Article

The Role of Geomorphology on Flood Propagation in a Large Tropical River: The Peculiar Case of the Araguaia River, Brazil

by
Tainá Medeiros Suizu
*,
Edgardo Manuel Latrubesse
and
Maximiliano Bayer
Environmental Sciences Graduate Program—CIAMB, Federal University of Goiás, Goiânia 74001-970, Brazil
*
Author to whom correspondence should be addressed.
Water 2023, 15(21), 3725; https://doi.org/10.3390/w15213725
Submission received: 12 September 2023 / Revised: 12 October 2023 / Accepted: 19 October 2023 / Published: 25 October 2023
(This article belongs to the Special Issue Fluvial Systems and River Geomorphology)

Abstract

:
In large rivers, floods are affected by the mosaic of geomorphic and geologic settings of the fluvial corridor. Here, we assess the role of geomorphology on the downstream flood dynamics of the Araguaia River, the largest free-flowing river in Central Brazil. The study integrates and advances existing flood-type classifications. We assess the factors that govern flood hydrograph properties and their downstream propagation by using flow time series, conducting statistical analysis, and evaluating geomorphic and flood metrics. Our findings highlight the role of geomorphology in the transmission of floods. In the upper and lowermost fluvial segments, the geological characteristics of the valley are a major factor. In the intermediate section, two main factors modulate the floods. The wide and complex floodplain plays a major role through storage and buffer effect for floods, and water diversion from the main system to a huge abandoned channel by avulsion governs seasonal flow transfers. The Araguaia is the most geodiverse floodplain of the Amazon–Cerrado ecotone, and floods play a fundamental ecological role in the river–floodplain environments. The combination of diverse factors controlling the flood mechanisms has to be considered when implementing conservation plans for the fluvial corridor and effective river management strategies.

1. Introduction

The economic development and population growth of modern societies located in the tropics have fueled the demand for natural and energy resources. Thus, while the tropics still preserve some of the world’s most fascinating and pristine rivers, the intense development pressures are adversely affecting major river systems in this global region [1,2].
The Araguaia River, situated in the central highlands of Brazil, serves as a prime illustration of a large tropical non-regulated river susceptible to degradation by human activities. The Araguaia has been considered the ultimate fluvial example of the geomorphologic short-term temporal response of a large free-flow river to the highest rates of deforestation suffered by a biome in human history [3]. Over the past century, it has undergone sedimentation, fluvial metamorphism, and hydrological shifts due to intensified deforestation in its watershed since the 1970s [3,4]. Excessive water usage for irrigation places further stress on its water resources [5], with large-scale irrigation projects showing expansion prospects [6]. Additionally, there is interest in exploiting its hydroelectric potential, as evidenced by proposals to construct 70 dams in the watershed, including 4 large ones in the mainstem [7].
Despite the escalating anthropogenic impact, the Araguaia River, the last and most important free-flowing river nestled within the Cerrado–Amazônia biomes ecotone, offers an incomparable opportunity for investigating the hydrogeomorphic functioning of a large tropical system draining cratonic areas in a savanna’s dominated environment.
Previous studies adequately addressed the peculiar transmission patterns of floods that characterize this river’s middle section. Along 430 km of the middle reach, Aquino et al. [8] observed that downstream gauging stations recorded lower peak flows than upstream stations as the drainage area increased, a phenomenon known as peak discharge attenuation. To further enhance the understanding of peak discharge attenuation in the middle Araguaia River, a simplified water budget [9] revealed that water lost to the floodplain during peak discharge attenuation typically returns to the channel by the end of the flooding season, resulting in overall net gains of water.
The free-flowing Araguaia River is the main fluvial artery that sustains the most complex and geodiverse floodplains within the Cerrado biome, alongside hosting the highest diversity of fish species [7]. However, despite being one of the least studied large fluvial systems from an ecological standpoint [7], the available research points to the relevance of the influence of the annual flood cycle on the riverine ecosystem’s structure and dynamics [10,11,12,13,14]. Furthermore, a recent study [15] has unveiled a longitudinal diversity within the river continuum. Therefore, exploring the distinct hydrological patterns is relevant to increasing the knowledge of flood transmission mechanisms in large tropical rivers and providing scientific support to fluvial science and basin management programs in the Araguaia basin.
This study introduces a novel approach for classifying and assessing flood types in the middle Araguaia. We also extend the time frame of pre-existing results by analyzing the period from 1975 to 2014, tracking flood events along the entire middle course. We also identify and assess each flood type’s key attributes and controlling factors by examining flood hydrograph properties, statistical analyses, and by providing insights on the influence of tributaries on peak flow attenuation. Furthermore, we delve into how distinct geomorphic segments shape the downstream propagation of flood waves. Focusing on the dynamic interface between hydrology and geomorphology enhances our understanding of the fluvial functions in this large and intricate system while providing new insights into flood transmission processes and mechanisms in large tropical rivers.

2. Study Area

The Araguaia River catchment (Figure 1A) covers approximately 385,000 km2 in the central highlands of Brazil, where it experiences a tropical savanna climate (Aw). Between 1975 and 2014, average annual precipitation across the basin ranged from 1506 to 2024 mm, with a northward increase [16]. Most rainfall (93% on average) occurs between October and April, while the dry season spans from May to September.
The middle Araguaia River, depicted in Figure 1B, stretches from Araguaiana to Conceição do Araguaia and has a mean annual discharge of 4761 m3/s. Its drainage area is augmented from 50,120 to approximately 325,740 km2 by the entry of major tributaries. Aquino et al. [17] classified the eastern tributaries, such as the Claro, Vermelho, Peixe, and Crixas Açu (Figure 1A), as rivers that primarily drain Precambrian metamorphic and igneous rocks originating from hills with structural controls. On the other hand, the Cristalino, Mortes, Tapirapé, and Javaés rivers (Figure 1A) are tributaries mostly draining the Bananal Plain, a Quaternary sedimentary basin featuring a vast aggradational plain formed during the Pleistocene.
Along its 1100 km length, the middle Araguaia River flows through a late Quaternary alluvial plain composed of three morpho-sedimentary units [18]. The modern channel exhibits a variety of anabranching patterns, often with a tendency to braid, interspersed with reaches of higher sinuosity [15].
The Cerrado biome, which once covered the upper and middle basin, has been replaced by unsustainable agricultural practices since the 1970s, leading to widespread landscape fragmentation and soil erosion [19]. Currently, only 38.5% of the total area is preserved, while 61.5% was impacted by some environmental disturbance, including 44.6% of the riverine vegetation [20]. As a response to land-use/land cover changes, significant changes in the middle Araguaia River’s anabranching pattern due to an increase in sediment supply from the upper and middle catchment are reported [3].

3. Data and Methods

3.1. Hydrological Data

We processed daily mean discharge time series from gauging stations to analyze the flood events in the middle Araguaia River (Table 1) from Brazil’s National Water Agency. It also considered discharge and precipitation data from major tributary watersheds. The analysis period spans from October 1975 to September 2014, corresponding to the available discharge measurements for the Luiz Alves gauging station (Figure 1B), which plays a central role in capturing flood patterns influenced by upper-middle basin conditioning factors.
Continuous-record gauging stations are present along the mainstem, except for Fazenda Telésforo, which operated until 1995 and experienced a significant data gap in the early 90s (Table 1). We estimated missing measurements in this gauge using a three-step approach. Firstly, we applied the drainage-area ratio method to estimate the streamflow at the mouth of the Mortes River tributary (Figure 1) based on the available historical data from the Santo Antônio do Leverger station (Table 1). Secondly, we subtracted the estimated outflow of the Mortes River from the São Félix do Araguaia time series (Table 1) to eliminate the influence of this large tributary on the flow measurements at the closest gauging station to Fazenda Telésforo. Lastly, we generated the estimated records using log–log regression equations derived from the relationship between observed discharges at Fazenda Telésforo and the reference downstream flows established in the previous step. To enhance the linearity of the correlation, we derived two regression equations: one for the low-flow period (June–October) and another for the high-flow period (November–May). Both models exhibited high R2 values (0.85 and 0.9) and were statistically significant (p < 0.001). Hence, we considered this approach valid. The São Félix do Araguaia river gauge station exhibited few negligible faults in the low-flow period; therefore, we used the dataset without modifications.
In our analysis of peak discharges in the mainstem, we considered the significance of bankfull discharge as an important indicator of the initial stages of flood overflows. Field-estimated values of bankfull discharge for Aruanã and Luiz Alves stations were available from the literature [21]. For the remaining stations in the middle Araguaia where field data were unavailable, we utilized the concept of bankfull discharge as the 1.5-year flood [22] in the annual flood series, employing the Gumbel (extreme value type I) distribution.
In the absence of data directly from the outlets of the tributaries, we derived from Aquino et al. [17] their relative contribution to the main system. They estimated the average annual discharges of the Araguaia contributing watersheds by establishing a regression relationship between the available gauged data of the tributaries and their corresponding drainage areas, resulting in a high R2 value of 0.97.
Because gauging stations from tributaries have incomplete series, we prioritized analyzing the available reliable data over the attempt to interpolate or estimate missing values. We utilized the tributary gauged data to semiquantitatively assess whether the contributing subwatersheds exhibited analogous responses to the mainstem. We examined their peak flows and mean annual discharge deviations from the long-term averages, weather peak flow events, and annual rainfall (in the absence of river flow data) in the tributaries conformed to the same flood-type categories established for the mainstem. For the Javaés River, we also estimated the net water volume losses or gains.
Flood peaks in the middle Araguaia were determined by identifying and extracting the highest flow measurements from the annual hydrographs for each water year (1 October–30 September) in the time series. Since multipeak hydrographs are common, we selected the annual maximum daily water discharges at Aruanã (Figure 1B) as the reference flood event to be monitored along the study site. This approach allows us to focus on the most significant floods while disregarding events happening before or significantly later at the subsequent river gauging stations.

3.2. Flood Type Classification

An initial flood classification scheme for the middle Araguaia River was proposed by Aquino et al. [8], categorizing seven typical years into three distinct flood types based on the magnitude of peak discharge in the Aruanã gauge and its subsequent progression downstream towards Faz. Telésforo gauge (Figure 1B). These flood types are as follows:
  • Type A: Very large flood peaks that surpass the channel capacities, such as the floods in 1980 and 1983, resulting in significant peak transmission losses between Aruanã and Luís Alves (−27%) and even higher losses (−33%) between Aruanã and Faz. Telésforo.
  • Type B: Floods characterized by small magnitudes, showing slight increases up to Luís Alves, followed by relatively consistent levels or modest declines from Luís Alves to Faz. Telésforo. This pattern is evident in the years 1977, 1978, and 1979.
  • Type C: Intermediate floods that exhibit a slight increase in peak flows between Aruanã and Bandeirantes, followed by a trend of losses (−4.5%) between Bandeirantes and Luís Alves. They may display conservative magnitudes or experience additional decreases in peak discharge between Luís Alves and Faz. Telésforo. This flood type happened in the years 1982 and 1985.
This first flood categorization was later revised [23]. Due to the limited availability of continuous gauge data at Faz. Telésforo, the analysis focused on data from Aruanã up to the Luiz Alves gauges. Firstly, it adopted a single flood wave tracking instead of relying solely on the maximum peak discharge recorded at each station. Additionally, the lower and upper limits for peak magnitudes in Aruanã were defined as follows: Type A—5000 m3/s and above; Type B—below bankfull discharge up to approximately 4000 m3/s; and Type C—predominantly ranging from 4500 to 5500 m3/s [23]. That author also quantified the downstream rates of change in peak discharge for all the analyzed years (1975–2003) and even proposed two new categories: Types D1 and D2. These types exhibit distinct patterns of peak discharge translation downstream, characterized by marked increases followed by marked decreases and vice versa. This distinguishes them from the other flood types (A, B, and C) that display more monotonic trends along the river. Type D1 floods are characterized by higher peak discharges at Aruanã (average: 4003 m3/s), while Type D2 floods occur below bankfull flows (average: 2929 m3/s), resulting in more significant absolute peak reduction downstream for the former [23].
Here, we further refined the flood-type classes previously proposed for the middle Araguaia River. This updated classification is presented in the results section. Some considerations drove our choice to improve the groupings. Firstly, the area coverage of the previous studies was limited to only one-third of the total length of the middle section of the Araguaia. A thorough hydrogeomorphologic analysis enclosing the whole middle Araguaia River was still pending. Thus, our analysis expanded to all the gauge stations along the middle Araguaia River. Secondly, we recognized that the Brazilian National Water Agency had reviewed historical flow data estimates for the middle Araguaia River and addressed data gaps identified in the previous study [23]. Therefore, we aimed to establish consistent flood types based on the revised flow records and the extended time series from 1975 to 2014. Additionally, we sought to offer further insights into the distinct behaviors of the D1 and D2 flood types concerning the more typical patterns observed in types A, B, and C.
To achieve the scope, we divided our study site into six fluvial reaches (Figure 1B) whose limits correspond to the locations of consecutive gauge stations: F1 (Araguaiana–Aruanã), F2 (Aruanã–Bandeirantes), F3 (Bandeirantes–Luiz Alves), F4 (Luiz Alves–Faz. Telésforo), F5 (Faz. Telésforo–S.Félix do Araguaia), and F6 (S.Félix do Araguaia–Conceição do Araguaia).
Four hydrological years (1996, 1998, 2004, and 2010) were excluded from our analysis as they exhibited anomalous flood translation patterns that did not align with our proposed categories. In 1996, the peak flow in Aruanã (3099 m3/s) was below bankfull discharge, but significant losses (−29%) occurred up to Luiz Alves. Similarly, in 1998, a low flood in Aruanã (3627 m3/s) showed unusually high losses (−47%) in Bandeirantes, followed by substantial gains (+78%) in Luiz Alves. On the other hand, 2004 and 2010 were high flood flows in Aruanã (7931 and 7438 m3/s, respectively). Still, they experienced exceptionally large losses (−50% and −58%) between Aruanã and Bandeirantes, followed by increases in the subsequent station (+12% and +18%). Due to the derivation of flood events from observed discharge values, primarily obtained by applying stage observations to a stage–discharge relationship, it is important to acknowledge the potential influence of observational errors or instrumental inaccuracies on sudden and random shifts in peak discharge. Consequently, additional investigations are warranted to better understand these anomalies within the data series.

3.3. Geomorphic and Flood Metrics

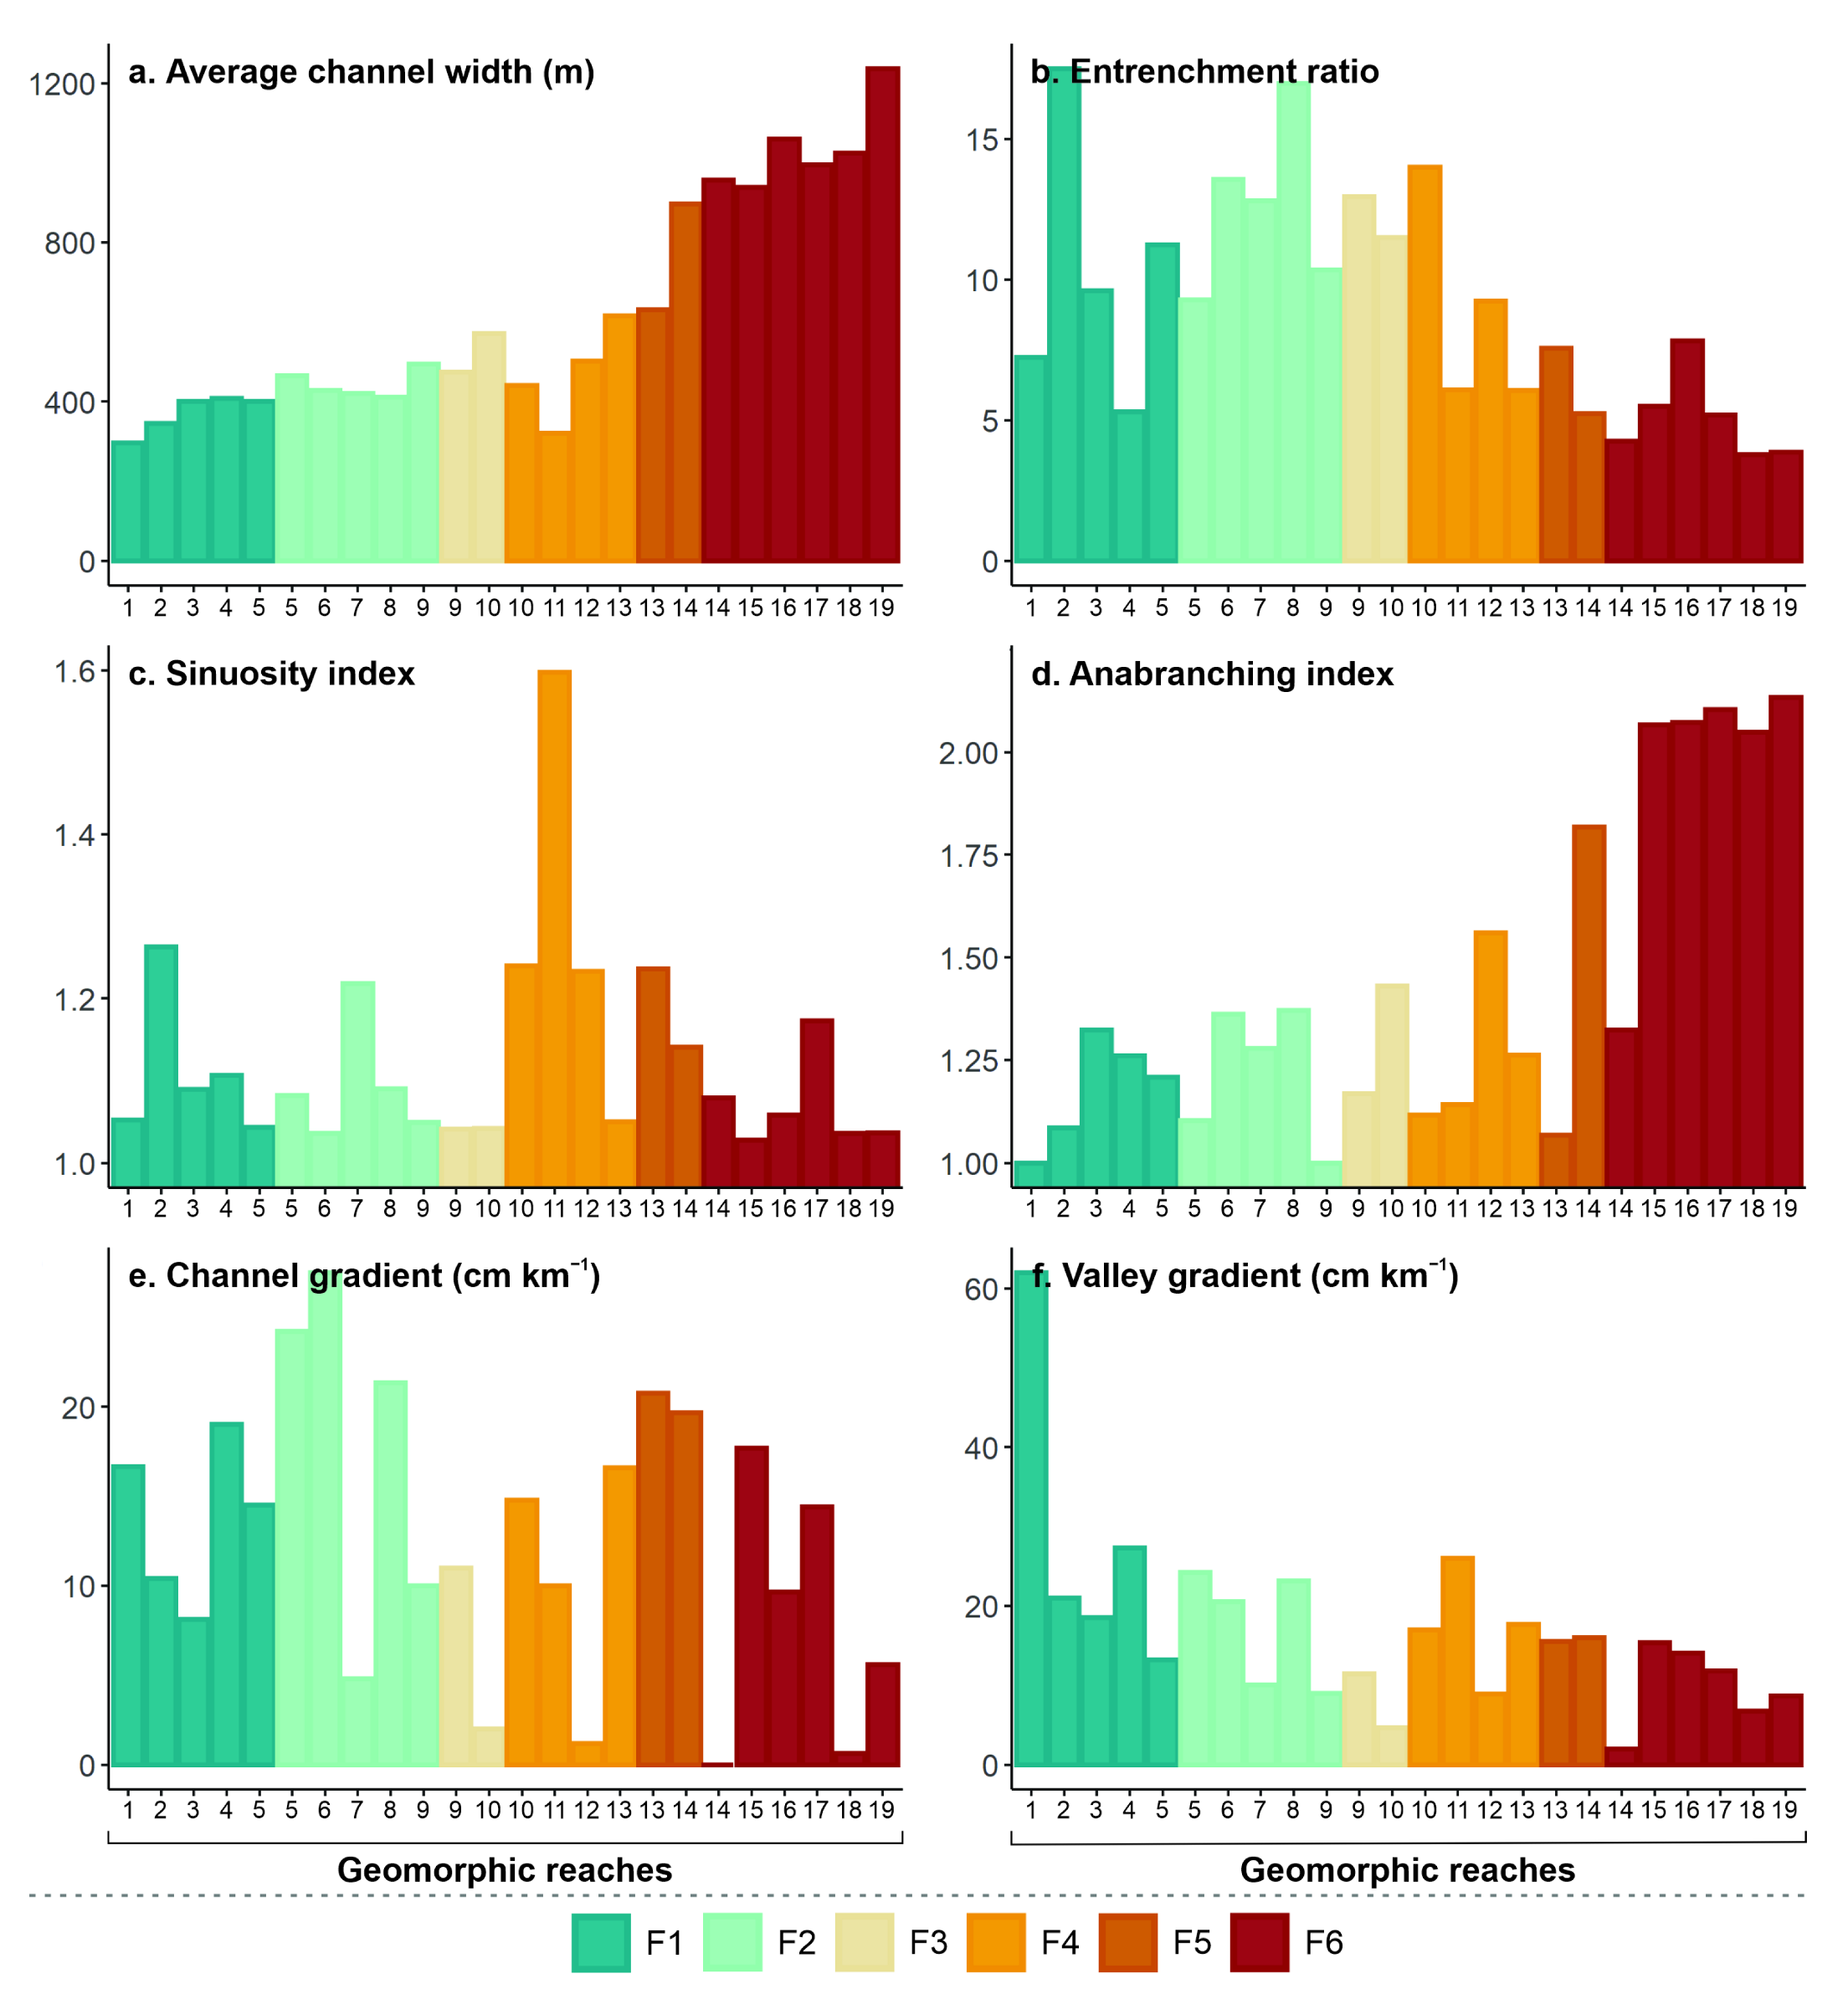
The six fluvial reaches (F1–F6) selected for examining the downstream behavior of flood waves in the middle Araguaia encompass the five geomorphic segments defined in a previous article by the authors [15]. These segments were established by statically grouping 19 reaches with relatively uniform morphological attributes, such as channel and valley gradients (measured in cm/km) and the degree of floodplain development, indicated by the entrenchment ratio, a metric derived from the ratio of floodplain width to channel width, as described by Polvi et al. [24]. Channel planform metrics like sinuosity and anabranching indexes were also incorporated [15]. By considering these elements, we explored the role of channel and floodplain morphology in controlling the translation and attenuation of flood peaks, addressing another crucial research question in our study.
Five flood metrics, namely peak discharge ratio (QpR), slope of the rising limb (S), flood wave celerity (c), water volume (V), and coefficient of overflow hydrograph asymmetry (υ), were employed to characterize the flood events and their corresponding flood types along the study site. The first two metrics, QpR and S, were adapted from Spellman et al. [25]. QpR quantifies the attenuation or intensification of flood peaks between consecutive reaches as the ratio of peak discharge observed at the downstream to the upstream stations. The slope of the rising limb (S) in m3s−1/day, represents the average rate of flood rise from overflow to the peak discharge, calculated as the difference between the hydrograph peak (Qp) and bankfull discharge (Qbf) divided by the number of days between them. Flood wave celerity (c), measured in m/s, indicates the speed at which peak flows propagate downstream and is determined by dividing the river reach length (m) by the peak-to-peak travel time (s) between the upstream and downstream stations [26]. Water volume (V) in km3 was derived using the ‘add_daily_volume()’ function from the fasstr package, a Flow Analysis Summary Statistics Tool for R [27]. This function converts daily mean discharges into daily volumetric flows. The annual and monthly summarized volume permitted us to evaluate the overall net changes in flow along F4 (for more detailed information on the utilization and interpretation of this metric, please refer to the subsequent sections). It was also calculated cumulatively to estimate the average total overflows of station hydrographs. Finally, the coefficient of overflow hydrograph asymmetry (υ) was calculated as the ratio of the duration of the flood overflows in the rising phase to the duration of the flood overflows in the recession phase [28].

3.4. Statistical Analysis

The hydrological data management and its statistical analysis were conducted using the RStudio IDE [29]. Before performing each statistical analysis, we assessed the normality of data distribution using the Shapiro–Wilk test with a significance level of 5%.
We employed the Spearman Rank correlation method to define the significance, strength, and direction of the relationships between QpR values and peak discharges observed at the upstream station. A significance level of p < 0.05 was set, and the Spearman’s Rho (ρ) correlation coefficient was categorized as low (<0.39), moderate (0.4–0.59), or strong (0.6–1).
We performed regression analysis to describe the relationships between the water volume inflows/outflows in F4 and the volume losses to the Javaés River. The overall quality of the fitted model was evaluated using R2, Residual Standard Error (RSE), and the p-value (t-test). A high value of R2 (ranging from 0 to 1) indicates a good correlation, while a small RSE suggests a well-fitted model. The significance of the predictor on the response variable was set at p < 0.05.
A one-way analysis of variance (ANOVA) was applied to assess the significance of differences among the flood-type groups. For statistically significant results (p < 0.05), we applied Tukey’s HSD test for post hoc pairwise comparisons to identify the specific locations where significant differences (p < 0.05). Additionally, we employed a two-way ANOVA to investigate the hypotheses related to the main factors and potential interactions that influence the notable peak discharge changes observed in F2 and F3.

4. Results

4.1. The Flood Types in the Middle Araguaia River

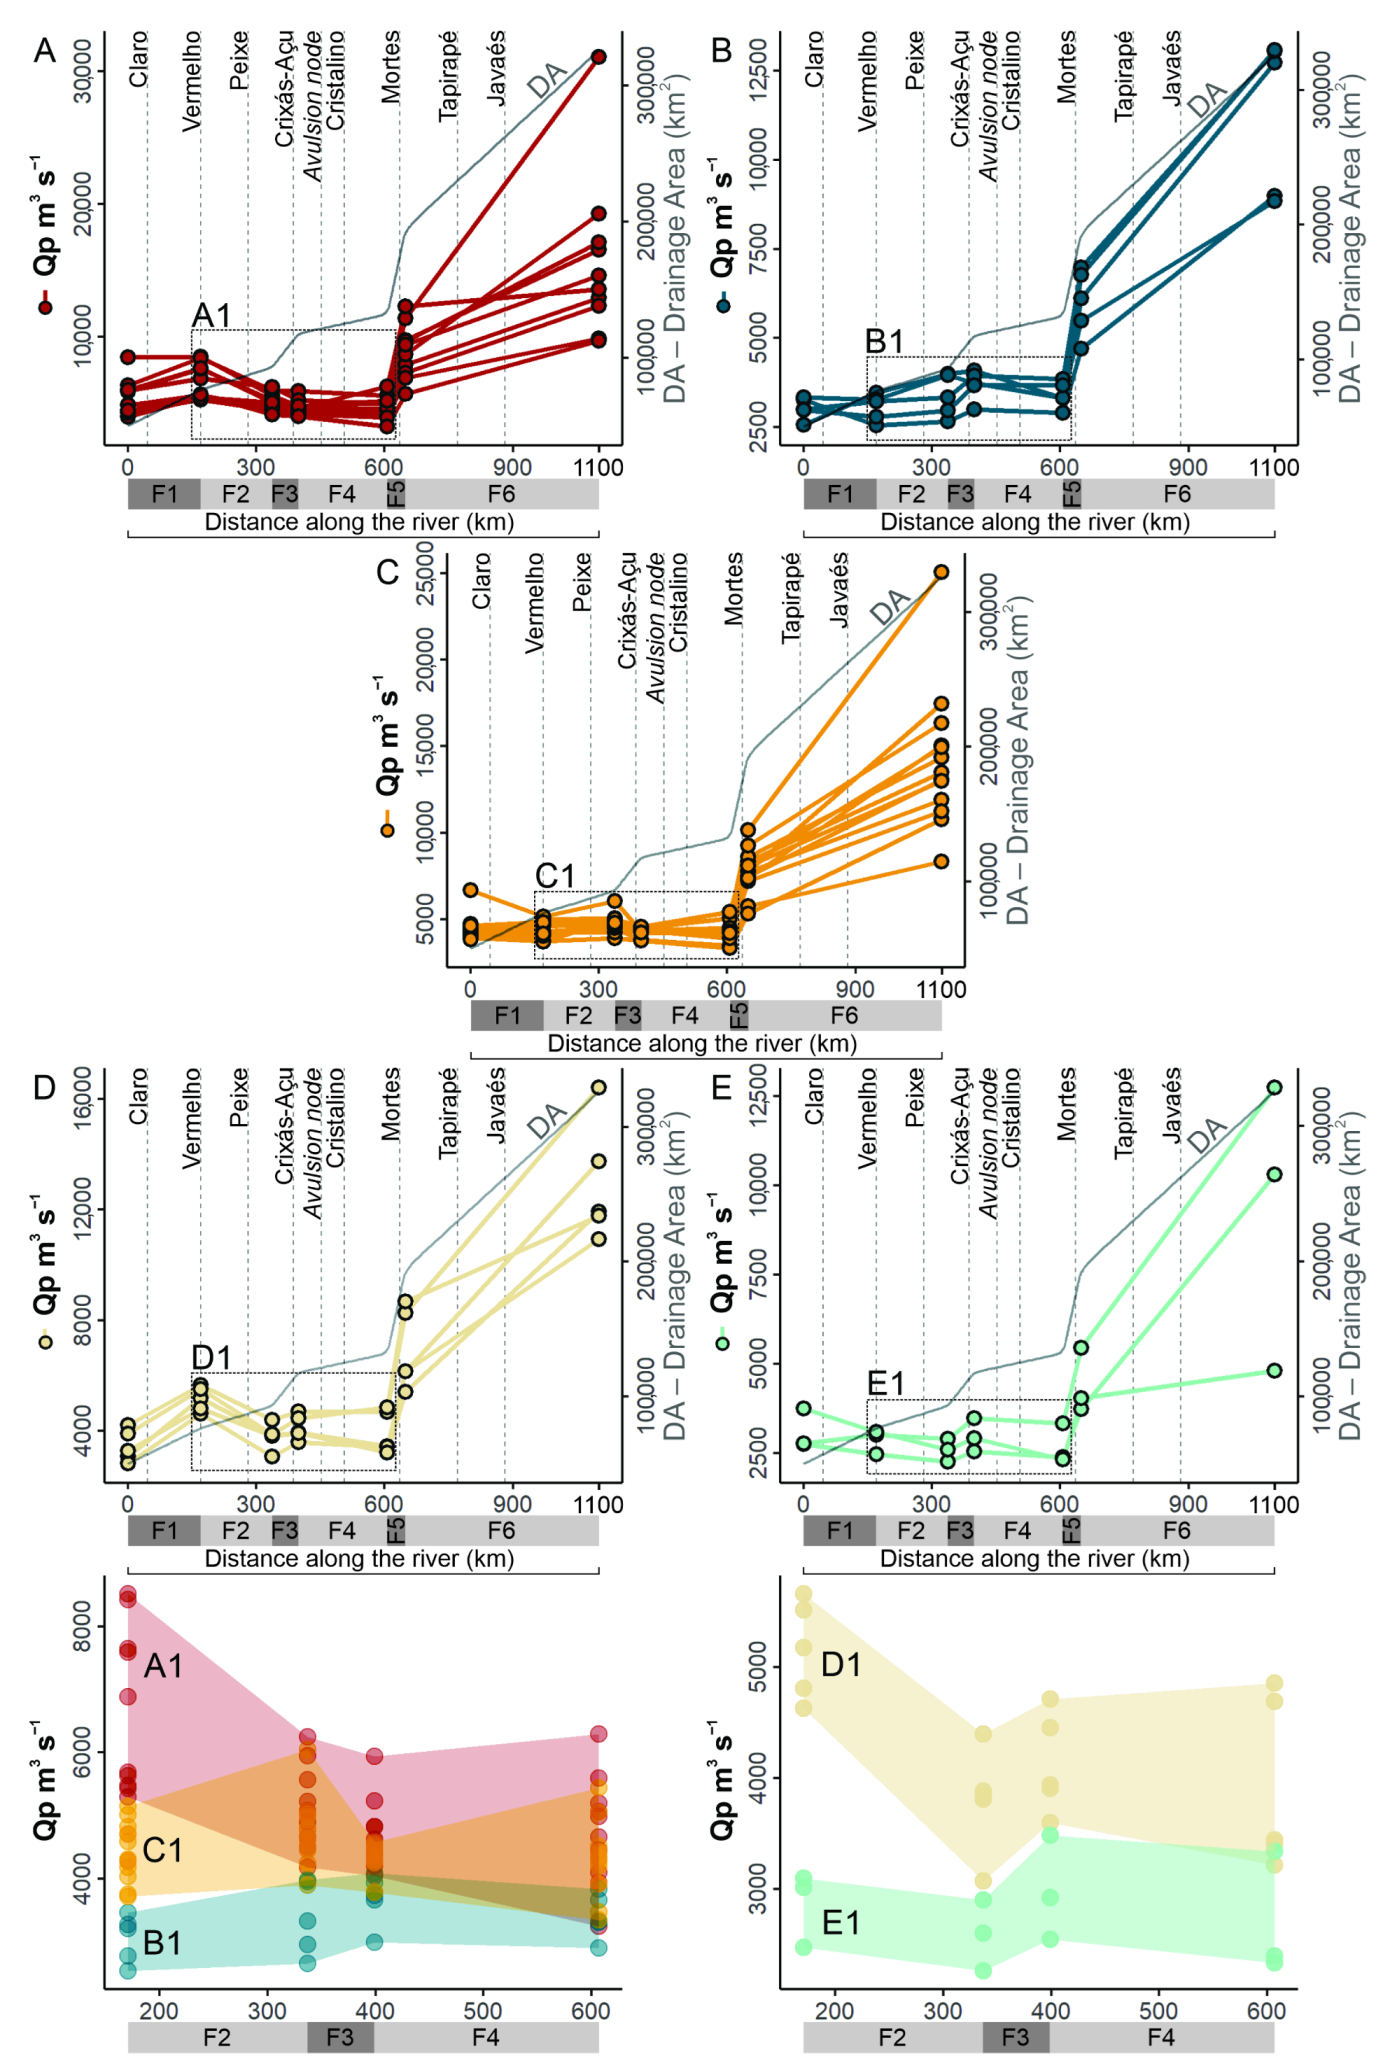
We characterized the floods in the middle Araguaia River based on the magnitude of the maximum annual flood peaks in Aruanã and downstream flood wave transmission modes. In our study, we built upon and adapted the classification schemes proposed by previous authors [8,23]. As a result, annual flood events were grouped into 5 distinct flood types (Figure 2).
Floods classified as type A represent the highest hydrological events in the historical record. These floods exhibit peak values of 5292–8510 m3/s at Aruanã (Figure 2(A1)), with notable attenuation downstream, resulting in flow losses ranging from 7% to 35% between Aruanã and Bandeirantes. The stretch between Aruanã and Faz. Telésforo experiences even higher losses, reaching up to −43%, except for 1991, which recorded a 12% increase (Figure 3A). It is worth noting that these periods of large flow reductions occur despite the contributions of tributaries to the system and the increase in the drainage area. The average discharges of the tributaries are estimated to be 13% (Peixe River, Figure 1A) and 21% (Crixás Açu River, Figure 1A) of the total flow gain in reaches F2 and F3, respectively. Furthermore, the drainage area increases from 76,688 km2 to 132,025 km2 between reaches F2 and F4 (Figure 2).
Type B flood events are relatively less severe than Type A, with peak flow values (2542–3464 m3/s, Figure 2(B1)) close to the bankfull discharge (3200 m3/s) at Aruanã and a tendency for increasing peak flow towards Luiz Alves (14–32%, Figure 3B). Maintenance or minor losses in peak flow happen between Luiz Alves and Fazenda Telésforo (Figure 3B).
Type C encompasses a range of intermediate peak flows (3716–5146 m3/s, Figure 2(C1)) above the bankfull discharge in Aruanã. These flows demonstrate a general pattern of gains in Bandeirantes (up to 34%), followed by losses in Luiz Alves. In Faz. Telésforo, the changes do not exhibit a consistent trend. Although most years show losses, occasional modest gains (5–13%) are observed between Aruanã and Faz. Telésforo in 1979, 1990, 1993, 1995, and 2002 (Figure 3C).
Flood types D (Figure 2(D1,E1)) display ranges of flow variability in Aruanã (D1: 4628–5658 m3/s, D2: 2473–3099 m3/s) that overlap with those of types C and B, respectively. However, the main characteristic distinguishing class D from the others is the decrease in peak flow observed in Bandeirantes, followed by increases in Luiz Alves and a general loss tendency in Faz. Telésforo (Figure 3D1,D2). Type D2 has peak flow values that are lower than the bankfull discharge (3200 m3/s) in Aruanã, resulting in less pronounced peak decreases (average: −9%) in Bandeirantes when compared to type D1 (average: −26%).

4.2. Propagation of Flood Waves along the Middle Araguaia River

To identify flood propagation patterns along the entire middle Araguaia River, we tracked classified events at stations upstream (Araguaiana) and downstream (São Félix do Araguaia and Conceição do Araguaia) from the reference stations (Aruanã–Bandeirantes–Luiz Alves–Faz Telésforo) during the study period. Figure 4 presents the values of QpR for consecutive stream gauges and their correlation with the magnitude of peak flow upstream of the flood wave.
For reach F1 (Araguaiana–Aruanã, Figure 1B), the upstream Qp value did not prove to be significant (p > 0.05) in attenuating the downstream flood wave (Figure 4a). Interestingly, we observed attenuations (QpR = 0.78–0.98) in F1 associated with peak flows slightly below or above the bankfull discharge in Araguaiana (Qbf = 3528 m3/s). Notably, the floods in F1 can also be influenced by two major tributaries—Claro and Vermelho (Figure 1A). The estimated annual average discharge of these tributaries indicates a contribution of 33% to the flow at the downstream station, where the drainage area increases from 50,120 km2 to 76,688 km2.
Flood wave attenuation is a prominent feature of the maximum flows recorded in F2 (Aruanã–Bandeirantes, Figure 4b) and F3 (Bandeirantes–Luiz Alves, Figure 4c). The upstream Qp value had a significant impact (ρ = −0.67 and −0.85, p < 0.05) in determining the rate of reduction of peaks transmitted downstream. F2 distinguishes flood-type clusters along this linear relationship (Figure 4b). In F3, the bankfull discharge (Bandeirantes Qbf = 3621 m3/s) constitutes a noticeable threshold for the beginning of attenuations (Figure 4c).
There is a general increasing trend (ρ = 0.53, p < 0.05, Figure 4d) of downstream peak flows (Faz. Telésforo) in F4 as a function of upstream Qp magnitude (Luiz Alves). However, this reach exhibits distinctive attenuation patterns. It experiences losses in all events below bankfull discharge (Luiz Alves Qbf = 3700 m3/s), with more significant reductions (QpR = 0.8–0.91) observed at some flows just above this threshold (3736–4085 m3/s), and more minor losses (QpR = 0.94 and 0.95) for the two largest events in the Luiz Alves historical series—1980 and 1983. In F4, the Araguaia River receives the contribution of the Cristalino River (Figure 1A). Unlike the right-bank tributaries (Claro, Vermelho, Peixe, and Crixás Açu) in reaches F1–F3, the Cristalino is currently an underfit system within the abandoned fluvial belt it occupies. It features a narrow channel that becomes more active during the rainy season.
The final two reaches of the Middle Araguaia (F5 and F6) are notable for the lack of reduction in peak flows (QpR > 1, Figure 4e,f) between gauging stations. The strong and positive relationship observed in F5 (ρ = 0.60, p < 0.05, Figure 4e) indicates that upstream (Faz. Telésforo) increases in maximum flow led to larger peak flows downstream at the S. Félix do Araguaia station, even when these exceed the bankfull discharge (Faz. Telésforo Qbf = 3683 m3/s). QpR values in this reach ranged from 1.56 to 2.04 (Figure 4e), with these increases primarily influenced by the entry of the main Araguaia tributary, the Mortes River (Figure 1A), which expands the contributing drainage area from 132,025 km2 to 194,854 km2 and has an annual mean flow equivalent to 32% of the flows measured at the downstream station.
In the F6 reach, the peak upstream (at S. Félix do Araguaia) does not have an explicit control (p > 0.05, Figure 4f) over the fluctuation of transmitted peaks downstream (at Conc. Araguaia). Flood flows in this reach reflect the influence of major tributaries, such as the Javaés and Tapirapé, which, together with other smaller basins arranged along the axis of the lower middle valley (Figure 1A), increase the drainage area by 61% and integrate a substantial component of the high flows recorded at Conceição do Araguaia. At this last station, QpR values ranged from 1.10 to 2.76 (Figure 4f).

4.3. Impact of Tributaries on Mainstem Flood Attenuation

The impact of tributaries on mainstem flood attenuation can be challenging to assess, especially in the case of large rivers with scarce hydrological data, as it depends on a range of factors, such as tributary size, location, and watershed characteristics, the complex array of floodplain features, and the timing, intensity, and spatial distribution of precipitation. Moreover, the lack of gauged data on tributary outlets further complicates accurate assumptions about tributary contribution to downstream flood magnitude. To solve it, we briefly analyzed discharge records from tributaries that feed into mainstem reaches exhibiting attenuating behaviors (F1–F3). However, due to the lack of river flow measurements in the Cristalino River, we could not assess its impact in F4.
Data from two gauges (Figure 1A, stations 1 and 2) located approximately 82% and 37% of the drainage area of the Claro and Vermelho watersheds, respectively, revealed that smaller flood events exhibiting a decline in downstream peak discharge at F1 (i.e., 1975, 1976, 1984, 1987, 1989, 2003, and 2014) also displayed peak magnitudes that were 10–53% (Claro River, Figure 5a) and 15–65% (Vermelho River, Figure 5b) lower than the long-term average of peak events in both contributing watersheds. Except for 1984, when a minor increase (5%) was detected, the mean annual flows for these years were 26–50% (Claro River, Figure 5c) and 5–52% (Vermelho River, Figure 5d) lower than the long-term mean annual flow, suggesting that the subwatersheds experienced more frequent episodes of lower flow during these years.
Previous research into the hydrological characteristics of the system revealed that the connection between the river channel and floodplain is established when the river reaches the bar full level, which occurs when the sandbars are entirely submerged when the river reaches ~66% of the bankfull stage at the Aruanã station [30]. Thus, in drought years, anabranches functioning below the bankfull stage may still divert water to the floodplain. In such circumstances, the floodplain lakes and channels experiencing reduced storage and surface-water supply may contribute to discharge losses near bankfull flows (Figure 4a).
Previous studies identified the attenuation patterns in reaches F2 and F3 and highlighted the geomorphic influence on the flood’s transmission mechanisms and the floodplain’s water storage capacity [8,9]. Since the length of F3 is only 37% of that of F2 (Figure 1), expressing peak discharge gains and losses per unit channel length between these consecutive reaches provides a more accurate comparison of the effectiveness of the reaches in temporarily storing floodwaters (Figure 6a).
The analysis of potential water available for tributary runoff in F2 involved an assessment of the mean annual precipitation of the Peixe basin (Figure 6b), considering the unavailability of in situ flow data for the main tributary river. To evaluate the input peak flows in F3, we obtained annual peak discharge data for the Crixás Açu River (Figure 6c) from a gauge station located within 78% of its total watershed area (Figure 1A, station 3). Our one-way ANOVA reveals a significant difference (p < 0.05) in annual rainfall within the Peixe basin (Figure 6b) and peak discharges along the mainstem (Figure 6d,e) among certain flood-type categories. However, when it comes to peak discharges in the Crixás Açu River, there were no distinct patterns of a magnitude consistent with the mainstem flood types (p > 0.05, Figure 6c), ruling out the requirement for post hoc comparisons.
Despite showing similar peak magnitudes in Aruanã (p > 0.05, Tukey post hoc comparisons, Figure 6d), types B and D2 exhibit contrasting behaviors in F2 (Figure 6a). In this reach, type D2 experiences minimal net losses, even below bankfull discharge (d), which can be associated with the lowest average annual precipitation values recorded in the Peixe basin (b). These drier years, accompanied by reduced flood flows, were also observed in the preceding reach F1 (Figure 5).
Tukey post hoc comparisons revealed no significant differences in precipitation patterns of the Peixe basin among flood types A, C, and D1 (b). Interestingly, type C exhibits average annual precipitation values as high as those observed in the largest type A events. Despite this similarity, type C demonstrates a net gain in F2 that is 5 times smaller than the net loss per unit of channel length estimated for type A (a). Conversely, type D1 floods have lower average precipitation values than type C but experience net losses in F2 that are 4.4 times larger than the average gains per unit of channel length observed for type C (a).
Such divergent trends observed in intermediate to large flood types are reasonably explained based on our two-way ANOVA analysis (f). The analysis indicates that the magnitude of the peak (Qp) at the upstream gaging stations Aruanã (d) and Bandeirantes (e) in the mainstem exerts the primary control (p < 0.001) in determining the rates of channel losses and gains along reaches F2 and F3. The statistical analysis reveals that neither tributary precipitation (b), tributary peak flow (c), nor the interaction effect of these variables with upstream peak discharge show statistical significance (p > 0.05) in explaining the absolute peak change per unit channel length along reaches F2 and F3 (f). These findings align with the outcomes of our previous correlation analysis (Figure 4b,c).

4.4. Influence of Geomorphic Variables on the Floods

The most striking downstream trends of flood types in the middle Araguaia River cannot be attributed solely to the flow regime; channel and floodplain morphology (Figure 7) also play a crucial role in determining the river’s capacity to convey or store floods, with significant implications for associated hydrograph properties (Figure 8).
F1 is characterized by a low-sinuous channel pattern (sinuosity: 1–1.3, Figure 7c) with narrow channel widths (averaging 296–408 m, Figure 7a). Downstream sections in this reach are less constrained (Figure 7b), typically resulting in the natural attenuation of peak discharges due to the floodplain’s increased water storage capacity [26,31]. However, in F1, a combination of moderate channel gradients (8–19 cm km−1, Figure 7e) and high valley slopes (13–62 cm km−1, Figure 7f) facilitates the rapid conveyance of floodwaters, limiting their contact with the floodplain and impeding the slowing down of large peak flows (Figure 4a). The high wave celerities observed for all flood types in F1 (Figure 8a) evidence this process. The presence of abrupt rising limbs in the hydrographs of type A floods at consecutive stations in F1 (Figure 8b) further indicates the efficient conveyance of large floods in this reach.
While there were no significant changes in sinuosity (Figure 7c) or anabranching (Figure 7d) indexes between F1 and F2, the modern channel widens by approximately 20% (Figure 7a) in this second reach and flows into an extensive floodplain (entrenchment ratio: 9–17, Figure 7b). The steeper channel gradients at the beginning of F2 (24–28 cm km−1, Figure 7e) allow for better conveyance of fast flood waves from F1, producing hydrographs at the Aruanã gauge site with high peak discharge relative to the overall runoff in the rising limb, particularly in the case of large type A floods (Figure 8b). However, as F2 progresses, this channel gradient decreases, and floodwaters inundate the wide floodplain with gentler slopes (Figure 7f). As a result, all flood types in F2 experience a reduction in flood wave velocity (Figure 8a), especially those with considerably smaller peak discharges at the Bandeirantes gauge downstream (i.e., types A, D1, and D2). The lowered and broadened hydrographs of the Bandeirantes station (Figure 8b) support this claim, except for the smallest type B events, indicating that floodplain morphology has little effect on peak discharges close to bankfull. In reach F3, the presence of a gently sloping channel (Figure 7e) in the relatively flat areas of the valley (Figure 7f) allows for the downstream extension of the floodplain’s capacity to store (delay) excess floodwater and attenuate flood peaks. This feature may explain the flatter rising limbs of the hydrographs for all flood types at the Luiz Alves station (Figure 8b).
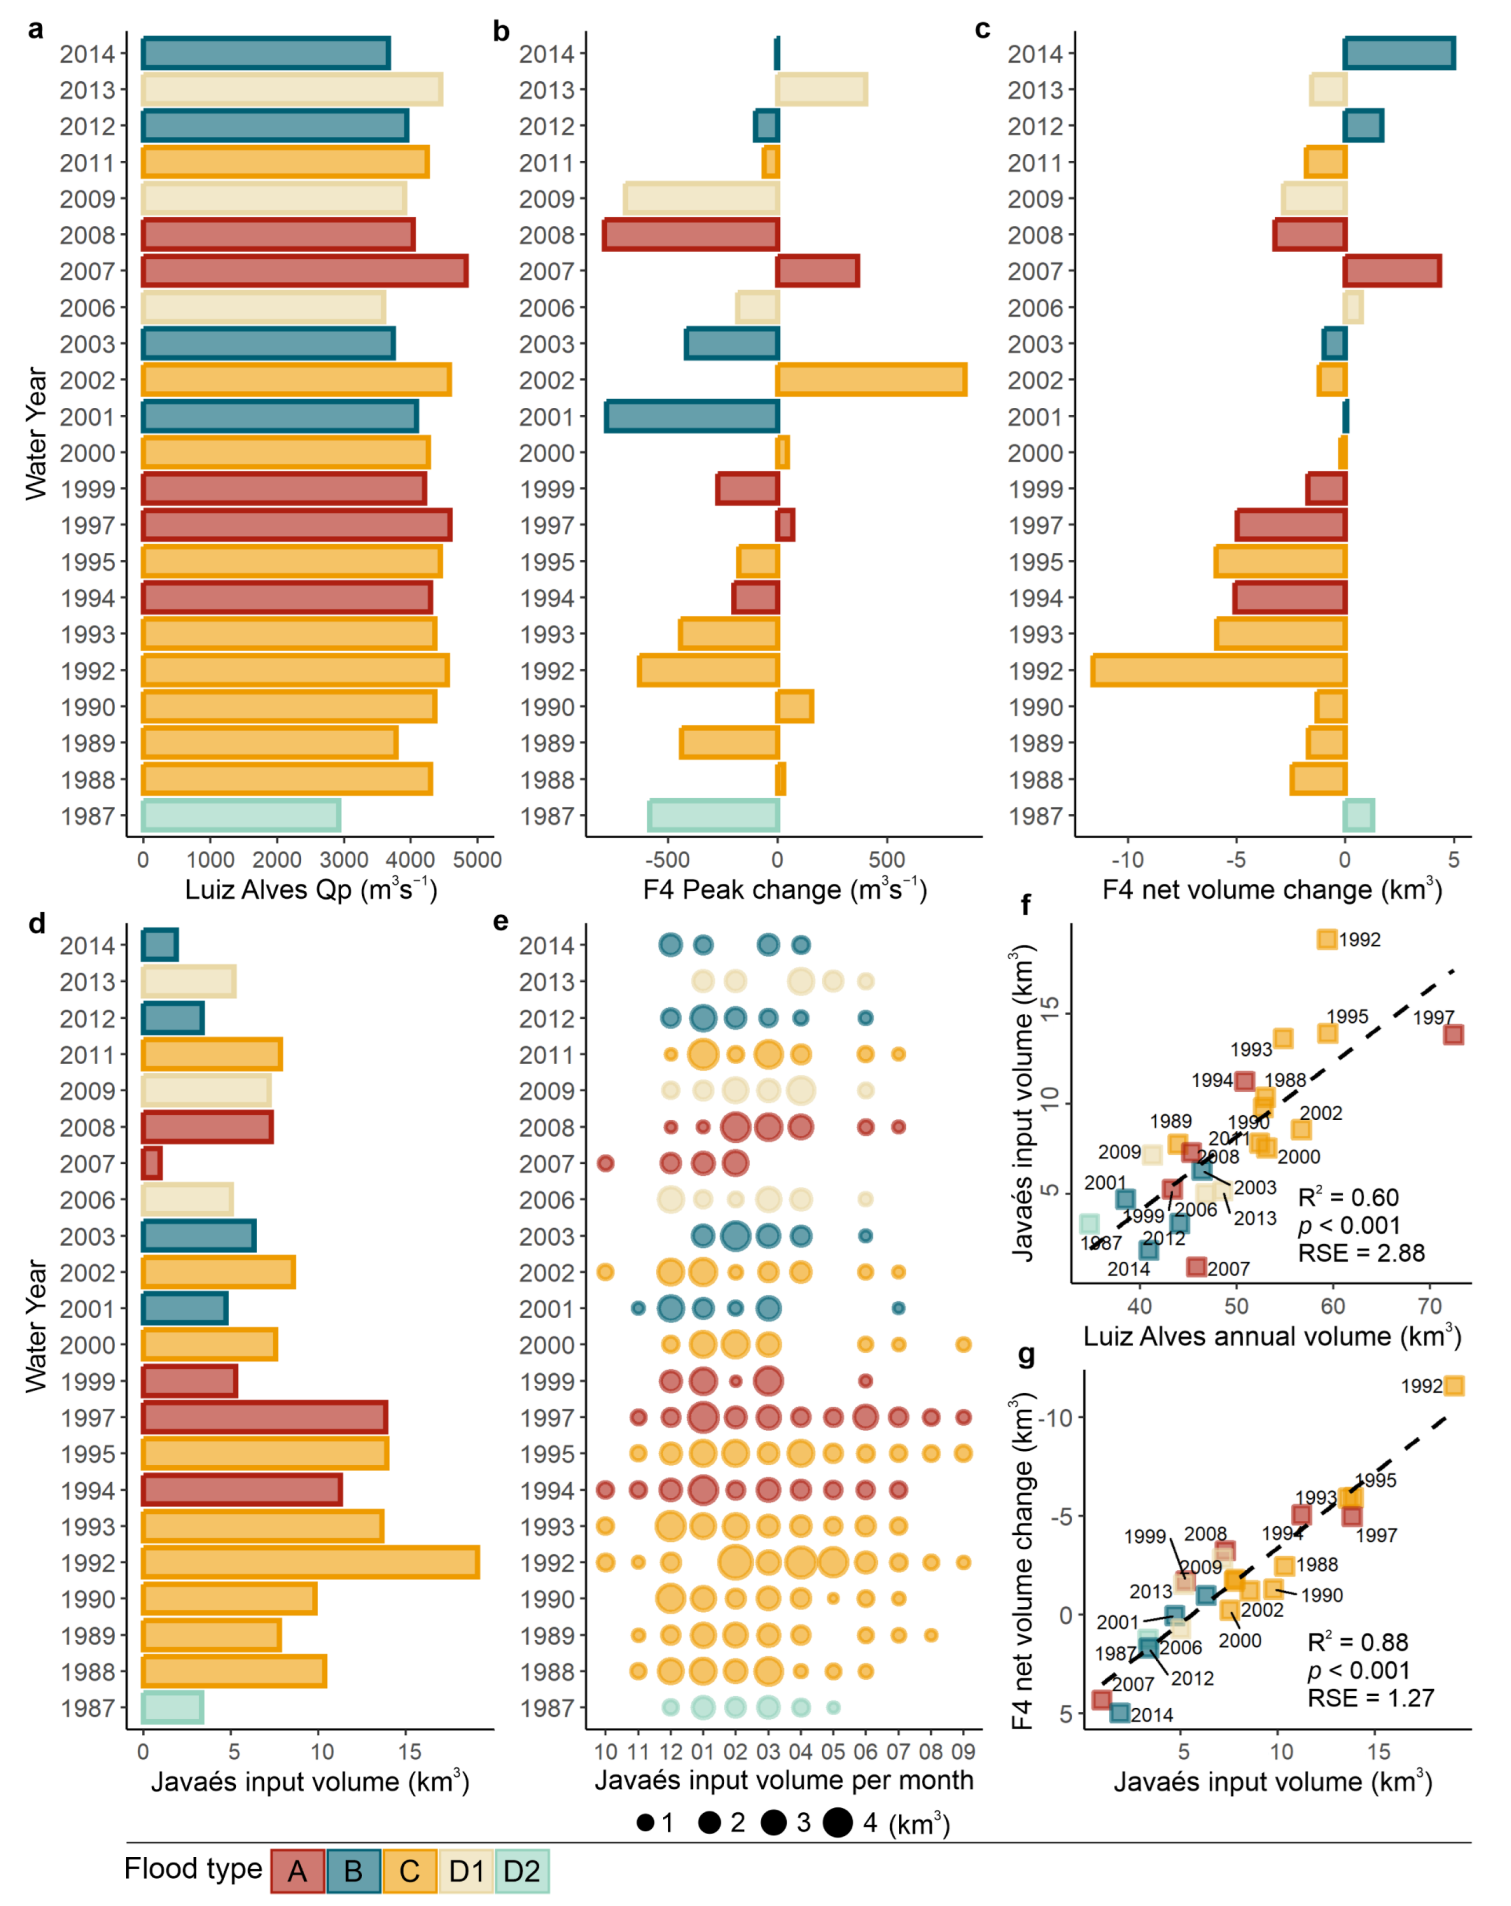
Peak discharge losses in F4 are attributed to water transfer from the main river to its old abandoned river branch, Javaés River (Figure 9) [8]. In this reach, it is necessary to note that there is no straightforward relationship between upstream peak magnitude (Figure 9a) and the rate of peak loss (Figure 9b). For instance, we observed that maximum discharges of type A (i.e., 1997 and 2007, Figure 9a) exhibited downstream peak increases (Figure 9b). Conversely, we found that type D2 (e.g., 1987) and B (e.g., 2003), with flows just below to slightly above bankfull discharge (Figure 9a), displayed significant peak reductions (Figure 9b). To address these peculiar transfer patterns, we computed annual net changes (overall gain or loss) in volume (V in km3) between Luiz Alves and Faz. Telésforo (Figure 9c). Additionally, we estimated the total volume of water discharged into the Javaés River (Figure 9d,e) by considering the daily flows recorded in the former channel (Figure 1A, station 5) in the mainstem water balance equation (VFaz. Telésforo − (VLuiz Alves + VJavaés)).
This estimation of water released into the ancient system is a valid approach despite our inability to account for the flow contribution of the Cristalino tributary (Figure 1A) to F4 due to the absence of a gauge. Although the drainage area of the Cristalino (11,427 km2) is larger than that of the Javaés upstream from its gauged site (8150 km2), the Cristalino basin is primarily located on the vast low-gradient Bananal Plain. In contrast, the Javaés basin contains a source higher-elevation sub-basin zone in its eastern part. It is characterized by smaller streams that contribute to a higher hierarchization level than the Cristalino system. These compensatory characteristics of these catchments result in similar outflow (inflow) conditions, allowing us to assume that the discharge yielded by one is equivalent to that transferred to the other, making our previous water balance equation reasonable. The similarity between the mean annual discharge estimated by Aquino et al. [19] for the Cristalino (199 m3/s) and the calculated mean annual discharge at the Javaés gauge (168 m3/s) supports this assumption.
The overall losses and gains of the river along F4 (Figure 9c) exhibit a pattern of higher net volumetric losses during the 1990s, following an increasing trend in the frequency of total volumes transmitted downstream in more recent years. Similar patterns characterize the diversion of volumes to the Javaés branch (Figure 9d), with water inflows in the 1990s approximately double the volumes estimated for the recent decades. The findings of the regression analysis support these observations, demonstrating that water delivered to the Javaés branch has a strong explanatory power (R2 = 0.88; p < 0.001, Figure 9g) over the outflows at the Faz. Telésforo station. Furthermore, we can infer the influence of mainstem flow availability (Luiz Alves) on the volume of water flowing into the old river arm, as indicated by the reasonably linear relationship between these variables (R2 = 0.60; p < 0.001, Figure 9f).
Figure 10 illustrates distinct patterns of discharge losses to the abandoning bifurcate throughout the year, associated with two type A flood events of similar peak magnitude (1997 and 2007, Figure 9a). In 1997, the hydrograph exhibited multiple peaks (Figure 10a), with discharges exceeding bankfull flows in Luiz Alves (3700 m3/s), lasting nearly four months (Jan–Apr). Discharge losses extend from late November to the first days of September (Figure 10b), resulting in an overall water loss of 13.84 km3 to the Javaés that year (Figure 9d). In contrast, 2007 experienced a single large peak (Figure 10c), with discharges exceeding bankfull flows for only five weeks (February–March). Discharge losses extended from October to the first days of March (Figure 10d), resulting in an overall water loss of 0.96 km3 to the Javaés that year (Figure 9d).
In general, F4 exhibits reduced wave propagation velocities and gradual rising limbs for all flood types. This contrasts significantly with the hydrograph properties observed in the downstream reach F5 (Figure 8a,b). In F5, the channel gradient experiences an increase (+84% on average, Figure 7e), and the river undergoes substantial channel widening (+63% on average, Figure 7a) due to the entrance of the Mortes River. However, despite these morphological shifts, a wide floodplain has not developed (average entrenchment ratio: 6, Figure 7b). The increased channel capacity to convey flows, coupled with the limited adjacent overbank areas in F5, results in the absence of flood attenuations (Figure 4e), faster propagation of flood waves (Figure 8a), and steeper gradients in the rising limb of downstream hydrographs (Figure 8b).
The main planform changes observed in the F5 are further intensified in F6. These changes encompass a widening of the channel (Figure 7a), an increased anabranching character of the river (Figure 7d), and the presence of a narrow floodplain (Figure 7b). This configuration allows flood waves to propagate downstream without attenuation (Figure 4f) and contributes to flood hydrographs characterized by steep rising limbs (Figure 8b). Notably, while F5 rapidly translates hydrographs downstream, F6 exhibits a delay in the translation, except for smaller type D2 events that occur within the channel (Figure 8a). The gradual decrease in channel and valley gradients along F6 (Figure 7e,f) may reduce peak wave velocities. However, it is important to highlight that F6 spans a length of 451 km (Figure 1) and covers a drainage area of approximately 130,000 square kilometers. Therefore, it is essential to consider this significant physiographic influence when analyzing the generation of high-volume flood events at the downstream station of Conceição do Araguaia. This station experiences a substantial increase of 153% in floodwaters compared to the upstream São Félix do Araguaia station (Figure 11a).

5. Discussion

Our findings demonstrate that different types of floods in the middle Araguaia River present hydrograph properties (peak magnitude, slope, wave celerity, attenuation, and volume losses) are ultimately influenced by downstream variations in the geomorphological characteristics of the channel–floodplain corridor at the reach scale. Suizu et al. [15], in their geomorphic assessment of the river, identified that the initial subdivision into 19 reaches (Figure 7) could be rescaled into five major geomorphic segments (SI–SV). These segments were statistically defined and characterized by consistent trends in the river’s character and the degree of development of the fluvial corridor.
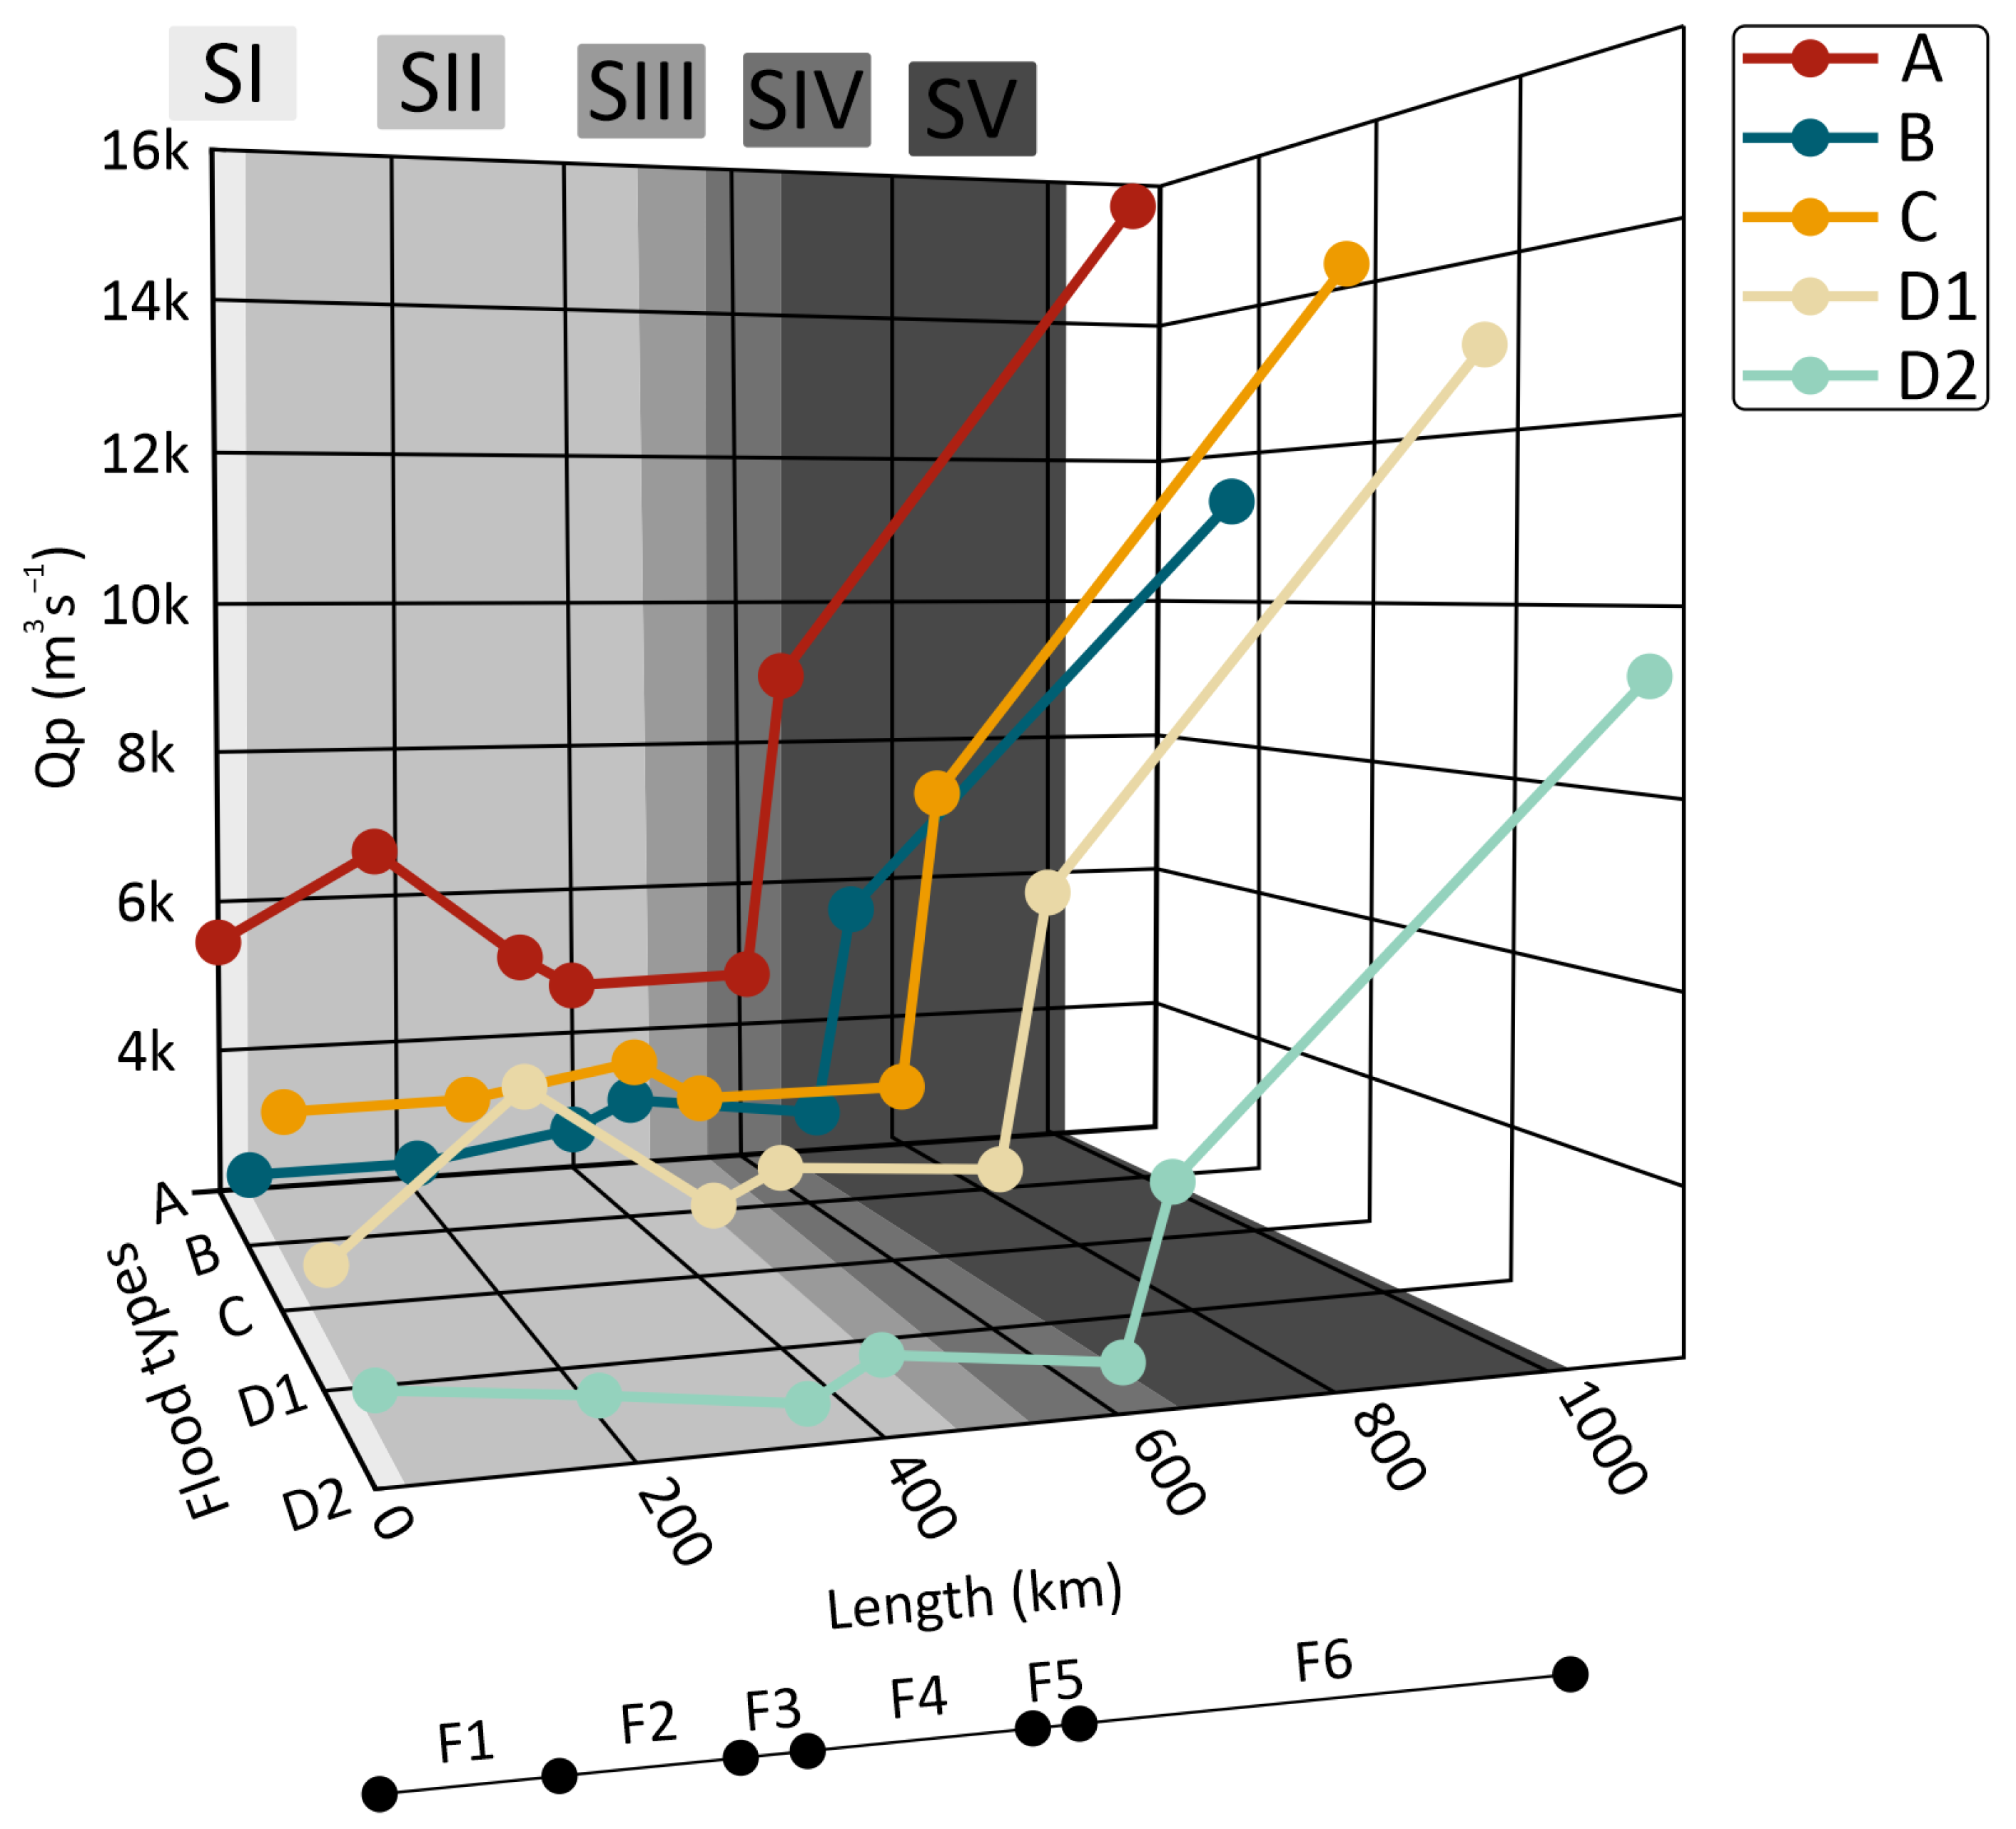
By assessing our flood classes in the context of these major fluvial domains, it becomes evident that the complex patterns of flow transmission in the middle Araguaia respond to the regional-scale organization of the system (Figure 12). In the SI—single-channel reach, planform controlled, and restricted floodplain—the Araguaia emerges from a relatively narrow, wide V-shaped geologically controlled valley into reaches with a well-developed and broad Quaternary fluvial belt containing the active floodplain. The upstream high valley gradient in this structurally controlled channel reach is the dominant driver behind the efficient conveyance of high floodwaters in F1.
F2 and F3 reaches are entirely situated within the SII—alluvial anabranching pattern, laterally unconfined, wide, and complex Holocene floodplain (Figure 12). Previous research [8,9] demonstrated the primary mechanisms responsible for peak attenuation along these reaches F2 and F3. Building upon these findings, we acknowledge the significant potential of the wide floodplain to act as storage areas and attenuate flood peaks in such reaches. However, we consider that the slope of the trunk stream and the valley may also play a critical role in this process. Additionally, an earlier examination of stream gains and losses (a) suggests that, in general, F2 is more prone to discharge loss (or less likely to gain) than F3. This may be partly attributed to the sharp-peaked and rapidly translated hydrographs from the upper basin that reach F2. Floods with quick rises have a higher potential for attenuation, as the crest of the flood wave carries a relatively small volume of water that is unlikely to exceed the capacity of overbank storage areas and can significantly reduce peak discharge [32].
Reach F4 is mainly influenced by SIII—highly sinuous anabranching pattern, partly confined on alluvium, and younger meander belt with scrolls (Figure 12). This segment (see geomorphic sub-reach 11, Figure 7) features a remarkable avulsion channel that diverts the mainstem flow to the northwest, forming the southern portion of Bananal Island. It can be inferred that the presence of sufficient gradient (current valley gradient: 26 cm km−1, Figure 7f) facilitated the incision in the older, well-indurated Pleistocene alluvium of the Bananal Plain, leading to the development of a sinuous channel (sinuosity: 1.6, Figure 7c) that dissipate the excess energy along this short segment [15]. Although the lateral mobility of this avulsion channel is currently reduced [15], it created a partially confined setting (entrenchment ratio: 6, Figure 7b) by a younger meander belt with incised scrolls in the Araguaia Formation. Additionally, the modern channel in this reach is sufficiently large (average width: 321 m, Figure 7a) to accommodate almost the entire discharge of the mainstem.
Aquino et al. [8] previously highlighted the significance of discharge loss to the abandoned channel of the Araguaia River as the primary mechanism for attenuating peak discharge along F4. The study authors observed water transfer from the main river to the old river arm during both small-scale (type B) and large-scale (type A) flood events, with peak discharge losses reaching up to 8%. Based on these previous findings, we also observed significant reductions in peak flow (up to 20%) between Luiz Alves and Faz. Telésforo is associated with different flood types (Figure 4d and Figure 10b). However, the distinctive transmission patterns observed during flood events highlight that while annual peak discharges are valuable indicators of discharge losses in F4, they represent isolated occurrences in the time series and may not capture the full range of mainstem flows that allow connections with the abandoning bifurcate.
The connection between the Araguaia and Javaés rivers extends beyond high flood flows. It typically starts on discharges near the average annual mean in Luiz Alves (1565 m3/s) in the early stages of the wet period (December), and it continues until the beginning of the falling limbs in April, with occasional extensions to July (Figure 9e). In addition, the flow dynamics showed a consistent trend of higher net volumetric losses during the 1990s, followed by an increasing frequency of total volumes transmitted downstream in recent years. Therefore, further research is necessary to comprehend the influence of temporal shifts in flow patterns on the geometry, equilibrium, and maintenance of the abandoning channel within the system.
Segments IV—anabranching pattern, planform controlled, discontinuous floodplain—and V—complex anabranching pattern, partly confined on alluvium and/or bedrock, underfit floodplain—encompass reaches F5 and F6, respectively (Figure 12). These segments undergo morphological changes due to alterations in the flow regime resulting from river avulsion [15]. SIV and SV represent annexational segments, incorporating sections of the preexisting Cristalino River and the lower portion of the Mortes River. Following the incisional process described earlier in F4, these segments did not have sufficient time to develop a floodplain compatible with the contemporary river’s flow regime and geomorphic processes [15]. Consequently, SIV and SV, characterized by a discontinuous floodplain on alternating sides of the river, have intermittent contact with the confining margins. The modern system, which is somewhat “overfit” with limited overbank storage areas, exerts a dominant influence over flood flows in F5 and F6, facilitating efficient conveyance downstream.
This observation is further supported by the coefficient of overflow hydrograph asymmetry (υ) shown in Figure 11b. The analysis of υ reveals similar asymmetries between the upper (Araguaiana and Aruanã) and lowermost (Conceição do Araguaia) stations, indicating a longer duration of flood overflows in the rising phase compared to the recession phase. This suggests a higher conveyance capacity rather than significant flood storage in these areas. In contrast, the intermediate section of the river (Bandeirantes, Luiz Alves, and Faz. Telésforo) exhibits relatively lower values of υ, indicating a more abrupt rising phase compared to a longer duration of flood overflows in the recession phase. This implies a more significant potential for flood storage (or loss in the case of Faz. Telésforo) and attenuation in this section.
The attenuation and storage effects of floodplains are well known in hydrogeomorphological and applied studies on floodplain management and restoration [33,34]. Yet, our finding regarding the role of the complex morphology of the fluvial corridor as a foundational element in understanding flood properties and hydrological connectivity patterns is in accordance with results from other studies on large rivers [35,36,37,38,39]. In the context of the Solimões-Amazon River, Meade et al. [40] observed that apart from the shifted timing of tributary inputs, the subdued extremes of discharge, differing only by a factor of 2 or 3 throughout the year, reflects the seasonal storage of substantial water volumes within the intervening floodplain during rising stages. This water then gradually returns to the river channel as the stages recede. Richey et al. [41] estimated that up to 30% of the Amazon River’s discharge could experience temporary storage within the floodplain during flooding events. Montero and Latrubesse [42] also recorded distinct water stage dynamics across geomorphic reaches of the Negro River. They observed that stage oscillations tend to manifest later upstream than in the downstream reaches. This behavior is partly attributed to the reservoir effect induced by a large tectonic block and the presence of the Mariuá archipelago within the intermediate section of the river.
Peak discharge attenuation driven by distinctive fluvial styles was also observed by Stevaux et al. [43] in the Upper Paraguay River. Their research revealed that areas of constricted plains serve as bottlenecks for flood runoff, leading to backwater effects that slow down flood wave transmission. This phenomenon creates extensive water bodies upstream that store floodwater, ultimately impacting the duration and magnitude of floods. According to Assine and Silva [44], there is a substantial loss of water, exceeding 50%, as the Upper Paraguay River enters the Pantanal wetland due to its transition into a depositional mega-fan system. Despite being situated in a similar wet–dry seasonal climate, the Araguaia exhibit distinct geomorphic characteristics from the Upper Paraguay. The Araguaia River is an extensive axial tributary system, with water flow and sediment deposition confined to its genetic floodplain.
Nevertheless, our study reveals that during large-scale (type A) flood events, the Araguaia River experiences peak discharge attenuation of up to −43% at the Fazenda Telésforo station. This reduction stems from temporary storage within its well-developed floodplain and water diversion toward the abandoned river branch. This unique combination of characteristics differentiates the Araguaia River from other large axial tributary rivers in tropical South America.

6. Summary and Conclusions

The Araguaia River is a large tropical system characterized by a longitudinal geomorphic variability, significantly shaped by late Holocene avulsion events and subsequent adjustments of the modern channel [15]. Previous studies [8,23] already highlighted the role of geomorphology in understanding the progression of floods in this river, leading to the identification of distinct flood types.
Our approach in this study offers a refined perspective on classifying flood events in this river. We found that small-scale floods (types B and D2) exhibit distinct attenuation patterns, with type D2 associated with drier-than-usual years and low-level water diversion. In contrast, the attenuation of intermediate (Types C and D1) and large-scale (type A) floods is primarily influenced by the peak magnitude at the upstream gauging station, with no statistical significance observed for the influence of tributaries on absolute peak changes. Flood properties such as wave celerity and slope of the rising limb show limited discernible distinctions between flood types but appear to respond to the regional geomorphological organization of the system. By considering the geomorphically distinct segments, we observed that the nature of the valley floor plays a central role in facilitating the efficient conveyance of floods in the upper (SI) and the lowermost (SIV and SV) segments. The presence of a wide and complex floodplain significantly influences the storage capacity, allowing for the gradual dissipation of excess floodwater and the attenuation of flood peaks in SII. Additionally, water diversion to the ancient system (Javaés River) does not directly impact peak flows; however, it exhibits unique transfer patterns across a range of flow conditions, resulting in overall annual losses or gains in SIII.
In the Araguaia River, the distinctive hydrogeomorphic transmission of floodwaters plays a crucial role in maintaining the ecological integrity of its highly diverse floodplain at the Cerrado–Amazonia ecotone. Therefore, it is essential for sustainable management practices to consider the outcomes highlighted in this study.
Our findings on the propagation patterns of flow across different geomorphic segments provide insights for studying the spatial dynamics of nutrients and sediments within the system. These insights extend to understanding their effects on the diversity and functioning of aquatic and riparian ecosystems, thereby aiding in identifying prone areas to vulnerabilities. Our research also holds the potential to be integrated with studies dedicated to evaluating the environmental impacts of potential hydroelectric installations. In particular, examining the downstream hydrophysical repercussions of dam construction by assessing the effect of the regulation on the flood regime is a necessity because it could impact the unique mechanisms of hydrogeomorphic transmission and channel–floodplain hydrogeomorphological processes of flood waves in the middle Araguaia River. These impacts would directly affect the ecological preservation of the river corridor.
We also recommend greater awareness of the partially abandoned branch of the Araguaia River. Our research demonstrates that the Javaés River is a functional part of the active system annually sourced by the Araguaia at a wide range of flows. These mechanisms of hydrological connectivity sustain and emphasize the role of the Araguaia in maintaining the riverine ecosystems of the Javaes. This vulnerable subsidiary system has been facing progressively severe water crises in recent years, leading to substantial environmental problems affecting indigenous communities and triggering conflicts between rural producers and environmentalists. Consequently, protective management measures and plans for water management are required.

Author Contributions

Conceptualization, T.M.S., E.M.L. and M.B.; methodology, T.M.S.; validation, T.M.S. and E.M.L.; formal analysis, T.M.S., E.M.L. and M.B.; data curation, T.M.S.; writing—original draft preparation, T.M.S.; writing—review and editing, T.M.S. and E.M.L.; supervision, E.M.L.; project administration, E.M.L.; funding acquisition, M.B. All authors have read and agreed to the published version of the manuscript.

Funding

This research was funded by Coordination for the Improvement of Higher Education Personnel—Brazil (CAPES), Finance Code 001, and the Brazilian National Council for Scientific and Technological Development (CNPq), No. 422559/2021-0.

Data Availability Statement

Data will be made available on request.

Conflicts of Interest

The authors declare no conflict of interest.

References

  1. Latrubesse, E.M.; Sinha, R. Human Impacts on Sediment and Morphodynamics of Large Tropical Rivers, 2nd ed.; Elsevier Inc.: Amsterdam, The Netherlands, 2022. [Google Scholar]
  2. Wohl, E.; Barros, A.; Brunsell, N.; Chappell, N.A.; Coe, M.; Giambelluca, T.; Goldsmith, S.; Harmon, R.; Hendrickx, J.M.H.; Juvik, J.; et al. The Hydrology of the Humid Tropics. Nat. Clim. Chang. 2012, 2, 655–662. [Google Scholar] [CrossRef]
  3. Latrubesse, E.M.; Amsler, M.L.; de Morais, R.P.; Aquino, S. The Geomorphologic Response of a Large Pristine Alluvial River to Tremendous Deforestation in the South American Tropics: The Case of the Araguaia River. Geomorphology 2009, 113, 239–252. [Google Scholar] [CrossRef]
  4. Coe, M.T.; Latrubesse, E.M.; Ferreira, M.E.; Amsler, M.L. The Effects of Deforestation and Climate Variability on the Streamflow of the Araguaia River, Brazil. Biogeochemistry 2011, 105, 119–131. [Google Scholar] [CrossRef]
  5. Guimarães, D.P.; Landau, E.C. Georreferenciamento Dos Pivôs Centrais de Irrigação No Brasil: Ano-Base 2020. Bol. Pesqui. Desenvolv. 2020, 1, 64. [Google Scholar]
  6. Companhia de Desenvolvimento Dos Vales Do São Francisco E Do Parnaíba—Codevasf. Codevasf Anuncia Investimentos Federais no Projeto de Irrigação de Luiz Alves Do Araguaia, em Goiás. Available online: https://www.codevasf.gov.br/noticias/2020/codevasf-anuncia-investimentos-federais-no-projeto-de-irrigacao-de-luiz-alves-do-araguaia-em-goias (accessed on 12 July 2023).
  7. Latrubesse, E.M.; Arima, E.; Ferreira, M.E.; Nogueira, S.H.; Wittmann, F.; Dias, M.S.; Dagosta, F.C.P.; Bayer, M. Fostering Water Resource Governance and Conservation in the Brazilian Cerrado Biome. Conserv. Sci. Pract. 2019, 1, e77. [Google Scholar] [CrossRef]
  8. Aquino, S.; Latrubesse, E.M.; de Souza Filho, E.E. Relações Entre o Regime Hidrológico e Os Ecossistemas Aquáticos Da Planície Aluvial Do Rio Araguaia. Acta Sci. Biol. Sci. 2008, 30, 361–369. [Google Scholar] [CrossRef]
  9. Lininger, K.B.; Latrubesse, E.M. Flooding Hydrology and Peak Discharge Attenuation along the Middle Araguaia River in Central Brazil. Catena 2016, 143, 90–101. [Google Scholar] [CrossRef]
  10. Ferreira, P.D.; de Tarso Amorim Castro, P. Nest Placement of the Giant Amazon River Turtle, Podocnemis Expansa, in the Araguaia River, Goiäs State, Brazil. Ambio 2005, 34, 212–217. [Google Scholar] [CrossRef]
  11. Kurzatkowski, D.; Leuschner, C.; Homeier, J. Effects of Flooding on Trees in the Semi-Deciduous Transition Forests of the Araguaia Floodplain, Brazil. Acta Oecologica 2015, 69, 21–30. [Google Scholar] [CrossRef]
  12. Nabout, J.C.; Nogueira, I.S.; Oliveira, L.G. Phytoplankton Community of Floodplain Lakes of the Araguaia River, Brazil, in the Rainy and Dry Seasons. J. Plankton Res. 2006, 28, 181–193. [Google Scholar] [CrossRef]
  13. Rocha, R.G.; Ferreira, E.; Fonseca, C.; Justino, J.; Leite, Y.L.R.; Costa, L.P. Seasonal Flooding Regime and Ecological Traits Influence Genetic Structure of Two Small Rodents. Ecol. Evol. 2014, 4, 4598–4608. [Google Scholar] [CrossRef] [PubMed]
  14. Tejerina-garro, F.L.; Fortin, R.; Rodríguez, M.A. Tejerina-Garro et Al 1998 Fish Communities Middle Rio Araguaia.Pdf. Environ. Biol. Fishes 1998, 51, 399–410. [Google Scholar] [CrossRef]
  15. Suizu, T.M.; Latrubesse, E.M.; Bayer, M. Geomorphic Diversity of the Middle Araguaia River, Brazil: A Segment-Scale Classification to Support River Management. J. South Am. Earth Sci. 2023, 121, 104166. [Google Scholar] [CrossRef]
  16. Climate Engine; Desert Research Institute, University of Idaho. 2023. version 2.1. Available online: http://climateengine.org (accessed on 27 June 2023).
  17. Aquino, S.; Latrubesse, E.M.; de Souza Filho, E.E. Caracterização Hidrológica e Geomorfológica Dos Afluentes Da Bacia Do Rio Araguaia. Rev. Bras. Geomorfol. 2009, 10, 43–54. [Google Scholar] [CrossRef]
  18. Bayer, M. Diagnóstico Dos Processos de Erosão/Assoreamento Na Planície Aluvial Do Rio Araguaia: Entre Barra Do Garças e Cocalinho; Universidade Federal de Goiás (UFG): Goiânia, Brazil, 2002. [Google Scholar]
  19. Marinho, G.V.; de Castro, S.S.; de Campos, A.B. Hydrology and Gully Processes in the Upper Araguaia River Basin, Central Brazil. Z. Fur Geomorphol. Suppl. 2006, 145, 119–145. [Google Scholar]
  20. Ferreira, M.E.; Ferreira, L.G.; Latrubesse, E.M.; Miziara, F. High Resolution Remote Sensing Based Quantification of the Remnant Vegetation Cover in the Araguaia River Basin, Central Brazil. Int. Geosci. Remote Sens. Symp. 2008, 4, 2008–2010. [Google Scholar] [CrossRef]
  21. Latrubesse, E.M. Patterns of Anabranching Channels: The Ultimate End-Member Adjustment of Mega Rivers. Geomorphology 2008, 101, 130–145. [Google Scholar] [CrossRef]
  22. Dunne, T.; Leopold, L.B. Water in Environmental Planning; Macmillan: New York, NY, USA, 1978. [Google Scholar]
  23. Lininger, K.B. The Hydro-Geomorphology of the Middle Araguaia River: Floodplain Dynamics of the Largest Fluvial System Draining the Brazilian Cerrado; The University of Texas at Austin: Austin, TX, USA, 2013. [Google Scholar]
  24. Polvi, L.E.; Wohl, E.E.; Merritt, D.M. Geomorphic and Process Domain Controls on Riparian Zones in the Colorado Front Range. Geomorphology 2011, 125, 504–516. [Google Scholar] [CrossRef]
  25. Spellman, P.; Gulley, J.; Martin, J.B.; Loucks, J. The Role of Antecedent Groundwater Heads in Controlling Transient Aquifer Storage and Flood Peak Attenuation in Karst Watersheds. Earth Surf. Process. Landforms 2019, 44, 77–87. [Google Scholar] [CrossRef]
  26. Wolff, C.G.; Burges, S.J. An Analysis of the Influence of River Channel Properties on Flood Frequency. J. Hydrol. 1994, 153, 317–337. [Google Scholar] [CrossRef]
  27. Goetz, J.; Schwarz, C. Fasstr: Analyze, Summarize, and Visualize Daily Streamflow Data. 2023. Available online: https://bcgov.github.io/fasstr/ (accessed on 28 June 2023).
  28. Mandych, A.F. Classification of Floods. In Encyclopedia of Life Support Systems. Natural Disasters Vol. II.; Kotlyakov, V.M., Ed.; UNESCO, Eolss Pbl. Co.: Paris, France, 2010; pp. 63–88. [Google Scholar]
  29. Posit Team RStudio. Integrated Development Environment for R 2023; RStudio: Boston, MA, USA, 2023. [Google Scholar]
  30. Aquino, S. Mecanismos de Transmissão de Fluxos de Água e Sedimentos Em Dois Grandes Rios Aluviais Impactados Pela Atividade Humana: O Araguaia e o Paraná; Universidade Estadual de Maringá (UEM): Maringá, Brazil, 2007. [Google Scholar]
  31. Bhowmik, N.G.; Stall, J.B. Hydraulic Geometry and Carrying Capacity of Floodplains; University of Illinois at Urbana-Champaign. Water Resources Center: Champaign, IL, USA, 1979; p. 147. [Google Scholar]
  32. Woltemade, C.J.; Potter, K.W. A Watershed Modeling Analysis of Fluvial Geomorphologic Influences on Flood Peak Attenuation. Water Resour. Res. 1994, 30, 1933–1942. [Google Scholar] [CrossRef]
  33. Archer, D.R. Flood Wave Attenuation Due to Channel and Floodplain Storage and Effects on Flood Frequency. In Floods: Hydrological, Sedimentological and Geomorphological Implications; Beven, K., Carling, P., Eds.; John Wiley & Sons Ltd.: Chichester, UK, 1989; pp. 37–46. [Google Scholar]
  34. Wohl, E. An Integrative Conceptualization of Floodplain Storage. Rev. Geophys. 2021, 59, e2020RG000724. [Google Scholar] [CrossRef]
  35. Ang, W.J.; Park, E.; Yang, X. Geomorphic Control on Stage-Area Hysteresis in Three of the Largest Floodplain Lakes. J. Hydrol. 2022, 614, 128574. [Google Scholar] [CrossRef]
  36. Hudson, P.F.; Colditz, R.R. Flood Delineation in a Large and Complex Alluvial Valley, Lower Pánuco Basin, Mexico. J. Hydrol. 2003, 280, 229–245. [Google Scholar] [CrossRef]
  37. Marchetti, Z.Y.; Latrubesse, E.M.; Pereira, M.S.; Ramonell, C.G. Vegetation and Its Relationship with Geomorphologic Units in the Parana River Floodplain, Argentina. J. South Am. Earth Sci. 2013, 46, 122–136. [Google Scholar] [CrossRef]
  38. Marinho, R.R.; Zanin, P.R.; Filizola Junior, N.P. The Negro River in the Anavilhanas Archipelago: Streamflow and Geomorphology of a Complex Anabranching System in the Amazon. Earth Surf. Process. Landf. 2022, 47, 1108–1123. [Google Scholar] [CrossRef]
  39. Park, E.; Latrubesse, E.M. The Hydro-Geomorphologic Complexity of the Lower Amazon River Floodplain and Hydrological Connectivity Assessed by Remote Sensing and Field Control. Remote Sens. Environ. 2017, 198, 321–332. [Google Scholar] [CrossRef]
  40. Meade, R.H.; Rayol, J.M.; da Conceicão, S.C.; Natividade, J.R.G. Backwater Effects in the Amazon River Basin of Brazil. Environ. Geol. Water Sci. 1991, 18, 105–114. [Google Scholar] [CrossRef]
  41. Richey, J.E.; Mertes, L.A.K.; Dunne, T.; Victoria, R.L.; Forsberg, B.R.; Tancredi, A.C.N.S.; Oliveira, E. Sources and Routing of the Amazon River Flood Wave. Global Biogeochem. Cycles 1989, 3, 191–204. [Google Scholar] [CrossRef]
  42. Montero, J.C.; Latrubesse, E.M. The Igapó of the Negro River in Central Amazonia: Linking Late-Successional Inundation Forest with Fluvial Geomorphology. J. South Am. Earth Sci. 2013, 46, 137–149. [Google Scholar] [CrossRef]
  43. Stevaux, J.C.; de Macedo, H.A.; Assine, M.L.; Silva, A. Changing Fluvial Styles and Backwater Flooding along the Upper Paraguay River Plains in the Brazilian Pantanal Wetland. Geomorphology 2020, 350, 106906. [Google Scholar] [CrossRef]
  44. Assine, M.L.; Silva, A. Contrasting Fluvial Styles of the Paraguay River in the Northwestern Border of the Pantanal Wetland, Brazil. Geomorphology 2009, 113, 189–199. [Google Scholar] [CrossRef]
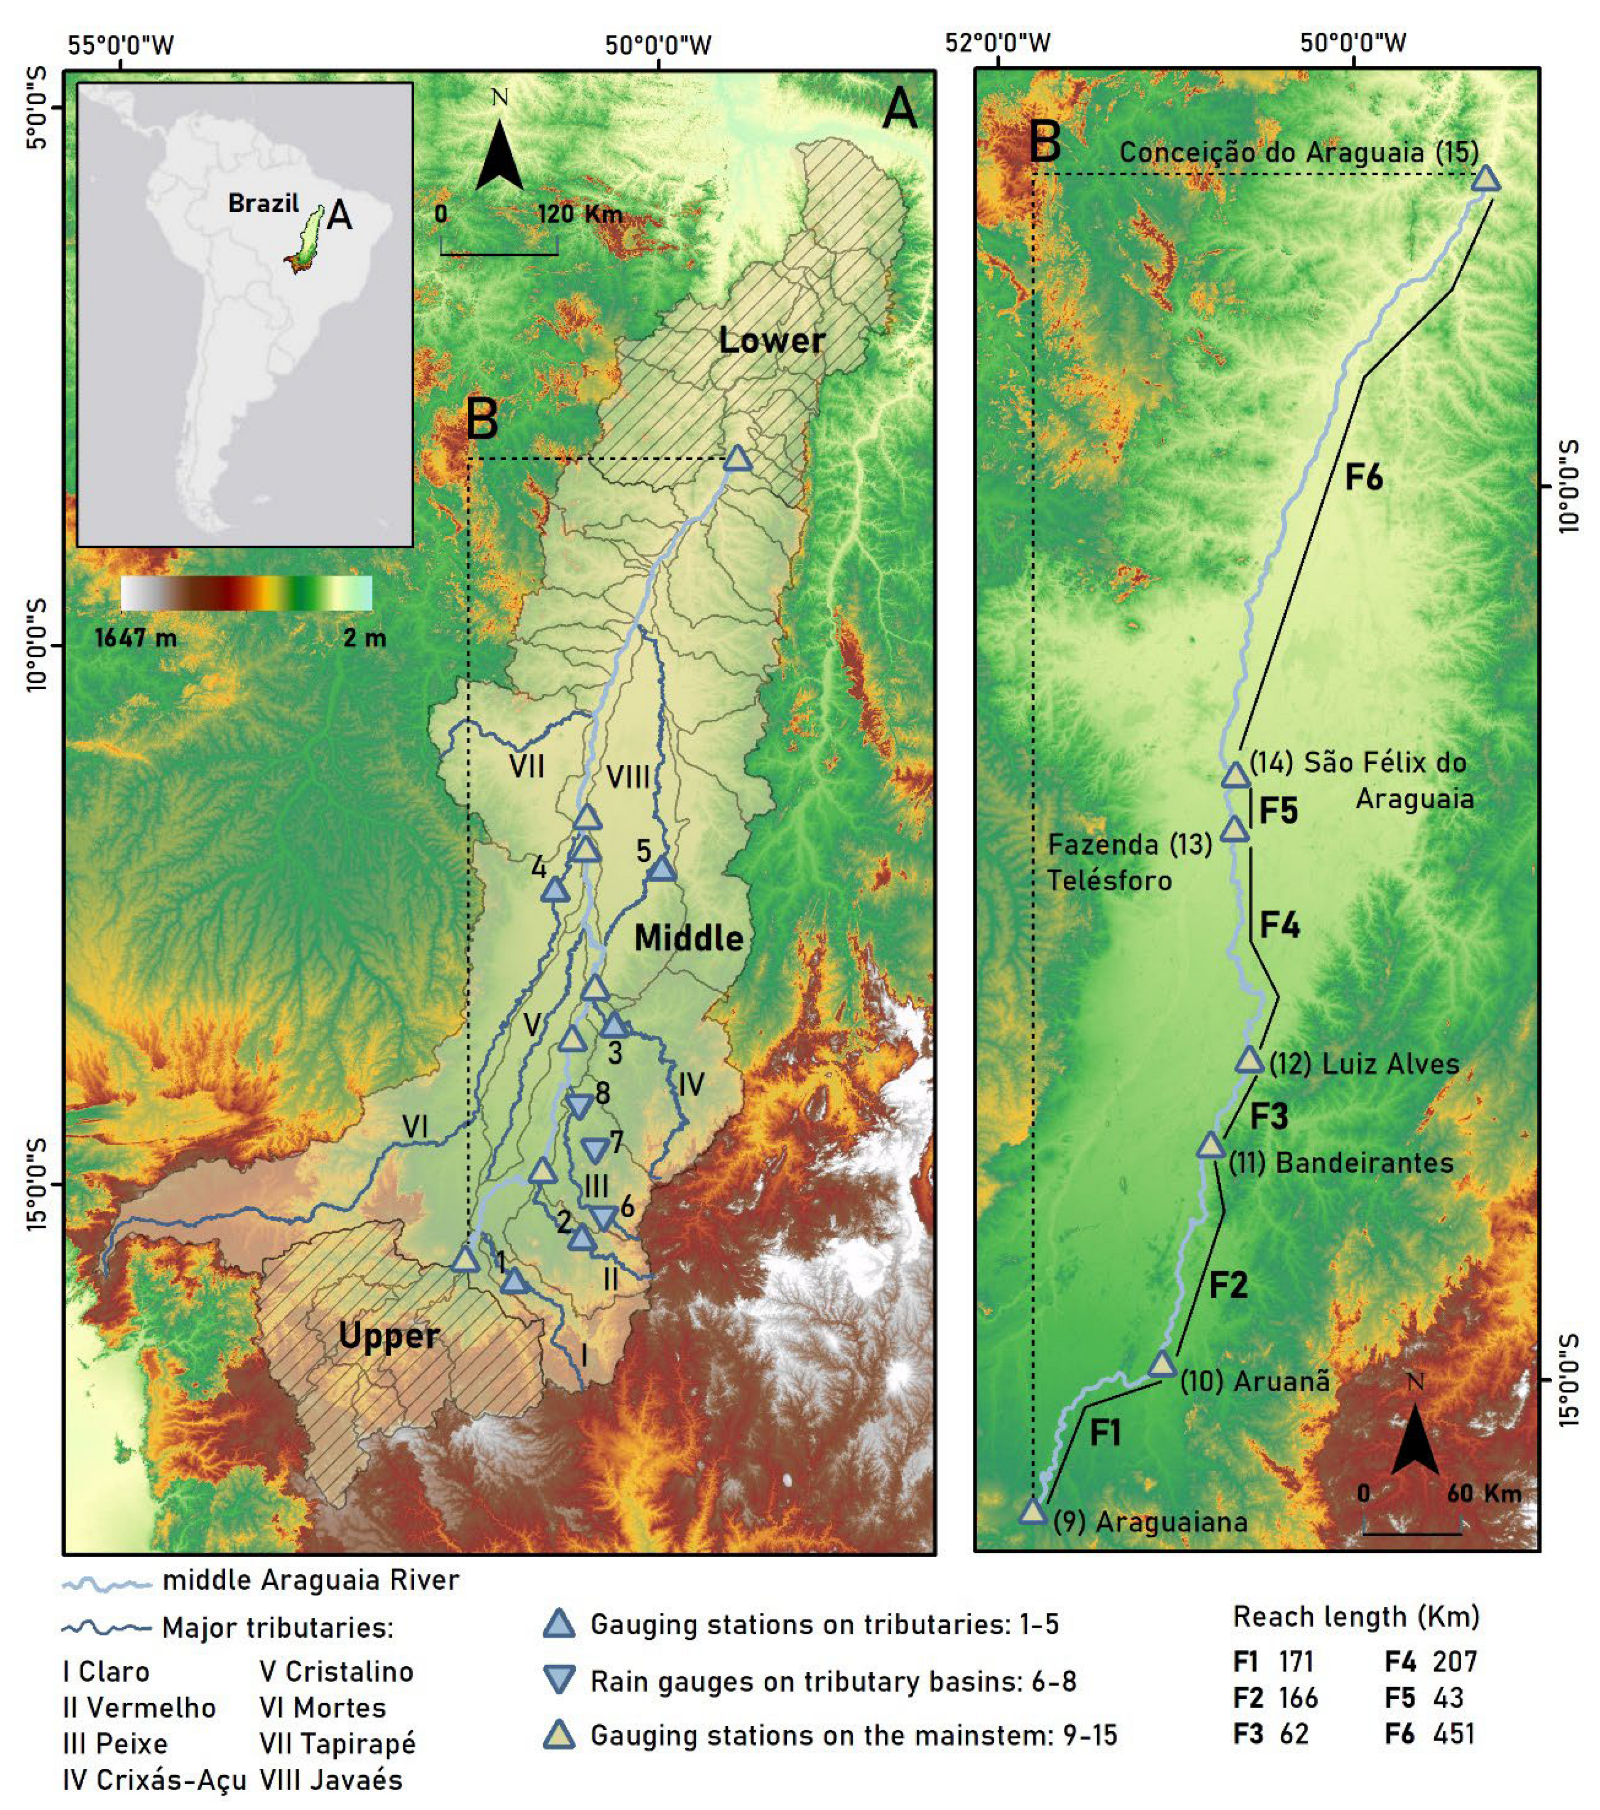
Figure 1. (A) Araguaia River basin in central Brazil with major tributaries and selected gauging stations. (B) Study reaches (F1–F6) in the middle Araguaia River. Table 1: gauge stations (1–15) information.
Water 15 03725 g001
Figure 2. Classification of flood events in the middle Araguaia River between 1975 and 2014. (A Type A), (B Type B), (C Type C), (D Type D1), and (E Type D2) display downstream variations in peak flow (Qp) and the corresponding increases in drainage area (DA) for the gauging stations located along the study site. The vertical dotted lines indicate the entry points of the major tributaries. F1–F6 refer to the reaches between consecutive gauging stations (Figure 1B), while A1–E1 represent the absolute values of Qp for each flood type between Aruanã and Faz. Telésforo. Upper and lower envelopes define the maximum and minimum values.
Water 15 03725 g002
Figure 3. Percentage change rate in downstream peak flows for each flood class (AD2) between 1975 and 2014. The peak flow value in Aruanã was considered the reference to calculate changes in Bandeirantes (Bd), Luiz Alves (LA), and Faz. Telésforo (FT).
Water 15 03725 g003
Figure 4. Peak discharge ratio (QpR) plotted against the absolute value of upstream peak flow (Qp) for successive reaches F1 (a), F2 (b), F3 (c), F4 (d), F5 (e), and F6 (f). Qbf: bankfull discharge. The Spearman correlation coefficient (ρ) and the associated p-values (p) provide a measure of correlation significance.
Water 15 03725 g004
Figure 5. Deviations of Qp from the long-term average peak flow (1975–2014) expressed as a percentage for the (a) Claro and (b) Vermelho tributaries, as well as the deviations of Qmean from the long-term mean annual flow (1975–2014) expressed as a percentage for the (c) Claro and (d) Vermelho tributaries.
Water 15 03725 g005
Figure 6. Analysis of peak discharges (Qp) and precipitation patterns in reaches F2 and F3. (a) Net gain or loss in peak flow (m3/s) per unit channel length (km). (b) Average annual precipitation in the Peixe River basin based on annual rainfall totals from available stations (6, 7, and 8 in Figure 1A). (c) Qp for the lower course of the Crixás Açu River. (d) Qp for the Aruanã station in the mainstem. (e) Qp for the Bandeirantes station in the mainstem. The colored bars, vertical error bars, and dots represent the mean, standard deviation, and absolute values of all yearly measurements associated with a specific flood type in the Araguaia River. The bankfull discharge (Qbf) is indicated on the graphs. Significance levels, represented by p-values, are shown for the one-way ANOVA and Tukey’s pairwise comparisons (horizontal lines) in panels (be). Additionally, the p-values of the two-way ANOVA are provided in panel (f) to identify possible interactions between the net gain or losses in F2 and F3 and the variables depicted in panels (be).
Water 15 03725 g006
Figure 7. Channel and floodplain metrics of the 19 geomorphic reaches previously defined [15] for the middle Araguaia River. F1–F6 are the reaches between gauging stations (Figure 1B).
Water 15 03725 g007
Figure 8. Flood hydrograph properties for each middle Araguaia River flood type from 1975 to 2014. (a) Flood wave celerity from peak-to-peak discharges between every river reach monitored (F1–F6). (b) Slope of the rising limb from bankfull to peak discharges for each gauging station (Ara = Araguaiana; Aru = Aruanã; Bd = Bandeirantes; LA = Luiz Alves; FT = Faz. Telésforo; SFA = S. Félix do Araguaia; CA = Conc. Araguaia). Gauge stations’ locations in Figure 1.
Water 15 03725 g008
Figure 9. Flood flow dynamics and volume transmission patterns along F4. (a) Peak discharges (Qp) at Luiz Alves station in the mainstem. (b) Absolute peak change along reach F4 (Luiz Alves to Faz. Telésforo). (c) Net loss (negative values) or gain (positive values) in water volume along F4. (d) Water volume inflow to the Javaés River. (e) Monthly water volume inflow to the Javaés River. (f) Water input to the Javaés River vs. total annual volume at Luiz Alves mainstem station. (g) Net changes in water volume along F4 vs. water input to the Javaés River. (f,g) Also includes R2, RSE, and p-values for assessing significance and strength of relationships.
Water 15 03725 g009
Figure 10. Discharge dynamics and losses to the Javaés River in 1997 and 2007. Hydrographs for (a) 1997 and (c) 2007 water years from Luiz Alves, Faz. Telésforo, and Barreira do Pequi gauge located in the Javaés River (Figure 1A, station 5). Net discharge losses to the Javaés River (negative values) in (b) 1997 and (d) 2007. Yellow-filled circles represent the duration of the period with significant water losses.
Water 15 03725 g010
Figure 11. Comparative analysis of flood overflows among gauging stations. (a) Average cumulative overflow water volume for all flood events. (b) Coefficient of overflow hydrograph asymmetry averaged for all flood events.
Water 15 03725 g011
Figure 12. Schematic diagram illustrating flood wave transmission for each flood type along the middle Araguaia River, influenced by major geomorphic segments (SI–SV, [15]). Qp values (in m3/s) are averaged for each gauging station.
Water 15 03725 g012
Table 1. River discharge and rain gauge stations with records duration available for analysis. Data sourced by the National Water Agency (Agência Nacional de Águas—ANA).
Number *Gauging StationCode No.Upstream Catchment Area (km2)Years of RecordNumber of Missing Days
1Montes Claros de Goiás2495000010,1001975–20140
2Travessão2513000053101975–201492
3Jusante do Rio Pintado2580000018,3001980–20141411
4Santo Antônio do Leverger2630000059,3001975–20140
5Barreira do Pequi2671000081501987–201479
6Jeroaquara1550001-1975–2014183
7Mozarlândia1450001-1975–2014153
8Lagoa da Flecha1450000-1975–2014375
9Araguaiana2485000050,1201975–20140
10Aruanã2520000076,6881975–20140
11Bandeirantes2570000093,0271975–20140
12Luiz Alves25950000117,9101975–20140
13Fazenda Telésforo26030000132,0251975–19951128
14São Félix do Araguaia26350000194,8541975–201461
15Conceição do Araguaia27500000325,7401975–20140
Note: * Numbers 1–15 correspond to the stations’ locations as depicted in Figure 1.
Disclaimer/Publisher’s Note: The statements, opinions and data contained in all publications are solely those of the individual author(s) and contributor(s) and not of MDPI and/or the editor(s). MDPI and/or the editor(s) disclaim responsibility for any injury to people or property resulting from any ideas, methods, instructions or products referred to in the content.