Article

Determination of Heavy Metals and Health Risk Assessment in Tap Water from Wuhan, China, a City with Multiple Drinking Water Sources

1
State Key Laboratory of Water Resources Engineering and Management, Wuhan University, Wuhan 430072, China
2
Hubei Key Laboratory of Water System Science for Sponge City Construction, Wuhan University, Wuhan 430072, China
*
Authors to whom correspondence should be addressed.
Water 2023, 15(21), 3709; https://doi.org/10.3390/w15213709
Submission received: 20 September 2023 / Revised: 15 October 2023 / Accepted: 17 October 2023 / Published: 24 October 2023

Abstract

:
The health issues of urban tap water are of great concern in the context of sustainability challenges to the environmental quality of water and the security of the water supply. In this work, tap water from the main urban areas in Wuhan and surface water from the Yangtze River and the Hanjiang River were collected during summer (June) and winter (December), 2022. The concentrations of 10 heavy metals including Fe, Al, Mn, Co, Ni, Cu, Se, Cd, Cr and Pb were determined for water quality evaluation and health risk assessment. The results demonstrated that almost all of the tap water samples contained metal concentrations below the Chinese national standard limits for drinking water (GB 5749-2022). The risk of heavy metals in tap water to human health was evaluated, and the results showed that the total carcinogenic risk (TCR) was in the range of 10−6 and 10−4 and the hazard index (HI) was much lower than one in both summer and winter. The current tap water in Wuhan is generally in a relatively safe state and will not cause acute hazards or chronic diseases in the short term, but the long-term cancer risk is still noteworthy. The heavy metal pollution index (HPI) showed that the overall water quality of urban drinking water sources in Wuhan has been satisfactory, despite its slightly polluted state in winter. Pipeline corrosion was considered as one of the important sources of heavy metals in Wuhan tap water, which can explain, to a certain extent, the increase in the heavy metal concentrations of tap water outlets relative to the finished water reported by waterworks, such as Fe, Ni, Cd and Pb. This study has implications for the formulation of better urban water supply security management strategies and associated sustainability challenges.

1. Introduction

The security and effectiveness of domestic water supplies have become a significant concern as a result of rapid urbanization and climate change [1]. Due to the increasing population from urban expansion, urban water security has been regarded as a major problem in megacities [2]. Tap water, which is centrally treated and supplied through complex pipeline networks, serves as the main source for daily household needs and other indispensable purposes for urban residents, including drinking, cooking, bathing, washing, etc. [3]. Generally, tap water sources include rivers, lakes, reservoirs, groundwater or a combination of them, depending on the locally available main water resources or long-distance water transfer projects [4]. After the natural water is taken by the waterworks, a series of treatment measures—involving coagulation, precipitation, filtration, disinfection, etc.—are applied to reduce the content of heavy metals, suspended solids, microorganisms and other substances [5,6]. Then, the treated water enters the water distribution system and is delivered through pipeline networks to individual users. The water quality of the sources, the treatment technology of the waterworks and the maintenance of the pipelines are all important links to ensure the ultimate quality and safety of tap water.
The pollutants in the water environment have become more complex with the development of technology and the intensification of anthropogenic activities [7]. Among the numerous pollutants, heavy metals have attracted global attention for decades due to their non-biodegradability and their high stability and persistence in either the environment or living organisms [8,9,10]. The concentration levels among common heavy metals in water vary greatly. Though some metal elements such as Fe and Cu are critical for physiological processes, excessive bioaccumulation can still pose negative effects [11,12]. In addition, the severity of the toxic effects of heavy metals is disproportionate to their concentrations [13]. Toxic metals such as Cr, Cd and Pb, which have been listed as carcinogens by the World Health Organization (WHO), can induce adverse health consequences including gastrointestinal inflammation, blood cerebral diseases and cardiovascular diseases under long-term exposure at low-dose levels [14,15]. In modern society, humans are significantly exposed to tap water compared with natural water due to their frequent direct intake and contact. The existence of heavy metals in tap water will therefore undoubtedly trigger the increasing potential health risks.
Both natural processes such as rock weathering and anthropogenic factors such as sewage discharge can lead to the increase in heavy metal contents in surface water [16,17,18]. Many past studies have investigated the variations in heavy metals in surface water and groundwater, and they have conducted health risk assessments in different regions [19,20]. Some studies have also focused on developing the water quality assessment using methods such as machine-learning techniques as water quality prediction tools [21,22,23]. Higher heavy metal contents are often found in areas with rich mineral resources or less-developed economies [24], and the serious pollution of water sources then poses a great threat to water supply security. Water sources in highly developed cities are generally more strictly protected due to the increasing awareness of the sustainable exploitation of natural resources [25]. Even if the water sources are slightly contaminated as a result of resident activities and non-point source pollution caused by rainfall and other reasons, the treatment process of the waterworks in these cities can remove most of the heavy metals before transportation since these kinds of pollutants are relatively easy to adsorb or precipitate [24]. However, such cities also face the problem of pipeline aging due to their longer development duration. The pipelines used in the past were usually made of galvanized pipes, which contained high contents of heavy metals such as Mn, Ni and Cr, besides Fe. The corrosion of the pipelines would lead to the release of large amounts of metal elements, which change the chemical composition of the outlet water as it is transported through the water supply system [26,27,28]. The decline in water quality after long-distance transportation through pipelines has often been reported in previous investigations [5,29].
As a megacity with multiple drinking water sources, Wuhan has a complex water supply system with important safety responsibilities that serves more than 13 million residents. Previous studies have mainly investigated the pollution status of the surface water environment in Wuhan, focusing on the water quality of the urban lakes, the Yangtze River and the Hanjiang River [30,31,32]. However, few studies have specifically considered the importance of tap water health issues, which is also a hot issue for water security in the process of accelerating urbanization. In this work, two comprehensive sampling campaigns were carried out, and the tap water from different types of users as well as the rivers serving as their water sources were collected and analyzed for heavy metal concentrations in the summer and winter. The objectives of this study are (1) to elucidate the concentration levels and variations of heavy metals in tap water and (2) to estimate the potential health risks due to exposure to heavy metals in tap water in the main urban areas in Wuhan. The results of this study have implications for the formulation of better urban water supply security management strategies and associated sustainability challenges.

2. Materials and Methods
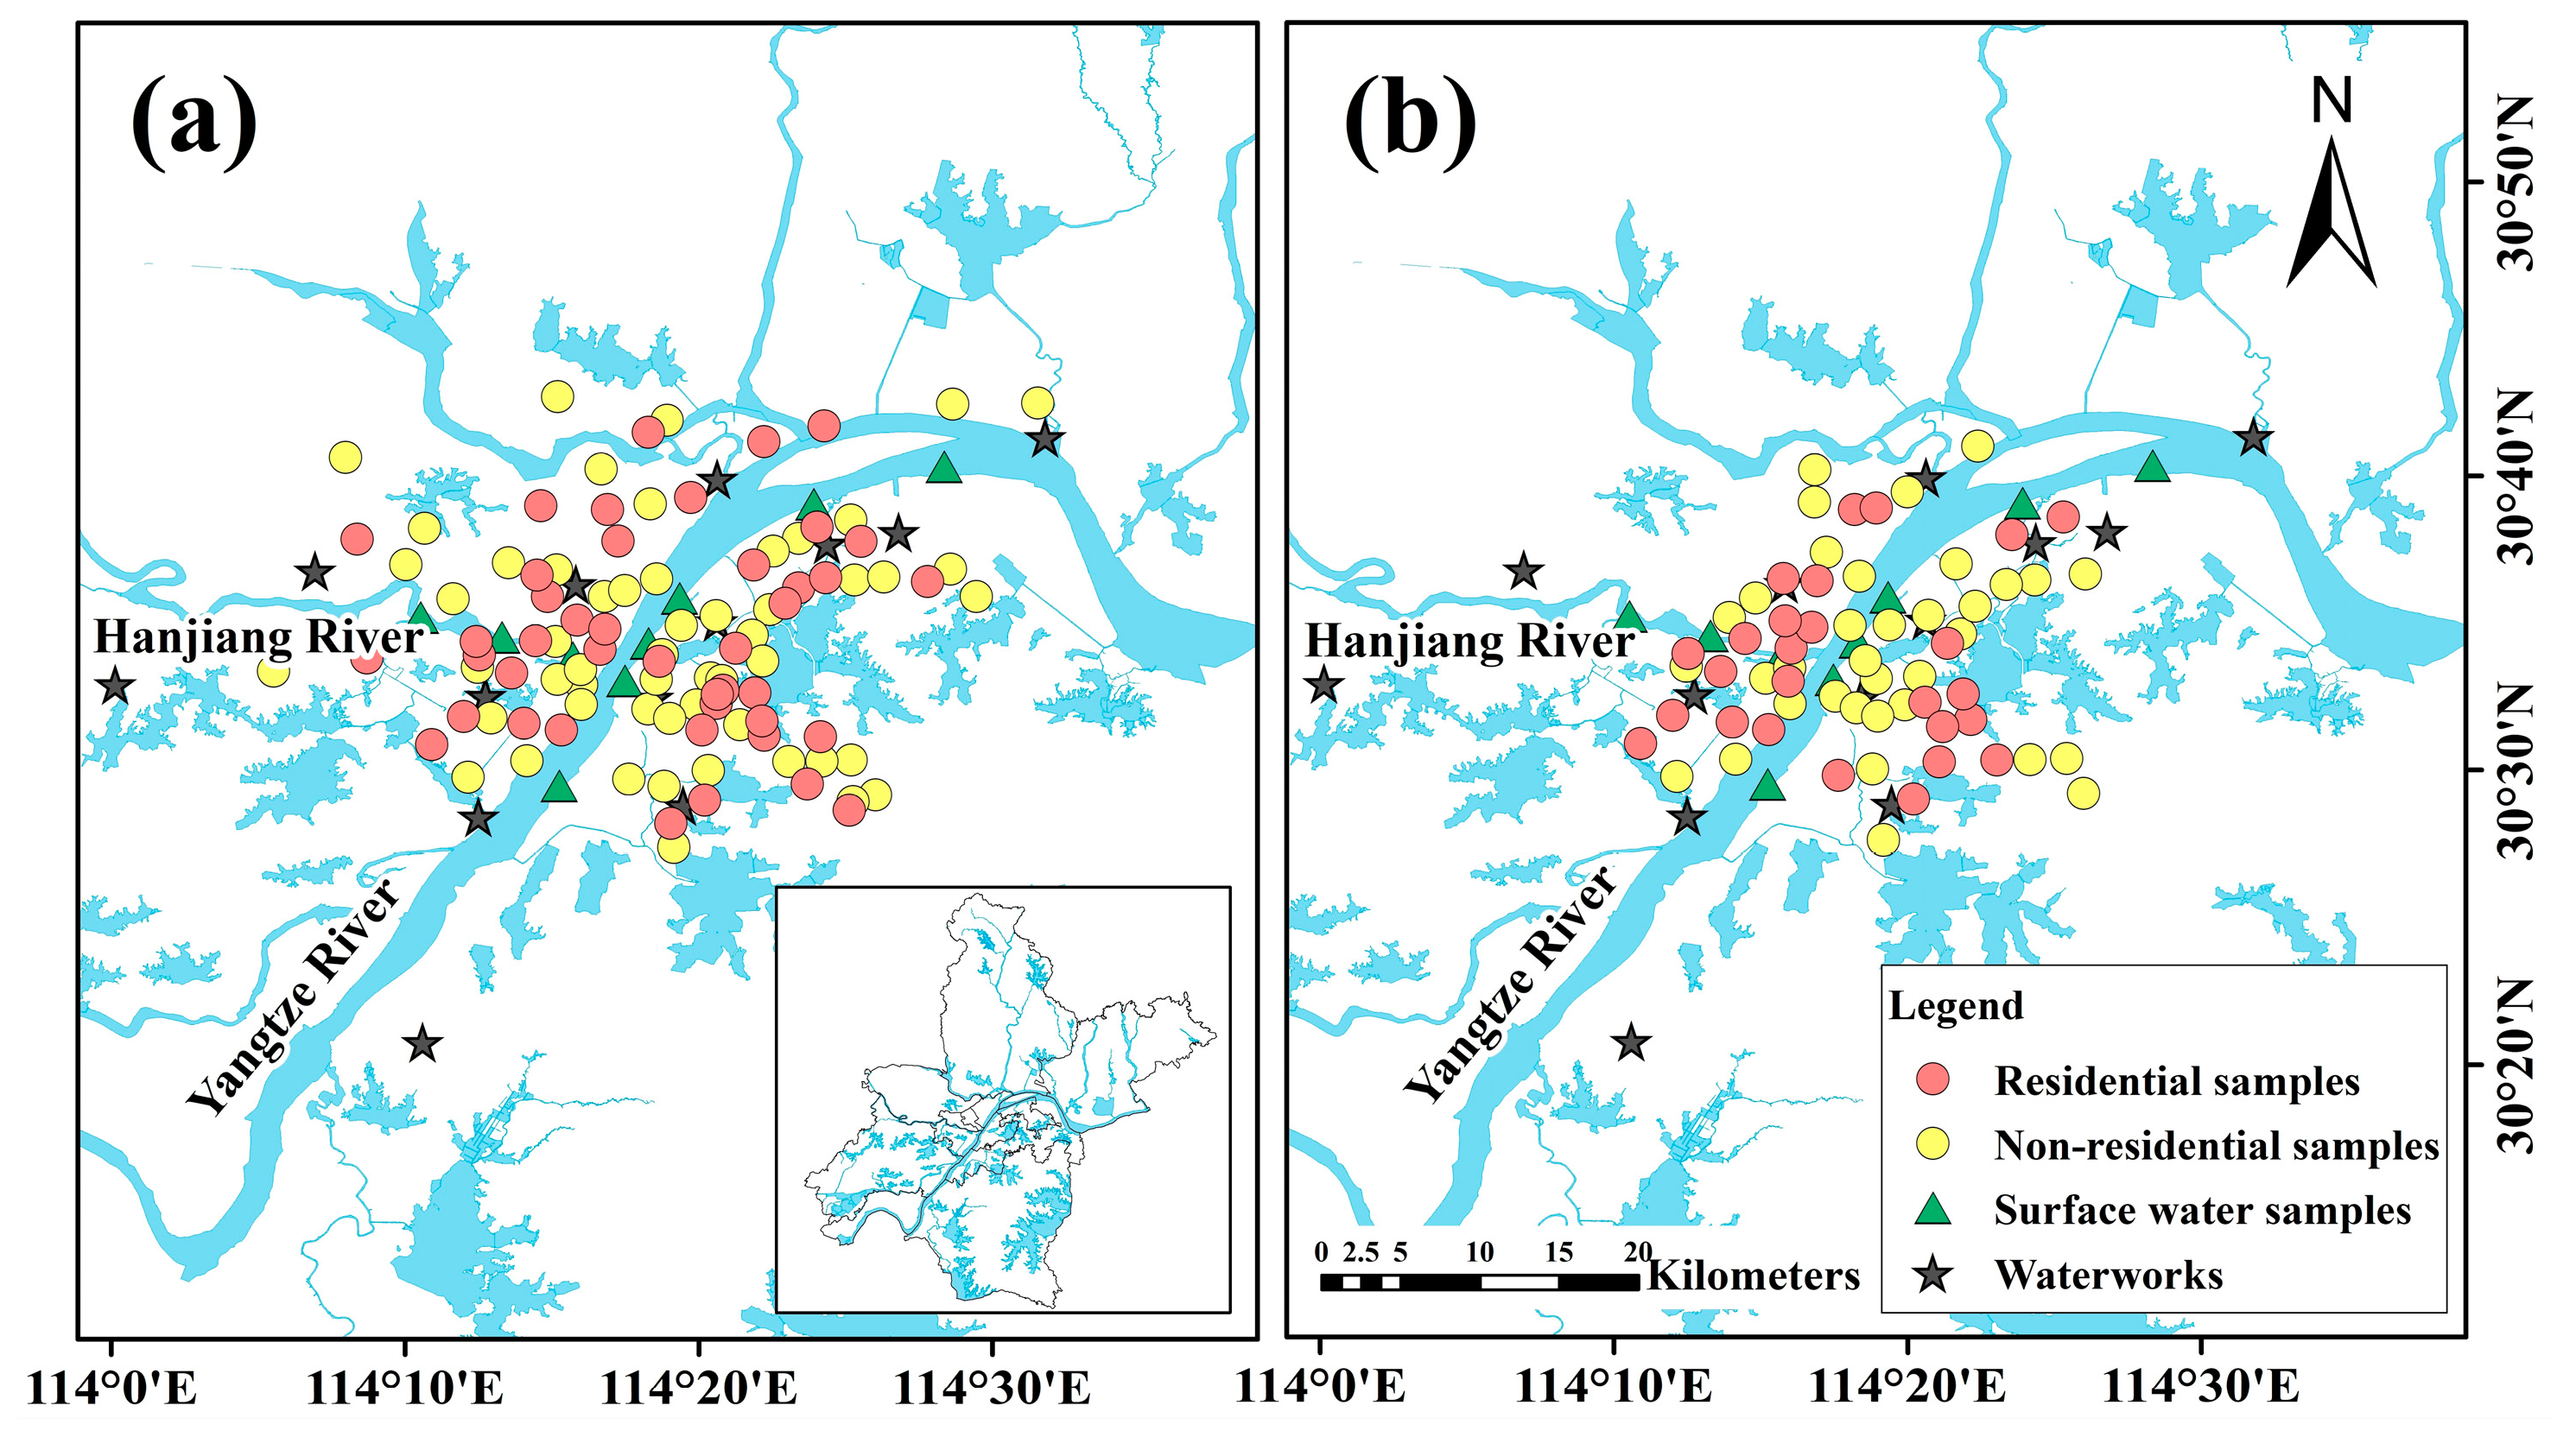
2.1. Study Area

Wuhan (113°41′–115°05′ E and 29°58′–31°22′ N), located in the middle part of China, is one of the core cities in the Yangtze River Economic Belt. Wuhan has a subtropical humid monsoon climate with the annual average temperature of 15.8–17.5 °C and annual average precipitation of about 1205 mm [17]. Wuhan covers an area of 8494 km2, and the water area accounts for 26.1% of the total area [33]. Numerous rivers and lakes form a huge urban water network with the Yangtze River and the Hanjiang River dividing the city into three towns. With the development of the economy, Wuhan has experienced a rapid urbanization process and the demand for water resources in the city is constantly increasing. Both the Yangtze River and the Hanjiang River serve as the drinking water sources for Wuhan [34], and a series of urban water supply infrastructures have been built and upgraded to ensure the reliability of basic urban domestic water. However, the Yangtze River and the Hanjiang River are also natural receiving water bodies for urban surface runoff and some possible treated and untreated wastewater, which increases the potential risks of urban water security.

2.2. Sample Collection and Measurement Method

The urban tap water sampling activities were intensively conducted in the main urban areas in Wuhan and a total of 97 samples and 61 samples were collected during the summer (June) and winter (December) of 2022, respectively. The tap water samples collected during the two sampling activities involved both residential and non-residential (commercial) areas, and the locations of sampling points are indicated in Figure 1. In addition, a total of 9 surface water samples including 6 from the Yangtze River and 3 from the Hanjiang River were also collected as the references during each sampling activity. The cold tap water was collected after running the tap for 1 min to ensure a stable water quality, and grab water samples were collected from the rivers. All water samples were stored in thoroughly pre-washed 500 mL capacity polyethylene bottles and rinsed twice on site prior to filling. It should be noted that it is necessary to ensure that the tap water outlet has not been installed with a water purification device. Then, all the samples were transferred to the laboratory at low temperatures as quickly as possible for further treatment and analysis.
The obtained tap water samples were filtered with 0.22 µm polyether sulfone filters and added into 10 mL polypropylene tubes. A certain volume of HNO3 and HCl solution was then added to reach the final concentration of 4% HNO3 and 1% HCl. The obtained surface water samples were digested with HNO3 and HCl by a microwave digestion system (APL MD8H, Chengdu, China) at the volume ratio of 20 mL water sample: 2 mL HNO3: 0.5 mL HCl, and the digested solutions were transferred into 50 mL volumetric bottles, then diluted with the ultrapure water. Inductively-coupled plasma mass spectrometry (ICP-MS, NexION 350, PerkinElmer, Waltham, MA, USA) was used to determine the concentrations of 10 heavy metal elements in the water samples, including Fe, Al, Mn, Co, Ni, Cu, Se, Cd, Cr and Pb. The blank (ultrapure water) and standard samples were analyzed regularly to control the accuracy of the analysis during the sample measurement. In order to eliminate the influence of matrix in different samples, 3 elements that scarcely exist in tap water and surface water (i.e., Sc, Ge, Re) were selected as the internal standard to ensure quality control. The detection limits for metal elements from ICP-MS analysis were according to “water quality—determination of 65 elements—inductively coupled plasma-mass spectrometry (HJ 700-2014)” [35]. All the water samples were prepared and analyzed at least twice.

2.3. Statistical Analysis

Principal component analysis (PCA) was used for the dimensionality reduction of the heavy metal concentration data in the tap water with respect to the samples collected in two seasons and originated from different water sources. The original data were standardized by z-score transformation prior to PCA, and the Kaiser–Meyer–Olkin (KMO) and Bartlett’s sphericity test were applied to confirm the validity of PCA [17]. Spearman correlation analysis was applied to measure the strength of monotonic relationships between paired data, and hierarchical cluster analysis (HCA) was also used to group the variables into significant different clusters by the Ward’s linkage method, to explore potential associations among heavy metals in tap water. The normality and homogeneity of the variance of the original data were tested using the Shapiro–Wilk test and Levene’s test, respectively. Since the variables were not all subject to a normal distribution and homogeneity of variance, the Mann–Whitney non-parametric test was performed to examine the statistical differences of each metal element in the surface water samples between the Yangtze River and the Hanjiang River, as well as the tap water samples between the residential and non-residential areas during each season, with statistical significance established at the 0.05 level.

2.4. Health Risk Assessment Model

The health risk assessment, which reflects the threat of heavy metals in tap water to human health, was conducted according to the model developed by the United States Environment Protection Agency (US EPA) [36]. In general, the exposure of humans to the metal elements in tap water includes two approaches: oral intake and dermal absorption intake. The dose of oral chronic daily intake (CDIoral, mg·kg−1·d−1) and dermal absorption chronic daily intake (CDIdermal, mg·kg−1·d−1) can be calculated according to Equations (1) and (2), respectively [20,37].
CDI oral = C × I R D W × E F × E D B W × E A T × 10 3
CDI dermal = C × k × S A × B T × E F × E D B W × E A T
where C is the concentration of each metal element detected in the tap water samples, IRDW, EF, ED, BW, EAT, SA and BT refer to the intake rate of drinking water (L/d), exposure frequency (d/a), exposure duration (a), body weight (kg), exposure average time (d), skin surface area (m2) and daily bathing time (h/d), respectively. The values of such parameters are shown in Table 1. The parameter k refers to the skin permeability coefficient (m/h), which is dependent on the characteristics of each metal element (given in Table 2).
Then, the carcinogenic health risk and the non-carcinogenic health risk caused by heavy metals in tap water can be calculated through Equations (3)–(10) [3,20]. The carcinogenic risk (CR) is normally considered for the toxic metals of Cr, Cd and Pb as their carcinogenic ability has been widely reported, while the non-carcinogenic risk is considered for all the metal elements determined in this study.
CR = CRoral + CRdermal
CRoral = CDIoral × CSF
CRdermal = CDIdermal × CSF
TCR = j = 1 m C R j
HQ = HQoral + HQdermal
HQoral = CDIoral/Rfdoral
HQdermal = CDIdermal/Rfddermal
HI = j = 1 n H Q j
The value of CR of each metal element is the sum of CRoral and CRdermal (Equation (3)), where CRoral and CRdermal refer to the carcinogenic risk of oral exposure and dermal exposure, respectively. These two parameters were obtained by multiplying the oral or dermal chronic daily intake and carcinogenic slope factor (CSF) (Equations (4) and (5)). The standard assumption values of CSF for each specific metal were obtained from Selvam et al. [20] and summarized in Table 2 for the subsequent calculations. The total carcinogenic risk (TCR) was then obtained by calculating the sum of CR of each toxic metal (Equation (6)), where m and CRj refer to the number of metal elements and the CR value of the jth heavy metal, respectively. Generally, a TCR lower than 10−6 indicates a negligible carcinogenic risk to human health, a TCR between 10−6 and 10−4 indicates an acceptable or tolerable risk, and a TCR higher than 10−4 indicates a high risk and is detrimental to human health [39].
The probability of a non-carcinogenic risk from an individual metal element is represented by the hazard quotient (HQ), which is the sum of HQoral and HQdermal (Equation (7)). HQoral and HQdermal refer to the hazard quotient of oral exposure and dermal exposure, respectively. These two results were the ratio of the oral or dermal chronic daily intake to the corresponding reference dose (Rfdoral and Rfddermal, shown in Table 2) using Equations (8) and (9). The combined potential non-carcinogenic risks were further appraised by estimating the hazard index (HI), which can be obtained by calculating the sum of HQ of each metal element (Equation (10)), where n and HQj refer to the number of metal elements and the HQ value of the jth heavy metal, respectively. A HI higher than 1 indicates that there may be some concerns about the adverse effects on human health, and a HI lower than 1 indicates the opposite applies [40].
Table 2. Reference dose, skin permeability coefficient and carcinogenic slope factor for each metal element [3,20,41].
MetalsRfdoral
(mg·kg−1·d−1)
Rfddermal
(mg·kg−1·d−1)
k
(m/h)
CSF
(mg·kg−1·d−1)−1
Fe0.70.140.00001
Al10.20.00001
Mn0.0240.000960.00001
Co0.00030.000060.00004
Ni0.020.00080.00004
Cu0.040.0120.00001
Se0.0050.000150.00001
Cd0.00050.0000250.000016.1
Cr0.0030.0000750.000030.5
Pb0.00140.000420.000010.0085
Note: Rfdoral, Rfddermal, k and CSF refer to the oral reference dose, dermal reference dose, skin permeability coefficient and carcinogenic slope factor, respectively.

2.5. Heavy Metal Pollution Index (HPI)

HPI, a method that comprehensively evaluates the influence of various heavy metals on the overall surface water quality based on a weighted arithmetic mean, has been widely used worldwide. It can be used to classify the pollution levels and toxicity degree caused by heavy metals in water. HPI can be calculated according to Equations (11)–(13) [42,43]:
HPI = i = 1 n Q i W i i = 1 n W i
Q i = C i I i S i I i × 100
W i = K S i
where n is the number of heavy metal elements determined in this study, Qi is the sub-index of the ith heavy metal element and Wi is the ith unit weight as the reflection of its importance. Among these, Qi is obtained by Equation (12), where Ci and Si are the concentrations of the ith heavy metal in the surface water samples and its corresponding standard limit value for drinking purposes according to the “standards for drinking water quality (GB 5749-2022)” [44], respectively, and Ii is the ideal limit of ith heavy metal, which is routinely set as “0” to simplify in this case. In Equation (13), the proportional constant K is consistently set as “1” for all the metal elements for a convenient calculation, that is, Wi is actually inversely proportional to the standard limit value. The final obtained HPI values can be divided into 3 levels to characterize the degree of heavy metal pollution: low pollution with a value <15, medium pollution with a value between 15 and 30, and high pollution with a value >30 [39].

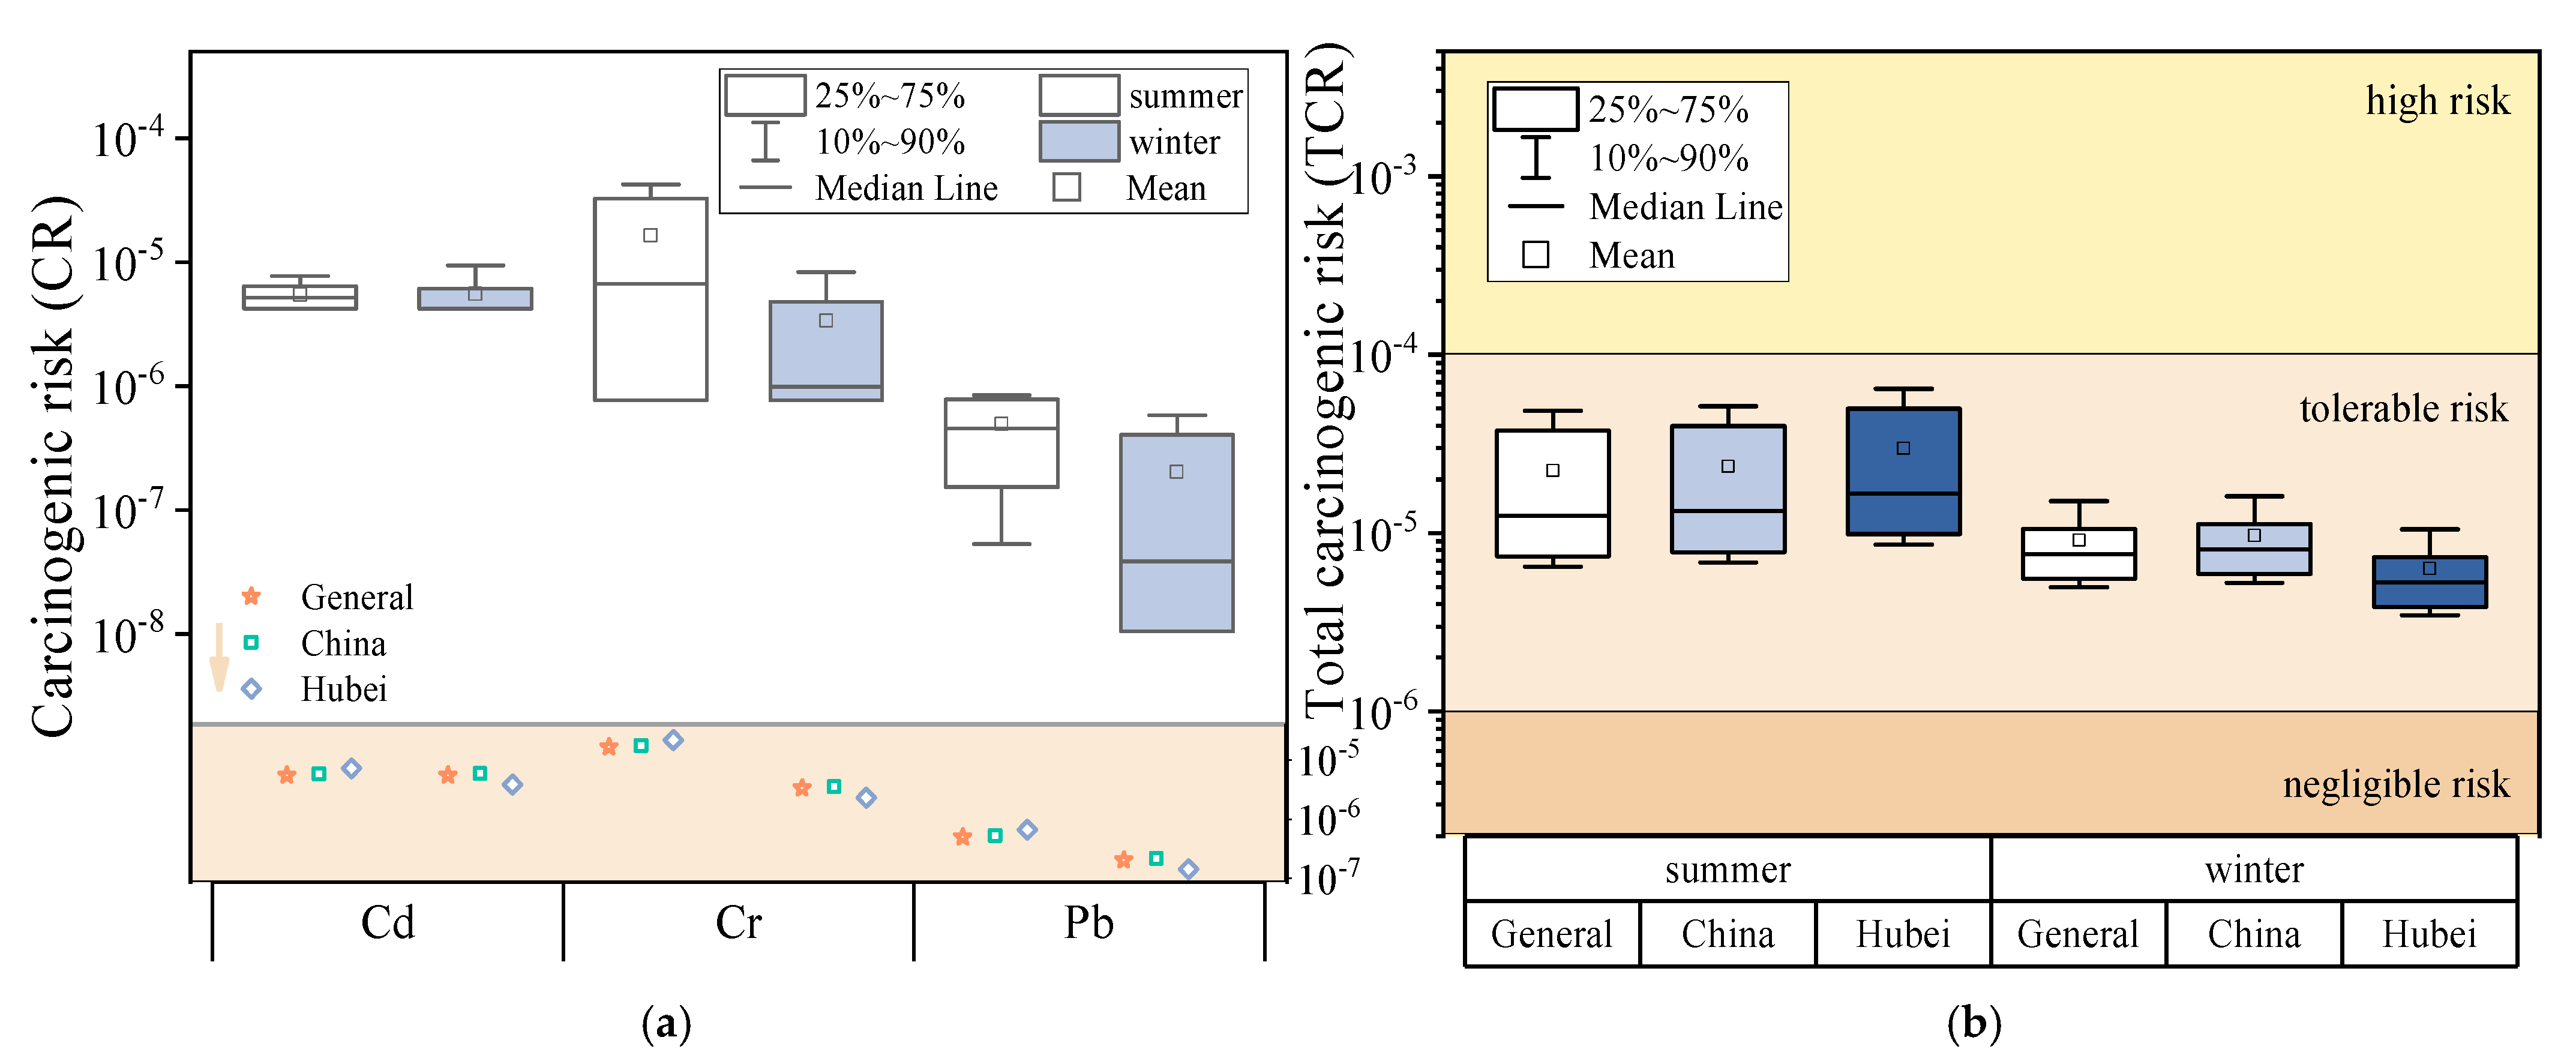
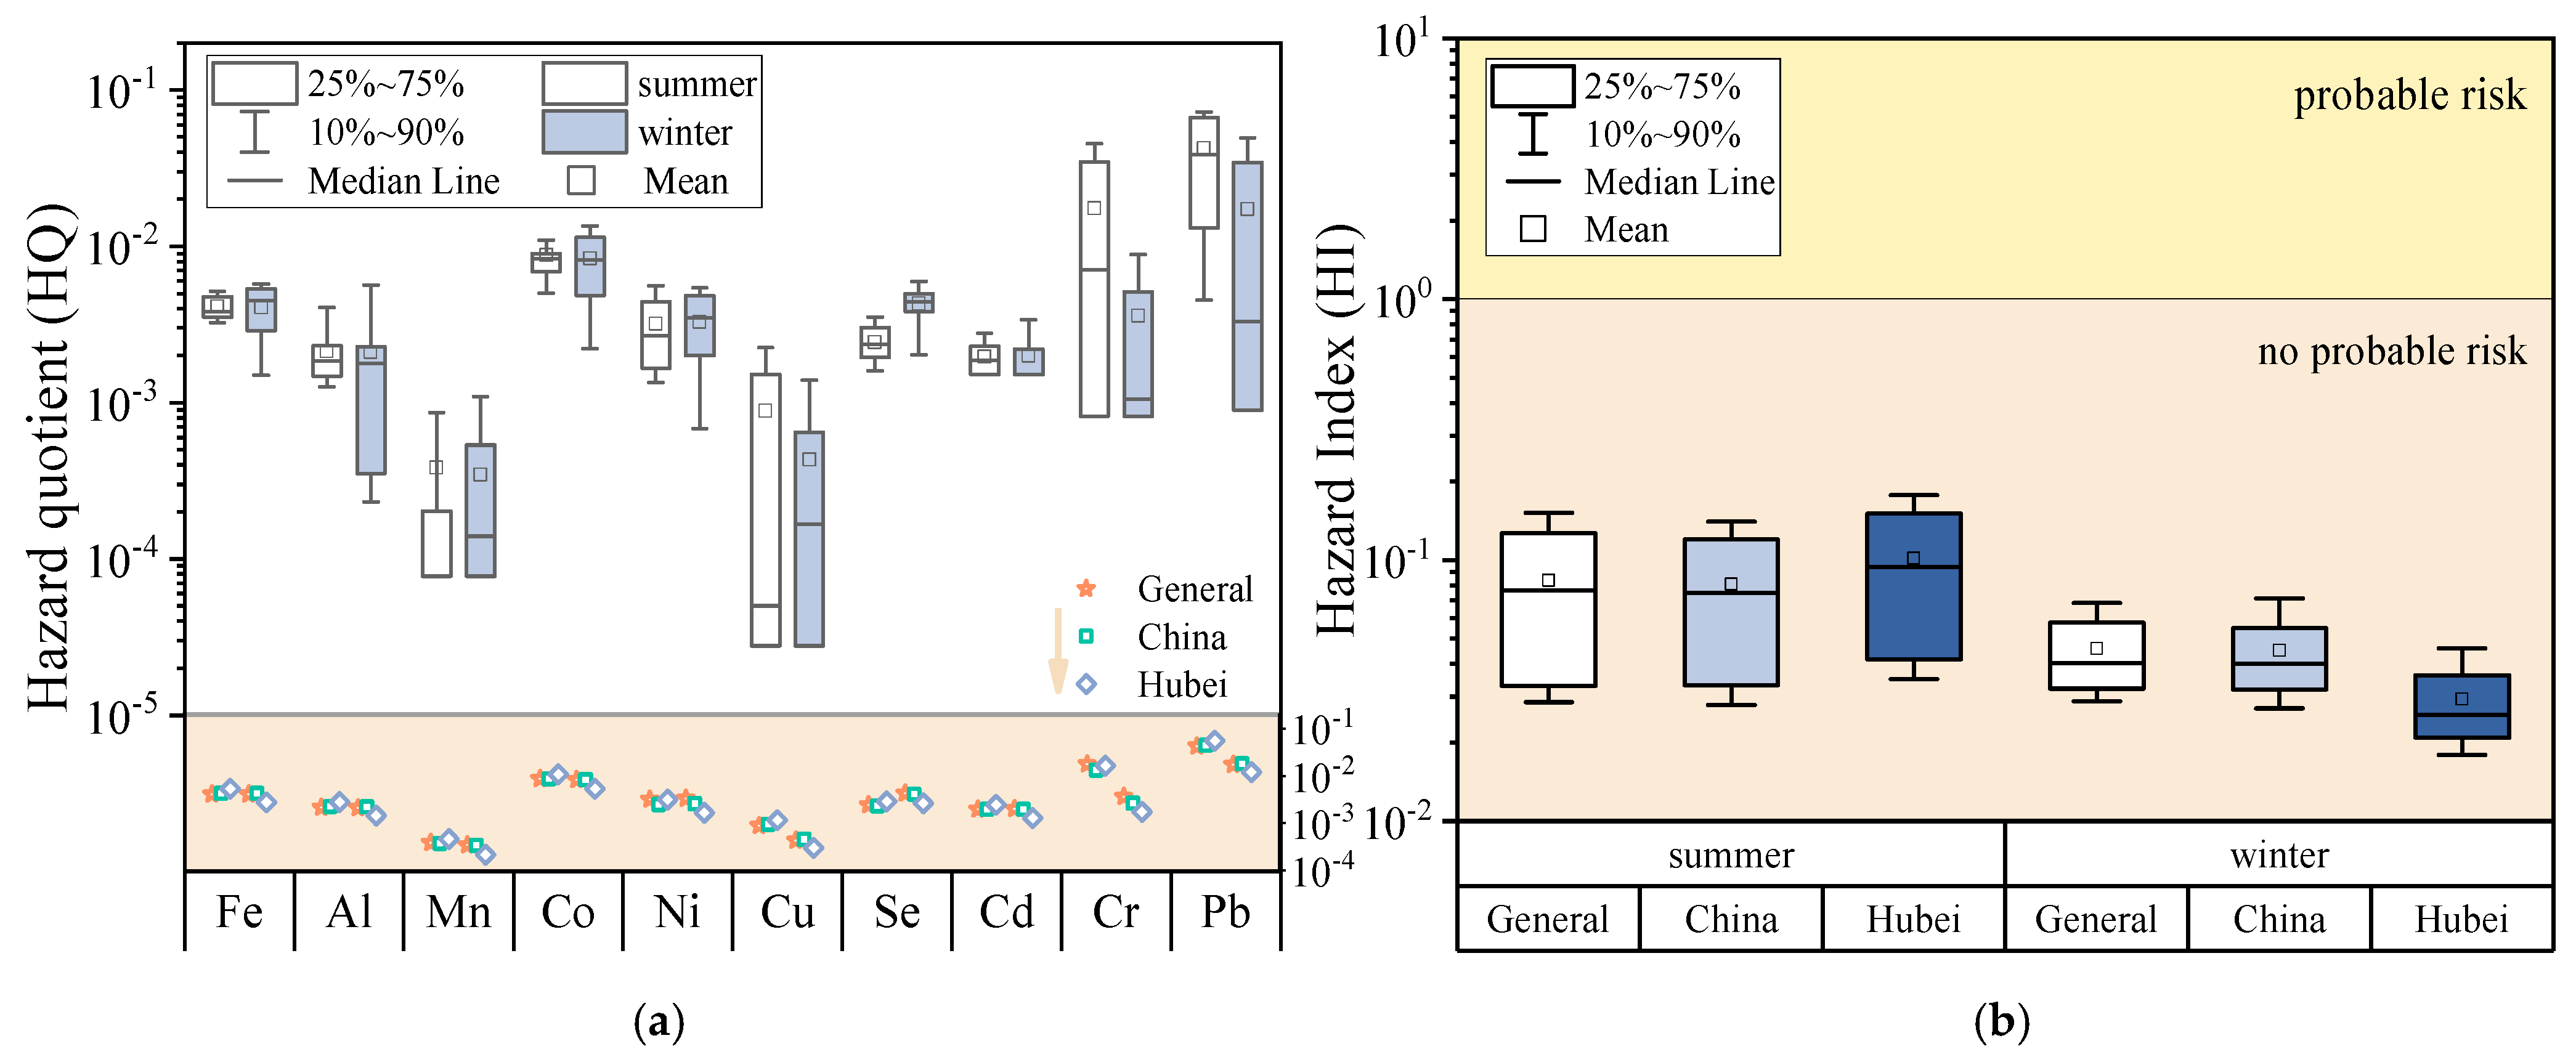
3. Results and Discussion

3.1. Concentrations of Heavy Metals in Surface Water and Tap Water

The statistical results of heavy metal concentrations in surface water and tap water are demonstrated in Table 3 and Table 4, respectively. All the 10 heavy metal elements can be detected in the surface water samples, with Fe and Al concentrations several orders of magnitude higher than other metals, as reported in the previous studies [41,45]. Specifically, Fe and Al concentrations in the Yangtze River were obviously higher than those in the Hanjiang River in both seasons, especially in summer (p = 0.024). About two-thirds of all surface water samples collected in summer and winter had Fe concentrations that exceeded the surface water standard limit for centralized drinking water in “environmental quality standards for surface water (GB 3838-2002)” [46].
For the other eight metal elements, the concentrations of Co and Pb in the Yangtze River in summer were statistically higher, and the concentrations of Cu and Se were lower than those in the Hanjiang River (p < 0.05). In winter, the concentrations of Cd, Cr and Pb in the Yangtze River were obviously higher (p < 0.05). Nevertheless, the concentrations of these eight heavy metal elements in the Yangtze River and the Hanjiang River were significantly lower than the corresponding limit values (GB 3838-2002). Moreover, the concentrations of heavy metals in the surface water displayed great seasonality with overall average concentrations higher in winter than in summer. Such results were commonly reported and might be due to the relatively steady domestic sewage discharge during each season whereas there is a lower river runoff in winter [47,48].
Whether in summer or winter, the concentrations of most heavy metals in tap water were significantly lower (p < 0.01) than those of its corresponding water sources (i.e., the Yangtze River or the Hanjiang River) based on the locations of the sampling points. However, it is of concern that the concentrations of the toxic metals Cd and Pb in tap water increased significantly in summer compared with the water sources (p < 0.01), whether the water was drawn from the Yangtze River or the Hanjiang River. Among the tap water samples collected from residential and non-residential areas, the detection frequency of Fe and Al was 100%, while the remaining metal elements were detected at a relatively lower frequency, with the detection frequency of Mn and Cu being less than 50%. The ranking order of the average concentrations of heavy metals in tap water detected in this study was Fe > Al > Pb > Ni > Cu > Cr > Se > Mn > Co > Cd and Fe > Al > Ni > Pb > Se > Cu > Mn > Cr > Co > Cd in summer and winter, respectively. Similar to the seasonal patterns of metal concentrations in surface water, more than half of metal elements in tap water were found at slightly higher concentration levels in winter than in summer, but the discrepancy between the two seasons was not as significant, reflecting the effective function of water treatment technology in waterworks. Except for Co, Ni, Cr and Pb in summer, all metal elements showed no statistical difference between residential and non-residential areas. When compared with the drinking water guidelines by the WHO and Chinese national standards (GB 5749-2022), the heavy metal concentrations in almost all tap water samples were below the corresponding limits, with only four winter samples containing higher concentrations of Al.
Table 3. Concentrations of heavy metals in surface water sources in Wuhan (μg/L).
MetalsSummerWinterChinese National Standard Limits [46]
Surface Water Environmental Quality Surface Drinking Water Sources
Yangtze RiverHanjiang RiverYangtze RiverHanjiang RiverIIIIIIIVV
Fe304.10 ± 42.93146.13 ± 42.651014.87 ± 271.94832.12 ± 93.19 300
Al364.70 ± 117.1765.82 ± 47.481417.82 ± 669.92788.10 ± 144.65
Mn5.01 ± 1.332.83 ± 1.4426.67 ± 5.2437.83 ± 9.95 100
Co0.19 ± 0.020.14 ± 0.020.67 ± 0.180.66 ± 0.34 1000
Ni1.95 ± 0.202.16 ± 0.324.74 ± 0.975.00 ± 0.23 20
Cu1.92 ± 0.152.27 ± 0.113.68 ± 0.583.10 ± 0.13101000100010001000
Se0.30 ± 0.080.56 ± 0.050.78 ± 0.170.88 ± 0.061010102020
Cd0.02 ± 0.010.02 ± 0.010.05 ± 0.020.02 ± 0.01155510
Cr3.37 ± 0.293.46 ± 0.501.38 ± 0.390.77 ± 0.2610505050100
Pb0.21 ± 0.120.04 ± 0.011.48 ± 0.370.70 ± 0.2510105050100
Table 4. Concentrations of heavy metals in tap water in Wuhan (μg/L).
MetalsSummerWinterDetection Frequency (%)WHO Limits
[49]
Chinese National Standard Limits
[44]
RangeResidential
43 Samples
Non-Residential
54 Samples
Total
97 Samples
RangeResidential
26 Samples
Non-Residential
35 Samples
Total
61 Samples
MeanSDMeanSDMeanSDMeanSDMeanSDMeanSD
Fe64.58–159.61102.7218.699.9417.96101.1718.323.18–175.97101.4837.87113.8033.23108.5535.8100.00 300
Al22.77–176.9976.2536.364.2428.4369.5632.714.18–296.7474.9674.2066.3348.4570.0160.93100.00 200
Mnn.d.–3.260.30.610.240.510.270.56n.d.–2.350.270.290.300.460.290.3936.08 100
Con.d.–0.450.090.050.080.060.110.04n.d.–0.230.080.050.090.050.090.0597.47 50
Ni0.39–10.891.531.011.221.481.361.3n.d.–2.951.580.841.620.751.60.7998.107020
Cun.d.–10.021.272.140.8921.042.08n.d.–2.990.620.840.210.270.390.6249.3720001000
Sen.d.–0.680.380.110.380.110.380.11n.d.–1.010.670.190.670.190.670.1994.944010
Cdn.d.–0.100.030.010.030.010.030.01n.d.–0.330.030.010.040.050.040.0451.2735
Crn.d.–6.651.181.520.270.330.681.14n.d.–1.280.240.290.160.130.20.2255.065050
Pbn.d.–8.102.121.771.291.151.661.52n.d.–6.090.871.060.811.270.841.1973.421010
Note: n.d. denotes that the metal element measurements were below the detection limits.
The tap water supplies in Wuhan are mainly from the Yangtze River and the Hanjiang River, which are distributed according to the location and pipeline laying. The distribution pattern of metal elements in tap water originated from the Yangtze River and the Hanjiang River in summer and winter was investigated using PCA. The values of KMO (0.63) and Bartlett’s sphericity test (p < 0.01) indicated that PCA was effective for the dimensionality reduction. As was shown in Figure 2a, the accumulated variance of the first (PC1) and second (PC2) principal components accounted for 52.1% of the total variance, where PC1 was dominated by the loadings from Fe, Al, Ni and Co, and PC2 was dominated by the loadings from Pb and Cr. The score plots of tap water originated from the Yangtze River and the Hanjiang River were similar in each season, revealing an insignificant effect of water sources on the tap water characteristics, which was related to the performance of the water purification effect in waterworks. Though parts of the samples collected in winter had lower scores on PC2 and several samples collected in summer had higher scores on PC2, as a whole, the plots for these two seasons were scattered in a similar range. Further, Spearman correlation analysis and HCA were conducted to analyze the correlations among the 10 metal elements and the results are shown in Figure 2b,c. Positive correlations with a ρ value higher than 0.6 were found between Fe-Al (ρ = 0.69), Fe-Co (ρ = 0.81), Fe-Ni (ρ = 0.69), Al-Co (ρ = 0.66) and Co-Ni (ρ = 0.82). Three groups were generated from HCA, indicating similar results to PCA, where group I included Fe, Al, Se, Ni and Co, revealing their potential common sources and mutual dependence during water intake from sources, pretreatment and transportation.

3.2. Health Risk Assessment on Human Health

The comprehensive analysis combining the exposure pathways, dose and duration could reflect the total potential human health risks from various heavy metals. The health risks of tap water were therefore evaluated to quantify its suitability in terms of the daily consumption using TCR and HI in this study. It is generally considered that tap water in residential areas is most closely associated with human daily consumption, since the exposure to tap water in non-residential areas is relatively less frequent. For this reason, only the samples collected from residential areas were used to conduct the health risk assessment. The results for both TCR and HI based on the general, China and Hubei values of the exposure parameters were shown in Figure 3 and Figure 4, as well as the individual risk for each metal element.
As we can see from Figure 3a, the obtained CR for the toxic metals (Cd, Cr and Pb) calculated by the general values of the exposure parameters were all lower than the level of 10−4 in both seasons, and the CR for Pb was even lower than the level of 10−6. Such low CR values indicated that the carcinogenic risk of the tap water in residential areas caused by Pb is negligible, and the carcinogenic risks from Cd and Cr were acceptable, although some still existed. In this case, the average values of the obtained TCR were 2.24 × 10⁻⁵ and 9.11 × 10⁻⁶ in summer and winter, respectively. When the values of the China-oriented exposure parameters were used instead for the calculation, the obtained TCR values were slightly magnified to 2.37 × 10⁻⁵ in summer and 9.67 × 10⁻⁶ in winter as shown in Figure 3b. Though the values of the exposure parameters from daily oral intake (IRDW) and dermal intake (SA and BT) in China were lower than the general values, the average body weight (BW) was also at a lower level, leading to an increase in TCR outcomes. Further replacing the exposure parameters with local values in Hubei Province, an even higher TCR result can be obtained for the tap water in summer (2.98 × 10⁻⁵), while this was much lower in winter (6.32 × 10⁻⁶), depending on the disparity in water intake and bathing time during these two seasons. Despite this, the obtained TCR values were assessed within the non-negligible risk range.
Some metal elements, such as Fe, Mn and Ni, are essential to maintain the normal metabolism of the human body. However, long-term exposure to high concentrations of these metals will also pose a negative effect to human health. For example, excessive Fe can cause hemochromatosis, excessive Ni can cause allergy and hand eczema, and excessive Mn can cause neurotoxicity [50,51]. In the meantime, the toxic metals mentioned above also have such risks besides carcinogenicity. Therefore, calculating the HQ values of all these metals to reveal the non-carcinogenic risk is necessary and important. As can be seen from Figure 4a,b, the obtained HQ values based on different exposure parameters for all of the determined metal elements were much lower than one in either summer or winter, and even HI, which is the sum of the HQs of all the 10 metals, was also lower than one. This result means that the non-carcinogenic risk of tap water in Wuhan is currently kept at a very low level. The value of HI in summer (8.38 × 10⁻²) was higher than that in winter (4.58 × 10⁻²) based on the general values of the exposure parameters, which was mainly caused by the higher amount of Pb in summer. When the general values were replaced with the values of China-oriented parameters, the obtained HI values decreased slightly in both winter and summer. Similarly, replacing the exposure parameters to the local values in Hubei Province, the obtained HI values increased in summer (1.02 × 10⁻¹) and decreased in winter (2.95 × 10⁻²).
As discussed above, both the water quality and exposure parameters influenced the health risk assessment of tap water. Such risks therefore varied among different regions and were also related to differences in living habits and physical conditions. Even under similar exposure conditions, people with lighter weight and more water intake were more easily threatened at the same metal concentrations. In a survey of drinking water in Bihair, India, nearly 28% of the water samples collected in summer exceeded the corresponding limit of Mn (400 μg/L), resulting in the non-carcinogenic risk reaching 1.5 with serious health risks [52]. Heavy Pb contamination has been reported to make the HQ value reach 1.96 in Ilam, Iran, nearly twice the safety standard limit [37]. Lu et al. [14] assessed the tap water in Shenzhen, China, and the result showed that the CRs of Cd and Cr were 2.1 × 10⁻⁸ and 2.5 × 10⁻⁷, respectively, both lower than our study. Overall, the tap water in Wuhan is currently in a relatively safe state and will not cause acute hazards or chronic diseases in the short term, but the long-term cancer risk is still noteworthy. In addition, it should also be noted that the health risk assessment was calculated without taking into account the forms and valence states associated with the direct toxicity of the metals, and the actual health risk may still be biased to some extent.

3.3. Potential Contamination of Heavy Metals from Water Supply Pipelines

Conventionally, the accumulation of heavy metals in tap water can be attributed to the atmospheric deposition, wastewater discharge, or even seepage of external groundwater into the water supply system [53,54]. In addition, significant levels of contaminants may also be extracted from materials in water supply pipelines due to water bodies coming into contact with them. Previous studies have reported that materials used in water distribution systems (Pb, Cu and other metals, etc.) can lead to a deterioration of the water quality, emphasizing the significant increase in the relative contribution of Pb exposure from drinking water when water was consumed after stagnation [55]. However, the occurrence of such pollution processes, the extent of its contribution and the relevant data are actually difficult to ascertain and need to be investigated.
The heavy metal concentrations in tap water measured in this study were much lower than the standard limits, and even close to the detection limit values of the mass spectrometer except for Fe and Al. As mentioned above, the water quality of water sources, the treatment technology at the waterworks and the maintenance of the pipelines are all crucial to guarantee the security of tap water. The obtained HPI of the Yangtze River and the Hanjiang River in summer were 4.92 ± 0.52 and 3.34 ± 0.32, respectively, both of which were much lower than the pollution limits of 15, revealing a very low pollution level of the water sources in this season. Meanwhile, such HPI values were 17.05 ± 5.23 and 12.26 ± 1.36 for the Yangtze River and the Hanjiang River in winter, reflecting a slightly polluted state and potential environmental risks of heavy metals. Even so, the overall water quality assessment of urban water sources in the study area has been quite satisfactory, compared to many cities around the world [42,56].
Nevertheless, according to the data reported by the waterworks in Wuhan, the contents of heavy metals in the finished water are at very low concentration levels before entering the water transmission network (Table 5), which are mostly lower than the amount detected in tap water collected from the faucet outlet. This means that the minor contamination we detected at the water supply terminal may come from the water transmission network, i.e., the pipelines. The relatively high Fe concentrations in tap water can be caused by the high contamination from the pipe dissolution. Kavacr et al. [57] indicated that the corrosion of pipelines was one of the important sources of heavy metals in tap water. The higher concentrations of Ni, Cd and Pb in tap water relative to the finished water of waterworks can also be explained through this perspective. That is to say, in order to ensure the urban domestic water safety, it is of importance to maintain and update the pipes of the water supply network, especially for the old residential areas.

4. Conclusions

This study evaluated the quality of tap water and surface water (the Yangtze River and the Hanjiang River) in Wuhan based on the concentrations of heavy metals (Fe, Al, Mn, Co, Ni, Cu, Se, Cd, Cr and Pb) during the summer (June) and winter (December) of 2022, and conducted a health risk assessment on human health. Among all the tap water samples, the detection frequency of Fe and Al was 100%, while the remaining metal elements were detected at a relatively lower frequency, with the detection frequency of Mn and Cu less than 50%. Almost all of the tap water samples contained metal concentrations below the Chinese national standard limits for drinking water (GB 5749-2022), except for a very small number of winter samples with excessive Al concentrations. Statistical analysis revealed the correlations among different heavy metals in tap water, such as Fe, Al, Se, Ni and Co. The obtained TCR based on the general values of the exposure parameters for the residential areas were 2.24 × 10⁻⁵ and 9.11 × 10⁻⁶ in summer and winter, respectively, and the obtained HI were 8.38 × 10⁻² and 4.58 × 10⁻² in summer and winter, respectively. The results of health risk assessment indicated that the tap water in residential areas in Wuhan is currently in a relatively safe state and will not cause acute hazards or chronic diseases in the short term, but the long-term cancer risk is still noteworthy. The obtained HPI showed that the overall water quality of urban drinking water sources is satisfactory, despite its slightly polluted state and the potential environmental risks of heavy metals in winter. According to the heavy metal concentration data of finished water reported by waterworks and tap water outlets, pipeline corrosion was considered as one of the important sources of heavy metals in Wuhan tap water, which can explain, to a certain extent, the increase in the heavy metal concentrations, such as Fe, Ni, Cd and Pb.

Author Contributions

Conceptualization, S.T. and J.X.; methodology, J.X.; software, Z.L.; validation, Z.L. and Z.S.; formal analysis, Z.L., Z.S. and Y.C.; investigation, Z.L., S.T., Z.S. and Y.C.; resources, J.X.; writing—original draft preparation, Z.L.; writing—review and editing, S.T. and J.X.; visualization, Z.L. and S.T.; supervision, S.T. and J.X.; project administration, S.T. and J.X.; funding acquisition, S.T. and J.X. All authors have read and agreed to the published version of the manuscript.

Funding

This work was financially supported by the Strategic Priority Research Program of the Chinese Academy of Sciences (No. XDA23040302), Hubei Provincial Natural Science Foundation of China (No. 2023AFB154), and the National Natural Science Foundation of China (No. 41890823).

Data Availability Statement

The data that support the findings of this study are available from the authors upon reasonable request.

Acknowledgments

Comments from the anonymous reviewers are appreciated. We also thank the volunteers who helped us to collect samples.

Conflicts of Interest

The authors declare no conflict of interest.

References

  1. Bichai, F.; Smeets, P.W.M.H. Using QMRA-based regulation as a water quality management tool in the water security challenge: Experience from the netherlands and australia. Water Res. 2013, 47, 7315–7326. [Google Scholar] [CrossRef] [PubMed]
  2. Puchol-Salort, P.; Boskovic, S.; Dobson, B.; van Reeuwijk, M.; Mijic, A. Water neutrality framework for systemic design of new urban developments. Water Res. 2022, 219, 118583. [Google Scholar] [CrossRef] [PubMed]
  3. Hossain, S.; Anik, A.H.; Khan, R.; Ahmed, F.T.; Siddique, M.A.B.; Khan, A.H.A.N.; Saha, N.; Idris, A.M.; Alam, M. Public Health Vulnerability Due to the Exposure of Dissolved Metal(oid)s in Tap Water from a Mega City (Dhaka, Bangladesh): Source and Quality Appraisals. Expo. Health 2022, 14, 713–732. [Google Scholar] [CrossRef]
  4. Wang, L.; Li, J.; Zheng, J.; Liang, J.; Li, R.; Gong, Z. Source tracing and health risk assessment of phthalate esters in household tap-water: A case study of the urban area of Quanzhou, Southeast China. Ecotoxicol. Environ. Saf. 2022, 248, 114277. [Google Scholar] [CrossRef] [PubMed]
  5. Dinelli, E.; Lima, A.; Albanese, S.; Birke, M.; Cicchella, D.; Giaccio, L.; Valera, P.; De Vivo, B. Major and trace elements in tap water from Italy. J. Geochemical Explor. 2012, 112, 54–75. [Google Scholar] [CrossRef]
  6. Fernández-Navarro, P.; Villanueva, C.M.; García-Pérez, J.; Boldo, E.; Goñi-Irigoyen, F.; Ulibarrena, E.; Rantakokko, P.; García-Esquinas, E.; Pérez-Gómez, B.; Pollán, M.; et al. Chemical quality of tap water in Madrid: Multicase control cancer study in Spain (MCC-Spain). Environ. Sci. Pollut. Res. 2017, 24, 4755–4764. [Google Scholar] [CrossRef]
  7. Wang, G.; Shen, J.; Wei, S.; Cai, D.; Liu, J. Identification of Heavy Metals and Organic Micropollutants in Drinking Water Sources in Typical Villages and Towns in Northeast China. Molecules 2022, 27, 8033. [Google Scholar] [CrossRef]
  8. Zhao, L.; Gong, D.; Zhao, W.; Lin, L.; Yang, W.; Guo, W.; Tang, X.; Li, Q. Spatial-temporal distribution characteristics and health risk assessment of heavy metals in surface water of the Three Gorges Reservoir, China. Sci. Total Environ. 2020, 704, 134883. [Google Scholar] [CrossRef]
  9. Li, M.S.; Luo, Y.P.; Su, Z.Y. Heavy metal concentrations in soils and plant accumulation in a restored manganese mineland in Guangxi, South China. Environ. Pollut. 2007, 147, 168–175. [Google Scholar] [CrossRef]
  10. Qian, Y.; Cheng, C.; Feng, H.; Hong, Z.; Zhu, Q.; Kolenčík, M.; Chang, X. Assessment of metal mobility in sediment, commercial fish accumulation and impact on human health risk in a large shallow plateau lake in southwest of China. Ecotoxicol. Environ. Saf. 2020, 194, 110346. [Google Scholar] [CrossRef]
  11. Khan, S.; Shah, I.A.; Muhammad, S.; Malik, R.N.; Shah, M.T. Arsenic and Heavy Metal Concentrations in Drinking Water in Pakistan and Risk Assessment: A Case Study. Hum. Ecol. Risk Assess. 2015, 21, 1020–1031. [Google Scholar] [CrossRef]
  12. Le Bot, B.; Lucas, J.P.; Lacroix, F.; Glorennec, P. Exposure of children to metals via tap water ingestion at home: Contamination and exposure data from a nationwide survey in France. Environ. Int. 2016, 94, 500–507. [Google Scholar] [CrossRef] [PubMed]
  13. Çelebi, A.; Şengörür, B.; Kløve, B. Human health risk assessment of dissolved metals in groundwater and surface waters in the Melen watershed, Turkey. J. Environ. Sci. Health Part A 2014, 49, 153–161. [Google Scholar] [CrossRef] [PubMed]
  14. Lu, S.Y.; Zhang, H.M.; Sojinu, S.O.; Liu, G.H.; Zhang, J.Q.; Ni, H.G. Trace elements contamination and human health risk assessment in drinking water from Shenzhen, China. Environ. Monit. Assess. 2015, 187, 4220. [Google Scholar] [CrossRef]
  15. Ranjbar, Z.; Pourhadadi, D.; Montazeri, S.; Roshanzamir Modaberi, M. Lead compounds in paint and coatings: A review of regulations and latest updates. Prog. Org. Coatings 2023, 174, 107247. [Google Scholar] [CrossRef]
  16. Zhang, L.; Wang, L.; Yin, K.; Lv, Y.; Zhang, D. Environmental-geochemical characteristics of Cu in the soil and water in copper-rich deposit area of southeastern Hubei Province, along the middle Yangtze River, Central China. Environ. Pollut. 2009, 157, 2957–2963. [Google Scholar] [CrossRef]
  17. Tao, S.; Zhang, X.; Xu, J.; Pan, G.; Gu, F. Anthropogenic impacts on isotopic and geochemical characteristics of urban streams: A case study in Wuhan, China. Environ. Sci. Pollut. Res. 2021, 28, 39186–39198. [Google Scholar] [CrossRef]
  18. Ali, M.M.; Rahman, S.; Islam, M.S.; Rakib, M.R.J.; Hossen, S.; Rahman, M.Z.; Kormoker, T.; Idris, A.M.; Phoungthong, K. Distribution of heavy metals in water and sediment of an urban river in a developing country: A probabilistic risk assessment. Int. J. Sediment Res. 2022, 37, 173–187. [Google Scholar] [CrossRef]
  19. Nduka, J.K.; Kelle, H.I.; Umeh, T.C.; Okafor, P.C.; Iloka, G.C.; Okoyomon, E. Ecological and health risk assessment of radionuclides and heavy metals of surface and ground water of Ishiagu–Ezillo quarry sites of Ebonyi, Southeast Nigeria. J. Hazard. Mater. Adv. 2023, 10, 100307. [Google Scholar] [CrossRef]
  20. Selvam, S.; Jesuraja, K.; Roy, P.D.; Venkatramanan, S.; Khan, R.; Shukla, S.; Manimaran, D.; Muthukumar, P. Human health risk assessment of heavy metal and pathogenic contamination in surface water of the Punnakayal estuary, South India. Chemosphere 2022, 298, 134027. [Google Scholar] [CrossRef]
  21. Najafzadeh, M.; Niazmardi, S. A Novel Multiple-Kernel Support Vector Regression Algorithm for Estimation of Water Quality Parameters. Nat. Resour. Res. 2021, 30, 3761–3775. [Google Scholar] [CrossRef]
  22. Najafzadeh, M.; Homaei, F.; Farhadi, H. Reliability assessment of water quality index based on guidelines of national sanitation foundation in natural streams: Integration of remote sensing and data-driven models. Artif. Intell. Rev. 2021, 54, 4619–4651. [Google Scholar] [CrossRef]
  23. Najafzadeh, M.; Basirian, S. Evaluation of River Water Quality Index Using Remote Sensing and Artificial Intelligence Models. Remote Sens. 2023, 15, 2359. [Google Scholar] [CrossRef]
  24. Chowdhury, S.; Mazumder, M.A.J.; Al-Attas, O.; Husain, T. Heavy metals in drinking water: Occurrences, implications, and future needs in developing countries. Sci. Total Environ. 2016, 569–570, 476–488. [Google Scholar] [CrossRef]
  25. Lee, D.; Gibson, J.M.; Brown, J.; Habtewold, J.; Murphy, H.M. Burden of disease from contaminated drinking water in countries with high access to safely managed water: A systematic review. Water Res. 2023, 242, 120244. [Google Scholar] [CrossRef]
  26. Chen, W.; Chen, J. Formation and prevention of pipe scale in water supply pipelines with anti-corrosion lining. Water Supply 2022, 22, 4006–4014. [Google Scholar] [CrossRef]
  27. Sun, H.; Shi, B.; Yang, F.; Wang, D. Effects of sulfate on heavy metal release from iron corrosion scales in drinking water distribution system. Water Res. 2017, 114, 69–77. [Google Scholar] [CrossRef]
  28. Sarin, P.; Snoeyink, V.L.; Bebee, J.; Jim, K.K.; Beckett, M.A.; Kriven, W.M.; Clement, J.A. Iron release from corroded iron pipes in drinking water distribution systems: Effect of dissolved oxygen. Water Res. 2004, 38, 1259–1269. [Google Scholar] [CrossRef]
  29. Yao, M.; Zhang, Y.; Dai, Z.; Ren, A.; Fang, J.; Li, X.; van der Meer, W.; Medema, G.; Rose, J.B.; Liu, G. Building water quality deterioration during water supply restoration after interruption: Influences of premise plumbing configuration. Water Res. 2023, 241, 120149. [Google Scholar] [CrossRef]
  30. Zhang, X.; Wu, Q.; Gao, S.; Wang, Z.; He, S. Distribution, source, water quality and health risk assessment of dissolved heavy metals in major rivers in Wuhan, China. PeerJ 2021, 9, 11853. [Google Scholar] [CrossRef]
  31. Zhang, H.; Liu, Z.; Xu, J.; Yang, J.; Zhang, X.; Tao, S. Characterization of Dissolved Organic Matter of Sediments in Urban Streams Using EEMs–PARAFAC and Absorption Spectroscopy: A Case Study in Wuhan, China. Water 2022, 14, 3181. [Google Scholar] [CrossRef]
  32. Rao, K.; Zhang, X.; Yi, X.J.; Li, Z.S.; Wang, P.; Huang, G.W.; Guo, X.X. Interactive effects of environmental factors on phytoplankton communities and benthic nutrient interactions in a shallow lake and adjoining rivers in China. Sci. Total Environ. 2018, 619–620, 1661–1672. [Google Scholar] [CrossRef] [PubMed]
  33. Zhu, D.; Zhou, X.; Cheng, W. Water effects on urban heat islands in summer using WRF-UCM with gridded urban canopy parameters—A case study of Wuhan. Build. Environ. 2022, 225, 109528. [Google Scholar] [CrossRef]
  34. Tang, Z.; Yang, Z.; Shen, Z.; Niu, J.; Cai, Y. Residues of organochlorine pesticides in water and suspended particulate matter from the Yangtze River catchment of Wuhan, China. Environ. Monit. Assess. 2008, 137, 427–439. [Google Scholar] [CrossRef] [PubMed]
  35. Water Quality—Determination of 65 Elements—Inductively Coupled Plasma-Mass Spectrometry (HJ 700-2014); Ministry of Environmental Protection; China Environmental Press: Beijing, China, 2014.
  36. USEPA. Risk Management Guidance for Superfund Volume I Environmental Evaluation Manual (Part A); USEPA: Washington, DC, USA, 1989. [Google Scholar]
  37. Fakhri, Y.; Saha, N.; Ghanbari, S.; Rasouli, M.; Miri, A.; Avazpour, M.; Rahimizadeh, A.; Riahi, S.M.; Ghaderpoori, M.; Keramati, H.; et al. Carcinogenic and non-carcinogenic health risks of metal(oid)s in tap water from Ilam city, Iran. Food Chem. Toxicol. 2018, 118, 204–211. [Google Scholar] [CrossRef]
  38. Duan, X.; Zhao, X.; Wang, B.; Chen, Y.; Cao, S. Highlights of the Chinese Exposure Factors Handbook (Adults); Science Press: Beijing, China, 2014. [Google Scholar]
  39. Qu, L.; Huang, H.; Xia, F.; Liu, Y.; Dahlgren, R.A.; Zhang, M.; Mei, K. Risk analysis of heavy metal concentration in surface waters across the rural-urban interface of the Wen-Rui Tang River, China. Environ. Pollut. 2018, 237, 639–649. [Google Scholar] [CrossRef]
  40. Rasic Misic, I.D.; Tosic, S.B.; Pavlovic, A.N.; Pecev-Marinkovic, E.T.; Mrmosanin, J.M.; Mitic, S.S.; Stojanovic, G.S. Trace element content in commercial complementary food formulated for infants and toddlers: Health risk assessment. Food Chem. 2022, 378, 132113. [Google Scholar] [CrossRef]
  41. Li, S.; Zhang, Q. Risk assessment and seasonal variations of dissolved trace elements and heavy metals in the Upper Han River, China. J. Hazard. Mater. 2010, 181, 1051–1058. [Google Scholar] [CrossRef]
  42. Tiwari, A.K.; De Maio, M.; Singh, P.K.; Mahato, M.K. Evaluation of Surface Water Quality by Using GIS and a Heavy Metal Pollution Index (HPI) Model in a Coal Mining Area, India. Bull. Environ. Contam. Toxicol. 2015, 95, 304–310. [Google Scholar] [CrossRef]
  43. Roșca, O.M.; Dippong, T.; Marian, M.; Mihali, C.; Mihalescu, L.; Hoaghia, M.-A.; Jelea, M. Impact of anthropogenic activities on water quality parameters of glacial lakes from Rodnei mountains, Romania. Environ. Res. 2020, 182, 109136. [Google Scholar] [CrossRef]
  44. GB 5749—2022; Standards for Drinking Water Quality. State Administration for Market Regulation; Standards Press of China: Beijing, China, 2022.
  45. Zhang, Y.; Zhang, M.; Yu, W.; Li, J.; Kong, D. Ecotoxicological risk ranking of 19 metals in the lower Yangtze River of China based on their threats to aquatic wildlife. Sci. Total Environ. 2022, 812, 152370. [Google Scholar] [CrossRef] [PubMed]
  46. GB 3838-2002; Environmental Quality Standards for Surface Water. State Environmental Protection Administration of China; Standards Press of China: Beijing, China, 2002.
  47. Islam, M.S.; Ahmed, M.K.; Raknuzzaman, M.; Habibullah -Al- Mamun, M.; Islam, M.K. Heavy metal pollution in surface water and sediment: A preliminary assessment of an urban river in a developing country. Ecol. Indic. 2015, 48, 282–291. [Google Scholar] [CrossRef]
  48. Liu, N.; Ni, T.; Xia, J.; Dai, M.; He, C.; Lu, G. Non-carcinogenic risks induced by metals in drinking source water of Jiangsu Province, China. Environ. Monit. Assess. 2011, 177, 449–456. [Google Scholar] [CrossRef]
  49. Guidelines for Drinking Water Quality, 4th ed.; World Health Organization: Geneva, Switzerland, 2011.
  50. Khan, S.; Shahnaz, M.; Jehan, N.; Rehman, S.; Shah, M.T.; Din, I. Drinking water quality and human health risk in Charsadda district, Pakistan. J. Clean. Prod. 2013, 60, 93–101. [Google Scholar] [CrossRef]
  51. Ong, C.; Ibrahim, S.; Sen Gupta, B. A survey of tap water quality in Kuala Lumpur. Urban Water J. 2007, 4, 29–41. [Google Scholar] [CrossRef]
  52. Kumar, M.; Rahman, M.M.; Ramanathan, A.L.; Naidu, R. Arsenic and other elements in drinking water and dietary components from the middle Gangetic plain of Bihar, India: Health risk index. Sci. Total Environ. 2016, 539, 125–134. [Google Scholar] [CrossRef]
  53. He, L.; Wang, S.; Liu, M.; Chen, Z.; Xu, J.; Dong, Y. Transport and transformation of atmospheric metals in ecosystems: A review. J. Hazard. Mater. Adv. 2023, 9, 100218. [Google Scholar] [CrossRef]
  54. Kumar, A.; Kumar, V.; Pandita, S.; Singh, S.; Bhardwaj, R.; Varol, M.; Rodrigo-Comino, J. A global meta-analysis of toxic metals in continental surface water bodies. J. Environ. Chem. Eng. 2023, 11, 109964. [Google Scholar] [CrossRef]
  55. Van Dijk-Looijaard, A.M.; Van Genderen, J. Levels of exposure from drinking water. Food Chem. Toxicol. 2000, 38, 37–42. [Google Scholar] [CrossRef]
  56. Hasan, M.M.; Ahmed, M.S.; Adnan, R.; Shafiquzzaman, M. Water quality indices to assess the spatiotemporal variations of Dhaleshwari river in central Bangladesh. Environ. Sustain. Indic. 2020, 8, 100068. [Google Scholar] [CrossRef]
  57. Kavcar, P.; Sofuoglu, A.; Sofuoglu, S.C. A health risk assessment for exposure to trace metals via drinking water ingestion pathway. Int. J. Hyg. Environ. Health 2009, 212, 216–227. [Google Scholar] [CrossRef] [PubMed]
Figure 1. Locations of the study area and sampling points for tap water and surface water in (a) summer and (b) winter.
Water 15 03709 g001
Figure 2. Results of (a) principal component analysis, (b) Spearman correlation analysis, and (c) hierarchical cluster analysis among heavy metals in tap water in Wuhan.
Water 15 03709 g002
Figure 3. (a) Carcinogenic risk of Cd, Cr and Pb and (b) total carcinogenic risk in tap water from residential areas in Wuhan. Note: only the box diagram based on the general values of the exposure parameters is shown for better visualization of CR in (a), and the average values of CR based on different exposure parameters are shown for each metal element.
Water 15 03709 g003
Figure 4. (a) Hazard quotient and (b) hazard index of heavy metals in tap water from residential areas in Wuhan. Note: only the box diagram based on the general values of the exposure parameters is shown for a better visualization of HQ in (a), and the average values of HQ based on different exposure parameters are shown for each metal element.
Water 15 03709 g004
Table 1. The values of exposure parameters [36,38].
ParametersGeneralChinaHubei Province
SummerWinter
IRDW (L/d)21.852.31.2
EF (d/a)350350350350
ED (a)70707070
BW (kg)7060.660.160.1
EAT (d)25,55025,55025,55025,550
SA (m2)1.81.61.61.6
BT (h/d)0.580.120.170.08
Note: IRDW, EF, ED, BW, EAT, SA and BT refer to the intake rate of drinking water, exposure frequency, exposure duration, body weight, exposure average time, skin surface area and daily bathing time, respectively.
Table 5. Concentrations of heavy metals in the finished water of waterworks in Wuhan (μg/L).
WaterworksFeAlMnCoNiCuSeCdCrPb
W114850.6 0.40.9 <0.1<4<0.1
W217904.1 0.61.4 <0.1<4<0.1
W3<5094<100 2<100 <1<4<5
W4<5088<100 0.4<100 <1<1<5
W5131311.1 0.81.4 <0.1<4<0.1
W6541192.4 0.40.8 <0.1<4<0.1
W711950.2 0.40.9 <0.1<4<0.1
W812990.5 0.40.9 <0.1<4<0.1
W91259<0.1 0.60.6 <0.1<4<0.1
W1012940.4 0.60.8 <0.1<4<0.1
W11161120.7 0.31 <0.1<4<0.1
W12131044.9 0.71.2 <0.1<4<0.1
W13111030.2 1.50.8 <0.1<4<0.1
Note: W1–W13 represent 13 waterworks distributed in Wuhan, and data are obtained from https://www.whwater.com accessed on 19 July 2023.
Disclaimer/Publisher’s Note: The statements, opinions and data contained in all publications are solely those of the individual author(s) and contributor(s) and not of MDPI and/or the editor(s). MDPI and/or the editor(s) disclaim responsibility for any injury to people or property resulting from any ideas, methods, instructions or products referred to in the content.

