Article

Numerical Modeling and Simulation of Fractured-Vuggy Reservoirs Based on Field Outcrops

1
School of Environmental Science and Engineering, Southern University of Science and Technology, Shenzhen 518055, China
2
National Center for Applied Mathematics Shenzhen (NCAMS), Southern University of Science and Technology, Shenzhen 518055, China
3
Petroleum Exploration & Production Research Institute, SINOPEC, Beijing 100083, China
*
Author to whom correspondence should be addressed.
Water 2023, 15(20), 3687; https://doi.org/10.3390/w15203687
Submission received: 22 September 2023 / Revised: 19 October 2023 / Accepted: 20 October 2023 / Published: 21 October 2023
(This article belongs to the Special Issue Fluid Dynamics Modeling in Porous Media)

Abstract

:
We propose a novel workflow to investigate the complex flow behaviors and remaining oil distribution related to the oil–gas–water three-phase system based on information from typical outcrops of fractured-vuggy reservoirs. A refined geological model is built to represent the size, geometry, and spatial distribution of the karst caves and fractures extracted from the field outcrop photographs. The combination of the perpendicular bisector (PEBI) grid technique and the control-volume finite difference method is adopted for space discretization. We have validated the numerical model against experimental data. Numerical simulations were performed to explore the impacts of the permeability of karst cave and natural fractures and the position of natural water bodies upon oil production performance. Numerical results indicate that (1) the cave permeability has few impacts on the oil production, yet the fracture permeability plays a significant role in determining the oil recovery; (2) a higher permeability of the fractures will lead to a longer period of time for no-water oil production and, thus, a higher oil recovery; (3) the position of natural water body shows significant impacts on oil recovery, e.g., a short distance between the natural water body and the production well tends to form preferential passages, causing severe reduction of water flooding range; and (4) the distribution of remaining oil is controlled by spatial patterns of the fractured-vuggy system and reservoir development schemes. We found that the remaining oil is mainly distributed along the model boundaries and at the corner of the caves with single or multiple connection/s to fractures.

1. Introduction

Carbonate reservoirs account for approximately 70% of global oil and gas reserves, of which 2/3 are fractured-vuggy reservoirs [1]. It is estimated that the proved oil and gas reserves from carbonate reservoirs were approximately 2.93 Gt and 3.37 ×   10 3 billion cubic meters [2]. Therefore, the development of fractured-vuggy carbonate reservoirs has received attention worldwide. Since the 1960s, many efforts have been made in characterizing the complex fluid flow processes in fractured-vuggy reservoirs [3]. It was, however, not until the 1970s that China began research on fractured and vuggy reservoirs [4]. The discovery of the Tahe Oilfield stimulated Chinese scholars and experts to conduct systematic research on fractured-vuggy reservoirs, covering various aspects, such as reserve estimation, connectivity calculation, laboratory experiments, and numerical simulations. The technique of X-ray-computed tomography enables engineers to reconstruct and classify the fractured-vuggy formations at the lab scale [5], while at the field scale, the tracer monitoring would facilitate the detection of inter-well connectivity. In particular, numerical models play a central role in understanding complicated flow behaviors at various scales associated with fractured-vuggy reservoirs [6,7]. However, the development mechanisms of fractured-vuggy reservoirs are not yet fully understood. The major challenge stems from the complexity of the porous media of the fractured-vuggy reservoir itself. A vast variety of fractures (cemented or uncemented) and caves (filled or unfilled), ranging from micrometers to several hundred meters, exist in the reservoir rock, which introduces high heterogeneity and anisotropy into the system and, thus, impede the characterization, modeling, and simulation of the porous rock (cf. Figure 1). As a result, researchers can hardly fully comprehend the fluid flow behaviors and the petroleum engineers are incapable of coming up with a proper development scheme to minimize the remaining oil.
To unveil the development mechanisms of fractured-vuggy reservoirs, many scholars analytically/numerically and experimentally investigate the impact of the coexistence of fractures and caves on oil recovery based on synthetic distributions of fractures and caves. Pioneering work in the field was performed by Neale and Nader [8], where they investigated how the caves influence the permeability of the porous media. Guo et al. [1] used 3D printing technology to experimentally study the production improvement effect during water flooding. Their results suggest that the oil–water gravity differentiation plays a significant role in changing the remaining oil distribution. To investigate the characteristics of oil–water flow, the oil–water interface, and residual oil distribution, Liu et al. [9] carried out flooding experiments in a two-dimensional visual model. They argued that the remaining oil in fractured-vuggy reservoirs tends to reside in the tops of the structures and peripheral areas with poor connectivity. Other experiment analysis related to fractured-vuggy reservoirs focuses on water/nitrogen-flooding efficiency [10], oil-trapping mechanisms [11,12], the potential of fracturing treatments [13], multiphase flow through 3D-printed analogs [14,15], etc. Because of boundary effects and difficulties in strictly adhering to similarity criteria, experimental results are significantly affected by the dimension of the tested samples and, to some extent, represent real field sale cases.
Analytical and numerical approaches prevail in the petroleum industry [16], mining engineering [17,18], and geothermal engineering [19,20] due to their merits of simplicity, time-saving, and repeatability. Based on CT-scanning images, Fadlelmula et al. [21] employed a multi-point geostatistical modeling technique to generate multiple fractured-vuggy realizations, which can be used for reservoir modeling prior to multi-phase fluid flow simulations. Lei et al. [22] proposed a novel analytical model to explore the flow characteristics in acidized fractured-vuggy reservoirs, suggesting six flow stages (i.e., wellbore storage stage, radial flow stage, fractured-vuggy inter-porosity flow stage, transition flow stage, fracture-matrix inter-porosity flow stage, and external boundary response stage). Limited by the scale issue, the combination of the CT-scanning method and multi-point geostatistics modeling is unable to deal with the case, containing a large-scale cave with tens of meters or larger. Analytical methods work well only when assuming a quite simple geometry of the studied domain and the fracture-cave system. A three-dimensional hydromechanical model was established to investigate how the karst fractured-vuggy reservoirs evolve under natural conditions [23]. A triple-/multiple-continuum model was utilized to investigate single-/multi-phase flow and displacement in fractured-vuggy reservoirs [6,24,25]. A multiscale modeling framework was recently proposed to simulate fluid flow through fractured vuggy porous media [26,27]. Guo et al. [28] employed a dual permeability model to model horizontal well production and found that there exist seven flow regimes with a constant rate and five flow regimes with constant wellbore pressure.
Nevertheless, previous studies attach limited importance to integrating field outcrops of fractured-vuggy reservoirs with experimental and numerical analyses. Most experimental studies adopted simple, synthetic fracture-cave geometries due to limited knowledge regarding invisible subsurface formations. Additionally, experimental studies tend to be expensive, time-consuming, and of poor repeatability. Field outcrops contain sufficient information for reservoir modeling, although some unknown reconstruction activities (e.g., weathering processes, dissolution process, and/or tectonic movements) may alter the shape and geometry of the fractures and caves to some extent. We argue that it still constitutes a viable means to represent the subsurface fractured-vuggy reservoirs using field outcrops. The prime objective of this work is to establish a workflow for exploring multi-phase flow behaviors related to fractured-vuggy reservoirs based on relatively reliable input data. In this study, we focus on typical field outcrops of fractured-vuggy formations and establish a numerical model using actual geological data and measured fluid physical parameters from Tahe Oilfield. A fine geological model is built to characterize the dimension, geometry, and spatial distribution of fractures and caves, which is in line with the field outcrops. The combination of the PEBI grid technique and the control-volume finite difference method is employed to discretize the physical domain. Numerical simulations were conducted to explore the effects of the permeability of fractures and caves and the positions of natural water bodies upon displacement efficiency. We elucidate how these factors affect the remaining oil distribution and the production performance, as well.

2. Methods

2.1. Basic Assumptions

Fractured-vuggy reservoirs have complex media systems with random distribution of fractures and caves, multiple length-scale fractures and caves, complicated morphology of the karst caves, various filling types, and filling degrees [1,29,30]. In order to capture the first-order effects that control the flow processes of fluids within porous media and facilitate numerical processing, the following assumptions are made [31]:
  • Assuming that the system consists of three phases—oil, gas, and water—with each phase containing multiple components, they are treated as a single “pseudo component” with average fluid properties, and the two liquid components of oil and water only exist in the accompanying phase; gases not only exist in the gas phase but can also be dissolved in oil;
  • The fractured vuggy reservoir is considered an isothermal medium system without considering the impact of heat exchange;
  • Heat transport through the porous media is neglected in this study;
  • The caves studied in this work are assumed to be filled-type, such that Darcy’s law is satisfactory in describing the flow behaviors in the cave;
  • Geomechanical and geochemical effects on the rock porosity and permeability are not considered in this study;
  • The influence of capillary force is not considered in fractures;
  • Fractures and karst caves are the main storage spaces, while fractures also serve as connecting channels, neglecting the self-absorption and oil drainage effect of the matrix.
In the current model, we do not take the turbulent flow into consideration in both fractures and caves. Also, this study only focuses on two-dimensional scenarios. The third dimension is significant for modeling the cave since the volume and potential connection play a vital role in contributing to the well performance. It is satisfactory to describe the fluid flow behaviors associated with caves since we focus on filled caves in this work. However, both laminar and turbulent flow regimes may occur in the fracture. This is a methodological shortcoming of our study. In our future work, we will solve a complete Navier–Stokes equation to account for the turbulent flow in fractured-vuggy reservoirs.

2.2. Governing Equations

Based on the above assumptions, the three-phase material balance equations for any flow region are given as follows [31,32]. For gas phase:
t ϕ S o ρ ¯ d g + S g ρ g = · ρ ¯ d g v o + ρ g v g + q g
for water phase:
t ϕ S w ρ w = · ρ w v w + q w
for oil phase:
t ϕ S o ρ ¯ o = · ρ ¯ o v o + q o
where the velocity of the β phase fluid ( β = g is gas; = w is water; = o is oil) is defined as follows, according to Darcy’s law:
v β = k k r β μ β p β ρ β g D
where ρ β is the density of the β phase under reservoir conditions, k g / m 3 ; ρ ¯ o is the density of the oil phase that removes dissolved gas under reservoir conditions, k g / m 3 ; ρ ¯ d g is the density of dissolved gas in the oil phase under reservoir conditions; ϕ is the effective porosity of the formation; v β is the viscosity of the β phase; S β is the saturation of the β phase; p β is the pressure of the β phase, Pa; q β is the sink point/source point term per element volume of the β component in the formation, k g / m 3 · s ; g is the gravitational acceleration, m / s 2 ; k is the absolute permeability of the formation, m 2 ; k r β is the relative permeability of β phase, dimensionless; and D is the burial depth, m . As the control equations for the conservation of three-phase mass, it is necessary to supplement the constraint equation and constitutive equation, which represent secondary variables as functions of the basic main thermodynamic variables. Capillary force and relative permeability can usually be expressed as a function of fluid saturation. The density and viscosity coefficient of oil, water, and gas can be expressed as functions of fluid pressure.

2.3. Control Volume Finite-Difference Method

The control volume finite-difference method [31,32,33] (Figure 2) is used for spatial discretization, the backward first-order difference is used for time discretization, and the equation in element i after discretization is as follows [34]:
M β i n + 1 M β i n V i t = j η i F β , i , j n + 1 + Q β , i n + 1
where M is the mass of the β phase per element volume, k g / m 3 ; The superscript n represents the quantity from the previous moment; The superscript n + 1 represents the quantity at the current time; V i is the volume of element i , representing matrix, fractures, or caves, m 3 ; t is the time step; η i is the set of elements j connected to the same element i ; F β , i , j   is the mass flow term of the β phase between element i and element j , k g / s ; and Q β is the source or sink term of the β phase in element i , k g / s .
According to the form of Equation (5), governing Equations (1)–(3) can be discretized and rewritten into the residual form for the gas phase [34,35]:
R i g ,     n + 1 = ϕ S o ρ ¯ d g + ϕ S g ρ g i n + 1 ϕ S o ρ ¯ d g + ϕ S g ρ g i n V i t j η i ρ ¯ d g λ o i j + 1 / 2 m γ i j Ψ o j n + 1 Ψ o i n + 1 j η i ρ g λ g i j + 1 / 2 m γ i j Ψ g j n + 1 Ψ g i n + 1 Q g i n + 1
for the water phase:
R i w ,     n + 1 = ϕ S w ρ w i n + 1 ϕ S w ρ w i n V i t j η i ρ w λ w i j + 1 / 2 m γ i j Ψ w j n + 1 Ψ w i n + 1 j η i ρ w λ w i j + 1 / 2 m γ i j Ψ w j n + 1 Ψ w i n + 1 Q w i n + 1
for the oil phase:
R i o ,     n + 1 = ϕ S o ρ ¯ o i n + 1 ϕ S o ρ ¯ o i n V i t j η i ρ ¯ o λ o i j + 1 / 2 m γ i j Ψ o j n + 1 Ψ o i n + 1 j η i ρ ¯ o λ o i j + 1 / 2 m γ i j Ψ o j n + 1 Ψ o i n + 1 Q o i n + 1
where i = 1, 2, 3, …, N; m can be n or n + 1 . If m = n , element i applies the implicit pressure-explicit saturation (IMPES) approach [36,37]; if m = n + 1 , then the fully implicit method should be used, and N is the number of iterations of the grid. n represents the previous time point; n + 1 represents the existing time points that need to be addressed; the subscript i j + 1 / 2 represents an appropriate average value at the interface between elements i and j , related to the β phase mobility, which can be defined as follows [34]:
λ β ,     i j = k r β μ β i j + 1 / 2
The definition of the sink/source point term for element i is as follows:
Q β i n + 1 = q β i n + 1 V i
The conductivity coefficient of the flow boundary is defined as follows:
γ i j = A i j k i j + 1 / 2 d i + d j
and
Ψ β i n + 1 = p β i n + 1 ρ β , i j + 1 / 2 n + 1 g D i
where A i j is the area of the common interface between connected elements i and j , m 2 ; d i is the distance from the center of element i to the interface between elements i and its neighboring element; k i j + 1 / 2 is the permeability along the junction of elements i and j , m 2 ; and D i is the burial depth of the center element i , m .

2.4. Treatments of Boundary Conditions

2.4.1. First Type of Boundary Conditions

The first type of boundary condition refers to a constant pressure and constant saturation condition. In finite volume methods, the large volume method is typically used, which specifies a mesh volume of 1050 orders of magnitude on the boundary [31,34] and ensures that other mesh geometric features remain unchanged. This method is also based on the principle of material balance.

2.4.2. Second Type of Boundary Conditions

The second type of boundary condition refers to the flow boundary type condition, which depends on the production/injection conditions and treats it as a source/sink term; that is, the flux terms related to the produced/injected fluid are added to the material balance equation.

2.4.3. Well Boundary Conditions

The “virtual node” method [34] is used to handle the well boundary conditions, which treat the wellbore as single or multiple computational nodes connected to multiple critical nodes of the well. For well node i , the reference Equations (6)–(8) include gas phase [34]:
R i g ,     n + 1 = ϕ S o ρ ¯ d g + ϕ S g ρ g i n + 1 ϕ S o ρ ¯ d g + ϕ S g ρ g i n V i t j η i ρ ¯ d g λ o i j + 1 / 2 m P I i j Ψ o j n + 1 Ψ o i n + 1 j η i ρ g λ g i j + 1 / 2 m P I i j Ψ g j n + 1 Ψ g i n + 1 Q g i n + 1
water phase:
R i w ,     n + 1 = ϕ S w ρ w i n + 1 ϕ S w ρ w i n V i t j η i ρ w λ w i j + 1 / 2 m P I i j Ψ w j n + 1 Ψ w i n + 1 j η i ρ w λ w i j + 1 / 2 m P I i j Ψ w j n + 1 Ψ w i n + 1 Q w i n + 1
and oil phase:
R i o ,     n + 1 = ϕ S o ρ ¯ o i n + 1 ϕ S o ρ ¯ o i n V i t j η i ρ ¯ o λ o i j + 1 / 2 m P I i j Ψ o j n + 1 Ψ o i n + 1 j η i ρ ¯ o λ o i j + 1 / 2 m P I i j Ψ o j n + 1 Ψ o i n + 1 Q o i n + 1
where P I i j refers to the production index or injection index connected to well node i and adjacent node j , m 3 ; Q β i n + 1 refers to the total mass flow rate of well production or injection ( β = g ,   w ,   o ), k g / s . The production index P I i j for the vertical well is calculated using the following formula [38]:
P I i j = 2 π k Z i l n r e r w + s 0.5
where Z i is the thickness of layer j , m ; r e is the effective radius of grid j , m ; r w is the wellbore radius, m ; and s is the skin coefficient, dimensionless. The phase injection rate of the injection well Q β ( β = g ,   w ,   o ) is estimated as follows [34,35]:
Q β , w = j η i ρ β λ β i j + 1 / 2   P I i j p β j p W ρ β g D j D W
where D W is the depth of the pump inside the wellbore, m ; and p W is the bottom hole flow pressure, Pa. When using a constant liquid production rate, the bottom hole flow pressure is determined by the following equation [34,35]:
p W = Q L + j η i β ρ β λ β / ρ β o i j + 1 / 2   p β j p W ρ β g D j D W ÷ j η i β ρ β λ β / ρ β o i j + 1 / 2  
Bottom hole flow pressure constraint conditions:
p W p W , m i n
where p W , m i n is the minimum allowable bottom hole flow pressure, and when the pressure is lower than the lower limit pressure, it automatically switches to constant pressure production at that pressure. Constant pressure production p W is considered a known quantity, and the total mass flow rate of each phase is calculated according to Equation (17) and then added to Equations (6)–(8) for calculation.

2.5. Solution Methodology

Selection of the primary variables is crucial for a successful solution of the three-phase problems, especially for variable bubble point ones. In this model, we have three primary variables: oil pressure p o , oil saturation S o , and gas saturation S g or saturation pressure p s . The selection of the third primary variable depends on the reservoir conditions. If the in situ pressure exceeds the bubble point pressure (i.e., no free gas), saturation pressure becomes the primary variable; otherwise, the third primary variable would be switched to gas saturation. To solve the governing Equations (6)–(8), the Newton–Raphson scheme is employed and leads to the following formula:
R i β ,   n + 1 x k , p x k · δ x k , p + 1 = R i β ,   n + 1 x k , p ,   k   =   1 ,   2 ,   3
where x k denotes the primary variable; p is the iteration level. The primary variables are updated after each iteration:
x k , p + 1 = x k , p + δ x k , p + 1
The Newton–Raphson iteration is repeated until the convergence criteria associated with the prescribed residual tolerances are satisfied:
x k , p + 1 x k , p x k , p + 1 < ε k ,   k = 1 , 2 , 3
where x k is the primary variable vector, ε k = 1.0 ×   10 4 ( k = 1 , 2 , 3 ) is the prescribed tolerance, and the symbol “ · ” is the operator for root-mean-square. In this study, we also force the absolute increment of the primary variables to be small enough:
δ p o < 1.0   k P a ;   δ p s < 1.0   k P a δ S o < 10 4 ;   δ S g < 10 4  

3. Model Validation

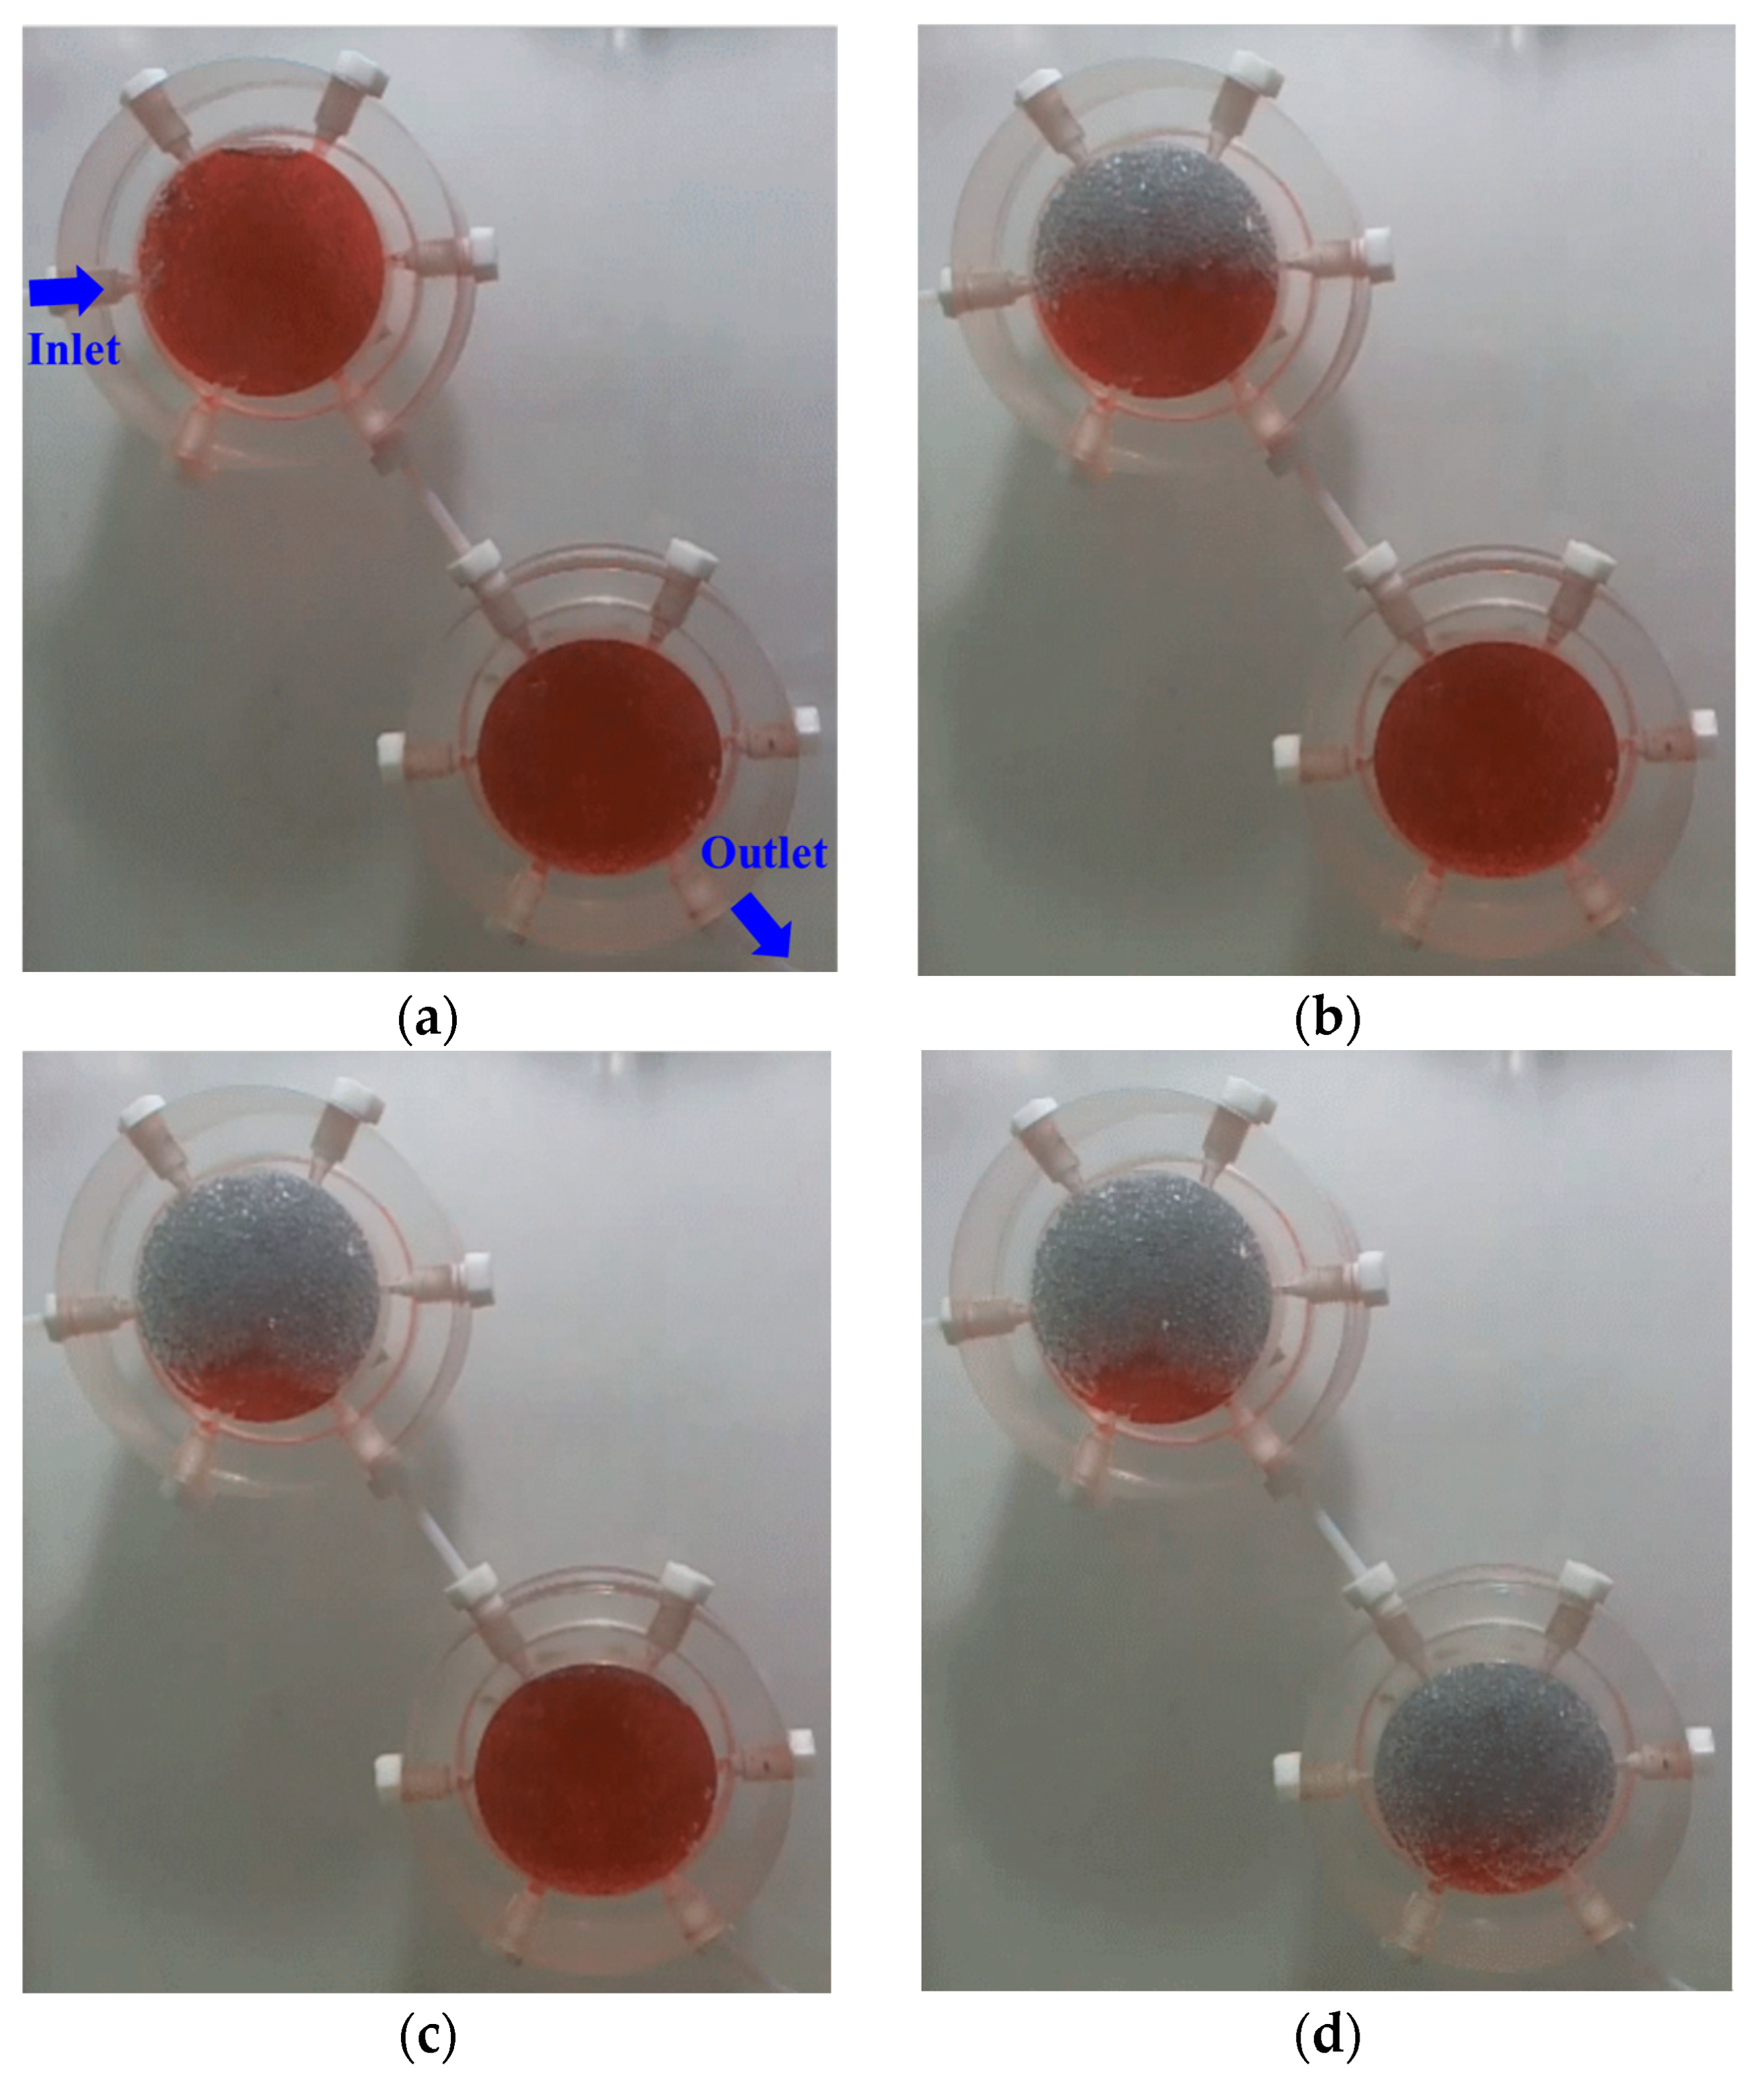
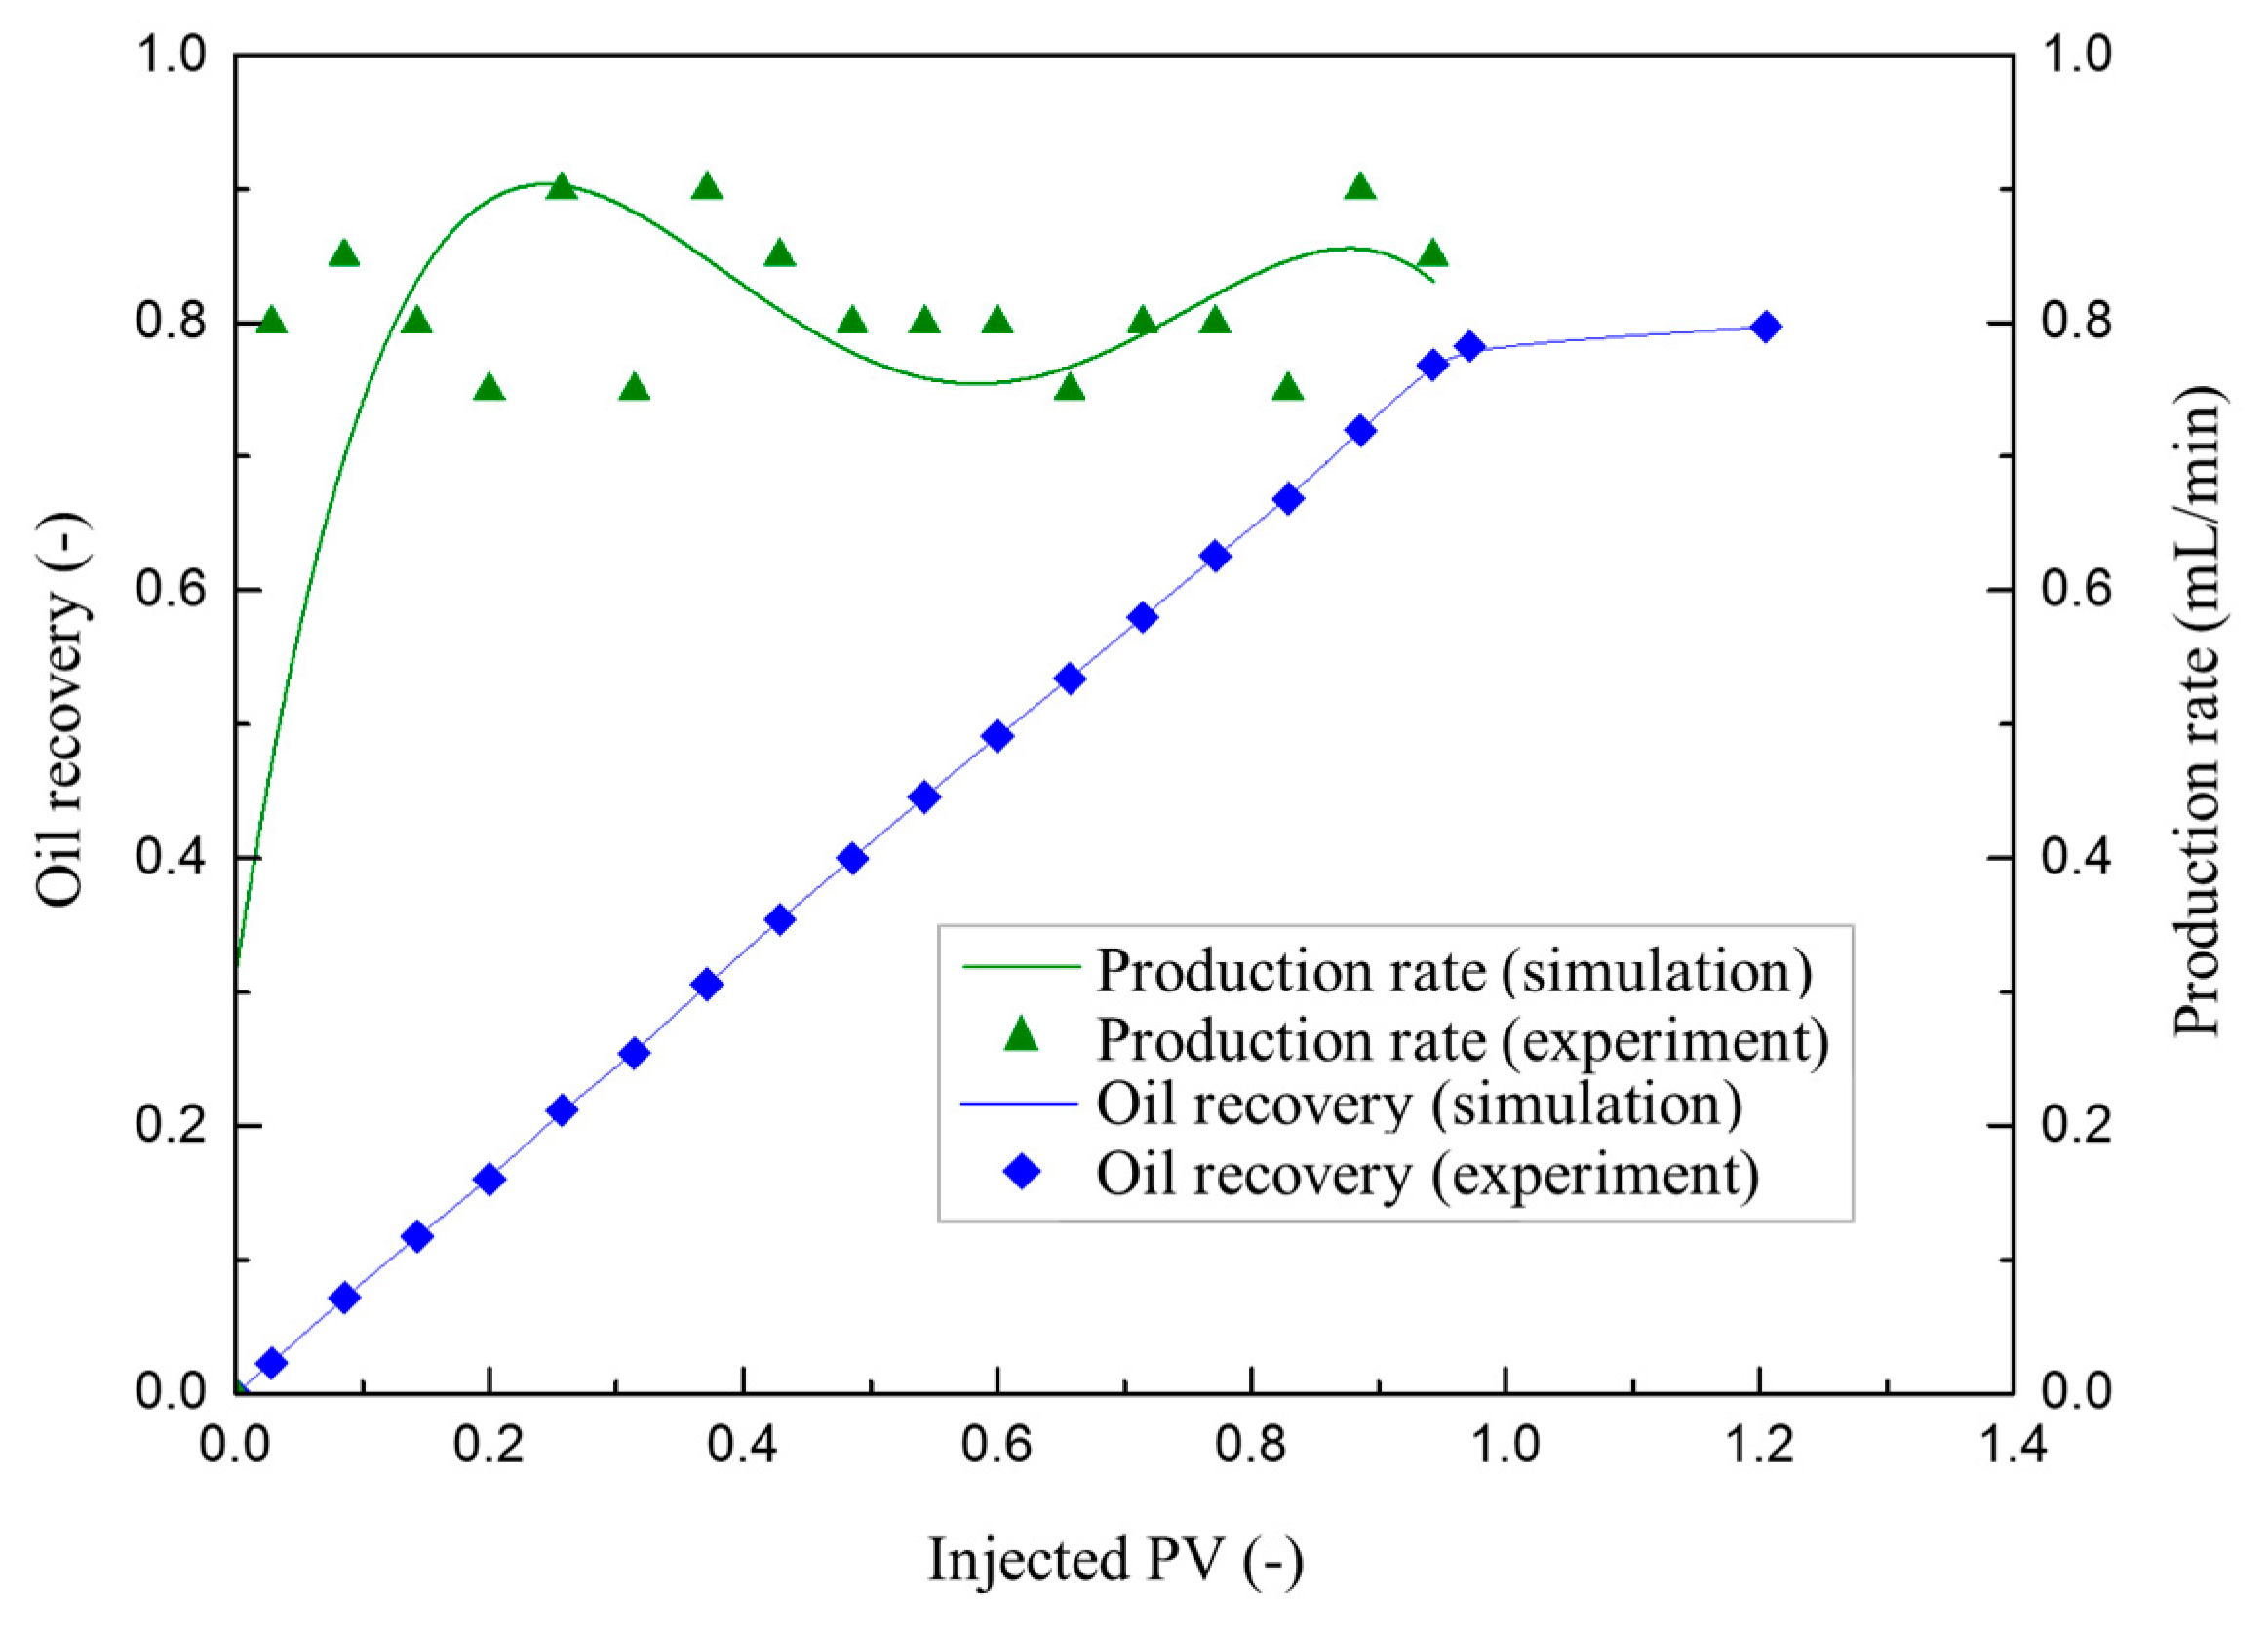
The prototype of this model, called MSFLOW code, was originally developed by Wu [35]. Subsequently, various scholars were dedicated to extending this model as a more general simulator for oil and gas development [6,34,39,40]. The numerical model has been validated against experimental data [34], analytical solutions [40], and a widely acknowledged commercial software, CMG [39]. However, the validity of the MSFLOW code used for fractured-vuggy reservoirs is undetermined. In this section, we verify the in-house simulator against laboratory experimental results. As shown in Figure 3, a constant flow rate (i.e., 1.0 mL/min) of gas with a density of 1.1648 kg/m3 and a viscosity of 1.757 × 10⁻² cP was injected from the inlet point (see Figure 3a) into a cylinder. A standard atmospheric pressure of 0.1 MPa was kept at the outlet point, connected to the other cylinder. A tiny tube connects the two cylinders, both of which are full of oil whose density and viscosity are 913.1 kg/m3 and 5.0 cP, respectively. The two cylinders are analogs of the filled caves, whose total porous volume was 70.0 mL. After 90 min gas injection, the oil production rate observed from the outlet became so low and the cumulated oil production was 54.94 mL. The processes described above were simulated with the MSFLOW code, keeping the initial and boundary conditions consistent with the experiment. Figure 4 displays the comparison of oil production rate and oil recovery between numerical and experimental results, which exhibits good agreement with each other. This comparison indicates that the MSFLOW code could lead to satisfactory modeling results when simulating multiphase flow through the fractured-vuggy reservoir.

4. Numerical Results

4.1. Discretization of Field Outcrop of Fractured-Vuggy Reservoirs

To reflect the flow processes of fluids in fractured-vuggy reservoirs, as far as possible, AutoCAD was used to depict the morphology and size of fractures and caves in detail, as shown in Figure 5. The depicted fractures and caves were data-driven and imported into a specialized gridding software, WinGridder [41]. During gridding, parameters such as the strike angle, dip angle, and the width of fractures were assigned based on actual measurement data. The entire simulation area was discretized into a series of irregular local orthogonal grids, as shown in Figure 5b,d [41,42]. Although the numerical model itself is three-dimensional, we would like to set up a two-dimensional model to simulate the multiphase flow through the outcrop-like reservoir due to the lack of knowledge on the third dimension of the outcrop. Namely, we use a unit-length scale (i.e., 1.0 m) in the third dimension. Considering the neglect of the self-suction and oil drainage effect of the matrix, the matrix grid was removed from the grid system, and the final mesh only includes fractures and karst caves, as shown in Figure 5d. The model dimension is 10.0 m (length) × 1.0 m (width) × 6.77 m (depth), with a total of 14,127 grids. Among them, the matrix is discretized as a 0.2 m × 0.2 m rectangular grid, and the karst cave is discretized as a 0.06 m × 0.06 m regular hexagonal grid (see Figure 5d). It should be noted that the outcrop only represents the subsurface vuggy reservoir to a certain extent since the outcrop may have suffered from various unknown reconstruction activities, such as weathering processes, dissolution processes, and/or tectonic movements. We still believe that it constitutes a satisfactory way to characterize the invisible underground fractured-vuggy formations based on field outcrops.

4.2. Numerical Results and Discussion

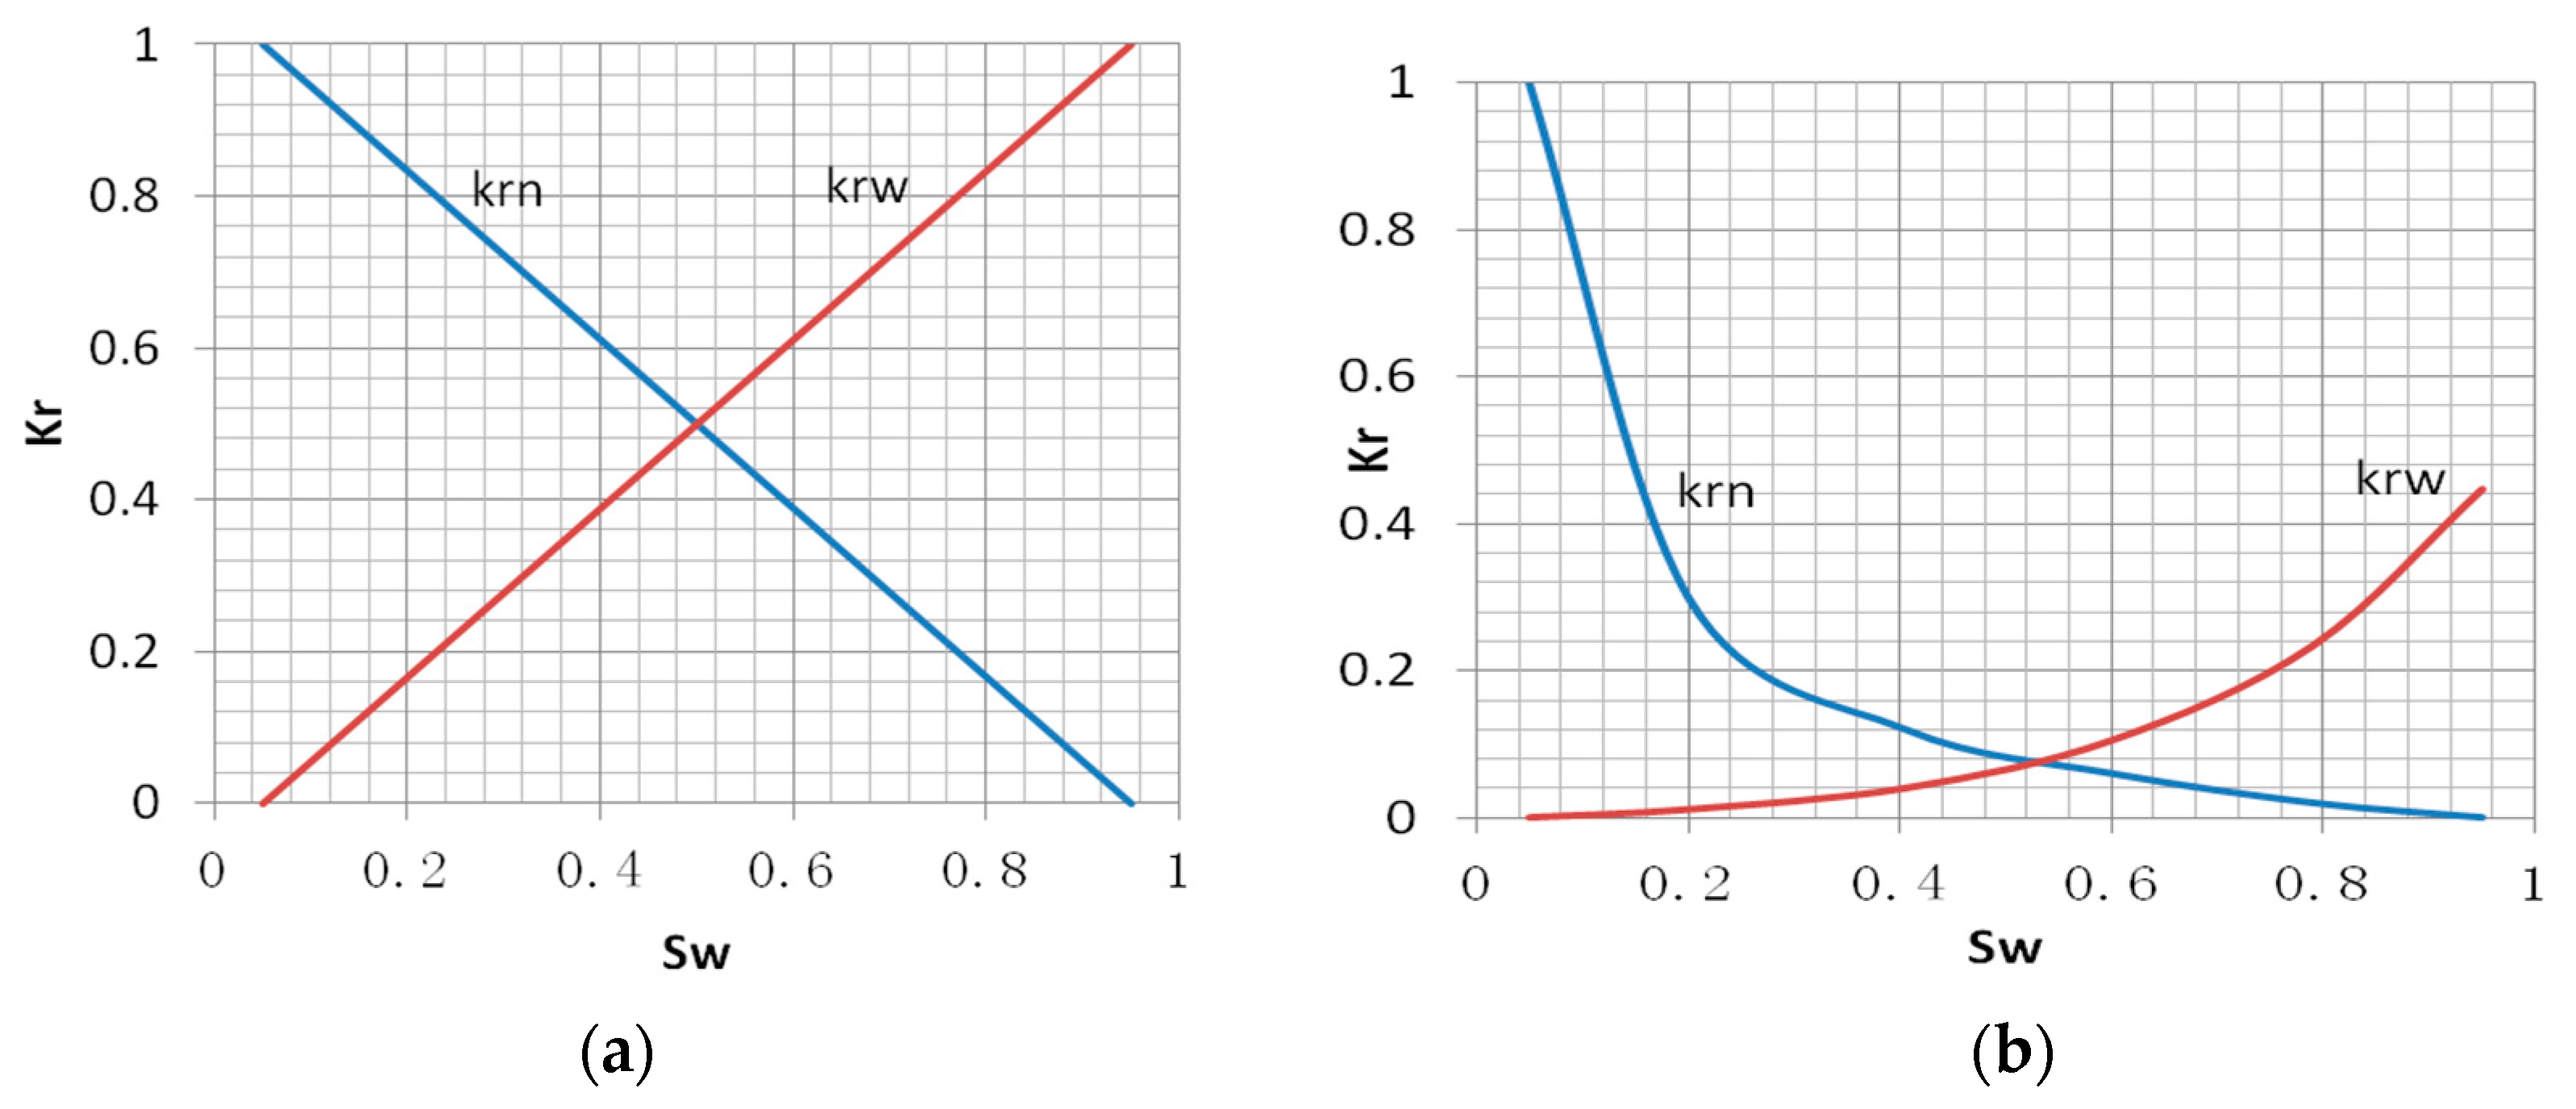
We establish a geological model based on typical outcrop patterns of fractured-vuggy reservoirs in Tahe Oilfield and provide petrophysical parameters based on relevant data from the Tahe Oilfield. Under standard conditions, the viscosities of oil, gas, and water are 24.0, 0.01, and 0.898 mPa · s, respectively, and the corresponding densities are 960, 0.7, and 1147.3 kg/m3, respectively. The compression coefficients are 1.1 ×   10 3 , 0.998 ×   10 6 , and 1.0 ×   10 4 MPa−1, respectively. The bubble point pressure of the reservoir is 20.2 MPa, the bound water saturation and residual oil saturation are both 0.05, and the residual gas saturation is 0. At the initial time of simulation, the fractures and caves were full of oil, and the bottom pressure of the model was 59.0 MPa (see Figure 6). Figure 7 shows the relative permeability curve for fractures and filled caves. The pressure field in the simulation area is distributed according to a gravity gradient. By default, the model boundaries are all zero-flow boundary conditions, with an oil well liquid production rate of 0.1 m3/d, an initial time step of 1.0 h, and a maximum time step of 100 h. The time step is automatically adjusted according to the speed of convergence during the simulation.

4.2.1. The Impact of the Location of Natural Water Bodies on Oil Recovery Efficiency

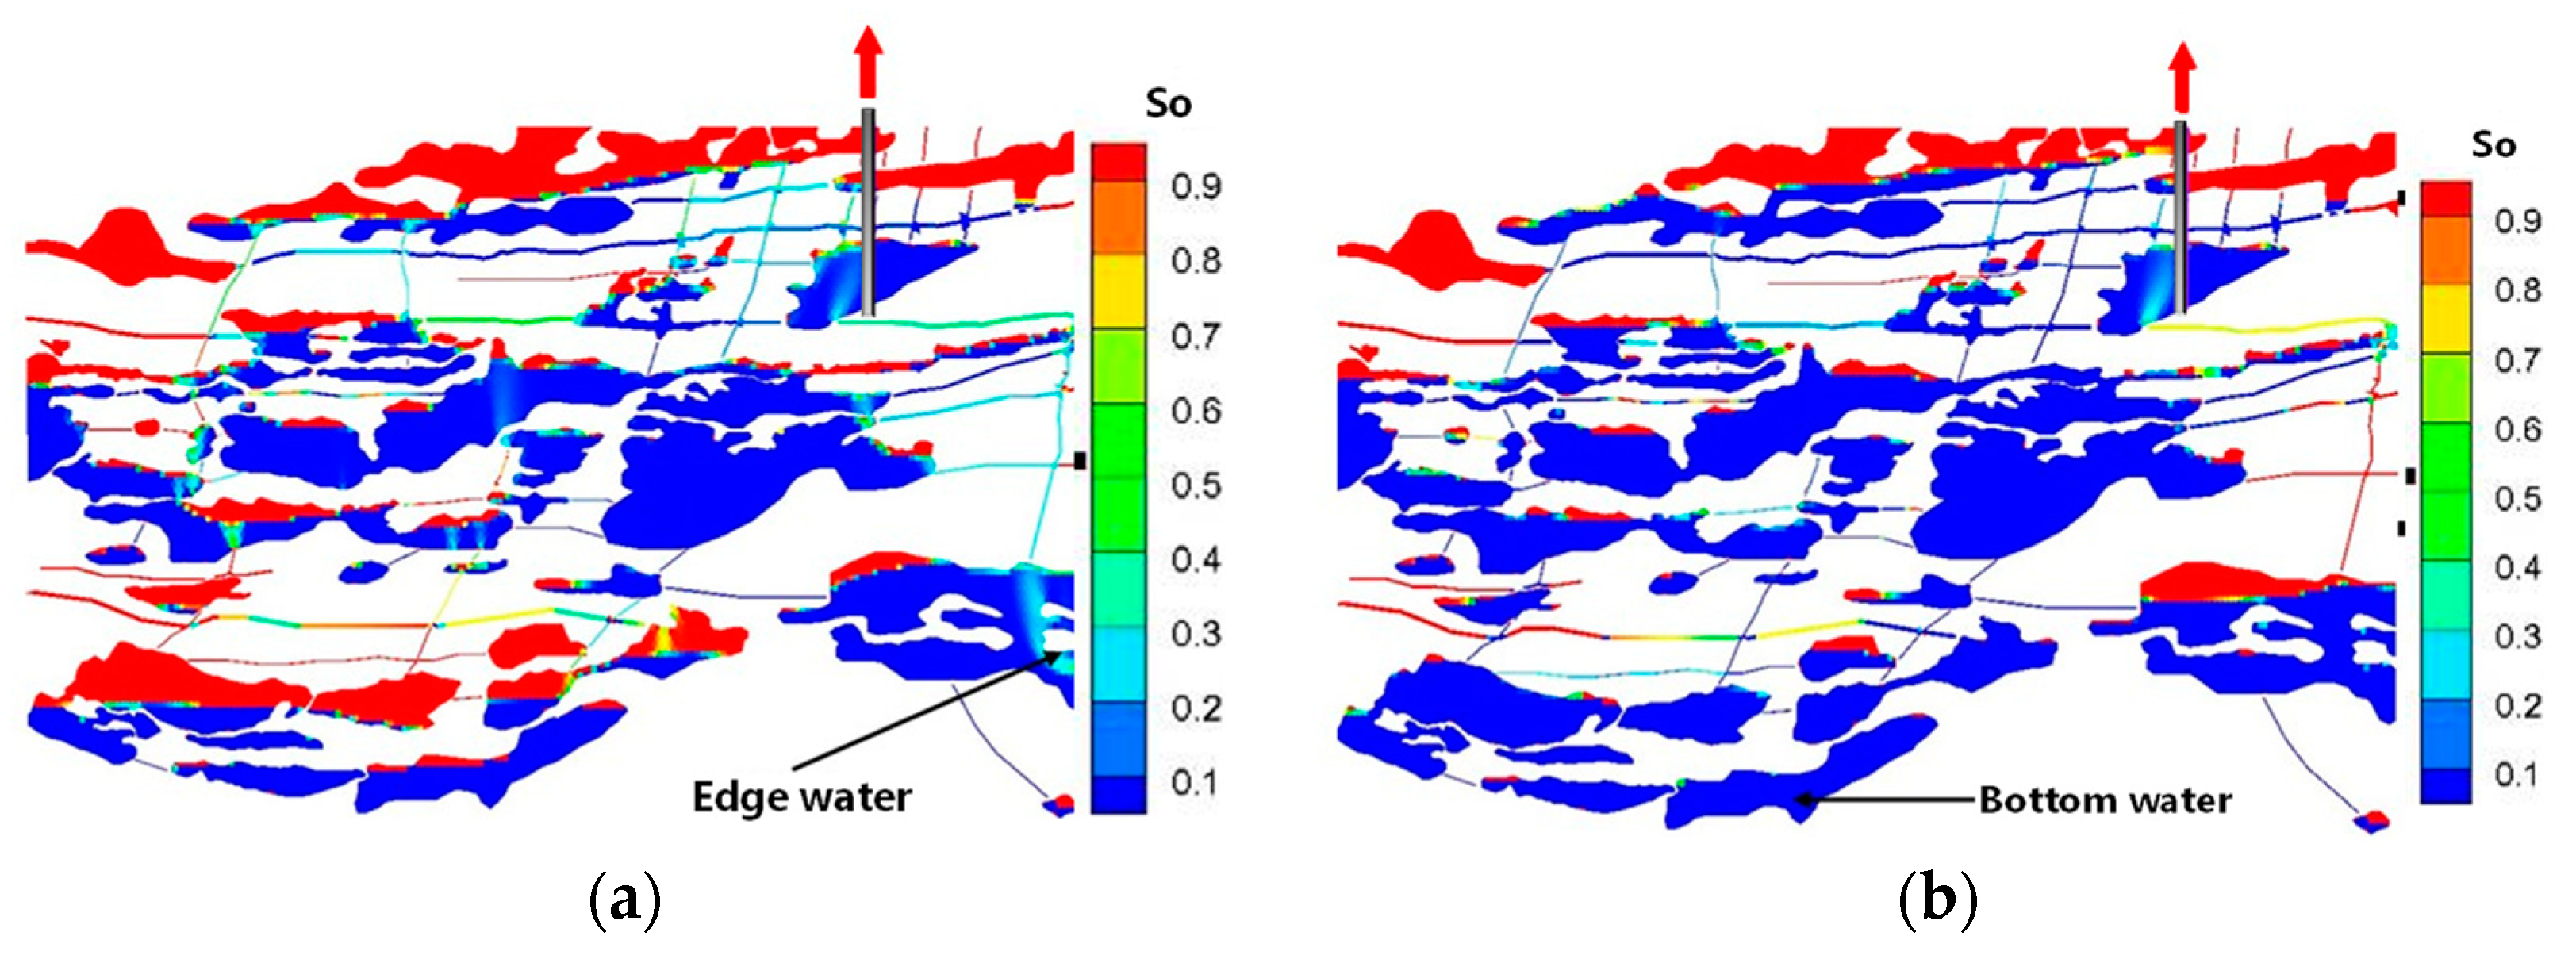
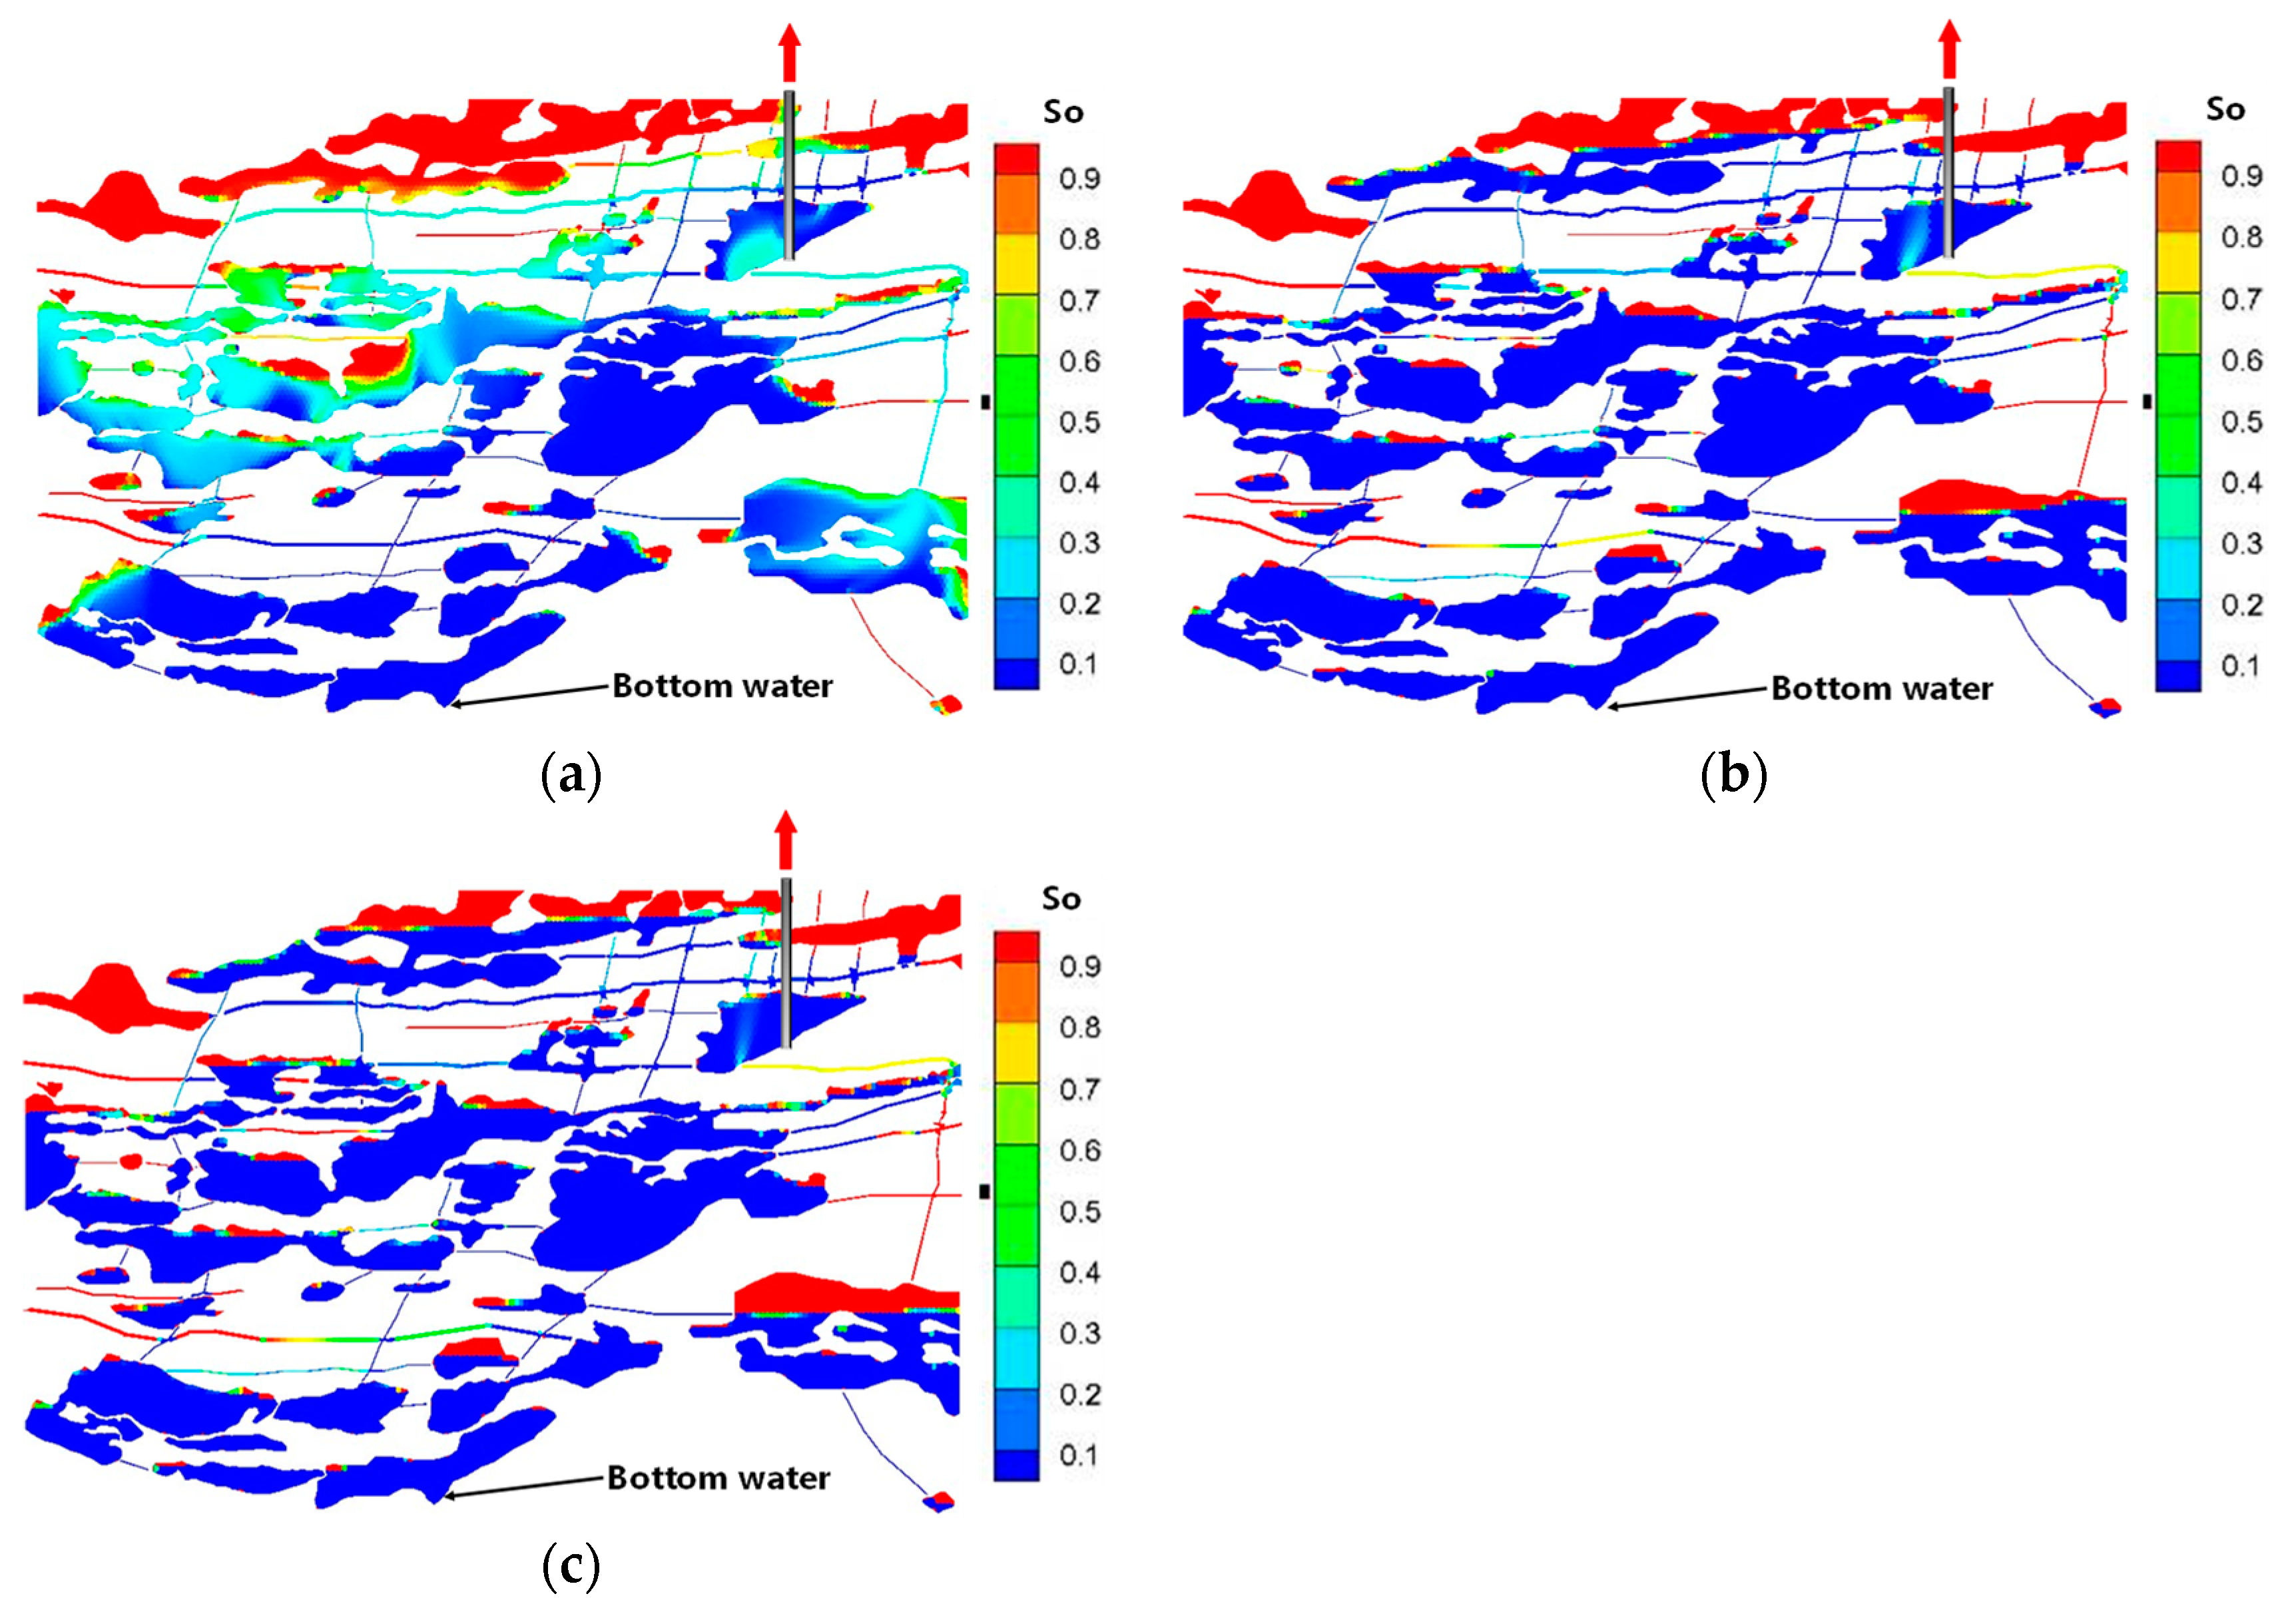
The location and energy level of natural water bodies are important parameters. This is because, given the location of the production well, the water body location partially determines the sweep areas of the oil, and the magnitude of the water-energy decides how much fluid one can extract from the reservoir. This subsection studies the impact of different natural water conditions on oil recovery efficiency by setting different water body positions (see Figure 8).
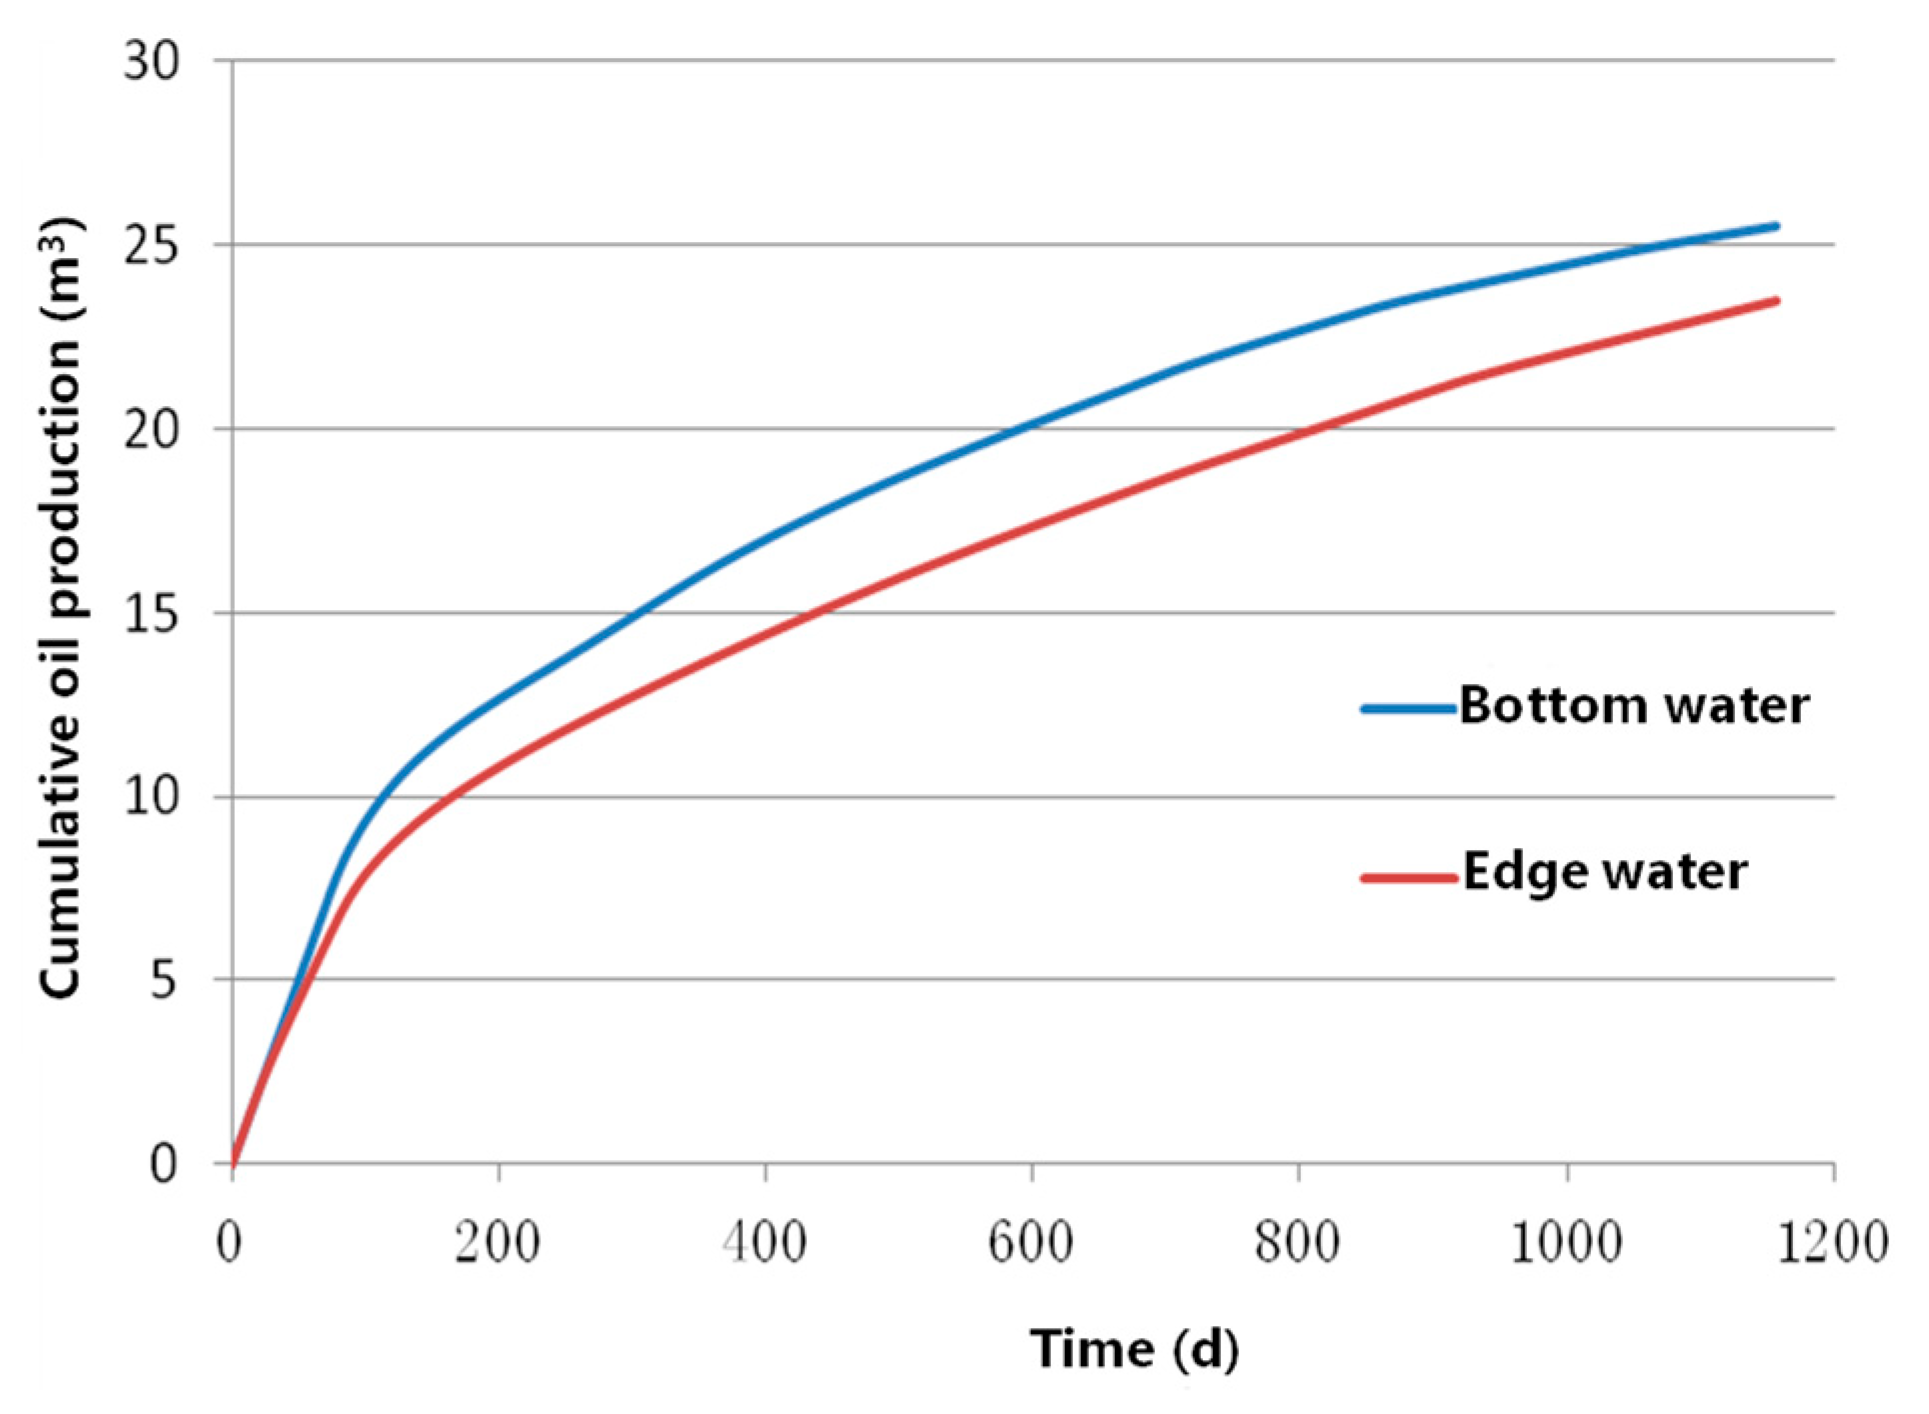
The total liquid production rate of the production well is 0.1 m3/d; the fracture permeability is given by the cubic law and the cave permeability is 5 D; the simulation time is based on the production shutdown standard of the production well with the water cut reaching 98%; the water bodies are located at the edge (Figure 8a) and the bottom (Figure 8b) of the model; and the oil saturation distribution, water cut curve, and cumulative oil production curve at the last moment are obtained. The simulation results show that the location of water bodies has a significant impact on oil recovery, with bottom water conditions resulting in a long period of anhydrous oil recovery, high cumulative oil production, and high extraction efficiency. When the water body is close to the production well, it can easily form a preferential channel, and the water body’s sweep range decreases. Oil in the fractures and caves located below the water body is difficult to extract. Figure 8 shows that the fractured-vuggy reservoirs have a complex oil–water contact relationship. Curves shown in Figure 9, Figure 10 and Figure 11 reflect the oil production performance, which implies that the displacement efficiency relies on the distance and the connected passages between the water body and the production well. Particularly, space connections between fractures and caves determine the shape of the waterflooding frontiers and, thus, longitudinal and transverse oil displacement efficiency. Fluctuation characteristics associated with water cut and oil production curves can be observed after approximately 200 d. This is because the permeability contrast between the fracture and the caves will amplify the contribution of individual caves to the fluid production. The caves have various volumes and, thus, present differing potentials for providing oil even under the same conditions. The fluctuation characteristics reflect the geometry and volume differences between the cave/s that contribute to the oil production in time sequence.

4.2.2. The Influence of the Cave Permeability on Oil Recovery Efficiency

Generally speaking, karst caves in fractured-vuggy porous media are either fully filled or partially filled, and the properties of the filling material can be characterized by porosity and permeability. This subsection mainly conducts a parameter sensitivity analysis on permeability to consider the impact of the filling degree, represented by cave permeability here, of karst caves on oil recovery efficiency.
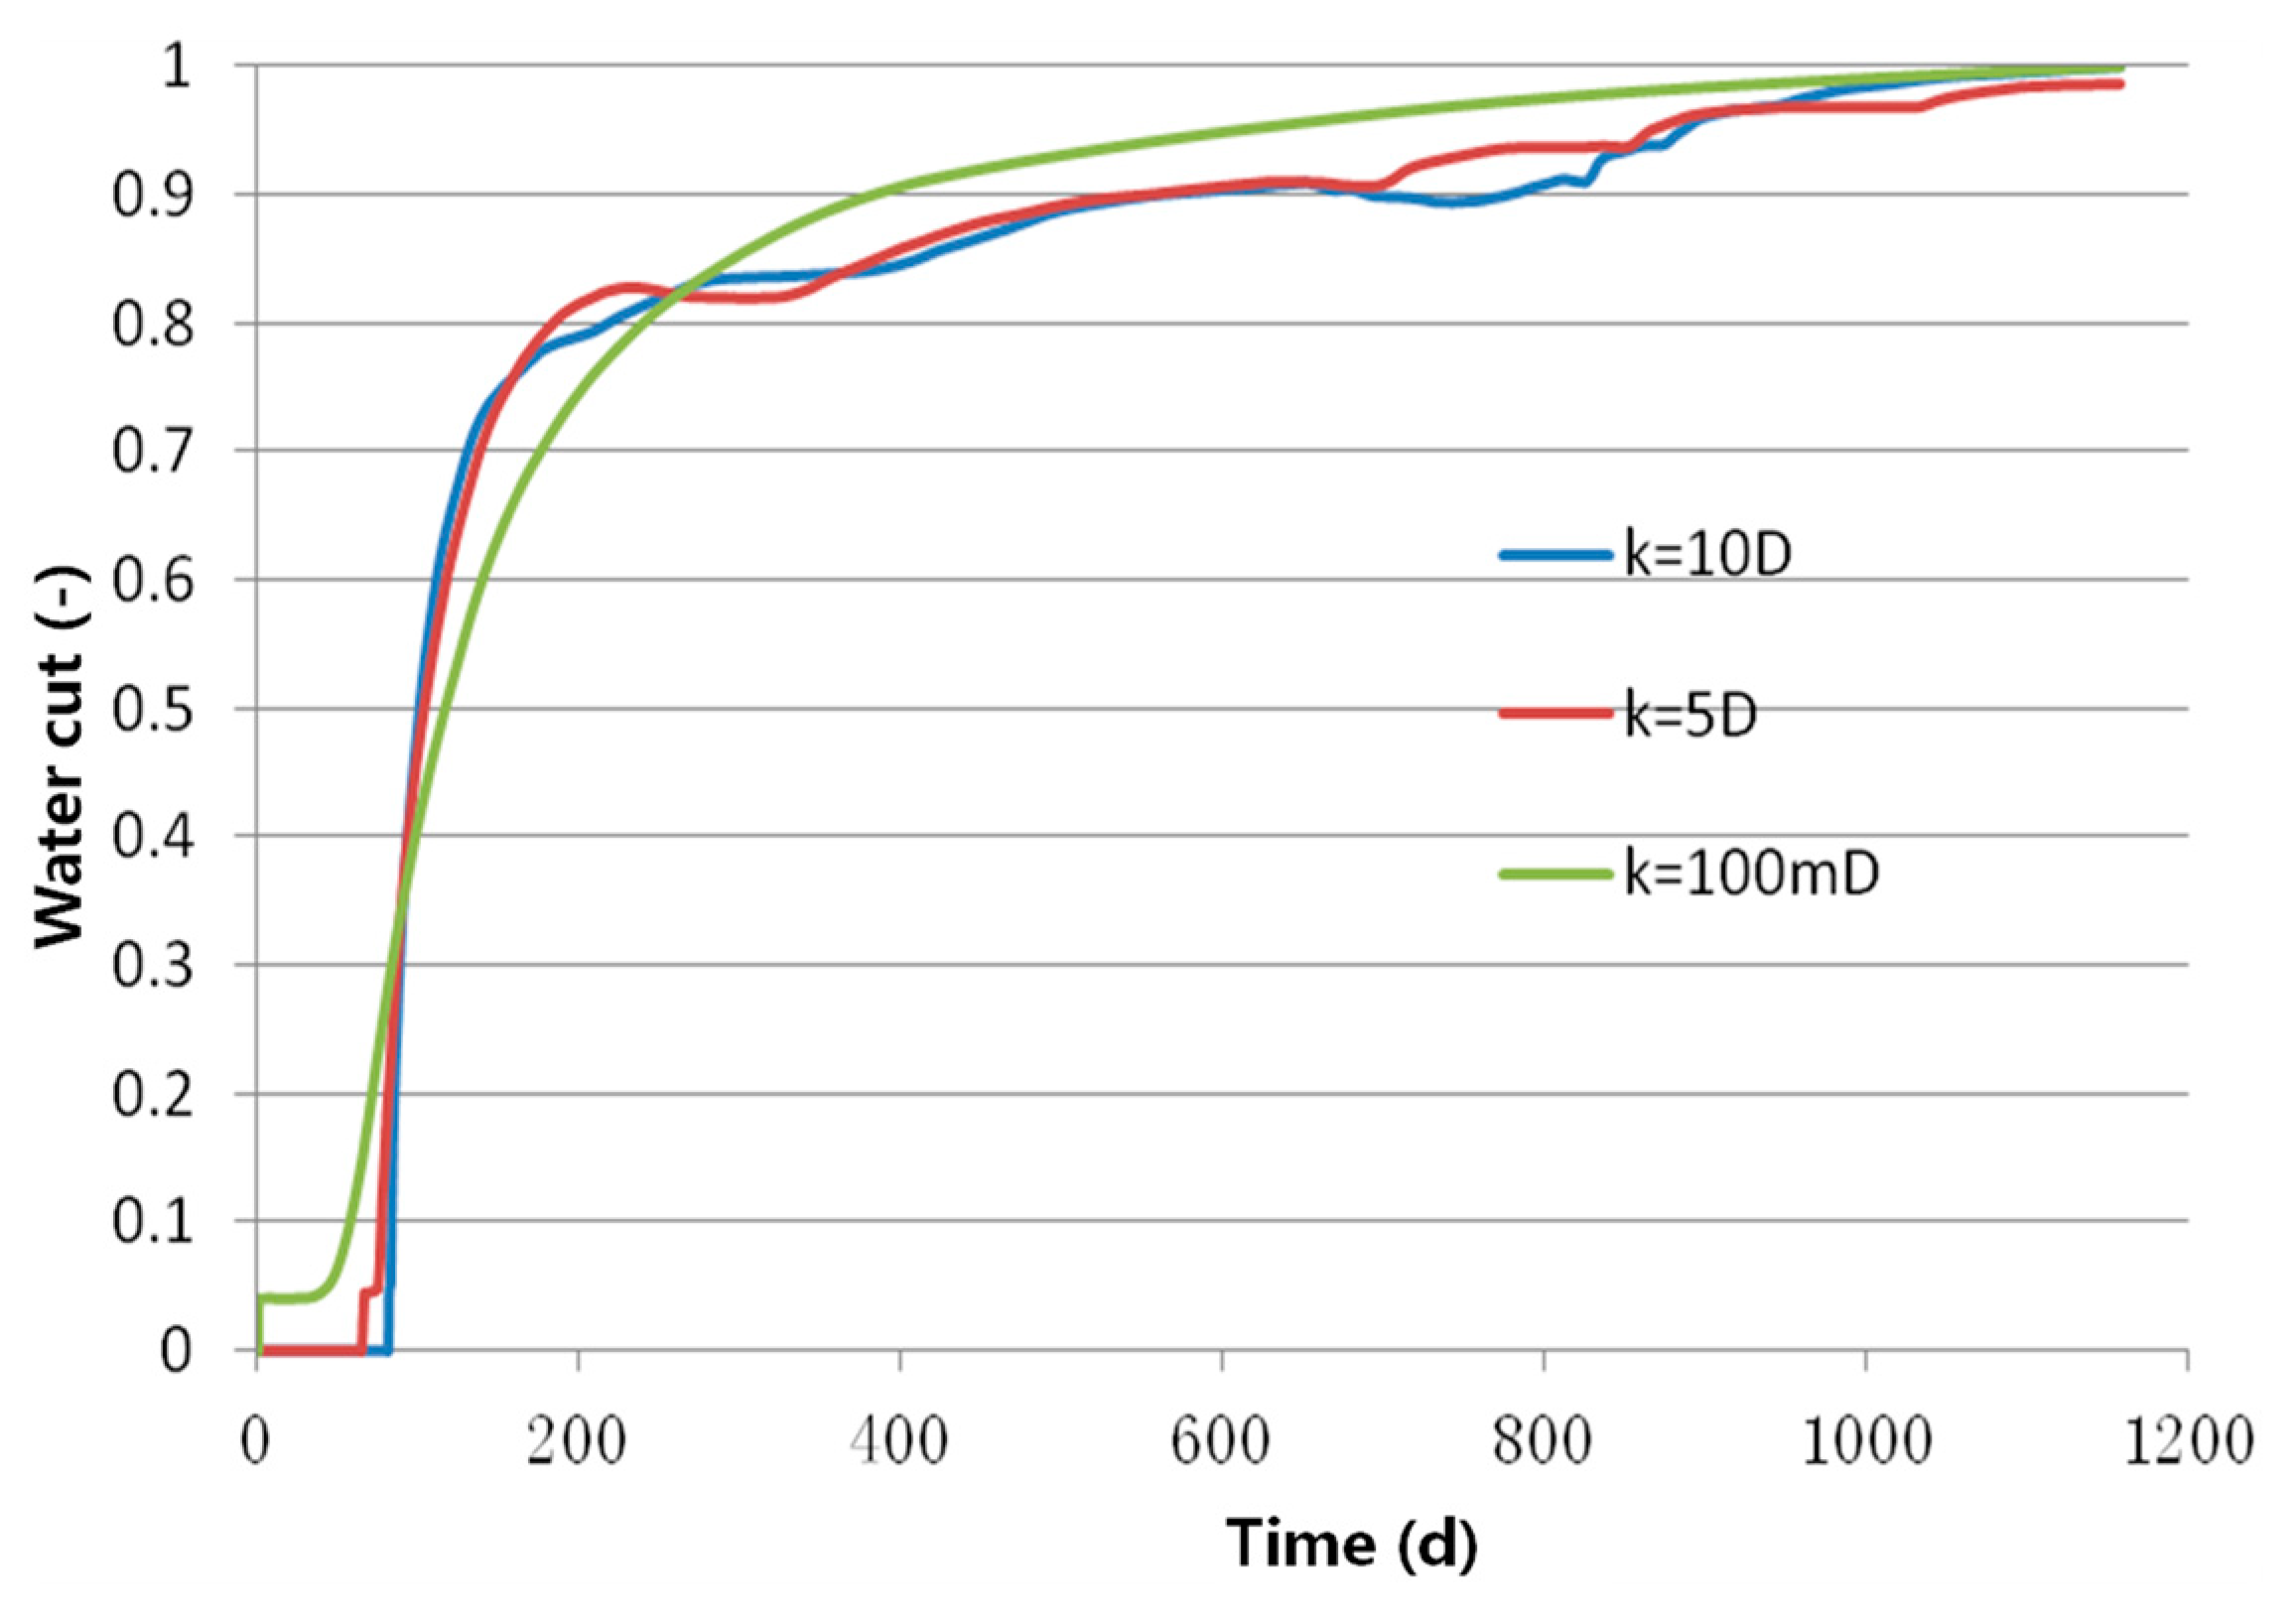
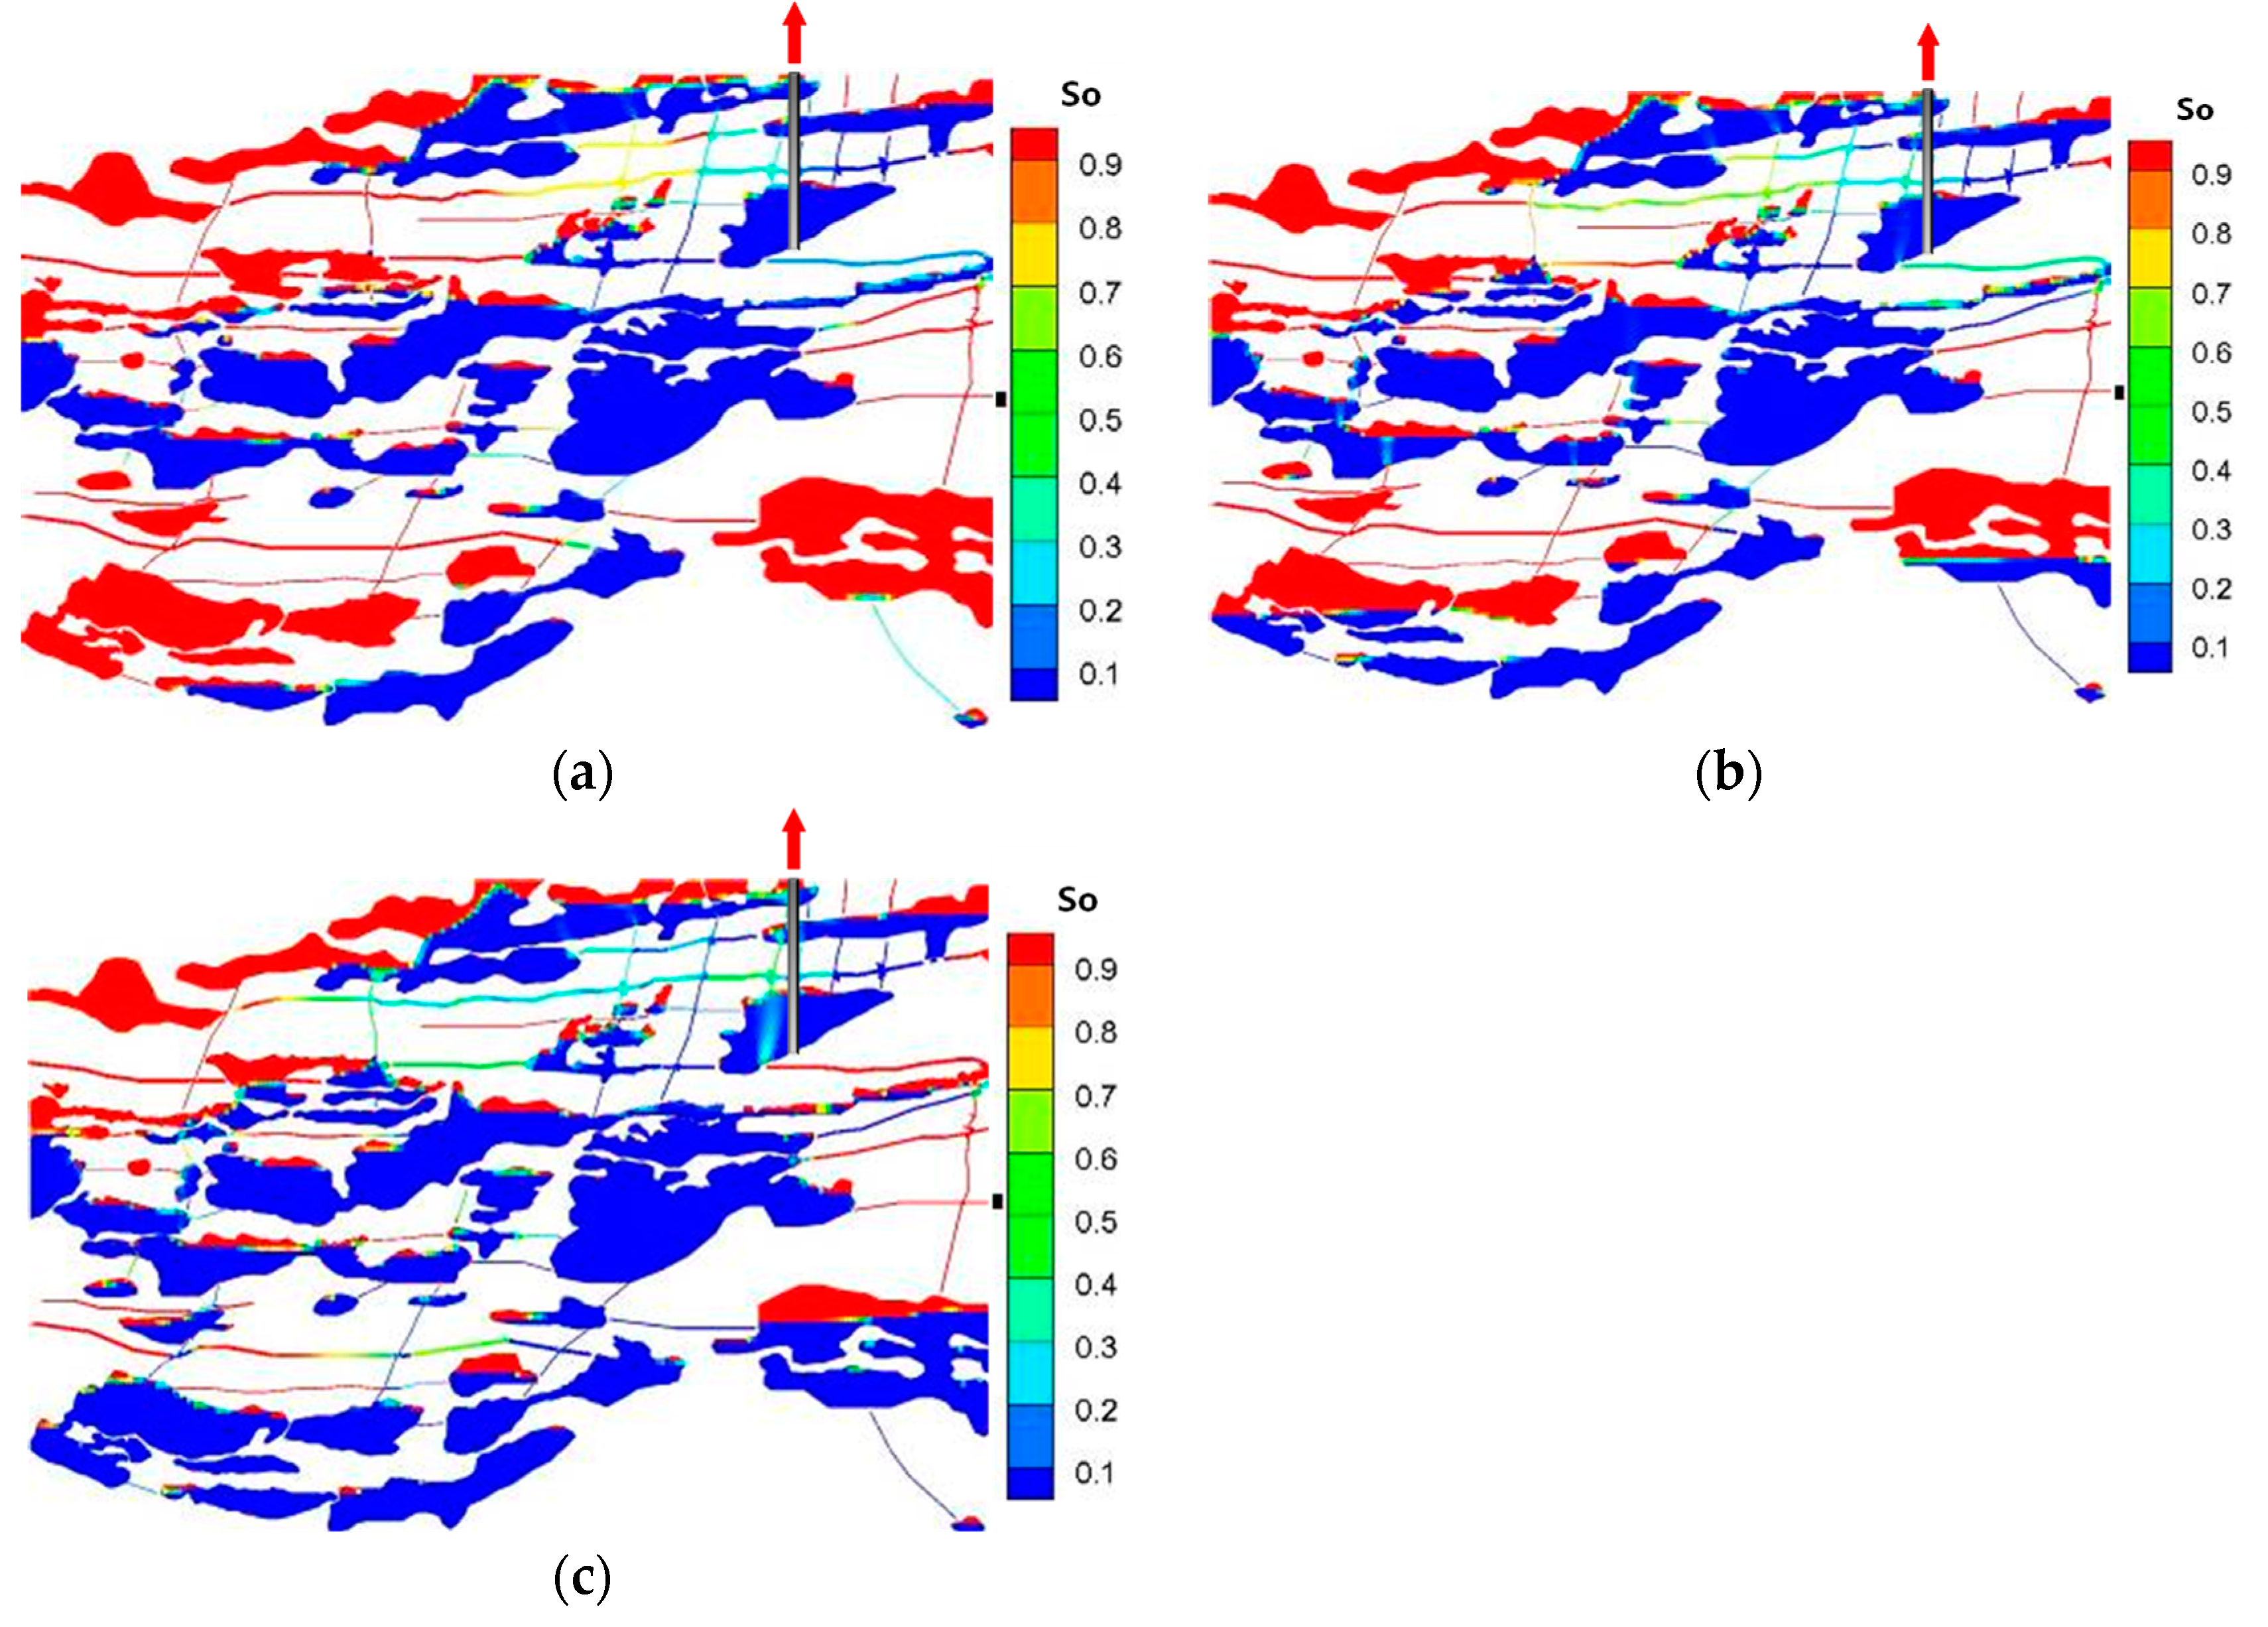
Under the condition of bottom water, the production is carried out according to the above-mentioned 0.1 m3/d fluid production rate. The perforation depth and location of the oil well are shown in Figure 12. The fracture permeability is prescribed according to the cubic law. The simulation time is based on the shutdown standard of 98% water cut in the production well, and the cave permeability is set as 100 mD, 5 D, and 10 D, respectively. The oil saturation distribution, water cut curve, and cumulative oil production curve at the last moment can be calculated. The simulation results show that the higher the permeability of karst caves, the higher the degree of recovery (see Figure 13) and the longer the anhydrous oil recovery period (see Figure 14). When the permeability reaches a certain level, the influence of karst cave permeability on oil recovery efficiency becomes weaker (see Figure 13); the gravity capture effect is significant, and the bottom water roughly advances smoothly in a horizontal manner. After the production well is affected, it is immediately flooded with explosive water; the remaining oil is mainly distributed at the top and edges of the model, as well as at the top of single-fracture connected karst caves and multiple-fracture connected karst caves. Overall, the cave permeability does not have a significant impact on the water cut evolution and the oil production rate (see Figure 14 and Figure 15). Moreover, the remaining oil distributions of different cave permeabilities have a similar pattern. We believe that caves are mainly responsible for oil/gas storage, yet they have limited influence on oil displacement efficiency and production performance.

4.2.3. The Influence of the Fracture Permeability on Oil Recovery Efficiency

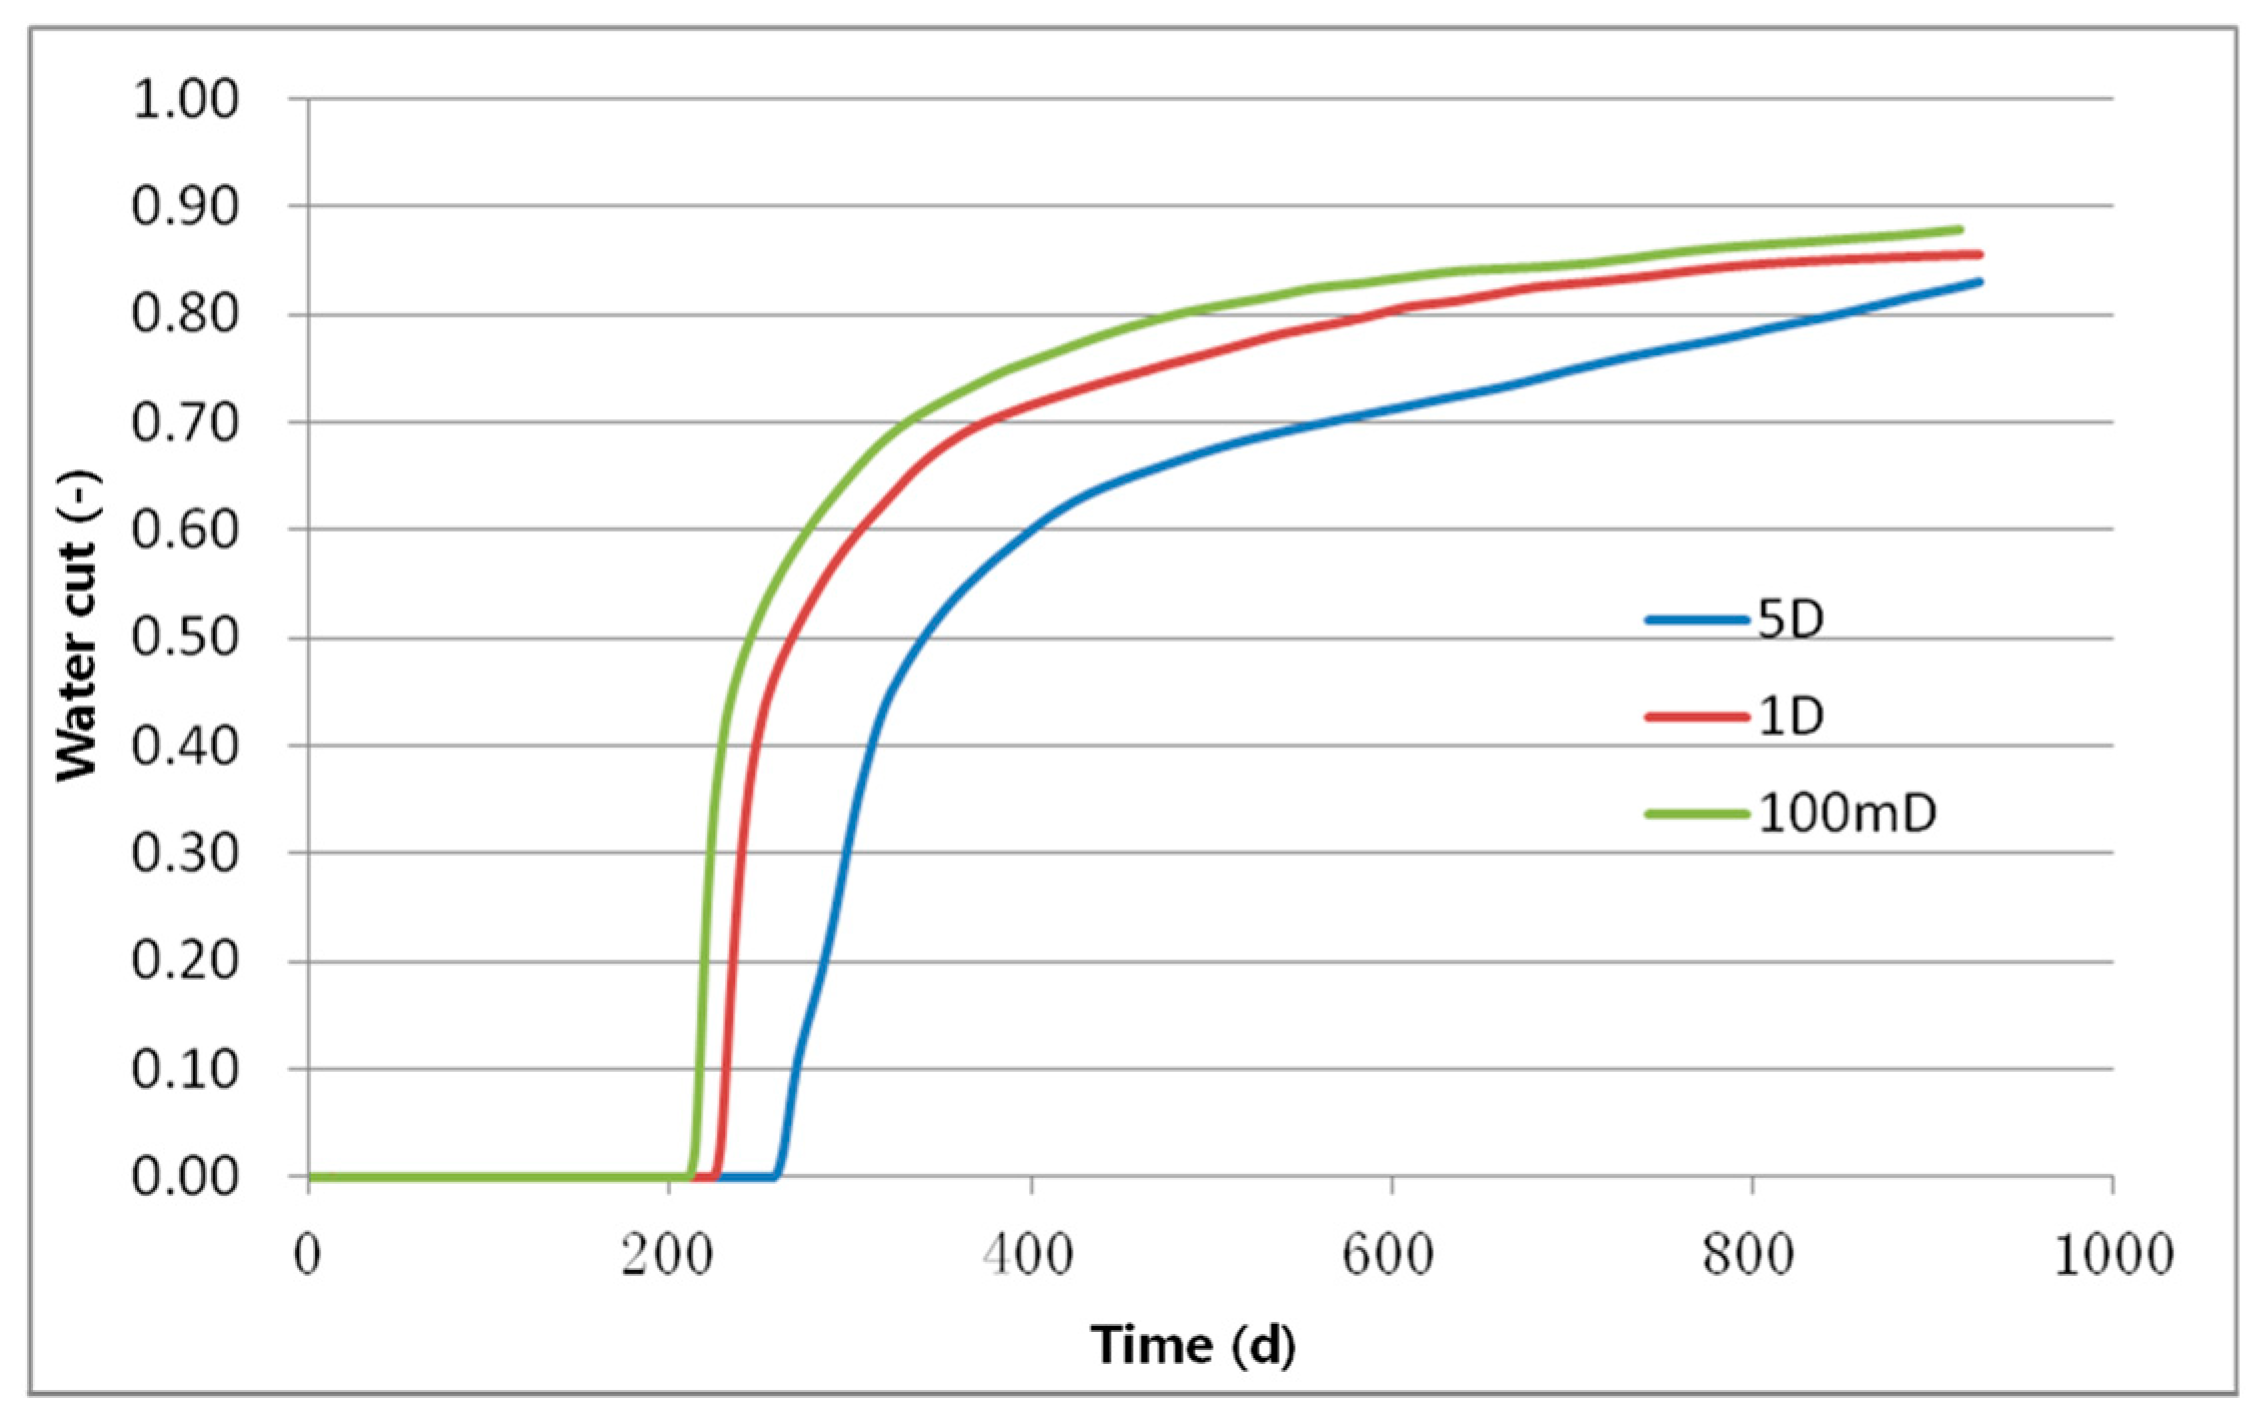
As we know, the fracture serves as a vital passage that connects one cave to another, such that during waterflooding or nitrogen flooding, hydrocarbons can be extracted from caves far away from the production wells. If the production well was drilled into an isolated cave, one may lose the chance of tapping oil/gas from other caves, even in the vicinity of it. Under this circumstance, human-made fractures, through hydraulic fracturing or acid fracturing treatments, are desired to create connectivity among caves/fractures or between the cave and the fracture [43]. In this subsection, we have a single production well, and the driving force comes from the bottom water. The permeability of the caves is 5 D, and the total production rate is 0.05 m3/d. Different fracture permeabilities (i.e., 100 mD, 1 D, and 5D) were prescribed for three simulation cases with the intention of elucidating the influence of fracture permeability on oil recovery efficiency.
Figure 16 shows oil distributions with different fracture permeabilities at the end of 960 days. During the first 200 d of the production, we observe few differences among the three cases; that is, we have the same oil production rate without water produced and the same cumulative oil production (Figure 17, Figure 18 and Figure 19). Subsequently, however, a dramatic decrease in the oil production rate occurs due to a sharp increase in the water cut. The comparison results of Figure 17, Figure 18 and Figure 19 demonstrate that a lower fracture permeability would result in an earlier water breakthrough (see Figure 18) and a more rapid increase of the water cut. For fractured-vuggy reservoirs, the permeability of the fracture determines the degree of cave connectivity, which affects both transverse and longitudinal flows. A lower fracture permeability severely impedes the transverse flow but strengthens the longitudinal flow, such that the bottom water fails to sweep the oil residing in the cave with a relatively large burial depth. Consequently, the fracture permeability exhibits a positive relationship with the oil production rate, as well as the cumulative oil production. Modeling results indicate the dominant role fracture permeability played in oil production. This is because, during oil production, a higher fracture permeability secures a timely energy supplement from the bottom water, which further guarantees a steady oil displacement from the bottom to the up. In contrast, it becomes very harsh for the bottom water to sweep the oil from every corner of the caves, resulting in more remaining oil undeveloped.

5. Conclusions

In this work, we propose a novel workflow, integrated with an in-house multiphase simulator, to investigate the complex flow behaviors and remaining oil distribution based on typical outcrops of fractured-vuggy reservoirs in Tahe Oilfield. Our simulation results lead to the following conclusions:
  • The cave permeability has few impacts on the oil production, while the fracture permeability plays a significant role in determining the oil recovery;
  • The higher the permeability of fractures, the longer the anhydrous oil recovery period and the higher the degree of recovery. When the permeability reaches a certain level, the impact of fracture permeability weakens;
  • The location of the water body has a significant impact on the oil recovery effect. When the water body is close to the production well, it can easily form preferential channels, reduce the water body’s coverage, and thus, have a low oil recovery;
  • The distribution of remaining oil is influenced by the connection mode of fractures and caves and the development scheme, usually distributed at the top and edges of the model, as well as at the top of single- and multiple-fracture connected caves.

Author Contributions

Conceptualization, S.L. and Z.K.; methodology, S.L. and Z.K.; software, Z.K., Y.Z. and S.L.; formal analysis, S.L., Z.K. and Y.Z.; writing—original draft preparation, S.L.; writing—review and editing, Z.K., Y.Z. and S.L.; visualization, Y.Z. and S.L.; supervision, Z.K. and S.L. All authors have read and agreed to the published version of the manuscript.

Funding

This research is partially funded by the National Natural Science Foundation of China (Grant 52174025) and the Joint Fund for Enterprise Innovation and Development of NSFC (Grant U19B6003-02).

Data Availability Statement

Not applicable.

Acknowledgments

The authors would like to express their gratitude to the SINOPEC for permission to publish this work. We thank four anonymous reviewers for constructive comments that improved this manuscript.

Conflicts of Interest

The authors declare no conflict of interest.

References

  1. Guo, W.; Fu, S.; Li, A.; Xie, H.; Cui, S.; Nangendo, J. Experimental research on the mechanisms of improving water flooding in fractured-vuggy reservoirs. J. Pet. Sci. Eng. 2022, 213, 110383. [Google Scholar] [CrossRef]
  2. Li, Y.; Kang, Z.; Xue, Z.; Zheng, S. Theories and practices of carbonate reservoirs development in China. Pet. Explor. Dev. 2018, 45, 712–722. [Google Scholar] [CrossRef]
  3. Zhang, F.; An, M.; Yan, B.; Wang, Y. Modeling the depletion of fractured vuggy carbonate reservoir by coupling geomechanics with reservoir flow. In Proceedings of the SPE Reservoir Characterisation and Simulation Conference and Exhibition, Abu Dhabi, United Arab Emirates, 8–10 May 2017. [Google Scholar]
  4. Lu, A. Carbonate Fractured Vuggy Reservoir Engineering Method Research. Ph.D. Thesis, China University of Petroleum, Qingdao, China, 2007. [Google Scholar]
  5. Li, B.; Tan, X.; Wang, F.; Lian, P.; Gao, W.; Li, Y. Fracture and vug characterization and carbonate rock type automatic classification using X-ray CT images. J. Pet. Sci. Eng. 2017, 153, 88–96. [Google Scholar] [CrossRef]
  6. Wu, Y.-S.; Di, Y.; Kang, Z.; Fakcharoenphol, P. A multiple-continuum model for simulating single-phase and multiphase flow in naturally fractured vuggy reservoirs. J. Pet. Sci. Eng. 2011, 78, 13–22. [Google Scholar] [CrossRef]
  7. Yao, J.; Huang, Z.-Q. Fractured Vuggy Carbonate Reservoir Simulation; Springer: Berlin/Heidelberg, Germany, 2017. [Google Scholar]
  8. Neale, G.H.; Nader, W.K. The permeability of a uniformly vuggy porous medium. Soc. Pet. Eng. J. 1973, 13, 69–74. [Google Scholar] [CrossRef]
  9. Liu, S.; Zhang, Y.; Du, H.; Liu, J.; Zhou, Z.; Wang, Z.; Huang, K.; Pan, B. Experimental study on fluid flow behaviors of waterflooding fractured-vuggy oil reservoir using two-dimensional visual model. Phys. Fluids 2023, 35, 062106. [Google Scholar]
  10. Ju, X.; Zhao, X.; Zhou, B.; Zhang, R.; Wu, X.; Guo, D. Identification of reservoir water-flooding degrees via core sizes based on a drip experiment of the Zhenwu Area in Gaoyou Sag, China. Energies 2023, 16, 608. [Google Scholar] [CrossRef]
  11. Lu, G.; Zhang, L.; Liu, Q.; Xu, Q.; Zhao, Y.; Li, X.; Deng, G.; Wang, Y. Experiment analysis of remaining oil distribution and potential tapping for fractured-vuggy reservoir. J. Pet. Sci. Eng. 2022, 208, 109544. [Google Scholar] [CrossRef]
  12. Lyu, X.; Liu, Z.; Hou, J.; Lyu, T. Mechanism and influencing factors of EOR by N2 injection in fractured-vuggy carbonate reservoirs. J. Nat. Gas Sci. Eng. 2017, 40, 226–235. [Google Scholar] [CrossRef]
  13. Liu, Z.; Zhao, H.; Shi, H. Experimental study on stress monitoring in fractured-vuggy carbonate reservoirs before and after fracturing. J. Pet. Sci. Eng. 2022, 218, 110958. [Google Scholar] [CrossRef]
  14. Yang, W.; Zhang, D.; Lei, G. Experimental study on multiphase flow in fracture-vug medium using 3D printing technology and visualization techniques. J. Pet. Sci. Eng. 2020, 193, 107394. [Google Scholar] [CrossRef]
  15. Yang, W.; Zhang, D. Experimental study on multiphase flow in 3D-printed heterogeneous, filled vugs. J. Pet. Sci. Eng. 2022, 208, 109497. [Google Scholar] [CrossRef]
  16. Li, S.; Zhang, D. Development of 3-D curved fracture swarms in shale rock driven by rapid fluid pressure buildup: Insights from numerical modeling. Geophys. Res. Lett. 2021, 48, e2021GL092638. [Google Scholar] [CrossRef]
  17. Wang, H.; Wang, Z.; Jiang, Y.; Song, J.; Jia, M. New approach for the digital reconstruction of complex mine faults and its application in mining. Int. J. Coal Sci. Technol. 2022, 9, 43. [Google Scholar] [CrossRef]
  18. Chen, Y.; Zuo, J.; Liu, D.; Li, Y.; Wang, Z. Experimental and numerical study of coal-rock bimaterial composite bodies under triaxial compression. Int. J. Coal Sci. Technol. 2021, 8, 908–924. [Google Scholar] [CrossRef]
  19. Li, S.; Feng, X.-T.; Zhang, D.; Tang, H. Coupled thermo-hydro-mechanical analysis of stimulation and production for fractured geothermal reservoirs. Appl. Energy 2019, 247, 40–59. [Google Scholar] [CrossRef]
  20. Li, S.; Zhang, D. Three-dimensional thermoporoelastic modeling of hydrofracturing and fluid circulation in hot dry rock. J. Geophys. Res. Solid Earth 2023, 128, e2022JB025673. [Google Scholar] [CrossRef]
  21. Fadlelmula, M.M.; Fraim, M.; He, J.; Killough, J.E. Discrete Fracture-vug Network Modeling in Naturally Fractured Vuggy Reservoirs Using Multiple-Point Geostatistics: A Micro-Scale Case; SPE: Kuala Lumpur, Malaysia, 2015. [Google Scholar]
  22. Lei, G.; Liao, Q.; Zhang, D. A new analytical model for flow in acidized fractured-vuggy porous media. Sci. Rep. 2019, 9, 8293. [Google Scholar] [CrossRef]
  23. Li, S.; Kang, Z.; Feng, X.T.; Pan, Z.; Huang, X.; Zhang, D. Three-dimensional hydrochemical model for dissolutional growth of fractures in karst aquifers. Water Resour. Res. 2020, 56, e2019WR025631. [Google Scholar] [CrossRef]
  24. Wu, Y.-S.; Ehlig-Economides, C.; Qin, G.; Kang, Z.; Zhang, W.; Ajayi, B.; Tao, Q. A Triple-Continuum Pressure-Transient Model for a Naturally Fractured Vuggy Reservoir; SPE: Kuala Lumpur, Malaysia, 2007. [Google Scholar]
  25. Kang, Z.; Wu, Y.-S.; Li, J.; Wu, Y.; Zhang, J.; Wang, G. Modeling Multiphase Flow in Naturally Fractured Vuggy Petroleum Reservoirs; SPE: Kuala Lumpur, Malaysia, 2006. [Google Scholar]
  26. Zhang, N.; Yao, J.; Xue, S.; Huang, Z. Multiscale mixed finite element, discrete fracture–vug model for fluid flow in fractured vuggy porous media. Int. J. Heat Mass Transf. 2016, 96, 396–405. [Google Scholar] [CrossRef]
  27. Wang, M.; Cheung, S.W.; Chung, E.T.; Vasilyeva, M.; Wang, Y. Generalized multiscale multicontinuum model for fractured vuggy carbonate reservoirs. J. Comput. Appl. Math. 2020, 366, 112370. [Google Scholar] [CrossRef]
  28. Guo, J.-C.; Nie, R.-S.; Jia, Y.-L. Dual permeability flow behavior for modeling horizontal well production in fractured-vuggy carbonate reservoirs. J. Hydrol. 2012, 464, 281–293. [Google Scholar] [CrossRef]
  29. Jing, W.; Huiqing, L.; Zhengfu, N.; Zhang, H.; Cheng, H. Experiments on water flooding in fractured-vuggy cells in fractured-vuggy reservoirs. Pet. Explor. Dev. 2014, 41, 74–81. [Google Scholar]
  30. Jing, W.; Huiqing, L.; Jie, X.; Zhang, H. Formation mechanism and distribution law of remaining oil in fracture-cavity reservoir. Pet. Explor. Dev. 2012, 39, 624–629. [Google Scholar]
  31. Pruess, K. A General Purpose Numerical Simulator for Multiphase Fluid and Heat; LBL-29400; Lawrence Berkeley National Lab: Berkeley, CA, USA, 1991. [Google Scholar]
  32. Narasimhan, T.; Witherspoon, P. An integrated finite difference method for analyzing fluid flow in porous media. Water Resour. Res. 1976, 12, 57–64. [Google Scholar] [CrossRef]
  33. Zhang, K.; Wu, Y.-S.; Pruess, K. User’s Guide for TOUGH2-MP-a Massively Parallel Version of the TOUGH2 Code; Ernest Orlando Lawrence Berkeley National Laboratory: Berkeley, CA, USA, 2008. [Google Scholar]
  34. Wu, Y.-S. A virtual node method for handling well bore boundary conditions in modeling multiphase flow in porous and fractured media. Water Resour. Res. 2000, 36, 807–814. [Google Scholar] [CrossRef]
  35. Wu, Y.-S. MSFLOW: Multiphase Subsurface Flow Model of Oil, Gas and Water in Porous and Fractured Media with Water Shut-Off Capability, Documentation and User’s Guide; Twange Int.: Houston, TX, USA; Walnut Creek, CA, USA, 1998. [Google Scholar]
  36. Huber, R.; Helmig, R. Multiphase flow in heterogeneous porous media: A classical finite element method versus an implicit pressure-explicit saturation-based mixed finite element-finite volume approach. Int. J. Numer. Methods Fluids 1999, 29, 899–920. [Google Scholar] [CrossRef]
  37. MacDonald, R. Methods for numerical simulation of water and gas coning. Soc. Pet. Eng. J. 1970, 10, 425–436. [Google Scholar] [CrossRef]
  38. Peaceman, D.W. A new method for representing multiple wells with arbitrary rates in numerical reservoir simulation. SPE Reserv. Eng. 1995, 10, 253–258. [Google Scholar] [CrossRef]
  39. Tian, Y.; Xiong, Y.; Wang, L.; Lei, Z.; Zhang, Y.; Yin, X.; Wu, Y.-S. A compositional model for gas injection IOR/EOR in tight oil reservoirs under coupled nanopore confinement and geomechanics effects. J. Nat. Gas Sci. Eng. 2019, 71, 102973. [Google Scholar] [CrossRef]
  40. Wu, Y.-S. Numerical simulation of single-phase and multiphase non-Darcy flow in porous and fractured reservoirs. Transp. Porous Media 2002, 49, 209–240. [Google Scholar] [CrossRef]
  41. Pan, L. User Information Document for WinGridder Version 3.0; Ernest Orlando Lawrence Berkeley National Laboratory: Berkeley, CA, USA, 2007. [Google Scholar]
  42. Li, S.; Zhang, K.; Wang, Y. Use WinGridder grid generator to achieve the fine description of complex geological features. Geotech. Investig. Surv. 2012, 40, 37–40. [Google Scholar]
  43. Li, S.; Zhang, D.; Li, X. A new approach to the modeling of hydraulic-fracturing treatments in naturally fractured reservoirs. SPE J. 2017, 22, 1064–1081. [Google Scholar] [CrossRef]
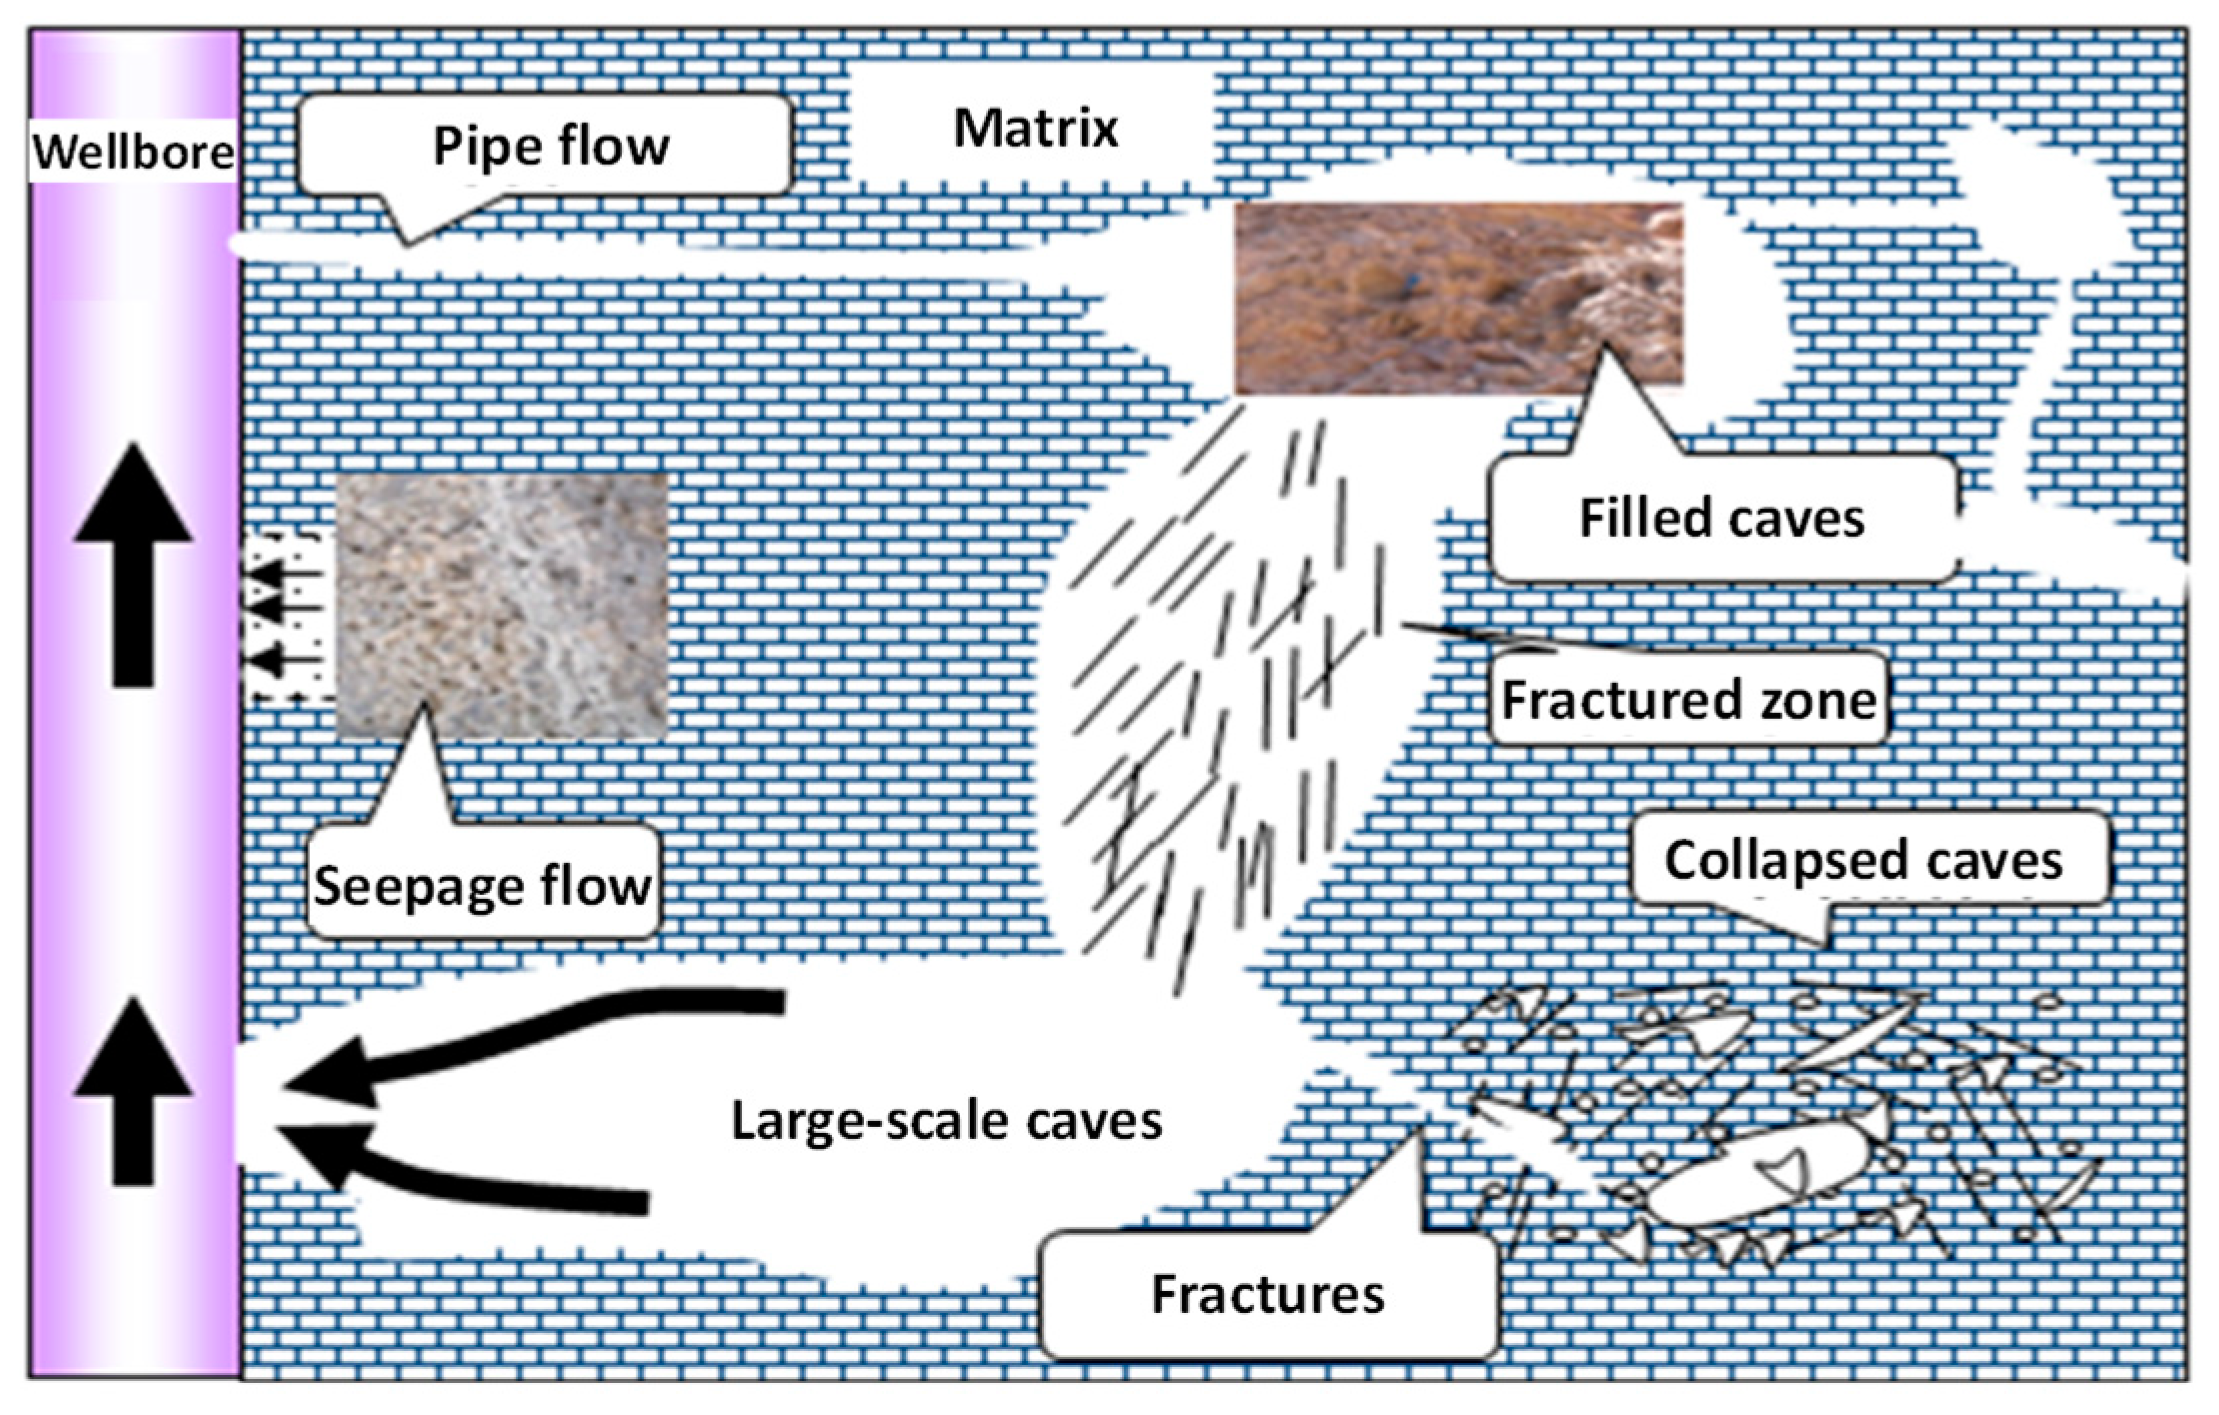
Figure 1. Schematic of the characteristics of the fluid flow through multiscale fractures and caves within the fractured-vuggy reservoirs.
Water 15 03687 g001
Figure 2. Space discretization and geometry data in the integral finite difference method [31].
Water 15 03687 g002
Figure 3. Snapshots of the remaining oil in the cylinders with different porous volume numbers (PVs): (a) 0.0 PVs; (b) 0.25 PVs; (c) 0.5 PVs; and (d) 1.0 PVs.
Water 15 03687 g003
Figure 4. Comparison of oil production rate and oil recovery between numerical and experimental results.
Water 15 03687 g004
Figure 5. The workflow of modeling and discretization of a typical outcrop of fractured vuggy reservoirs: (a) an outcrop picture of a fractured-vuggy reservoir; (b) digital description of the fractures and caves; (c) domain discretization; and (d) digital extraction of the fractures and caves using computational grids.
Water 15 03687 g005
Figure 6. Initial state of the studied domain: (a) pressure distribution and (b) oil saturation distribution of oil phase.
Water 15 03687 g006
Figure 7. Relative permeability curve for (a) fractures and (b) filled caves.
Water 15 03687 g007
Figure 8. Oil saturation distribution of (a) edge water and (b) bottom water. Note that the grey rectangle zone denotes a production well and the red arrow denotes fluid extraction from the well.
Water 15 03687 g008
Figure 9. Comparison of cumulative oil production between bottom and edge water drive.
Water 15 03687 g009
Figure 10. Comparison of the response of water cut between bottom and edge water drive.
Water 15 03687 g010
Figure 11. Comparison of oil production rate between bottom and edge water drive.
Water 15 03687 g011
Figure 12. Oil distributions with various cave permeabilities: (a) 100 mD, (b) 5 D, and (c) 10 D. Note that the red arrow denotes fluid extraction from the well.
Water 15 03687 g012
Figure 13. Comparison of cumulative oil production between different cave permeabilities.
Water 15 03687 g013
Figure 14. Comparison of water cut history between different cave permeabilities.
Water 15 03687 g014
Figure 15. Comparison of oil production rate between different cave permeabilities.
Water 15 03687 g015
Figure 16. Oil distributions with various fracture permeabilities: (a) 100 mD, (b) 5 D, and (c) 10 D. Note that the red arrow denotes fluid extraction from the well.
Water 15 03687 g016
Figure 17. Comparison of cumulative oil production between different fracture permeabilities.
Water 15 03687 g017
Figure 18. Comparison of water cut history between different fracture permeabilities.
Water 15 03687 g018
Figure 19. Comparison of oil production rate between different fracture permeabilities.
Water 15 03687 g019
Disclaimer/Publisher’s Note: The statements, opinions and data contained in all publications are solely those of the individual author(s) and contributor(s) and not of MDPI and/or the editor(s). MDPI and/or the editor(s) disclaim responsibility for any injury to people or property resulting from any ideas, methods, instructions or products referred to in the content.