1. Introduction
In recent years, a surge in hydrological drought events has been observed worldwide [
1]. These escalating drought occurrences posed substantial risks and economic implications, presenting pressing challenges to both society and the environment. The evolution of hydrological drought is no longer solely influenced by climatic anomalies. Instead, it has become increasingly complex due to direct human water use activities. This new paradigm underscored the vital role of human actions in shaping drought patterns and emphasized the necessity for advanced and adaptable water resource management strategies to tackle evolving hydrological drought challenges [
2].
Over the recent decades, extensive research has explored the development of meteorological and hydrological droughts and their influencing factors. The studies consistently highlighted the profound influence of climate change and human activities in altering the occurrence patterns and characteristics of hydrological droughts [
3,
4]. For example, Wada et al. [
3] revealed the significant role of human water usage activities in worsening hydrological droughts. He et al. [
4] reported that severe drought events were at least twice as likely to occur in California due to human activities and water use. Yuan et al. [
5] showed that anthropogenic interventions reduced the correlation between hydrological and meteorological droughts from 1961 to 2010. Currently, there is limited scholarly research dedicated to unraveling the propagation mechanisms from meteorological drought to hydrological drought [
6]. For example, Zhao et al. [
7] found a delay of approximately 127 days between meteorological and hydrological droughts in the JRB in northwestern China using interevent time and volumetric criterion methods. Huang et al. [
8] unveiled a significant positive correlation between hydrological and meteorological droughts across various time scales. Lorenzo-Lacruz et al. [
9] uncovered two primary response modes of hydrological drought to meteorological drought across 187 watersheds in the Iberian Peninsula. They identified that the northern watersheds demonstrated a peak response pattern with heightened hydrological sensitivity, whereas the central and southern watersheds exhibited a sustained response pattern with greater sensitivity to meteorological drought. Furthermore, Van et al. [
10] emphasized the significance of climate and groundwater system responsiveness in shaping the progression of hydrological drought. Their work demonstrated that climate, subsurface conditions, and human activities exert considerable influence on drought propagation timelines. However, existing research predominantly concentrated on an annual time scale, overlooking investigations into drought transmission across different seasons [
11,
12,
13].
The study of drought propagation has sparked robust scholarly discourse and has been a focal point in the hydrological community over the past decade. To examine the linkage between meteorological and hydrological droughts, the SPEI and SRI were widely acknowledged and adopted across diverse scientific and practical domains [
14]. For example, Um et al. [
15] assessed the relationship between hydrological, meteorological, and agricultural droughts using the SPEI, SRI, and standardized soil moisture index (SSMI) in the Yangtze River basin, respectively. Yuan et al. [
16] used the standardized supply–demand water index (SSDI) and water balance model to describe the linkage between meteorological and hydrological droughts. Tang et al. [
17] investigated the dynamics of meteorological and hydrological droughts using the SPI and SRI.
In predicting hydrological droughts, it is also necessary to use land surface hydrological models to transfer climate anomaly information into hydrological variables. The temporal and spatial resolution of coupled-model forecast products has been increasing in recent years, and the use of coupled-model forecast products to drive hydrological models for hydrological drought prediction has been widely used. Commonly used hydrological models include VIC, SWAT [
18], and the Xin’an River model, etc. Chen et al. [
19] conducted a comparative analysis in the upper Yangtze River based on SWAT, VIC, and HBV hydrological models and found that the simulation effect of the three models for annual runoff was better, with an average error of less than 5%. Among the models, the SWAT model simulated runoff closest to the average value, indicating that SWAT was more effective in predicting annual runoff than the average value. They also found that the average error of SWAT in the upper Yangtze River was lower than the average value of SWAT and that the average error of SWAT in the lower Yangtze River was higher than the average error of SWAT. The SWAT model simulated the runoff closest to the average value of the model, indicating that SWAT has good applicability in the JRB.
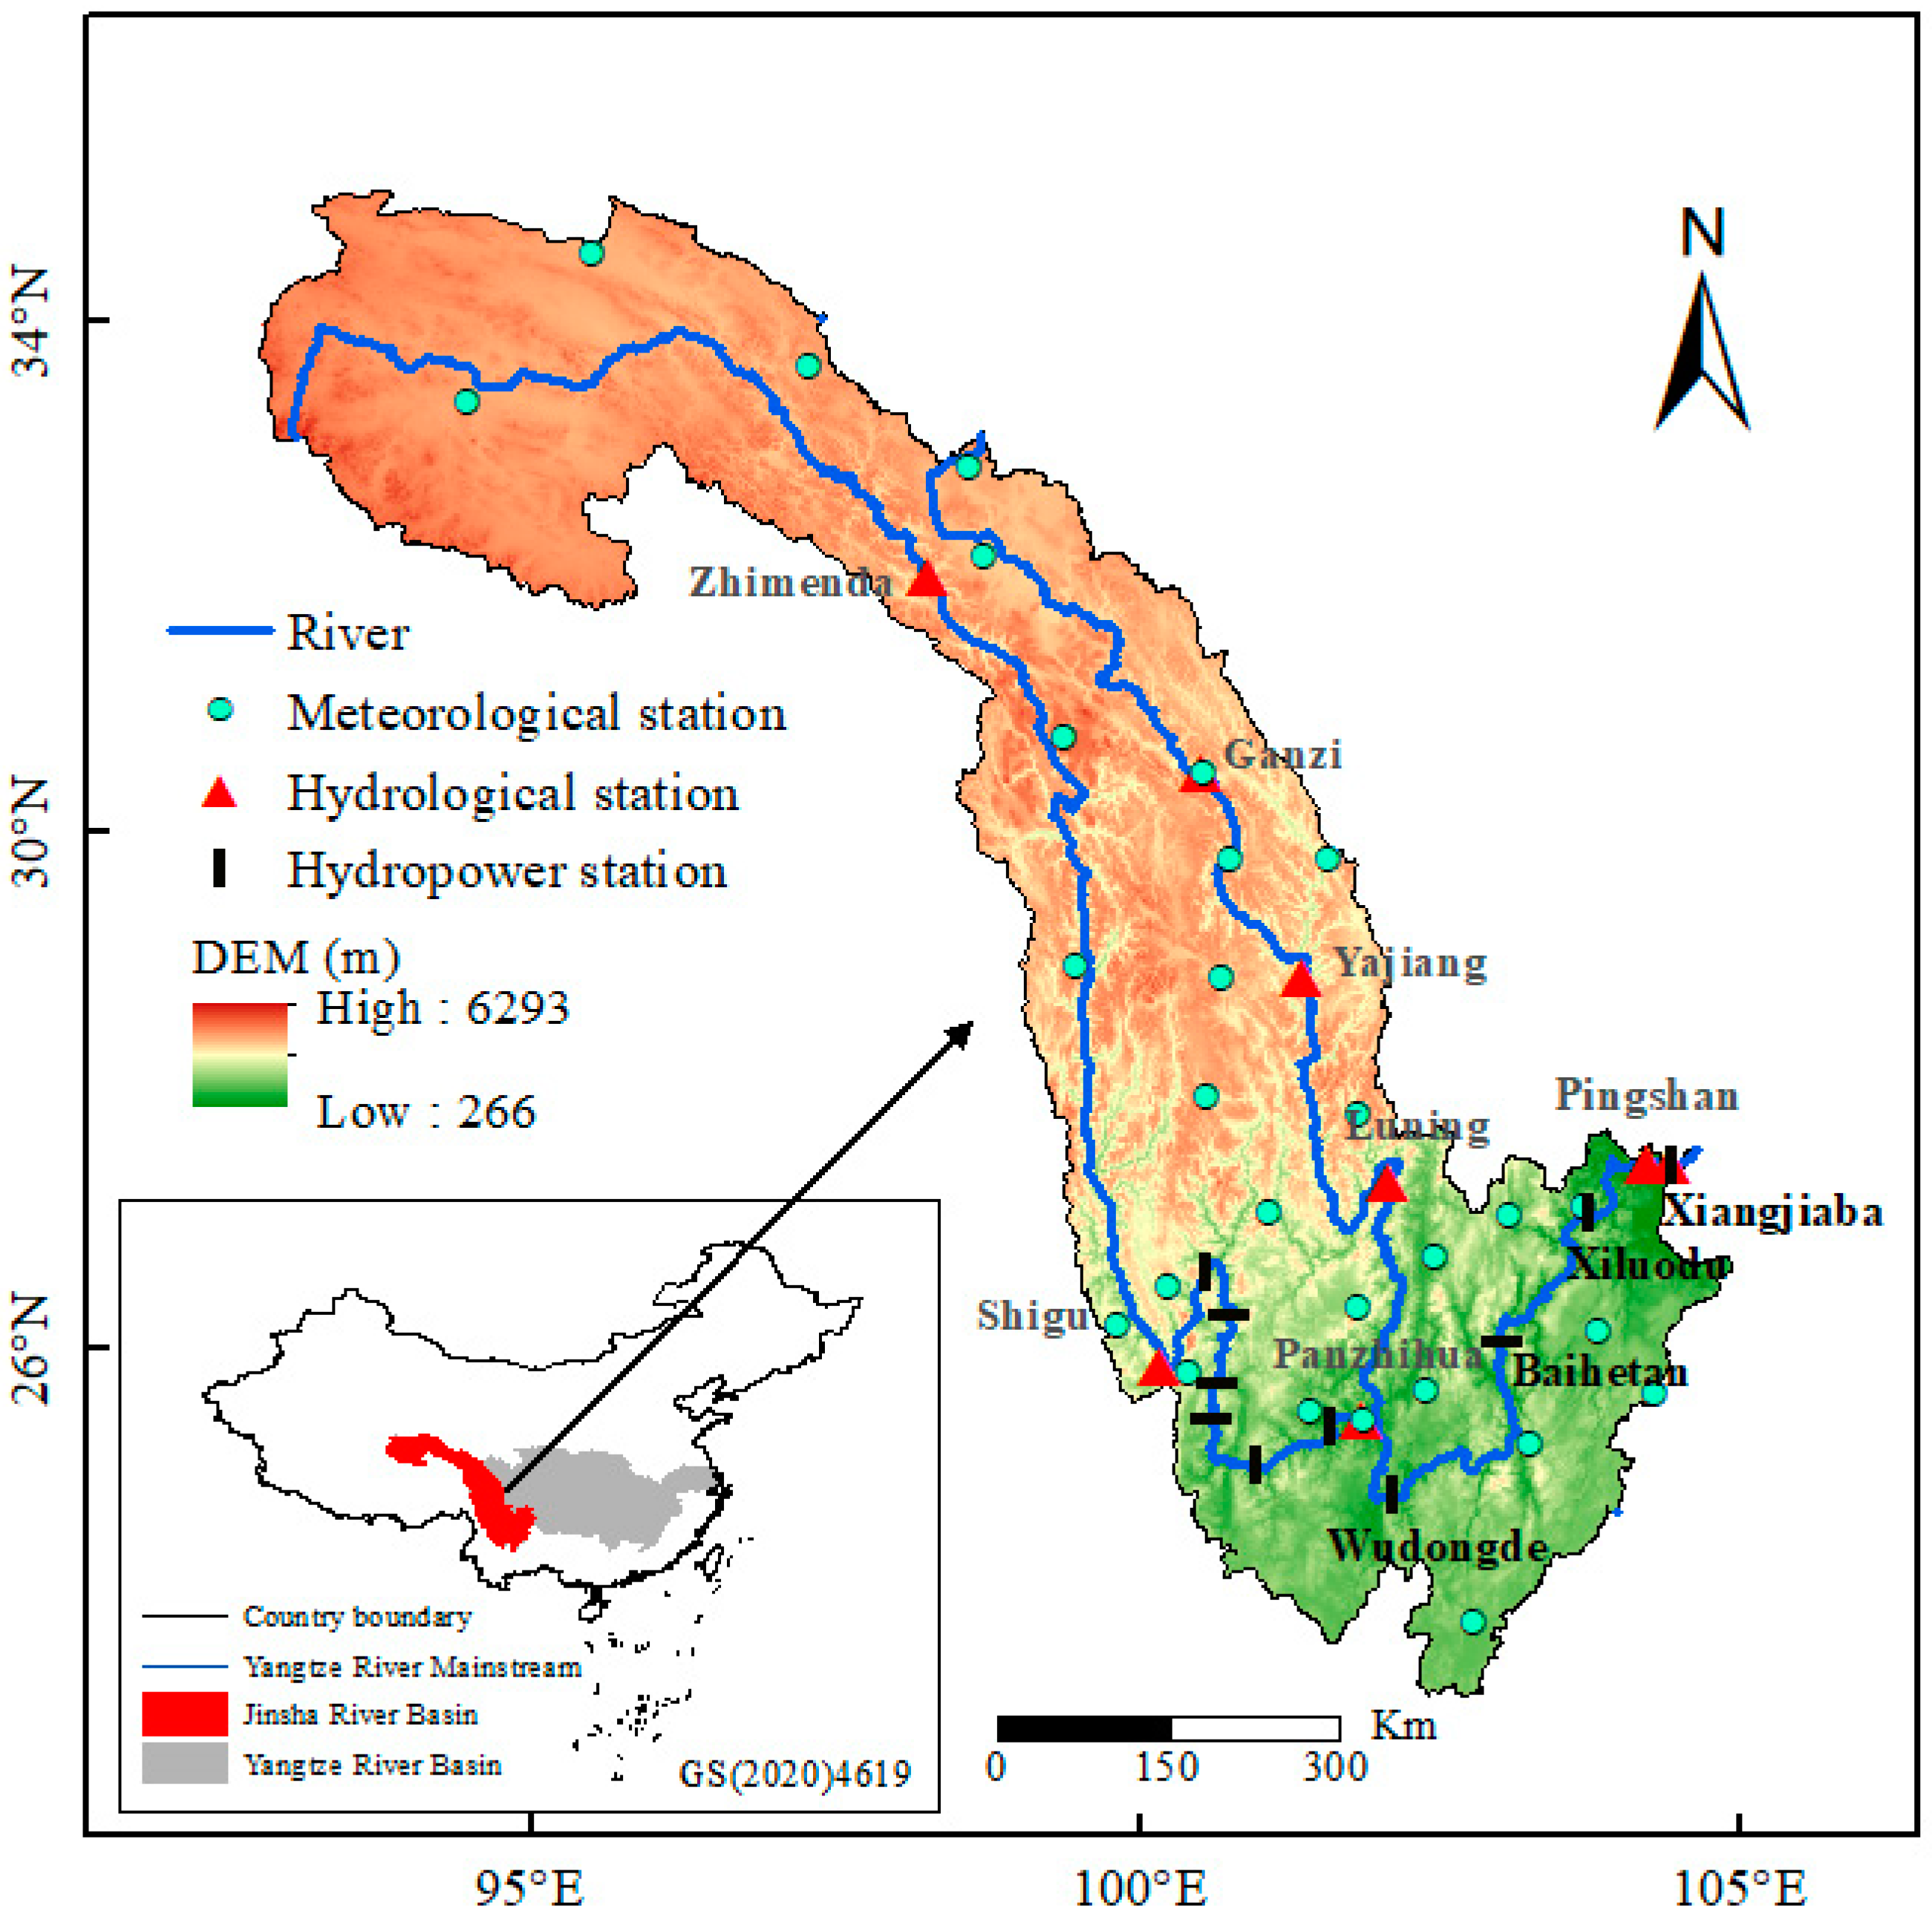
The JRB is extremely rich in terms of hydropower resources in China, and the construction of a national hydropower base on the Jinsha River has been developing rapidly, with the planning of a multi-stage terraced hydropower development [
20]. There are currently 25 under-construction and completed tertiary hydropower plants, including four world-class hydropower plants (Xiangjiaba, Xiluodu, Baihetan, and Wudongde), with the total installed capacity of the four hydropower plants exceeding two Three Gorges hydropower plants. However, in the recent past, hydrological drought events were frequent in the JRB, seriously affecting the power generation and ecological benefits of giant reservoir complexes. To enhance drought prevention and drought management in the basin, it is particularly vital to investigate the hydrological evolution of drought in the JRB. For example, Zhang et al. [
21] extensively examined how the Jinsha River Reservoir influences runoff, flooding, and drought patterns. By combining long short-term memory (LSTM) modeling with flood–drought assessment techniques, their study revealed important findings. They showed that dam operations alter drought duration and severity, leading to a reduction in extreme droughts. The research also highlighted the reservoir’s positive contribution to regulating water resources. Currently, a lack of knowledge about the drought evolution process in a changing environment is a problem in the research of drought propagation in the JRB. Hence, examining the transmission and impact mechanisms of meteorological drought on hydrological drought in the JRB at a monthly scale within evolving conditions becomes crucial. This investigation can unveil the occurrence process and mechanisms of hydrological drought in the region. Consequently, this information can serve as a foundation for developing an early warning and predictive system for hydrological droughts, built upon the analysis of meteorological droughts.
This paper presents a comprehensive analysis and insightful discussion of the spatiotemporal change patterns in climate elements and the intricate transformation of meteorological drought into hydrological drought in the JRB. This study’s two main goals are as follows: (1) Firstly, to conduct an in-depth study of the evolution of drought patterns in the JRB and the role of climate change and human activities in influencing them. (2) To conduct a rigorous investigation into the propagation patterns from meteorological drought to hydrological drought within the basin under the influence of a changing environment. The purpose of this paper is to construct a technical system for forecasting hydrological drought in the JRB using the SPEI and SRI, as a way to study the expansion pattern and connection between meteorological drought and vertical drought built in the JRB, and using the SWAT hydrological model, to analyze how changing environmental conditions such as climate change, precipitation, and temperature affect hydrological drought, in order to provide important information for managers.
3. Results
3.1. Spatial and Temporal Distribution Characteristics of Precipitation and Air Temperature
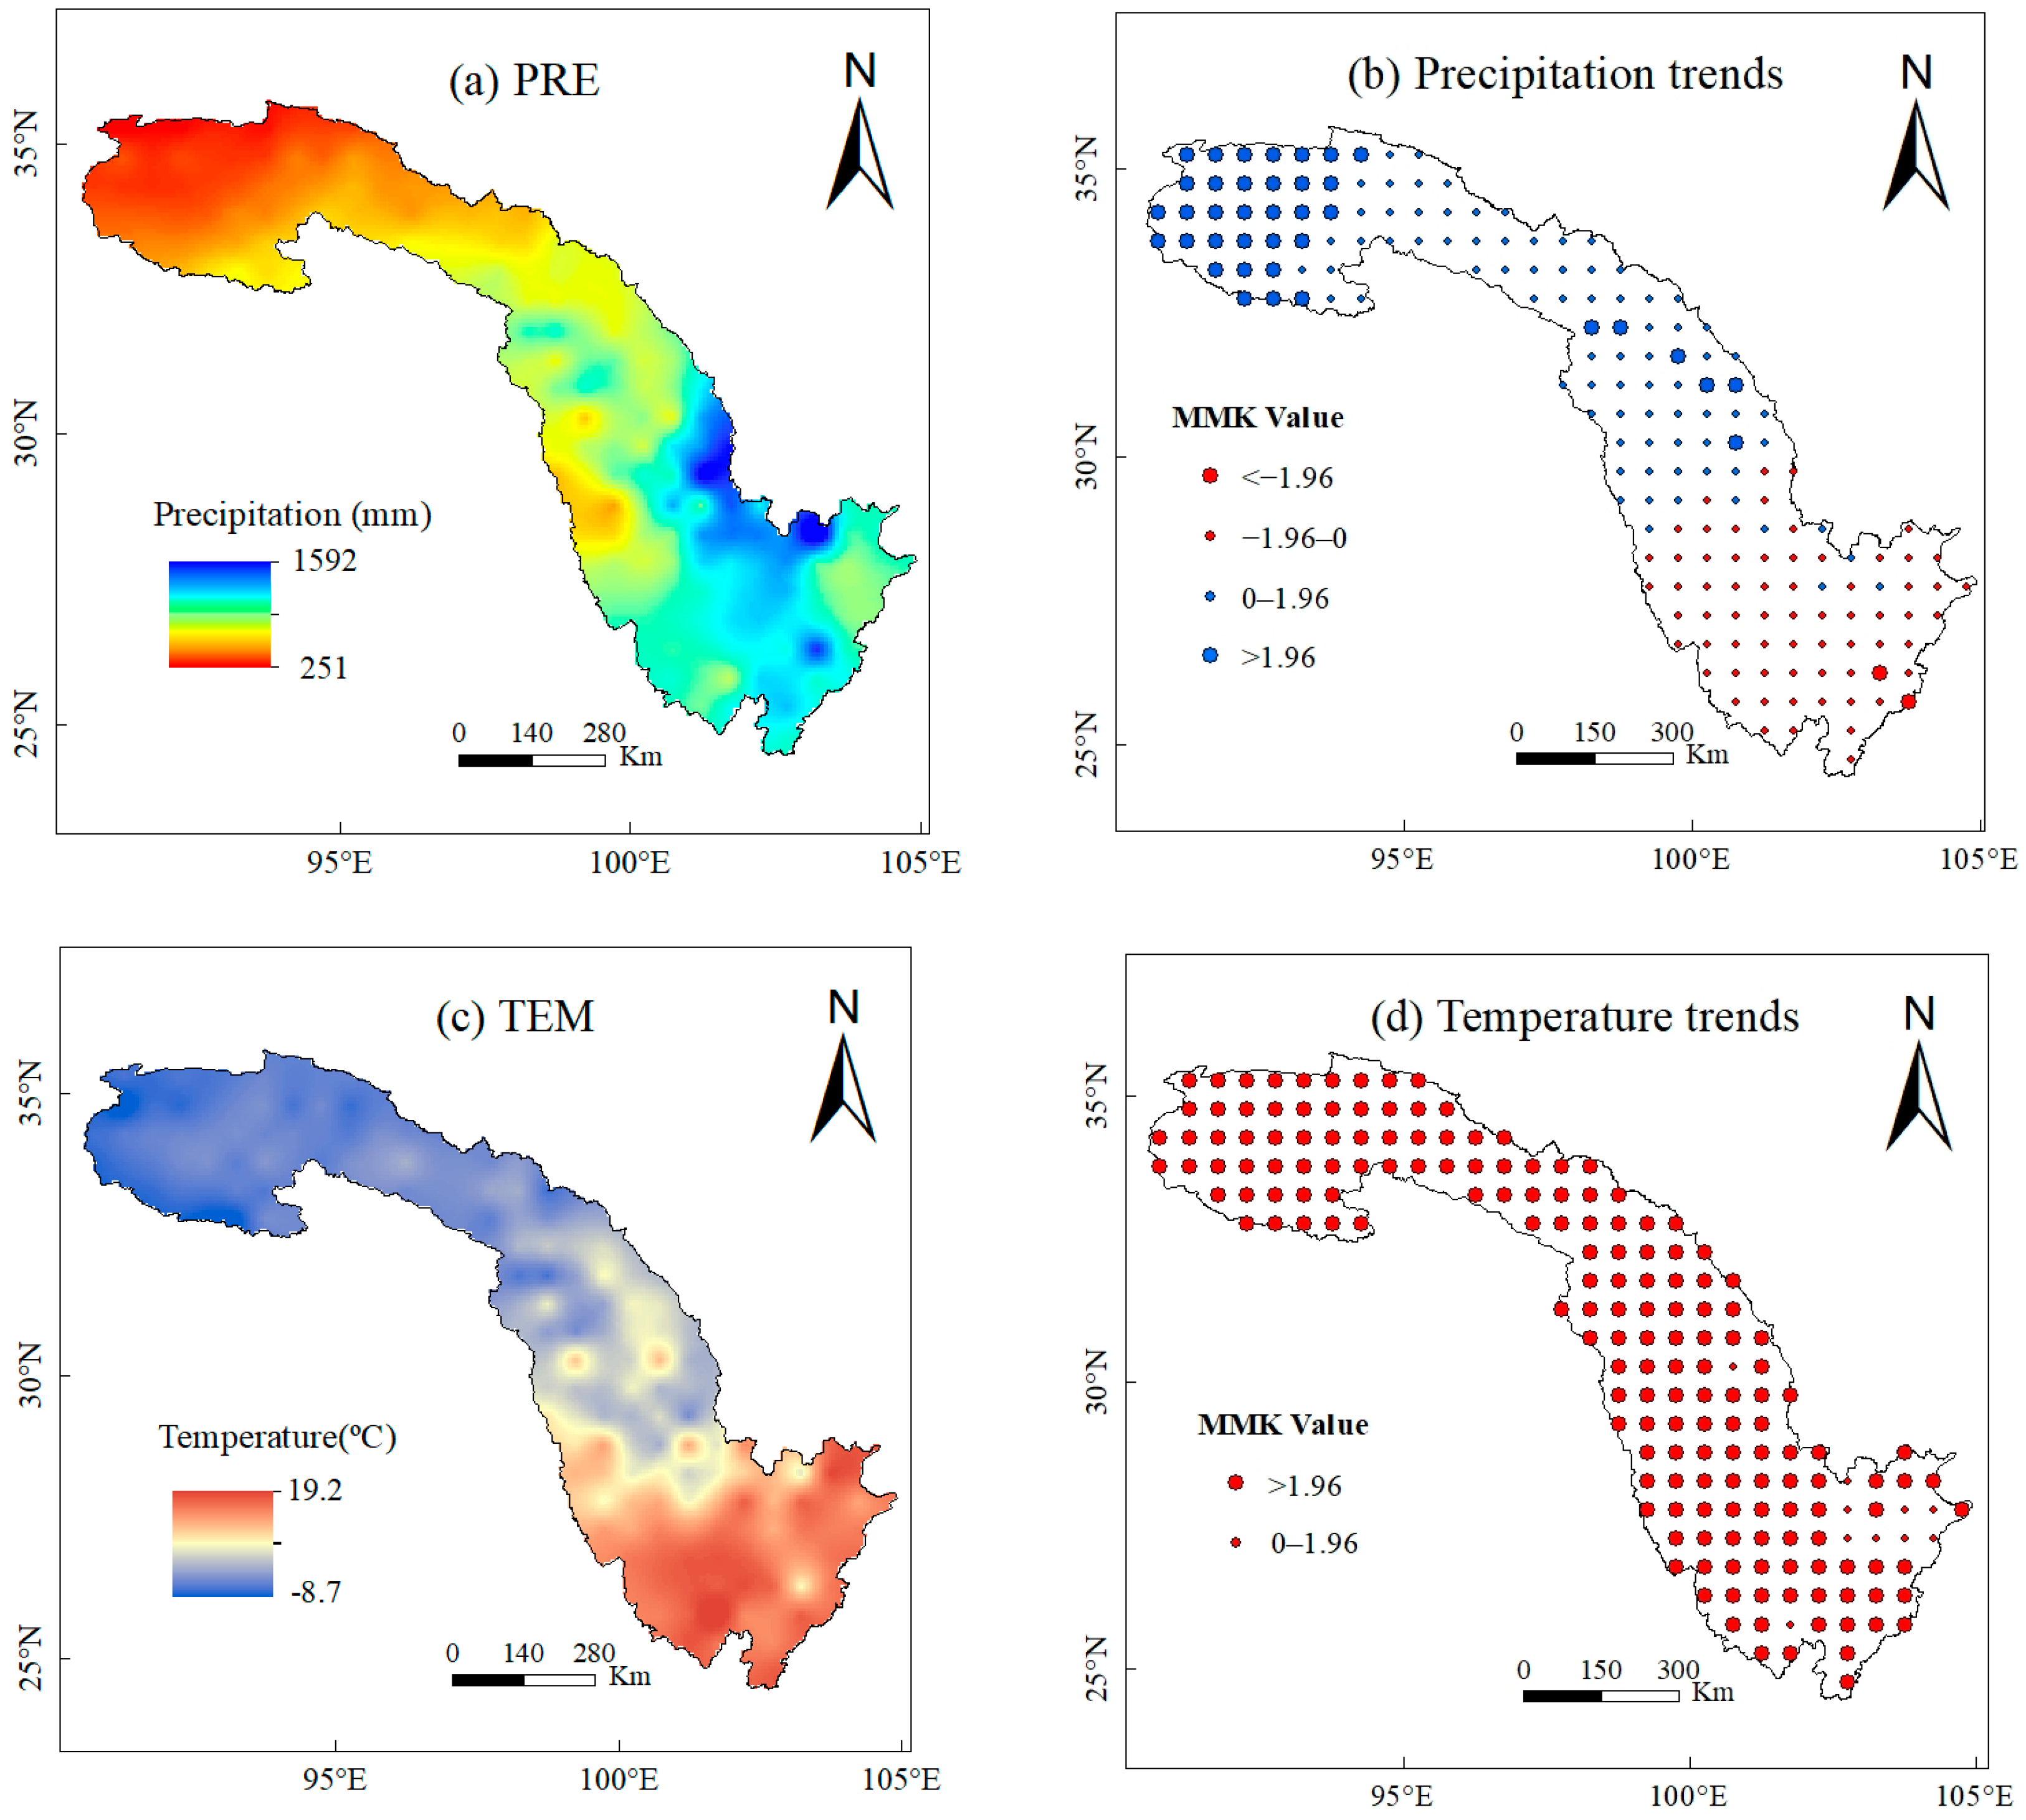
As shown in
Figure 2, the spatial dispersion of the annual average precipitation within the JRB exhibited a discernible gradient, characterized by a gradual decline in precipitation levels as one progresses from the southeastern reaches to the northwestern reaches. The area north of the lower Yalong River exhibited higher annual precipitation values, while the Yangtze River source area experienced consistently low precipitation, with average annual values below 400 mm in many years. According to the distribution pattern, precipitation rose in the upper ranges while falling in the middle and lower regions. It is worth highlighting that the Yangtze River source region showed a remarkable and significant rise in precipitation, as determined using the MMK significance test. Conversely, there were only a limited number of cells in the downstream region that demonstrated a noteworthy significant decrease.
Unlike the spatial distribution of precipitation, the spatial distribution of mean annual temperature in the JRB showed an increasing trend from north to south. The northwestern part of the Yunnan–Guizhou Plateau, characterized by a dry and hot river valley landscape, consistently demonstrated higher annual mean temperatures, reaching 19.2 °C. Conversely, the Yangtze River source area displayed lower annual mean temperatures, dropping below −5 °C. The spatial distribution of the annual mean temperature trend indicated a significant increase across the basin, with only a few grid points in the downstream area exhibiting insignificant temperature trends. Approximately 95% of the basin area passed the MMK significance test, confirming a significant temperature increase. These findings indicated a distinct climate change pattern in the JRB, characterized by significant fluctuations and a notable surge in temperature.
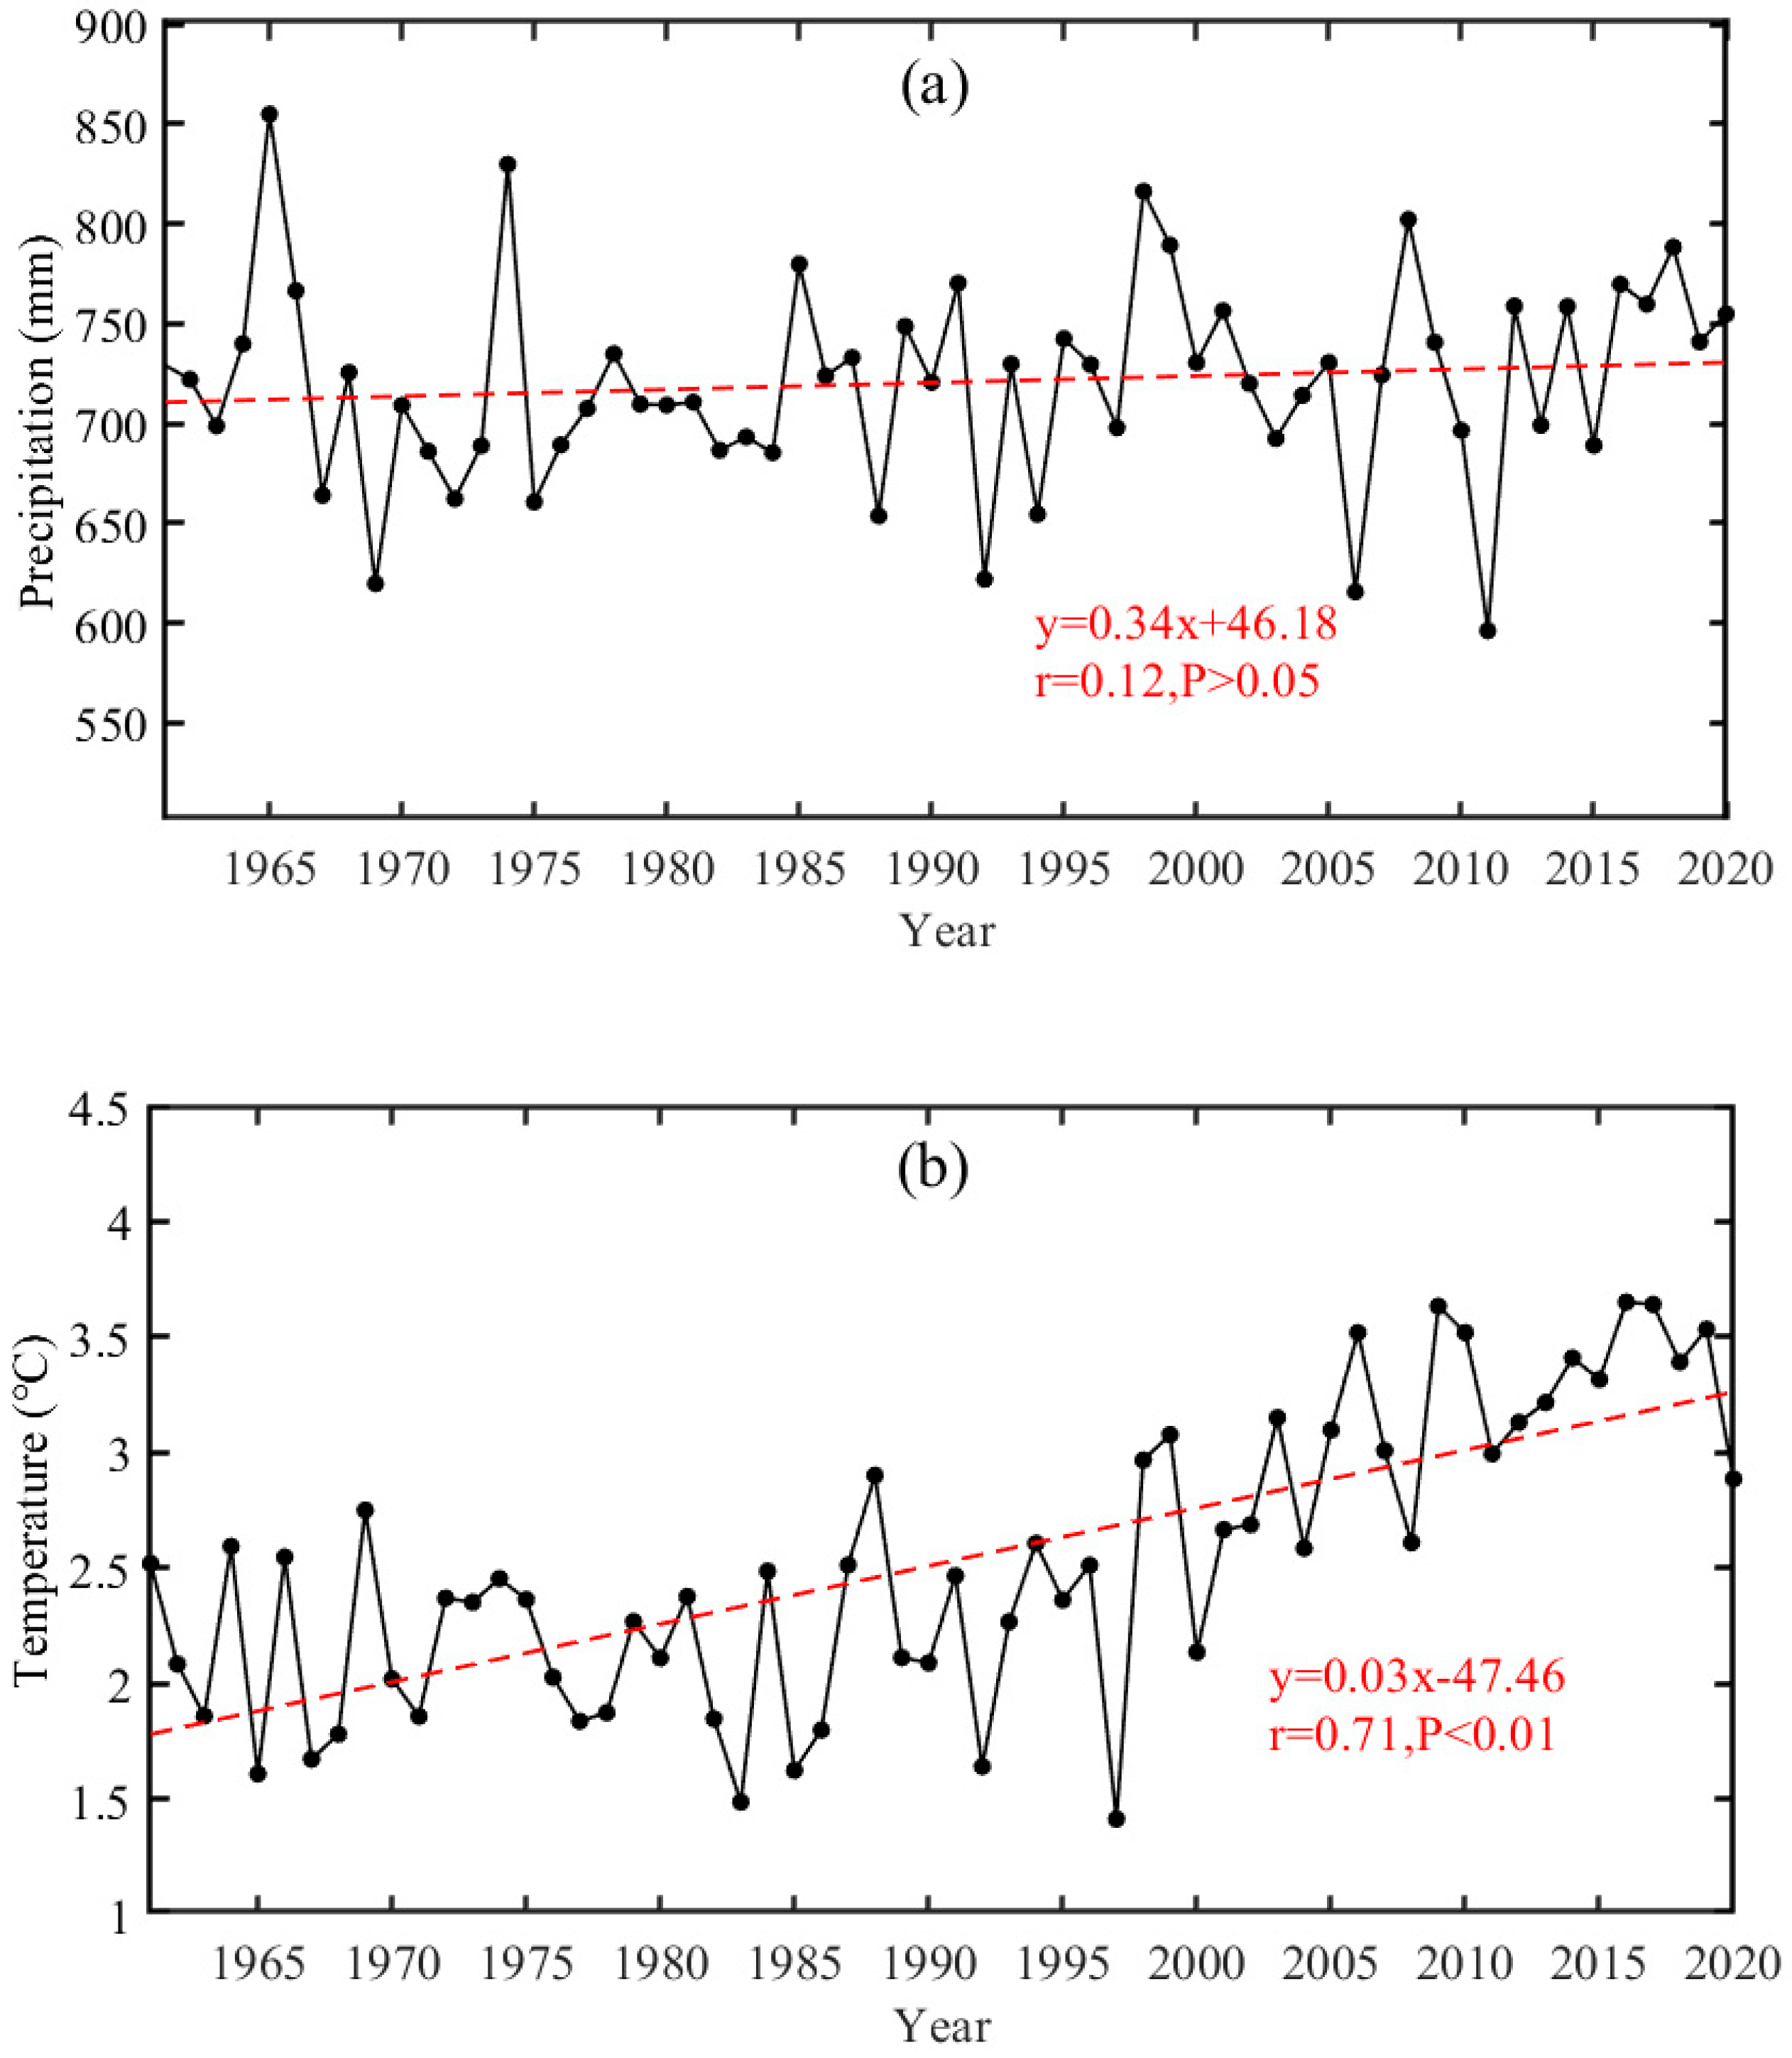
The time series of temperature and precipitation in the JRB from 1961 to 2020, along with their linear fits, are depicted in
Figure 3. The average surface temperature of the basin ranged from 1 to 4 °C, displaying a notable increasing trend over the years. The correlation coefficient of 0.71 indicated a significant positive relationship, passing the significance level test of 0.01. On the other hand, the mean precipitation at the basin surface did not exhibit a significant increasing or decreasing trend, although it demonstrated considerable interannual variability.
As shown in
Figure 3a, it becomes evident that over the previous two decades, the precipitation in the JRB was notably lower than the average in 2006 and 2011, at only around 600 mm. It is worth noting that corresponding records indicate the occurrence of the most severe drought in Sichuan since 1951 during the summer of 2006, along with an extreme hydrological drought situation in 2011 in the JRB. These instances suggest a higher likelihood of drought events in years characterized by low precipitation. Exploratory analyses of precipitation and temperature trends in the JRB provided valuable information for understanding changing climate dynamics and their potential impact on hydrologic processes.
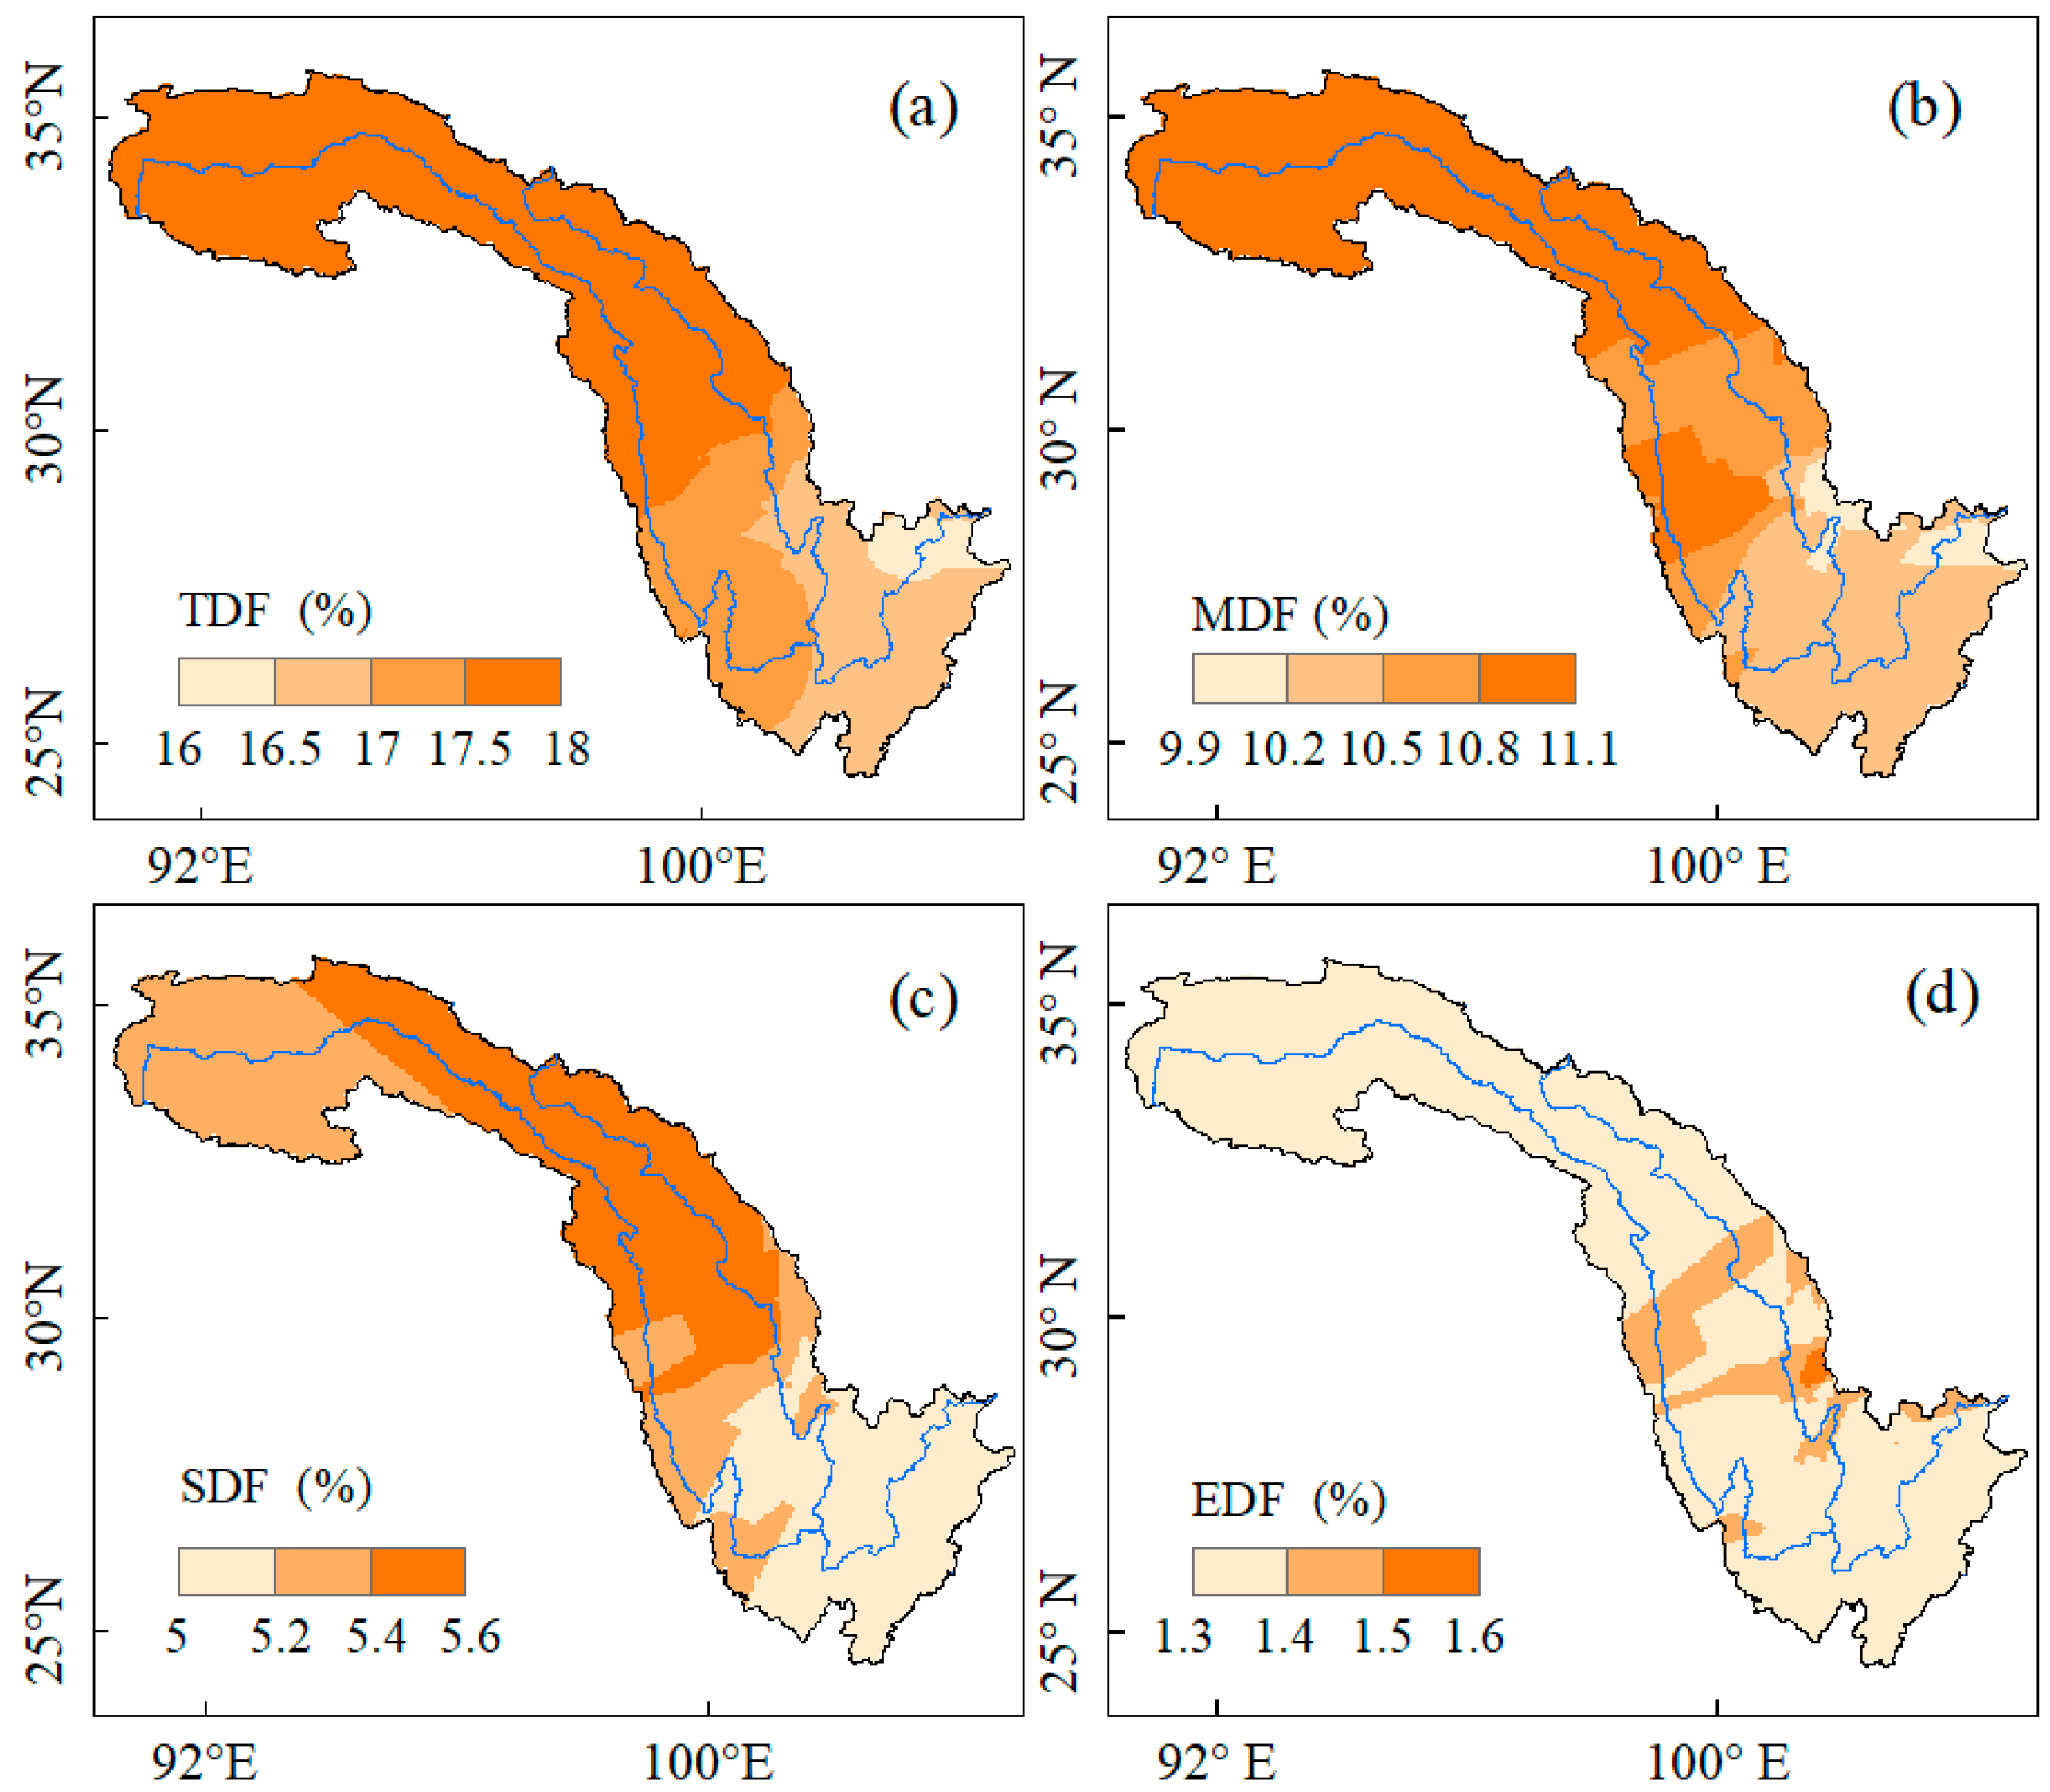
Figure 4 visually presents the spatial dispersion of drought frequencies corresponding to varying degrees of meteorological droughts throughout the designated timeframe. As depicted in
Figure 4a, the JRB exhibited a high frequency of drought events, with a total drought frequency ranging from 16.3 to 17.9%. The spatial pattern displayed a decreasing trend from Jinsha River, exceeding 17.5%. The lower frequency of drought in the southeastern edge of the Sichuan basin can be attributed to the unique topography of the district. Regarding the occurrence of moderate drought frequency (
Figure 4b), it followed a similar spatial pattern to the total drought frequency, with a range of 9.9% to 11.1%. This indicated that moderate drought was the most prevalent class among all drought categories. In terms of severe drought frequency (
Figure 4c), the upper part of the JRB continued to experience a higher occurrence, with a frequency ranging from 5.2% to 5.6%. Extreme droughts occurred between 1.3% and 1.6% of the time in the JRB, with the Jiulong area of Sichuan exhibiting a higher frequency of over 1.5%.
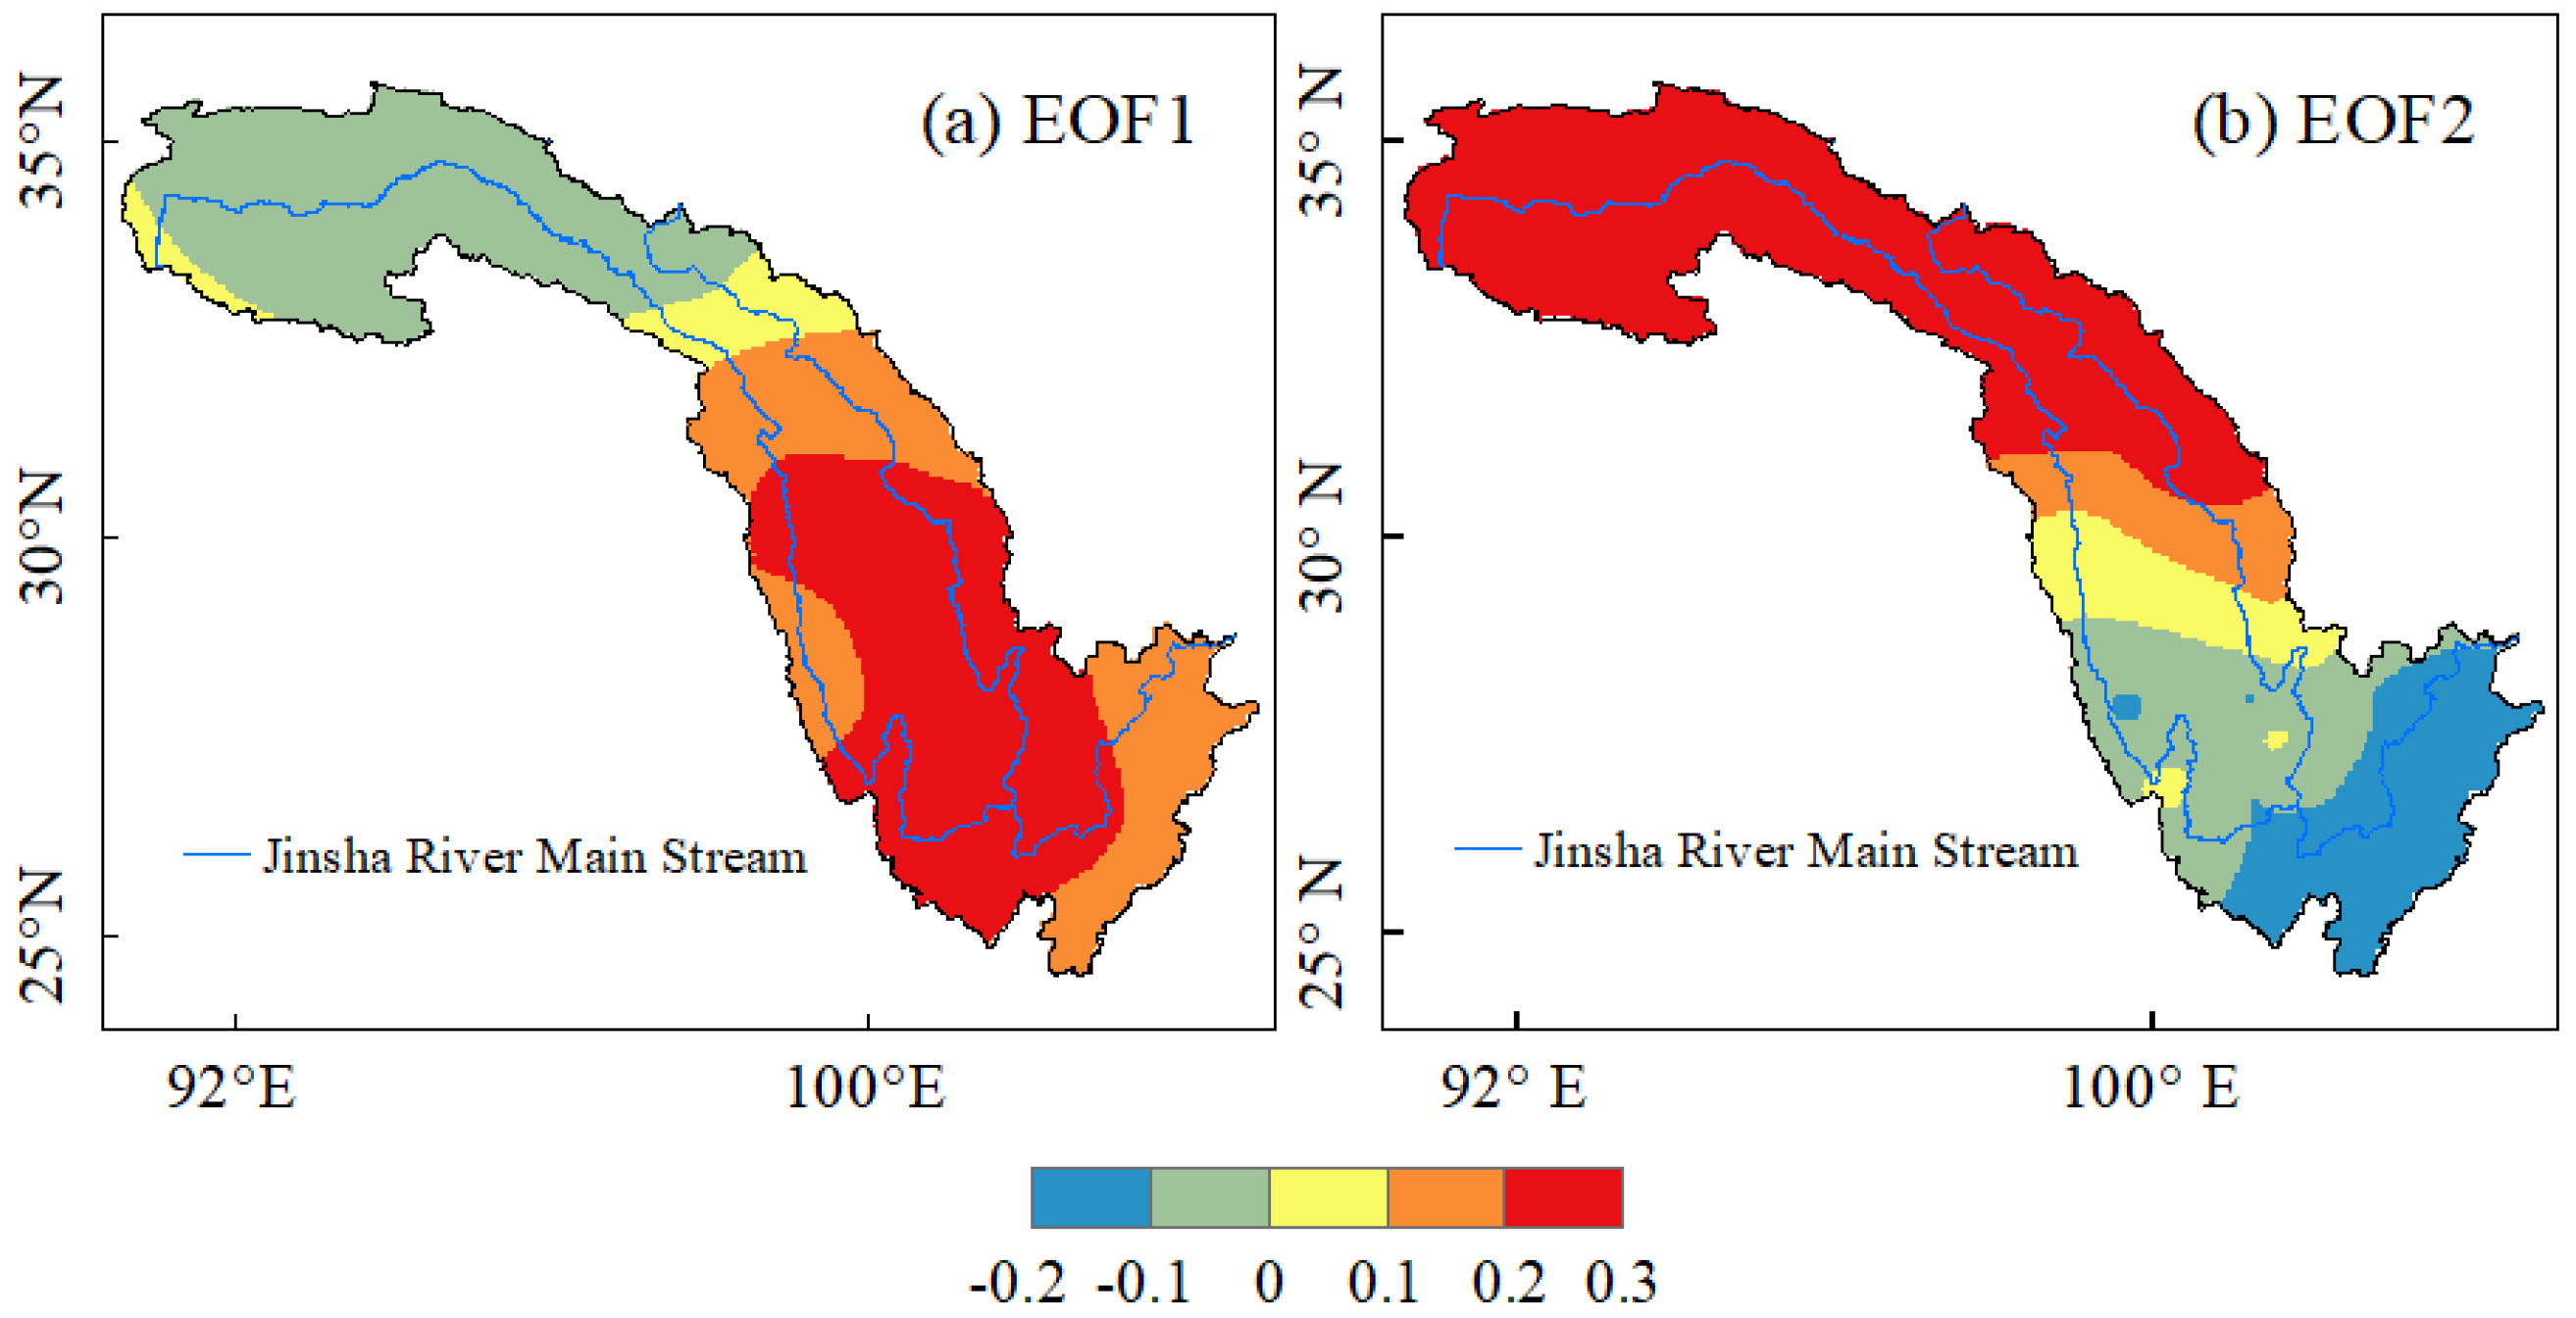
To examine the spatial and temporal distribution of SPEI-12 in various regions of the watershed, the first two models were chosen. The spatial modes were determined using kriging interpolation and are presented in
Figure 5.
Figure 5a depicts the first spatial mode of SPEI-12, referred to as EOF1, which contributes 32.0% to the cumulative variance and was considered the primary type of spatial distribution for meteorological drought in the JRB. The spatial coefficients corresponding to EOF1 range from −0.1 to 0.3, with extreme points found in the middle and upper reaches of the Jinsha River and the middle and lower reaches of the Yalong River. These areas represent the sensitive centers for changes in dryness and wetness under this mode. The spatial coefficients of EOF1 in the middle and lower reaches of the JRB are consistently around 0.2, indicating a consistent pattern of dry and wet changes in these regions. However, the spatial coefficients of EOF1 in the upstream Yangtze River source area are negative, suggesting differences in dry and wet changes compared with the middle and lower reaches. In
Figure 5b, the second spatial mode (EOF2) contributes 19.7% to the variance, indicating another typical pattern of meteorological drought distribution in the JRB. EOF2 reveals that the spatial coefficient in the northern part of the basin is greater than 0.2, indicating a higher consistency in dry and wet changes in that region. However, the spatial coefficient in the southern region is negative, with the downstream region exhibiting a coefficient below −0.1. This indicates a spatial distribution pattern of a wet north and dry south or a dry north and wet south in the basin under the EOF2 mode. The analysis of the spatial modes provides insights into the dominant spatial patterns of meteorological drought in the JRB and highlights the contrasting dry and wet conditions among different regions within the basin.
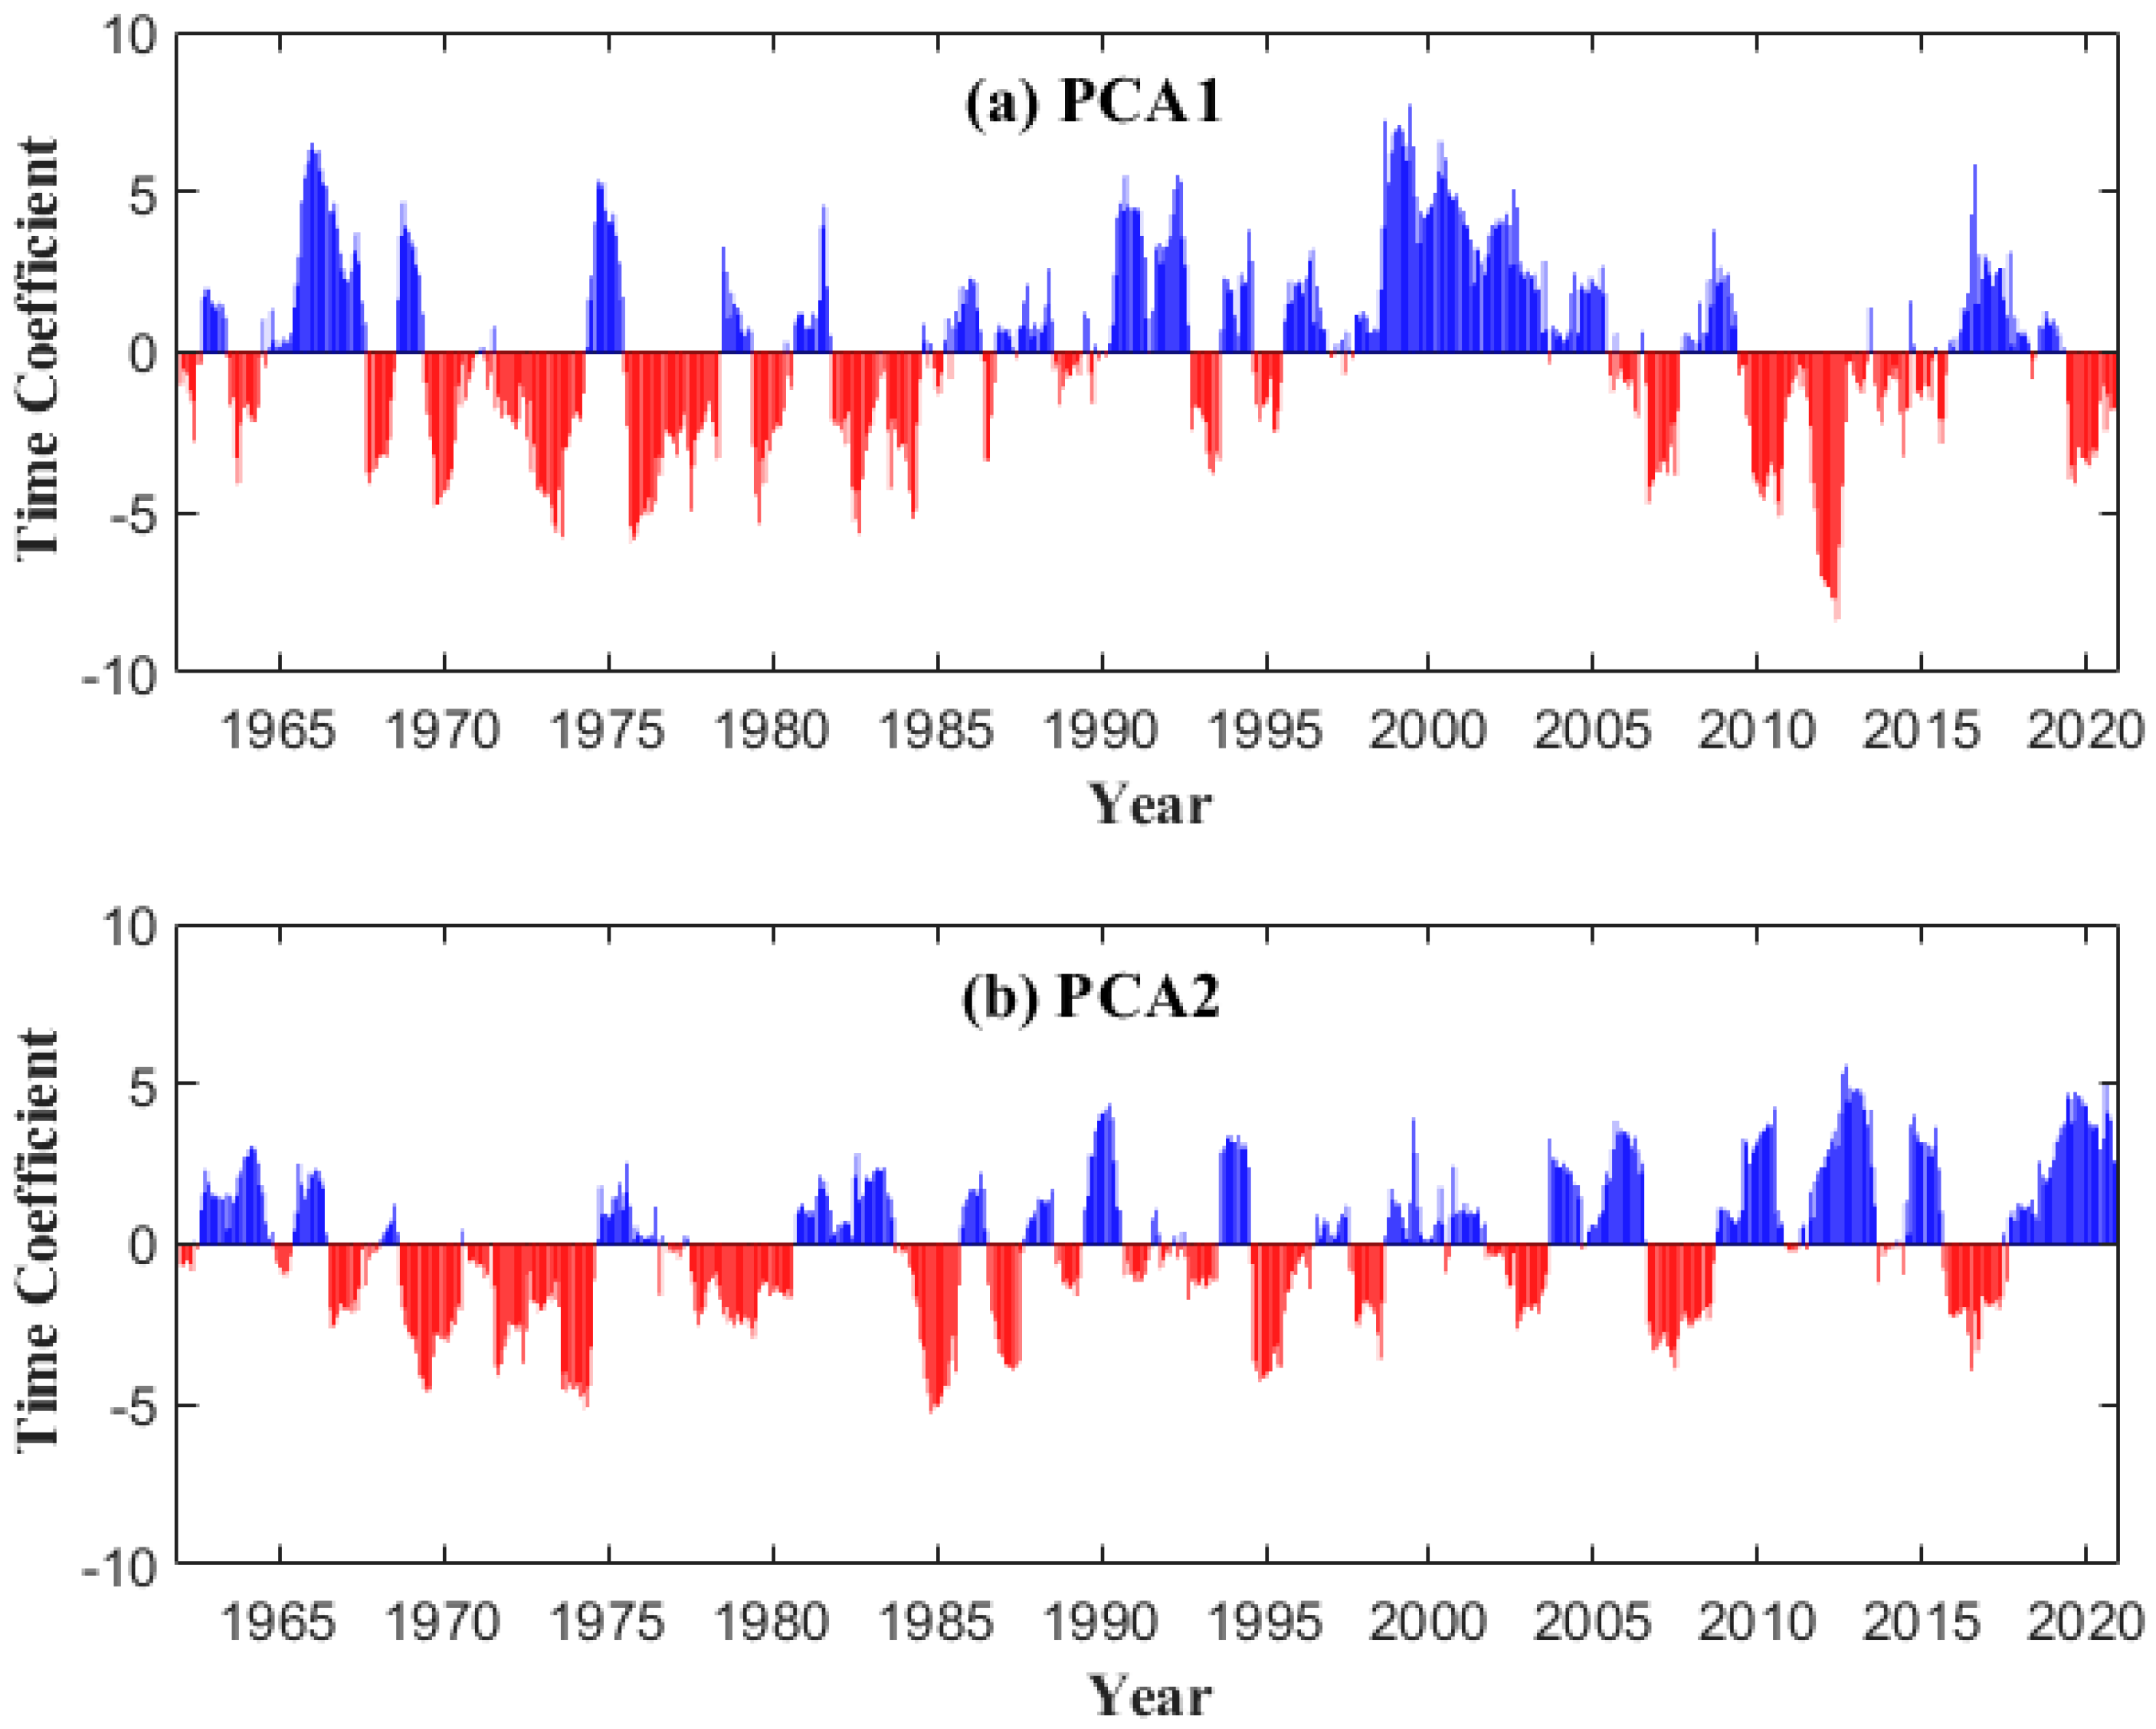
The temporal coefficients corresponding to the eigenvectors provide insights into the time-varying characteristics of the spatial modes. Positive and negative coefficients reflect the direction of the mode, with positive values indicating the same direction as the mode and negative values indicating the opposite direction. The coefficient’s absolute value indicates the typical nature of the pattern.
Figure 6 illustrates the principal component analysis (PCA) of the time series corresponding to the meteorological drought fields EOF1 and EOF2 in the JRB.
The outcomes derived from the analysis of EOF1 and PCA1 distinctly highlight the prevalence of frequent drought occurrences, particularly within the middle and lower sectors of the JRB. This period from 1967 to 1985 notably exhibited heightened drought frequency when contrasted with other temporal segments. From the early 1990s to 2005, there were fewer drought events in this region. However, a 15-year period from 2006 to 2020 witnessed an increase in drought events and higher drought frequency. Regarding PCA2 (
Figure 6b), the typicality of the second spatial mode was weaker compared with the first spatial mode. The northern part of the JRB exhibited wetter conditions during the 2010s, while the basin as a whole displayed a spatial pattern of being wetter in the north and drier in the south. This may be attributed to the increase in glacial meltwater in the Yangtze River source area in the north, which is influenced by rising temperatures. The scrutiny of temporal coefficients not only furnished insight into the spatial modes but also offered a temporal dimension that enriched our comprehension of the evolving patterns characterizing meteorological drought within the JRB.
3.2. Analysis of Simulated Runoff Results Using the SWAT Model
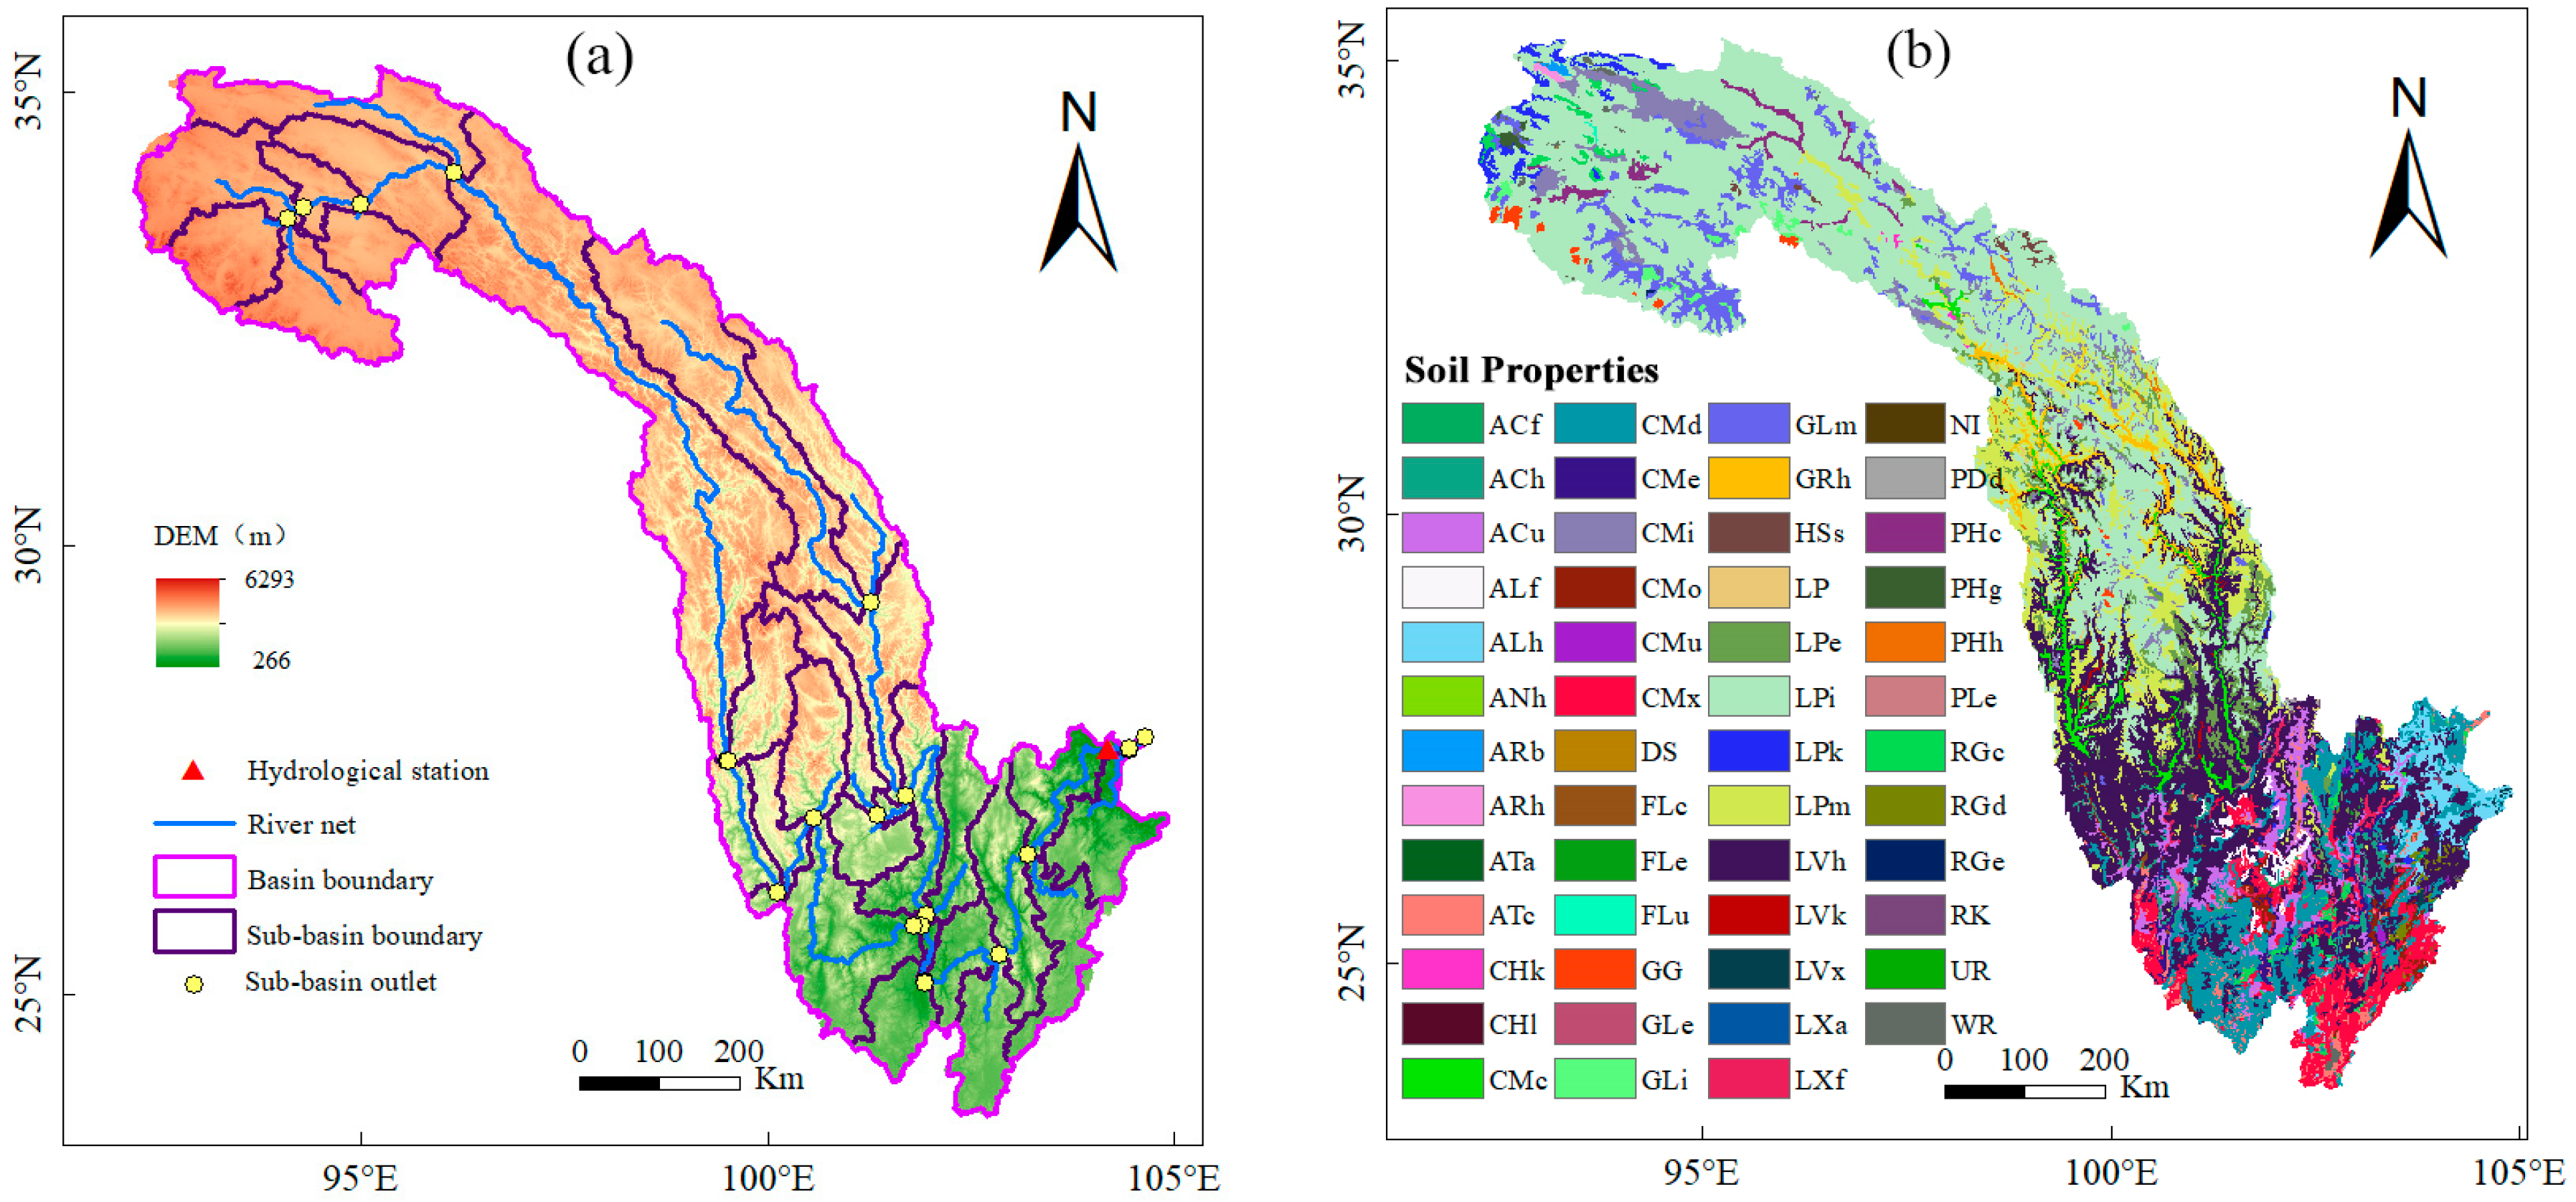
In the process of sub-basin delineation, the SWAT model loaded the Mask file and the main river file of the JRB and set the minimum value of the sub-basin area as 800,000 ha. The model finally generated 34 sub-basins, as shown in
Figure 7a. The final spatial distribution of soil properties in the JRB is shown in
Figure 7b.
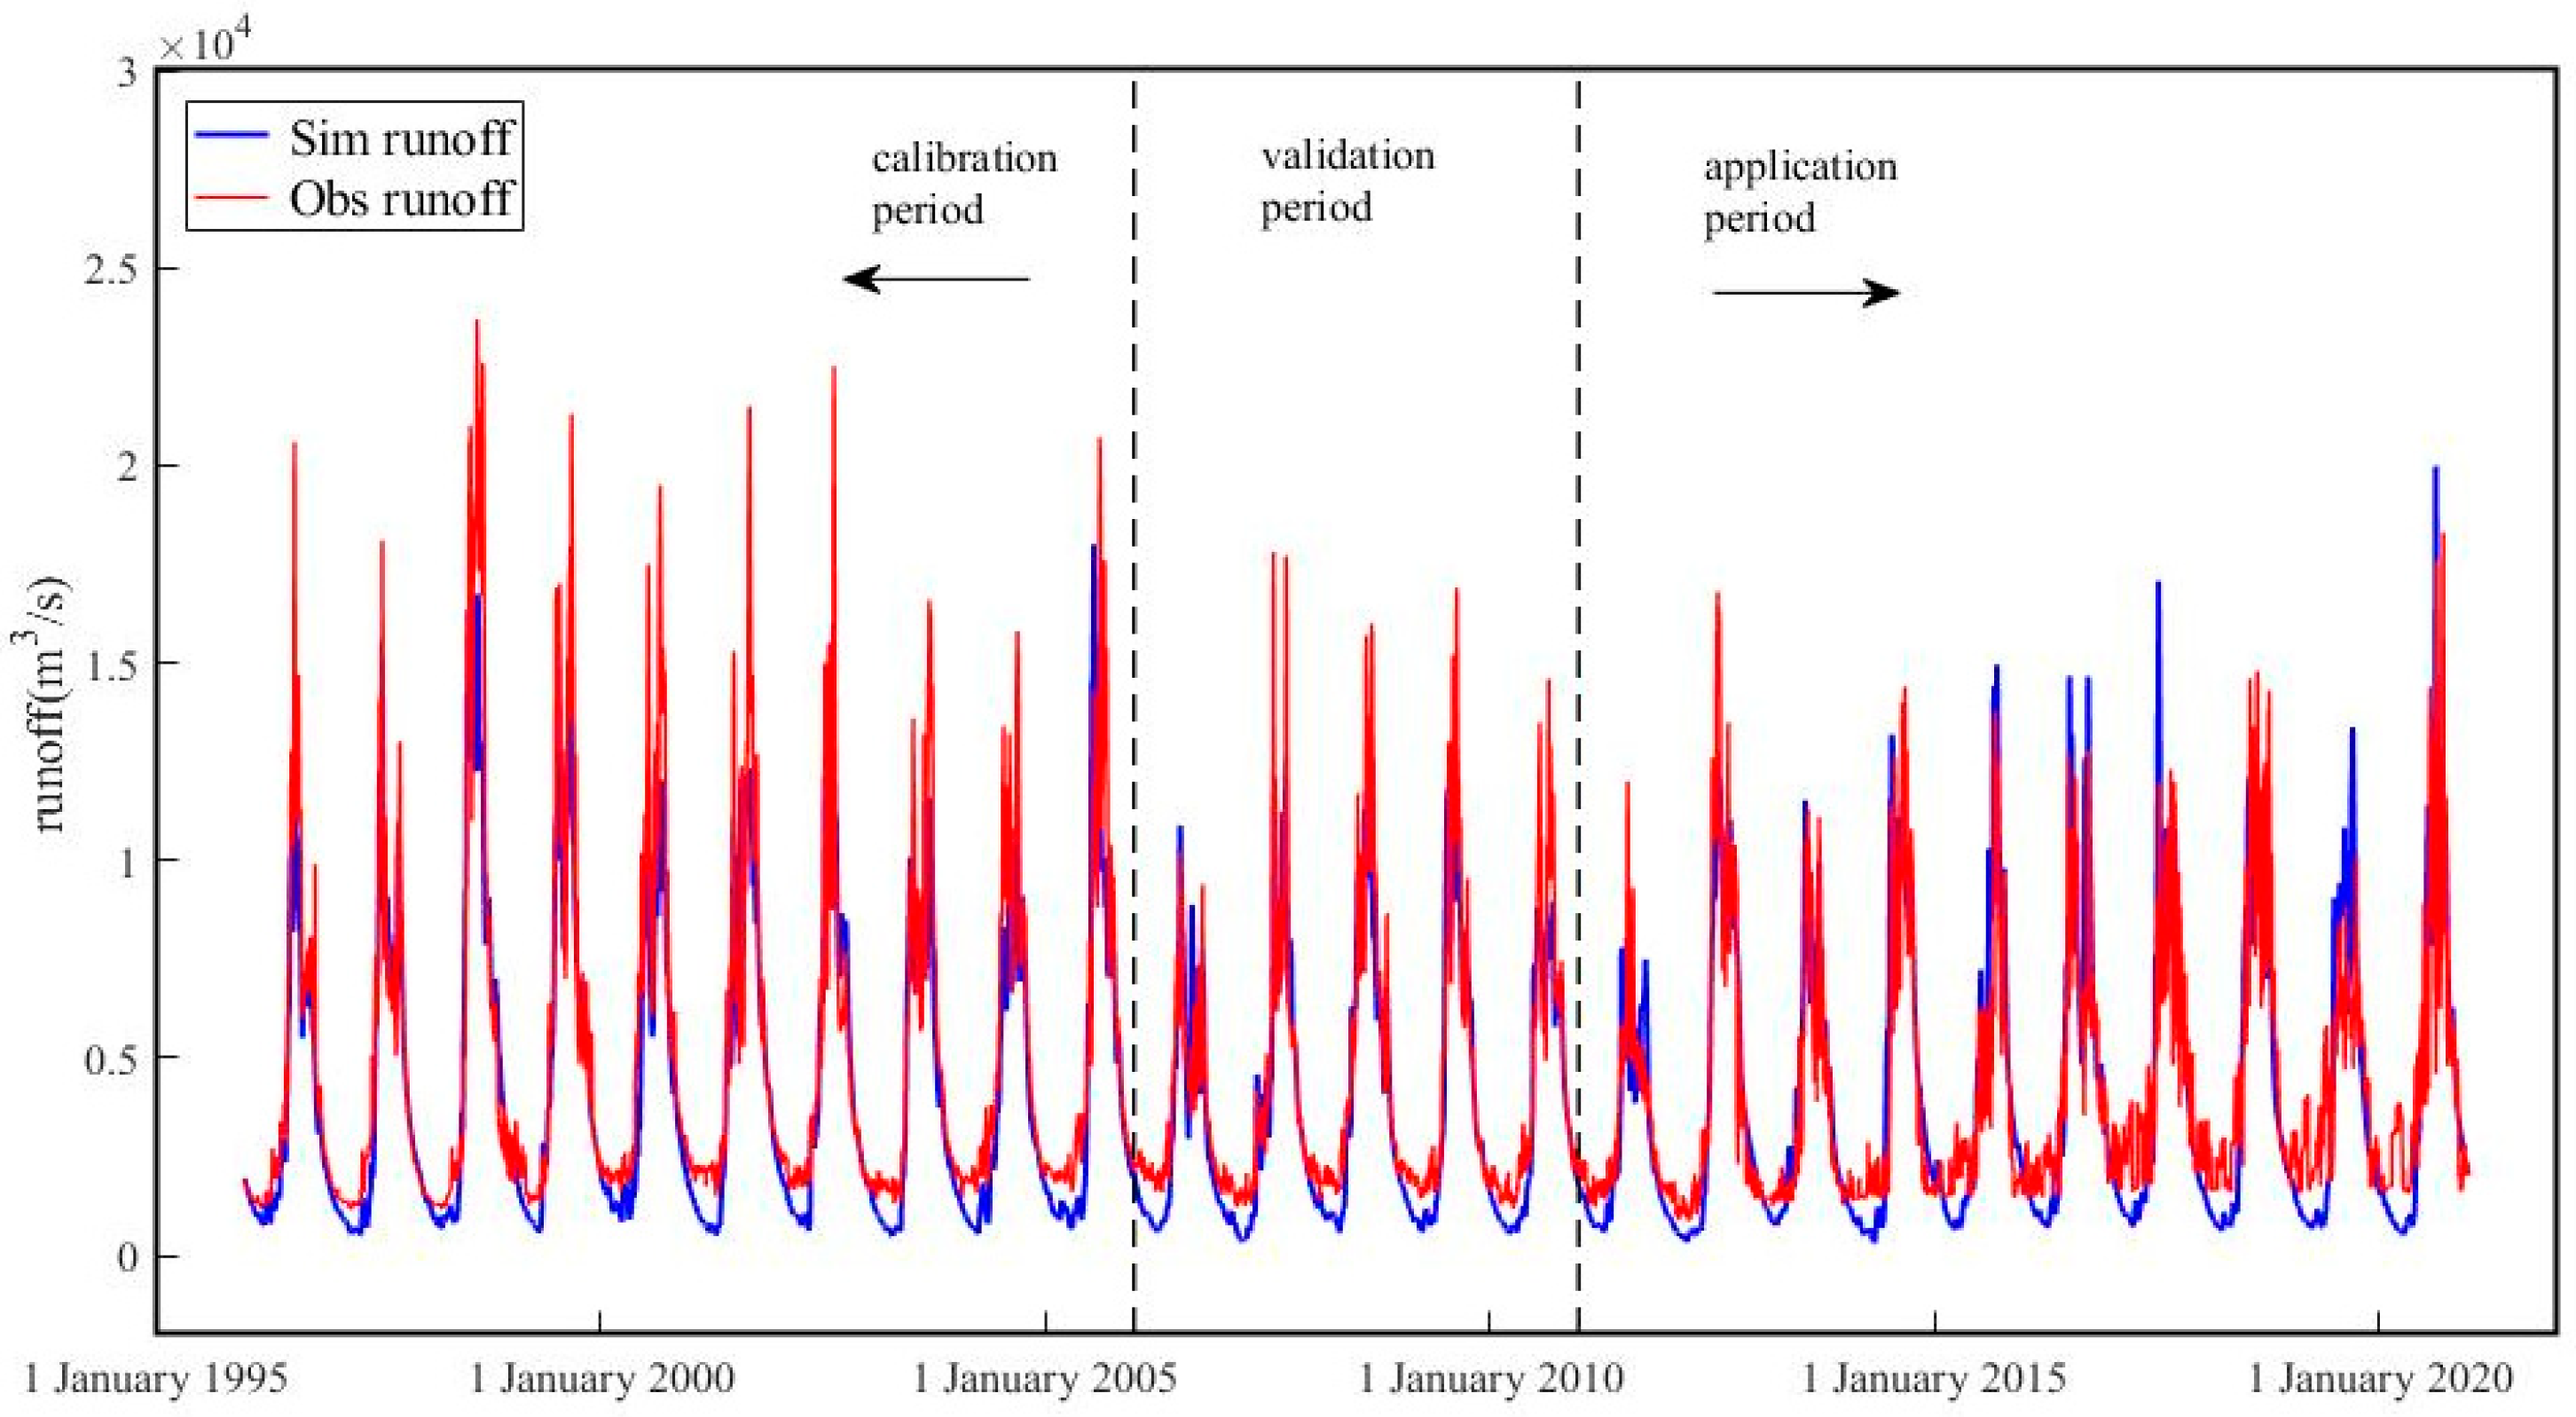
The simulation results of daily runoff at Pingshan station obtained using the SWAT model from 1996 to 2020 are shown in
Figure 8. The years 1996–2005 were selected as the calibration period and 2006–2010 as the validation period, and the simulation results from 2006–2010 were used to validate the applicability of the SWAT model in the JRB. The reservoir storage effect was increased from 2011 to 2020, so the simulation results of the runoff in this period were regarded as natural runoff obtained using the SWAT model, and the years from 2011 to 2020 were regarded as the application period. The statistical indicators of the simulation effect in the rate period, validation period, and application period were calculated, respectively. The statistical indicators of the runoff simulation in different periods of the SWAT model are shown in
Table 2. The SWAT model simulation results showed that the daily runoff simulation was good in the rate period and the validation period, with an R
2 of 0.87 and an NSE of 0.83.
3.3. Analysis of Hydrological Drought Evolution Characteristics
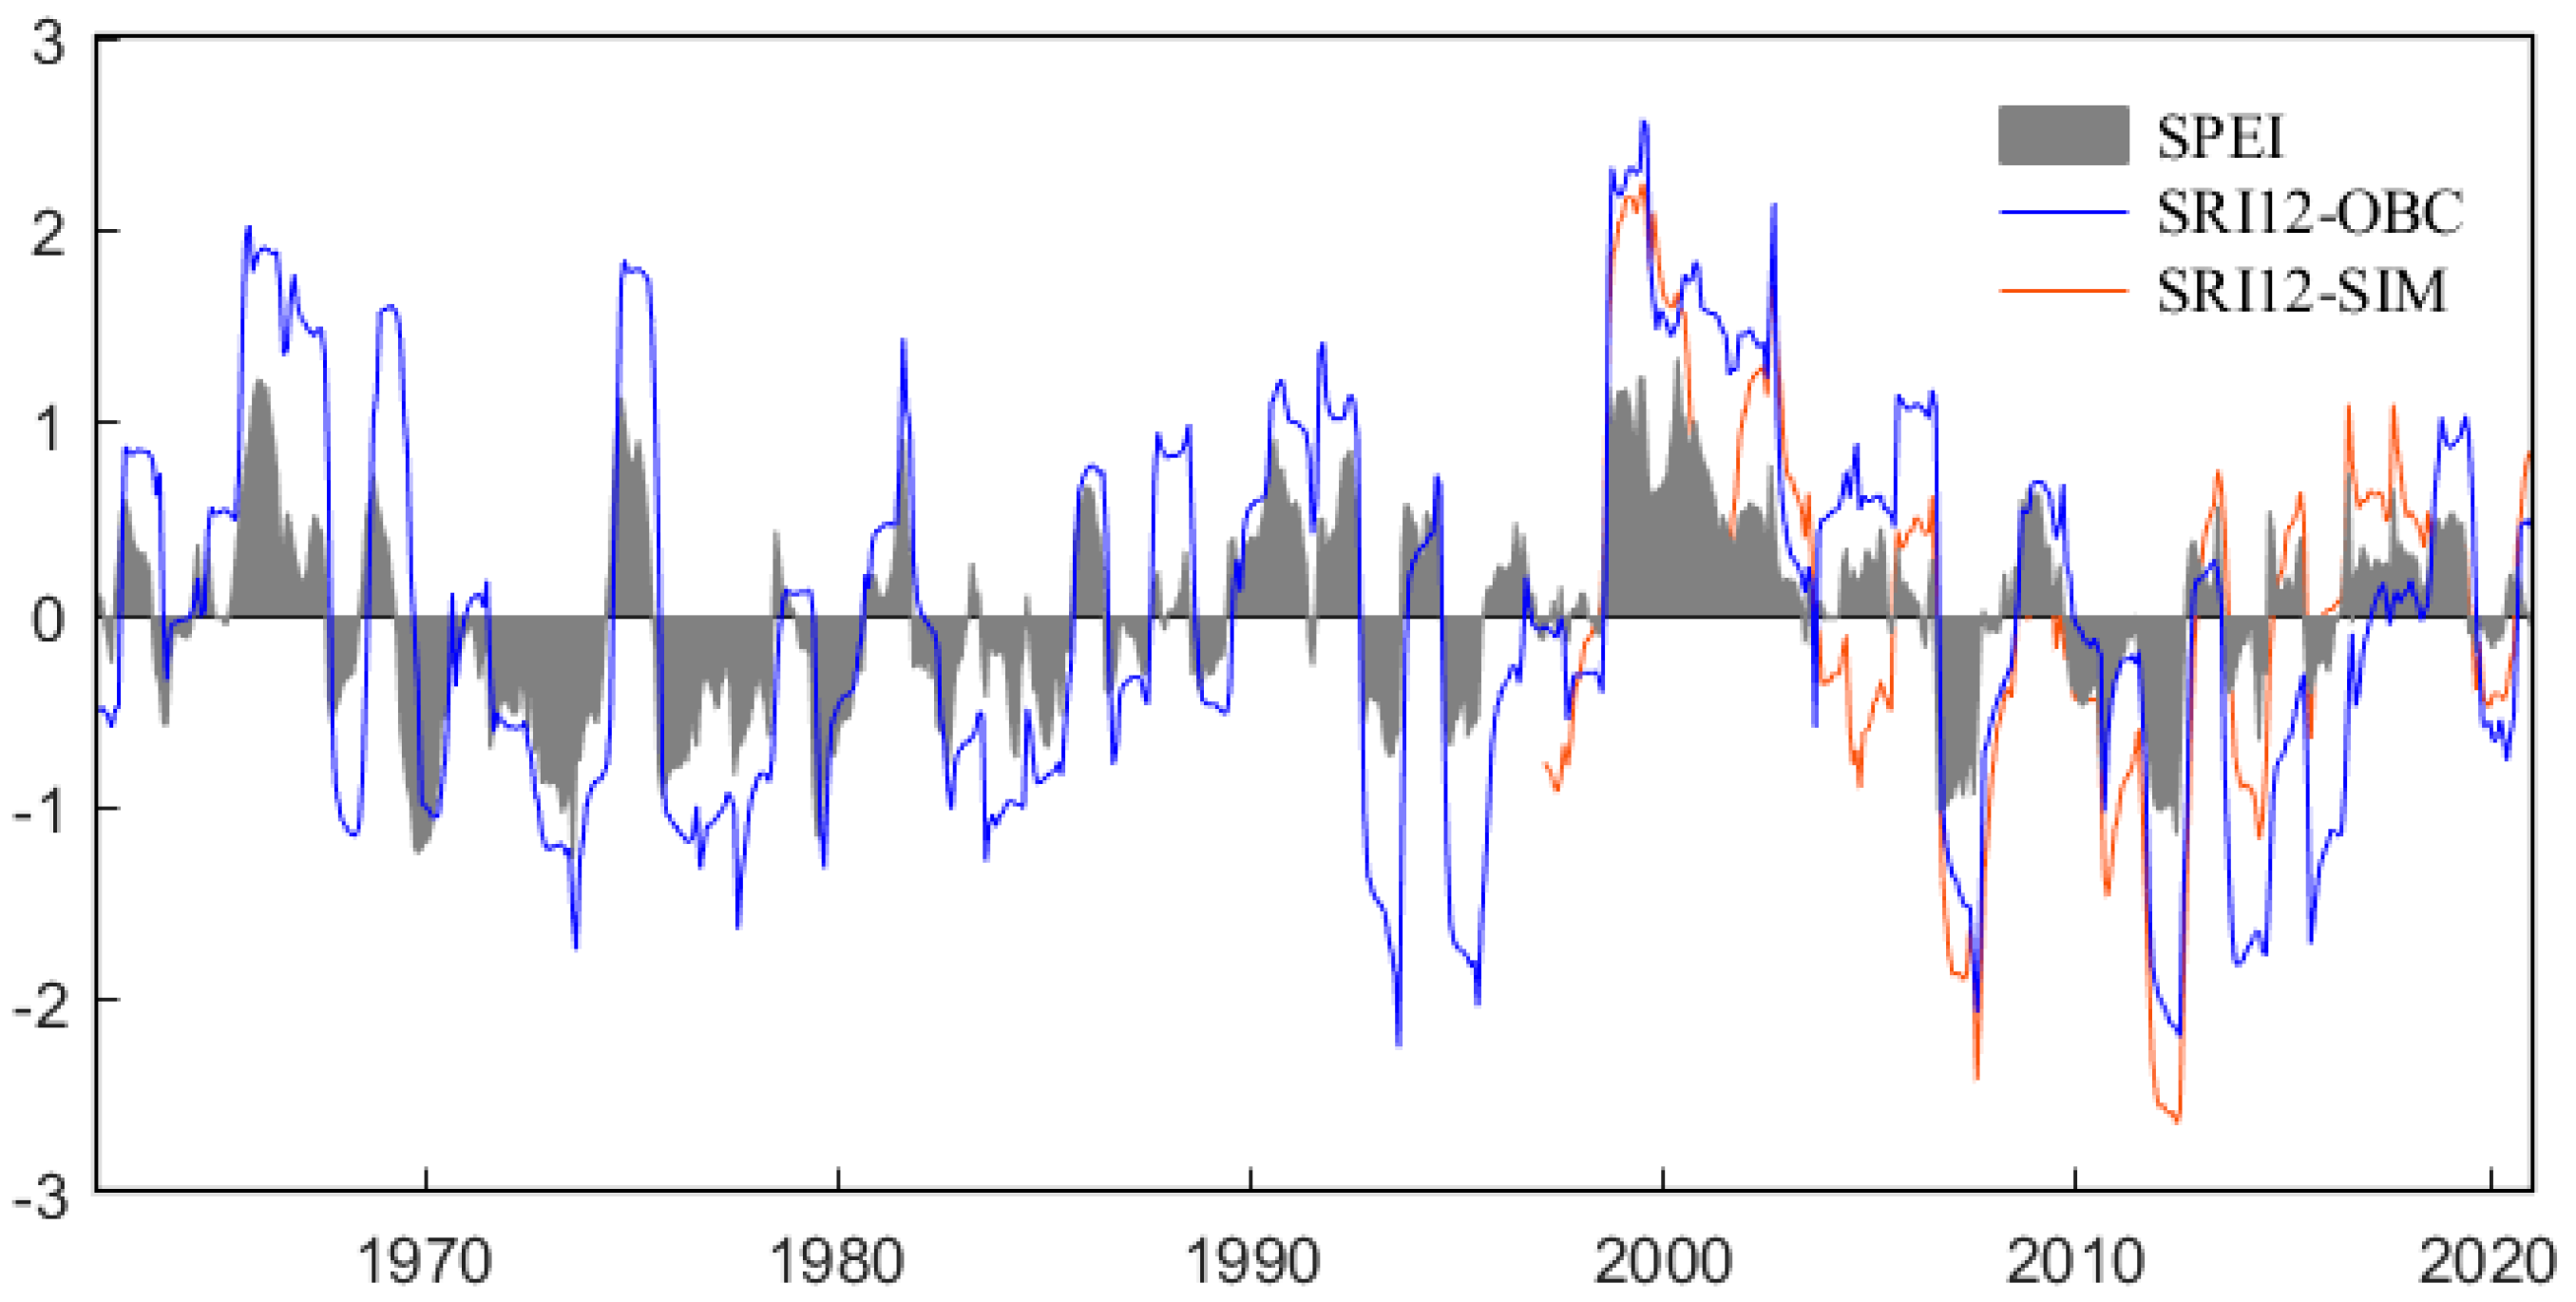
To interpret the hydrological drought process in the JRB from 1961 to 2020, the 12-month scale SRI time series and SPEI time series were skillfully utilized in this study. The SRI time series was calculated based on observed runoff data from the basin outlet control station and the Pingshan hydrological station, while the SWAT model provided simulated runoff for generating additional SRI time series.
Figure 9 illustrates the results.
From
Figure 9, it can be observed that the SRI trend before 1998 was not significant, and the basin experienced flooding from 1998 to 2005, with the maximum SRI value exceeding 2. However, from 2006 to 2017, the SRI significantly decreased, reaching a minimum value below −2. This suggests that the watershed has experienced extreme hydrological drought events and protracted drought periods. The correlation coefficient between SRI and the years from 2000 to 2020 was calculated to be −0.48, passing the significance level test of 0.01. These data suggested that hydrological drought occurrences have significantly increased in the Jinsha River watershed since the turn of the century.
The results showed that there was a significant correlation between the standardized pre-SPEI and the SRI with correlation coefficients as high as 0.78, which passed the 0.01 significance level test. During drought events, the fluctuation range in SPEI values was smaller than that in SRI. This suggested that the JRB did not experience basin-wide drought in most cases. Instead, drought events occurred in specific areas, and the lower SPEI values in those areas were averaged over the entire basin, leading to a smaller variation range in SPEI compared with SRI. However, the SPEI continued to accurately portray the comprehensive drought or flood conditions in the JRB, even when factoring in the impact of runoff solely from Pingshan station.
By examining the fluctuation patterns of the two indices in
Figure 9, hydrological drought occurs later than meteorological drought. To further investigate the time lag between hydrological drought and meteorological drought, the correlation coefficients were calculated between SRI and SPEI with different time lags ranging from 1 month to 12 months. The time lag corresponding to the maximum correlation coefficient was determined as the lag time. The findings indicated that SRI and SPEI have a maximum correlation coefficient of 0.83, which occurs at a time lag of 1 month, while the minimum correlation coefficient is 0.22, which occurs at a time lag of 12 months. The second-largest correlation coefficient is 0.81, appearing at an interval of two months. Combining the correlation coefficient of 0.78 between SRI and SPEI for the corresponding month. Therefore, there was a time lag in the response of hydrological drought to meteorological drought in the JRB, with the most pronounced sensitivity occurring at a time lag of 1 to 2 months. Based on the observed runoff data from the Pingshan hydrological station, the outlet control station of the basin from 1961 to 1996, the simulated monthly runoff data of the JRB from 1997 to 2020 were simulated, and the SRI time series corresponding to the simulated runoff at the December scale was calculated. The results of SRI12-SIM are displayed in
Figure 9. The SRI showed a general trend of decreasing first and then increasing later. A comparison of the simulated runoff with the SRI-12 corresponding to the observed runoff revealed that the drought degree corresponding to the simulated runoff before and after 2010 was more severe than that of the actual observed runoff.
In this research, the drought characteristics of meteorological and drought events of medium and a higher degree in the JRB from 1998 to 2020 were identified using the tour theoretical threshold method (X
0 = 0, X
1 = −1, X
2 = −1) to determine the starting and ending times of drought events. The results are shown in
Table 3 for the drought characteristics of meteorological droughts before and after the construction of reservoirs from 1998 to 2020 in the JRB, i.e., 2010, and shown in
Table 4 for the drought characteristics of hydrological droughts before and after the construction of the reservoir from 1998 to 2020 in the JRB, i.e., 2010. The findings demonstrated that hydrological droughts were more severe than meteorological droughts in the JRB, and three severe meteorological droughts occurred continuously in the JRB in the 10 years before and after the construction of the reservoir, and two of these droughts lasted for more than 10 months. According to the SWAT model prediction of runoff in the JRB, there would be four hydrologic droughts of moderate magnitude and above from 1998 to 2020 and hydrologic droughts would be frequent from 2006 to 2015. Leveraging the empirically observed runoff data from Jinsha River, a comprehensive assessment of hydrological drought frequency was meticulously undertaken for the temporal interval spanning 2006 to 2016. This examination discerned the emergence of a series of notable hydrological drought episodes, notably encompassing five instances of moderate to severe magnitude. Particularly noteworthy is the pinnacle of hydrological drought intensity realized from July 2011 to August 2012, where the drought event reached its zenith with an impressively substantial magnitude of −1.69. Therefore, this study found that the frequency and duration of hydrological droughts within the JRB have been on the increase in the context of increasing climate change, as well as the effects of anthropogenic interventions, especially after the completion of the Jinsha River Reservoir in 2010. Notably, this change is characterized by a marked increase in the incidence of drought events. The frequency, duration, and severity of hydrological droughts tended to increase after the construction of the Jinsha River Reservoir in 2010.
3.4. Propagation Law of Meteorological Drought to Hydrological Drought
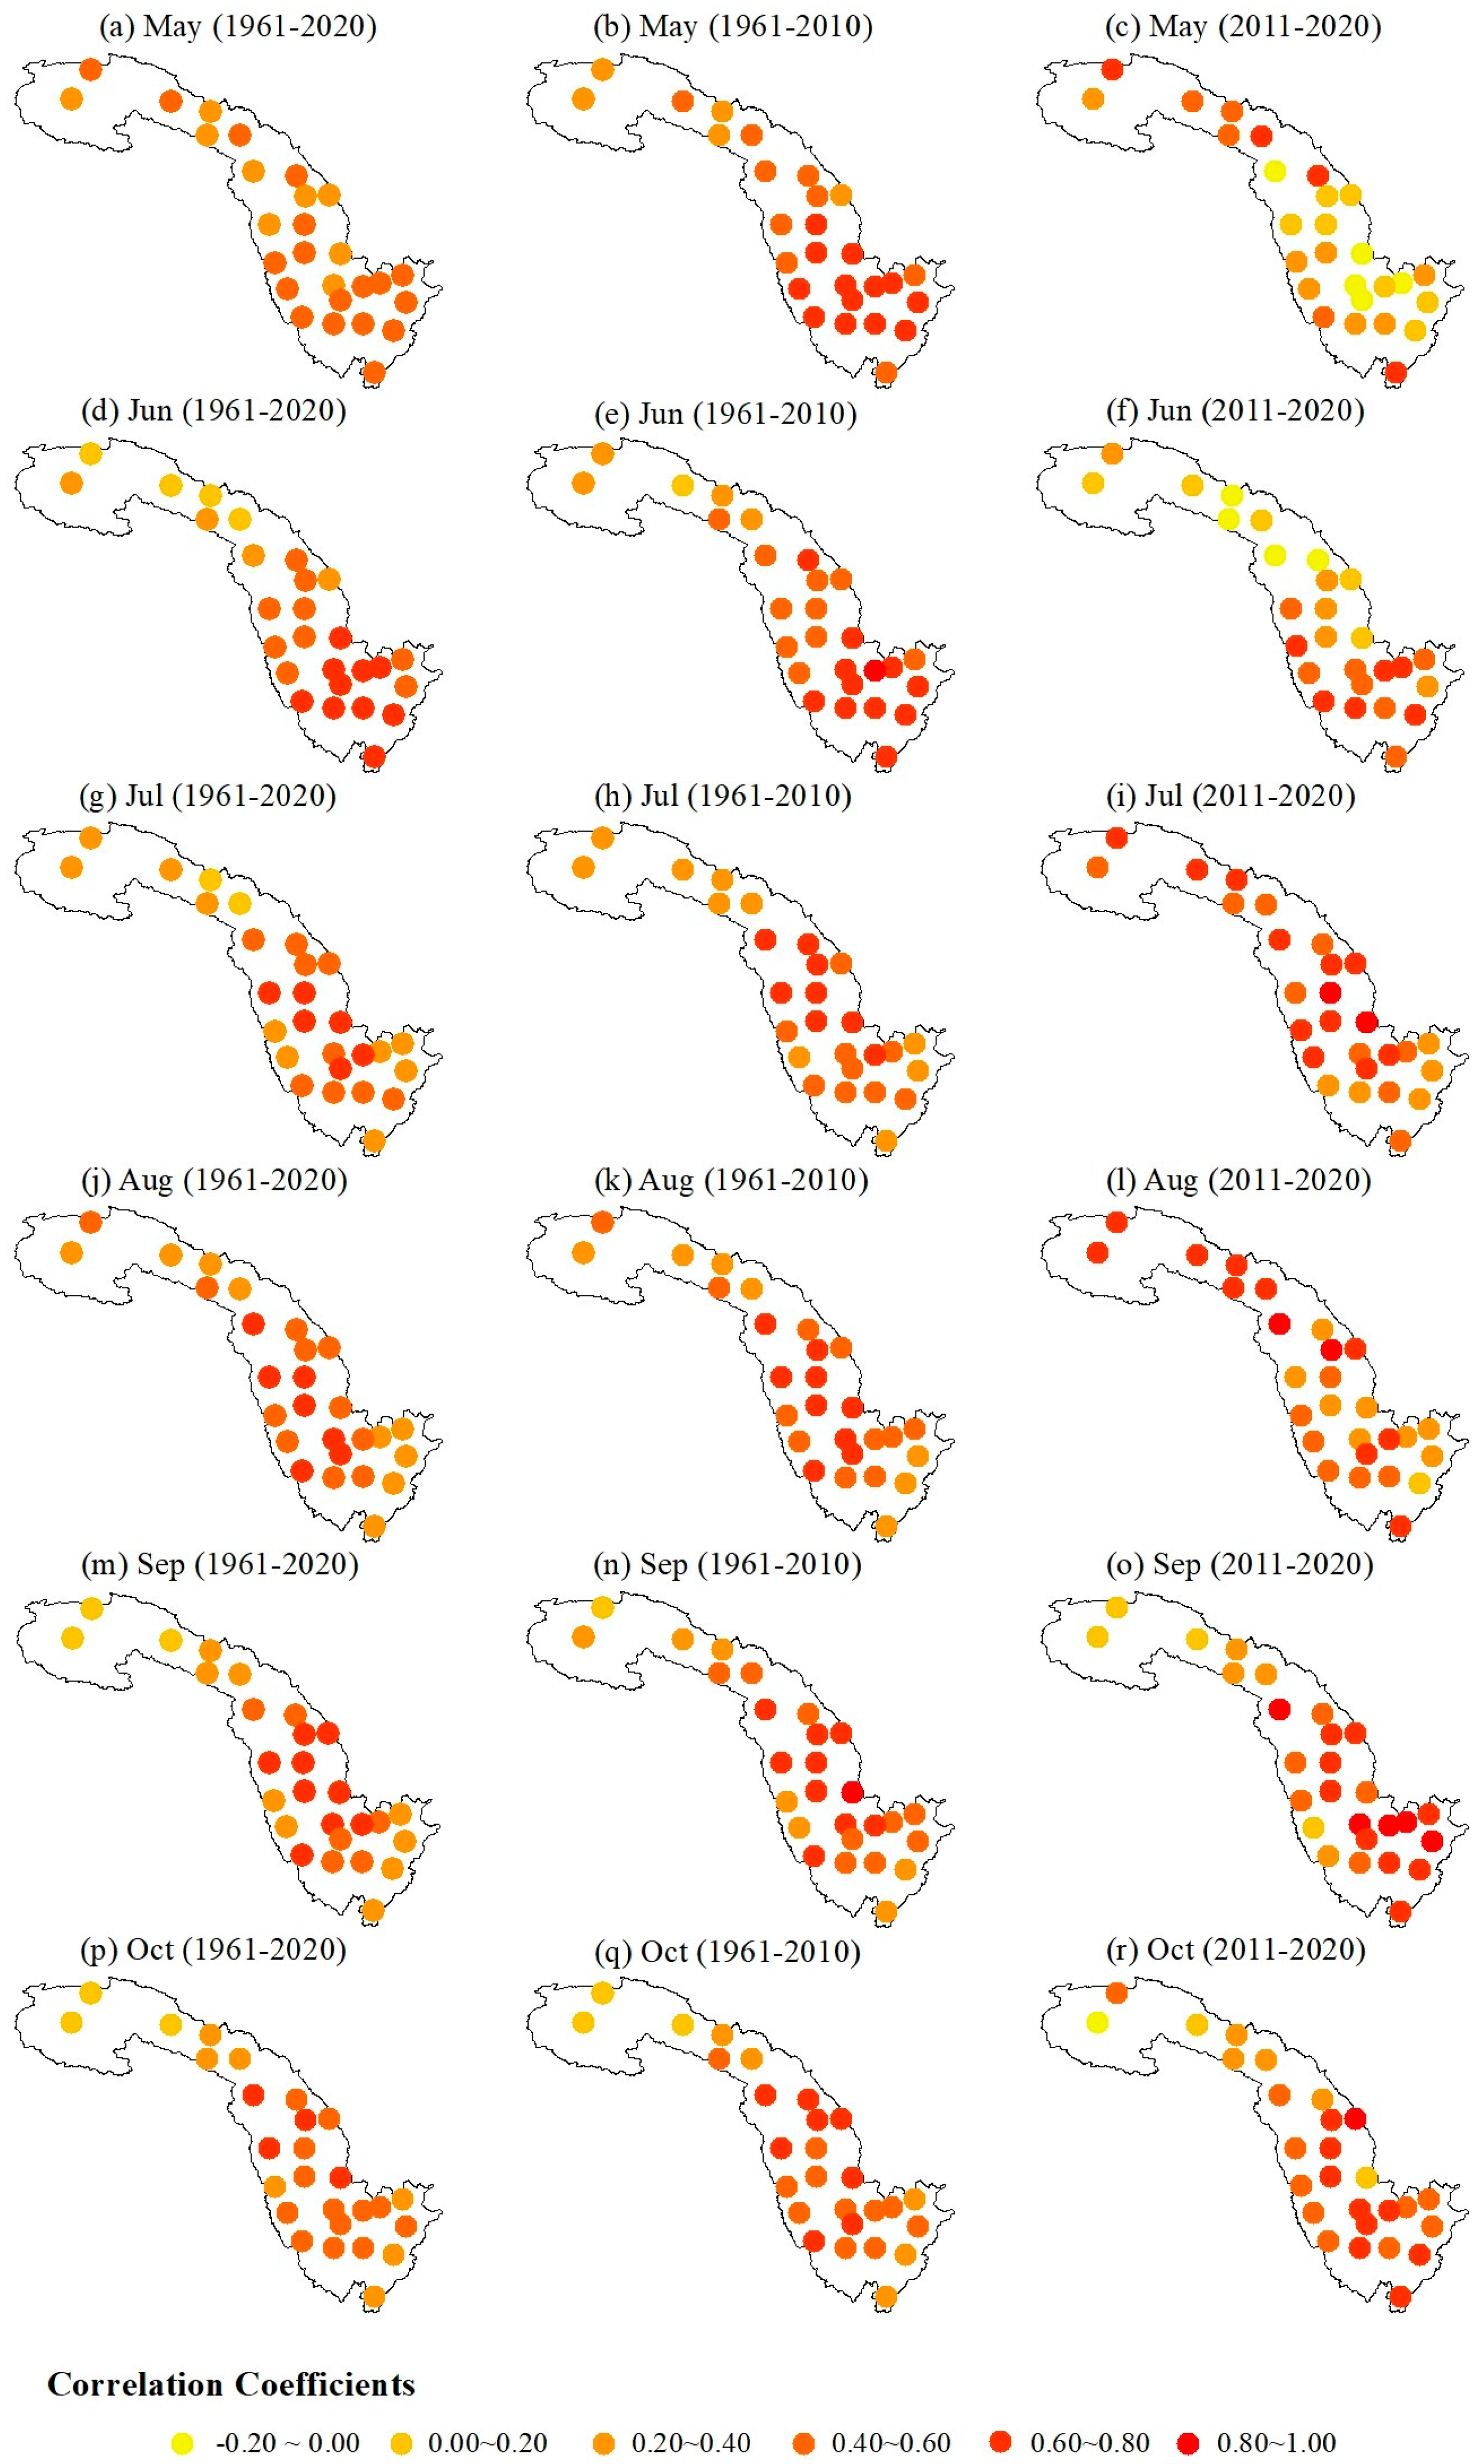
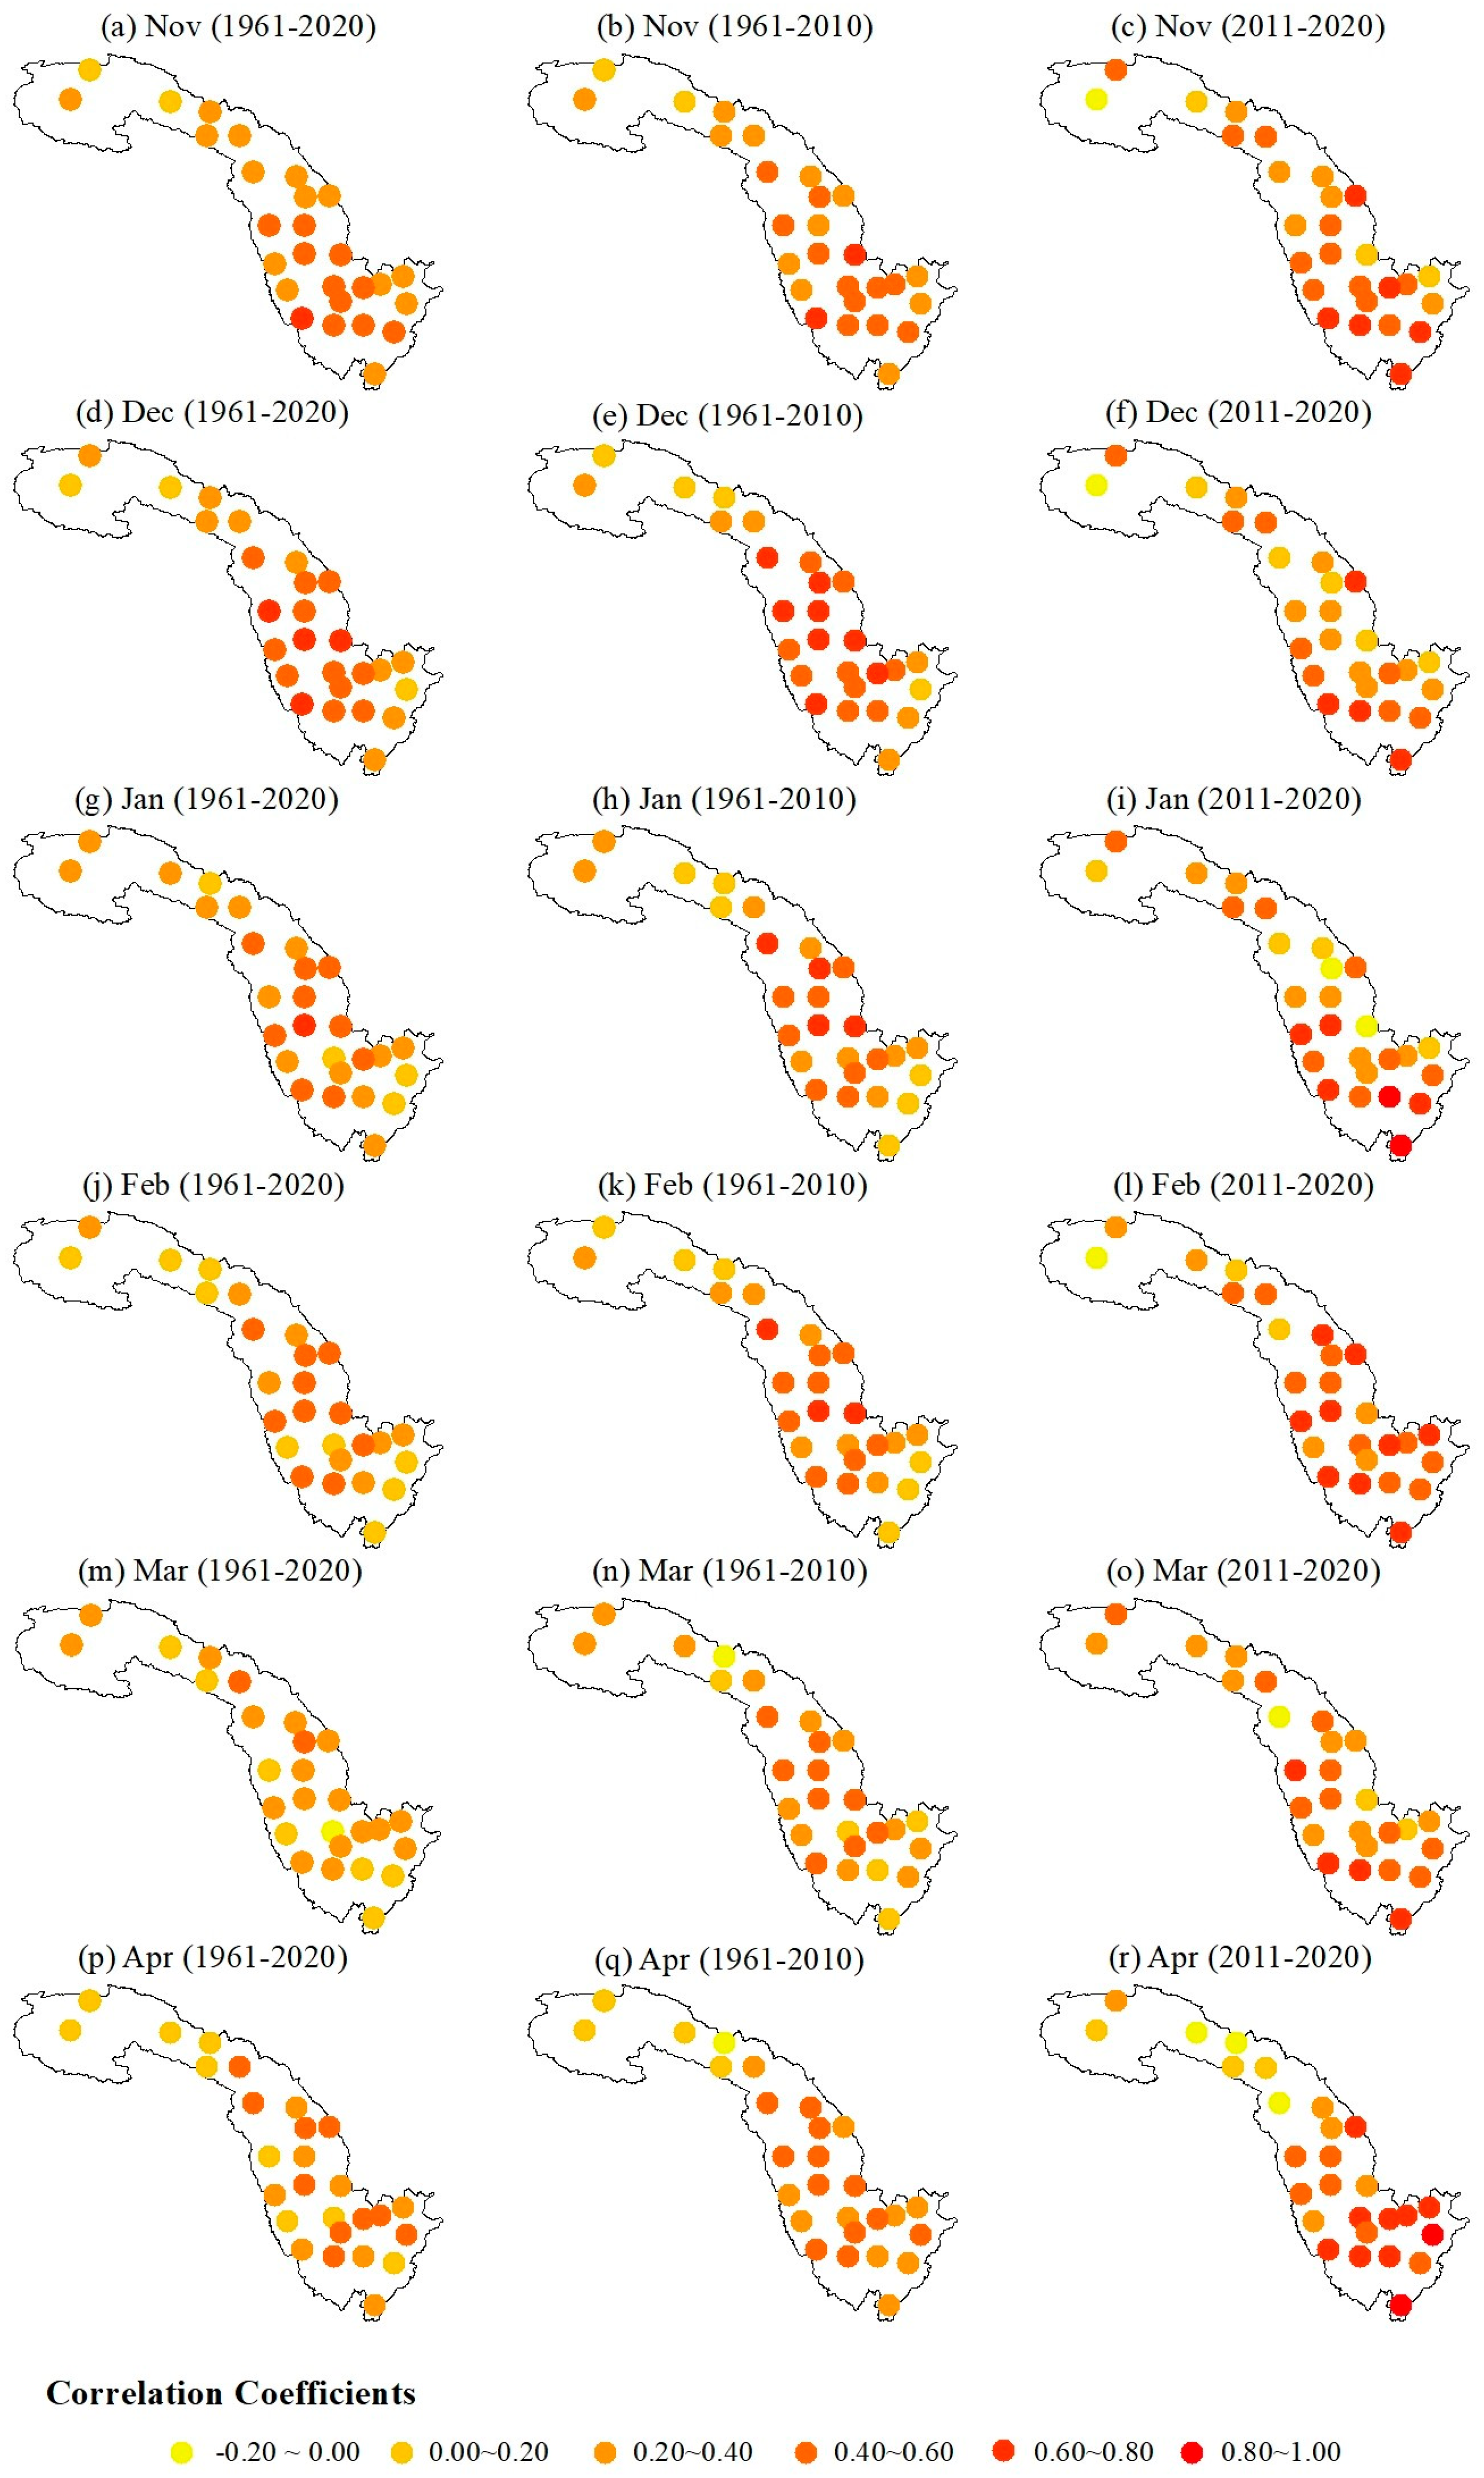
In this study, Pearson correlation coefficients were used to analyze the correlation between meteorological droughts at different time scales (SPEI-1, SPEI-2,…, SPEI-12) and hydrological droughts at a 1-month scale (SRI-1), and the SPEI time scale corresponding to the maximum correlation coefficient was taken as the drought propagation time. The spatial distribution of the correlations between the SPEI-n and the related SRI-1 in the JRB before and after the changing environment due to the construction of the giant reservoir in 2010 is shown in
Figure 10 and
Figure 11. The findings indicate that: from the flood season in
Figure 10, the correlation coefficients between SPEI-n and SRI-1 in the middle and lower JRB from 1961 to 2020 were higher than those in the upstream area as a whole, among which the correlation coefficient in the source area of the Yangtze River was the smallest, and it did not even pass the test of significance at the level of 0.05. The average correlation coefficient of SPEI-n and SRI-1 in the JRB during the flood seasons from 1961 to 2010 was 0.51. The mean correlation coefficient between SPEI-n and SRI-1 in the JRB for the flood season spanning 2011 to 2020 amounted to 0.38. From the viewpoint of
Figure 11, precipitation in the dry season is scarce, and it is not easy to reach the state of storage and production of streamflow, and the sensitivity of runoff response to precipitation changes is affected by glacier meltwater, soil water, and groundwater to a greater extent. The response sensitivity of runoff to precipitation changes is notably influenced by glacier meltwater and groundwater to a greater degree. During the drought stage, the correlation between meteorological drought and hydrological drought weakened, and the average correlation coefficient between SPEI-n and SRI-1 in the JRB was 0.38 during the dry period from 1961 to 2010. The JRB has more precipitation in the summer, and the temperature is high, which can speed up the runoff response to precipitation. The correlation coefficient in the JRB during the dry period from 2011 to 2020 was 0.42, and the propagation of meteorological drought to hydrological drought was most significant in May and June on the monthly scale before 2010, with a mean correlation coefficient of 0.55. The mean of the maximum correlation coefficients between the SPEI-n and the SRI-1 from January to April was small, ranging from 0.31 to 0.39, while the mean values of the maximum correlation coefficients between the SPEI-n and the SRI-1 from May to October were larger, ranging from 0.48 to 0.39. The mean value of the maximum correlation coefficient between SPEI-n and SRI-1 from May to October was larger, ranging from 0.48 to 0.55, and the mean values of the maximum correlation coefficients in November and December were 0.41 and 0.46. The mean values of the maximum correlation coefficients between SPEI-n and SRI-1 were larger from May to October, ranging from 0.28 to 0.56, and the maximum correlation coefficients in November and December were 0.44 and 0.38. The months with larger and smaller mean values of maximum correlation coefficients coincided with the flood and dry season, respectively. In general, the results show that the maximum correlation coefficients between SPEI-n and SRI-1 in the JRB are larger in the flood season and smaller in the dry season, indicating that the magnitude of runoff is related to the propagation of meteorological drought to hydrological drought, and the larger the runoff is, the more sensitive the hydrological drought is to the response of meteorological drought. Amidst the shifting dynamics catalyzed by the introduction of the reservoir construction in 2010, a nuanced alteration was manifested: the correlation between meteorological drought and hydrological drought showed a tendency to attenuate during the flood season, concurrently witnessing a propensity to intensify throughout the dry season.
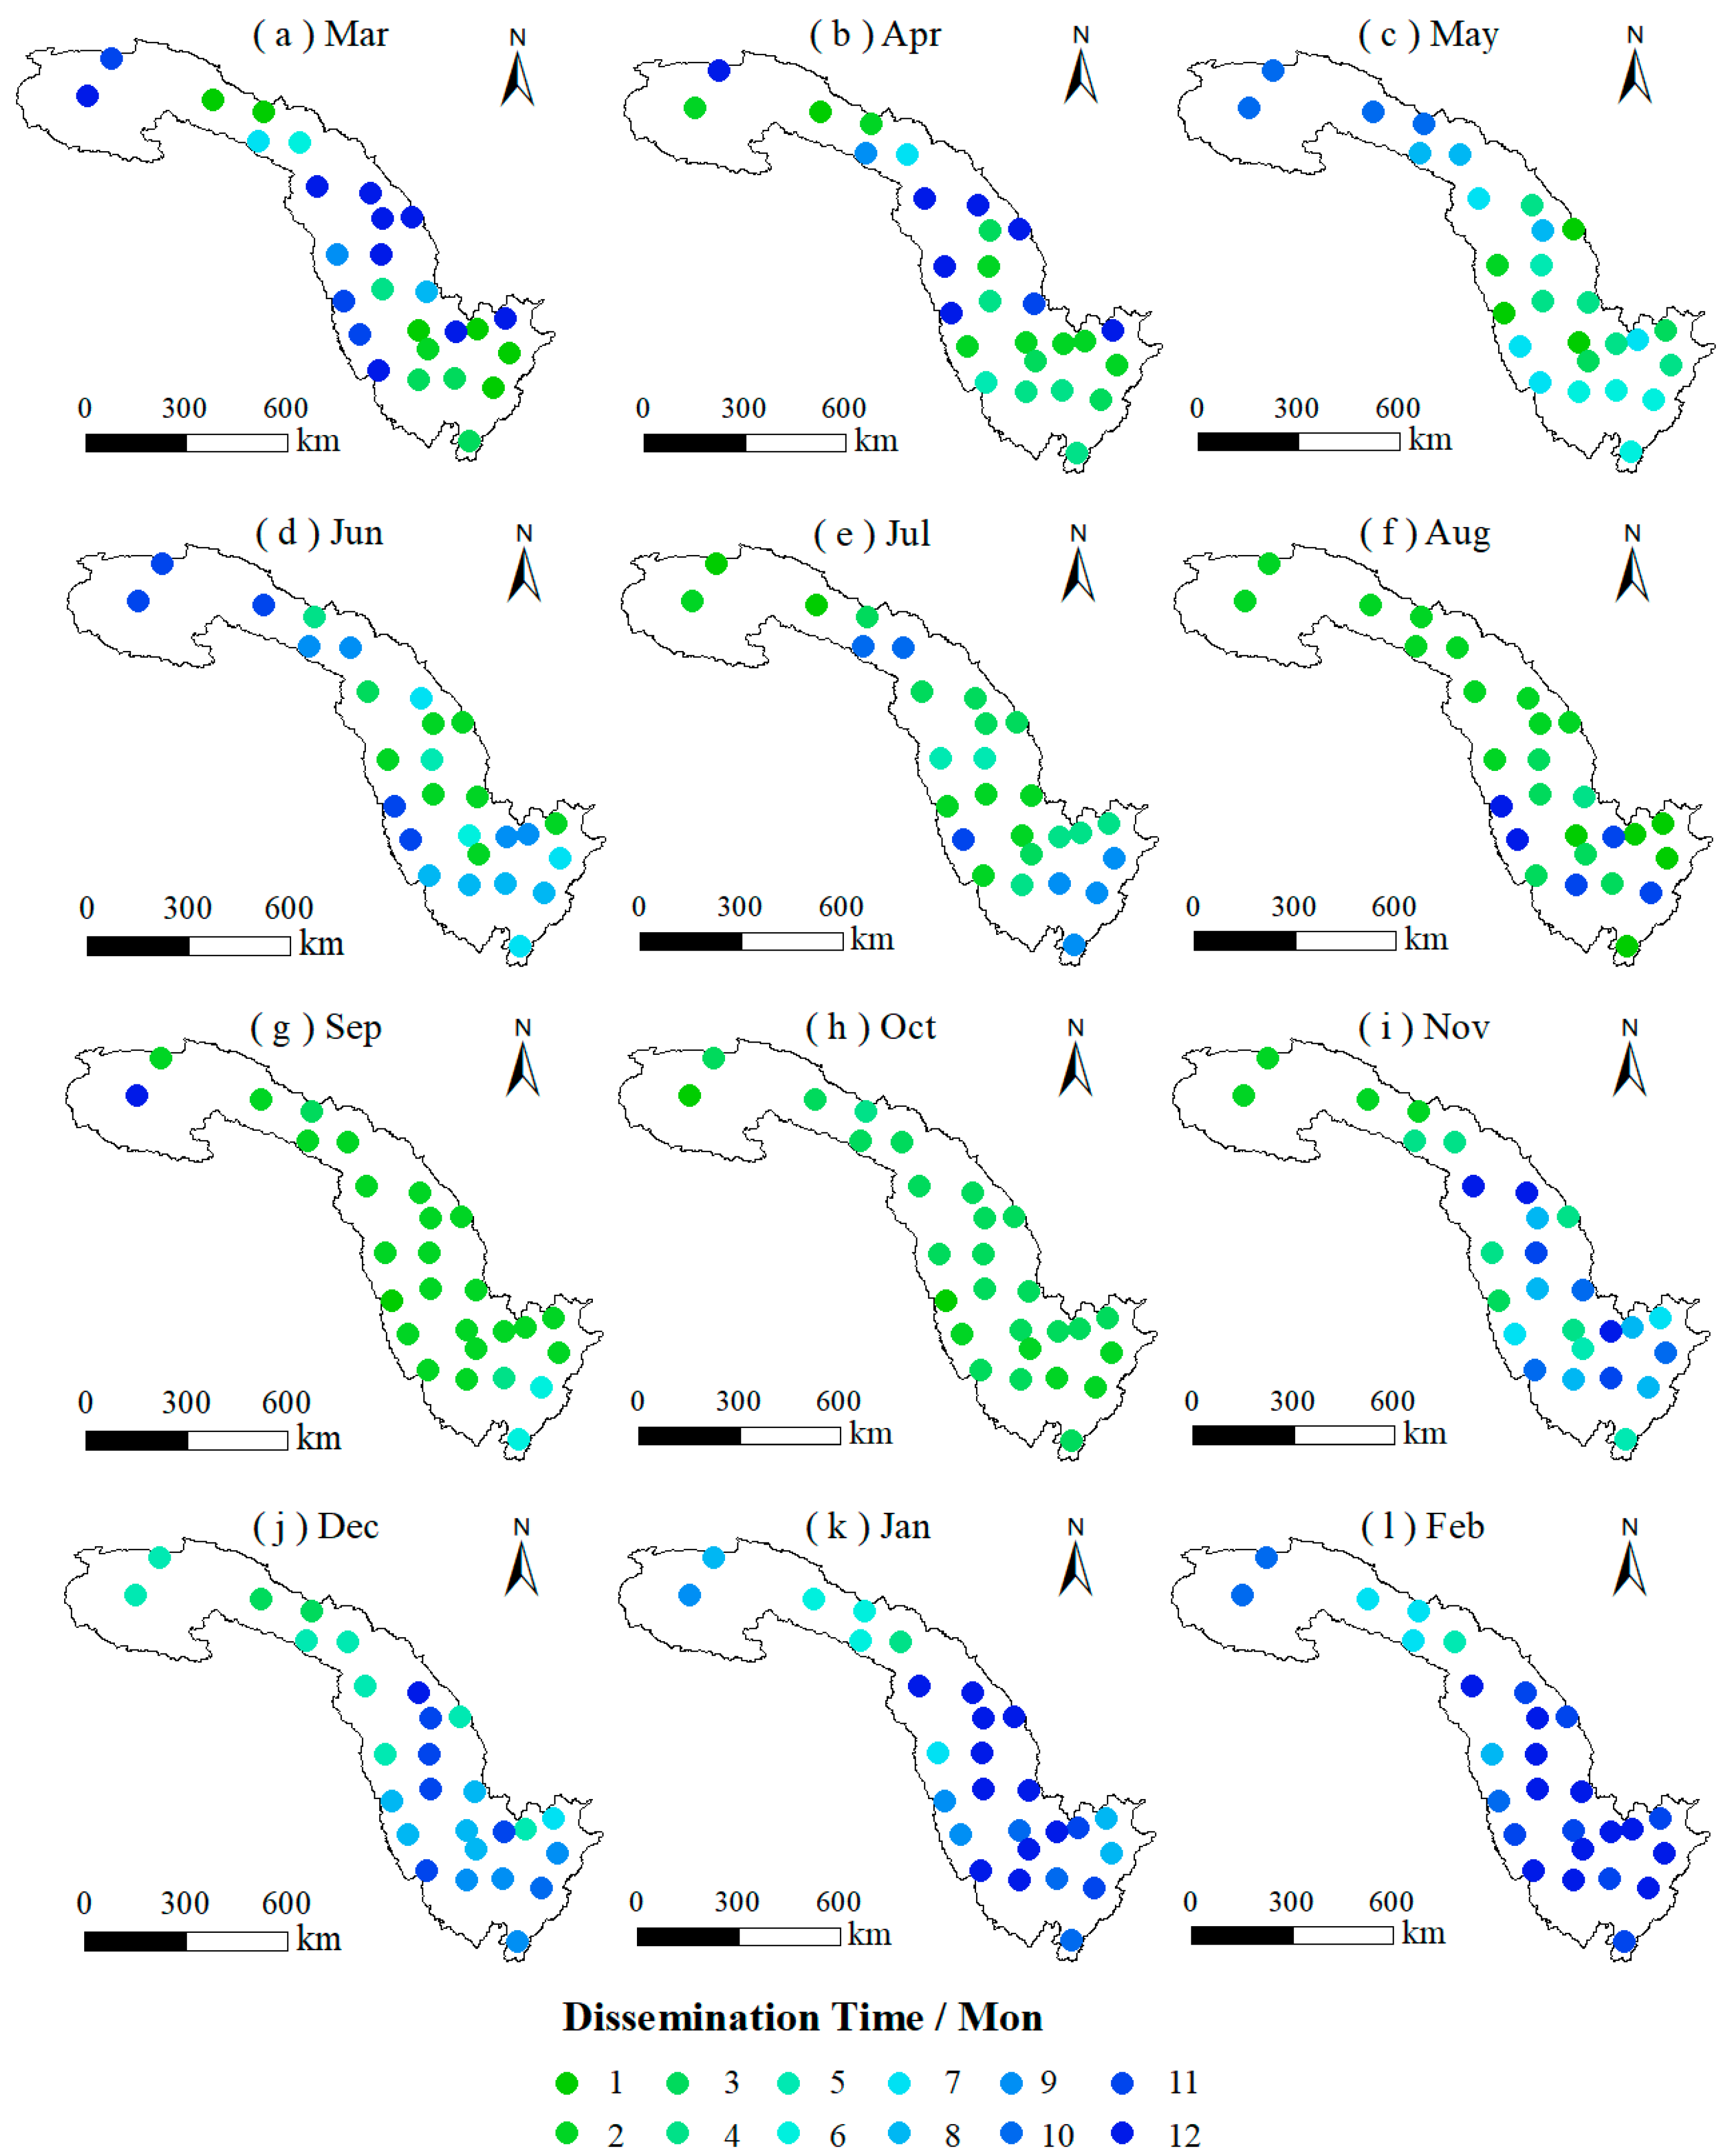
Figure 12 illustrates how the propagation time from meteorological drought to hydrological drought varies across different months throughout the JRB. The results showed that the propagation time has considerable seasonal changes. In comparison with the dry period from November to April, the propagation time from meteorological drought to hydrological drought was shorter during the flood period from May to October. This finding aligns with the previous conclusion that “the higher the runoff volume, the more sensitive the response of hydrological drought to meteorological drought”. Higher temperatures during the flood period led to increased evaporation, sufficient precipitation, and ample runoff, resulting in a faster water cycle process and shorter propagation time from meteorological drought to hydrological drought.
Of these, dissemination time was the shortest in September and October, with an average of 2.7 months across sites. Most sites experienced propagation times of 1, 2, or 3 months from August to October. In contrast, during the dry season, characterized by lower temperatures, reduced evaporation, insufficient precipitation, and low runoff, the propagation time was longer. This was particularly notable from December to March, with all sites experiencing propagation times exceeding 7 months. It is important to highlight that in certain locations, both during the flood and dry season, the duration for meteorological drought to transition into hydrological drought is extended. This may be due to modifications in the precipitation–runoff connection brought on by reservoir water resource management in the JRB, which has disrupted the typical process of meteorological drought propagating to hydrological drought.
4. Discussion
Currently, a multitude of monitoring indices exist for drought assessment; however, the SPEI and SRI have gained widespread recognition for evaluating meteorological and hydrological droughts, respectively [
25,
26,
27]. This study disclosed an inclination toward longer drought durations, attributed to the compounding influence of anthropogenic activities and climate change. These findings were in harmony with prior research endeavors. For example, Prudhomme et al. [
28] reported that the severity of global hydrologic droughts was likely to increase by the end of the 21st century using client data from the multi-model approach of five different global climate models. Wanders et al. [
29] revealed that in 15% of the world, there is a trend toward a negative increase in low flows, along with an increase in drought duration and deficit, and that the future may be characterized by severe water stress.
Identifying the mechanisms underlying the transition from meteorological to hydrological drought remains a challenging task in the latest academic research. The dynamic relevance between meteorological and hydrological drought was indisputable in this study. It was noteworthy that this correlation showed a clear pattern of fluctuation, with a weakening influence during the flood season and an increasing influence during the drought season. This intricate fluctuation has been further exacerbated by water projects such as reservoir construction, especially since 2010. Importantly, during flood seasons, seasonal fluctuations highlight a reduced time for the transmission from meteorological drought to hydrological drought. This was confirmed in existing studies. Particularly noteworthy was the fact that the establishment and operation of large reservoirs have had a significant impact on surface runoff dynamics. Thus, these activities have played a key role in changing the course of drought development, contributing to the transition from meteorological to hydrological drought [
30]. According to Wu et al.’s research [
31], the development of upstream reservoirs significantly impacted the trend change, decadal frequency change, and periodic change that occurred when the evolution of hydrological drought responded to meteorological drought.
The seasonal characteristics of climate change and human activities are usually easy to be ignored [
32,
33], and the hydrological response to climate has been shown to be seasonal because the relative impacts of different water sources, climatic conditions, hydrological processes, and water resource management vary throughout the hydrological year [
34]. The construction and operation of a large number of reservoirs in the JRB in recent years have significantly altered the seasonal characteristics of runoff. Huang et al. [
8] found seasonal variations in propagation time, with shorter intervals during spring and summer, and extended durations during fall and winter. Influenced by the rules of reservoir operation, crop sowing has a certain seasonality, and thus responds to the fact that much of the water in the reservoirs during the dry season may be used for irrigation [
35], and water conservancy projects are also required to store a certain amount of water at the end of the flood season. Therefore, under the influence of reservoir control, large- and medium-sized reservoirs will store part of the flood water during the flood season to ensure the safety of people’s cultivated land located downstream. In addition to meeting water demand during the dry season, many water conservancy projects to store water also make runoff decrease.
On the whole, water management projects wield a substantial regulatory influence on runoff dynamics, significantly mitigating hydrological droughts and extending their propagation timeline. Zhang et al. [
36] and Ye et al. [
37] showed that the intricate interactions between meteorological and hydrological aridity indices at different time scales can change significantly when affected by human activities. Indeed, land-use change [
38], the building and work of reservoirs [
39], water extraction for irrigation [
40], and so on, increase or modify the complex hydrological process’s responsiveness to climate conditions. The transformative impact of reservoir construction and operation pre-2010 and post-2010 reverberates through the hydrological cycle within the watershed. Reservoirs wield the capacity to reshape the precipitation–runoff nexus during dry periods by intercepting flood surges for subsequent rainy season storage, subsequently releasing water for dry season irrigation and other uses. This necessitates a deeper exploration into the effects and mechanisms underlying drought propagation, acknowledging the multifaceted impacts of evolving environmental dynamics and human interventions [
41,
42].
5. Conclusions
This study analyzed the linkages between meteorological and hydrological drought in the JRB under changing environments using hydrometeorological drought models and the complex SWAT hydrological model. The main conclusions were as follows:
(1) Meteorological drought can be found frequently within the expanse of the JRB, with notably elevated frequencies observed in its upstream domain. The spatial distribution exhibited variability, characterized by the prevalence of regional droughts over basin-wide events. The analysis showed that the temperature across the JRB increased significantly, while the precipitation decreased from the upper to the lower reaches.
(2) The frequency of hydrological drought in the JRB has been on the rise over the past six decades; moreover, the intensification of hydrological drought incidents has been found since the onset of the 21st century. Through the lens of travel theory, discernible epochs of heightened hydrological drought frequency come to the fore, accentuating the imperative for the establishment of early warning systems and the assurance of water resource security.
(3) The correlation analyses between meteorological drought and hydrological drought showed stronger correlations in the middle and lower reaches of the watershed, with seasonality showing greater correlations in the summer and fall. The transmission duration during the flood season was shorter, whereas in the dry season, it was more protracted. The seasonal fluctuations showed a shorter duration of propagation from meteorological to hydrological drought, which was particularly evident during the flood season. Overall, this study highlights the increased incidence of hydrological drought events in the JRB, underscoring the importance of understanding climate–water interactions, and thus the indispensability of drought monitoring and management strategies to effectively mitigate potential impacts.
