Article

Release of Microplastics from Urban Wastewater Treatment Plants to Aquatic Ecosystems in Acapulco, Mexico

by
Enrique J. Flores-Munguía
1,
José Luis Rosas-Acevedo
1,*,
Aurelio Ramírez-Hernández
2,
Alejandro Aparicio-Saguilan
3,
Rosa M. Brito-Carmona
1 and
Juan Violante-González
4
1
Centro de Ciencias de Desarrollo Regional, Universidad Autónoma de Guerrero, Privada de Laurel No. 13, Col. El Roble, Acapulco C.P. 39640, Mexico
2
Instituto de Química Aplicada, Universidad del Papaloapan, Circuito Central 200, Col. Parque Industrial, Tuxtepec C.P. 68301, Mexico
3
Instituto de Biotecnología, Universidad del Papaloapan, Circuito Central 200, Col. Parque Industrial, Tuxtepec C.P. 68301, Mexico
4
Facultad de Ecología Marina, Universidad Autónoma de Guerrero, Gran vía Tropical No. 20, Col. Fraccionamiento Las Playas, Acapulco C.P. 39390, Mexico
*
Author to whom correspondence should be addressed.
Water 2023, 15(20), 3643; https://doi.org/10.3390/w15203643
Submission received: 10 September 2023 / Revised: 7 October 2023 / Accepted: 15 October 2023 / Published: 17 October 2023
(This article belongs to the Topic Microplastics Pollution)

Abstract

:
Contamination of aquatic ecosystems by microplastics (MPs) is mainly due to the release of high levels of MP particles from treated effluents by wastewater treatment plants (WWTPs). Due to the lack of policies and regulations establishing criteria for the control and elimination of MPs from WWTP effluents, this research evaluates the presence of 38 and 150 µm MPs in influents and effluents from three WWTPs in the port of Acapulco, Mexico. Optical microscopy and Fourier transform infrared spectroscopy revealed that the MPs were polyethylene, polypropylene, polyethylene terephthalate, and polyvinyl chloride. MP removal efficiencies of 82.5–98.7% (38 µm) and 86.8–97.5% (150 µm) were achieved. Moreover, the MP average daily emissions to the receiving bodies of the three WWTPs ranged from 9.5 × 10⁶ to 4.70 × 10⁸ particles, while the annual emissions ranged from 3.05 × 10⁹ to 1.72 × 10¹¹ particles. This work reveals the urgency of implementing regulatory policies to avoid the continuous emission of MPs into aquatic ecosystems from WWTPs in Acapulco, Mexico.

1. Introduction

Approximately 6.3 billion metric tons of plastics are consumed worldwide each year, ultimately discarded into the environment, with a high potential to generate large amounts of microplastics (MPs) [1,2]. MPs have different morphologies and polymeric compositions and range in size from 5 mm to the nanometric scale. MPs originate from industrial production (primary MPs) or the fragmentation of larger plastic waste (secondary MPs) [3]. Indeed, they have been identified in soil, air, and water, with those composed of polypropylene (PP), polyethylene (PE), polyethylene terephthalate (PET), and polyvinyl chloride (PVC) being the most common [4]. These MPs constitute emerging pollutants as they have not yet been incorporated into regulatory environmental standards. However, due to their multidimensional nature, they pose a potential risk to the health of aquatic and terrestrial ecosystems as all living organisms are exposed to them [5,6]. Recent sex-based estimates revealed that girls, women, boys, and men consume or inhale 74,060, 98,305, 81,331, and 121,664 MP particles each year, respectively [7]. Additionally, MPs have been identified in the human placenta, feces, intestinal tract, and blood [8,9,10,11]. Meanwhile, PET reportedly alters the intestinal fauna and affects the genomic stability of human lymphocytes [10,11].
Due to the complexity and polymeric diversity of MPs, standardized protocols have yet to be established to precisely and accurately determine their accurate concentration in aquatic and terrestrial ecosystems. Meanwhile, their emissions and transfer greatly hinder the implementation of policies and regulations regarding the maximum permissible limits to control and eliminate MPs in the environment [12]. Nevertheless, recent research has adopted various protocols to sample, treat, quantify, and identify MPs. The most widely used analytical techniques for their identification include optical microscopy, Fourier transform infrared (FTIR) spectroscopy, Raman spectroscopy, and Pyr/GC/MS [13]. In particular, FTIR is the most commonly employed technique for identifying MPs originating from wastewater treatment plants (WWTPs) [14]. For example, FTIR spectroscopy coupled with optical microscopy can determine the polymeric composition of ≥20 µm MPs [12].
According to the physicochemical characteristics of wastewater (municipal or industrial), different types of WWTPs (secondary or tertiary) eliminate pollutants according to the policies and regulatory criteria of each country for their control and removal [15]. The removal efficiencies of MPs in WWTPs (secondary and tertiary) are approximately 90 to 98%. Nonetheless, the treated effluents continue to carry MPs that are transferred to the receiving bodies. Accordingly, WWTP discharge is considered an emission and exposure source for MPs to aquatic and terrestrial ecosystems [16,17,18,19,20,21,22,23]. However, the current standards that establish the quality criteria applied to treated wastewater do not include MPs within their reference framework; hence, MPs continue to contaminate aquatic and terrestrial ecosystems. Regarding Mexico, the official Mexican standards (NOM-001-SEMARNAT-2021; NOM-002-SEMARNAT-1996; NOM-SEMARNAT-1997) do not consider MPs within their regulatory framework. Instead, only the maximum permissible limits are established regarding the quality of discharge from WWTPs with effluents destined for aquatic and terrestrial receiving bodies [24,25,26,27].
Due to the lack of standards to regulate and establish maximum permissible limits in Mexico, the current study sought to assess the levels of MPs in WWTP emissions and the associated pollution of the environment in Mexico. To this end, we applied optical microscopy and FTIR spectroscopy to detect, quantify, and characterize MPs (150–38 µm) in wastewater and wastewater treated in three urban secondary WWTPs in Acapulco. Moreover, we estimated the removal percentages for these pollutants based on the MP concentrations in the influents and effluents of each WWTP to project their daily and annual emissions to receiving bodies. Collectively, the results of this study provide insights for the development of technical and methodological criteria to create policies and regulatory norms to eliminate MPs from effluents and mitigate future damage to the environment.

2. Materials and Methods

2.1. WWTP Evaluation

Sampling was carried out at three WWTPs in Acapulco (16°51′46′’ N 99°53′13′’ W), Guerrero (17°36′47″ N 99°57′00″ W), Mexico (19°25′10″ N 99°08′44″ W) (Figure 1). These WWTPs are operated by the para-municipal body; their purification systems comprise activated sludge (secondary treatment). WWTP A (16°48′04″ N 99°48′03″ W) is in the eastern part of the city with an operating capacity of 23 L/s for a population of 10,948 inhabitants; the receiving body is the Tres Palos lagoon. WWTP B (16°53′03′’ N 99°49′12″ W) is in the suburban area of the city with a 350 L/s operating capacity for a population of 166,600 inhabitants; its effluents are discharged into the Sabana River—a tributary of the Tres Palos lagoon. WWTP C (16°51′34″ N 99°54′30″ W) is in the western part of the city and has an operating capacity of 650 L/s for a population of 309,400 inhabitants; its effluents are discharged into the sea through Olvidada beach.
Influent and effluent samples from the three WWTPs were collected via point sampling during June and July (dry season) and October and November (rainy season) of 2022. The influent samples (4 L each) were collected from the intake pit at the WWTP after screening. Effluent samples (20 L each) were collected at the WWTP outlet. After collection, the samples were transported to the laboratory and stored at 15 °C.

2.2. MP Separation

MPs were separated from influents and effluents based on the methodologies reported by the National Oceanic and Atmospheric Administration (NOAA) and other researchers [18,28,29,30,31,32,33]. Influent samples were successively passed through mesh with 300 µm (to retain the larger solids), 150 µm, and 38 µm pores. The sieves were rinsed with distilled water to remove MP particles and deposit them in a beaker. MPs were dried in an oven at ±80 °C for 12 h and digested by adding 30 mL of 30% H2O2 and incubating at 60 °C for 2 h. To influent samples, 30 mL of H2O2 was added and incubated for 2 h to improve the digestion of organic matter. Once digestion was complete, the solutions were cooled to room temperature. Subsequently, density-based separation was carried out by adding 60 mL of ZnCl2 (1.62 g/cm3) to the samples in separation funnels, allowing them to settle for 12 h. Under vacuum, the supernatant was passed through 47-mm glass fiber filters that were later placed in Petri dishes for MP counting and identification.

2.3. Quality Control

Cotton lab coats, gloves, and face masks were used to avoid cross-contamination. Prior to sample processing, all areas of the laboratory were cleaned using distilled water and 30% (v/v) ethanol. All reagents were vacuum filtered through Whatman® filters (grade 41, 125 diameter). Blanks (distilled water) were collected and analyzed according to the same protocol used for the influent and effluent samples.
To assess the atmospheric quality of the laboratory, open Petri dishes with Whatman® filter paper (grade 41, 125 in diameter) were placed on laboratory surfaces throughout the experimental process. Subsequently, the exposed discs were analyzed by light microscopy. Additionally, commercial PVC, PE, PET, and PP plastics were included as references to determine the composition of the MPs within the influents and effluents of the WWTPs. The glass microfiber filter used during sample filtration was analyzed by FTIR to rule out interference in the spectra.

2.4. MP Characterization

MP characterization was carried out based on the classification criteria proposed by Hidalgo-Ruz et al. [5], which considers color and morphology. MPs were quantified and identified using a SWIFT® M10 Series optical microscope with 4X and 40X objectives. Infrared spectra of the MPs were recorded at room temperature in a Perkin-Elmer Spectrum 100FT-IR (ATR) spectrometer with a 4 cm−1 resolution and were averaged over 4 scans in the 4000–650 cm−1 range.

2.5. Daily and Annual Projections of Removal Efficiencies

Removal efficiencies were calculated based on the MP abundance in the influents and effluents, according to the method described by Talvitie et al. [34]. Additionally, the daily and annual projections of MP release to the receiving bodies were determined by multiplying the MP concentration in effluents (MP/L) by the average daily operating flow in each WWTP (L/day). Annual concentrations were determined by multiplying the total daily MP quantities by 365 [20].

2.6. Statistical Analysis

One factor analysis of variance (ANOVA) was performed to compare the three WWTPs with respect to their MP removal efficiency. A p < 0.05 was considered statistically significant.

3. Results and Discussion

3.1. MP Detection

Optical microscopy of the influents and effluents collected from the three WWTPs, revealed 38–150 µm MPs (Figure 2).
The MPs detected in the secondary treatment WWTPs were similar in morphology to those previously reported but of different sizes [17,18,19,20,21,35,36,37]. MPs from 10 to 1000 µm [31], 20 to ≥500 µm [38], 43 to 355 µm [13], 10 to 5000 µm [19], 20 to 200 µm [20], and 20 to ≥300 µm [33] have been reported. Regarding WWTPs with tertiary treatment systems [29,34], the MP morphology and appearance were similar to those in the current study. Therefore, unitary wastewater treatment systems do not affect the appearance or morphology of MPs in influents and effluents.

3.2. MP Physical Characterization
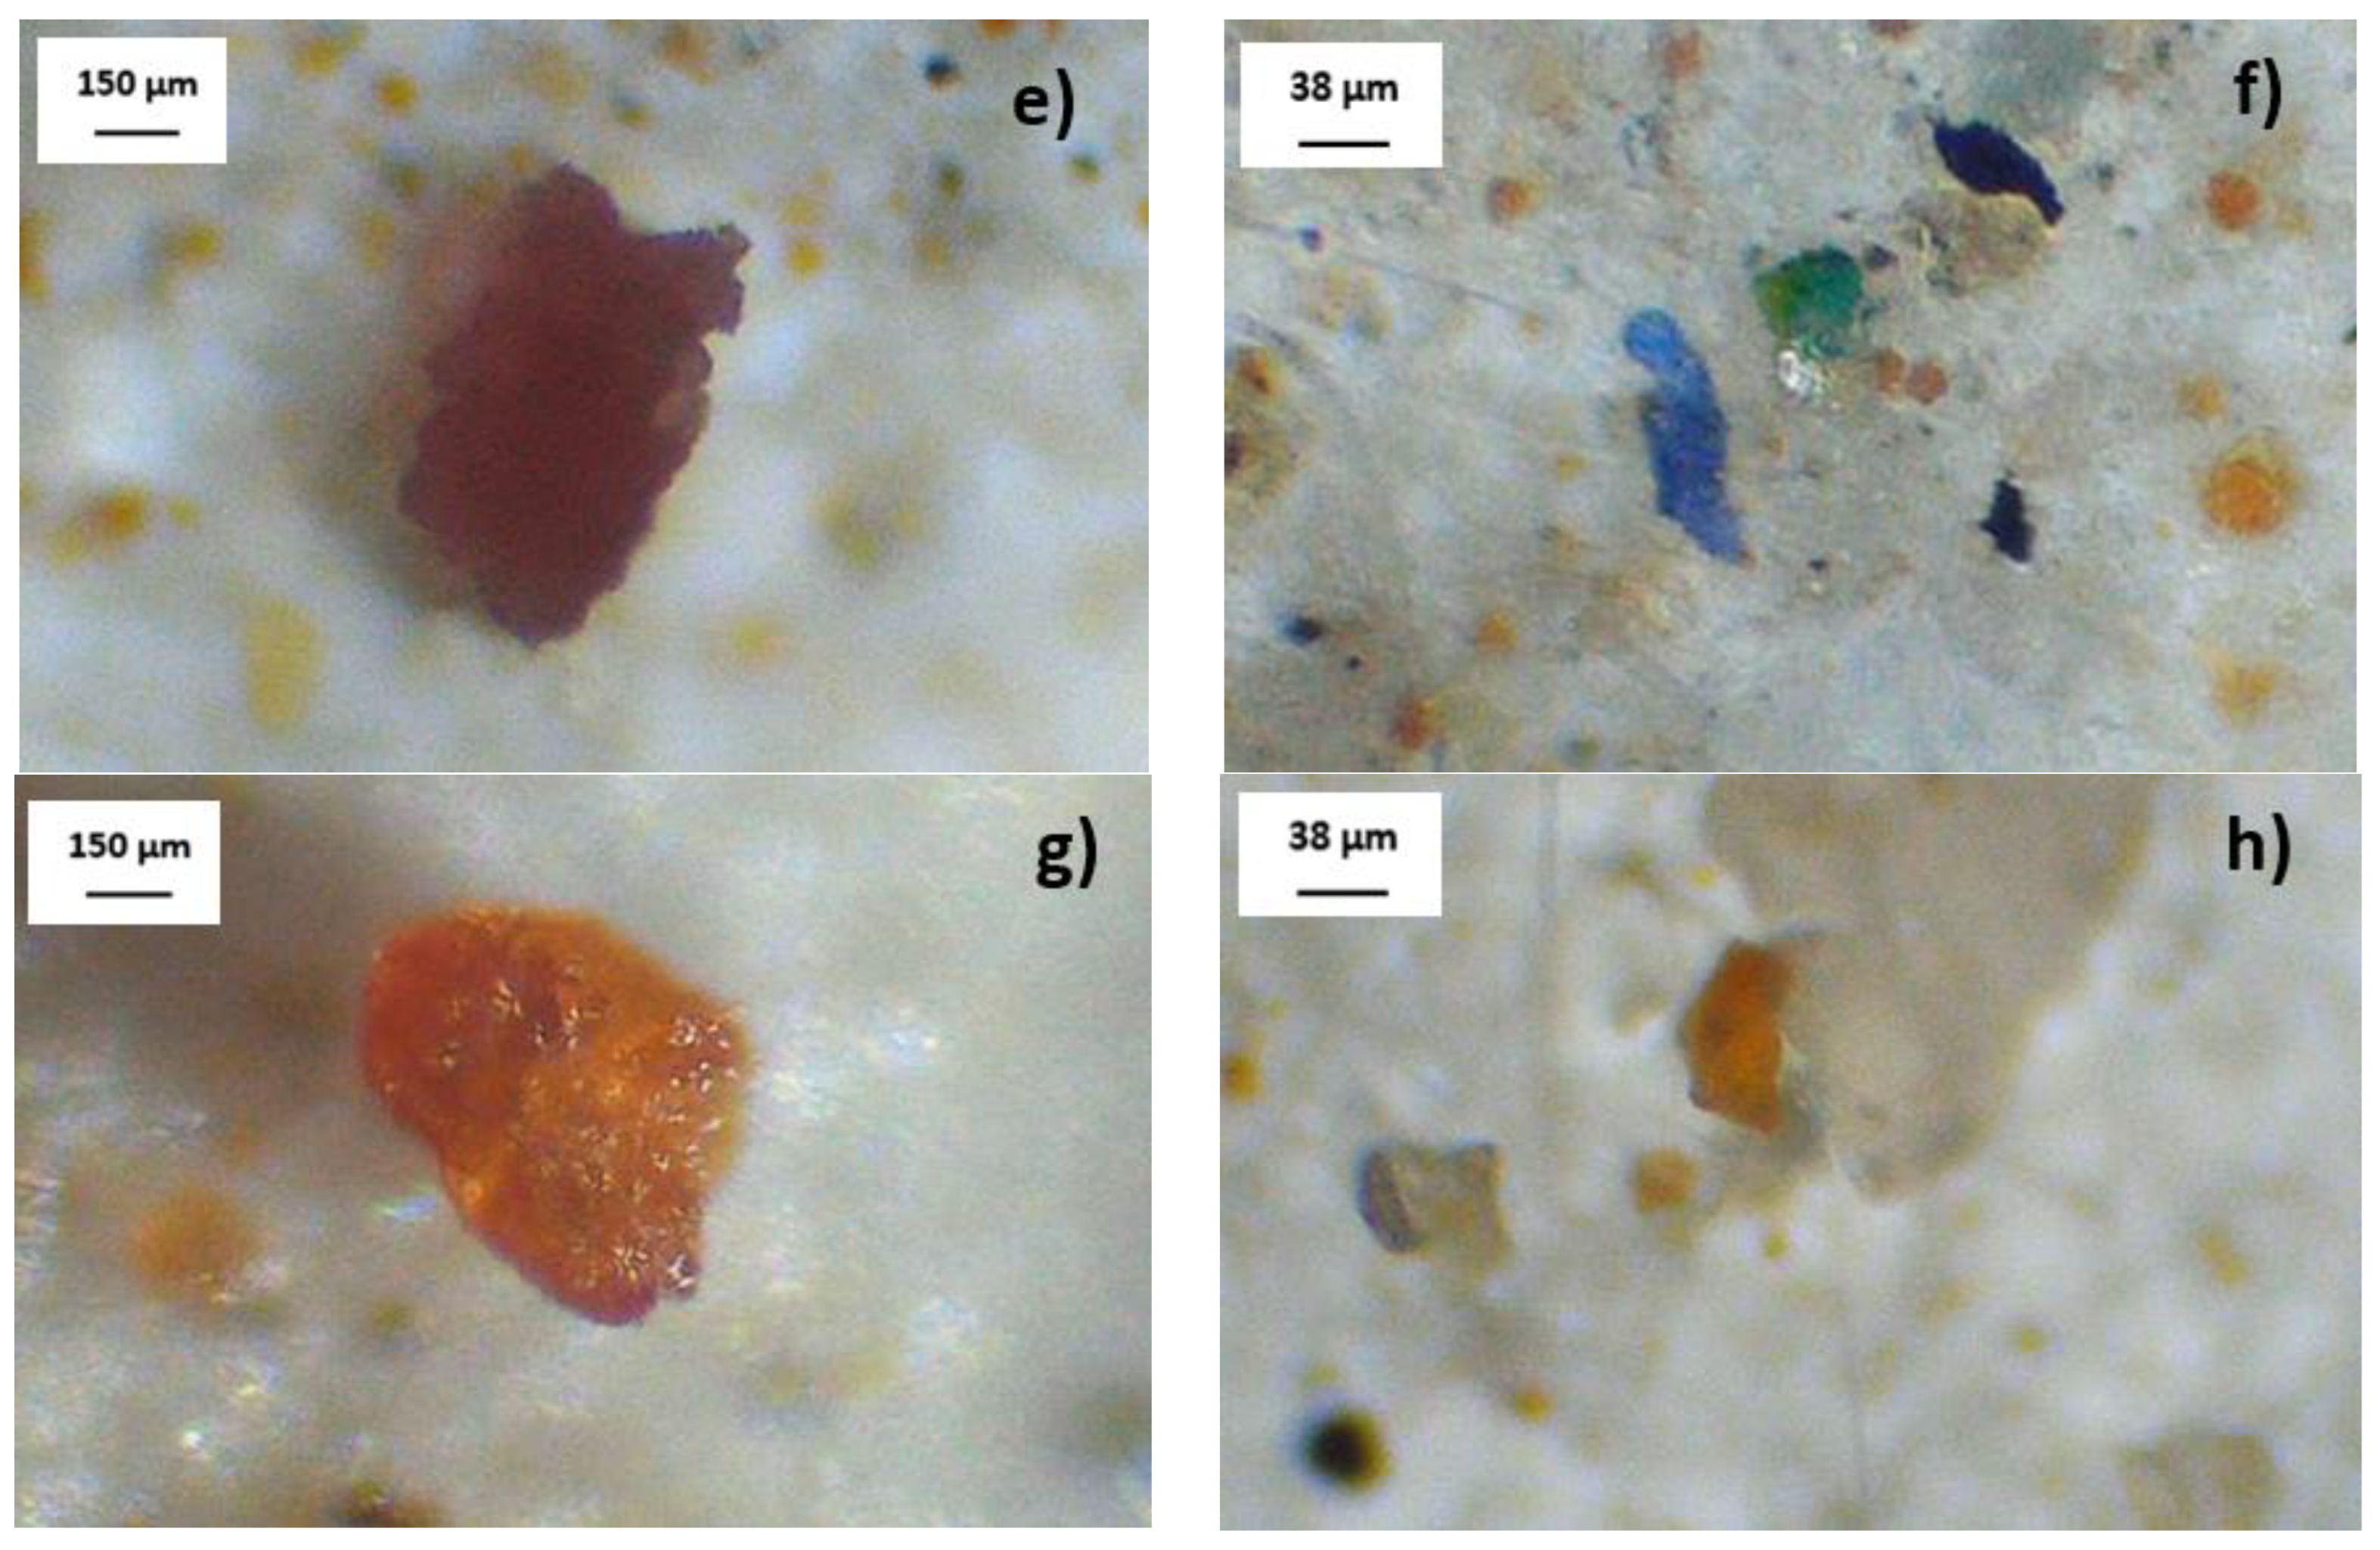
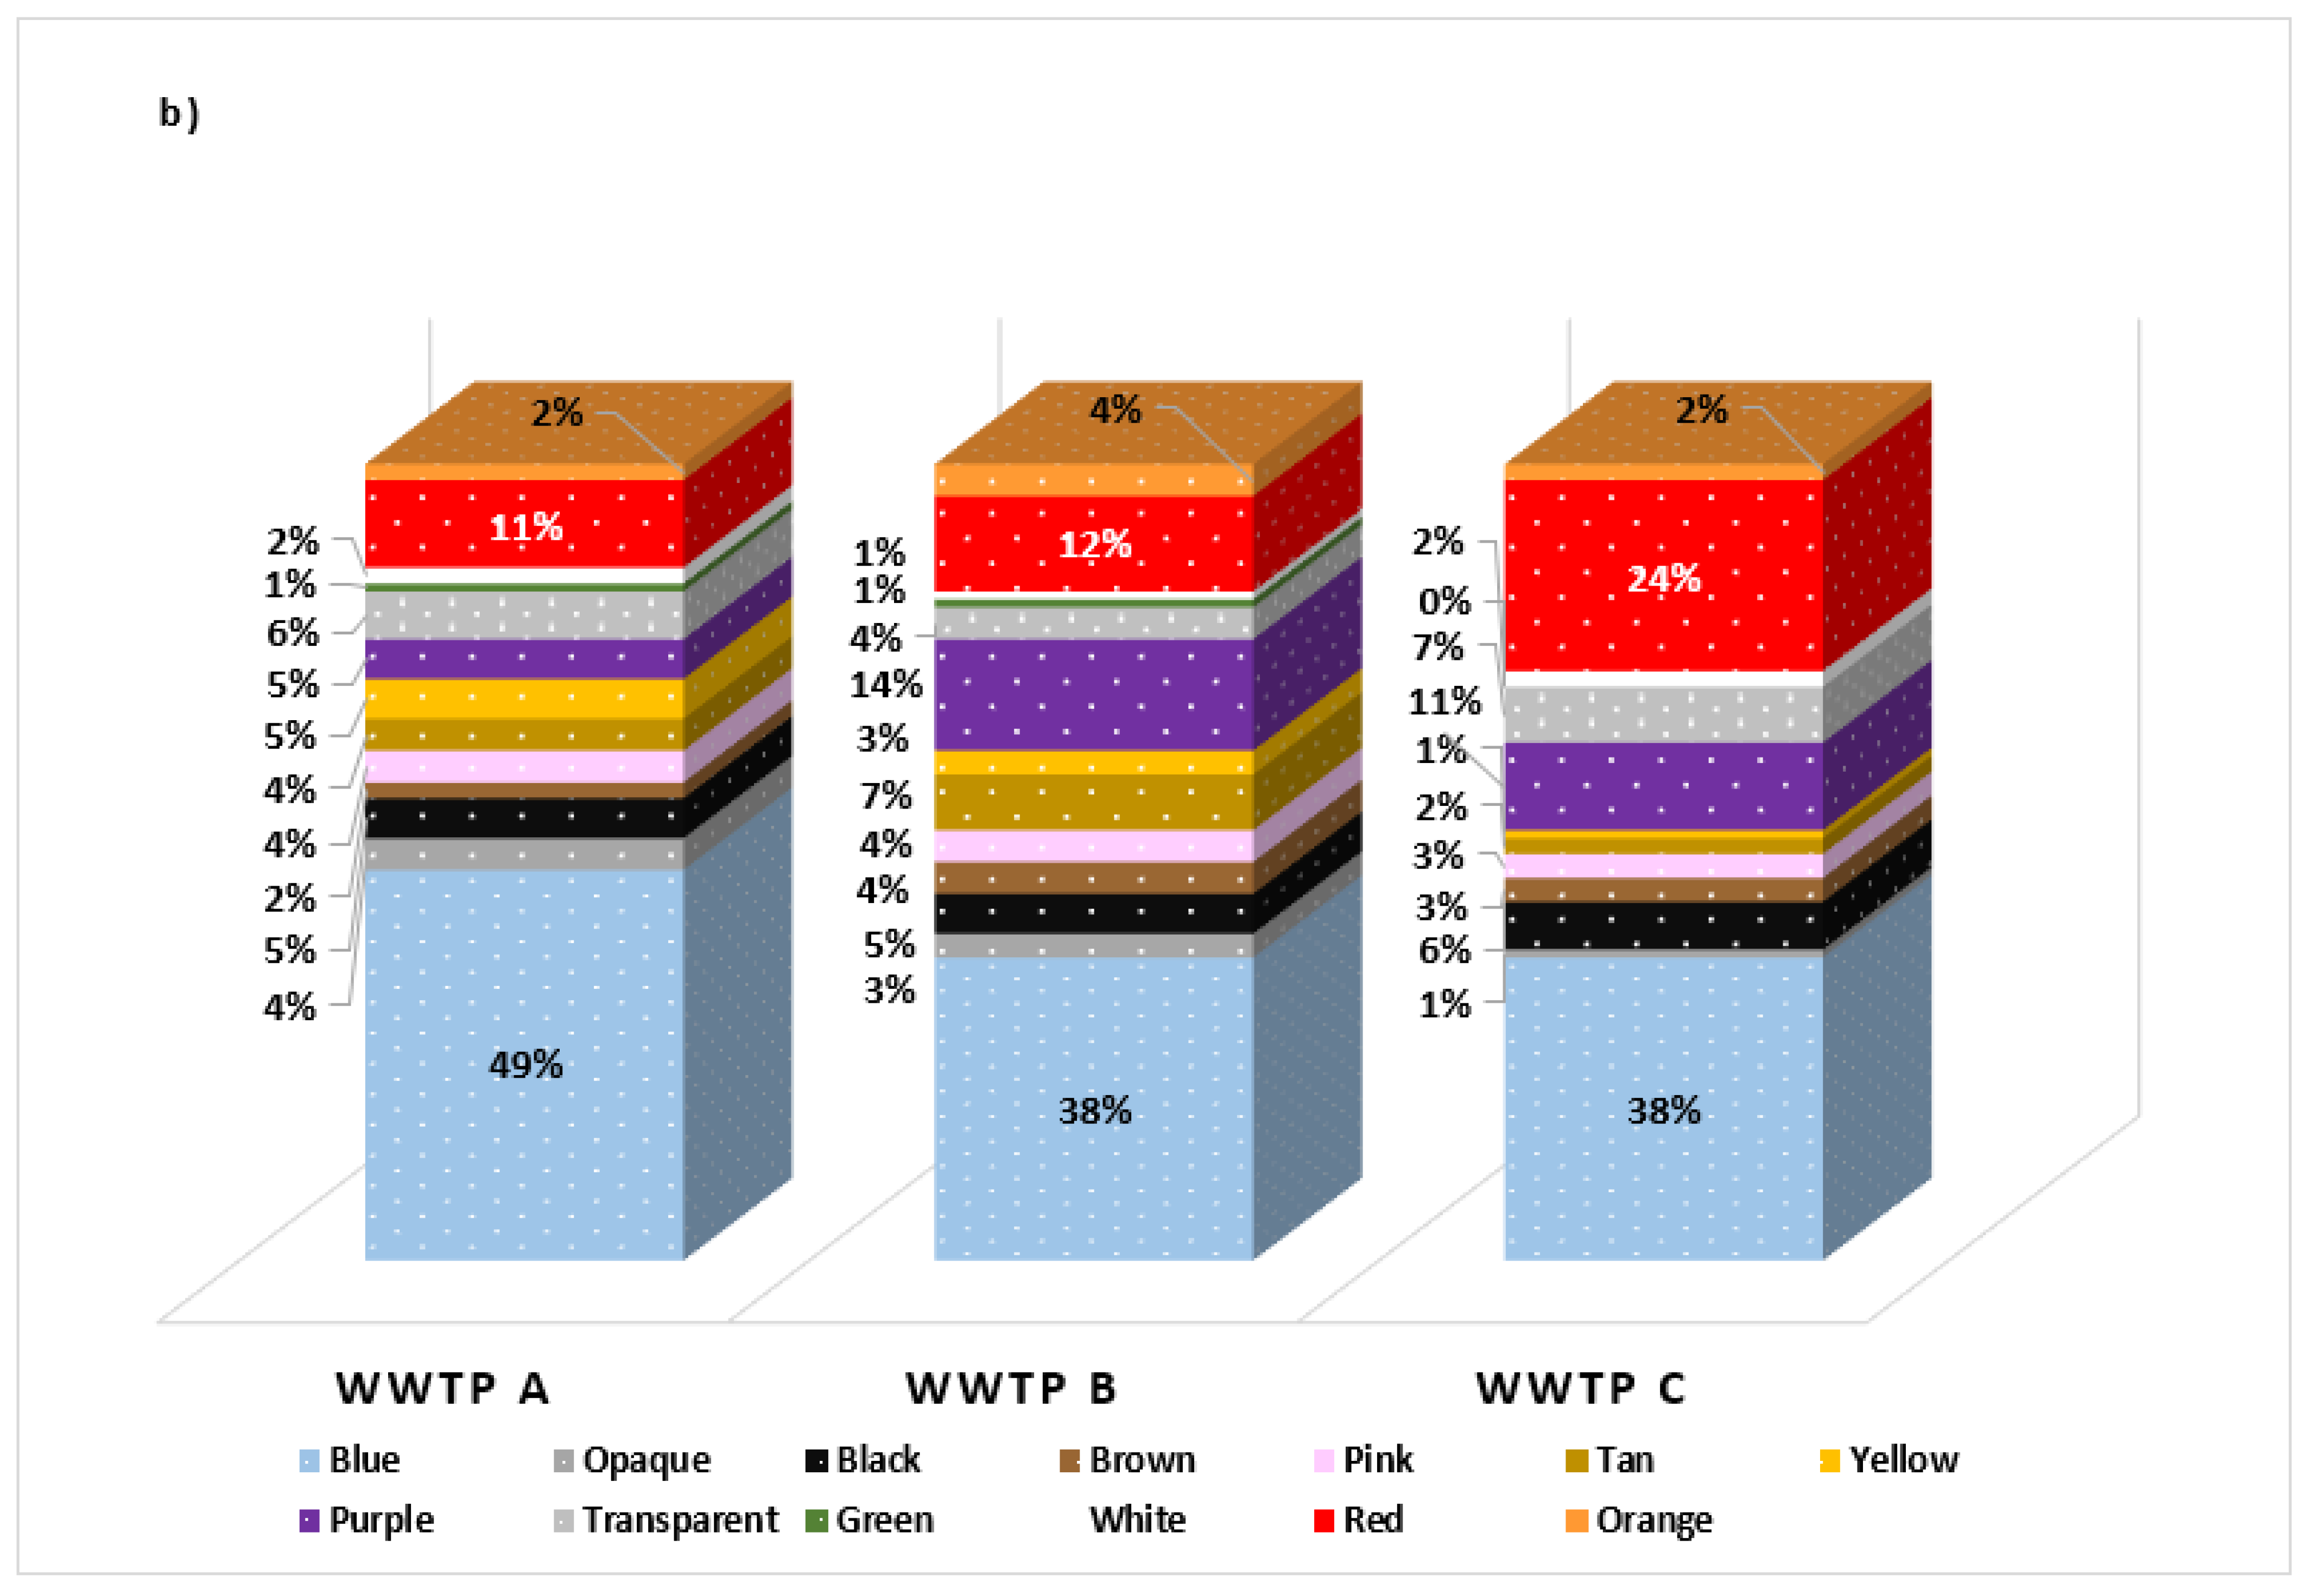
3.2.1. MP Color

The MPs detected in a four-month sampling period from WWTP influents and effluents were diverse colors according to the classification of Hidalgo-Ruz et al. [5] (Figure 3).
In the influents, black MPs were the most abundant in WWTP A (28.1%) and B (29.9%), while in WWTP C, red MPs were the most abundant (33.7%). Conversely, blue MPs predominated all effluents (WWTP A: 49%, WWTPs B and C: 38%), followed by red and purple MP. Meanwhile, the proportion of transparent plastics in the influents of WWTP A, B, and C was 6, 4, and 7%, respectively (Figure 4). Hence, black MPs predominated the influents, followed by transparent and blue [18]. In Scotland, red MPs were the most abundant (26.7%), followed by blue (25.4%) and green (19.1%) [20]. In China, white PMs represent 27.3% of the quantified plastics [13]. It should be noted that different MP colors are due to additives used to alter the plastic pigmentation [39]. Since chemical additives in polymers, such as PE, PVC, and PA, can be toxic, MPs pose an environmental risk. However, this toxicity is often due not only to the presence of these polymers but also to the leachates from their additives [40]. For example, the blue coloration in plastics may be due to the use of cobalt (II) diacetate (C4H6CoO4) in PET; to achieve red pigmentation, various additives are used, including cadmium selenide (CdSe), lead sulfate (PbSO4) and lead molybdate (PbMoO4), which are applied to various plastics [41]. Indeed, the chemical production of additives is constantly increasing, with an estimated 20,000 million tons of plastics containing additives produced by 2050 [22]. Accordingly, aquatic and terrestrial ecosystems will continue to be exposed to constant MP emissions and other associated pollutants (heavy metals) if adequate regulations for using additives in the plastic industry are not implemented.
The abundance of MPs of different colors in the influents and effluents of the analyzed WWTPs reflects the complexity of these polymers that, when transferred to hydrological bodies, pose potential risks to environmental health. Meanwhile, the lack of regulatory policies and standards does not prevent the deliberate emission of MPs, which is a potentially greater threat to the health of ecosystems. Furthermore, not only can the degree of toxicity be attributable to MPs, but their association with chemical additives and heavy metals can represent a toxicological danger [41]. Accordingly, the implementation of regulatory norms should consider the coloration of MPs as an additional criterion for evaluating the quality of the treated effluents discharged into aquatic and terrestrial ecosystems.
In Mexico, there are currently no standards or criteria that regulate the manufacture of plastics and the use of additives, which has a considerable impact on the generation of MPs and their emission and transfer to the environment. Instead, regulations only exist that identify plastic types to guide their selection, separation, collection, and recycling [42].

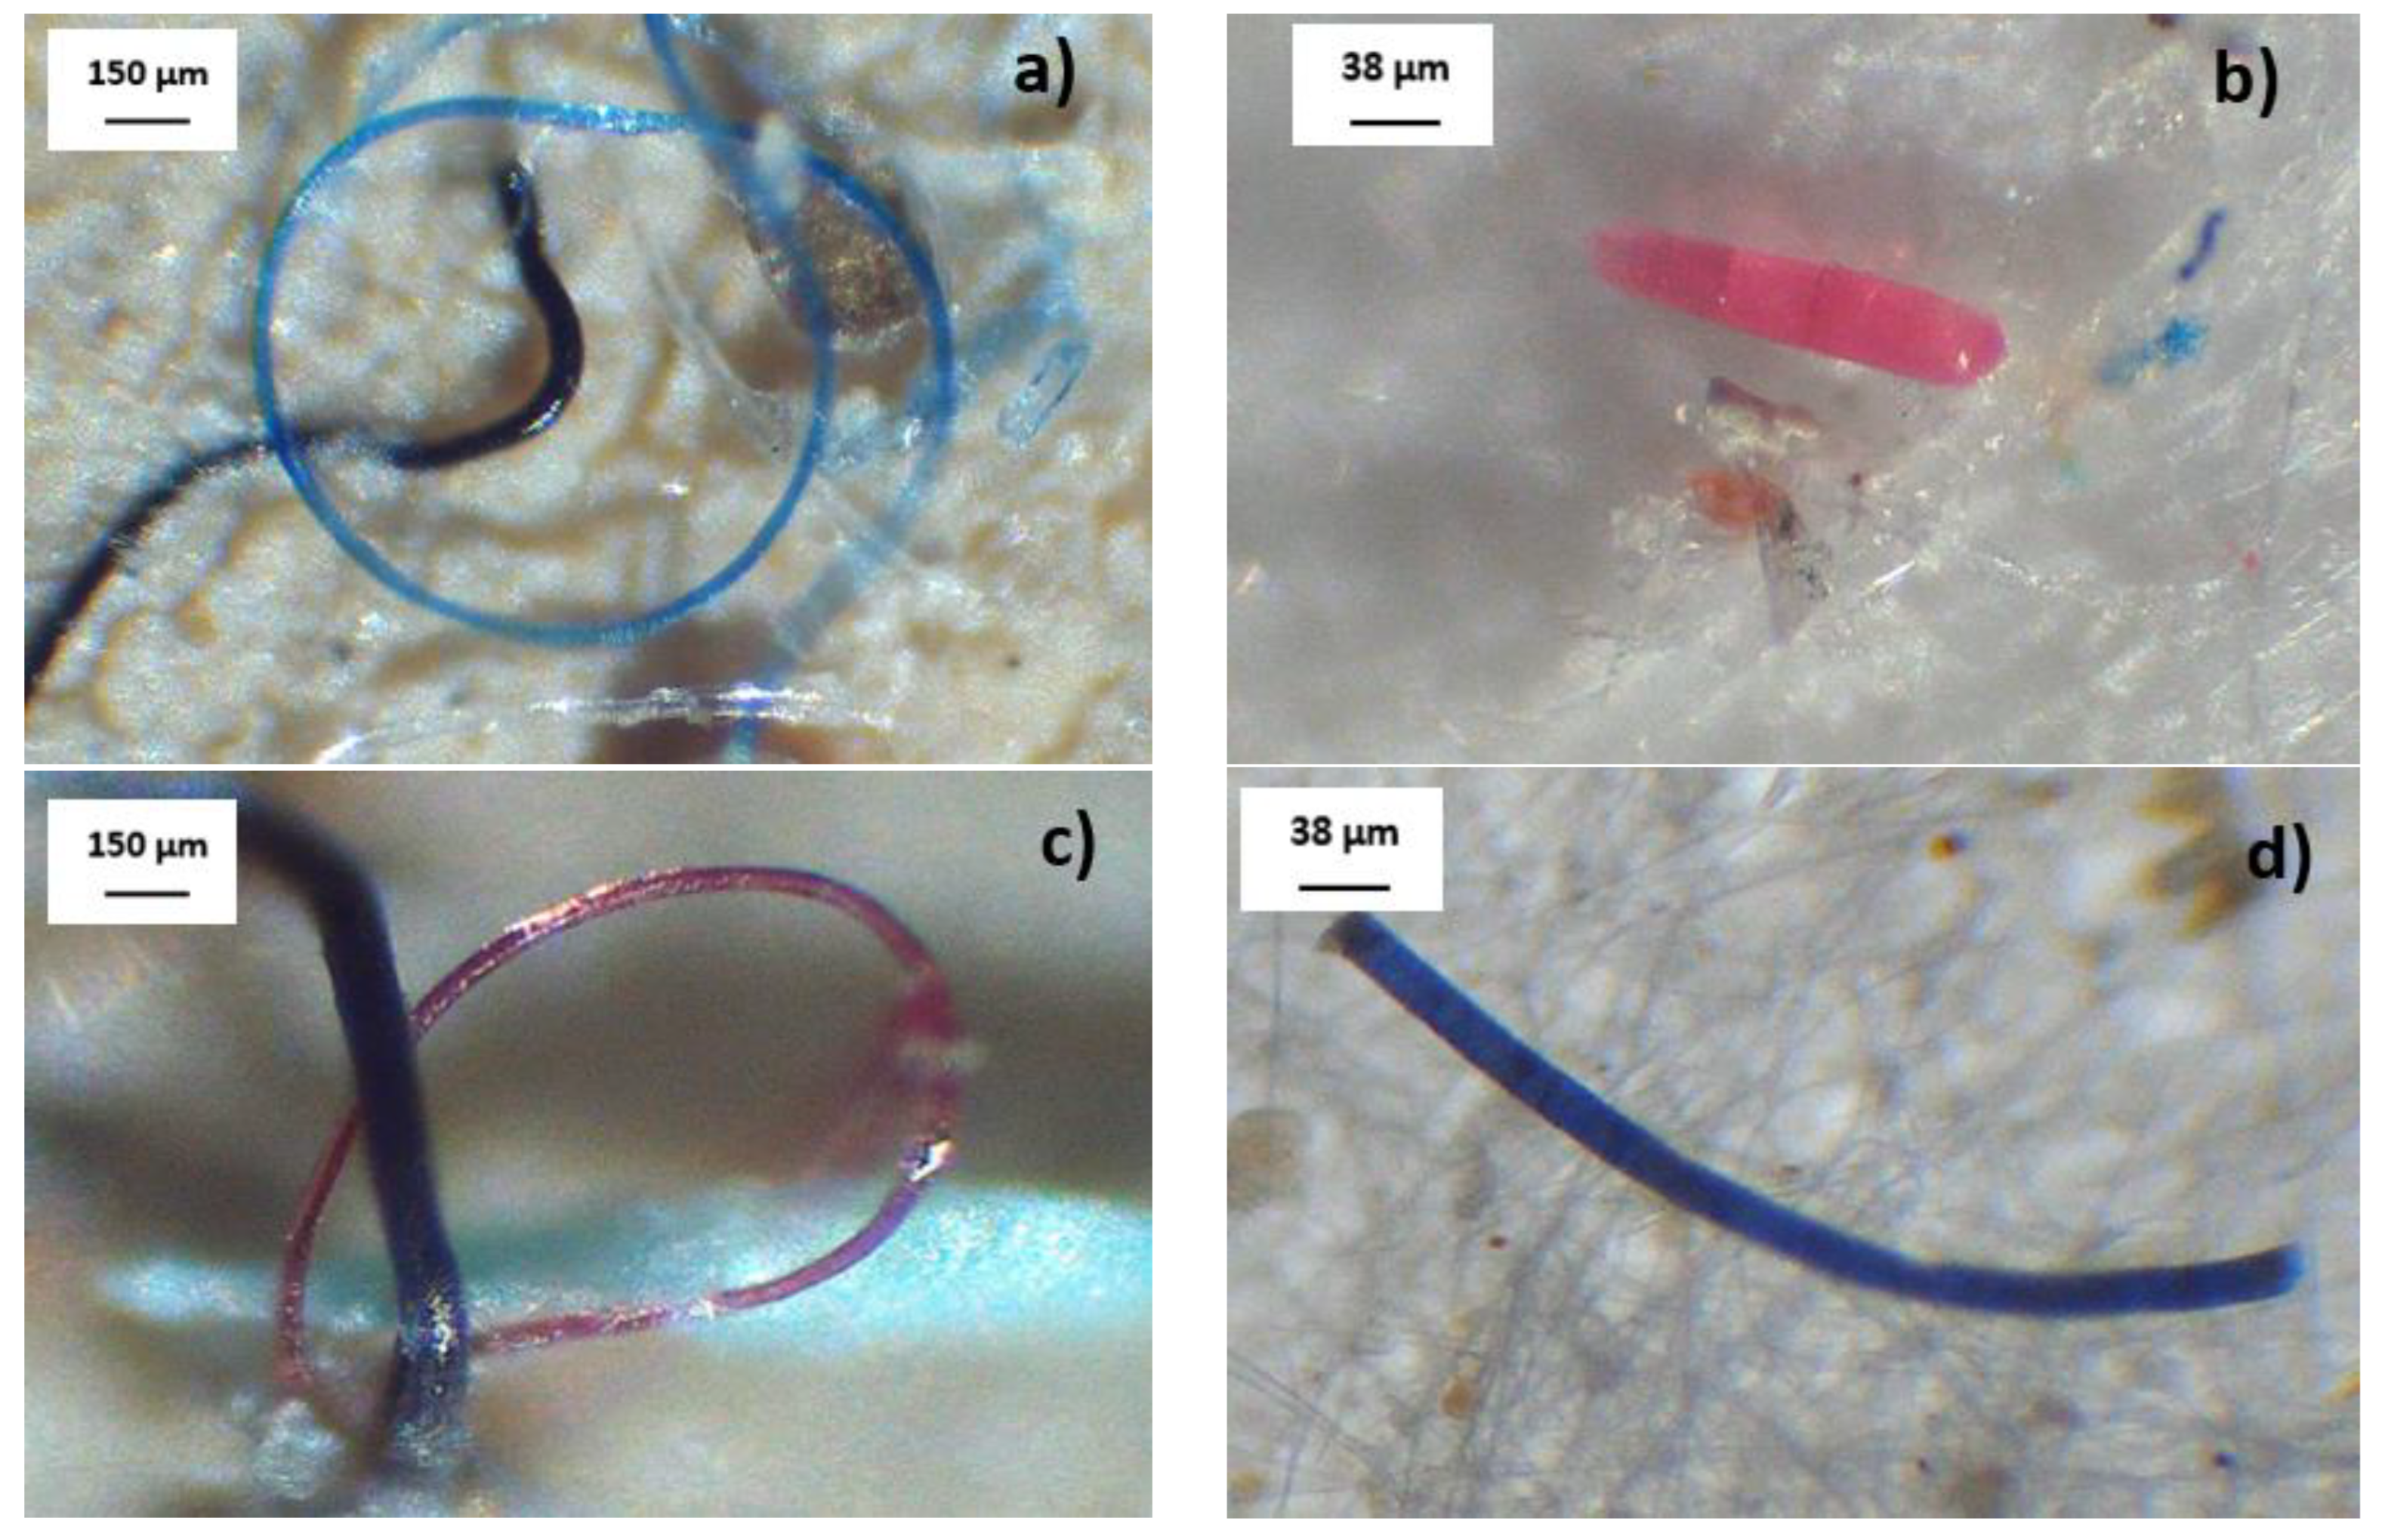
3.2.2. MP Morphology

Various MP forms were detected in the influents and effluents of the three WWTPs, with the fragment-type morphology being the most abundant, followed by filaments (Figure 4). There were no differences between the three WWTPs regarding MP morphological distribution in the treated effluents (one factor ANOVA, F = 0.11, p > 0.05) (Table 1). Therefore, it can be deduced that the MPs entering the three WWTPs and those subsequently released to the receiving bodies present similar morphological characteristics.
In contrast, other studies have reported higher proportions of filaments [18,21,29,43], granules [13], fragments [30], and scales [20]. The morphological classification of MPs informs their degradation mechanism and possible mechanisms of transfer and cellular absorption in organisms of the trophic chain. In this sense, MPs have been defined as vectors of other contaminants and pathogenic microorganisms. Therefore, their morphology offers information on the potential risks of transporting more dangerous pollutants, such as the chemical additives discussed in the previous section.
From the data obtained in this study, it can be deduced that most MPs that enter and leave the WWTPs are secondary; however, significant amounts of filaments have also been detected, suggesting the presence of many primary MPs. Similarly, fragments are the most abundant MP in secondary treatment WWTPs in Korea [44]. MP morphological characterization also provides insights regarding the changes they undergo in their shape and size during purification processes [45]. This informs the establishment of maximum permissible limits of control and the development of technologies and complementary unit operations (tertiary treatment) to be incorporated into current systems in accordance with the morphological typification to effectively eliminate these pollutants from the treated effluents [44,46,47,48]. Countries such as China, Kenya, and the European Union have implemented standards and public policies to reduce plastic pollutant generation. Moreover, in 2020 international agreements were established to reduce single-use plastic products and packaging by up to 20% by 2025 [5]. Despite these measures, there is an urgency to incorporate and establish criteria for MP evaluation and control in effluents treated at WWTPs.
The diverse sizes, colors, and shapes of the MPs destined for various receiving bodies can have different impacts on living organisms [5]. Moreover, the additives used during plastic manufacturing add another pollutant factor to the MPs. Hence, the characterization and classification of these chemical compounds will provide basic theoretical insights to inform the development of regulatory standards [16].

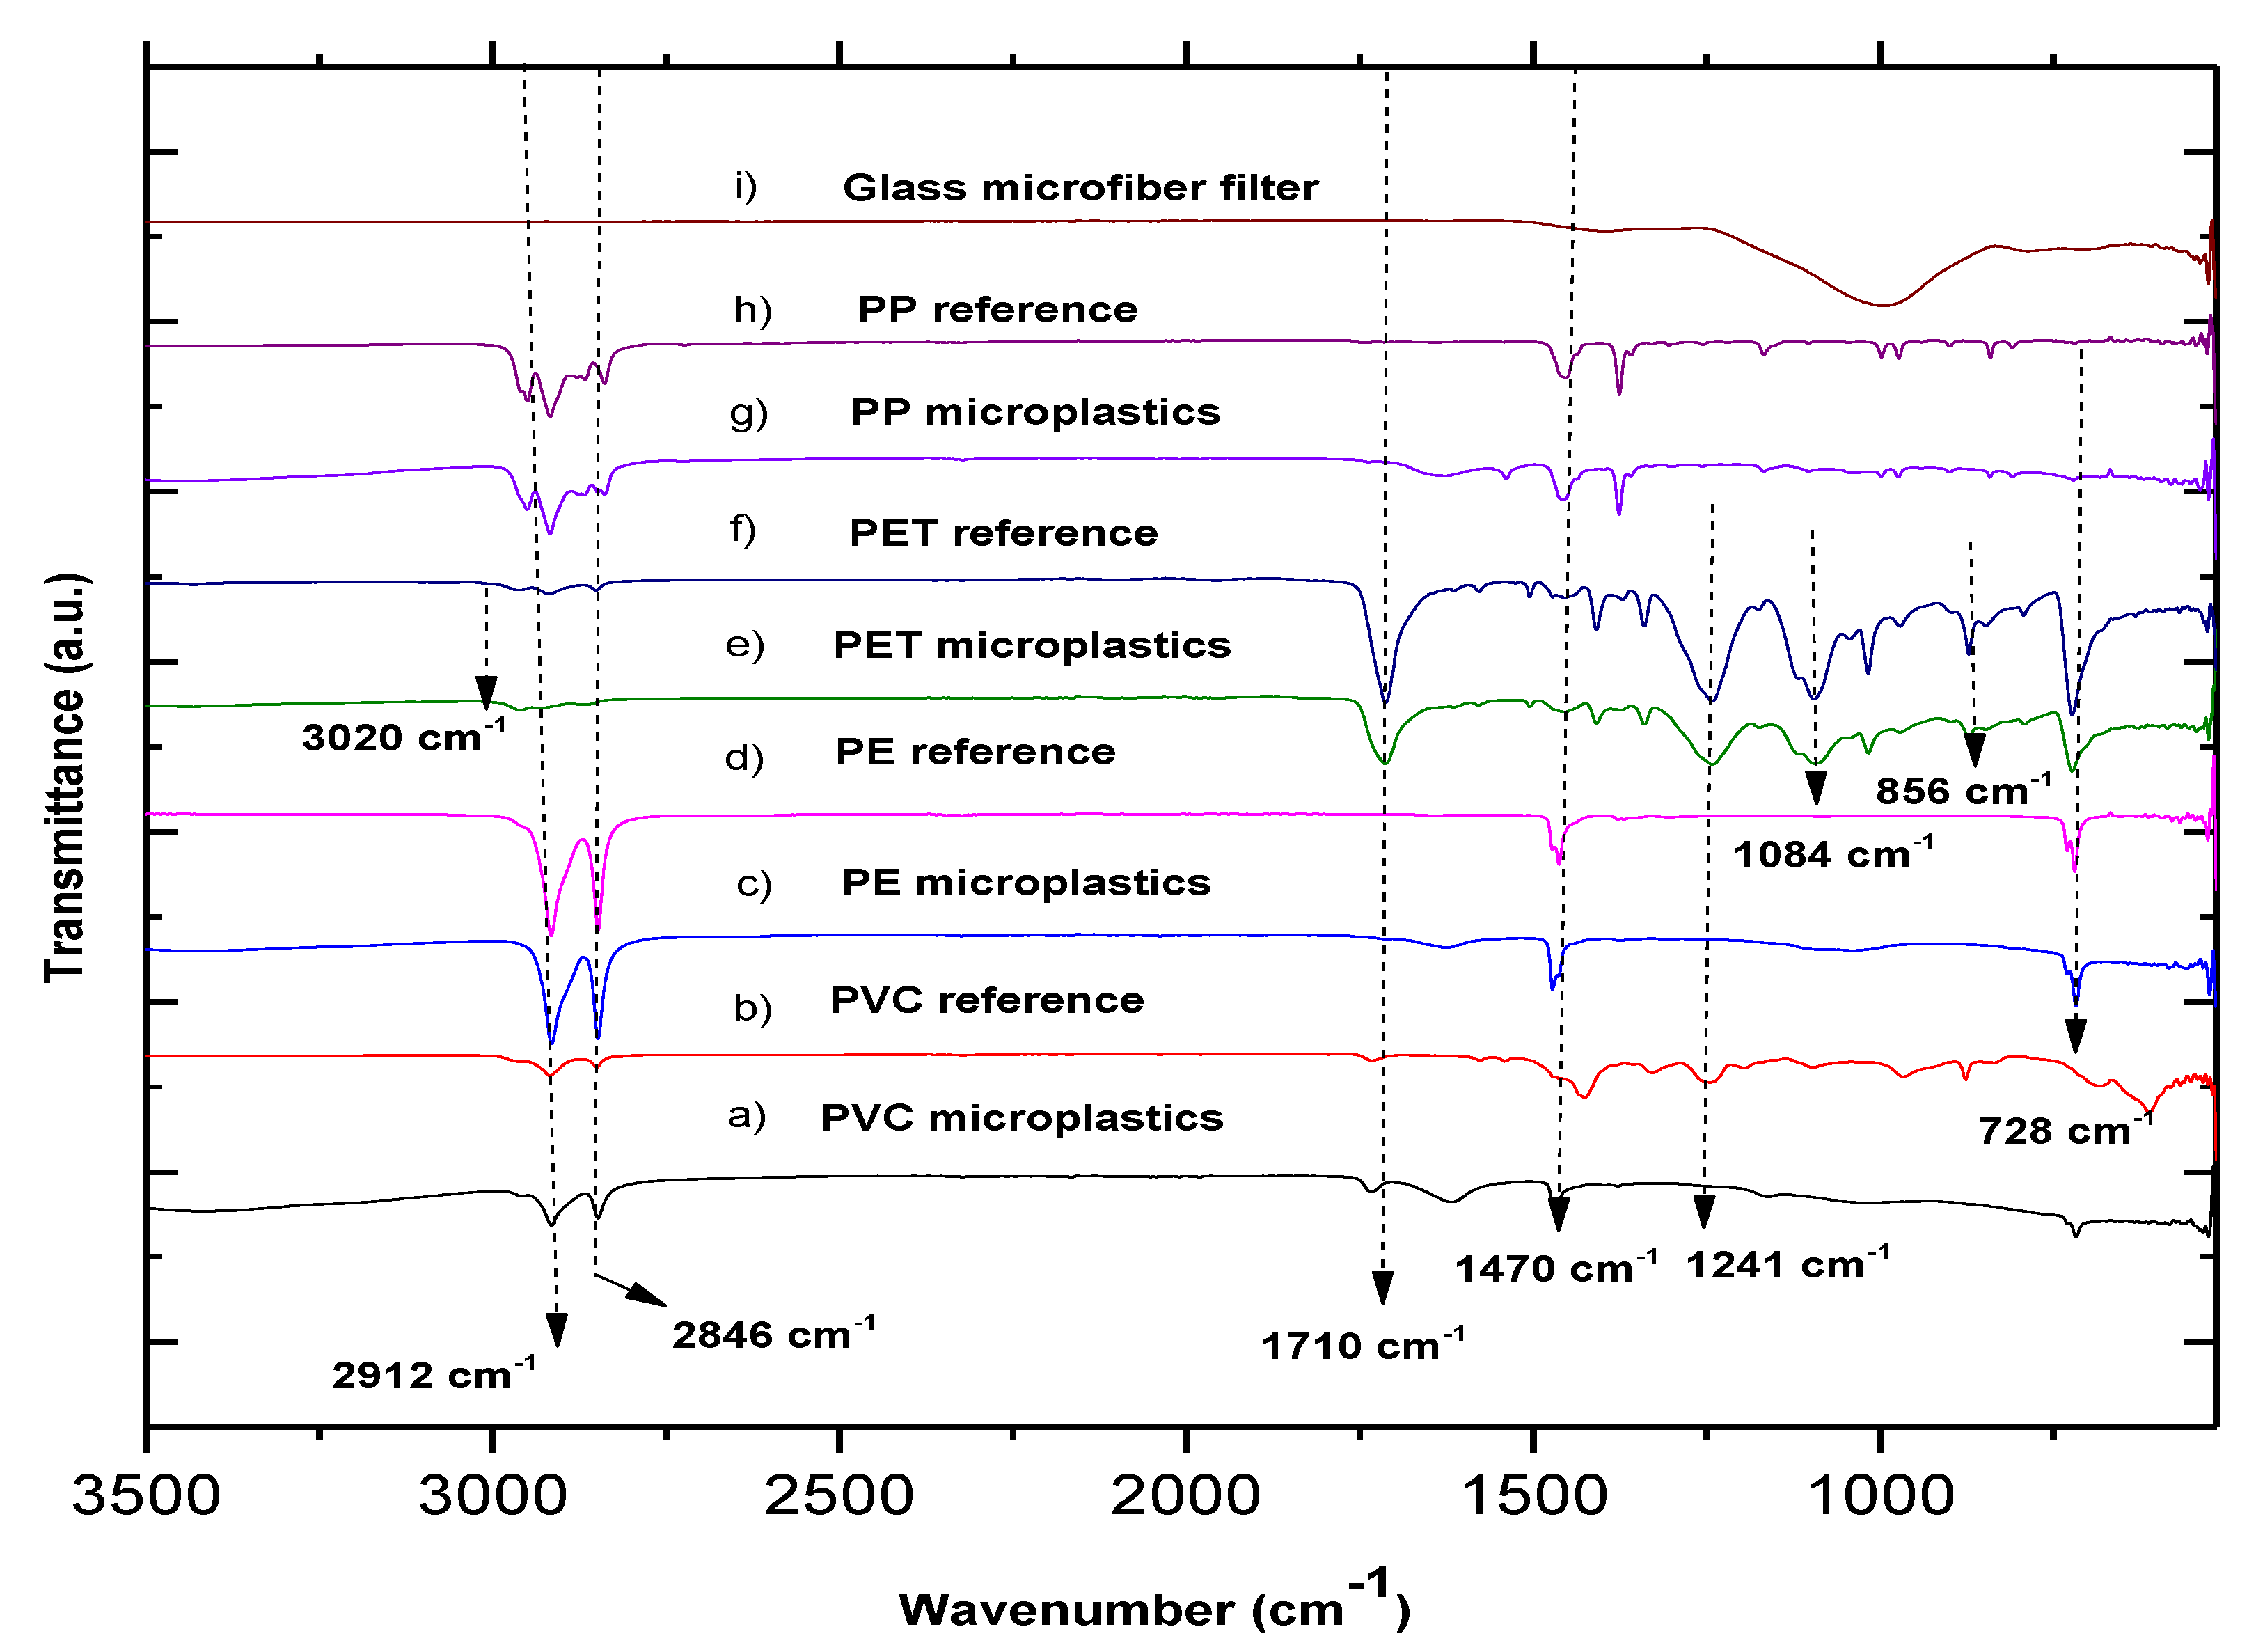
3.3. MP Characterization by FTIR

In the influent and effluent samples, FTIR analysis detected four types of polymers: PVC, PE, PET, and PP (Figure 5). To verify their identification, the spectra were compared with the reference spectra of conventional polymers.
The functional groups were compared according to the different characteristic vibration signals in the spectra from the MPs and reference samples (Table 2). Based on these results, PET, PE, PP, and PVC were the most frequently detected polymers in the influents and effluents of the three WWTPs (Figure 5). Notably, the signals corresponding to the glass fiber paper used to filter the samples did not interfere with the vibration signals of the MP spectra (Figure 5).
Similar to our results, others have also reported the four polymers (PET, PVC, PP, and PE) as the most abundant [18,19,20,37,38,49,50,51,52,53]. However, additionally, other studies have detected the presence of polyurethane (PU), polyphenylene oxide (PPO), nylon (PA), phenolic epoxide (PER), polyacrylonitrile (PAN), and polyvinyl alcohol (PVA), among others [18]. The detection of other MPs in different WWTPs across the world depends on the particular plastic-type consumption in each country and city. Moreover, the source of wastewater that enters the WWTPs, for instance those originating from a combination of industrial and domestic waste, contains more types of polymers in domestic use discharge [19,29]. One limitation of this work is that the samples obtained (by sieve sizes) and analyzed (equipment used) were only 38 and 150 µm; thus, other polymers may have been present in different particle size fractions. Additionally, the WWTPs analyzed in this research receive only domestic wastewater; thus, when comparing the results with similar WWTPs, consistencies are observed in the identified polymers. For example, in WWTPs in Colombia, low-density polyethylene (LDPE), PP, PET, and PS were reported [31]. In another similar case, the MPs identified in a WWTP in a Chinese province comprised primarily PP, PE, PS, and PET [50]; however, unlike this study, neither previous study reported PVC, and both identified PS.
Furthermore, the type of discharge (industrial, domestic, or mixed) can determine the predominance of PMs in influents and effluents [32]. Plastics, such as those detected in this study, are the basis for establishing mid- and long-term classification criteria on the types of discharge that enter the WWTPs and their discharge to the receiving bodies in cities with a tourist vocation. Therefore, considering only the chemical characterization of MPs is insufficient as it is necessary also to quantify the number of particles that enter and leave the WWTPs to determine the associated removal percentages and, thus, objectively evaluate the operating conditions and emission of MPs whose permanent destination is receiving bodies [34].

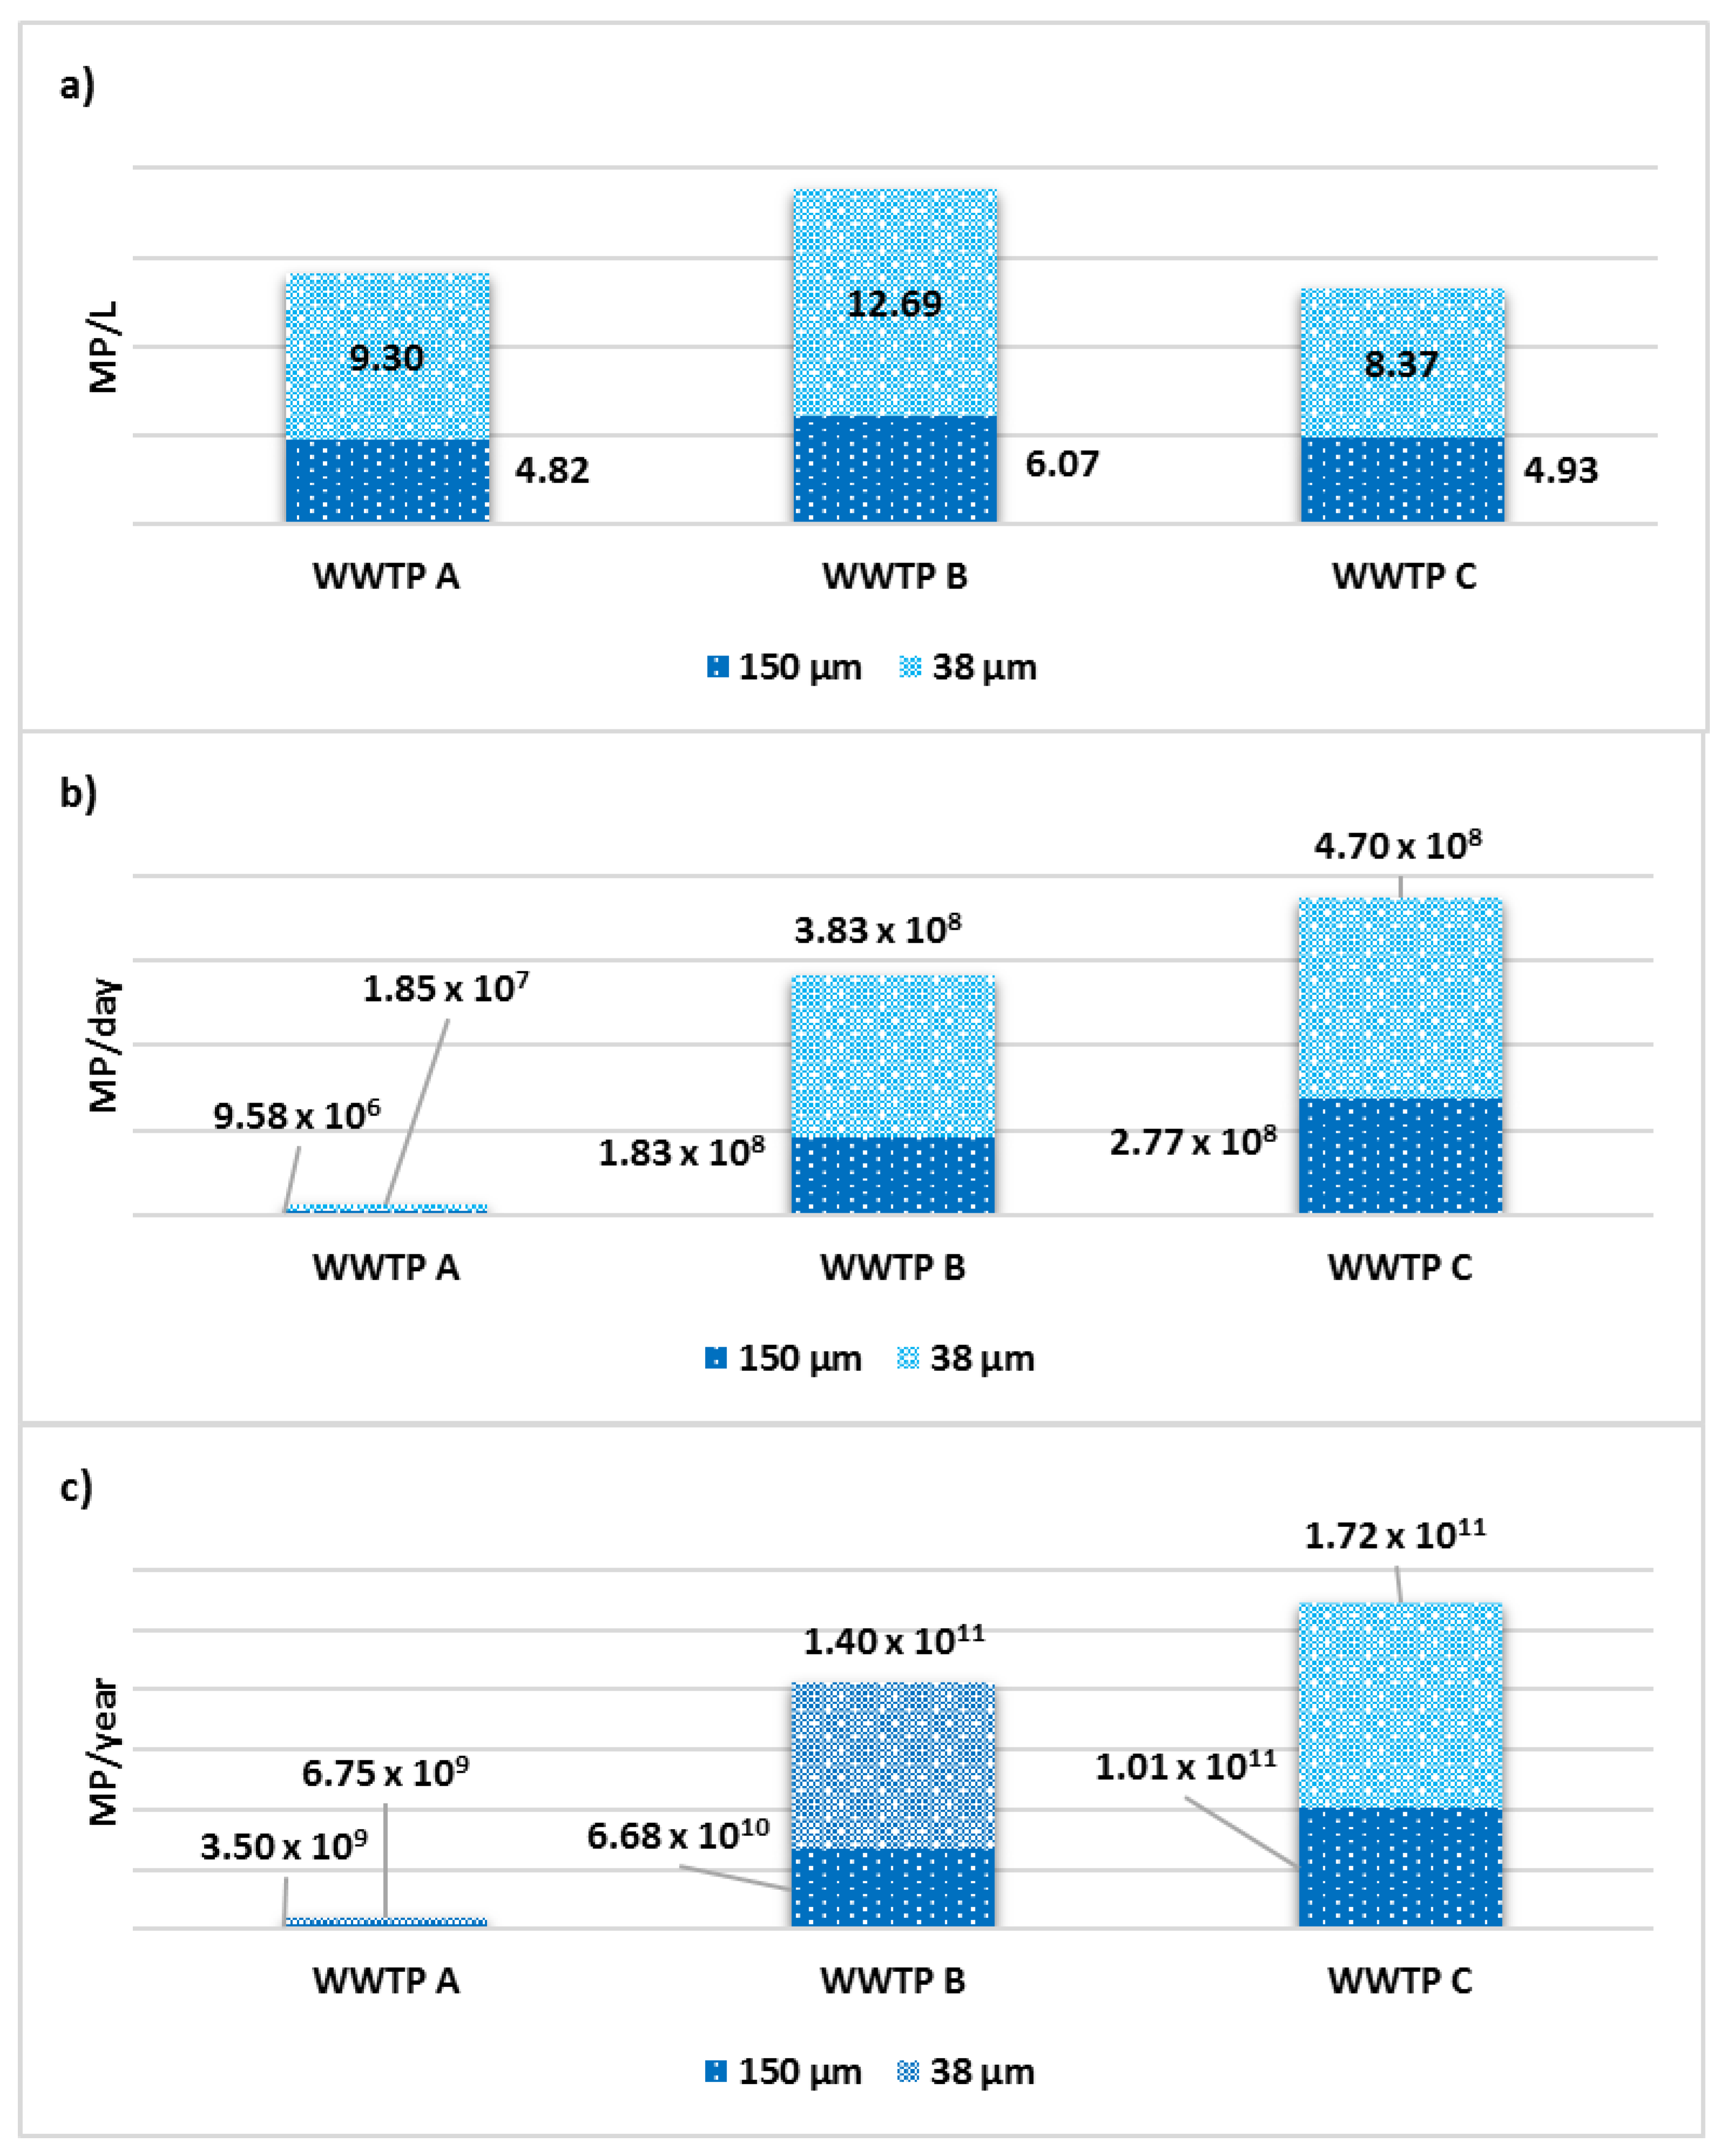
3.4. MP Concentration and Removal Efficiencies

The MP particles in influents and effluents from the three WWTPs presented different amounts and removal percentages concerning the sampling months (Table 3). Removal efficiency from monthly sampling was calculated for each MP particle size (38 µm and 150 µm). The obtained MP removal efficiencies for the WWTPs in Acapulco were similar to other investigations of secondary treatment systems. For example, in Italy, 95% of MPs were removed by WWTPs [18,30], while in China, 79.33–84% [18], in Colombia, 93.2–94.19% [31], in Canada, 99% [43] and in Scotland, 98% [20] was achieved. Hence, only the influents and effluents were analyzed for the three WWTPs, while the retained MPs were presumed to be in the sludge of the secondary clarifiers following biological treatment. According to different studies, most retained MPs are detected in biological sludge, so it is considered that the largest amount of MPs is intercepted in primary and secondary sludge [13,18,30,35,36,37,44,53,54,55]. Therefore, secondary treatment systems for biological sludge retain and concentrate most MPs in the primary and secondary sedimentation.
Temporality is a factor that influences the concentration, distribution, and removal of MPs in WWTPs [45,56]. However, these studies did not specify whether rainwater can affect the removal efficiency of MPs during treatment. According to the data obtained in this study, weather conditions are a variable factor impacting MP entry and emission. Thus, during the rainy season, the entry of MPs to the WWTPs increased, decreasing the removal efficiencies of the three WWTPs. The samples collected in June (dry season) presented the highest removal efficiencies (98.7%), while in November (rainy season), the lowest removal efficiencies were obtained (82.5%). This difference is due to the pluvial currents interfering with the influents during the rainy seasons; it is inferred that they significantly influence the transfer, transport, and emission of MPs from WWTPs due to the connection of the pluvial channels with the network plumbing in Acapulco. Considering the ANOVA results (p < 0.05), there were significant variations in MP concentrations between the dry and rainy months in influents and effluents (Table 4) (F calculated > F critical). Similarly, in Korea, higher concentrations of MP were reported in the treated effluents from a WWTP during the rainy season than in the dry season [56]. In contrast, in WWTPs in China, the MP concentrations and removal efficiencies were higher in dry seasons than in rainy seasons [45]. We posit that factors such as exposure of urban solid waste to the elements in storm channels and hydro-sanitary operating conditions contribute to the increase in MPs in urban wastewater treatment systems.
Similar MP removal percentages were obtained among the WWTPs in Acapulco: WWTP (A), 93.6%; WWTP (B), 93.06%; WWTP (C), 93.91%. One factor ANOVA (p > 0.05) further revealed that there were no significant differences in the MP purification processes (Table 5); hence, the three WWTPs presented similarities in MP elimination for secondary treatment systems.
It has been documented that WWTPs with tertiary treatment systems have higher removal percentages than primary and secondary systems, reaching approximately 99.9% [32,46]. This is an alternative to reduce MP concentrations in treated effluents further. As the WWTPs analyzed in Acapulco do not present tertiary treatment, it is suggested to consider incorporating advanced systems to purify MP in the treated effluents before they are sent to the receiving bodies.
In this sense, complementary technological alternatives can be implemented to purify treated effluents. For example, in effluent treatments treated by sand filtration, 99.2−99.4% removal percentages were obtained [47], and 89.7% was achieved using disk filters [48]. Meanwhile, in Germany, an advanced oxidation system has been developed in a pilot plant coupled to a municipal WWTP induced by organosilanes in parallel to a filtration system using granular activated carbon; they obtained 60.9% MP removal [57]. In China, the application of biofilters resulted in MP removal percentages of 79% and 89% by mass from treated effluents [58].
The secondary treatment systems in the three Acapulco WWTPs present high MP removal rates; however, significant amounts of MP continue to be released into water bodies [33]. It is, therefore, necessary to implement regulatory norms and policies that establish technical criteria to increase the removal of MPs and prevent their entry into aquatic ecosystems. Hence, it is important to extrapolate the values obtained in this study concerning the capacities of WWTP operation to determine the daily and annual concentrations of MPs that will enter the aquatic environments (rivers, coastal lagoons, wetlands, and sea).

3.5. Daily and Annual MP Emission Projections

The average MP concentrations during the four-month study (Figure 6) reveal that the effluents from WWTP B presented higher concentrations of MPs (Figure 6a). The three WWTPs released a greater quantity of 38 µm MP particles. According to the operating capacity, WWTP C released the most MPs per day to hydrological bodies with values of 2.77 × 10⁸ (150 µm) and 4.70 × 10⁸ (38 µm) particles (Figure 6b). For example, contrasting the treatment systems in similar works, the approximate daily emission in Scotland was 65 × 106 particles [20]. In Italy, the emissions from one of its largest WWTPs (for a population serving 1,200,000 inhabitants) was 160 × 106 PM per day [19], while the average emission per WWTP in China amounts to 650 × 106 PM per day [13].
Regarding other studies carried out in tertiary treatment systems, average MP emissions of 2.2 × 10⁷ particles/day have been recorded [29]. In Spain, the estimate of MPs released according to the particular conditions of the evaluated WWTPs was 1.6 × 10⁷/day [4]. The daily projections of the three WWTPs in the current study indicate that their secondary treatment systems require other complementary technologies to reduce the MP concentrations in their effluents and prevent their spread to different receiving bodies.
In Acapulco, as the largest studied WWTP (650 L/s), WWTP C had the highest projected annual MP emission value (Figure 6c). However, these values were estimated based on the concentrations of MPs obtained from specific samplings, so that the annual concentration may present significant variations estimates based on composite samplings. Despite this limitation, the values obtained demonstrate the MP contamination of municipal WWTPs in Mexico, specifically in a tourist city.
Despite the various works on the presence of MPs in WWTPs, several have not reported annual projections [8,18,21,29,30,31,32,44,46,53,54,59]. However, in others that included projections, the annual MP emissions from WWTPs were ~0.3 × 10⁹ particles [44], 9 × 10⁷ and 4 × 10⁹ particles [38] and 1.56 × 10¹⁴ particles [36]. The data obtained in the current study are within these other estimated values. Hence, it can be deduced that the issue of removing MPs in WWTPs is a global problem requiring the establishment of regulatory standards and protocols to standardize sampling and laboratory analysis to reduce the emission of MP particles and subsequent environmental degradation caused by the emerging pollutants [60,61,62].

4. Conclusions

MPs were detected and characterized in three secondary-type municipal wastewater treatment plants in Acapulco, Mexico, that were monitored for four months in 2022. Regarding polymeric particle diversity according to their pigmentation, black was the most abundant in the influents and red in the effluents. Hence, the MP coloring must be considered in the regulatory criteria as an indicator of other associated pollutants, such as heavy metals within additives used in the plastic industry, that represent a serious threat to living organisms, including humans.
The diversity of sizes and shapes in MPs represents a challenge for developing standardized analytical methodologies due to the multidimensional nature of these polymeric particles. Therefore, it is suggested to carry out studies in other size ranges to expand the knowledge on MPs’ qualitative and quantitative composition. Additionally, standardized analytical protocols, policies, and regulatory standards must be developed in the immediate future, and complementary technologies must be designed and implemented in the current wastewater treatment systems in Acapulco to retain and eliminate MPs in their different dimensions effectively.
This study shows the role of WWTPs in the retention and elimination of MPs, given the alarming global issue regarding plastic use and degradation, which are considered emerging pollutants. Within this context and the current lack of regulations and policies related to small particle plastic (e.g., MP) degradation in Mexico, the results of this study demonstrate the prevalence of MPs in three secondary municipal WWTPs in Acapulco, Mexico.
The results also indicate high MP removal efficiency by the three WWTPs; however, the effluents contain considerable amounts of MPs continuously released to receiving bodies. In this sense, temporality is a factor that influences MP quantity and removal. During rainy months, the highest MP load and lowest removal efficiencies were detected. However, the removal percentages only considered 150 and 38 µm particles and were, thus, only based on this size parameter. Hence, the removal efficiencies for other MP sizes may differ. Accordingly, it is suggested to incorporate finer meshes than those used in this study in future research. The annual MP load estimates indicate that aquatic ecosystems are highly exposed to the inappropriate use, consumption, and disposal of plastics. Moreover, there is a general lack of knowledge regarding the degradation of plastics to smaller sizes, such as MPs. Hence, the implementation of regulatory policies and standards must be promoted.
To date, no official Mexican standards establish maximum permissible limits for MPs in treated effluents discharged to receiving bodies. Based on the results of this study, it is recommended to continue advancing with work in other WWTPs at the local and national levels to incorporate MPs into the national agenda to update current regulations and policies in the medium term.

Author Contributions

Conceptualization, E.J.F.-M. and J.L.R.-A.; methodology, E.J.F.-M., J.L.R.-A., A.R.-H. and A.A.-S.; software, A.R.-H. and A.A.-S.; validation, E.J.F.-M., J.L.R.-A., A.R.-H. and A.A.-S.; formal analysis, E.J.F.-M., A.H-R. and J.L.R.-A.; data curation, E.J.F.-M., J.L.R.-A., A.R.-H. and A.A.-S.; writing—original draft preparation, E.J.F.-M. and J.L.R.-A.; writing—review and editing, E.J.F.-M., J.L.R.-A., A.R.-H. and A.A.-S.; visualization, E.J.F.-M., J.L.R.-A., A.R.-H., A.A.-S., R.M.B.-C. and J.V.-G.; supervision, J.L.R.-A., A.R.-H. and A.A.-S. All authors have read and agreed to the published version of the manuscript.

Funding

This research was funded by CONAHCYT, Mexico, through a graduate scholarship received by the first author (registration number 758303).

Data Availability Statement

All data presented in this research are contained in the article.

Acknowledgments

The authors thank the Acapulco Municipality Drinking Water and Sewerage Commission (CAPAMA) for allowing access to their facilities, especially Q.F.B. Gabriel Cejudo Blanco with the wastewater treatment systems. The authors also thank the Research Center of the Universidad del Papaloapan, Tuxtepec campus for the equipment for polymer chemical identification and Engineering in Water Treatment Systems S.A. de C.V. by microscopy.

Conflicts of Interest

The authors declare no conflict of interest.

References

  1. Geyer, R.; Jambeck, J.R.; Law, K.L. Production, use, and fate of all plastics ever made. Sci. Adv. 2017, 3, e1700782. [Google Scholar] [CrossRef] [PubMed]
  2. Meijer, L.J.J.; van Emmerik, T.; van der Ent, R.; Schmidt, C.; Lebreton, L. More than 1000 rivers account for 80% of global riverine plastic emissions into the ocean. Sci. Adv. 2021, 7, eaaz5803. [Google Scholar] [CrossRef]
  3. Frias, J.P.G.L.; Nash, R. Microplastics: Finding a consensus on the definition. Mar. Pollut. Bull. 2019, 138, 145–147. [Google Scholar] [CrossRef]
  4. Thompson, R.C.; Olsen, Y.; Mitchell, R.P.; Davis, A.; Rowland, S.J.; John, A.W.G.; McGonigle, D.; Russell, A.E. Lost at sea: Where is all the plastic? Science 2004, 304, 838. [Google Scholar] [CrossRef] [PubMed]
  5. Hidalgo-Ruz, V.; Gutow, L.; Thompson, R.C.; Thiel, M. Microplastics in the marine environment: A review of the methods used for identification and quantification. Environ. Sci. Technol. 2012, 46, 3060–3075. [Google Scholar] [CrossRef]
  6. Bucci, K.; Rochman, C.M. Microplastics: A multidimensional contaminant requires a multidimensional framework for assessing risk. Microplastics Nanoplastics 2022, 2, 7. [Google Scholar] [CrossRef]
  7. Cox, K.D.; Covernton, G.A.; Davies, H.L.; Dower, J.F.; Juanes, F.; Dudas, S.E. Human Consumption of Microplastics. Environ. Sci. Technol. 2019, 53, 7068–7074. [Google Scholar] [CrossRef]
  8. Ragusa, A.; Svelato, A.; Santacroce, C.; Catalano, P.; Notarstefato, V.; Carnevali, O.; Papa, F.; Rongioletti, M.C.A.; Baiocco, F.; Draghi, S.; et al. Plasticenta: First evidence of microplastics in human placenta. Environ. Int. 2021, 146, 106274. [Google Scholar] [CrossRef]
  9. Schwabl, P.; Köppel, S.; Königshofer, P.; Bucsics, T.; Trauner, M.; Reiberger, T.; Liebmann, B. Detection of various Microplastics in Human Stool. Ann. Intern. Med. 2019, 171, 453–457. [Google Scholar] [CrossRef] [PubMed]
  10. Tamargo, A.; Molinero, N.; Reinosa, J.J.; Alcolea-Rodriguez, V.; Portela, R.; Bañares, M.A.; Fernández, J.F.; Moreno-Arribas, M.V. PET microplastics affect human gut microbiota communities during simulated gastrointestinal digestion, first evidence of plausible polymer biodegradation during human digestion. Sci. Rep. 2022, 12, 528. [Google Scholar] [CrossRef] [PubMed]
  11. Çobanoğlu, H.; Belivermiş, M.; Sıkdokur, E.; Kılıç, Ö.; Çayır, A. Genotoxic and cytotoxic effects of polyethylene microplastics on human peripheral blood lymphocytes. Chemosphere 2021, 272, 129805. [Google Scholar] [CrossRef]
  12. Elkhatib, D.; Oyanedel-Craver, V. A critical review of extraction and identification methods of microplátics in wastewater and drinking wáter. Environ. Sci. Technol. 2020, 54, 7037–7049. [Google Scholar] [CrossRef] [PubMed]
  13. Park, H.; Park, B. Review of microplastic distribution, toxicity, análisis methods, and removal technologies. Water 2021, 13, 2736. [Google Scholar] [CrossRef]
  14. Sun, J.; Dai, X.; Wang, Q.; van Loosdrecht, M.C.M.; Ni, B.J. Microplastics in wastewater treatment plants: Detection, occurrence and removal. Water Res. 2019, 152, 21–37. [Google Scholar] [CrossRef] [PubMed]
  15. Hernández, A. Depuración y Desinfección de Aguas Residuales, 5th ed.; Colegio de Ingenieros de Caminos, Canales y Puertos: Madrid, Spain, 2001; pp. 88–120. [Google Scholar]
  16. Calero, M.; Gody, V.; Quesada, L.; Martín-Lara, M.A. Green strategies for microplastics reduction. Green Sustain. Chem. 2021, 28, 100442. [Google Scholar] [CrossRef]
  17. Alvim, C.B.; Bes-Piá, M.A.; Mendoza-Roca, J.A. Separation and identification of microplastics from primary and secondary effluents and activated sludge from wastewater treatment plants. Chem. Eng. J. 2020, 402, 126293. [Google Scholar] [CrossRef]
  18. Yang, L.; Li, K.; Cui, S.; Kang, Y.; An, L.; Lei, K. Removal of microplastics in municipal sewage from China’s largest water reclamation plant. Water Res. 2019, 155, 175–181. [Google Scholar] [CrossRef] [PubMed]
  19. Magni, S.; Binelli, A.; Pittura, L.; Avio, C.G.; Della Torre, C.; Parenti, C.C.; Gorbi, S.; Regoli, F. The fate of microplastics in an italian wastewater treatment plant. Sci. Total Environ. 2019, 652, 602–610. [Google Scholar] [CrossRef]
  20. Murphy, F.; Ewins, C.; Carbonnier, F.; Quinn, B. Wastewater treatment works (WwTW) as a source of microplastics in the aquatic environment. Environ. Sci. Technol. 2016, 50, 5800–5808. [Google Scholar] [CrossRef]
  21. Talvitie, J.; Heinonen, M.; Pääkkönen, J.P.; Vahtera, E.; Mikola, A.; Setälä, O.; Vahala, R. Do wastewater treatment plants act as a potential point source of microplastics? Preliminary study in the coastal Gulf of Finland, Baltic Sea. Water Sci. Technol. 2015, 72, 1495–1504. [Google Scholar] [CrossRef] [PubMed]
  22. Mato, Y.; Isobe, T.; Takada, H.; Kanehiro, H.; Ohtake, C.; Kaminuma, T. Plastic resin pellets as a transport medium for toxic chemicals in the marine environment. Environ. Sci. Technol. 2001, 35, 318–324. [Google Scholar] [CrossRef]
  23. Ricciardi, M.; Pironti, C.; Motta, O.; Miele, Y.; Proto, A.; Montano, L. Microplastics in the aquatic environment: Occurrence, persistence, análisis, and human exposure. Water 2021, 13, 973. [Google Scholar] [CrossRef]
  24. NOM-001-SEMARNAT-2021; Norma Oficial Mexicana—Que Establece los Límites Permisibles de Contaminantes en las Descargas de Aguas Residuales en Cuerpos Receptores Propiedad de la Nación. Comisión Nacional del Agua, Diario Oficial de la Federación: Ciudad de México, México, 2022.
  25. NOM-002-SEMARNAT-1996; Norma Oficial Mexicana—Que Establece los Límites Máximos Permisibles de Contaminantes en las Descargas de Aguas Residuales a los Sistemas de Alcantarillado Urbano o Municipal. Comisión Nacional del Agua, Diario Oficial de la Federación: Ciudad de México, México, 1998.
  26. NOM-003-SEMARNAT-1997; Norma Oficial Mexicana—Que Establece los Límites Máximos Permisibles de Contaminantes para las Aguas Residuales Tratadas que se Reúsen en Servicios al Público. Comisión Nacional del Agua, Diario Oficial de la Federación: Ciudad de México, México, 1998.
  27. Cámara de Diputados del H. Congreso de la Unión. Ley de Aguas Nacionales, Constitución Política Mexicana—Tiene por Objeto Regular la Explotación, Uso o Aprovechamiento de Dichas Aguas, su Distribución y Control, Así Como la Preservación de su Cantidad y Calidad para Lograr su Desarrollo Integral Sustentable; Cámara de Diputados del H. Congreso de la Unión, Diario Oficial de la Federación: Ciudad de México, México, 2023. [Google Scholar]
  28. Masura, J.; Baker, J.; Foster, G.; Arthur, C. Laboratory Methods for the Analysis of Microplastics in the Marine Environment; NOAA Marine Debris Program, 2015, Technical Memorandum NOS-OR&R-48. Available online: https://marinedebris.noaa.gov/sites/default/files/publications-files/noaa_microplastics_methods_manual.pdf (accessed on 1 October 2023).
  29. Blair, R.M.; Waldron, S.; Gauchotte-Lindsay, C. Average daily flow of microplastics through a tertiary wastewater treatment plant over a ten-month period. Water Res. 2019, 163, 114909. [Google Scholar] [CrossRef]
  30. Galafassi, S.; Di Cesare, A.; Di Nardo, L.; Sabatino, R.; Valsesia, A.; Fumagalli, F.S.; Corno, G.; Volta, P. Microplastic retention on small and medium municipal wastewater treatment plants and the role of the desinfection. Environ. Sci. Pollut. Res. 2022, 29, 10535–10546. [Google Scholar] [CrossRef] [PubMed]
  31. Hernández Fernández, J.; Cano, H.; Guerra, Y.; Puello Polo, E.; Ríos-Rojas, J.F.; Vivas-Reyes, R.; Oviedo, J. Identification and quantification of microplastics in effluents of wastewater treatment plant by differential scanning calorimetry (DSC). Sustainability 2022, 14, 4920. [Google Scholar] [CrossRef]
  32. Talvitie, J.; Mikola, A.; Koinstinen, A.; Setälä, O. Solutions to microplastic pollution -Removal of microplastics from wastewater effluent with advanced wastewater treatment technologies. Water Res. 2017, 123, 401–407. [Google Scholar] [CrossRef] [PubMed]
  33. Lee, H.; Kim, Y. Treatment characteristics of microplastics at biological sewage treatment facilities in Korea. Mar. Pollut. Bull. 2018, 137, 1–8. [Google Scholar] [CrossRef]
  34. Talvitie, J.; Mikola, A.; Setälä, O.; Heinonen, M.; Koistinen, A. How well is microlitter purified from wastewater?—A detailed study on the stepwise removal of microlitter in a tertiary level wastewater treatmetn plant. Water Res. 2017, 109, 164–172. [Google Scholar] [CrossRef]
  35. Asamoah, B.O.; Salmi, P.; Räty, J.; Ryymin, K.; Talvitie, J.; Karjalainen, A.K.; Kukkonen, J.V.K.; Roussey, M.; Peiponen, K.E. Optical monitoring of microplastics filtrated from wastewater sludge and suspended in etanol. Polymers 2021, 13, 871. [Google Scholar] [CrossRef]
  36. Li, X.; Chen, L.; Mei, Q.; Dong, B.; Dai, X.; Ding, G.; Zeng, E.Y. Microplastics in sewage sludge from the wastewater plants in China. Water Res. 2018, 142, 75–85. [Google Scholar] [CrossRef]
  37. Mahon, A.M.; O’Conell, B.; Healy, M.G.; O’Connor, I.; Officer, R.; Nash, R.; Morrison, L. Microplastics in sewage sludge: Effects of treatment. Environ. Sci. Technol. 2017, 51, 810–818. [Google Scholar] [CrossRef]
  38. Mintenig, S.M.; Int-Veen, I.; Löder, M.G.J.; Primpke, S.; Gerdts, G. Identification of microplastics in effluents of waste water treatment plants using focal plane-based micro-Fourier transform infrared imaging. Water Res. 2017, 108, 365–372. [Google Scholar] [CrossRef]
  39. Hahladakis, J.N.; Velis, C.A.; Weber, R.; Iacovidou, E.; Purnell, P. An overview of chemical additives present in plastics: Migration, release, fate and environmental impact during their use, disposal and recycling. J. Hazard. Mater. 2018, 344, 179–199. [Google Scholar] [CrossRef]
  40. Beiras, R.; Verdejo, E.; Campoy-López, P.; Vidal-Liñán, L. Aquatic toxicity of chemically defined microplastics can be explained by functional additives. J. Hazard. Mater. 2021, 406, 124388. [Google Scholar] [CrossRef] [PubMed]
  41. Turner, A.; Filella, M. Hazardous metal additives in plastics and their environmental impacts. Environ. Int. 2021, 156, 106622. [Google Scholar] [CrossRef]
  42. NMX-E-232-CNCP-2011; Norma Oficial Mexicana—Industria del Plástico. Símbolos de Identificación de Plásticos. Dirección General de Normas, Diario Oficial de la Federación: Ciudad de México, México, 2011.
  43. Gies, E.A.; LeNoble, J.L.; Noël, M.; Etemadifar, A.; Bishay, F.; Hall, E.R.; Ross, P.S. Retention of microplastics in a major secondary wastewater treatment plant in Vancouver, Canada. Mar. Pollut. Bull. 2018, 133, 553–561. [Google Scholar] [CrossRef] [PubMed]
  44. Kwon, H.J.; Hidayaturrahman, H.; Peera, S.G.; Lee, T.G. Elimination of microplastics at different stages in wastewater treatment plants. Water 2022, 14, 2404. [Google Scholar] [CrossRef]
  45. Meng, X.; Bao, T.; Hong, L.; Wu, K. Occurrence characterization and contamination risk evaluation of microplastics om Hefei’s urban wastewater treatment plant. Water 2023, 15, 686. [Google Scholar] [CrossRef]
  46. Bayo, J.; Olmos, S.; López-Castellanos, J. Assesment of microplastics in a municipal wastewater treatment plant with tertiary treatment: Removal efficiencies and loading per day into the environment. Water 2021, 13, 1339. [Google Scholar] [CrossRef]
  47. Wolff, S.; Weber, F.; Kerpen, J.; Winklhofer, M.; Engelhart, M.; Barkmann, L. Elimination of microplastics by downstream sand filters in wastewater treatment. Water 2020, 13, 33. [Google Scholar] [CrossRef]
  48. Simon, M.; Vianello, A.; Vollertsen, J. Removal of >10 µm microplastic particles from treated wastewater by a disc filter. Water 2019, 11, 1935. [Google Scholar] [CrossRef]
  49. Syberg, K.; Nielsen, M.B.; Clausen, L.P.W.; van Calster, G.; van Wezel, A.; Rochman, C.; Koelmans, A.A.; Cronin, R.; Pahl, S.; Hansen, S.F. Regulation of plastic from a circular economy perspective. Green Sustain. Chem. 2021, 29, 100462. [Google Scholar] [CrossRef]
  50. Lv, X.; Dong, Q.; Zuo, Z.; Liu, Y.; Huang, X.; Wu, W.M. Microplastics in a municipal wastewater treatment plant: Fate, dynamic distribution, removal efficiences, and control strategies. J. Clean. Prod. 2019, 225, 579–586. [Google Scholar] [CrossRef]
  51. Rasmussen, L.A.; Iordachescu, L.; Tumlin, S.; Vollersten, J. A complete mass balance for plastics in a wastewater treatment plant -Macroplastics contributes more than microplastics. Water Res. 2021, 2021, 117307. [Google Scholar] [CrossRef] [PubMed]
  52. Liu, W.; Zhang, J.; Liu, H.; Guo, X.; Zhang, X.; Yao, X.; Cao, Z.; Zhang, T. A review of the removal of microplastics in global wastewater treatment plants: Characteristics and mechanims. Environ. Int. 2021, 146, 106277. [Google Scholar] [CrossRef]
  53. Liu, X.; Yuan, W.; Di, M.; Li, Z.; Wang, J. Transfer and fate of microplastics during the conventional activated sludge process in one wastewater tratment plant of China. Chem. Eng. J. 2019, 362, 176–182. [Google Scholar] [CrossRef]
  54. Lares, M.; Ncibi, M.C.; Sillanpää, M.; Sillanpää, M. Ocurrence, identification and removal of microplastic particles and fibers in conventional activated sludge process and advanced MBR technology. Water Res. 2018, 133, 236–246. [Google Scholar] [CrossRef]
  55. Collivignarelli, M.C.; Miino, M.C.; Caccamo, F.M.; Milanese, C. Microplastics in sewage sludge: A known but underrated pathway in wastewater treatment plants. Sustainability 2021, 13, 12591. [Google Scholar] [CrossRef]
  56. Park, T.J.; Lee, S.H.; Lee, M.S.; Lee, J.K.; Park, J.H.; Zoh, K.D. Distributions of microplastics in surface wáter, fish, and sediment in the vicinity of a sewage treatment plant. Water 2020, 12, 3333. [Google Scholar] [CrossRef]
  57. Sturm, M.T.; Myers, E.; Schober, D.; Korzin, A.; Thege, C.; Schuhen, K. Comparision of AOP, GAC, and novel organosilane-based process for the removal of microplastics at a municipal wastewater treatment plant. Water 2023, 15, 1164. [Google Scholar] [CrossRef]
  58. Liu, F.; Nord, N.B.; Bester, K.; Vollertsen, J. Microplastics removal from treated wastewater by a biofilter. Water 2020, 12, 1085. [Google Scholar] [CrossRef]
  59. Anderson, Z.T.; Cundy, A.B.; Croudace, I.W.; Warwick, P.E.; Celis-Hernández, O.; Stead, J.L. A rapid method for assessing the accumulation of microplastics in the sea surface microlayer (SML) of estuarine systems. Sci. Rep. 2018, 8, 9428. [Google Scholar] [CrossRef] [PubMed]
  60. Li, X.; Bao, L.; Wei, Y.; Zhao, W.; Wang, F.; Liu, W.; Su, H.; Zhang, R. Occurrence, bioacumulation, and risk assessment of microplastics in the aquatic environment: A review. Water 2023, 15, 1768. [Google Scholar] [CrossRef]
  61. Haque, F.; Fan, C. Fate of microplastics under the influence of climate change. iScience 2023, 26, 107649. [Google Scholar] [CrossRef] [PubMed]
  62. Horton, A.A.; Walton, A.; Spurgeon, D.J.; Lahive, E.; Svendsen, C. Microplastics in freshwater and terrestrial environments: Evaluating the current understanding to identify the knowledge gaps and future research priorities. Sci. Total Environ. 2017, 586, 127–141. [Google Scholar] [CrossRef] [PubMed]
Figure 1. WWTP monitored locations for this study: WWTP (A) 23 L/s; WWTP (B) 350 L/s, and WWTP (C) 650 L/s.
Water 15 03643 g001
Figure 2. MP filaments in influents (a,b) and effluents (c,d); MP fragments in influents (e,f) and effluents (g,h). 150 µm size (a,c,e,g) and 38 µm (b,d,f,h).
Water 15 03643 g002aWater 15 03643 g002b
Figure 3. Average percentage distribution of MPs according their colors identified in influents (a) and effluents (b) in the three study WWTPs. Red MPs were more abundant in the influent than the effluent; blue MPs were more abundant in the effluent.
Water 15 03643 g003aWater 15 03643 g003b
Figure 4. Average percentage distribution of MPs according to their morphology identified in the (a) influents and (b) effluents of the three study WWTPs.
Water 15 03643 g004
Figure 5. FTIR spectra of MP obtained in the samples of the study WWTPs.
Water 15 03643 g005
Figure 6. MP average concentrations per liter (a), daily projections (b), annual projections (c) for 150 and 38 µm particles of three WWTPs in Acapulco, Gro. Mex.
Water 15 03643 g006
Table 1. One factor ANOVA (p < 0.05) of the morphology of MPs in the effluents of three WWTPs.
GroupCountSumAverageVariance
WWPT A6564.7794.1313,993.38
WWPT B6736.8122.8026,269.83
WWPT C6538.0489.6713,066.88
ANOVA
Source of VariationSSdfMSFp valueF crit
Between Groups3878.5821939.290.110.903.68
Within Groups266,650.441517,776.70
Total270,529.0117
Table 2. Wavenumber and functional groups detected in the FTIR spectra of the three WWTPs in Acapulco.
Functional GroupOHCH2
(Stretch)
CHC=OCH2
(Scissor)
C-O-CC-OCH2
(Rock)
Wavenumber (cm−1)3020290028001713144812471084728
PETPETPETPETPETPETPET-
-PVCPVC-PVC---
-PPPP-PP--PP
-PE--PE--PE
Table 3. MP removal percentages from influents and effluents of three WWTPs in Acapulco, Gro., Mex. in 2022.
WWTP AWWTP BWWTP C
MP (Ítems/L)
38 µm
MP (Ítems/L)
150 µm
MP (Ítems/L)
38 µm
MP (Ítems/L)
150 µm
MP (Ítems/L)
38 µm
MP (Ítems/L)
150 µm
IE% rIE% rIE% rIE% rIE%rIE%r
June76.0 ± 1.621.0 ± 0.6198.720.7 ± 0.481.73 ± 0.3691.757.7 ± 2.250.8 ± 0.3498.545.50 ± 1.641.1 ± 0.2397.444.2 ± 2.920.7 ± 0.1798.333.4 ± 2.530.8 ± 0.1897.5
July96.1 ± 1.262.8 ± 0.5597.168.5 ± 0.932.00 ± 1.6597.180.6 ± 2.672.8 ± 0.7496.448.33 ± 1.911.8 ± 0.8196.3104 ±6.092.4 ± 0.2097.739.4 ± 3.760.9 ± 0.6497.5
October174.9 ± 2.639.0 ± 0.7194.866.7 ± 2.234.82 ± 0.5392.8159.3 ± 7.7213.0 ± 1.9391.8103.67 ± 4.048.0 ± 0.5692.3150 ±8.6713.5 ± 1.1691.067.9 ± 4.646.2 ± 0.4890.8
November218.8 ± 3.2924.3 ± 1.0488.988.4 ± 0.5310.73 ± 0.7987.9194.7 ± 13.5134 ± 0.9082.5122.75 ± 4.7613.3 ± 1.0889.2200 ±1.0116.8 ± 0.4191.688.3 ± 5.011.6 ± 0.3886.8
Notes: Dry season: June and July; rainy season: October and November.
Table 4. One factor ANOVA (p < 0.05) according to the temporality in influents (a) and effluents (b) of three WWTPs in Acapulco, Gro. Mex.
(a)
Influent
GroupCountSumAverageVariance
June (dry season)3277.5892.53178.11
July (dry season)3437.50145.83321.10
October (rainy season)3723.09241.03497.15
November (rainy season)3912.92304.31221.56
ANOVA
Source of VariationSSdfMSFp valueF crit
Between Groups80,944.31326,981.4488.611.8 × 10−64.07
Within Groups2435.858304.48
Total83,380.1611
(b)
Effluent
GroupCountSumAverageVariance
June (dry season)36.412.140.36
July (dry season)312.824.270.65
October (rainy season)354.6718.2214.60
November (rainy season)3110.8136.9491.59
ANOVA
Source of VariationSSdfMSFp valueF crit
Between Groups2314.553771.5228.790.00014.07
Within Groups214.37826.80
Total2528.9311
Notes: Dry season: June and July; rainy season: October and November.
Table 5. One factor ANOVA (p < 0.05) according to the removal efficiencies of three WWTPs in Acapulco, Gro., Mex.
Effluent
GroupCountSumAverageVariance
WWTP A456.4914.12217.32
WWTP B475.0218.76433.26
WWTP C453.2013.30169.34
ANOVA
Source of VariationSSdfMSFp valueF crit
Between Groups69.19234.600.130.884.26
Within Groups2459.749273.30
Total2528.9311
Disclaimer/Publisher’s Note: The statements, opinions and data contained in all publications are solely those of the individual author(s) and contributor(s) and not of MDPI and/or the editor(s). MDPI and/or the editor(s) disclaim responsibility for any injury to people or property resulting from any ideas, methods, instructions or products referred to in the content.

