1. Introduction
Drought is one of the most disastrous natural hazards. It occurs in virtually all geographical regions, significantly impacting on the regional and global scales [
1]. Considering the multiple causal mechanisms or contributing factors to droughts, there is no universal definition of droughts [
2]. Generally, drought is broadly classified into four types, namely, meteorological, agricultural, hydrological, and socio-economic drought, which refer to different approaches to measurement and identification [
3]. Agricultural drought represents a lack of soil moisture available for vegetation [
4]. Agricultural drought affects the growth of vegetation, increasing mortality, and reducing carbon storage, thus influencing terrestrial carbon storage [
5]. It can also impact crop yield reductions or failure, and eventually lead to food demand/supply [
6].
Considering the spatial and temporal advantages that remote sensing can provide, remote sensing is an effective method for large-scale agricultural drought monitoring [
7]. Although soil moisture can be estimated by microwave remote sensing, microwave satellite observations are only possible for the surface layer (around 1–5 cm) and tend to have coarse spatial resolution (at kilometers) [
8,
9]. In the late 20th and early 21st century, many researchers have developed various multispectral indices for drought monitoring. The logic is that the vegetation water content will decrease due to soil moisture deficit. This will cause vegetation to wilt, resulting in a decrease of vegetation greenness. In the meantime, the vegetation’s stomata will partly close to sustain water. Thus, the temperature increases with a decrease in evapotranspiration. These phenomena are reflected in the time-series remote sensing images. The Vegetation Condition Index (VCI) [
10] was developed based on the NDVI. Some results suggest that the index is effective in monitoring agricultural drought at continental scales [
11,
12]. Gao [
13] developed the Normalized Difference Water Index (NDWI), which is sensitive to vegetation water content changes. The Land Surface Temperature (LST) provides valuable information on surface moisture conditions [
14]. The Temperature Condition Index (TCI) [
15] was designed to monitor drought. To combine the multi-spectral vegetation information and thermal information, efforts have been made to construct integrated indices, such as the Vegetation Health Index (VHI) [
16], the Vegetation Supply Water Index (VSWI) [
17], the Temperature Vegetation Drought Index (TVDI) [
18], and so on. Remote sensing drought monitoring requires a significant time series covering a long period to compare the changes in drought indices [
19]. Due to the different construction parameters of drought indices and the spatial heterogeneity in geographical properties and climatic conditions [
20], the various drought indices’ performances are different. The performance differences may arise from measuring soil moisture at different depths, soil/topographic/vegetation heterogeneity, and meteorological forcing. This leads to different temporal and spatial patterns represented by different drought indices. At present, there is no universally applicable drought index.
Kogan [
16] noted that drought indices need to be assessed and validated according to ground truth. Soil moisture is a direct measurement for vegetation suffering from drought. The International Soil Moisture Network (ISMN) established a global in situ soil moisture database [
21]. It brings together in situ soil moisture measurements collected and freely shared by a multitude of organizations, harmonizes them in terms of units and sampling rates, applies advanced quality control, and stores them in a database. Users can freely retrieve the data online [
22]. The soil moisture data can be used to validate and evaluate the drought indices’ practical performance for agricultural drought delineation.
A systematic assessment of drought indices based on a long-term series is the premise of applying drought indices, especially in different natural environments. The Contiguous United States, which is prone to drought, especially in the Midwest, has diverse climates and vegetation types, making it a typical geographical research area for drought indices’ comparison. In this study, we calculated some satellite image-derived drought indices and used in situ soil moisture data to evaluate their performance from 2000 to 2021 in different climates, vegetation cover types, and soil layer depths over the Contiguous United States. Five classic satellite image-derived drought indices: the VCI, Normalized Land Surface Water Index (NLSWI), TCI, VHI, and Normalized Vegetation Supply Water Index (NVSWI), were selected. These five drought indices estimate soil moisture via the vegetation growth status and environment from three different perspectives. The VCI estimates soil moisture deficit based on the vegetation greenness response. The NLSWI provides information on the vegetation water content. The TCI describes temperature, and the VHI and NVSWI integrate vegetation greenness and temperature information.
The objectives of this study are as follows: (1) Which of these five drought indices is applicable to most environments? (2) What is the cause of the performance differences between the drought indices based on vegetation status and those based on temperature?
2. Data Sources and Data Processing
Remote sensing datasets were used to calculate drought indices over the Contiguous United States. The in situ soil moisture datasets were used to evaluate the drought indices’ performance under different climates and vegetation cover types for three soil layers in the depth ranges of 0–20 cm, 20–100 cm, and 0–100 cm. To explore the performance differences under different environmental factors, we collected climate data and land cover data.
Table 1 shows detailed information about the data products used in this study. The analysis in this study focused on the plant-growing season from April to October to avoid complications arising from vegetation phenology and snow in winter.
2.1. Remote Sensing Data and Drought Indices
The Moderate-Resolution Imaging Spectroradiometer (MODIS) products were downloaded from the Land Processes Distributed Active Archive Center (LP DAAC:
http://lpdaac.usgs.gov/). The VCI was calculated using MODIS vegetation indices’ monthly data (MOD13A3). The NLSWI was calculated using the NIR reflectance and the SWIR reflectance contained within MOD13A3. The TCI was calculated using MODIS LST daily data (MOD11A1). The VHI and NVSWI were calculated using MOD13A3 and MOD11A1.
Table 2 presents detailed information about the drought indices based on the remote sensing data used in this study. The NLSWI and NVSWI calculation methods were similar to VCI and TCI. The LSWI and VSWI values were normalized to calculate the NLSWI and NVSWI over the study period, respectively, because the origin indices LSWI and VSWI only represented relative values to the scene and did not convey relative changes caused by soil moisture changes on the time series. The monthly TCI was calculated according to the data quality flags and the number of days in each month. We used the average temperature of daytime and nighttime. As the indices were normalized over the study period, the number of time-series images influenced the drought indices’ values. To ensure the reliability of the drought indices in the application of long time series, we used all MOD13A3 and MOD11A1 datasets from April to October for the period 2000–2021. Meanwhile, we only used pixels that had more than 20 years of records in the same month to calculate the monthly indices for different years by checking the data quality flags. All drought indices were calculated at monthly intervals and a 1000 m spatial resolution.
2.2. In Situ Soil Moisture Data
The in situ soil moisture data were collected from the ISMN [
22]. The techniques commonly used in these in situ soil moisture data sampling methods are based on the contrasting dielectric properties of soil and water. All soil moisture measurements provided by the ISMN are volumetric soil moisture in m
3 × m
−3, resampled to hourly UTC reference time steps. If there is no measurement available within this interval, the respective time step is filled with a no-data value. Different networks adopt different measurement depths. Since there are many potential uses for the data, the ISMN does not harmonize the measurement depths [
22]. We used Xu’s method [
25] to construct harmonies of soil moisture in different-depth layers. To maintain multiple in situ datasets after filtering, we downloaded all stations located in the Contiguous United States during the soil moisture data preparation, and 568 stations were retained after processing.
The data quality flags were applied to select the good-quality observation [
21]. The observation marked as G was preserved. The entire processing of in situ soil moisture data was divided into two parts, including calculating the monthly soil moisture data at every measured depth and the monthly averaged soil moisture data for three soil layers in the depth ranges of 0–20 cm, 20–100 cm, and 0–100 cm.
Calculating the monthly soil moisture data at every measured depth included three parts. Firstly, the observations in every in situ station were filtered to ensure at least one effective observation was available every day. If there were multiple observations in one day, we calculated the average. Secondly, the monthly averaged soil moisture data at a specific depth were calculated. To avoid not capturing the signal of soil moisture increase due to the direct impact of short-time rainfall, there must be observations every day when the monthly averaged data were calculated. Thirdly, if there were multiple sensors at the same depth and the same station, we calculated the average at the same observation time.
The monthly soil moisture data at multiple measured depths were weighted for each station to construct the monthly averaged soil moisture in the 0–20 cm, 20–100 cm, and 0–100 cm soil layers. The weights were determined by the ratio of the distance of two adjacent depths to the soil layer depth at which soil moisture was calculated. If the soil moisture was measured at a specific depth instead of a range, e.g., 5 cm, we assumed the depth range was calculated by the difference between the measured depth for the target layer and the measured depth in the previous layer, i.e., 0–5 cm. [
25]. Considering that the surface soil layer’s soil moisture was greatly affected by temperature, precipitation, and other factors, we ensured that at least one soil moisture data point was available for both the 0–10 cm and 10–20 cm soil layers, respectively, when we calculated the averaged soil moisture in the 0–20 cm soil layer. The soil moisture in the deep soil layer could adjust the water utilization of plants. To ensure the calculated monthly averaged soil moisture better represented soil moisture storage, the in situ data were filtered to ensure at least one soil moisture data point was available for the 20–100 cm soil layer, and at least one measured depth should be deeper than 50 cm, half of the 0–100 cm soil layer. The averaged soil moisture in the 0–100 cm soil layer was calculated if the conditions for calculating the soil moisture in the 0–20 cm and 20–100 cm soil layers were both met. For example, soil moisture was measured at 2.5 cm (SM
2.5), 5 cm (SM
5), 10 cm (SM
10), 20 cm (SM
20), 50 cm (SM
50), and 80 cm (SM
80) for an in situ station named Anthony in the ARM network. Three measured depths (SM
2.5, SM
5, and SM
10) were in the 0–10 cm soil layer and one measured depth (SM
20) was in the 10–20 cm soil layer, which met the conditions of calculating the monthly averaged soil moisture in the 0–20 cm soil layer. Two measured depths (SM
50 and SM
80) were in the 20–100 cm soil layer and one measured depth (SM
80) was deeper than 50 cm, which met the conditions of calculating the monthly averaged soil moisture in the 20–100 cm soil layer.
Table 3 shows the calculation formulas.
We found that many stations were located in the SCAN or SNOTEL networks, with the measured depths at 10.16 cm, 20.32 cm, 50.8 cm, and 100.16 cm. To expand the number of samples and better-discover general patterns, we treated 10.16 cm as 10 cm, 20.32 cm as 20 cm, 50.8 cm as 50 cm, and 100.16 cm as 100 cm. It is worth noting that there might be multiple stations within the 1000 m spatial resolution drought indices’ grid cell. To ensure we did not ignore potentially useful soil moisture signals, we calculated the station-averaged soil moisture in the same soil layer in the same month in this case.
2.3. Climate Data and Vegetation Cover Data
The Köppen–Geiger system classifies climate into five main classes: tropical (A), arid (B), temperate (C), cold (D), and polar (E) climates [
26]. The land cover data were derived from the MODIS Land Cover Type Products (MCD12Q1). We used the International Geosphere-Biosphere Programme (IGBP) classification system in this study. However, the spatial resolution of the land cover data is 500 m, one-quarter of the size of the remote sensing image pixels we used in this study. Moreover, the data type is the categorical variable. Therefore, it cannot be simply resampled to obtain the 1000 m spatial resolution land cover data. Based on the MCD12Q1 land cover type data and Google Earth images, we validated the land cover of every in situ soil moisture station within the pixel position of the 1000 m spatial resolution remote sensing image data.
We filtered the stations that could not be classified into the land cover and non-vegetation types. Considering that the number of stations in some vegetation cover types was small, the vegetation cover types in the IGBP classification system were modified to fit the major vegetation cover types (
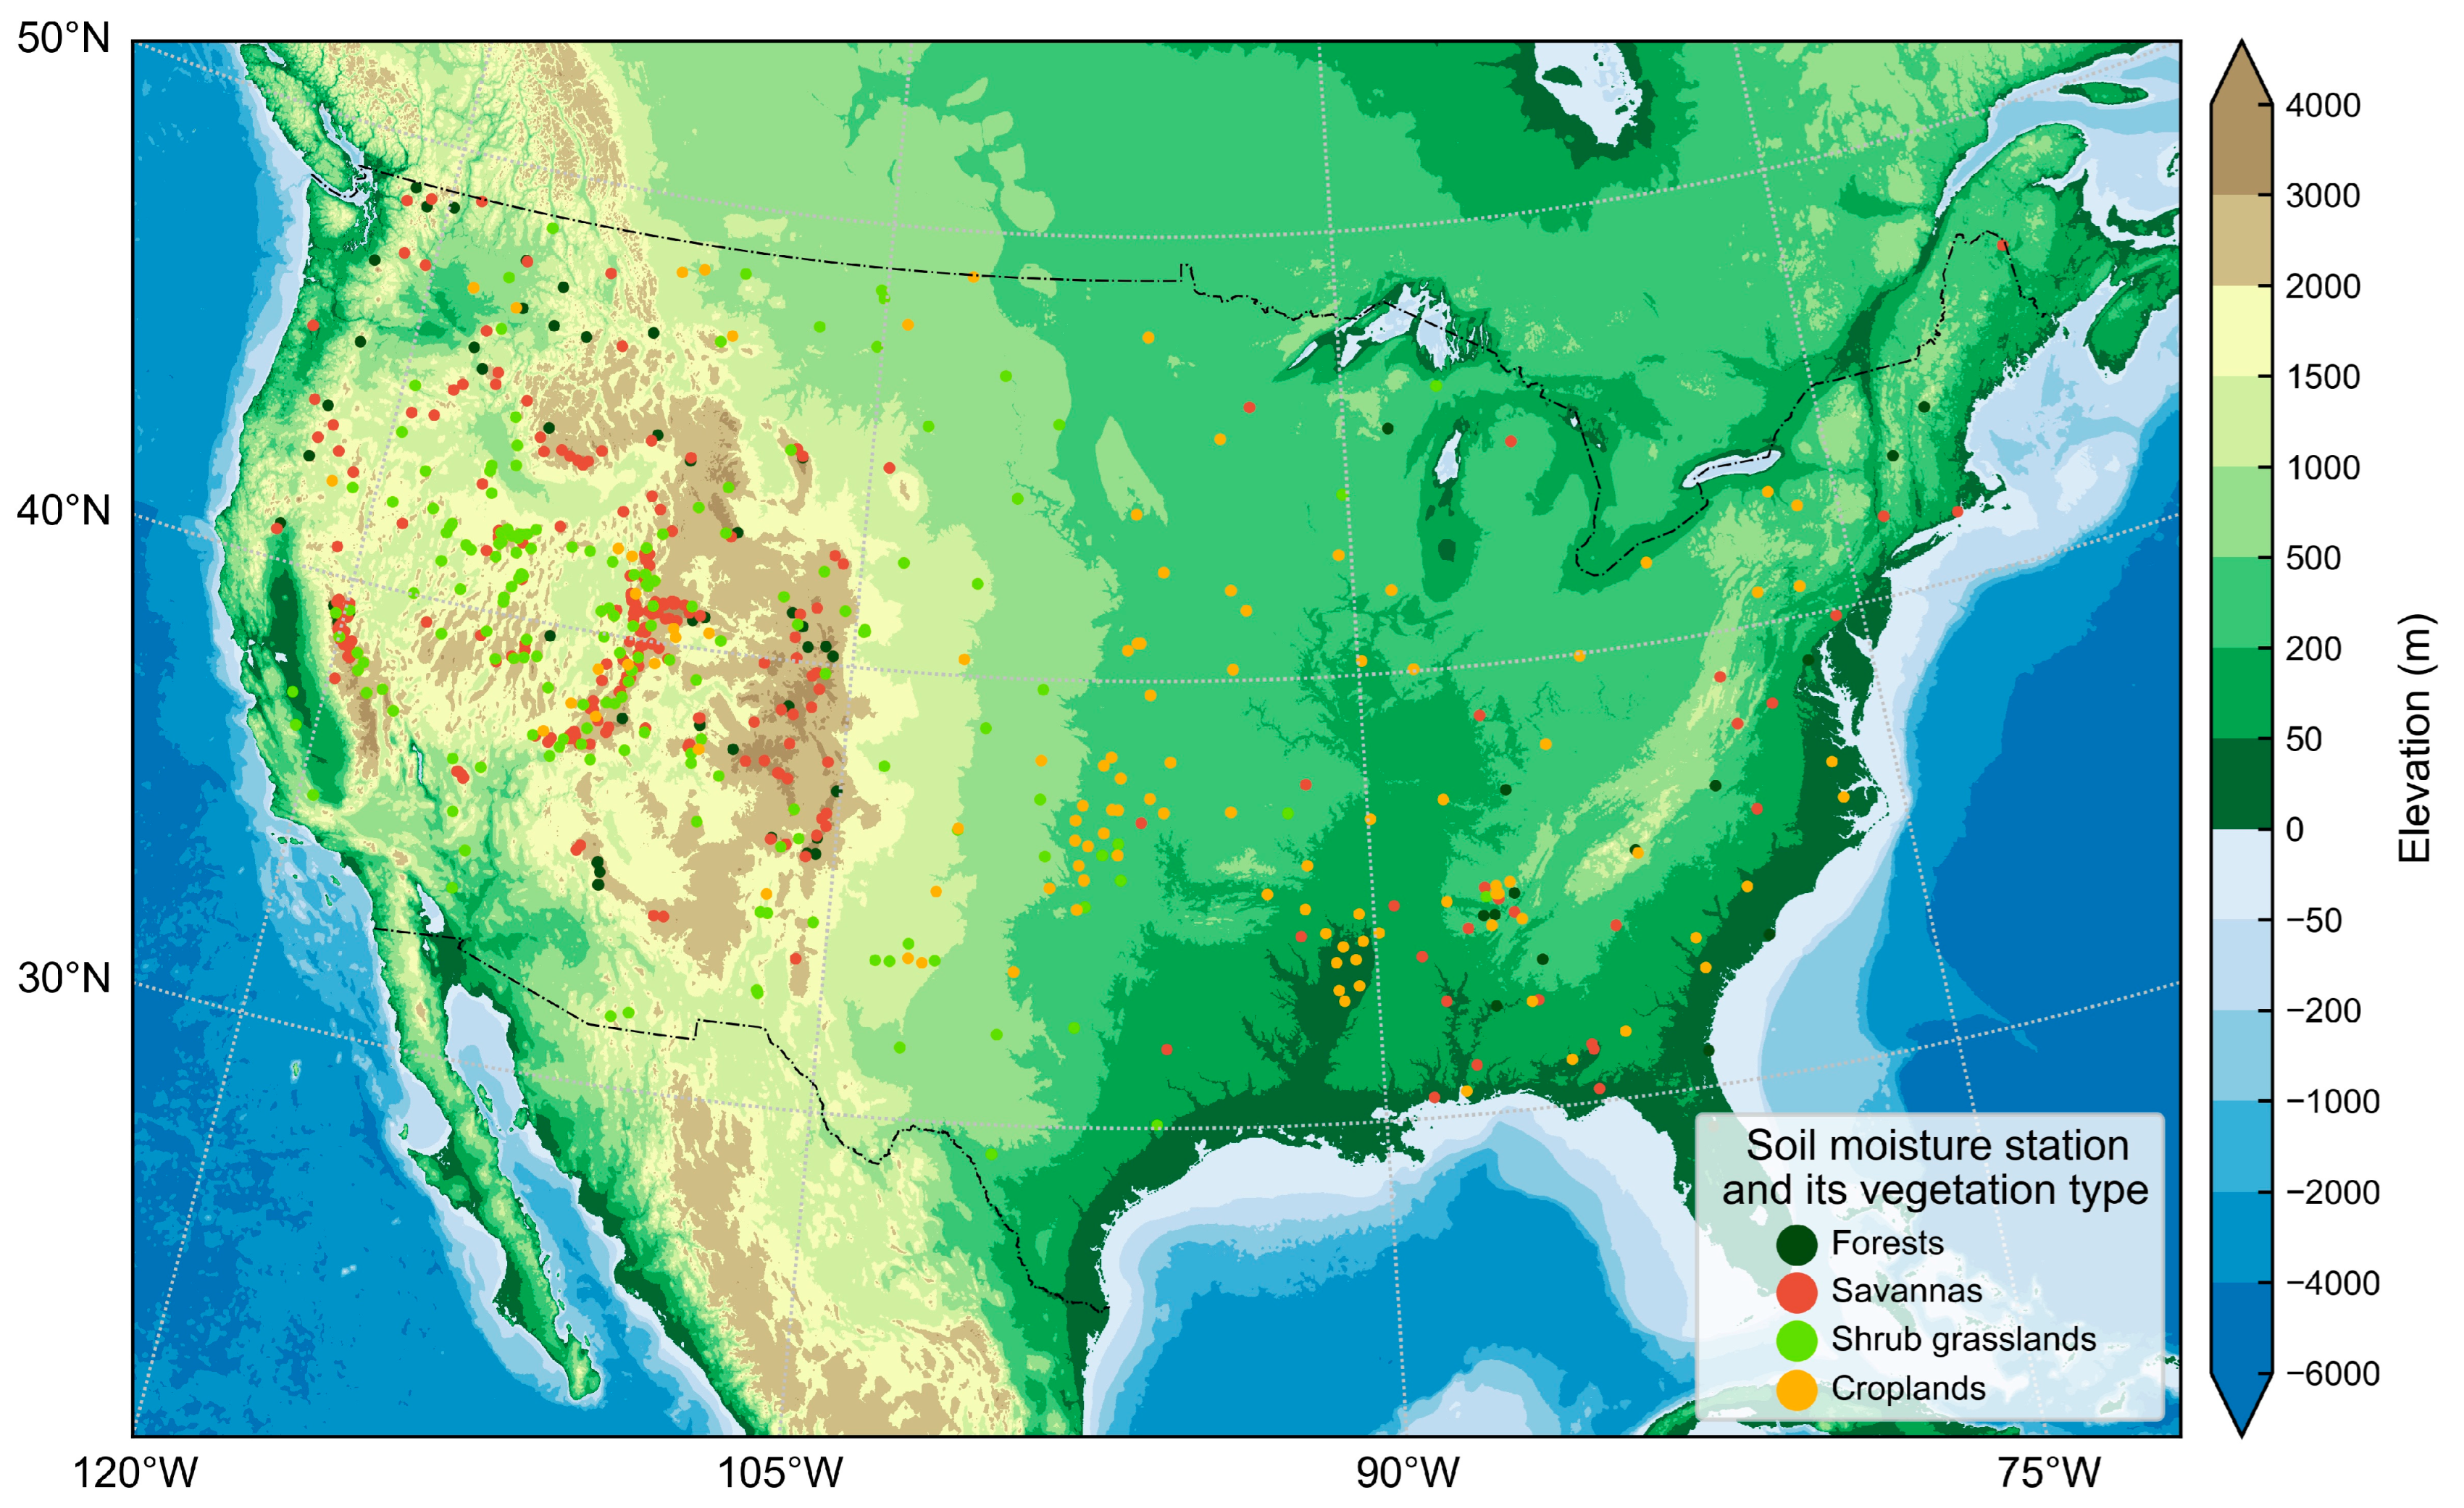
Table 4) to better evaluate the performance of the drought indices in different vegetation cover types. In addition, there was no station in the tropical (A) climate and only one in the polar (E) climate. Therefore, these two climates were not included in this study. Here, 144 stations were in the arid (B) climate, including 2 for forests, 24 for savannas, 93 for shrub grasslands, and 25 for croplands; 93 stations were in the temperate (C) climate, including 13 for forests, 24 for savannas, 9 for shrub grasslands, and 47 for croplands; 331 stations were in the cold (D) climate, including 49 for forests, 182 for savannas, 69 for shrub grasslands, and 31 for croplands.
Figure 1 shows the locations of the in situ soil moisture stations.
3. Methodology
In the data preparation and processing stage, we calculated the drought indices and the monthly averaged soil moisture data for three soil layers in the depth ranges of 0–20 cm, 20–100 cm, and 0–100 cm for each station. The drought indices, climate data, and vegetation cover data were at 1000 m spatial resolution, while the soil moisture values were measured at a single point. If the soil moisture stations were located in a fairly large and uniform vegetation cover type, the soil moisture values were generally representative of the environmental conditions in the measured stations or potentially homogeneous surrounding environments [
25]. Therefore, we extracted the time-series monthly drought indices’ values, climate types, and vegetation cover types from the 1000 m pixel that geographically corresponded to each station and the time that corresponded to the monthly averaged soil moisture data. We ensured that there were more than 30 records in every station’s 3 soil layers. We used the Pearson correlation analysis to compare the different performances of the drought indices under different climates, vegetation cover types, and soil layers.
A correlation coefficient value of 1 or −1 means a perfect correlation and a value of 0 means no correlation between two variables, x and y. The correlation coefficient value was kept to 2 decimal places. The rounding rule was round up when the third decimal place was larger than 5, round down when less than 5, and round to an even value when exactly 5:
where
and
are data samples of
and
, respectively,
and
are arithmetic averages of
and
, respectively, and
n denotes the sample size.
Using violin plots and scatter plots, we comprehensively compared the upper quartile, median quartile (median r), lower quartile, interquartile range, correlation coefficient values’ distribution, and the number of stations passing the significance test to determine which drought index performed best. The upper quartile, median r, lower quartile, and interquartile range represent values higher than 25%, 50%, and 75%, and values containing 50% of all values, which measure the dispersion of the correlation coefficient values’ distribution. Therefore, quartiles could be used to evaluate the performance of the drought indices. Based on the definitions of the drought indices, the correlation coefficient values should be greater than 0. The comparisons were as follows: (1) the higher the upper quartile, the better the index; (2) the higher the median r, the better the index; (3) the higher the lower quartile, the better the index; (4) the smaller the quartile range, the more centralized the correlation coefficient values, the better the representativeness of the median r to the central tendency, and the better the robustness of the index. Since the lower quartile represents most of the correlation coefficient values’ distribution, we considered the lower quartile as better to evaluate the drought indices’ performance than the upper quartile, median r, and interquartile range. The scatter plots show the distribution of the correlation coefficient values and the number of stations passing the significance test. Here, the higher the correlation coefficient values and the denser the correlation coefficient values’ distribution passing the significance test, the better the index. This characteristic was used as a supplementary indicator to solve the problem that the quartiles we obtained from the different indices were too close to determine which index was better. We also drew correlation coefficient value scatter points on the map to explore whether there were regional features.
4. Results
4.1. Performance of the Drought Indices in All Vegetation Types
4.1.1. Overall Performance
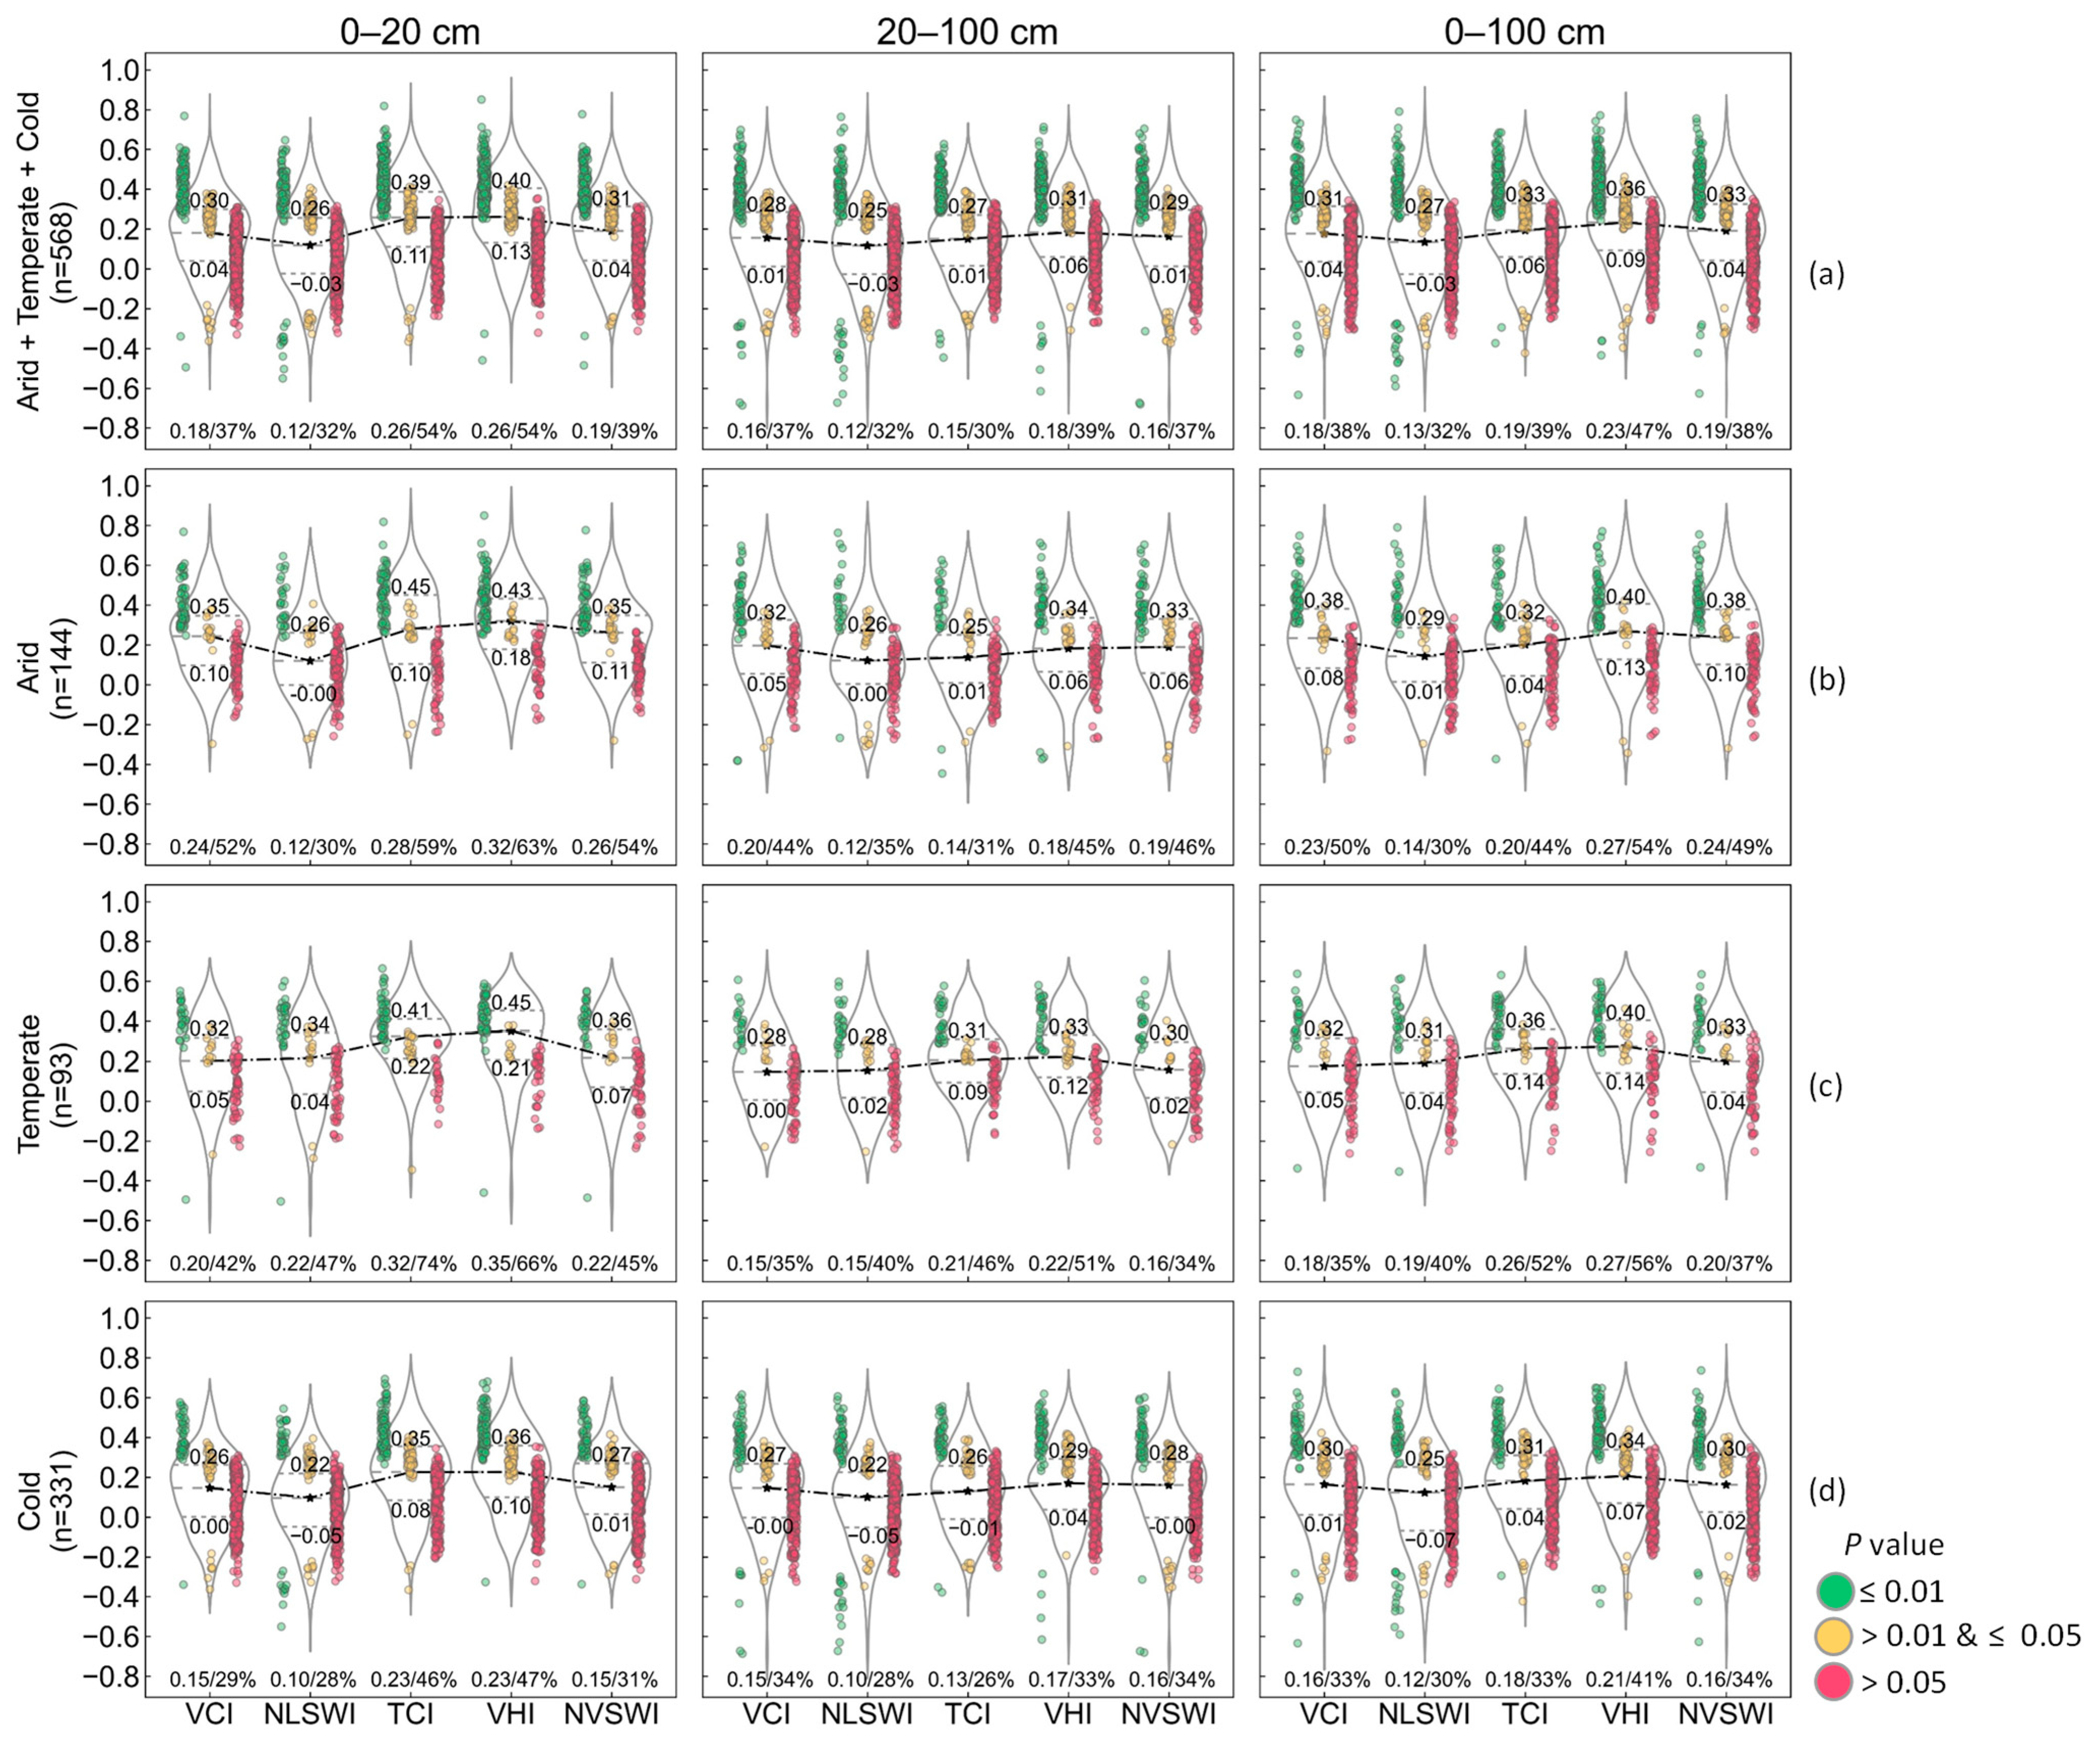
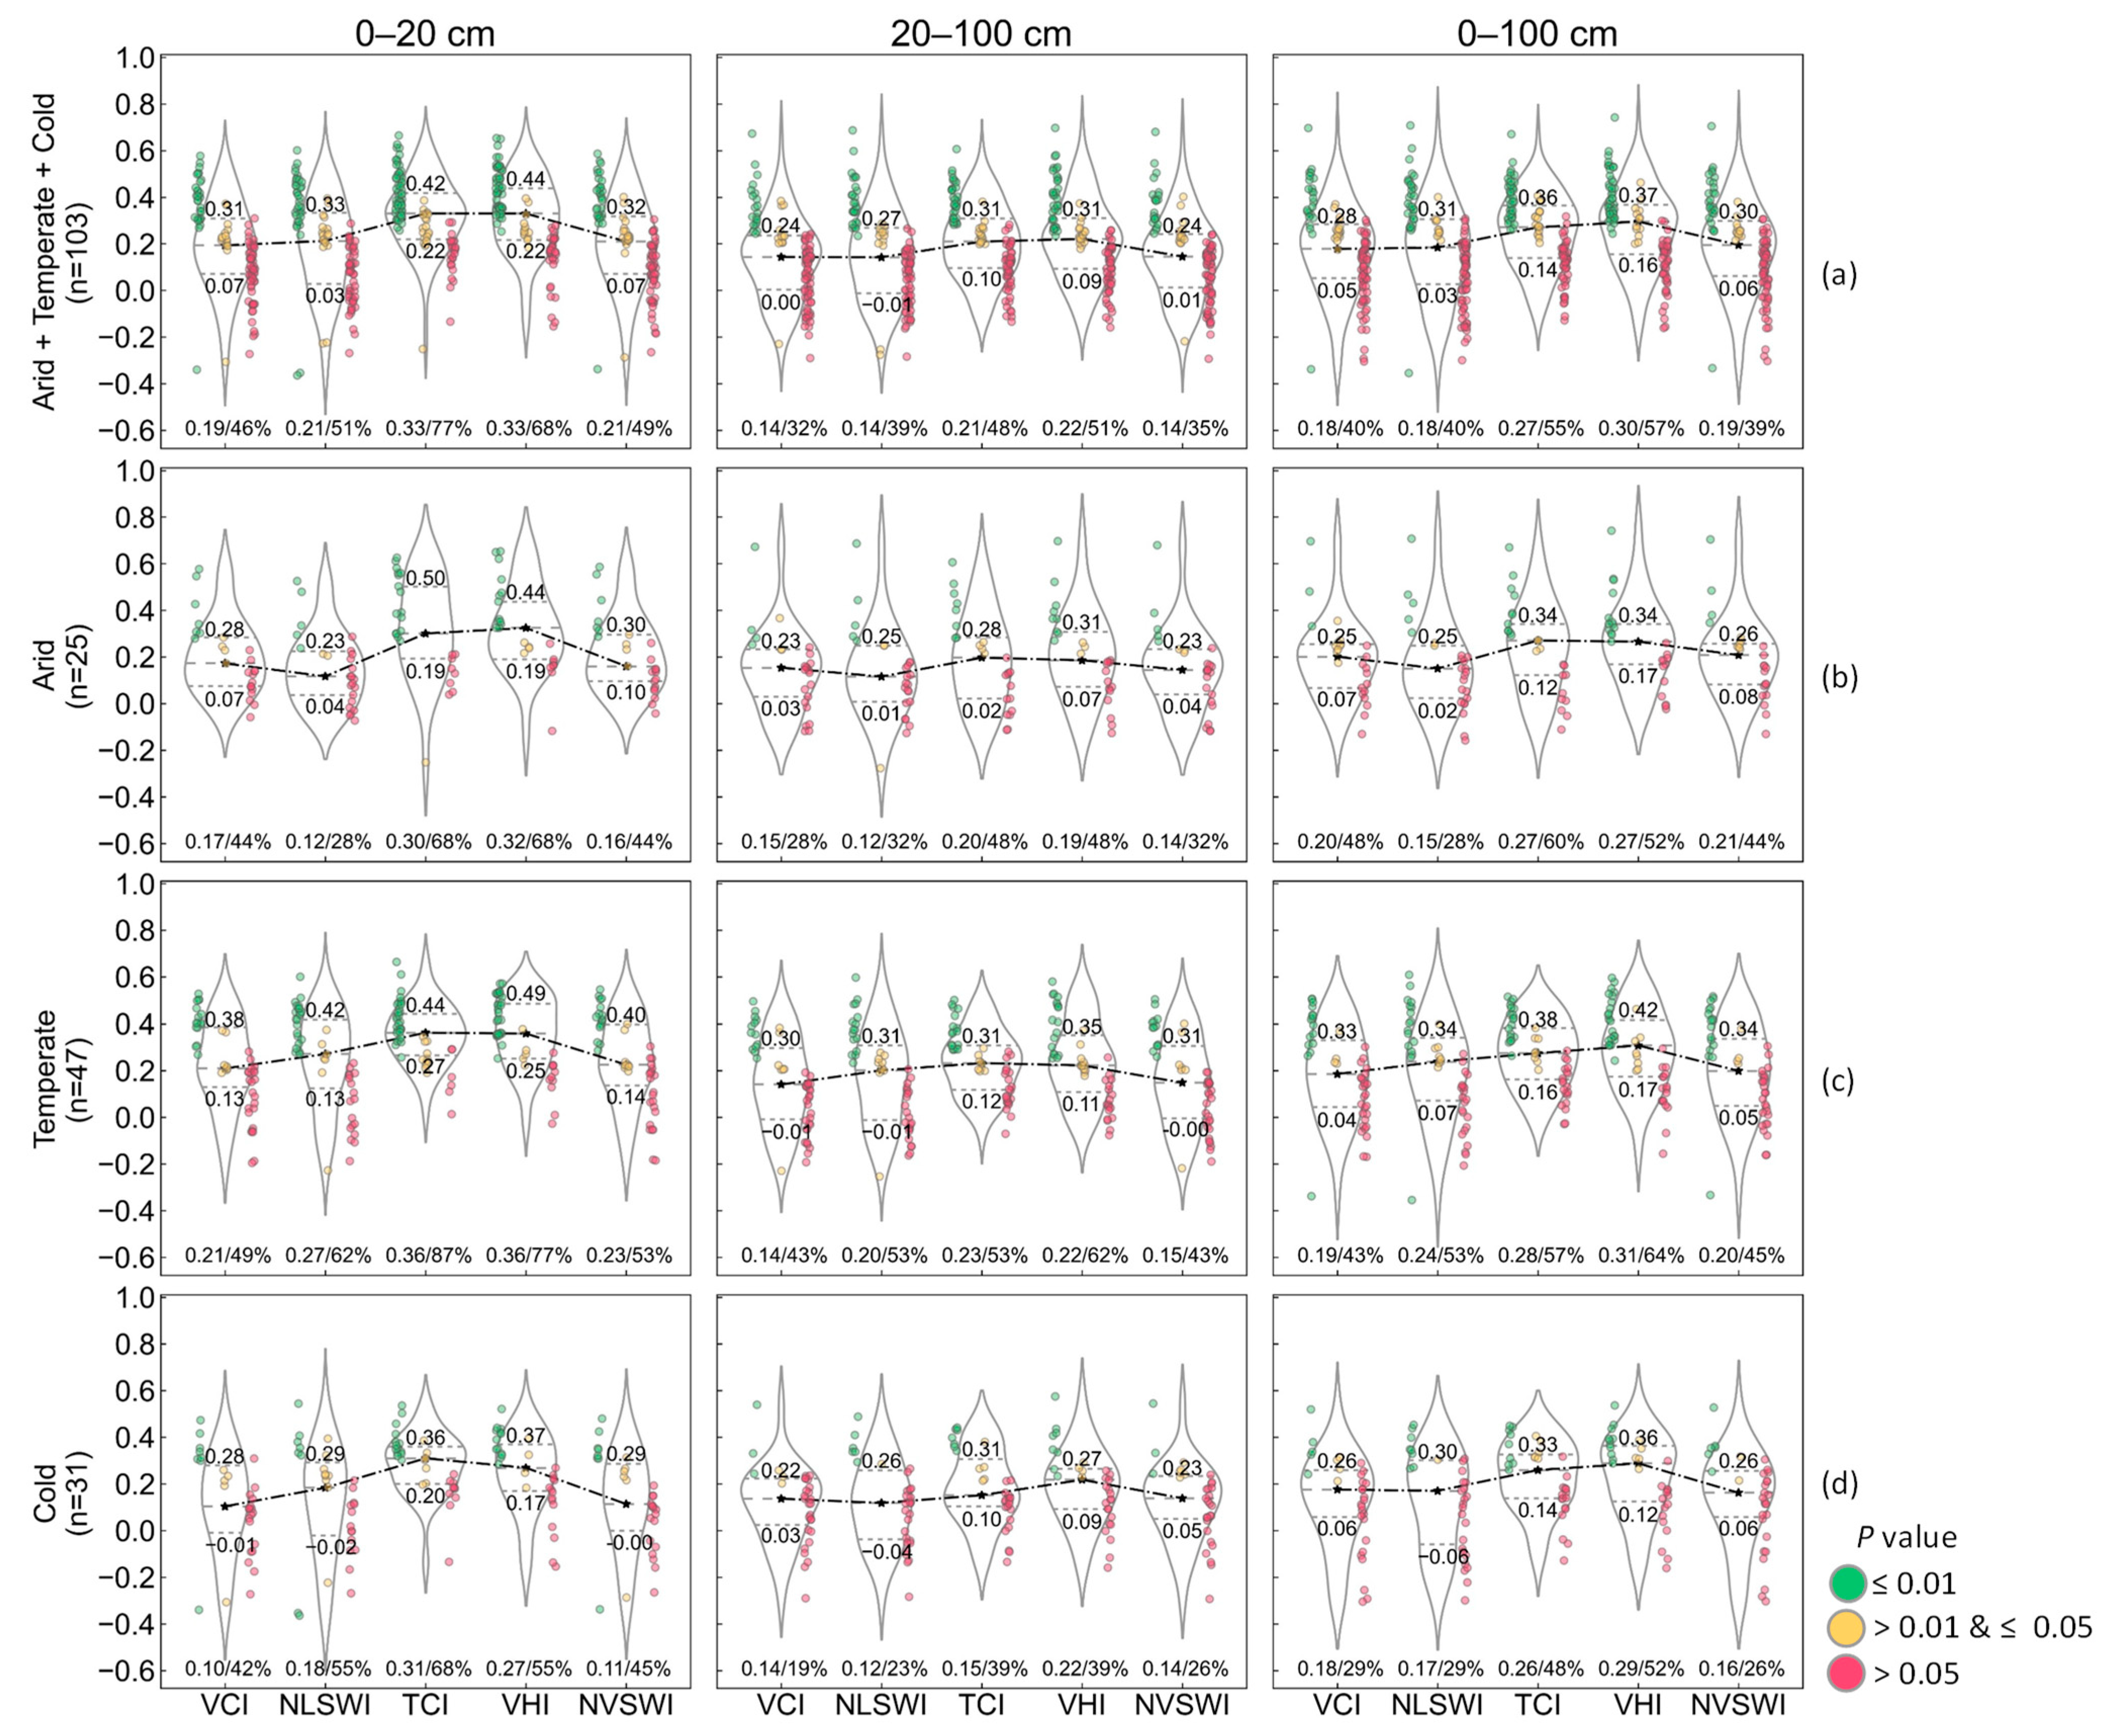
Figure 2a shows the overall performance of the drought indices for a total of 568 stations.
In the 0–20 cm soil layer, the VHI performed the best, followed by the TCI, NVSWI, VCI, and NLSWI. The VHI, with the highest upper and lower quartiles (r = 0.40/0.13), performed better than the TCI (r = 0.39/0.11), despite the equal median r (r = 0.26) obtained from the VHI and TCI. The TCI performed better than the NVSWI in all statistical indicators. The NVSWI, with the higher upper quartile and median r (r = 0.31/0.19), and more stations passing the significance test (39%), performed better than the VCI (r = 0.30/0.11, 37%). In the 20–100 cm soil layer, the VHI performed the best, with the highest median r (r = 0.18), upper and lower quartiles (r = 0.31/0.06), and the most stations passing the significance test (39%). The NVSWI performance ranked second, followed by the VCI, TCI, and NLSWI. Although the median r (r = 0.16), the lower quartile (r = 0.01), and the number of stations passing the significance test (37%) obtained from the VCI and NVSWI were equal, the upper quartile using the NVSWI (r = 0.29) was higher than that using the VCI (r = 0.28). In the 0–100 cm soil layer, the VHI performed the best in all statistical indicators, followed by the TCI, NVSWI, VCI, and NLSWI.
4.1.2. Performance in Different Climates
Figure 2b–d show the performance of the drought indices in arid, temperate, and cold climates, respectively.
For the arid climate, in the 0–20 cm soil layer, the VHI performed the best, with the highest median r and lower quartile (r = 0.32/0.18), and the most stations passing the significance test (63%), followed by the TCI, NVSWI, VCI, and NLSWI. In the 20–100 cm soil layer, the VCI, VHI, and NVSWI performed better, with a roughly equal median r and number of stations passing the significance test, 0.20/44%, 0.18/45%, and 0.19/46%, respectively. Considering the higher upper and lower quartiles, and the higher and denser r values’ distribution passing the 0.01 significance test, the VHI (r = 0.34/0.06) performed the best, followed by the NVSWI (r = 0.33/0.06) and VCI (r = 0.32/0.05). In the 0–100 cm soil layer, the VHI performed the best in all statistical indicators, followed by the NVSWI, VCI, TCI, and NLSWI.
For the temperate climate, in the three soil layers, the VHI and TCI performed better than the other indices. In the 0–20 cm soil layer, it was difficult to distinguish which one performed better between the VHI and TCI. The lower quartile using the TCI (r = 0.22) was higher than that using the VHI (r = 0.21), and the number of stations passing the significance test using the TCI (74%) was more than that using the VHI (66%). However, the median r and the upper quartile using the VHI (r = 0.35/0.45) were higher than those using the TCI (r = 0. 32/0.41), and the r values’ distribution using the VHI was more concentrated than that using the TCI. In the 20–100 cm and 0–100 cm soil layers, the VHI performed the best in all statistical indicators, followed by the TCI and other indices.
For the cold climate, in the 0–20 cm soil layer, the VHI performed the best in all statistical indicators, followed by the TCI, NVSWI, VCI, and NLSWI. In the 20–100 cm soil layer, the VCI, VHI, and NVSWI performed better, with a roughly equal median r and number of stations passing the significance test, 0.15/34%, 0.17/33%, and 0.16/34%, respectively. Considering the higher upper and lower quartiles, the VHI (r = 0.29/0.04) performed the best, followed by the NVSWI (r = 0.28/−0.00) and VCI (r = 0.27/−0.00). In the 0–100 cm soil layer, the VHI performed the best in all statistical indicators, followed by the TCI, NVSWI, VCI, and NLSWI.
4.2. Performance of the Drought Indices in Forests
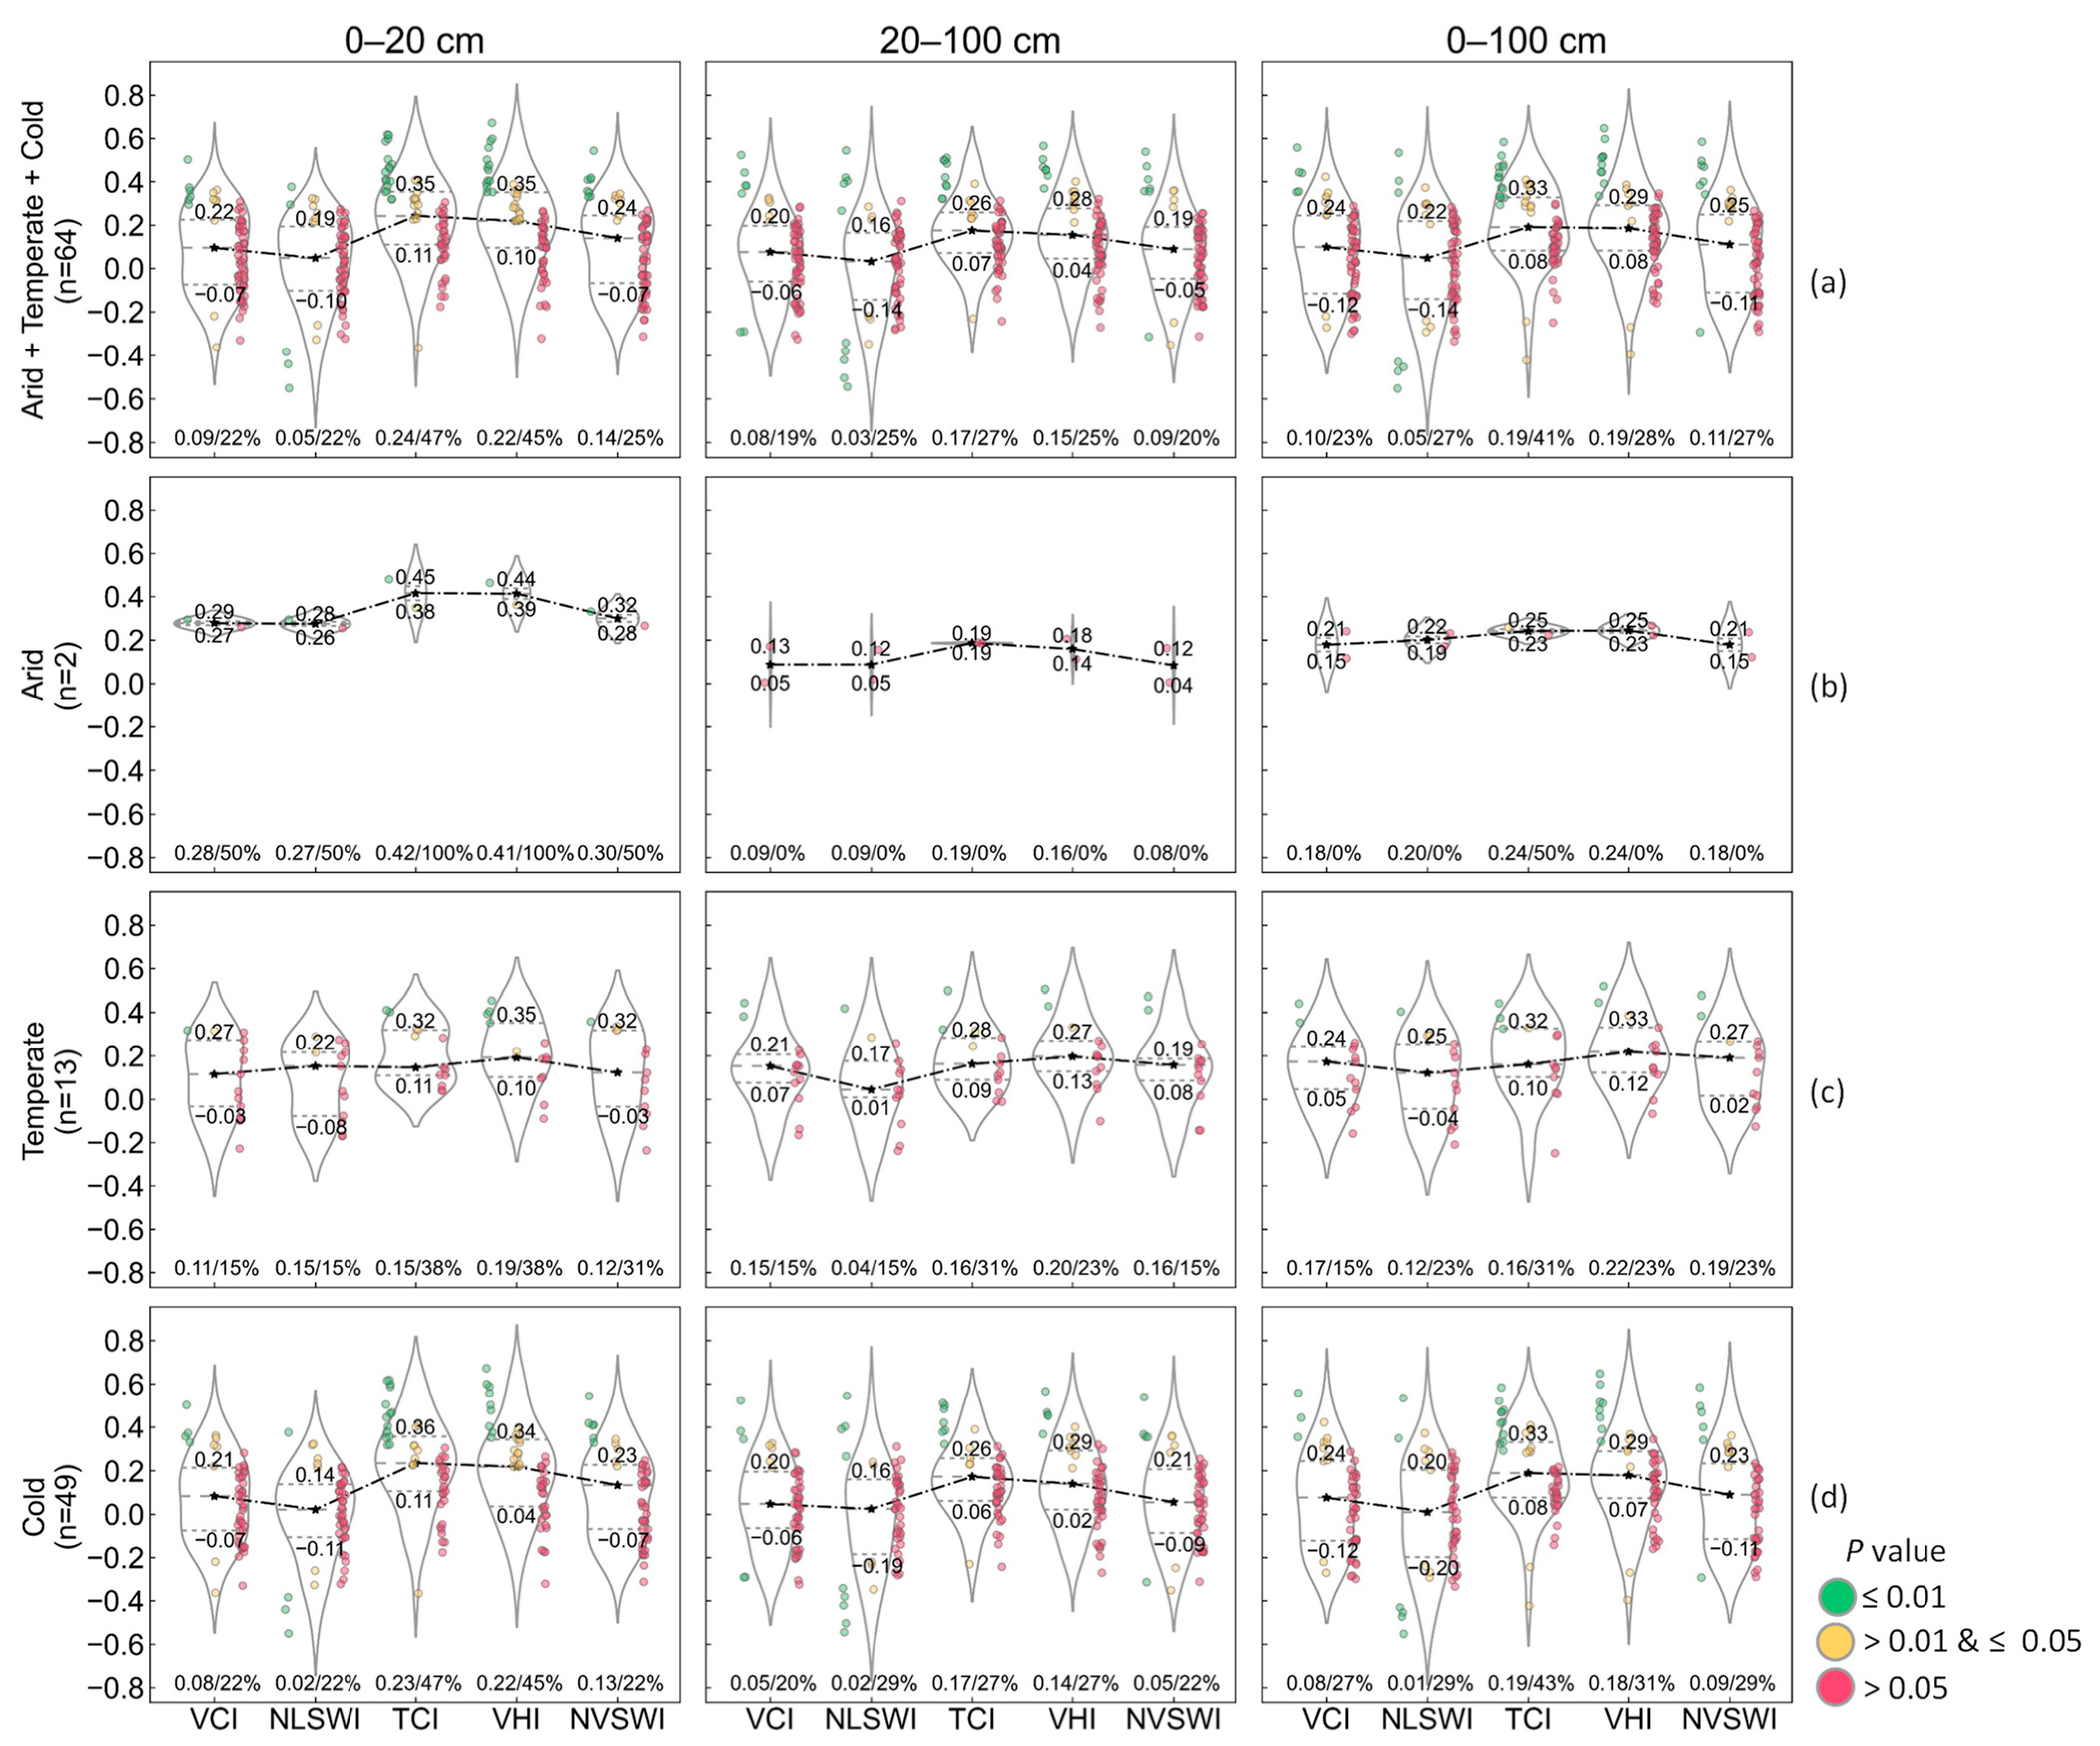
A total of 64 stations were in forests, including 13 stations in the temperate climate, mainly located in the southeast (defined by the National Climate Data Center) of the Contiguous United States, 49 stations in the cold climate, and 2 stations in the arid climate, located close to the cold climate. The stations in the cold and arid climates were mainly located in the mountains of the Western United States.
4.2.1. Overall Performance
Figure 3a shows the overall performance of the drought indices in forests.
In the 0–20 cm soil layer, the TCI performed the best in all statistical indicators. In the 20–100 cm soil layer, the TCI and VHI performed better than the other indices. Considering the higher median r and lower quartile, the TCI (r = 0.17/0.07) performed better than the VHI (r = 0.15/0.04). In the 0–100 cm soil layer, although the median r and lower quartile (r = 0.19/0.08) obtained from the TCI and VHI were equal, the TCI with the higher upper quartile (r = 0.33) and more stations passing the significance test (41%) performed better than the VHI (r = 0.29, 28%).
4.2.2. Performance in Different Climates
Figure 3b–d show the performance of the drought indices in forests in arid, temperate, and cold climates, respectively.
For the arid climate, there were only two stations. The number of stations was too small to distinguish which drought index performed the best and analyze the differences among these indices.
For the temperate climate, in the 0–20 cm soil layer, the VHI and TCI performed better than the other indices. It was difficult to distinguish which one performed better between the VHI and TCI. We obtained an equal number of stations passing the significance test (38%) from the VHI and TCI. The lower quartile using the TCI (r = 0.11) was higher than that using the VHI (r = 0.10), while the upper quartile and the median r using the VHI (r = 0.35/0.19) were higher than those using the TCI (r = 0.32/0.15). The VHI had more stations passing the 0.01 significance test. In the 20–100 cm and 0–100 cm soil layers, although the number of stations passing the significance test using the TCI was one more than that using the VHI, we found that the VHI performed better than the TCI in improving most of the r values, and had a higher median r (r = 0.20 vs. r = 0.16 and r = 0.22 vs. r = 0.16) and lower quartile (r = 0.13 vs. r = 0.09 and r = 0.12 vs. r = 0.10).
For the cold climate, the performance of each index in each soil layer was similar to the overall performance of the drought indices in forests. This might be due to 77% of the stations in forests being in this climate. The TCI performed the best, followed by the VHI, NVSWI, VCI, and NLSWI.
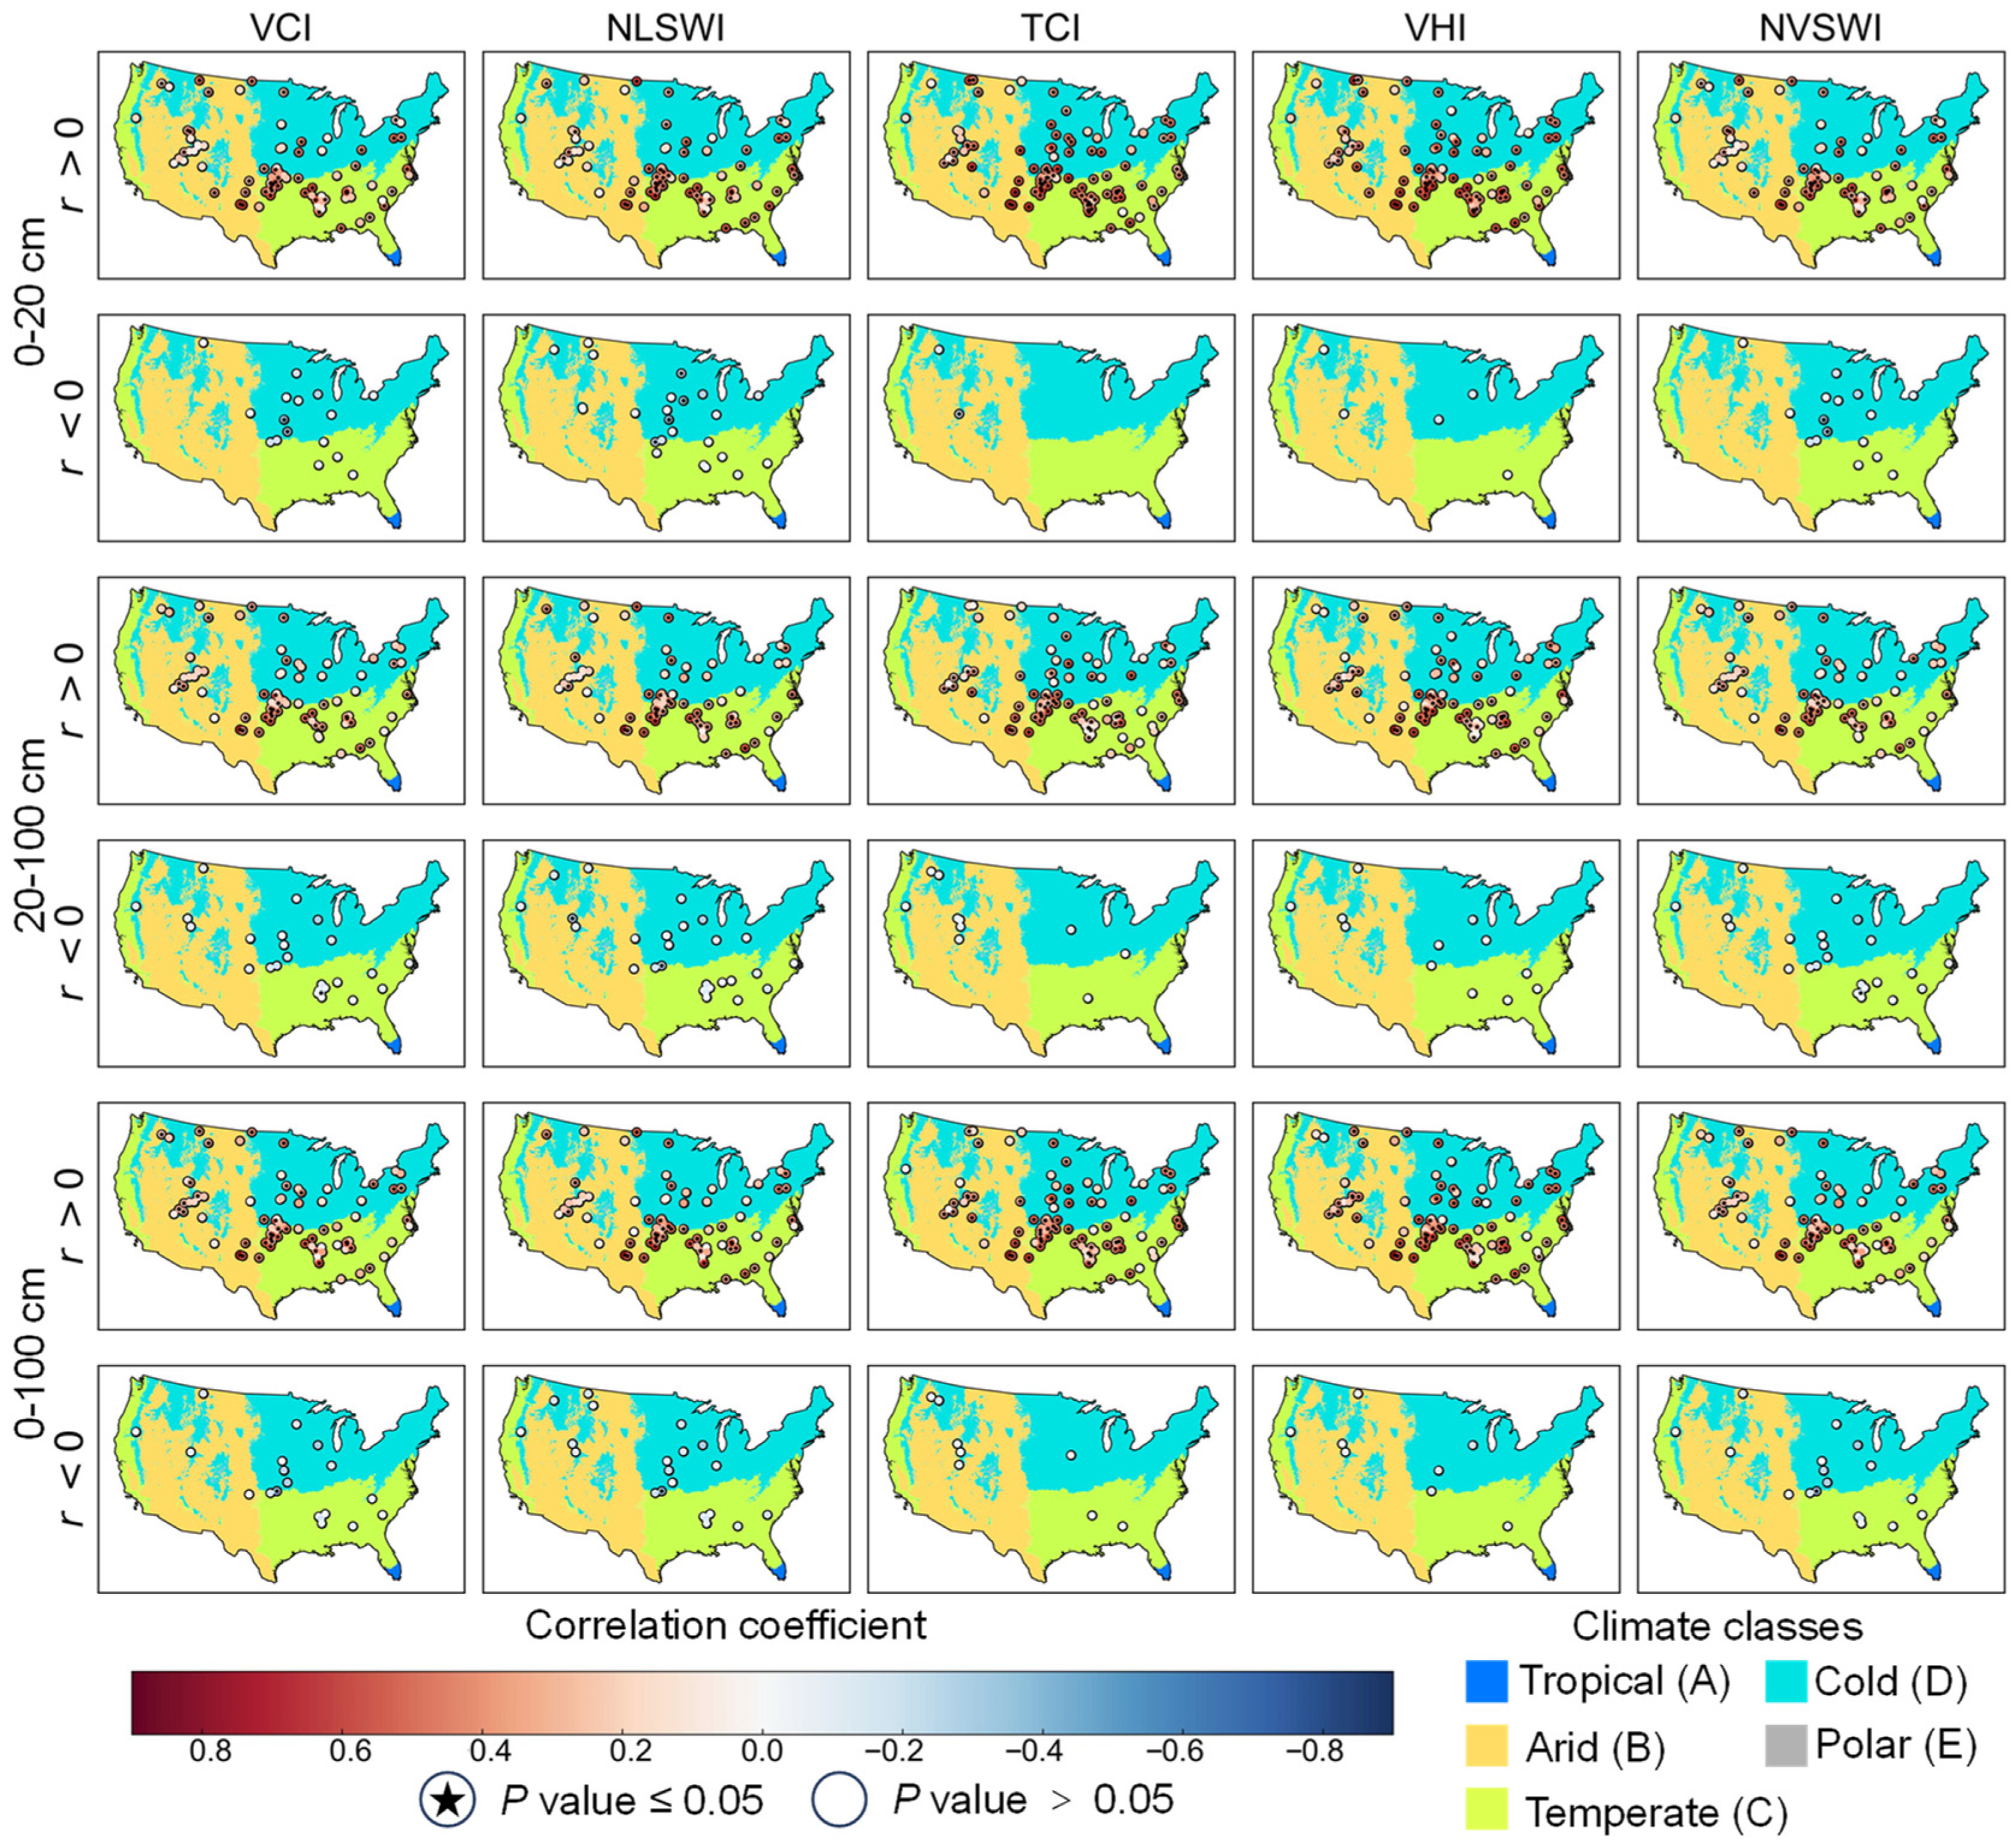
4.2.3. Spatial Distribution of Correlation Coefficient Values in Forests
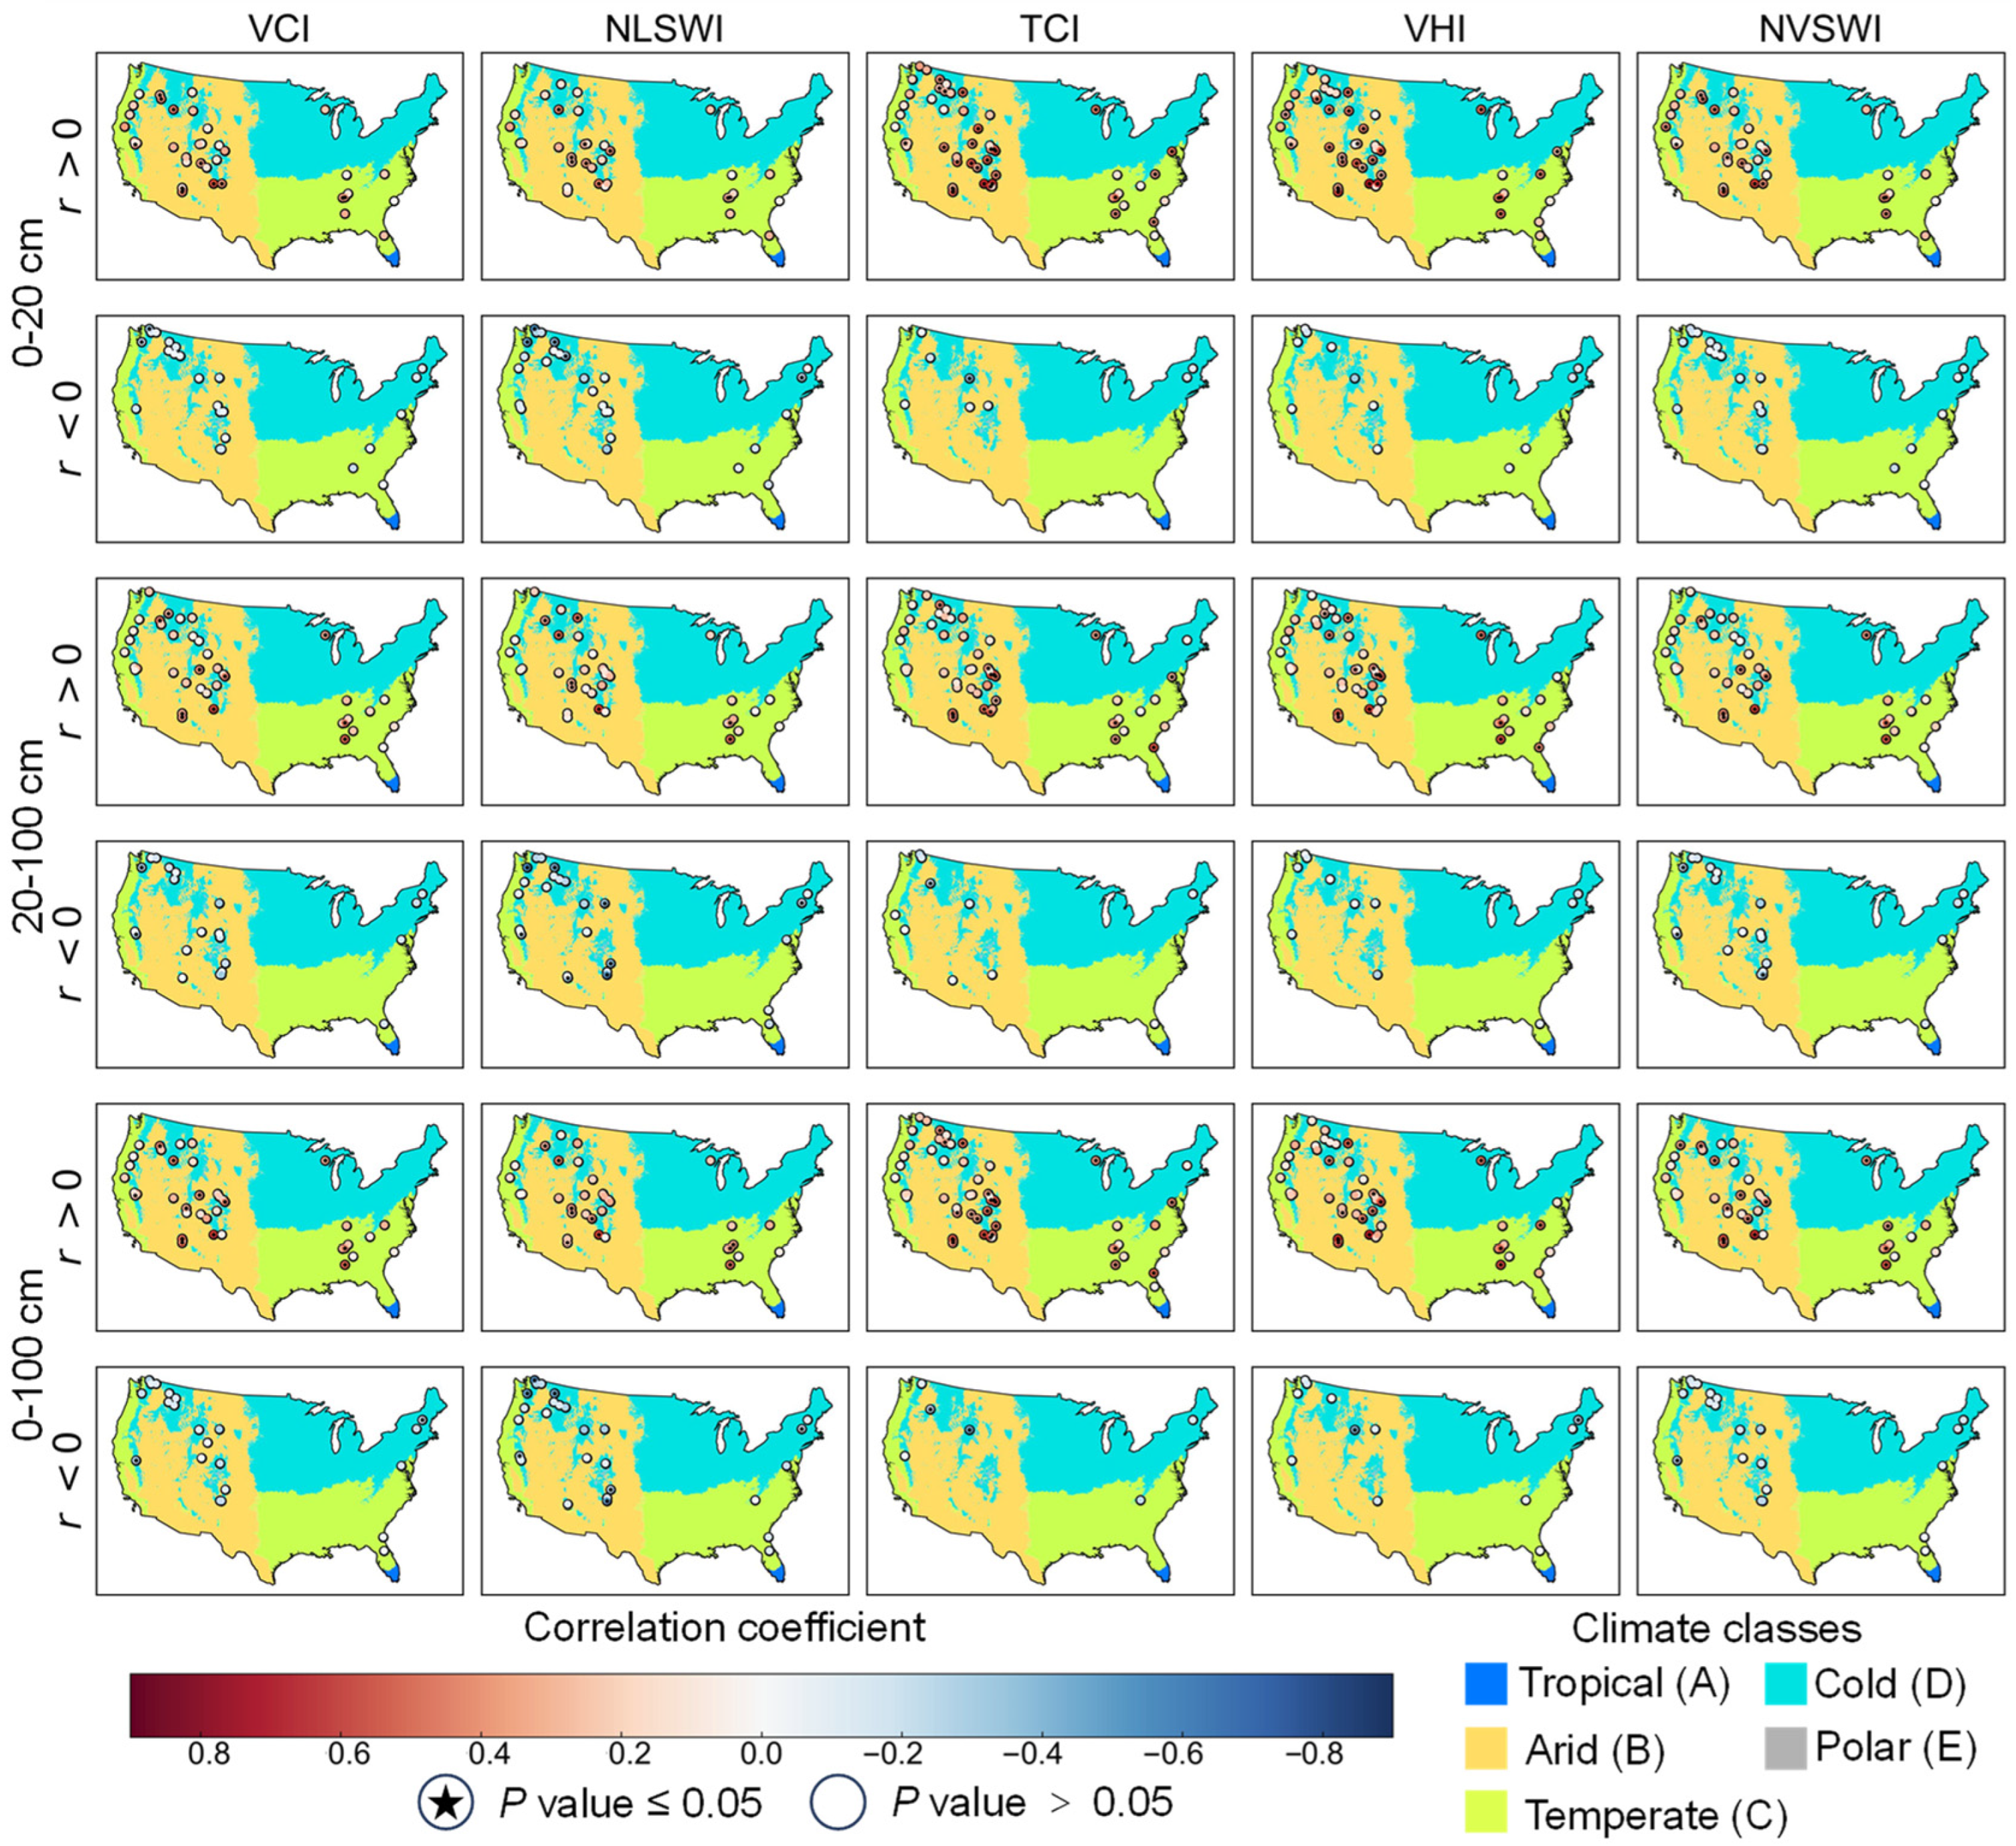
Figure 4 shows the spatial distribution of the correlation coefficient values in forests. In the 0–20 cm soil layer, the TCI and VHI had more stations passing the significance test than the VCI, NLSWI, and NVSWI. The number of stations passing the significance test for each index significantly reduced in the 20–100 cm and 0–100 cm soil layers compared with the number in the 0–20 cm soil layer. The number of stations with positive correlation coefficient values using the TCI and VHI was more than that using the VCI, NLSWI, and NVSWI in each soil layer. Many stations located in the Rocky Mountains passed the significance test using the TCI and VHI. However, many stations located in the Cascade Mountain Range barely passed the significance test using any index, although these stations are located in the cold climate.
4.3. Performance of the Drought Indices in Savannas
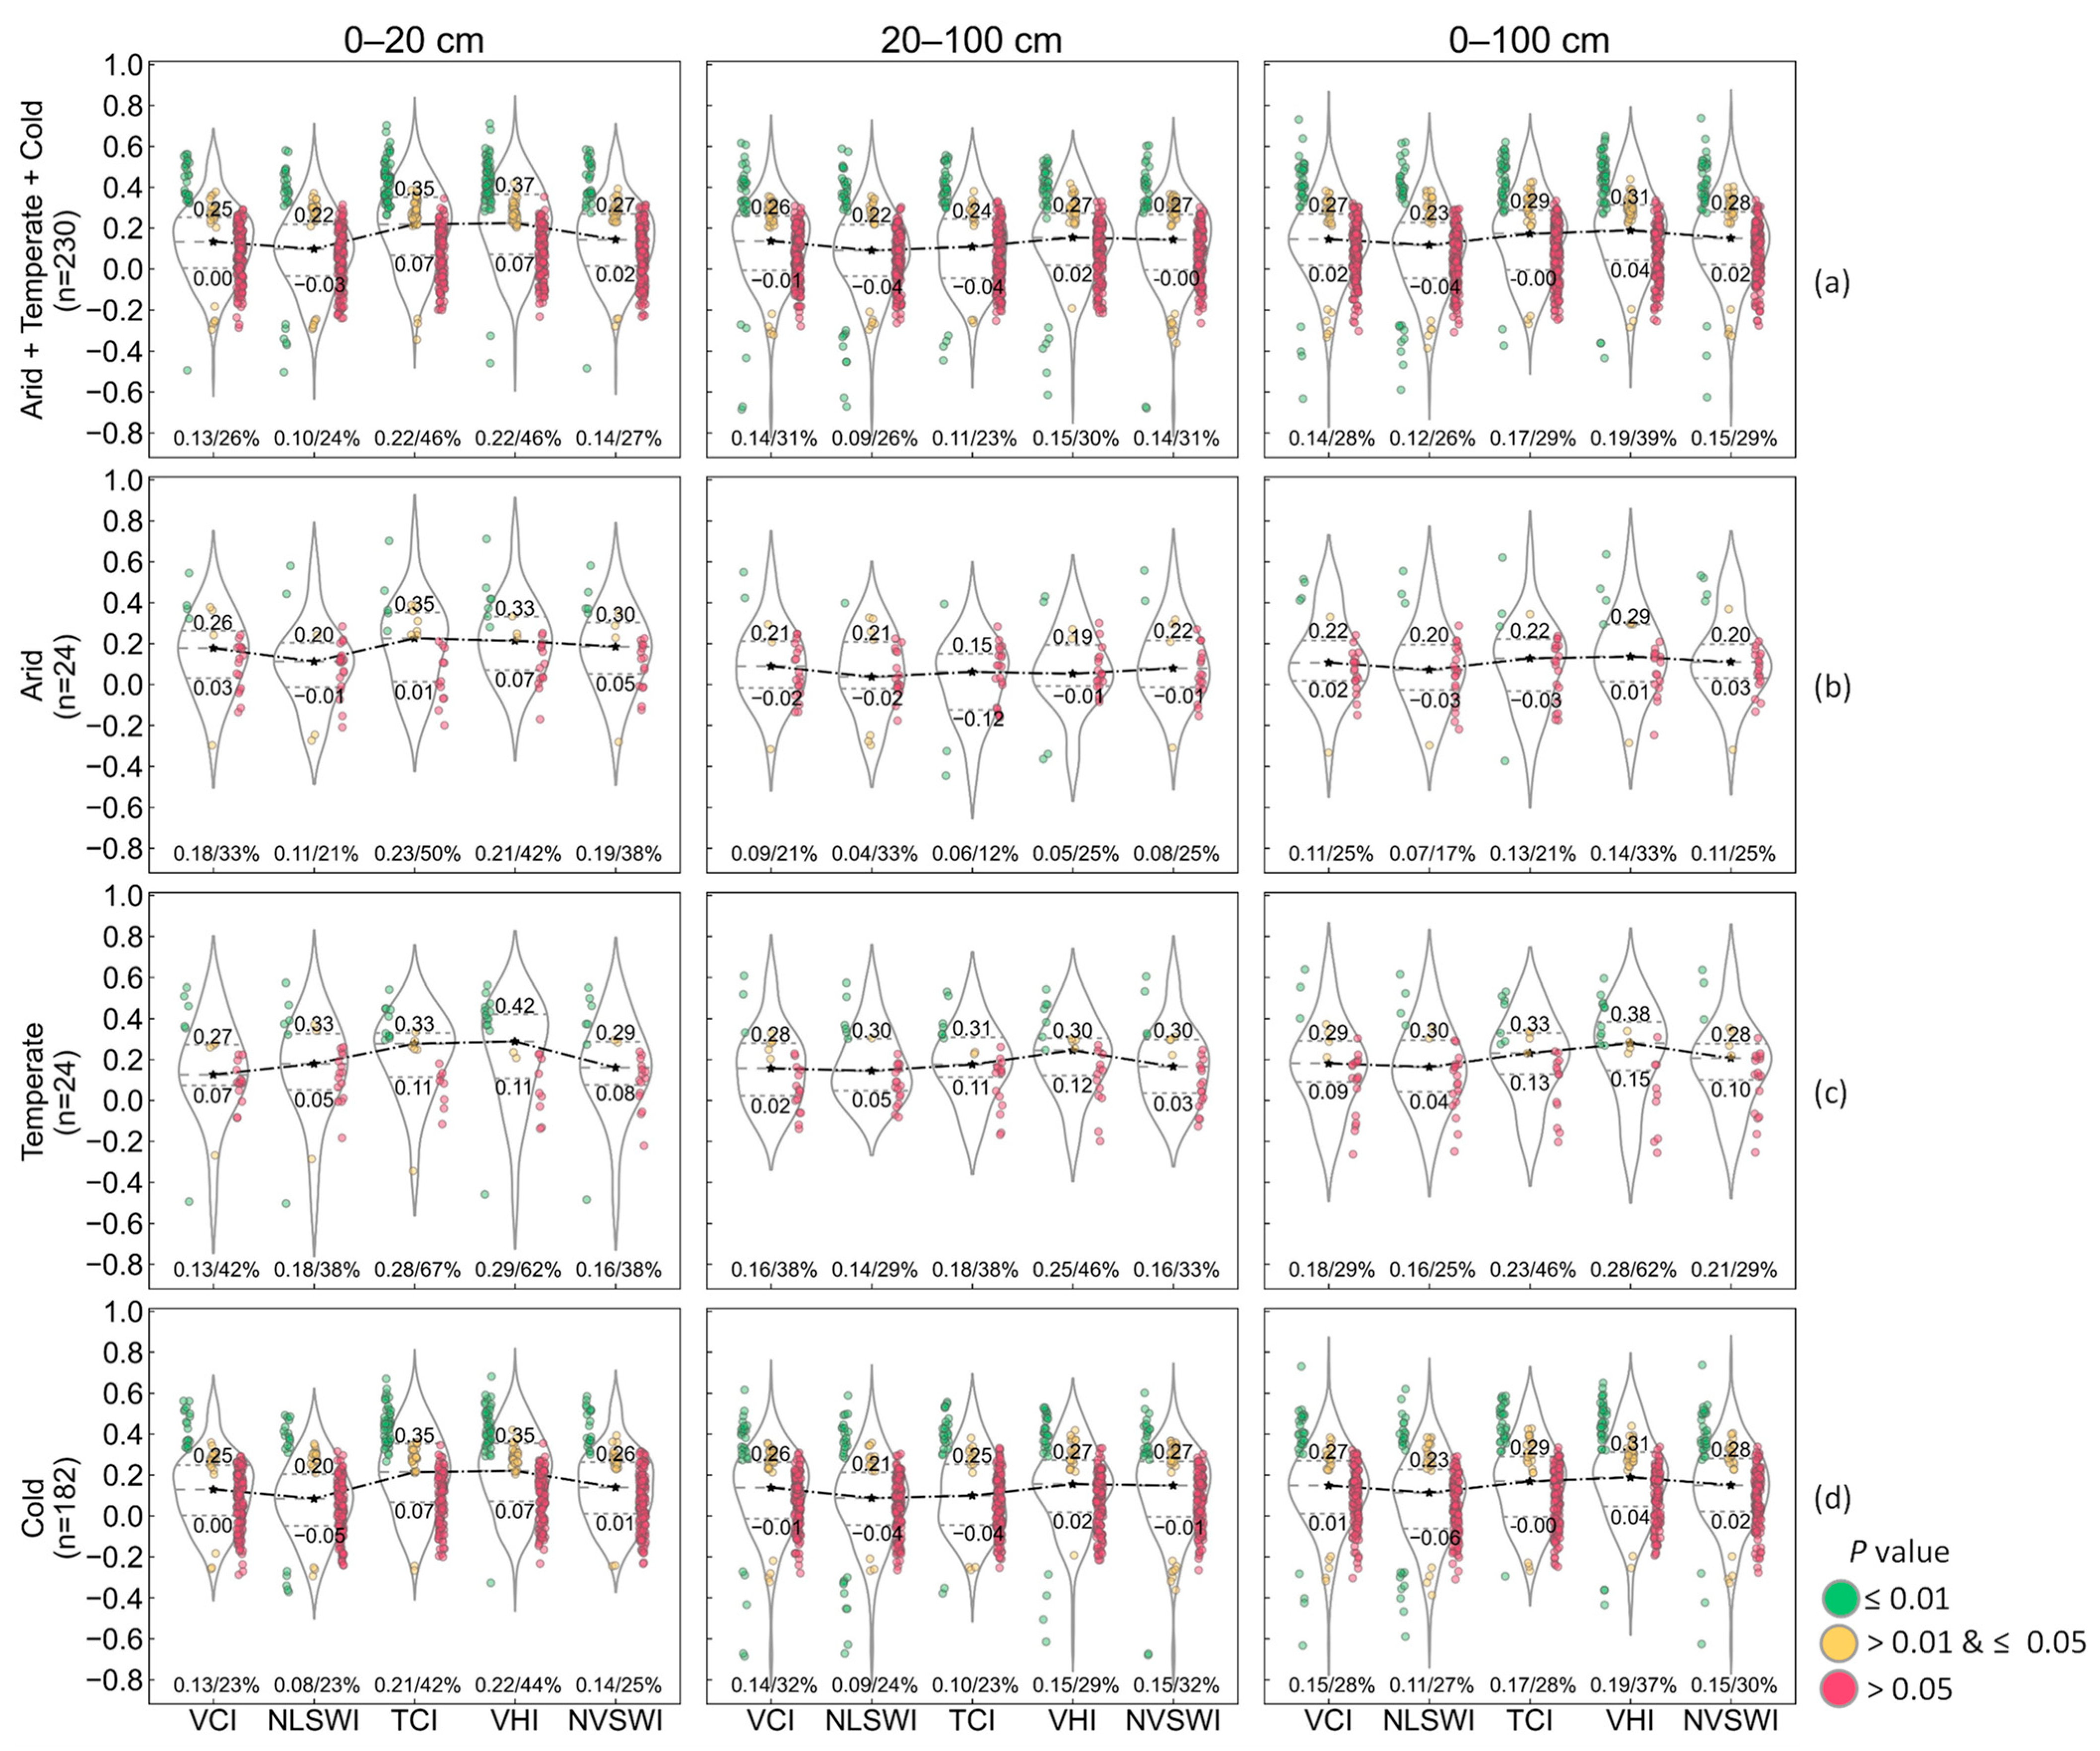
A total of 230 stations were in savannas, including 24 stations in the temperate climate, mainly located in the southeast of the Contiguous United States, 24 stations in the arid climate, and 182 stations in the cold climate, both of which were mainly located in the mountains of the Western United States.
4.3.1. Overall Performance
Figure 5a shows the overall performance of the drought indices in savannas.
In the 0–20 cm soil layer, the TCI and VHI performed better than the other indices. Although the median r (r = 0.22), the lower quartile (r = 0.07), and the number of stations passing the significance test (46%) obtained from the TCI and VHI were equal, the upper quartile using the VHI (r = 0.37) was higher than that using the TCI (r = 0.35), and the r values’ distribution passing the 0.01 significance test using the VHI was more concentrated with smaller fluctuant values compared with that using the TCI. The VHI performed the best, followed by the TCI, NVSWI, VCI, and NLSWI. In the 20–100 cm soil layer, the median r and the number of stations passing the significance test obtained from the VHI, NVSWI, and VCI were roughly equal, 0.15/30%, 0.14/31%, and 0.14/31%, respectively. From the interquartile range of the violin plot, the upper and lower quartiles using the VHI (r = 0.27/0.02) were higher than those using the NVSWI (r = 0.27/−0.00) and VCI (r = 0.26/−0.01), indicating a more robust performance of the VHI across regions. The VHI performed the best among these three indices. In the 0–100 cm soil layer, the VHI performed the best in all statistical indicators.
4.3.2. Performance in Different Climates
Figure 5b–d show the performance of the drought indices in savannas in arid, temperate, and cold climates, respectively.
For the arid climate, in the 0–20 cm soil layer, the VHI and TCI performed better than the other indices. It was difficult to distinguish which one performed better between the VHI and TCI. The median r and the upper quartile using the TCI (r = 0.23/0.35) were the highest, and the TCI had more stations passing the significance test (50%). In contrast, the lower quartile using the VHI (r = 0.07) was the highest, and the VHI had more stations passing the 0.01 significance test. In the 20–100 cm soil layer, the performance of each index was poor, with a low median r (r < 0.10). The highest lower quartile (r = −0.01) was obtained by using the VHI and NVSWI. In our view, the NVSWI performed the best, with the highest upper quartile (r = 0.22), the second-ranked median r (r = 0.08), and the higher r values passing the significance test. In the 0-100 cm soil layer, the VHI performed the best with the highest median r and upper quartile (r = 0.14/0.29), and the most stations passing the significance test (33%).
For the temperate climate, in the 0–20 cm soil layer, considering the r values’ distribution passing the significance test, the VHI performed the best, followed by the TCI and the other indices. In the 20–100 cm and 0–100 cm soil layers, the VHI performed the best with the highest median r and lower quartile (r = 0.25/0.12 and r = 0.28/0.15), and the most stations passing the significance test (46% and 62%), followed by the TCI and the other indices.
For the cold climate, in the 0–20 cm soil layer, the VHI performed the best, followed by the TCI, NVSWI, VCI, and NLSWI. In the 20–100 cm soil layer, the VHI performed the best, followed by the NVSWI and the other indices. The VHI, with the more concentrated r values’ distribution passing the 0.01 significance test and the higher lower quartile (r = 0.02), performed better than the NVSWI (r = −0.01). In the 0-100 cm soil layer, the VHI performed the best in all statistical indicators.
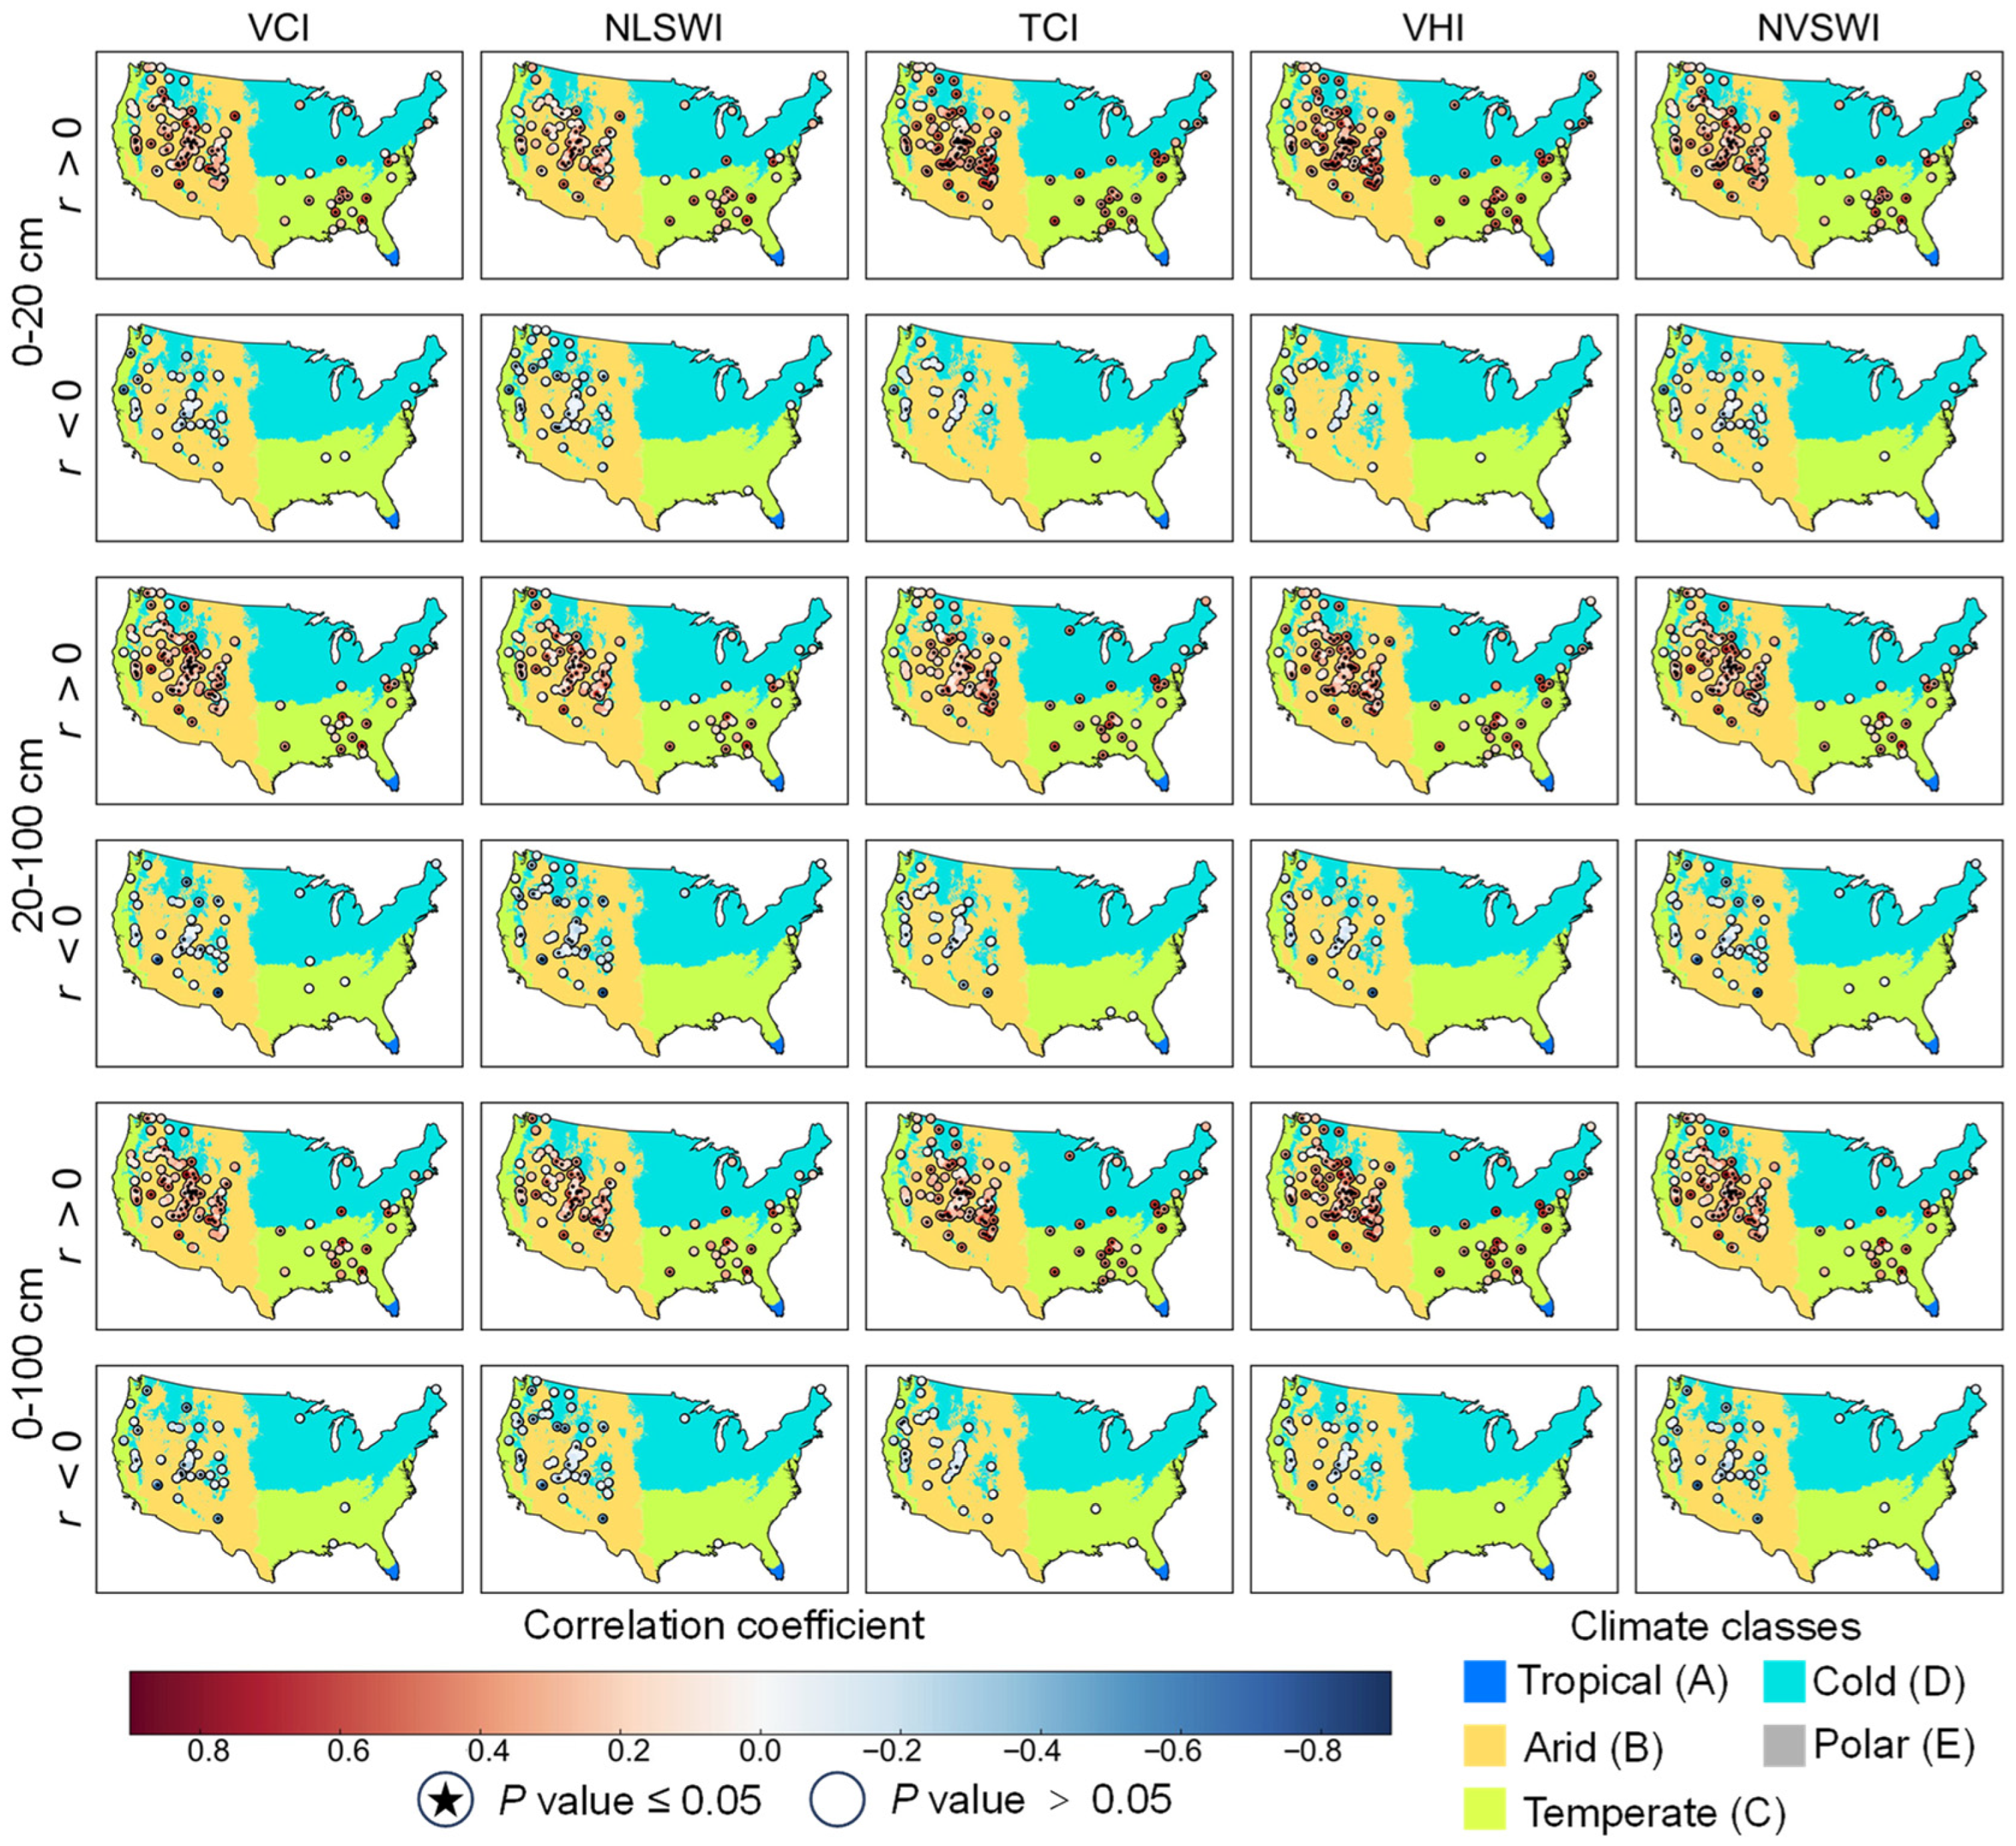
4.3.3. Spatial Distribution of Correlation Coefficient Values in Savannas
Figure 6 shows the spatial distribution of the correlation coefficient values in savannas. In the 0–20 cm soil layer, the VHI and TCI showed little significant difference in spatial distribution. The VHI and TCI had more stations passing the significance test compared with the VCI, NLSWI, and NVSWI. In terms of the distribution of stations passing the significance test in different soil layers, the VHI performed better than the TCI in the 20–100 cm and 0–100 cm soil layers. Many stations with negative correlation coefficient values were located in the cold climate zone of the Rocky Mountains, around many stations with positive correlation coefficient values.
4.4. Performance of the Drought Indices in Shrub Grasslands
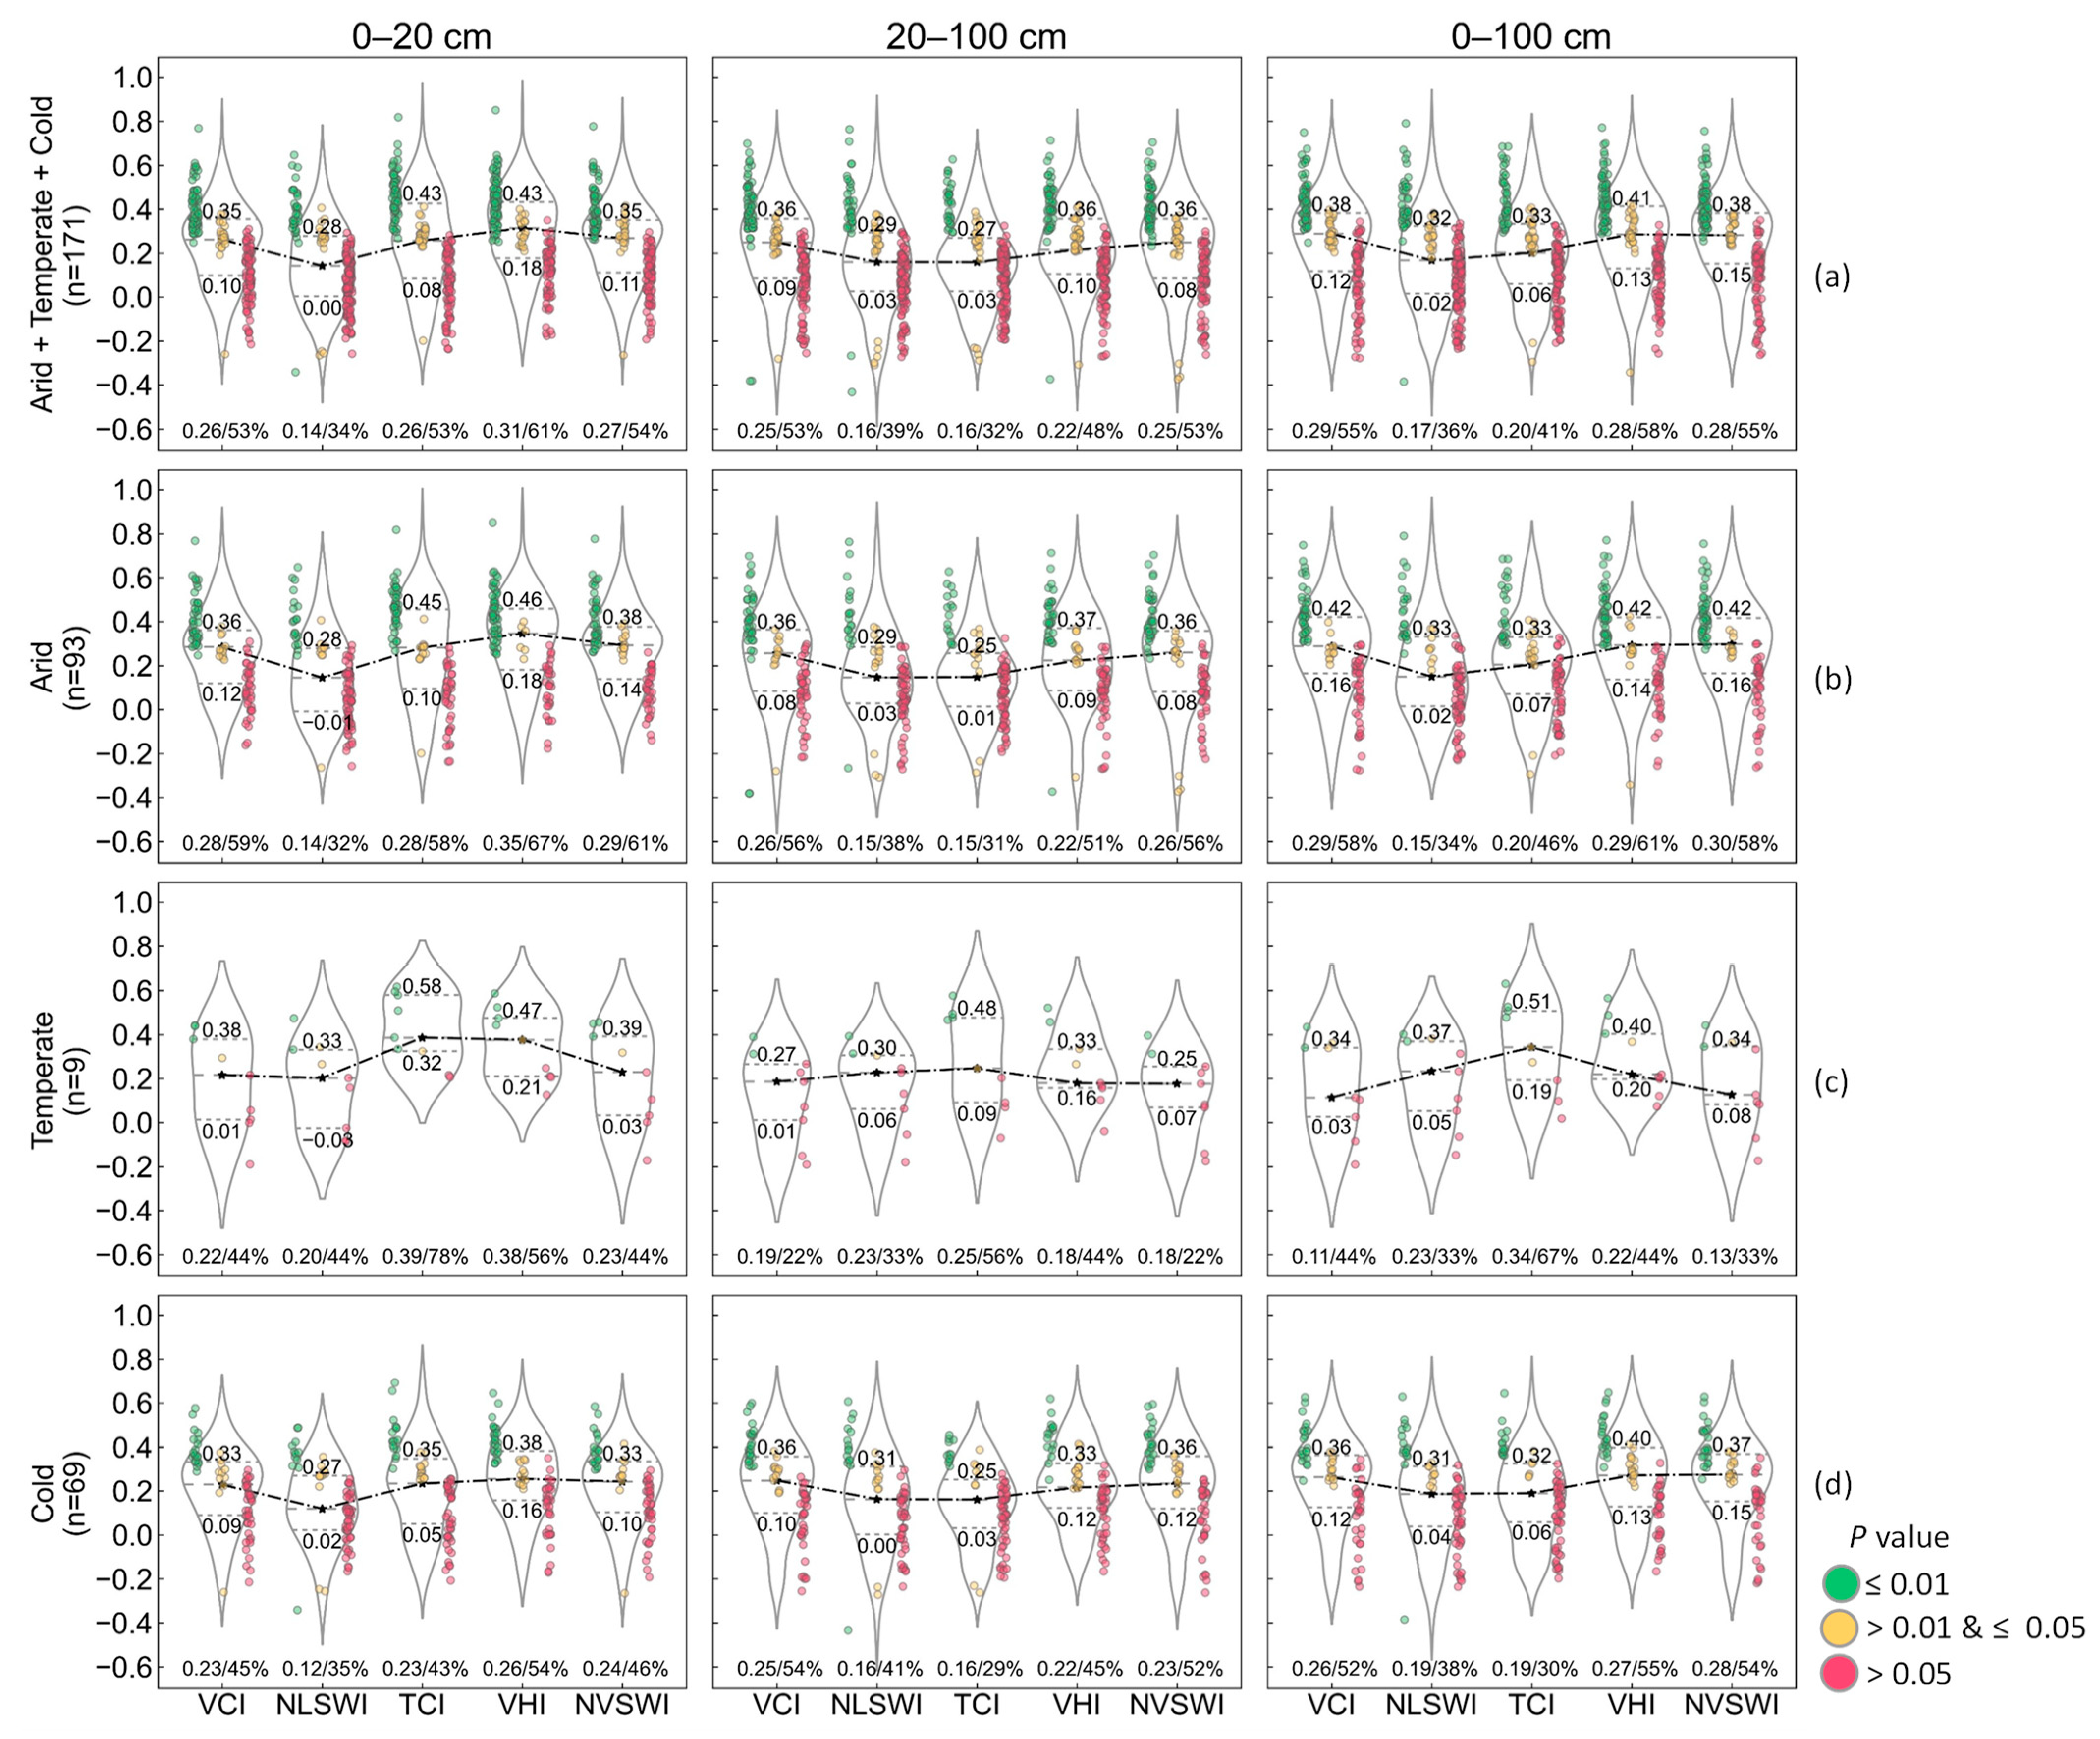
A total of 171 stations were in shrub grasslands, mainly located in the mountains of the Western United States, including 93 stations in the arid climate, 9 stations in the temperate climate, and 69 stations in the cold climate.
4.4.1. Overall Performance
Figure 7a shows the overall performance of the drought indices in shrub grasslands.
In the 0–20 cm soil layer, the VHI performed the best in all statistical indicators. The median r (r = 0.16) and the number of stations passing the significance test (53%) obtained from the VCI and TCI were equal. The quartile range using the VCI (0.10 to 0.35) was smaller than that using the TCI (0.08 to 0.43), which meant the r values’ distribution using the VCI was more concentrated than that using the TCI. The TCI improved the r values for some stations. Considering the higher and denser r values’ distribution passing the 0.01 significance test, the TCI performed better than the VCI. The NVSWI with the higher lower quartile (r = 0.11) performed better than the VCI (r = 0.10). However, it was difficult to distinguish which one performed better between the TCI and NVSWI. The median r and the number of stations passing the significance test obtained from the TCI and NVSWI were roughly equal, 0.26/53% and 0.27/54%, respectively. The upper quartile using the TCI (r = 0.43) was higher than that using the NVSWI (r = 0.35), while the lower quartile using the NVSWI (r = 0.11) was higher than that using the TCI (r = 0.08). The quartile range using the NVSWI (0.11 to 0.35) was smaller than that using the TCI (0.08 to 0.43), which meant the r values’ distribution using the NVSWI was more concentrated than that using the TCI. The NVSWI improved the poor r values. In the 20–100 cm soil layer, the VCI with the higher lower quartiles (r = 0.09) performed better than the NVSWI (r = 0.08), despite the equal median r and upper quartiles (r = 0.25/0.36) and the equal number of stations passing the significance test (53%) obtained from the VCI and NVSWI. Compared with the VCI, the VHI reduced the number of stations passing the significance test (53% vs. 48%). However, the lower quartile using the VHI (r = 0.10) was higher than that using the VCI (r = 0.09). It was difficult to distinguish which one performed better between the VHI and VCI. In the 0–100 cm soil layer, the VHI and NVSWI demonstrated almost the same performance, followed by the VCI, TCI, and NLSWI. The lower quartile using the NVSWI (r = 0.15) was higher than that using the VHI (r = 0.13) and the smaller interquartile range using the NVSWI (0.15 to 0.38) indicated that the r values’ distribution was more concentrated compared with the VHI (0.13 to 0.41). The higher upper quartile using the VHI indicated that the VHI improved the r values for some stations (r = 0.41 vs. r = 0.38) and had more stations passing the significance test (58% vs. 55%).
4.4.2. Performance in Different Climates
Figure 7b–d show the performances of the drought indices in shrub grasslands in arid, temperate, and cold climates, respectively.
For the arid climate, in the 0–20 cm soil layer, the performance of each index was similar to the overall performance of the drought indices in the 0–20 cm soil layer in shrub grasslands. The VHI performed the best in all statistical indicators. The TCI and NVSWI performed better than the VCI. It was difficult to distinguish which one performed better between the TCI and NVSWI. In the 20–100 cm soil layer, the median r (r = 0.26), the lower quartile (r = 0.08), the upper quartile (r = 0.36), and the number of stations passing the significance test (56%) obtained from the VCI and NVSWI were equal. The VHI with the higher upper and lower quartiles (r = 0.37/0.09) performed better than the VCI and NVSWI, which meant the VHI improved the r values for some stations. However, the VHI reduced the median r (r = 0.22) and the number of stations passing the significance test (51%) compared with the NVSWI and VCI. In the 0–100 cm soil layer, it was difficult to distinguish which one performed better among the VHI, NVSWI, and VCI. We obtained an equal upper quartile (r = 0.42) using the VHI, NVSWI, and VCI. The number of stations passing the significance test using the VHI (61%) was more than that using the NVSWI (58%) or VCI (58%), while the lower quartile using the NVSWI (r = 0.16) or VCI (r = 0.16) was higher than that using the VHI (r = 0.14).
For the temperate climate, in the 0–20 cm soil layer, the TCI performed the best in all statistical indicators, followed by the VHI, NVSWI, VCI, and NLSWI. In the 20–100 cm soil layer, the TCI improved the r values passing the 0.01 significance test compared with the VHI. However, we obtained the highest lower quartile using the VHI (r = 0.16). It was difficult to distinguish which one performed better between the VHI and TCI. In the 0–100 cm soil layer, the TCI performed the best, with the highest median r and upper quartiles (r = 0.34/0.51) and the most stations passing the significance test (67%).
For the cold climate, in the 0–20 cm soil layer, the VHI performed the best in all statistical indicators, followed by the NVSWI, VCI, TCI, and NLSWI. In the 20–100 cm soil layer, the NVSWI performed better than the VHI in the median r (r = 0.23 vs. r = 0.22), the upper quartile (r = 0.36 vs. r = 0.33), and the number of stations passing the significance test (52% vs. 45%). The NVSWI with the higher lower quartiles (r = 0.12) performed better than the VCI (r = 0.10). The NVSWI was considered as the best index. The lower quartile using the VHI (r = 0.12) was higher than that using the VCI (r = 0.10), while the number of stations passing the significance test using the VCI (54%) was more than that using the VHI (45%). It was difficult to distinguish which one performed better between the VHI and VCI. In the 0–100 cm soil layer, the integrated index, VHI, and NVSWI performed better than the VCI, TCI, and NLSWI. It was difficult to distinguish which one performed better between the VHI and NVSWI. The median r and the number of stations passing the significance test obtained from the VHI and NVSWI were roughly equal, 0.27/55% and 0.28/54%, respectively. The upper quartile using the VHI (r = 0.40) was higher than that using the NVSWI (r = 0.37), while the lower quartile using the NVSWI (r = 0.15) was higher than that using the VHI (r = 0.13). The quartile range using the NVSWI (0.15 to 0.37) was smaller than that using the VHI (0.13 to 0.40). The VCI performed better than the TCI and NLSWI in all statistical indicators.
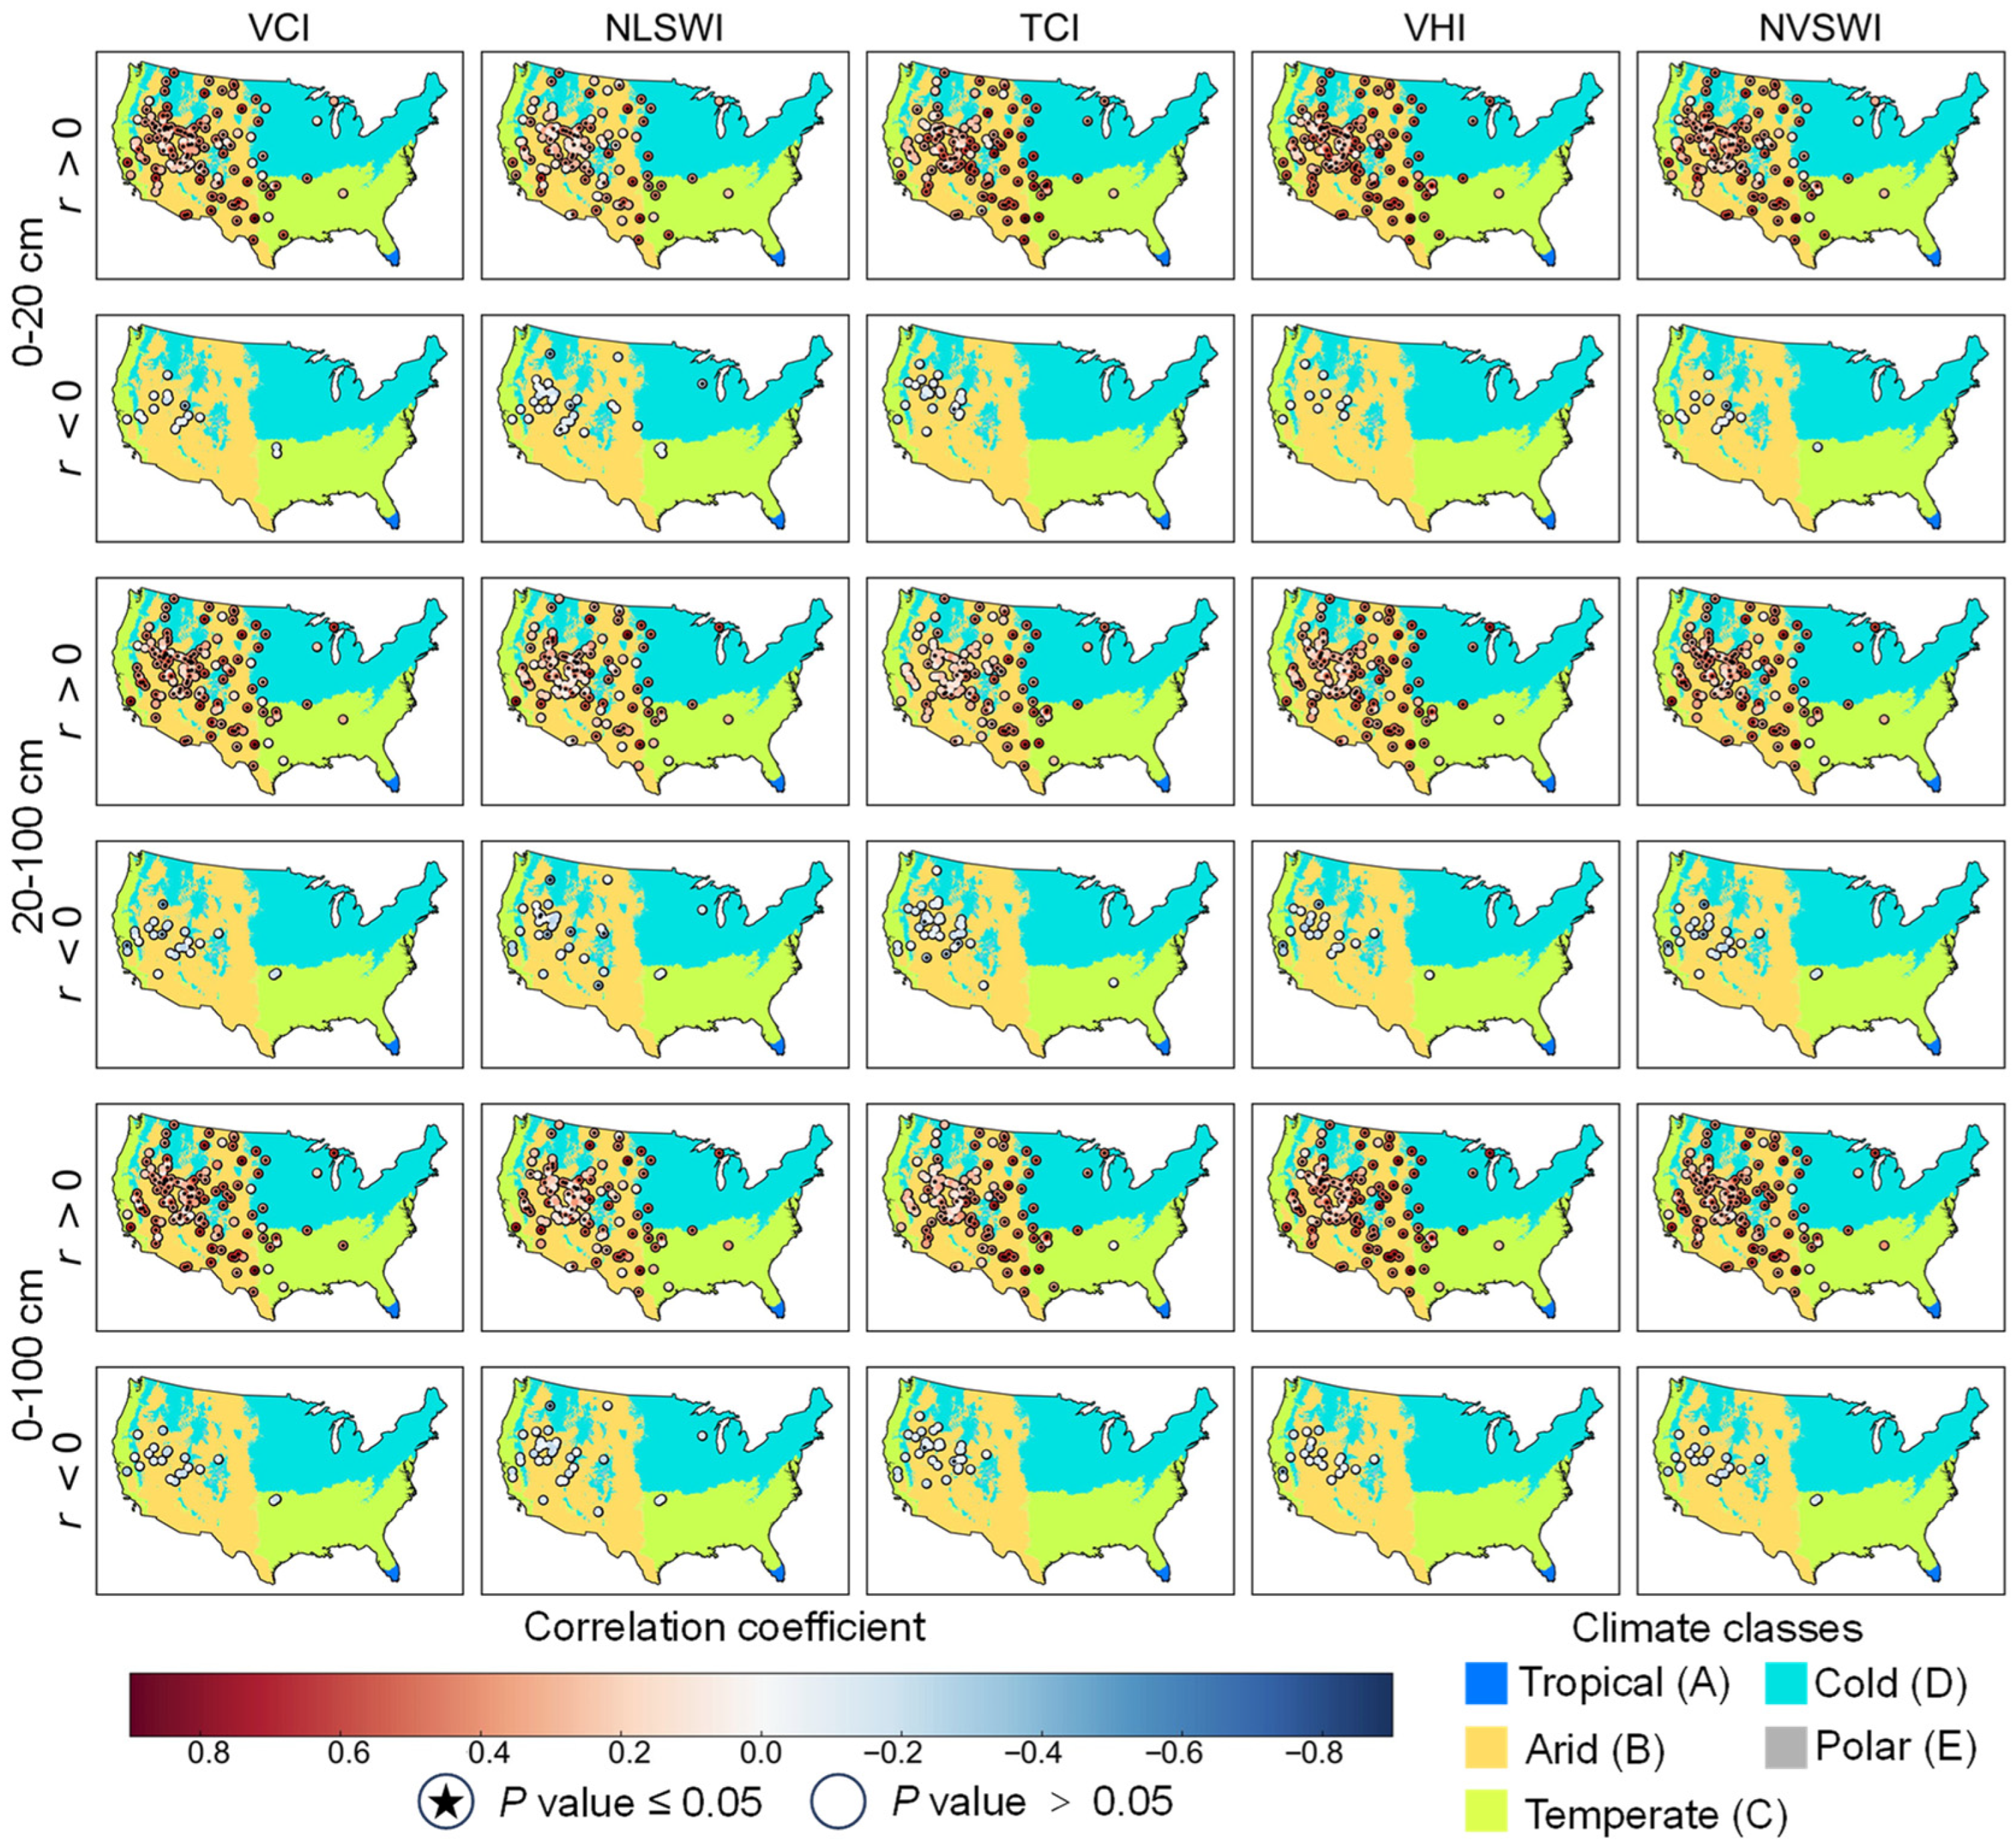
4.4.3. Spatial Distribution of Correlation Coefficient Values in Shrub Grasslands
Figure 8 shows the spatial distribution of the correlation coefficient values in shrub grasslands. In the 0–20 cm soil layer, except for the NLSWI, the distribution of stations passing the significance test using the other drought indices was even. In the 20–100 cm and 0–100 cm soil layers, the distribution of stations passing the significance test using the VHI, NVSWI, and VCI were more evenly distributed compared with that using the TCI and NLSWI. In the three soil layers, the stations passing the significance test using the TCI was significantly reduced in the Great Basin region located in Nevada and Utah in the 20–100 cm and 0–100 cm soil layers compared with the 0–20 cm soil layer. Many stations with negative correlation coefficient values were located in the Great Basin region, and the number using the TCI was more than that using the VCI in each soil layer. The number of stations with negative correlation coefficient values using the NLSWI was the most, while that using the VHI was the least in each soil layer.
4.5. Performance of the Drought Indices in Croplands
A total of 103 stations were in croplands, including 25 stations in the arid climate, mainly located in Utah, 47 stations in the temperate climate, located in the south and southeast of the Contiguous United States, and 31 stations in the cold climate, located in the east north central, central, and northeast of the Contiguous United States.
4.5.1. Overall Performance
Figure 9a shows the overall performance of the drought indices in croplands.
In the 0–20 cm soil layer, the TCI and VHI performed better than the other indices. Although the median r and lower quartile (r = 0.33/0.22) obtained from the TCI and VHI were equal and the upper quartile using the VHI (r = 0.44) was higher than that using the TCI (r = 0.42), we considered that the TCI performed better than the VHI because the number of stations passing the significance test using the TCI (77%) was more than that using the VHI (68%). In the 20–100 cm soil layer, the TCI and VHI performed better than the other indices. We obtained an equal upper quartile (r = 0.31) and a roughly equal lower quartile (r = 0.10 and r = 0.09) by using the TCI and VHI. The median r and the number of stations passing the significance test using the VHI (r = 0.22, 51%) performed better than those using the TCI (r = 0.21, 48%). From the r values’ distribution passing the 0.01 significance test, the r values’ distribution using the TCI was more concentrated with smaller fluctuant values compared with the VHI. In the 0-100 cm soil layer, the VHI performed the best in all statistical indicators, followed by the TCI, NVSWI, VCI, and NLSWI.
4.5.2. Performance in Different Climates
Figure 9b–d show the performances of the drought indices in croplands in arid, temperate, and cold climates, respectively.
For the arid climate, in the 0–20 cm soil layer, the TCI performed the best with the highest upper and lower quartiles (r = 0.50/0.19), and the most stations passing the 0.01 significance test, followed by the VHI and other indices. In the 20–100 cm soil layer, the VHI performed the best. The upper and lower quartiles using the VHI (r = 0.31/0.07) were the highest and the number of stations passing the 0.01 significance test using the VHI was more than that using the TCI. In the 0–100 cm soil layer, the VHI performed the best, as it did in the 20–100 cm soil layer.
For the temperate climate, in the 0–20 cm soil layer, the TCI and VHI performed better than the other indices. The number of stations passing the significance test using the TCI (87%) was more than that using the VHI (77%). However, the VHI improved the r values for most stations and concentrated the r values’ distribution passing the 0.01 significance test. It was difficult to distinguish which one performed better between the TCI and VHI. In the 20–100 cm soil layer, the TCI and VHI were still the two better indices. The upper quartile using the VHI (r = 0.35) was higher than that using the TCI (r = 0.31), while the lower quartile using the TCI (r = 0.12) was higher than that using the VHI (r = 0.11). The number of stations passing the significance test using the VHI (62%) was more than that using the TCI (53%). In the 0–100 cm soil layer, the VHI outperformed the other indices in all statistical indicators.
For the cold climate, in the 0–20 cm soil layer, the TCI performed the best, followed by the VHI and the other indices. The median r and lower quartile using the TCI (r = 0.31/0.20) were higher than those using the VHI (r = 0.27/0.17). The number of stations passing the significance test using the TCI (68%) was more than that using the VHI (55%). In the 20–100 cm soil layer, the TCI and VHI performed better than the other indices. The upper and lower quartiles using the TCI (r = 0.31/0.10) were higher than those using the VHI (r = 0.27/0.09). However, the median r using the VHI was close to the upper quartile, which meant the VHI improved the r values for most stations. In the 0-100 cm soil layer, although the lower quartile using the TCI (r = 0.14) was higher than that using the VHI (r = 0.12), the upper quartile and the median r using the VHI (r = 0.36/0.29) were higher than those using the TCI (r = 0.33/0.26), and the number of stations passing the significance test using the VHI (52%) was more than that using the TCI (48%). The VHI performed the best, followed by the TCI and other indices.
4.5.3. Spatial Distribution of Correlation Coefficient Values in Croplands
Figure 10 shows the spatial distribution of the correlation coefficient values in croplands. Many stations located in the south of the Great Plains passed the significance test using any of these five drought indices. The TCI and VHI had more stations passing the significance test than the other indices in the cold climate, especially in the 0–20 cm soil layer.
5. Discussion
5.1. VCI and NLSWI: Which Index Had a Stronger Correlation with Soil Moisture?
The drought indices based on vegetation status, VCI and NLSWI, showed fewer changes in the median r and the number of stations passing the significance test in the three different soil layers compared to the TCI. This might be due to the movement of moisture in the soil layers and the ability of roots to absorb moisture from each soil layer.
The VCI performed better than the NLSWI in most climates and vegetation cover types, except for croplands in temperate and cold climates, in this study. This result was similar to previous research based on the original indices, NDVI and LSWI (the NDWI calculation formula in their research was consistent with the LSWI calculation formula in this study). Gu [
27] found that soil moisture had a slightly higher correlation with the NDVI than the NDWI in Oklahoma, and Zhang [
28] found that the NDVI was more sensitive to soil moisture than the NDWI in the Western and Central United States. Both used the 500 m, 8-day MODIS data. This result further supplements and compares these two indices’ performances in coarse spatial resolution and temporal resolutions.
The properties of drought index, processing method, temporal resolution of remote sensing images, and processing method of in situ soil moisture, influenced the results. Research showed that compared with the NDVI, the LSWI was sensitive to rainfall and the subsequent increase in the vegetation and soil moisture content [
23], which meant the LSWI was an immediate response indicator while the NDVI was a cumulative response indicator. For the calculation formulas, the VCI and NLSWI were the normalizations of the NDVI and LSWI, which made the high and low values stretch to close to 1 and 0, respectively. The VCI and NLSWI transmitted the original indices’ properties and even enhanced these properties. For the temporal resolutions, the remote sensing image was a snapshot. The NDVI was a cumulative response of moisture, while the LSWI better represented a transient state of moisture. The larger-time-scale interval data are commonly composed of the best-quality daily reflectance data of the period. The original increased LSWI signal caused by short-time heavy rainfall might be lost if we used the larger-time-scale interval data. For soil moisture processing, the monthly averaged soil moisture represented the overall state of monthly soil moisture. It was calculated by daily soil moisture data, which might mask the increase in soil moisture caused by short-time heavy rainfall. As a result, the monthly VCI was more relevant to the monthly averaged soil moisture than the monthly NLSWI.
For cropland, the VCI and NLSWI showed opposite characteristics in temperate and cold climates. The NLSWI’s performance was better than the VCI, which might be due to irrigation. Zhang [
28] showed that the NDWI performed better than the NDVI in wetter areas where plants were not strongly controlled by moisture conditions.
Comparing the overall performance of the VCI and NLSWI in different climates, the VCI performed better in the arid climate compared with temperate and cold climates. The performance difference between the VCI and NLSWI was the largest in the arid climate. Farrar [
29] showed that the NDVI was controlled by soil moisture of the concurrent month in semi-arid Botswana, and Wang [
30] showed that the correlation between the NDVI and soil moisture was much higher in semi-arid conditions than in humid conditions. These studies suggested that the response of the NDVI to soil moisture was better when moisture was an influential factor limiting vegetation growth in arid areas because the NDVI responded to a long-term moisture status. These research conclusions and our research findings corroborate and supplement each other.
5.2. The Effects of LST on the Correlation with Soil Moisture
The TCI and the integrated index, VHI, and NVSWI performed better in the three soil layers. In most cases, either the performance of the integrated index or the performance of the TCI ranked first, or it was difficult to distinguish which one was better.
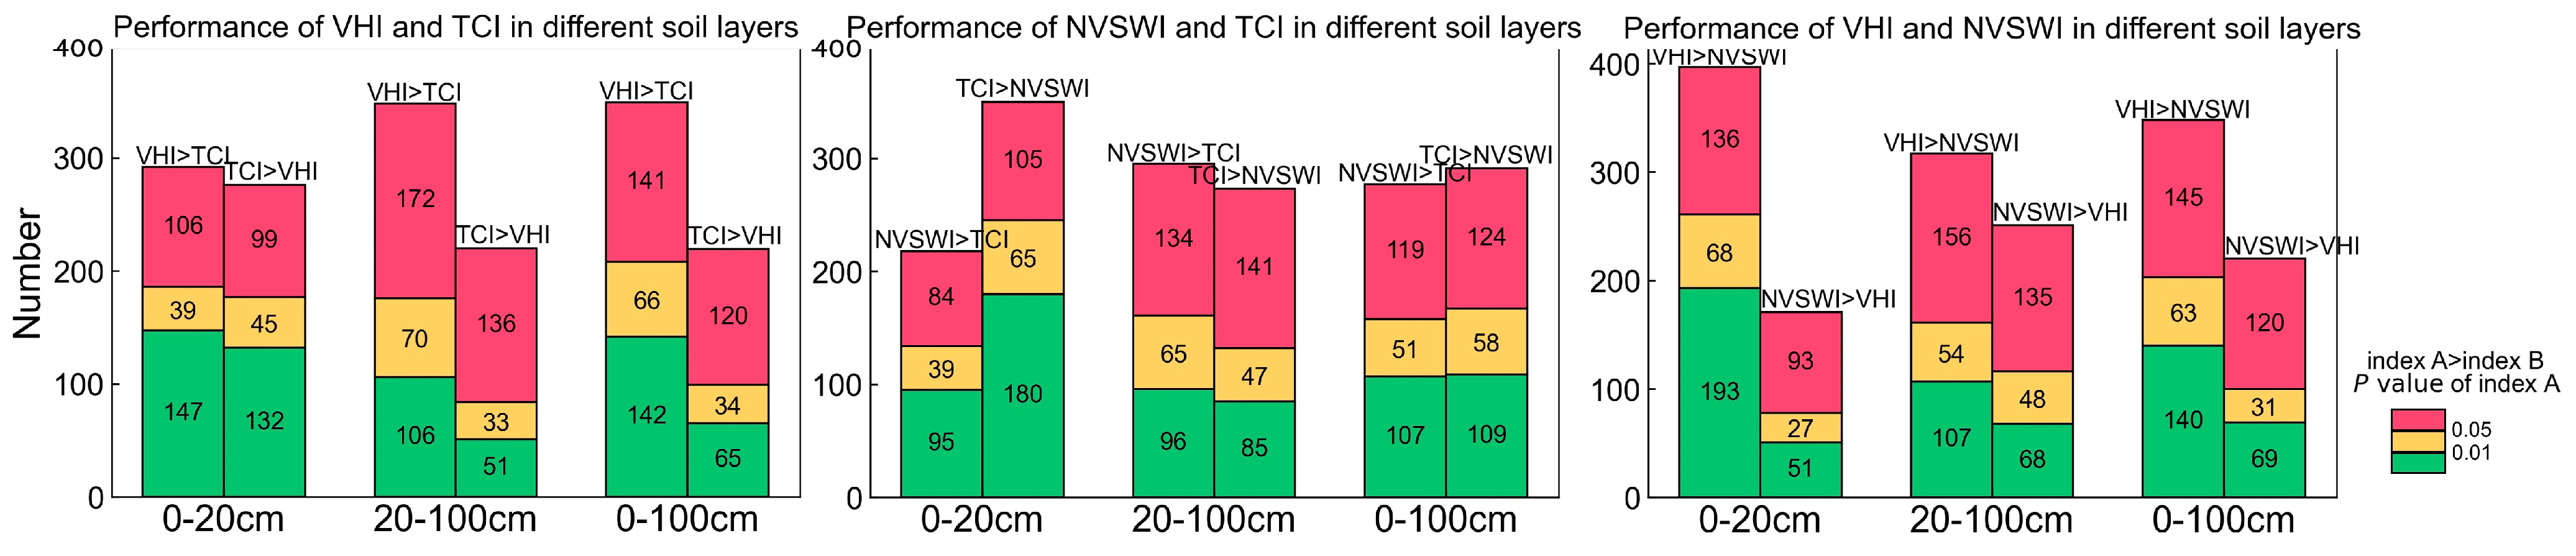
The correlation was affected by different formulas integrating temperature and vegetation status. We made a statistics chart to compare the difference in the number of stations with higher correlation values for the VHI, TCI, and NVSWI. As shown in
Figure 11, for the integrated index, the VHI performed better than the NVSWI in the three soil layers. However, the VHI and NVSWI did not perform equally compared with the TCI. For the VHI and TCI, the VHI performed significantly better than the TCI in the 20–100 cm and 0–100 cm soil layers, while only slightly better than the TCI in the 0–20 cm. For the NVSWI and TCI, the TCI performed significantly better than the NVSWI in the 0–20 cm soil layer and the NVSWI only performed slightly better than the TCI in the 20–100 cm soil layer. The TCI performed better than the NVSWI in the 0–100 cm soil layer when the surface soil layer was considered. As shown in
Table 5, we found that the NVSWI performed better than the TCI or was better than or at the same level as the VHI in savannas and shrub grasslands in arid and cold 20–100 cm soil layers. In these cases, the correlation values between the VCI and soil moisture had statistical advantages in some indicators, as shown in
Table 6. The formula of the NVSWI was division first and then normalization. Savannas and shrub grasslands in these climates were more vulnerable to environmental impacts than forests. The NDVI was prone to change with the concomitant change of the LST and soil moisture, then the VSWI values changed more obviously. Unlike the NVSWI, the formula of the VHI was a weighted sum using the NDVI and LST after normalization. The first step of normalization enabled the small variations in the NDVI or LST to be retained and weighted and summed to the VHI. Therefore, the VHI might be suitable for most of the situations. The LST mainly affected the surface soil moisture. In the 0–20 cm soil layer, the TCI could effectively reflect the changes in soil moisture. In case of insufficient data, we could use only thermal infrared data to monitor the surface soil moisture changes. Infrared data can be used as an important parameter for downscaling coarse-resolution satellite soil moisture product data.
Different climates and vegetation cover types affect the correlation. The VHI was defined as the simple average of the VCI and TCI in this study. Previous studies showed that the weight of the VCI and TCI depended on the vegetation types, vegetation states, and thermal stress to obtain the optimal ratio-integrated formula. In moisture-dependent regions, the VCI was the dominant index, which meant the weight associated with the VCI was larger than 0.5 and that associated with the TCI was lower, and in temperature-dependent regions, the TCI was the dominant index [
31,
32].
For forests, in the cold climate, the TCI performed better than the VHI in the three soil layers. In the temperate climate, the VHI performed better than the TCI in the 20–100 cm and 0–100 cm soil layers, and it was difficult to distinguish which one performed better between the VHI and TCI in the 0–20 cm soil layer. The difference might be caused by the temperature condition. In natural vegetation types, considering the vegetation of one pixel as a whole, forests with deeper roots better-approach sub-surface water resources if there is a moisture deficit compared with savannas and shrub grasslands. In the cold climate, temperature condition limitations might make the VCI unable to better reflect the soil moisture changes, possibly because the temperature might have limited forest growth and the weight of the TCI should be larger than that of the VCI. Savannas and shrub grasslands were less limited by the temperature condition than forests. The VCI changed more significantly. Therefore, the VHI performed better than the TCI in most cases.
For croplands, in the three climates, from an overall point of view, the TCI performed better in 0–20 cm soil layers and the VHI performed better in 0–100 cm soil layers. Different from natural vegetation, croplands are entirely a product of human agricultural activity. Human activities greatly influence soil moisture, e.g., irrigation and crop types also have different responses to soil moisture in different seasons [
33,
34]. In a sense, soil moisture might not be a limiting condition for crop growth if the water was sufficient. Hence, it could be concluded that the surface soil moisture generally reacted faster to temperature changes than vegetation states in cropland. It was difficult to distinguish which one performed better between the VHI and TCI in temperate and cold climates in the 20–100 cm soil layers. However, the VHI performed better than the TCI in the arid climate. When considering the whole soil layer, the VHI performed better than the TCI in the three climates. This was because the deeper water characteristics resulted from the long-term irrigation management and regional climate, which was reflected through the VCI, and the moisture limitation for croplands was stronger in the arid climate than in the others.
Different soil layer depths affect the correlation. In the 0–20 cm soil layer, comparing the overall performance and the statistics chart of the VHI and TCI, the VHI and TCI performed similarly in correlation with surface soil moisture. Comparing the VHI with TCI, the VHI was more relevant to deeper soil moisture and root-zone soil moisture. The 0–20 cm soil layer was most affected by temperature. With deeper soil depths, the performance of the TCI became less effective. We should consider monitoring the soil moisture in conjunction with vegetation information. This was further evidence that reasonably integrating vegetation information into a drought index calculation could improve the performance of the drought index in monitoring deeper soil moisture.
5.3. Deficiency of Research and Future Research Prospects
Temporal viewpoints: The vegetation indices are often used as the drought indices, and these indices are not immediate responses to soil moisture change. That is, the vegetation indices are the response to past and current soil moisture. The lag time needs further research to find the optimal integrated formula with temperature or other factors to monitor soil moisture. However, indices for the short term, e.g., eight-day and larger time scales, were not considered in this study. We used the average LST of daytime and nighttime instead of only daytime. Different methods to composite daily LST data into monthly data might have different results.
Spatial viewpoints: For aboveground research, the subpixel heterogeneity of vegetation has an influence on the correlation value. Reasonable rotation and intercropping can also improve the soil moisture retention capacity. This study was conducted at a 1000 m spatial resolution scale, a community scale. The performance of the drought indices can be further researched in conjunction with different spatial resolutions or vegetation compositions. For underground research, the soil texture and other properties vary in different regions. The storage capacity of water in the ground depends on the physics composition of it. The performance of drought indices could be further analyzed in conjunction with soil properties.
In addition, several other integrated drought indices were not included, e.g., the TVDI, since the values calculated based on regional pixels or complex input parameters are required.


 ,
, 
