Article

Improving Hydrological Simulation Accuracy through a Three-Step Bias Correction Method for Satellite Precipitation Products with Limited Gauge Data

1
College of Water Resources and Hydropower, Sichuan Agricultural University, Ya’an 625014, China
2
Institute for Disaster Management and Reconstruction, Sichuan University, Chengdu 610065, China
3
School of Emergency Management, Xihua University, Chengdu 610039, China
4
College of Resources and Environment, Chengdu University of Information Technology, Chengdu 610225, China
5
State Key Laboratory of Hydraulics and Mountain River Engineering, College of Water Resource & Hydropower, Sichuan University, No. 24 South Section 1, Yihuan Road, Chengdu 610065, China
*
Authors to whom correspondence should be addressed.
Water 2023, 15(20), 3615; https://doi.org/10.3390/w15203615
Submission received: 30 August 2023 / Revised: 9 October 2023 / Accepted: 12 October 2023 / Published: 16 October 2023

Abstract

:
Satellite precipitation products (SPPs) have advanced remarkably in recent decades. However, the bias correction of SPPs still performs unsatisfactorily in the case of a limited rain-gauge network. This study proposes a new real-time bias correction approach that includes three steps to improve the precipitation quality with limited gauges and facilitate the hydrological simulation in the Min River Basin, China. This paper employed 66 gauges as available ground observation precipitation, Asian Precipitation—Highly Resolved Observational Data Integration Towards Evaluation of Water Resources (APHRODITE) as the historical precipitation to correct Global Satellite Mapping of Precipitation NOW (GNOW) and Global Satellite Mapping of Precipitation NRT (GNRT) in 2020. A total of 1020 auto-rainfall stations were used as the benchmark to evaluate the original and corrected SPPs with six criteria. The results show that the statistic and dynamic bias correction method (SDBC) improved the SPPs significantly and the cumulative distribution function matching method (CDF) could reduce the overcorrection error from SDBC. The inverse error variance weighting method (IEVW) integrations of GNOW and GNRT did not have noticeable improvement as they use similar hardware and software processes. The corrected SPPs show better performance in hydrological simulations. It is recommended to employ different SPPs for integration. The proposed bias correction approach is significant for precipitation estimation and flood prediction in data-sparse basins worldwide.

1. Introduction

Precipitation plays a crucial role in the fields of climate, meteorology, hydrology, and agriculture [1,2,3,4]. Furthermore, it is a paramount factor, serving as a crucial input for hydrological model simulation and playing a pivotal role in hydrodynamic models and various other applications within the model [5,6,7,8]. Accurately gauging or estimating the precipitation is a fundamental step in researches such as water resource management [9], flood monitoring, and risk management [10,11]. However, ground observations are usually limited in number and eccentric in location in many places worldwide, especially in mountainous areas and developing countries [12].
Remote sensing precipitation estimation technology has made significant progress in the past few decades [13,14,15,16], and the resolution and estimation accuracy have been steadily improved, providing high-value rainfall monitoring data for watershed hydrological scientific research lacking ground data. The sensor technology of satellite precipitation generally includes visible light and infrared (VIS/IR), passive microwave (PMW), and active microwave (AMW). Satellite precipitation products (SPPs) are based on the observational results of a single remote sensor or channel and the comprehensive estimation method of integrated VIS, PWM, and AMW [17]. For example, the Global Precipitation Measurement (GPM) project is equipped with Ku/Ka-band Dual-Frequency Precipitation Radar (DPR) [18,19]. With the continuous improvement of remote sensing technology and the increasing enrichment of remote sensing data and technology, SPPs have been widely used in all aspects of hydrology and water resources research, which include the Tropical Rainfall Measuring Mission (TRMM) [20], Global Satellite Mapping of Precipitation (GSMaP) [17], the Global Precipitation Climatology Project (GPCP) [21], the Climate Prediction Center MORPHing technique (CMORPH) [22], and Feng Yun (F.Y.) [23].
Although SPPs have made impressive progress, their application in hydrology, meteorology, and other fields is still limited, using only satellite precipitation without bias correction based on ground observation data [24]. Although SPPs have the advantage of continuous spatiotemporal data, their accuracy does not meet the requirements for research and practical engineering. On the other hand, ground observation usually has the most accurate precipitation, but its spatial distribution is often too sparse and has a great disadvantage in spatial representation. The accuracy and spatiotemporal continuity of precipitation measurement can be improved by the fusion of the observation information of the gauge network and the estimated precipitation information of SPPs [25]. Many previous studies have shown that the assimilation of SPPs and gauges could complement each other and achieve good performance with sufficient ground observations [11,24,26]. Tian and Peters-Lidard [27] corrected the CMORPH and TRMM data by reducing the error by 47–63% based on rain gauges in the U.S. Stisen and Sandholt [28] improved hydrological simulation efficiency by correcting the SPPs in the Senegal River Basin in West Africa. Zhou et al. [11,24] employed statistical and dynamic bias correction to correct GSMaP and GPM series data in the Fuji River Basin, Japan. The results showed that the corrected SPPs significantly improved and benefited the efficiency of runoff simulation.
Nonetheless, correcting the bias of SPPs in regions with limited gauge data poses a significant challenge, especially when aiming for reliable precipitation data for hydrological simulations, particularly in near-real-time scenarios. This study aims to address this challenge through a three-step bias correction method incorporating the statistic and dynamic bias correction method (SDBC), the cumulative distribution function matching method (CDF), and the inverse error variance weighting method (IEVW) for SPPs. The primary objective is to enhance the accuracy of precipitation data and subsequently improve hydrological simulations in data-sparse basins. This novel bias correction approach is designed explicitly for near-real-time (NRT) SPPs with a restricted gauge network and is applied and tested in the Min River Basin (MRB), China.

2. Study Area and Data
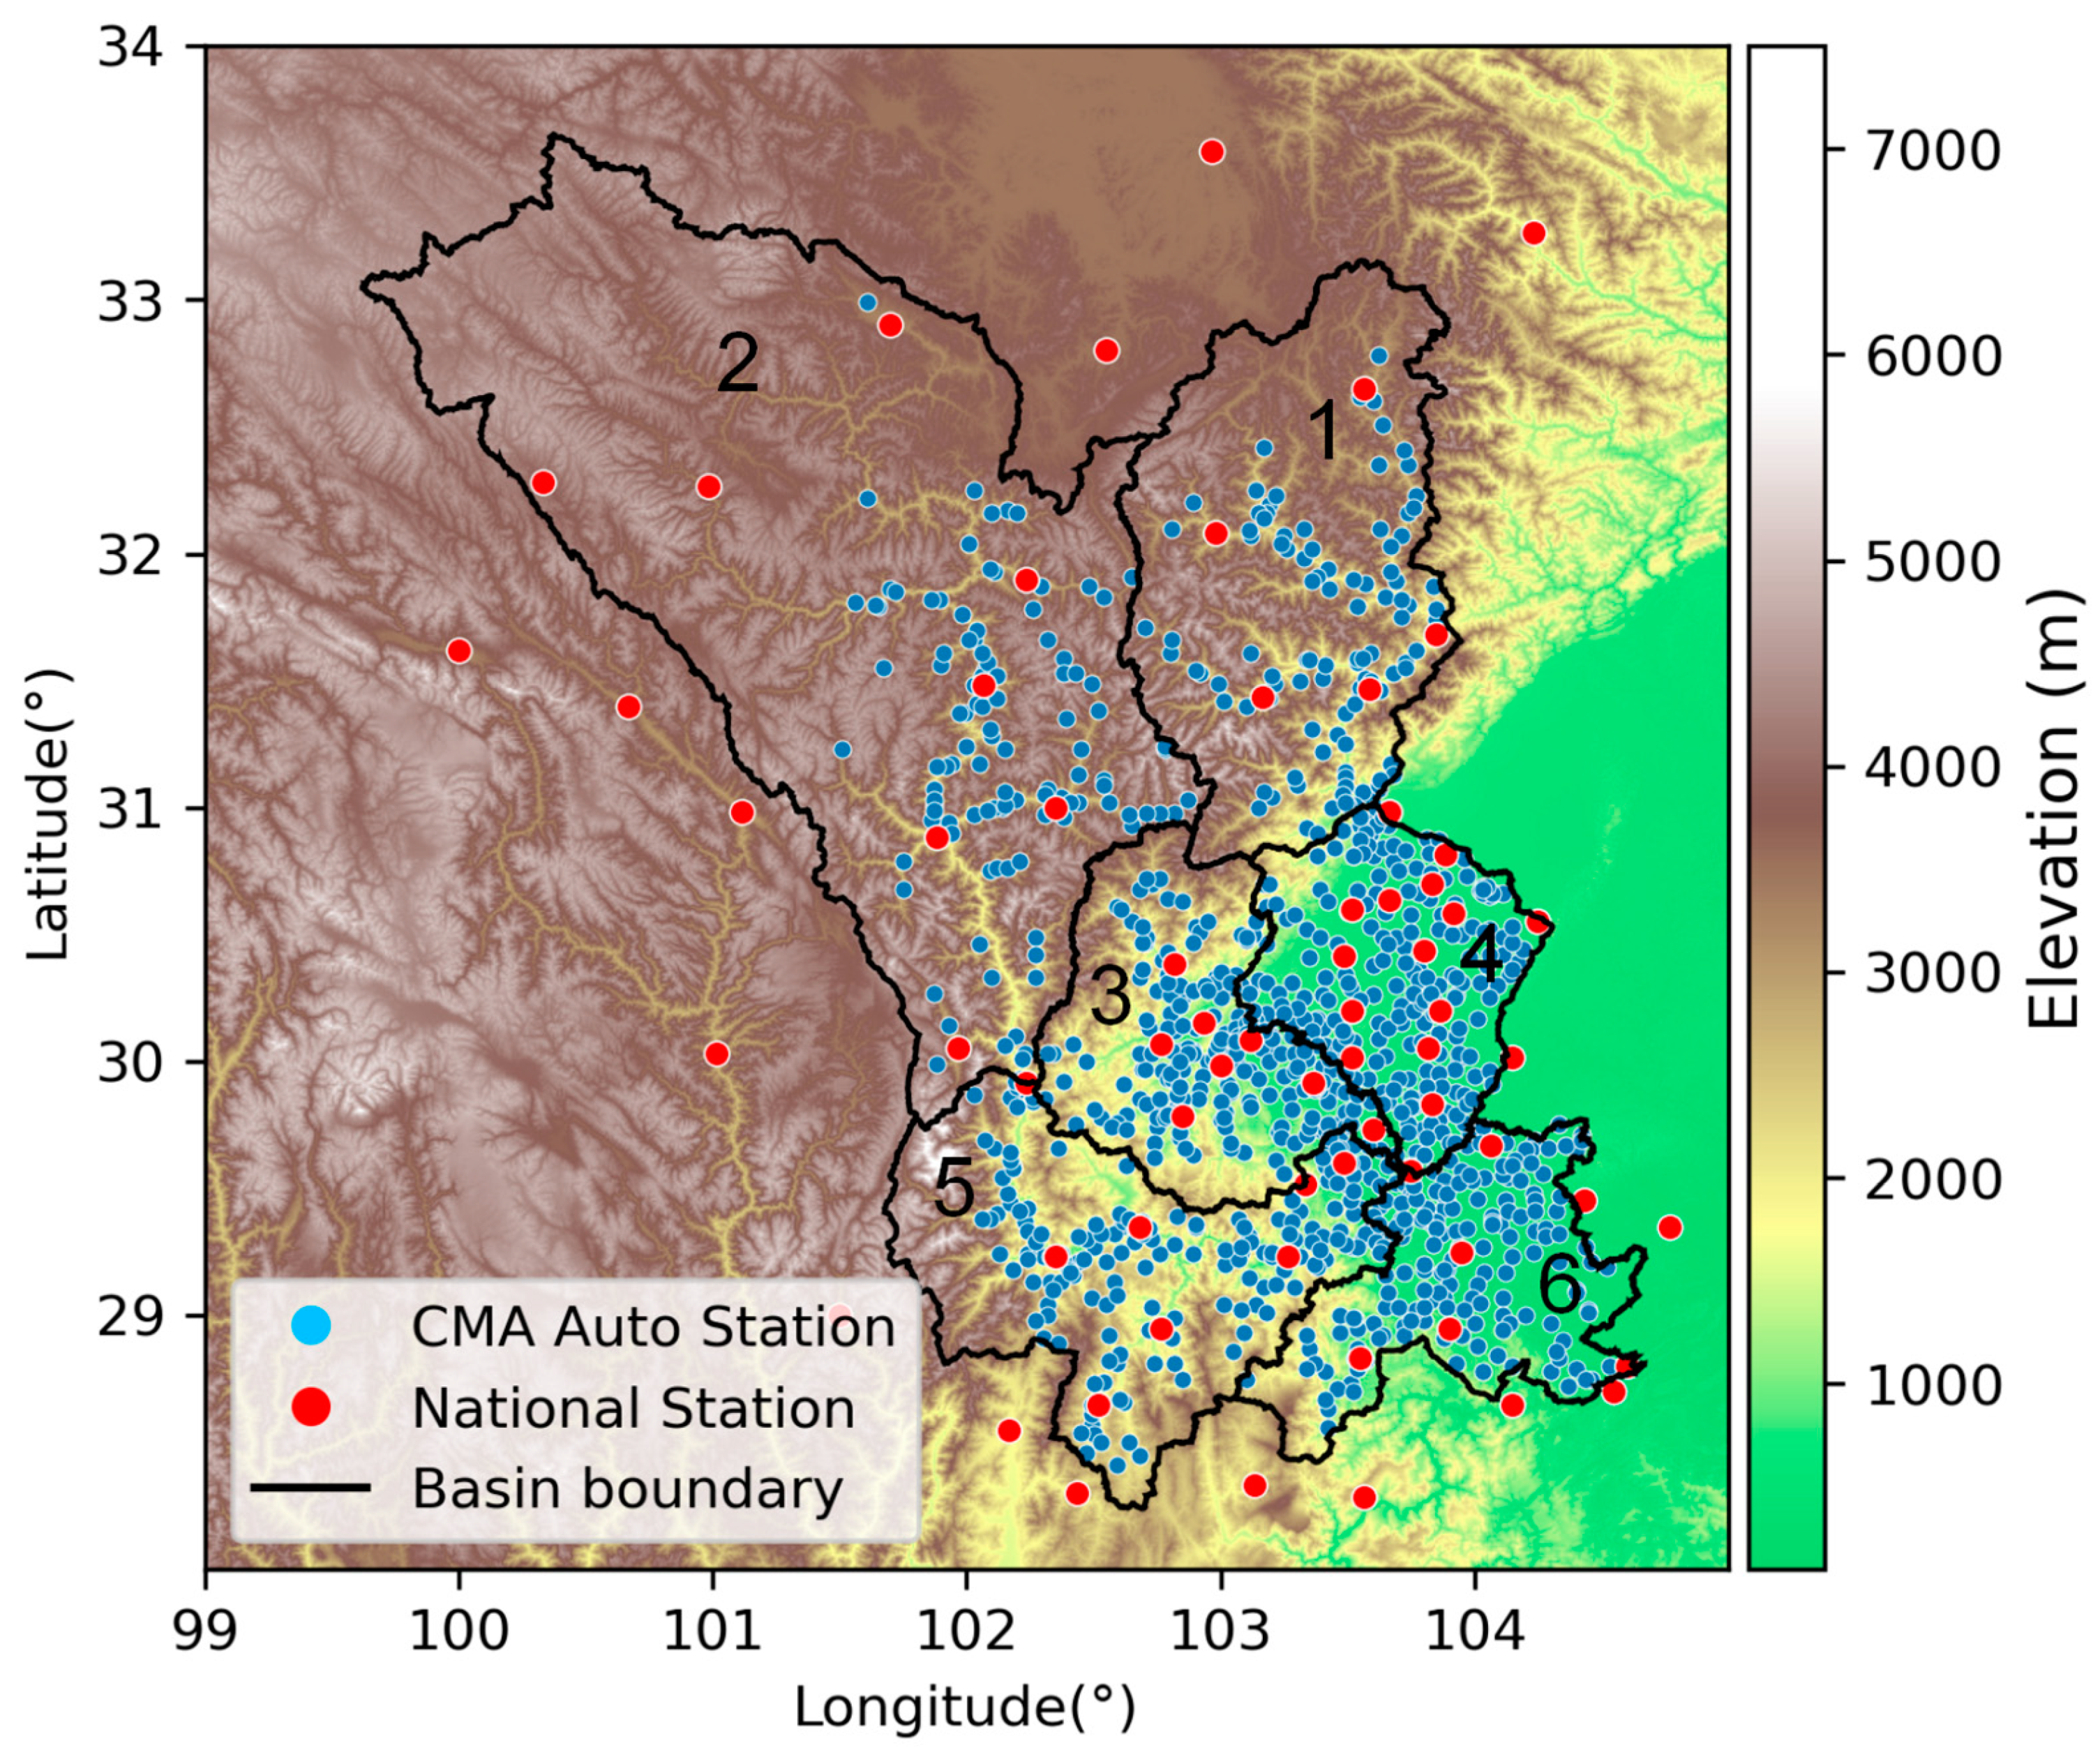
2.1. Study Area

Figure 1 shows the location, Digital Elevation Model (DEM), and ground observations of the Min River Basin (MRB) in China. The MRB is a first-class tributary of the Yangtze River’s upper reaches on the Tibet Plateau’s edge, with a total length of 711 km and a watershed area of 135,900 km2. The diversity of climate and the underlying surface of the MRB make it an ideal choice for validating the bias correction approach in this study. The MRB is located at the eastern edge of Tibet Plateau and its upper regions exhibit a diverse climate, encompassing subfrigid to temperate zones, owing to significant variations in mountain topography. A mountain plateau climate prevails in the elevated northern expanse, featuring an annual average temperature ranging from 5 to 9 °C and an annual average precipitation of 730 to 840 mm. Moving towards the middle and lower reaches, a subtropical climate with distinct seasons is prominent. Here, the annual average temperature ranges between 15 and 18 °C, accompanied by an average annual precipitation of 900 to 1300 mm. The main features of each subbasin are shown in Table 1.

2.2. Data

2.2.1. Ground Observation Precipitation

This study collected the daily precipitation of 66 national rain gauges from July 2019 to December 2020 (denoted as GAUGE) used for correcting SPPs and 1387 auto-stations from the China Meteorological Administration (denoted as CMA) in 2020 as the referee to evaluate the original and corrected SPPs. The distribution of ground observations is shown in Figure 1. Moreover, the quality control process of the CMA data is as follows: (i) Excluding 56 stations which records are zero; (ii) Excluding five stations with a missing rate greater than 1%; (iii) Conducting forward linear interpolation for the remaining stations; (iv) Since there may be a situation where the missing measurement value is written as 0 or a fault, and some stations may not work in non-flood seasons, removing the stations with cumulative annual precipitation less than 500 mm and cumulative precipitation less than 10 mm for 100 consecutive days. As a result, a total of 299 has been excluded; (v) Excluding five of the stations whose standard deviation is greater than twice the median value (1.08); (vi) Excluding two stations whose coefficient of variation is greater than twice the median (6.78). Therefore, 1020 stations remain.

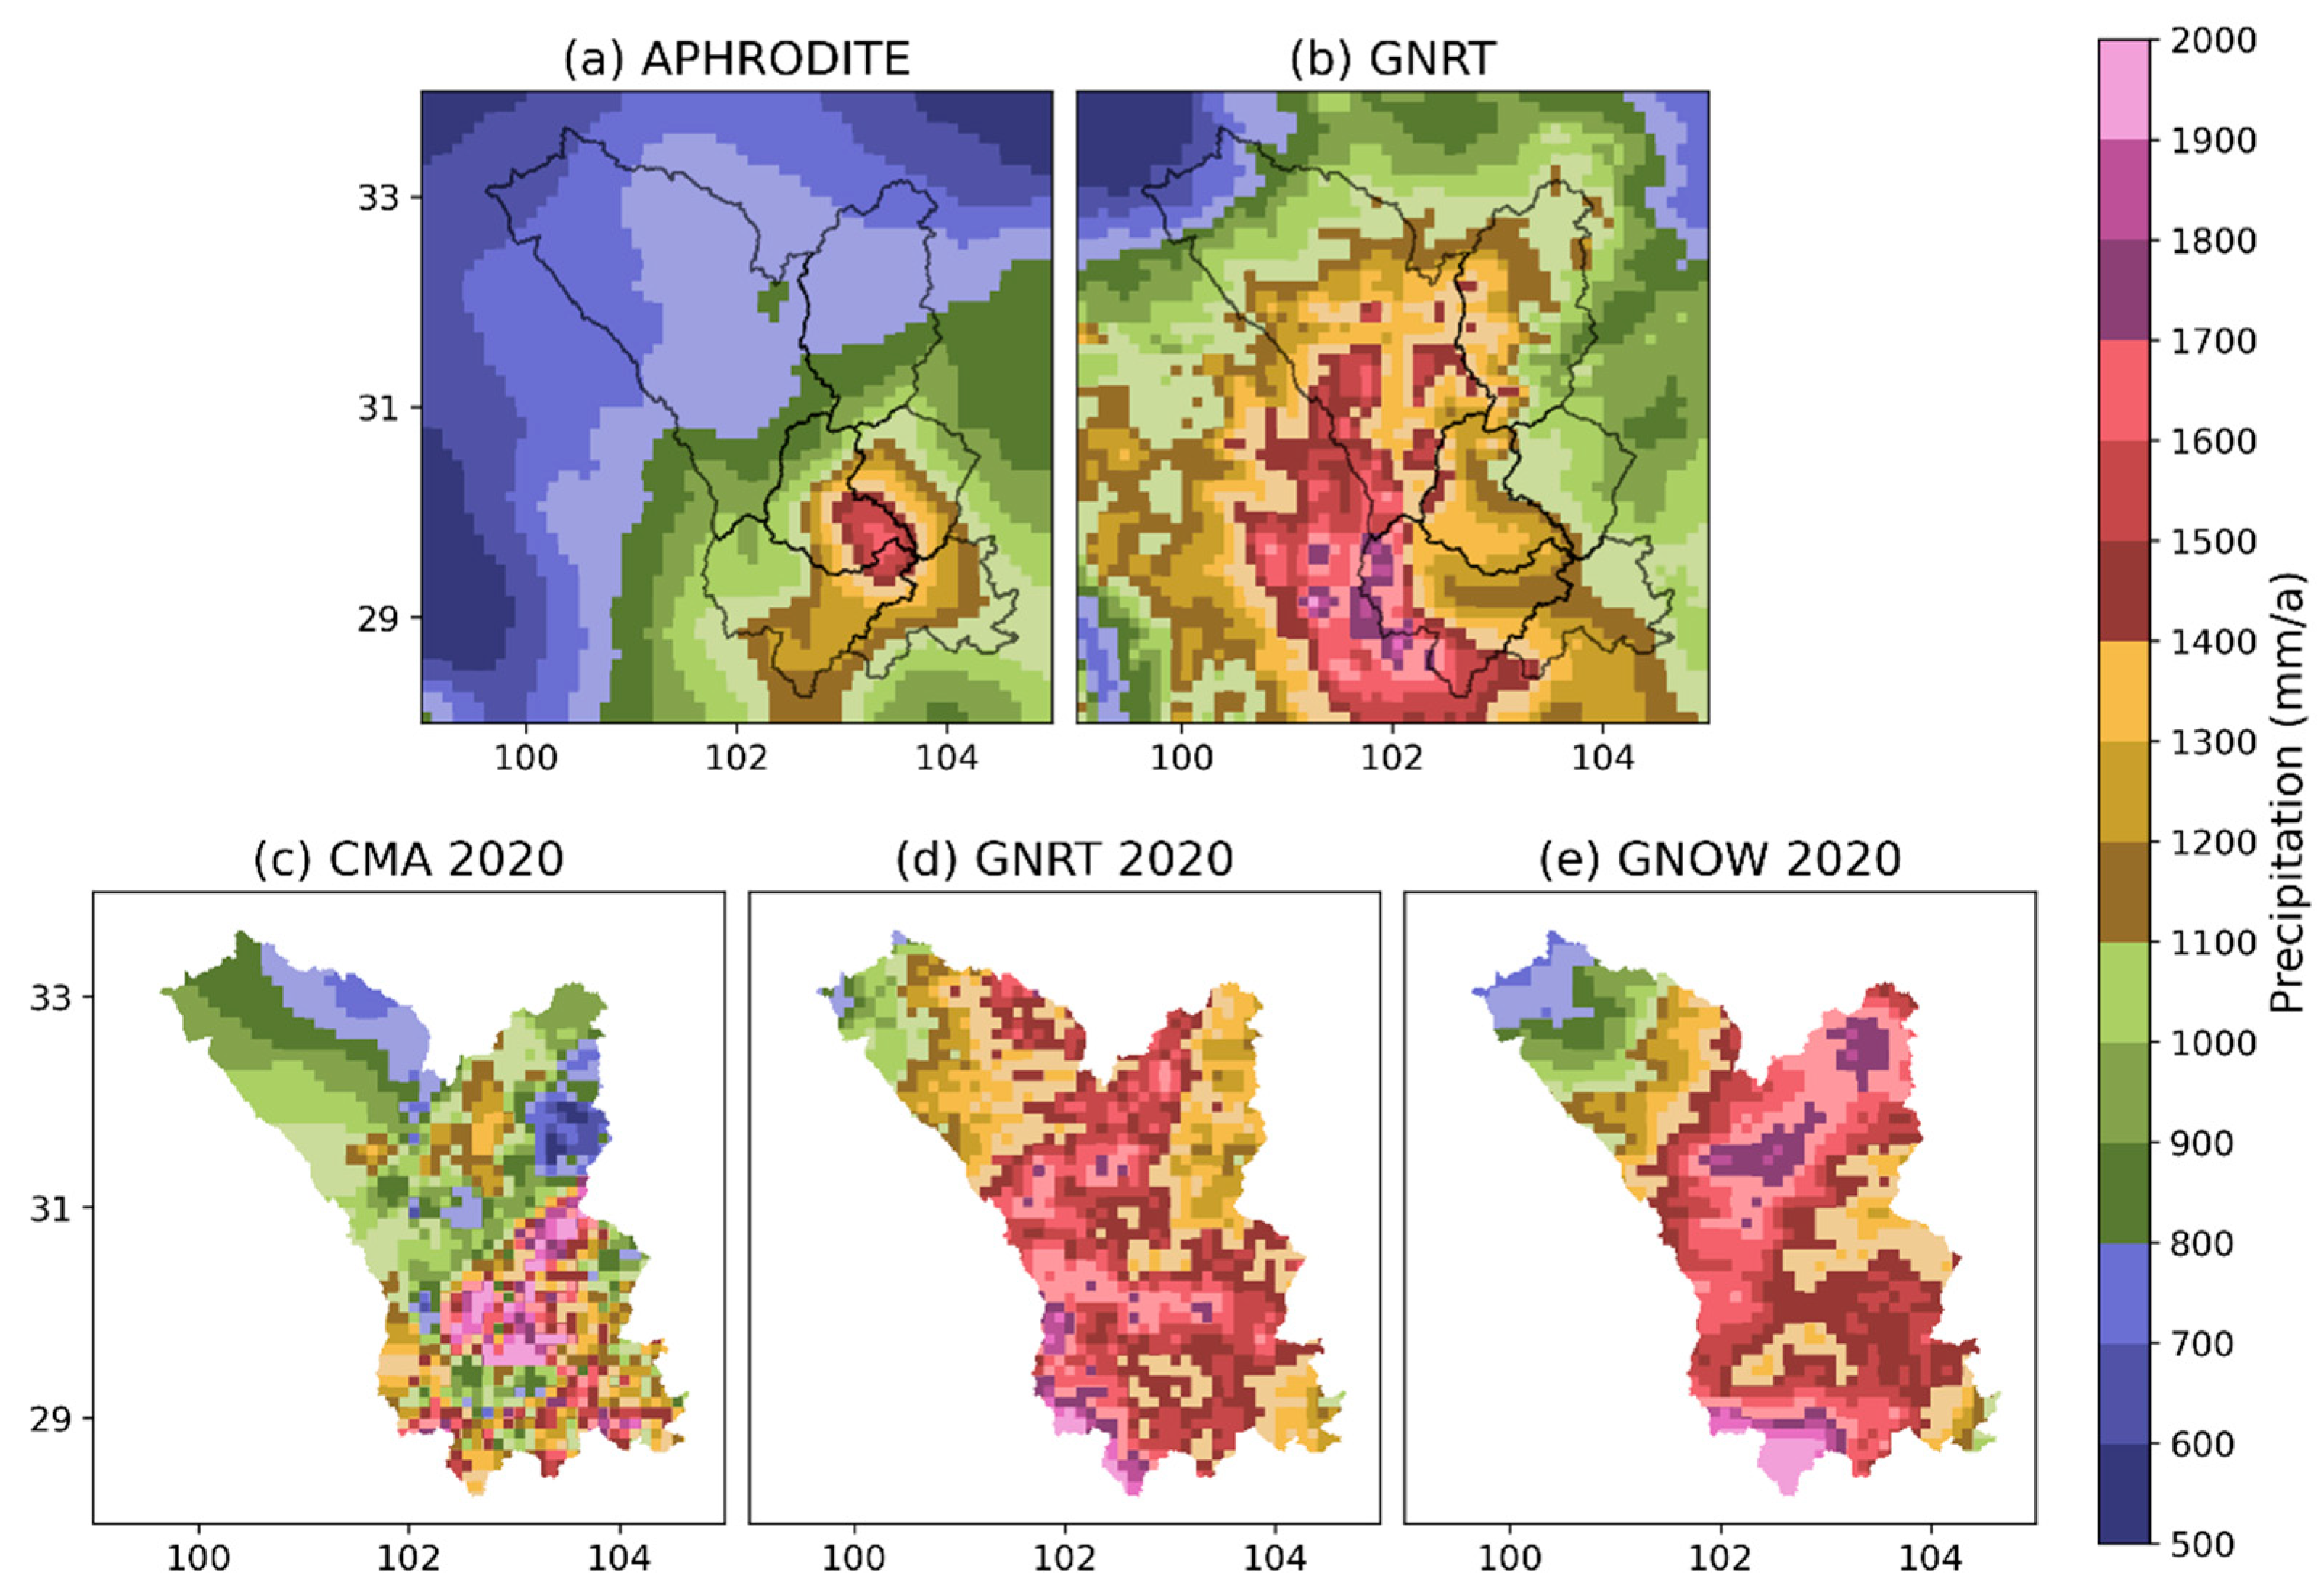
2.2.2. APHRODITE Gridded Precipitation

For grid interpolation precipitation data, Asian Precipitation—Highly Resolved Observational Data Integration Towards Evaluation of Water Resources (APHRODITE) is a daily grid precipitation dataset created by the Japan Meteorological Agency by collecting and analyzing rainfall observation data across Asia [29,30]. The APHRODITE precipitation dataset includes four sub-datasets covering the entire Asian region. This dataset is currently the only high-resolution (0.25°, approximately 25 km), long-term (from 1951), continental-scale gridded precipitation dataset. It is used as a precipitation benchmark or product and is widely used in studies on climate change, hydrological cycle, and other fields [31].
This study employed the APHRO_MA_025deg_V1901 version from 2001 to 2015, with the ground observation data provided by the China Meteorological Administration and the GTS (Global Telecommunication System) data compiled by the World Meteorological Organization [30]. We resampled the data to 0.1° and calculated the annual precipitation shown in Figure 2a.

2.2.3. Satellite Precipitation Products

GSMaP is a satellite precipitation product based on a combined microwave–infrared algorithm provided by the Japan Aerospace Exploration Agency (JAXA) Global Precipitation Observation System [17,32]. The main feature of the GSMaP algorithm is that it uses various data from TRMM/PR and GPM/DPR from spaceborne precipitation radar, including geostationary satellites and the low-Earth orbit satellite data NOAA series, GCOM-W, and MetOp-C series [33]. The temporal resolution of most GSMaP products is one hour, the spatial resolution 0.1° × 0.1° (about 10 km × 10 km), and the coverage 60° S–60° N.
This study used two sets of GSMaP near-real-time satellite precipitation data, GNOW and GNRT, of which GNOW is currently the product with the shortest latency (half an hour). We employed GNRT from 2001 to 2015 to calculate annual average precipitation consistent with APHRODITE and the 2020 daily precipitation consistent with the ground observed precipitation. As GNOW was released in July 2019, the data from July 2019 to December 2020 was used for the bias correction.

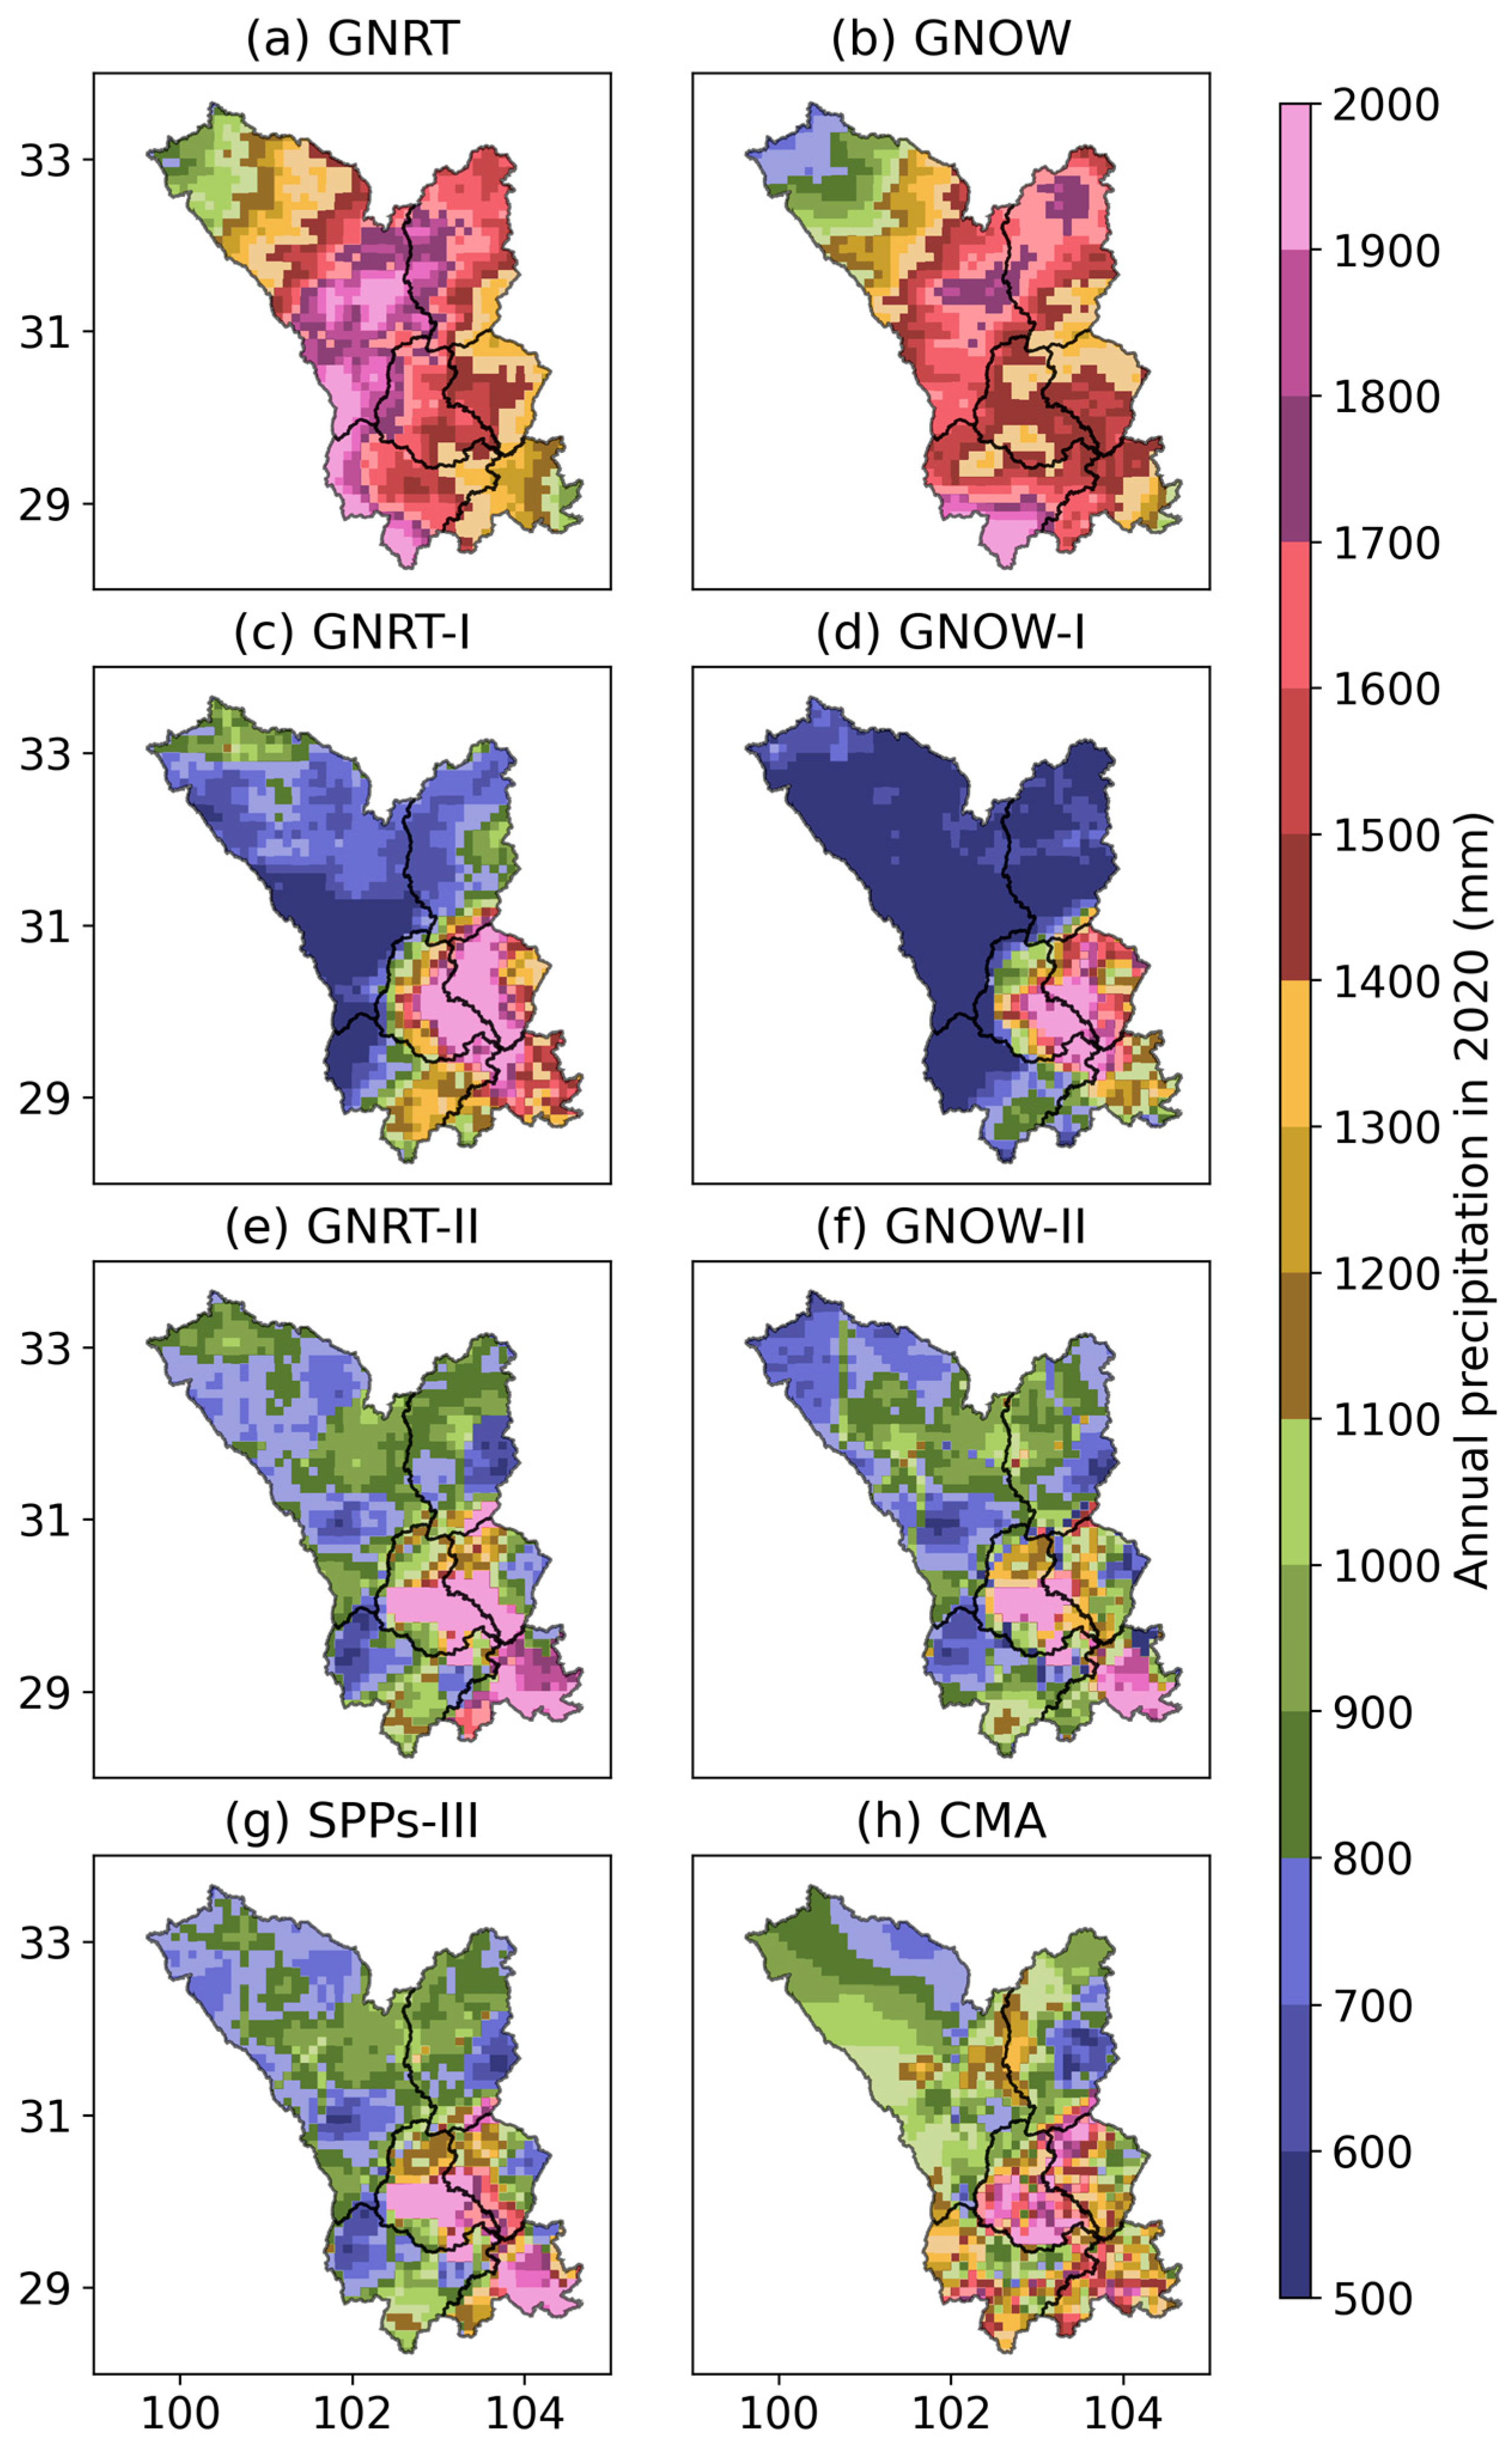
2.2.4. Annual (Average) Precipitation Distribution

Figure 2 shows the rainfall distribution of several datasets. In the view of annual average precipitation, GNRT overestimated the actual precipitation and the precipitation center shifted to the west. In particular, the storm center shifted westward, leading to an overestimation and expansion of precipitation. Consequently, a substantial disparity exists between the SPPs and the observed precipitation. GNOW and GNRT notably overestimated precipitation across various regions in the MRB, particularly in the northern and southwestern areas. Additionally, the range of SPPs precipitation exceeds that of the actual precipitation. Considering the overall precipitation patterns in 2020, it is evident that GNRT and GNOW exhibit a spatial bias that requires correction.

3. Methodology

Figure 3 shows the three-step near-real-time bias correction approach of this study. APHRODITE is used as historical precipitation data and 66 national stations (GAUGE) are used as available in-situ data to provide the information for bias correction of GNRT and GNOW in 2020. Besides, 1020 automatic rainfall stations from the CMA are used as benchmark data to comprehensively evaluate the original and corrected SPPs and verify the method’s reliability and applicability. Furthermore, the hydrological simulation is conducted with all precipitation datasets.
This study adopted the blockwise use of the TOPMODEL (BTOP) model, which has been applied to basins worldwide [34], for the hydrological simulation. It requires a relatively small number of calibrated parameters, all of which hold specific physical meanings and can account for influences such as soil type, topographic index, and soil moisture [35,36]. These characteristics indicate that the BTOP model can effectively leverage spatial distribution information from remote sensing data, topography, land use, etc., without excessive reliance on various ground observation data. Overall, these advantages enable the BTOP model to partially mitigate the impacts of uncertainties in the simulation process and the challenges of equifinality to some extent. For detailed information about the BTOP model, refer to Takeuchi et al. (2008) [37].

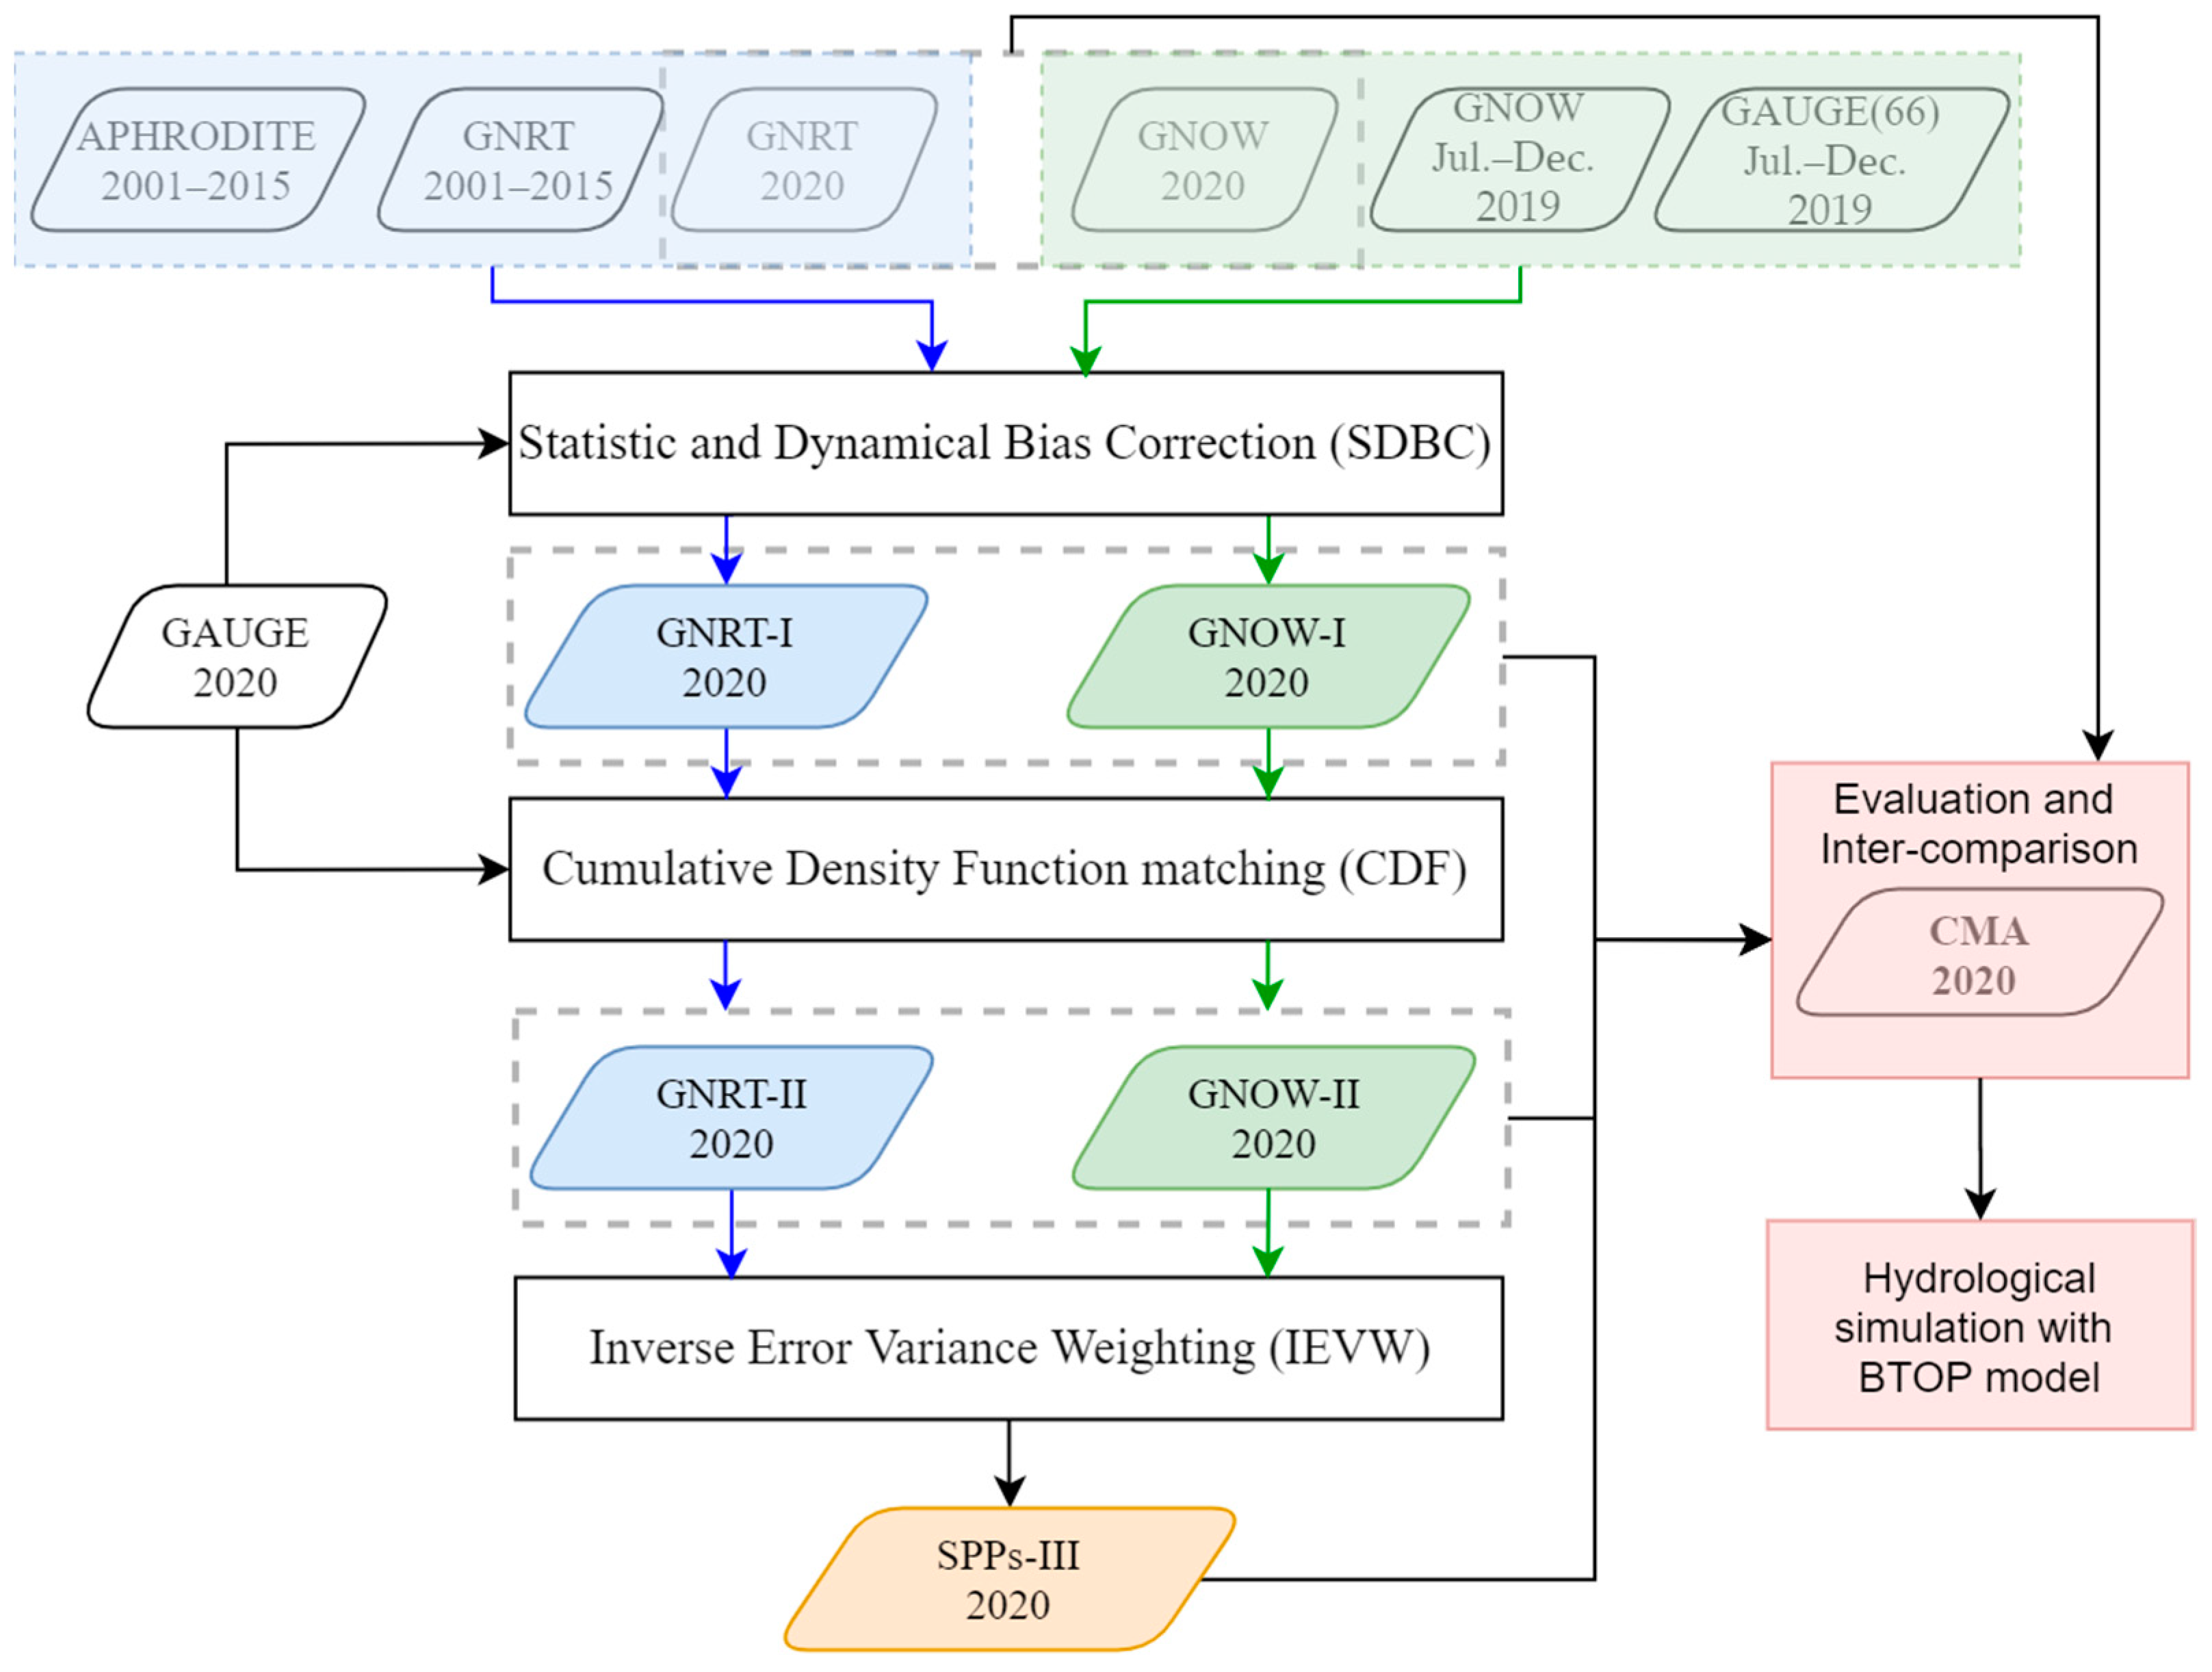
3.1. Statistic and Dynamic Bias Correction Method (SDBC)

The statistic and dynamic bias correction method (SDBC) was proposed by Zhou et al. (2022) [24]. This method can utilize historical data and near-real-time data to perform a steady correction in the case of insufficient ground observations. The process is as follows:
(1)
Statistical bias factor calculation
The statistical bias factor at grid j, F j S B C , is obtained from the slope of the regression line for 10-day cumulative precipitation. Due to the limited data range of GNOW, the factor for GNOW is calculated from July to December 2019, while the GNRT factor is calculated from the data range of 2001–2015.
(2)
Dynamic bias factor calculation
If the gauge and SPPs can be obtained in near real time, the dynamic temporary ratio-based bias correction method can obtain better results than the statistical bias correction method [38]. We adopt the dynamic correction of the ten-day cumulative forward-moving window, and the first ten values are obtained by adding the precipitation of the initial ten days, shown in Equation (1):
F D B C ( i , t ) = t = d 10 t = d G A U G E ( i , t ) t = d 10 t = d P S ( i , t )
where G A U G E i , t and P S ( i , t ) represent the gauge precipitation and SPPs at station i, time t.
(3)
Statistic and Dynamic bias factor calculation
In the previous study [24], the SDBC factor was modified by multiplying the modification factor obtained from the average statistical bias factor. In this study, we calculate the modification factor in each Thissen polygon k of GAUGE, and then get the corrected SPPs at grid j. The equations are as follows:
m ( k , i ) = F j S B C k , j / F S B C ( k , i )
F S D B C k , j , t = F D B C k , j , t m ( k , j )
P S D B C k , j , t = F S D B C k , j , t P S j , t

3.2. Cumulative Distribution Function Matching Method (CDF)

After the first step of SDBC, there will still be local overestimating or underestimating precipitation. Therefore, it is necessary to use the cumulative distribution function matching method (CDF) to further correct the precipitation in the second step. The CDF has been successfully applied to the correction of various SPPs [21,25,39]. Its concept is that the satellite precipitation data should have a consistent cumulative distribution function with the ground observed data [40]. Firstly, calculate the corrected SPPs ( P i c o r ) at station i, shown in Equation (5); secondly, calculate the difference between GAUGE and SPPs, and then interpolate them to SPPs grid j to get D i f j ; thirdly, as shown in Equation (7), the corrected SPPs, P j C D F , is obtained.
P i c o r = F i 1 g F i S P i S
D i f i = P i c o r P i S
P j C D F = P j S + D i f j

3.3. Inverse Error Variance Weighting Method (IEVW)

According to the results of previous studies [41,42], this study conducted the integration of corrected GNOW and GNRT in the third step to verify the advantages of fused satellite precipitation. Mastrantonas et al. (2019) [25] verified a variety of fusion methods, among which Inverse Error Variance Weighting (IEVW) [42,43] performed the best. This paper uses this method to integrate the corrected GNRT and GNOW after two correction steps. The equations are shown below:
S P P s j = k = 1 n W k , j × P k , j
W k , j = 1 v a r k , j 2 / 1 k = 1 n v a r k , j 2
where j is the SPPs grid, S P P s j is the integrated SPPs, P k , j is the kth SPPs, and the weight is W k , j .

3.4. Evaluation Criteria

We employ three classifications and three quantitative evaluation indexes to comprehensively evaluate the original and corrected SPPs at each correction step. Their calculation formulas, Equations (10)–(15), are shown in Table 2.
The classification evaluation indicators include Probability of Detection (POD), False Alarm Ratio (FAR), and Critical Success Index (CSI), which can reflect the accuracy of satellite precipitation product prediction of precipitation events. In this paper, the threshold is set as 0.1 mm/d according to several previous studies [44,45,46]. The Nash-Sutcliffe Efficiency (NSE), Bias, and Mean Absolute Error (MAE) are employed as quantitative evaluation indexes.

4. Results and Discussion

4.1. General Evaluation Results

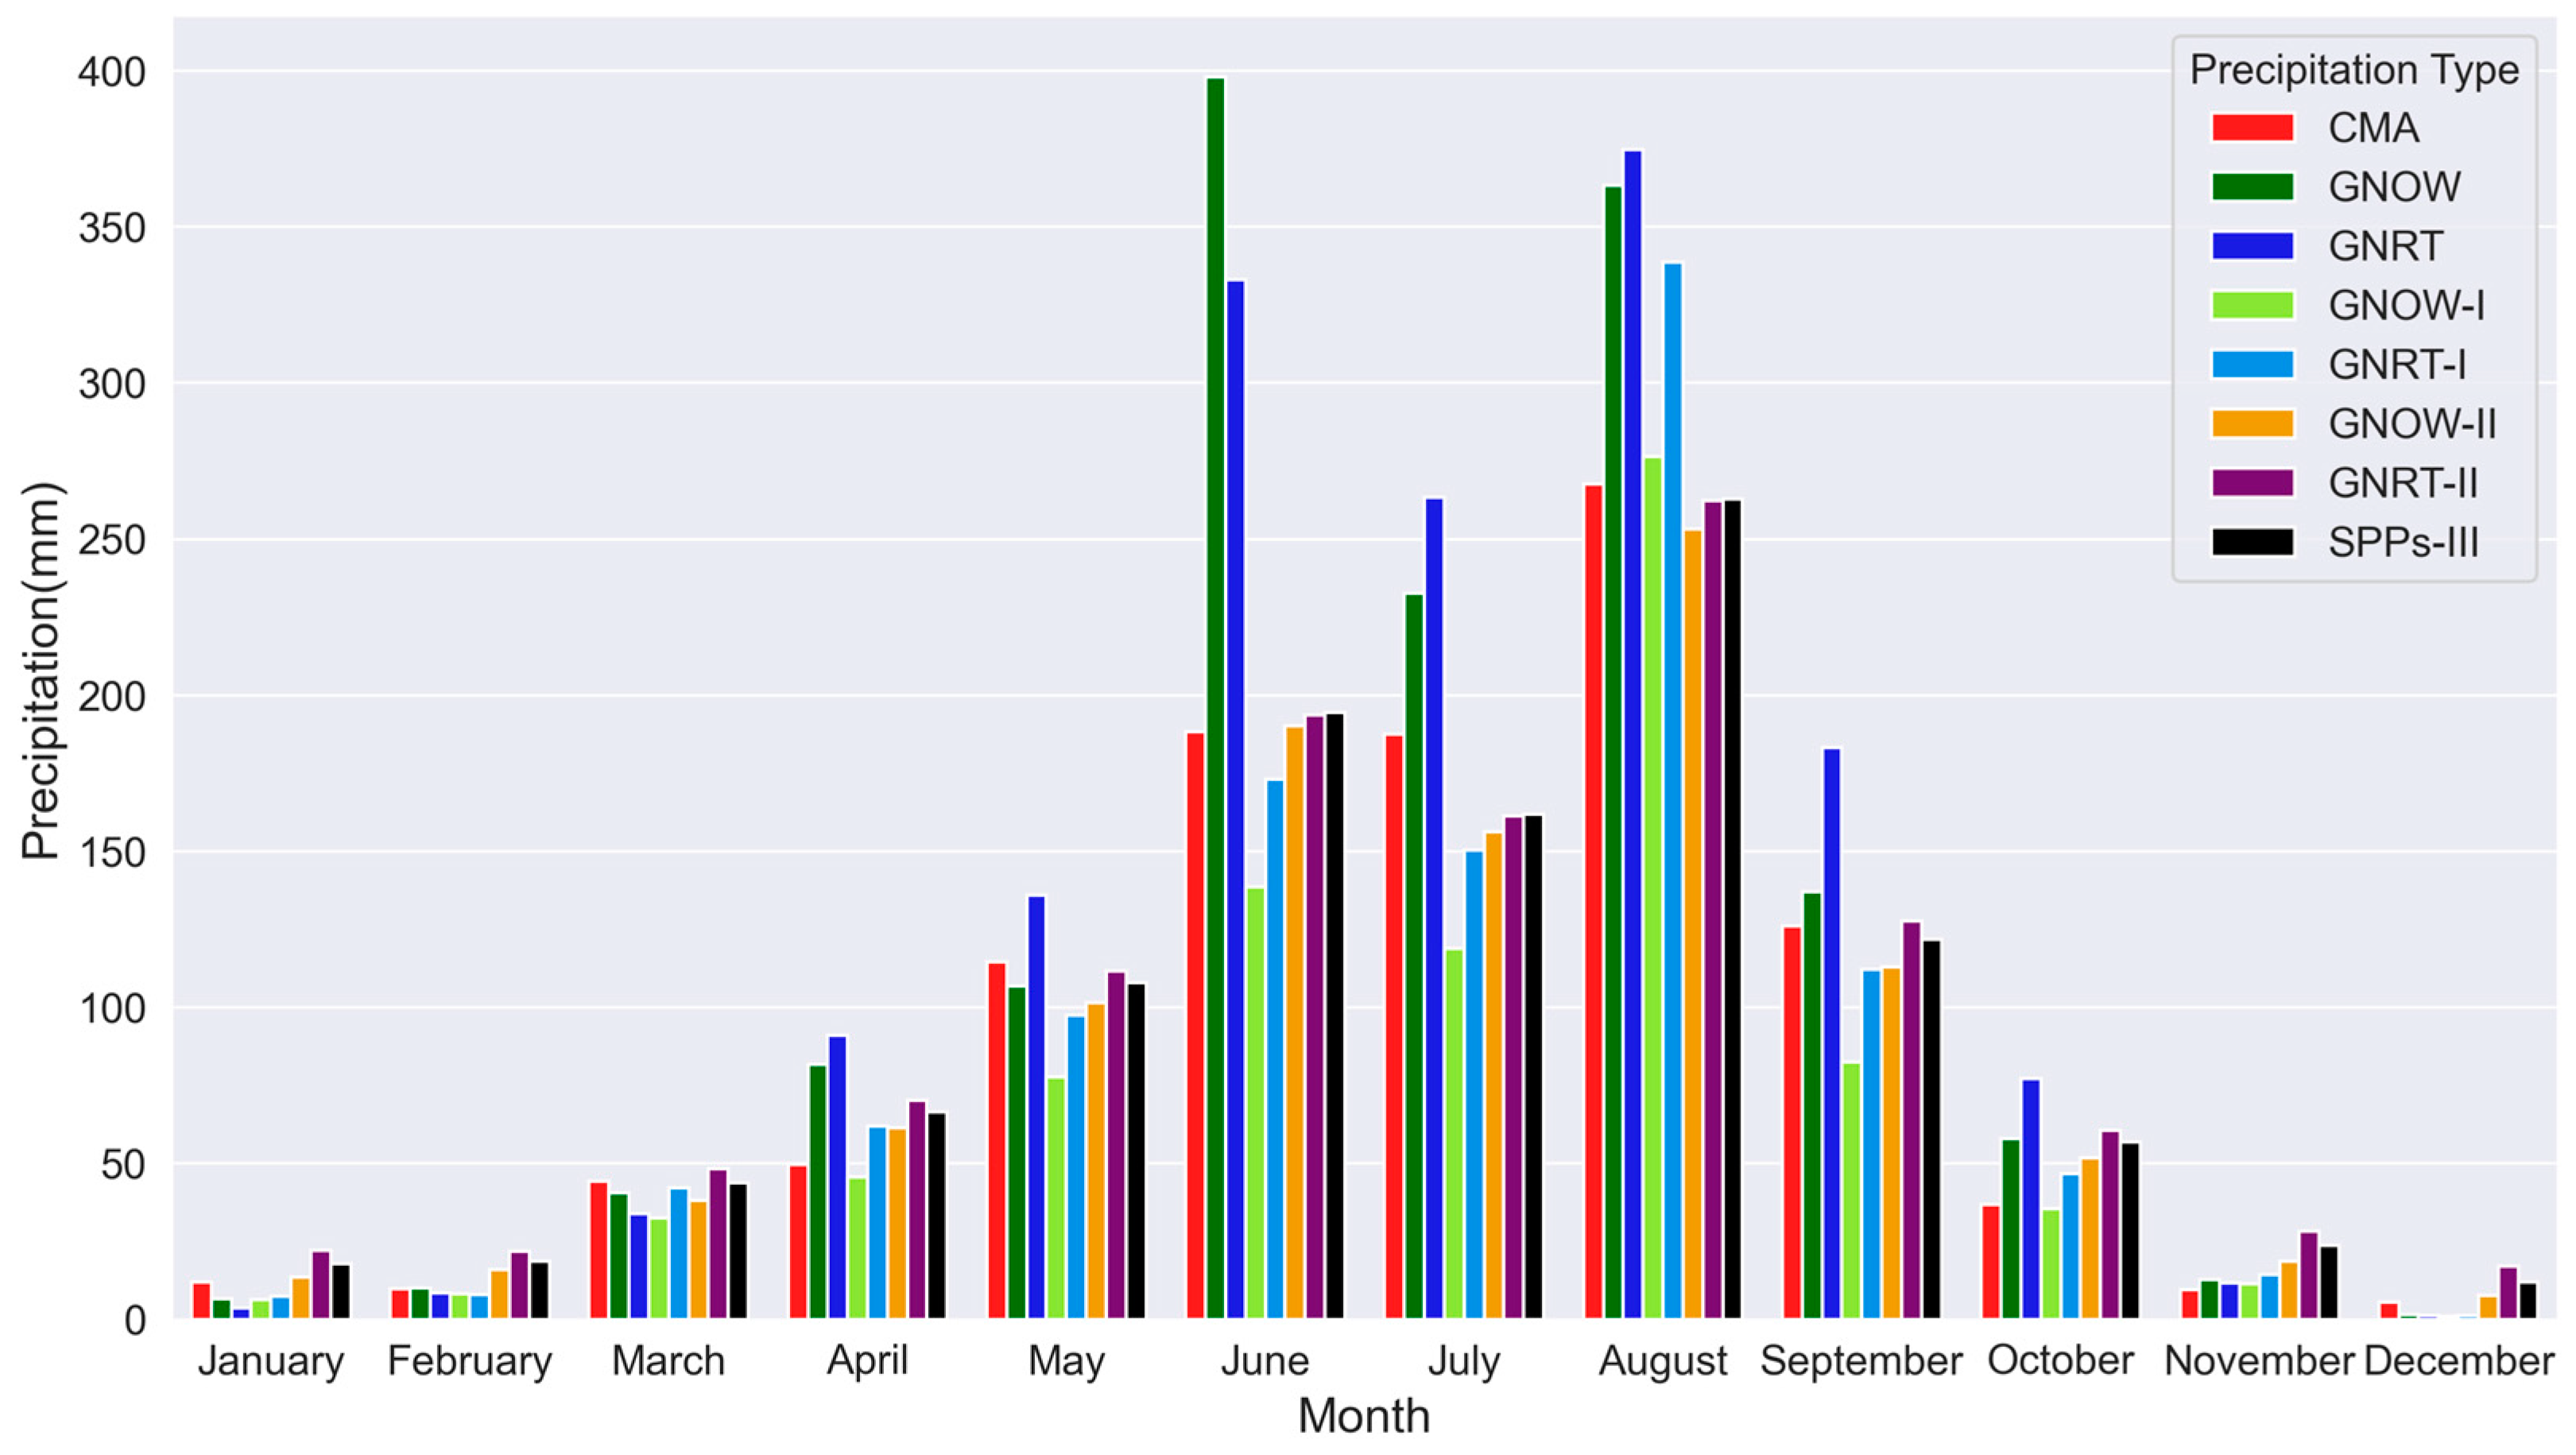
4.1.1. Evaluation of Precipitation Amount

Figure 4 shows the monthly cumulative precipitation of the eight precipitation products in 2020. The original satellite precipitation usually underestimates the total amount of precipitation in the dry season (November to March) and overestimates the actual precipitation in the rainy season (April to October). GNOW and GNRT significantly overestimated the actual precipitation, especially in June–August; the GNOW precipitation reached nearly 400 mm in June, which was twice the amount of the observed precipitation. This is consistent with related studies’ findings that SPPs often overestimate heavy precipitation and underestimate microprecipitation [11,47]. On the other hand, the corrected satellite precipitation has been greatly improved. However, the first step is generally over-corrected. For example, the GNOW-I from May to September is obviously less than the measured precipitation. Among them, the GNOW in June is 395 mm whereas the CMA is 190 mm. GNOW-I overcorrected the SPPs to 138 mm. However, after the second step of the CDF correction, the overcorrection is improved, and the total precipitation is almost the same as the CMA. In terms of the total amount, the IEVW integration is also consistent with the CMA.
Moreover, Figure 5 shows the cumulative curves of the average precipitation in the Min River Basin for eight precipitation products. Similar to the monthly precipitation comparison chart, it can be seen that the original SPPs are significantly overestimated in annual precipitation, and the performance of bias correction is quite good, except that GNOW-I is overcorrected (the total amount of precipitation decreased from 1396 mm to 706 mm). Furthermore, the figure illustrates a consistent overestimation of precipitation in the original satellite data throughout the flood season, leading to an annual precipitation value significantly higher than that reported by the CMA.
It is worth noting that GNRT-I obtains a relatively excellent correction effect using the statistic and dynamic bias correction method. On the contrary, GNOW-I obtains large biases when using the SDBC method. The main reason is that the static correction factors obtained by the statistical bias correction method are quite different. The factor used in this calculation is derived from GNOW data, which spans only a six-month period. Consequently, this limited timeframe exerts a significant influence on the final results. Therefore, when applying this correction method, it is recommended to use precipitation distribution information obtained from longer historical data. Figure 6 can better illustrate this problem through the distribution of the statistical bias correction factor of GNRT and GNOW. Due to the low correction factor of GNOW (most values are in the range of 0.2–0.6), GNOW-I is overcorrected and underestimates the actual precipitation. The correction factor of GNRT is obtained from the multi-annual average precipitation distribution from 2001 to 2015. Thus, its rationality, representativeness, and reliability are much better than that of GNOW.

4.1.2. Evaluation of Precipitation Distribution

Figure 7 shows the spatial distribution map of the 2020 precipitation for eight types of precipitation data. Taking the CMA data as the benchmark precipitation, both GNRT and GNOW overestimate the actual precipitation in the entire basin, especially in the upper Min River (subbasin 1) and the entire Dadu River basin (subbasin 2 and 5). The improvement effect of GNRT-I and GNOW-I is significant, and the distribution of precipitation in the basin is basically consistent with CMA. Nevertheless, there are still differences in specific values. For example, GNOW-I has over-corrected the previously overestimated area (upstream of the watershed), resulting in lower precipitation than the observed precipitation. Following the correction using the CDF, GNRT-II and GNOW-II exhibited notable enhancements in both the quantity and spatial distribution of precipitation. This led to a more effective alignment with the precipitation patterns observed by the CMA. The SPPs-III is not much different from GNRT-II and GNOW-II in terms of precipitation distribution and needs to be further analyzed in combination with evaluation indicators. Overall, the SPPs corrected in each step are significantly improved in comparison with the original GNRT and GNOW.

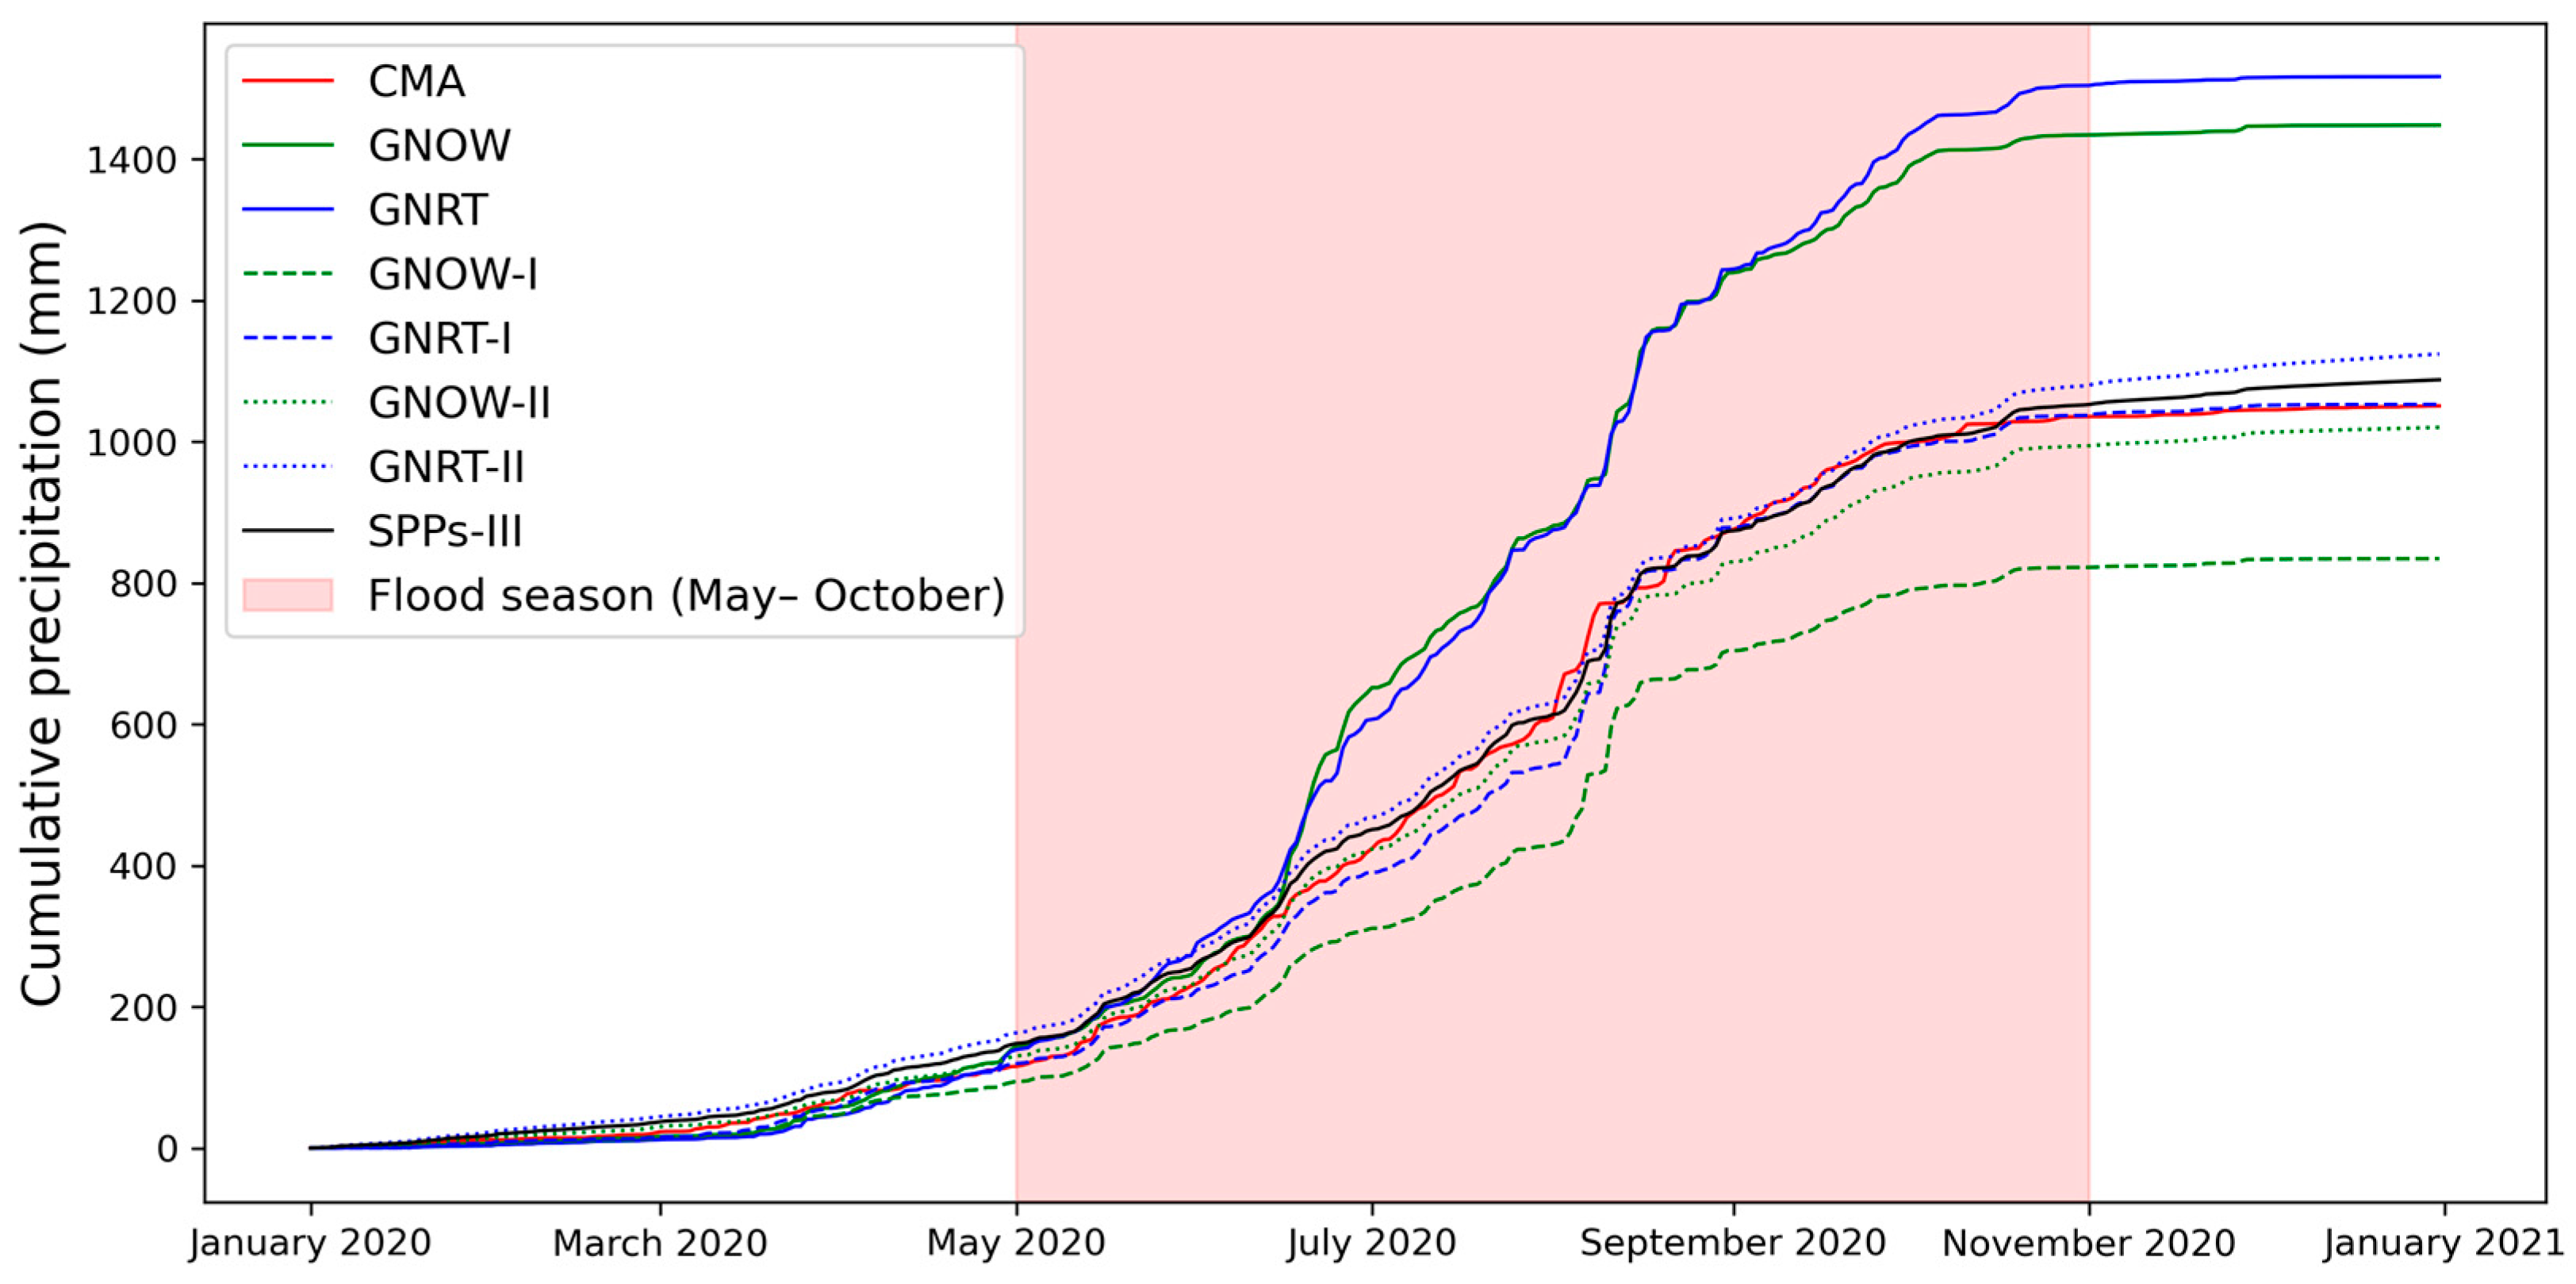
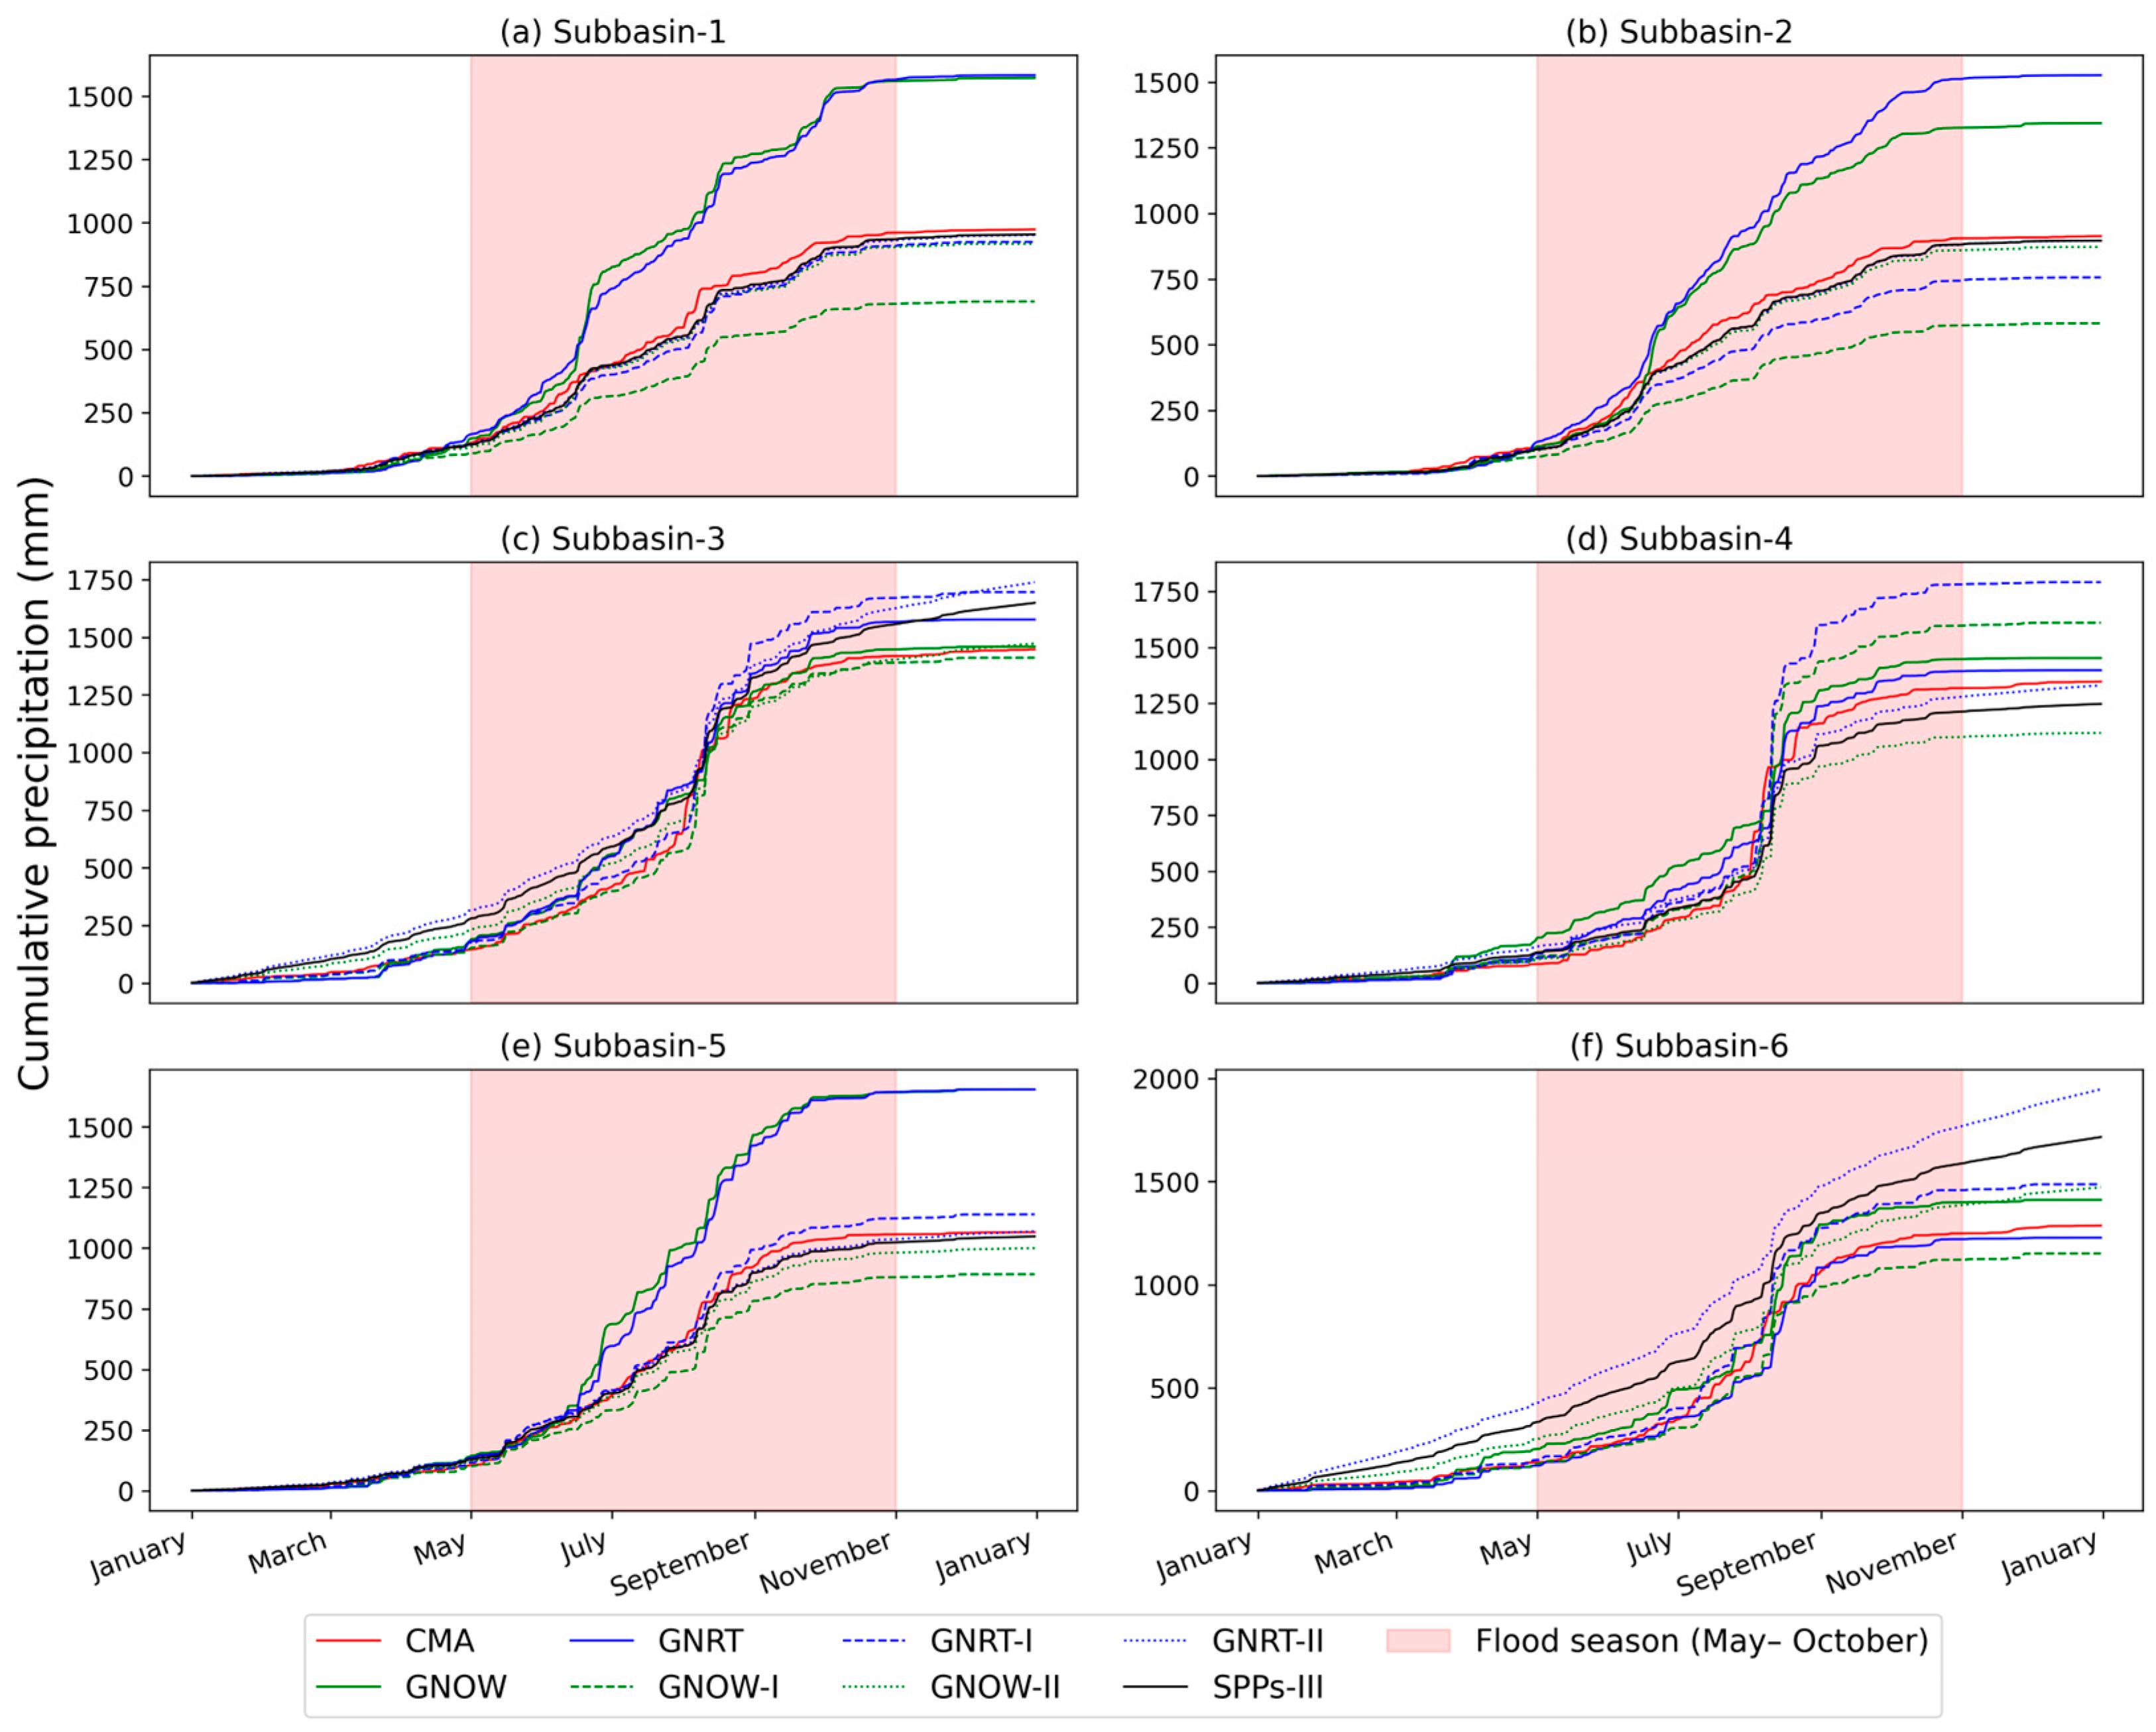
4.1.3. Cumulative Precipitation Evaluation at Subbasin Scale

The cumulative precipitation of various precipitation products in the subbasins is shown in Figure 8. It can be seen that the performances of GNOW and GNRT are generally consistent, but in the upper reaches of the Dadu River (subbasin 2), the degree of GNRT’s overestimation of the measured precipitation is greater than that of GNOW. In the upper reaches of the Min River (subbasin 1) and the Dadu River Basin (subbasins 2 and 5), the satellite precipitation overestimated the measured precipitation by more than two times. This deviation was rarely seen in previous research and investigations [16,48,49], indicating that the extreme precipitation events in 2020 had a greater impact, leading to the overall overestimation of SPPs. The deviation of satellite precipitation is much smaller in the middle and lower reaches of the Min River (subbasins 4 and 6) and the Qingyi River Basin (subbasin 3).
In general, the corrected SPPs exhibit a cumulative trend that aligns consistently with the CMA data. After the CDF correction and IEVW integration, the average areal precipitation at the (sub) basin scale can achieve results that fit the actual precipitation.

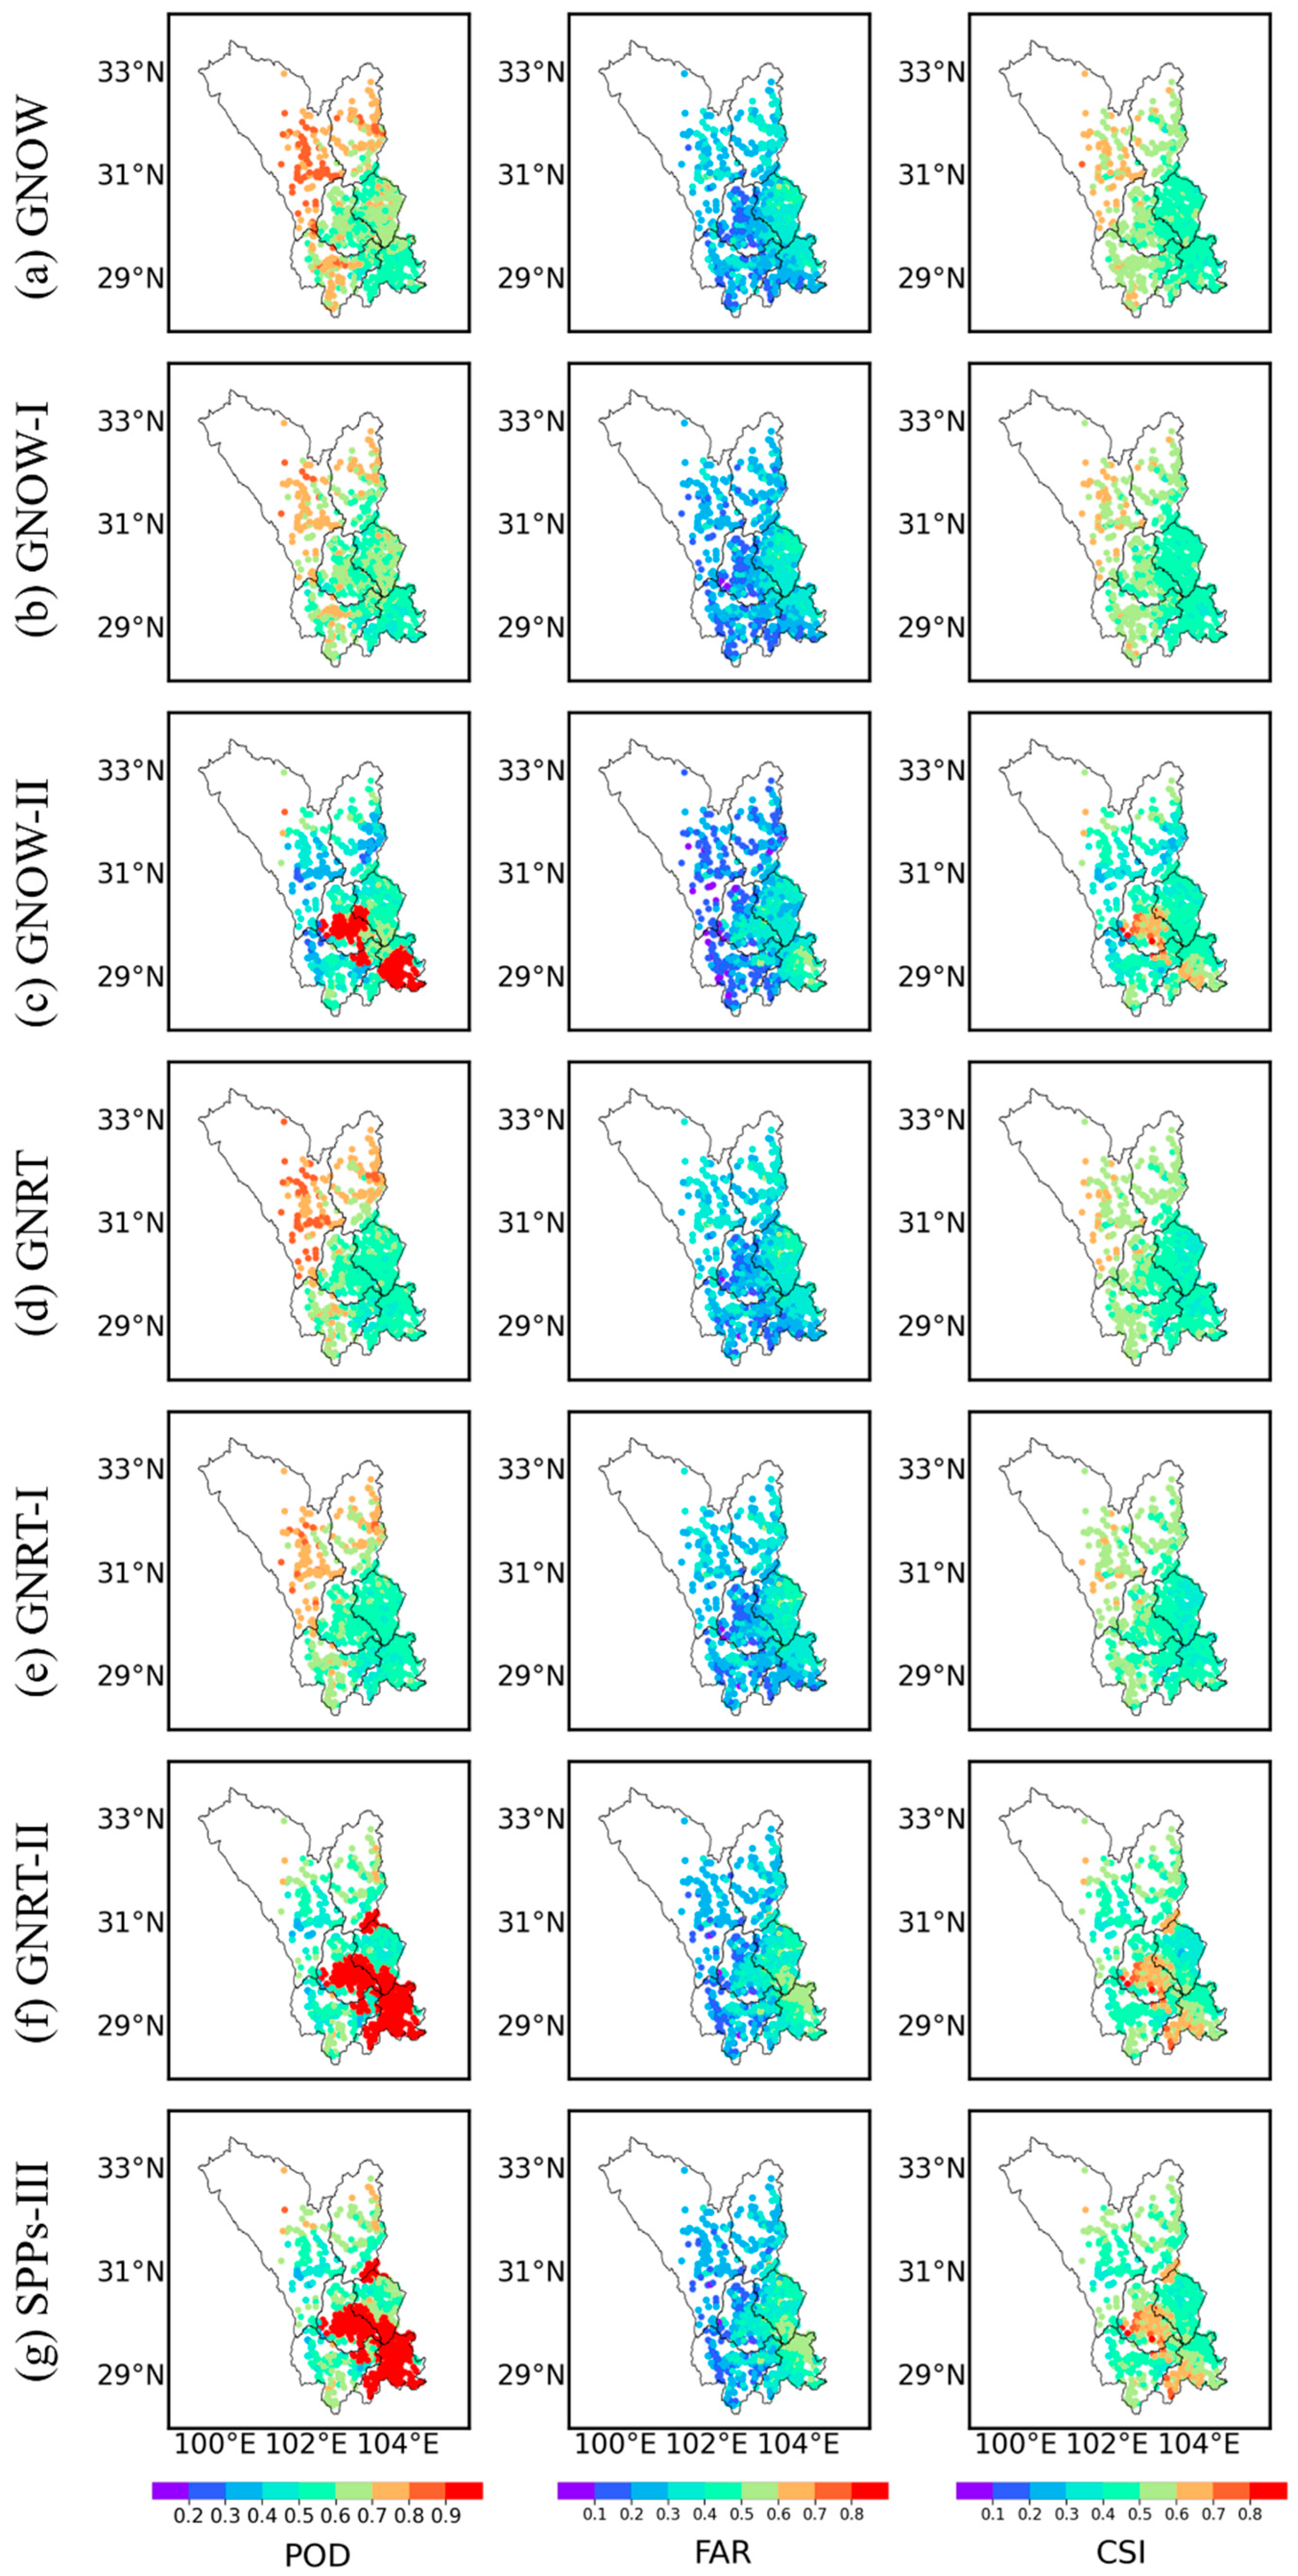
4.2. Classification Evaluation Results

Figure 9 shows the boxplots of the classification evaluation indicators at the CMA site for each original and corrected SPP. From the perspective of the original SPPs, GNOW performs slightly better than GNRT. Since the latency of GNOW is shorter, it should have priority in the selection of near-real-time satellite precipitation products for purposes such as flood prediction. After being corrected by the statistic and dynamic correction method, the evaluation indicators of each classification did not improve significantly.
The indicators of GNOW-II and GNRT-II show that the entire box and whiskers cover a wider range, indicating that some sites are well-corrected while others have become worse. However, on the whole, the sites with better performance in the classification index increased significantly, and the PODs of some sites reached 1. This shows that the CDF method can greatly improve the satellite precipitation quality on the basis of the SDBC method.
For the fusion of SPPs in the third step, the morphology and overall performance of SPPs-III are consistent with the performance of GNRT-II, indicating that the correction of precipitation fusion has little effect on improving data quality in classification indicators in this study.
The spatial distribution of the classification evaluation indicators in the watershed is shown in Figure 10. In addition to the overall performance consistent with the boxplot, in terms of spatial distribution, the classification indicators of the original satellite precipitation have better results in areas with sparse stations (upper Dadu River and upper Min River). This phenomenon might be attributed to the infrequent occurrence of precipitation in these areas, coupled with an overly dense network of stations in the middle and lower reaches of the watershed. The interpolation process, reliant on determining the presence or absence of precipitation, introduces new deviations due to these conditions. As for the results of corrected SPPs, although the results of the SDBC method are not satisfying, after the second step of CDF correction the PODs of most stations in the lower reaches of the Qingyi River and the lower reaches of the Min River are close to 1, as well as the results of SPPs-III. Furthermore, the trends of the FARs and CSIs are similar to those of the PODs.

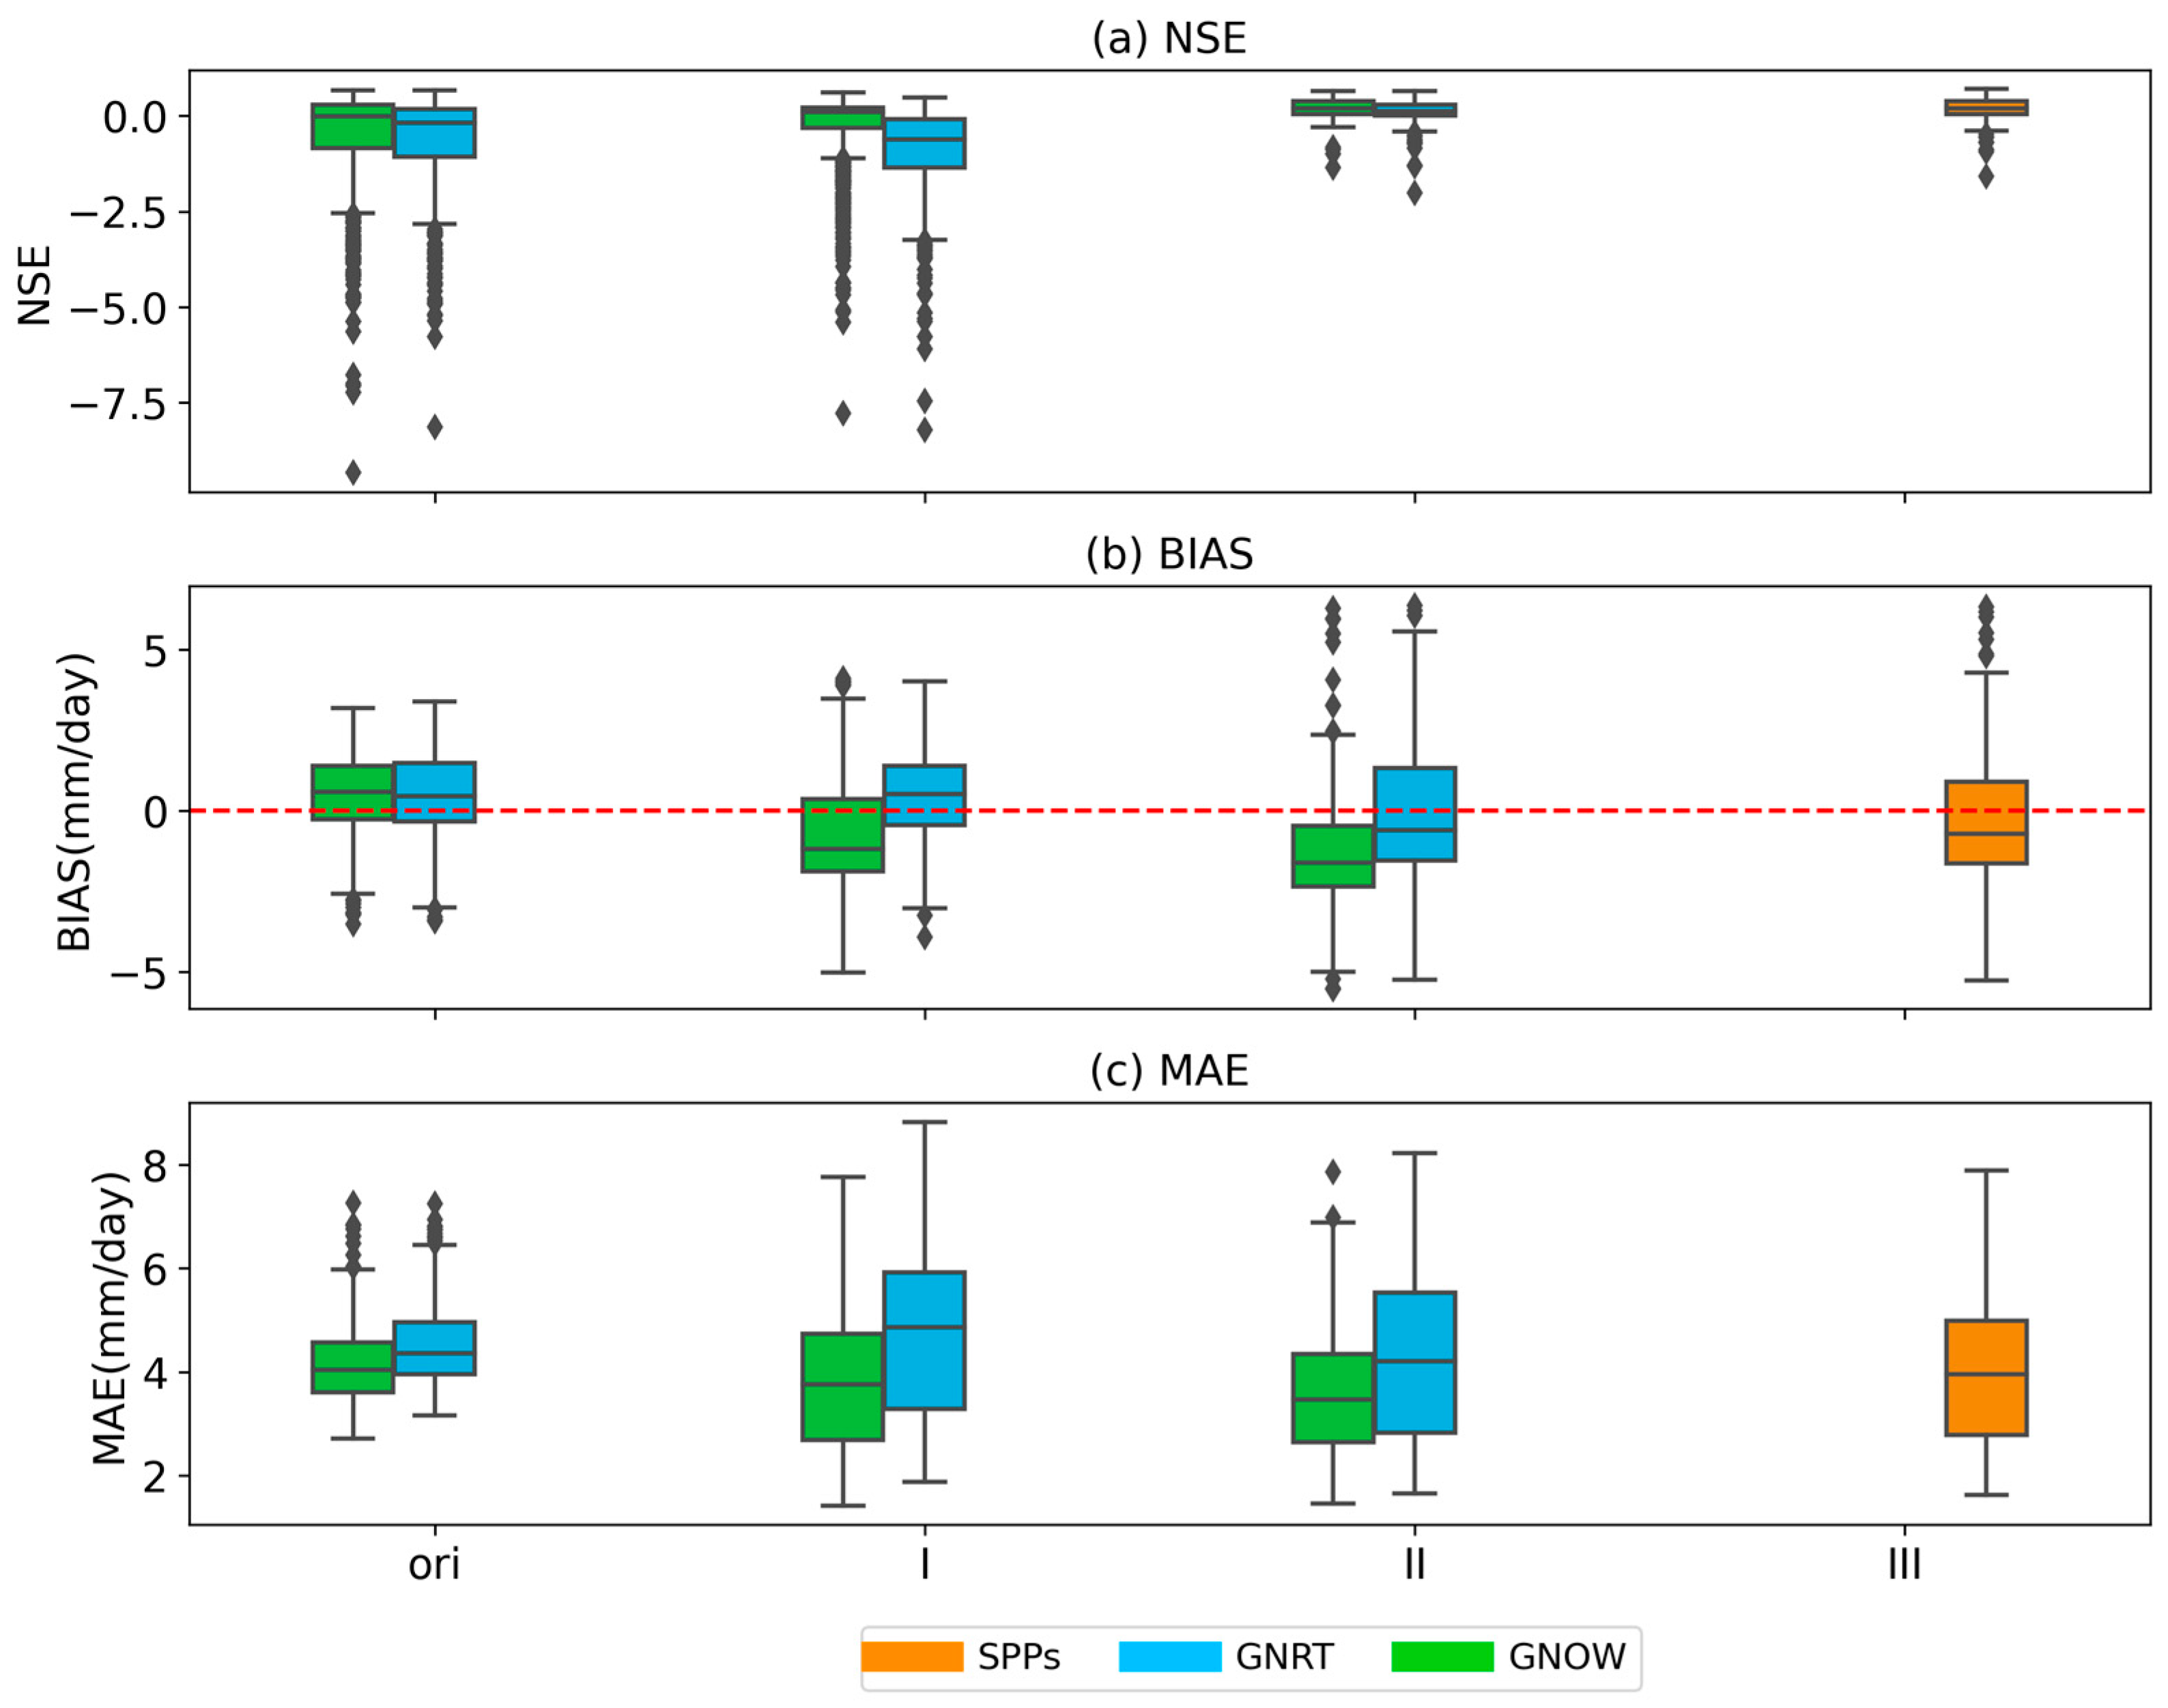
4.3. Quantitative Evaluation

Figure 11 shows the quantitative index evaluation results of original and corrected satellite precipitation at the station scale. From the perspective of NSE, the statistic and dynamic correction method improved the SPPs to a certain extent in the first step. However, there were still many stations with poor performance. There was a significant improvement after the second step of CDF correction and the median NSE reached 0.2. The third-step fusion effect is not apparent, mainly because the two corrected satellite precipitation performances are relatively close. From the perspective of bias, the correction of GNOW is overcorrected from a positive bias to a negative bias. However, compared with the original satellite precipitation, the MAE is still gradually reduced, indicating that the bias correction method positively affects the correction at the site scale.
The quantitative evaluation indicators of the original and corrected satellite precipitation at each station location are shown in Figure 12. It can be seen that the performance of the original satellite precipitation (GNOW and GNRT) in the upper reaches of the Min River and the Dadu River is obviously inferior to that in the Qingyi River and the middle and lower reaches of the Min River. There is a great improvement after being corrected by the statistical-dynamic correction method. However, the effect in the middle and lower reaches of the Min River has declined, especially GNRT. The discrepancies may arise from significant uncertainties introduced by extreme events downstream, resulting in substantial deviations during the correction of certain precipitation events. However, after the correction and fusion of the second and third steps, the quantitative evaluation index of SPPs-III is still greatly improved compared with the original satellite precipitation.

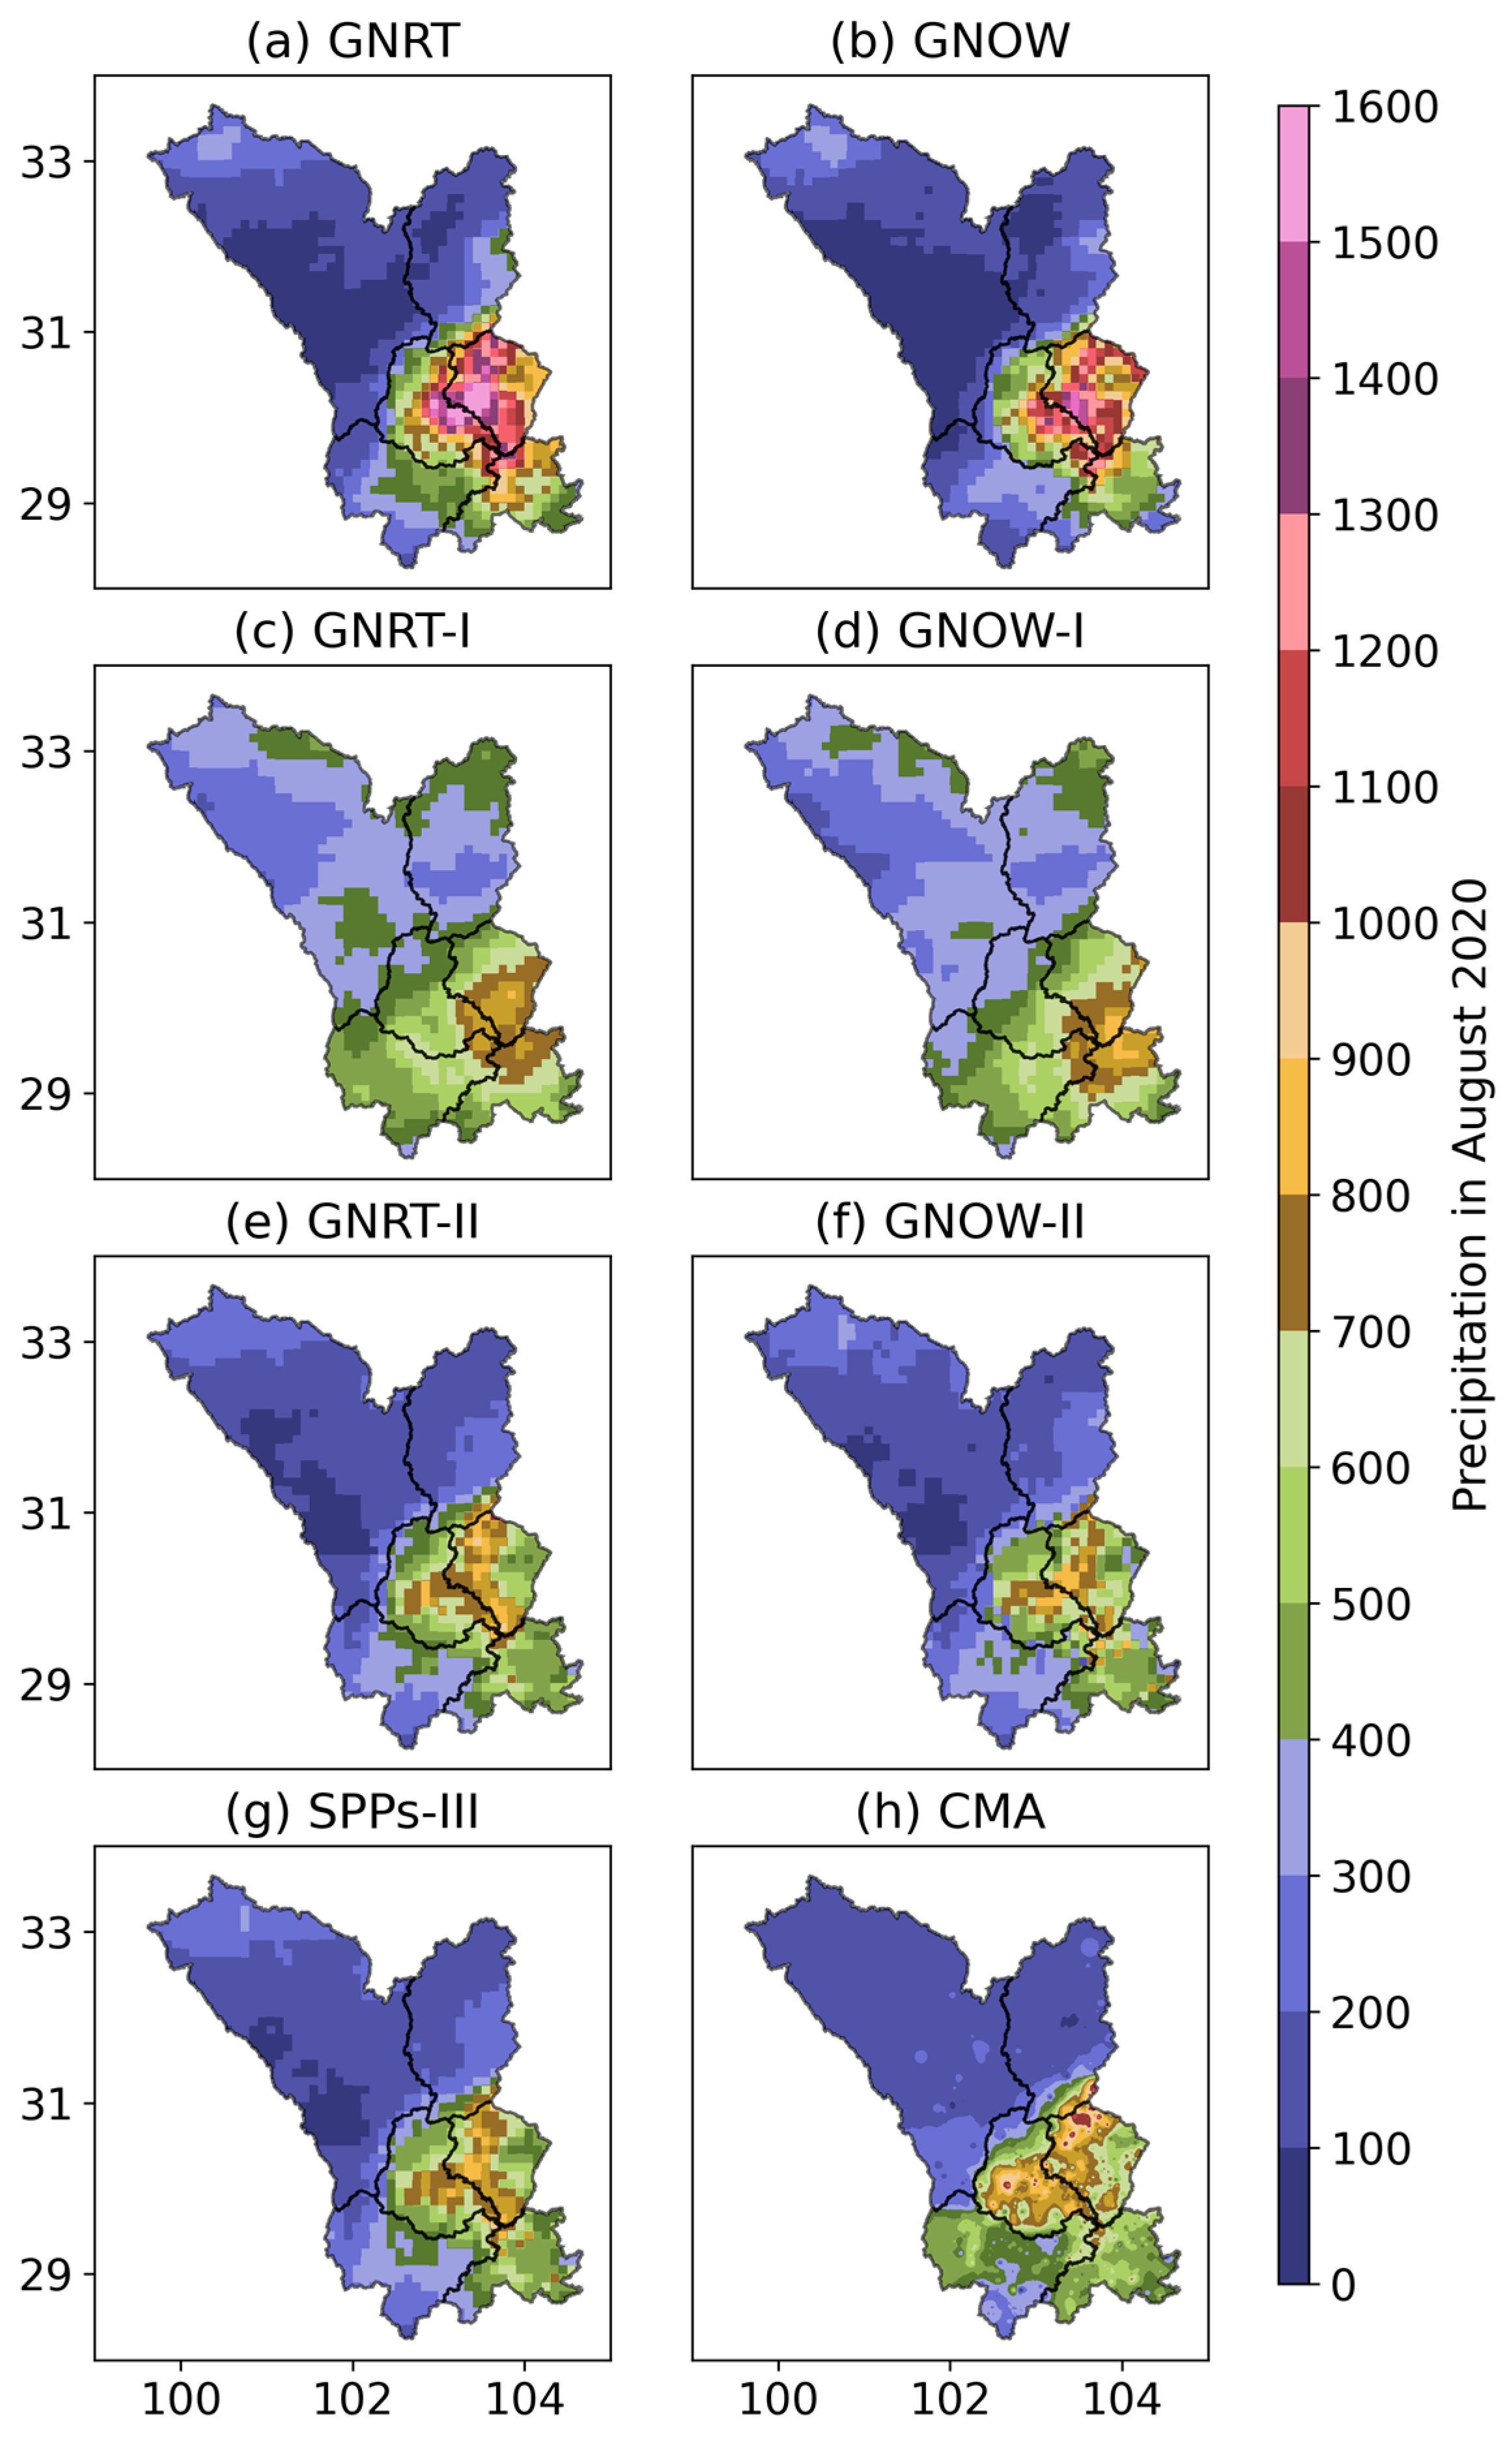
4.4. Evaluation for Month Precipitation in August

Since the actual precipitation in August 2020 is the largest monthly precipitation, the monthly precipitation in August was selected for further analysis and discussion in this section. Figure 13 shows the distribution of eight types of precipitation data in August 2020. It indicates that, except for underestimating precipitation in the middle reaches of the Dadu River, both GNRT and GNOW tend to overestimate actual precipitation. Moreover, in the Qingyi River Basin and most of the middle reaches and small parts of the lower reaches of the Min River, SPPs seriously overestimate the actual precipitation, with monthly precipitation of 1500 mm while the observed value is generally between 800 and 900 mm. After the SDBC correction, the overestimated area is significantly improved, but in the middle and lower reaches of the Dadu River and some areas of the upper Min River, due to excessive correction, it is more overestimated than the original satellite precipitation; after the second step of CDF, the overall precipitation distribution improved significantly.

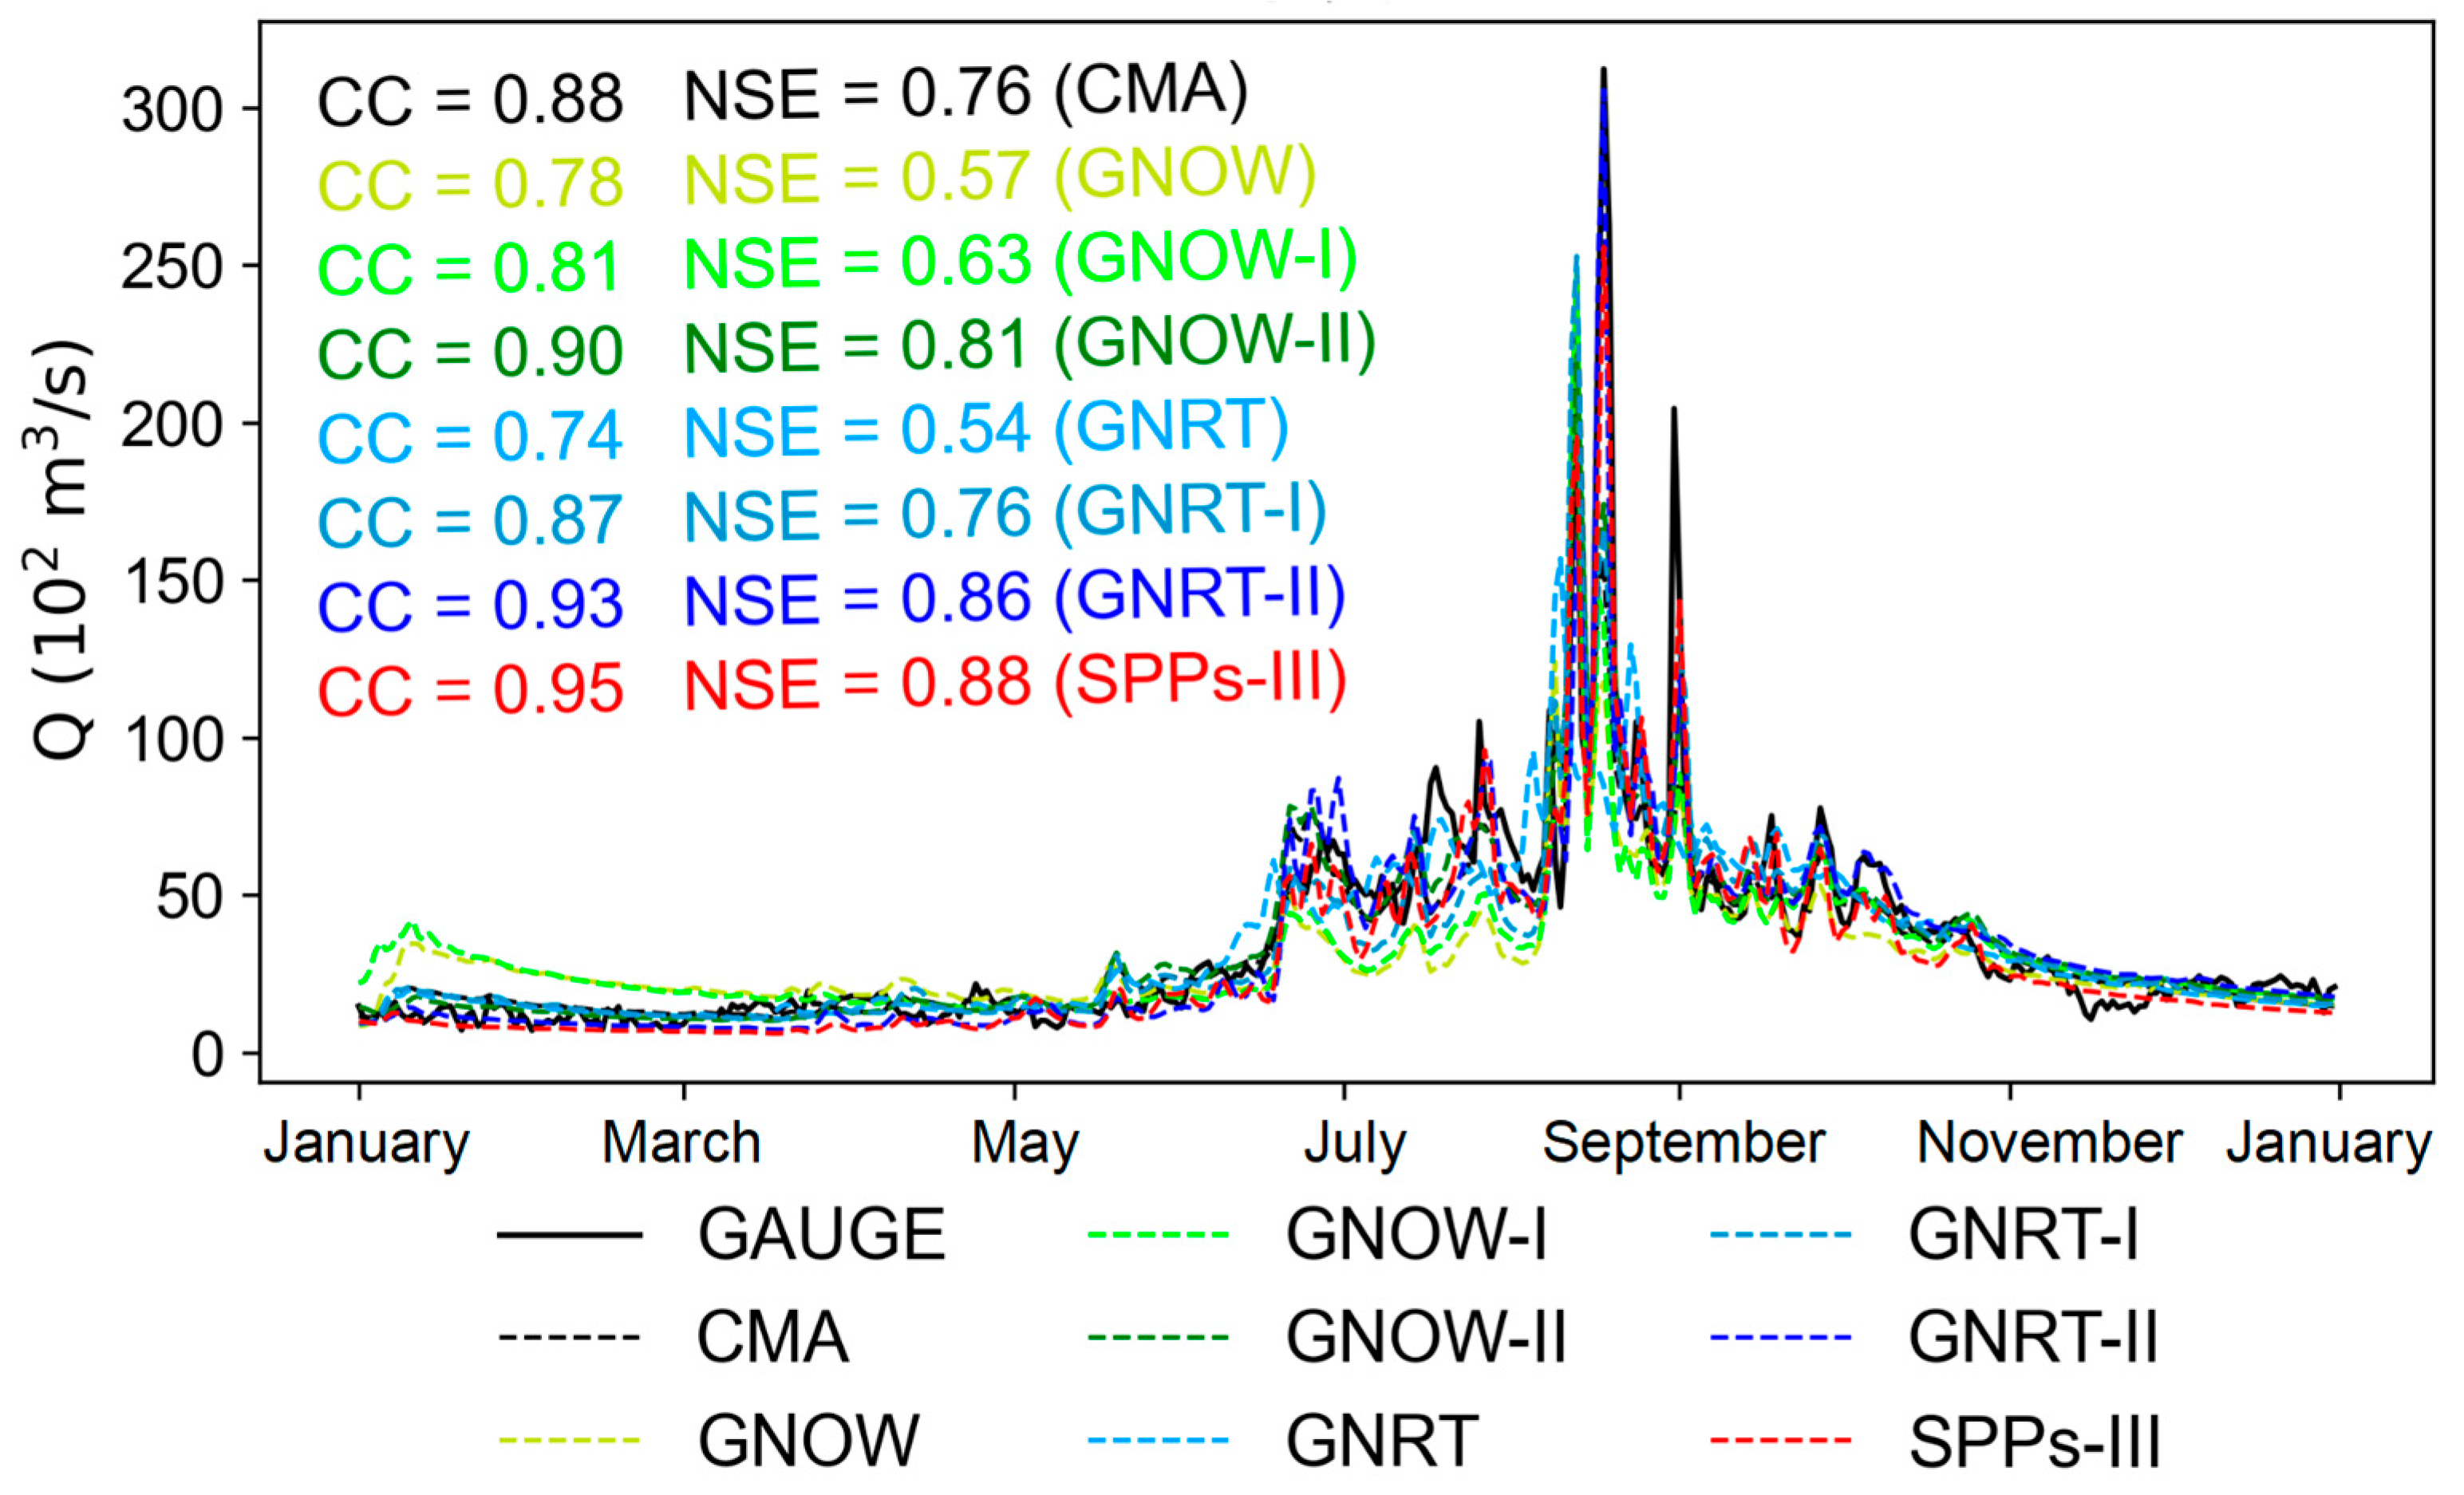
4.5. Hydrological Simulation

Figure 14 shows the hydrograph in 2020, using eight types of precipitation data as the precipitation input for the BTOP model. The results show that SPPs-III performed the best among the datasets in daily-scale hydrological simulations for 2020. The correlation coefficient (CC) and Nash-Sutcliffe Efficiency (NSE) are the highest values: 0.95 and 0.88, even surpassing the hydrological simulation results based on the CMA data (CC = 0.88, NSE = 0.76). This is primarily due to the incomplete spatial distribution of CMA data across the entire watershed, particularly with sparse data points in the upper reaches of the Dadu River. This leads to limitations in the spatiotemporal accuracy of precipitation across the watershed. It is worth noting that although human activities significantly influence the Min River basin, the hydrological model, through automatic parameter calibration, can better match peak flows, resulting in higher NSE and similar metrics. This is mainly attributed to the SDBC method, which derives correction coefficients based on ten-day cumulative precipitation. This can lead to overestimation or underestimation. Consequently, the performance of hydrological processes at the hourly scale is inferior to that at the daily scale.
Nevertheless, it is crucial to note that our study relied on a single hydrological model for runoff simulation. This approach may introduce limitations and uncertainties attributable to the inherent characteristics of the chosen model. In future endeavors, our focus will be on refining the bias correction method for SPPs and conducting a comprehensive assessment of correction and runoff simulation uncertainties by employing multiple hydrological models.

5. Conclusions

This paper proposes a new bias correction approach that includes three steps (SDBC, CDF, and IEVW) to correct the GNOW and GNRT with limited gauges in the Min River Basin, China. It used the historical gridded interpolation precipitation (APHRODITE), and ground observation precipitation to correct SPPs. The main conclusions are summarized below:
(1) The bias correction approach of SPPs proposed in this paper can effectively improve the precipitation quality: (i) the statistical-dynamic bias correction method can effectively correct the satellite precipitation to a certain extent; (ii) the satellite precipitation corrected by the cumulative distribution function matching method can effectively reduce the over-correction and further improve the precipitation quality; (iii) the inverse error variance weighting method is not effective in the fusion of GNOW and GNRT, mainly because both are GSMaP data series and the errors have certain similarity and consistency. When studying the fusion of different satellite precipitations, using data products released by different institutions is recommended.
(2) The performance of the original GNOW and GNRT is relatively consistent. Although the performance of bias correction is not as good as that of GNRT due to the short data series of GNOW, the latency of GNOW is only half an hour, which has better application prospects as it is the fastest real-time satellite precipitation product available currently.
(3) The corrected and integrated SPPs received impressive CC and NSE values of 0.95 and 0.88 in the daily-scale hydrological simulations for 2020. These values even surpass the simulation results obtained from automatic weather station precipitation inputs. This indicates that the fusion of multiple data sources can provide reliable precipitation inputs for hydrological simulations.
Given insufficient data basins that lack rainfall stations, the bias correction approach proposed in this study can effectively improve the quality of satellite precipitation and enhance the hydrological simulation. It is crucial for the application of water resource management and flood prediction, which has strong practical significance for the widespread lack of data in the world, making SPPs play a more significant role in precipitation estimation and hydrological simulation.

Author Contributions

Conceptualization, X.L., J.L. and L.Z.; methodology, Z.Y., L.L. and L.Z.; software, T.C. and J.L.; validation, L.Z.; formal analysis, X.L., Z.Y., L.Z. and J.L.; data curation, T.C.; writing—original draft preparation, X.L. and L.Z.; writing—review and editing, J.L. and L.Z. All authors have read and agreed to the published version of the manuscript.

Funding

This research was funded by the Postdoctoral Interdisciplinary Innovation Fund (JCXK2239) from Sichuan University.

Data Availability Statement

Not applicable.

Acknowledgments

We gratefully acknowledge the anonymous reviewers for their comments and suggestions that improved this manuscript.

Conflicts of Interest

The authors declare no conflict of interest.

References

  1. Jin, X.; Jin, Y. Calibration of a Distributed Hydrological Model in a Data-Scarce Basin Based on GLEAM Datasets. Water 2020, 12, 897. [Google Scholar] [CrossRef]
  2. Zhou, L.; Zhang, X.; Liu, L.; Chen, T.; Liu, X.; Ren, Y.; Zhang, H.; Li, X.; Ao, T. An approach to evaluate non-point source pollution in an ungauged basin: A case study in Xiao’anxi River Basin, China. Water Supply 2020, 20, 3646–3657. [Google Scholar] [CrossRef]
  3. Condom, T.; Martínez, R.; Pabón, J.D.; Costa, F.; Pineda, L.; Nieto, J.J.; López, F.; Villacis, M. Climatological and Hydrological Observations for the South American Andes: In situ Stations, Satellite, and Reanalysis Data Sets. Front. Earth Sci. 2020, 8, 92. [Google Scholar] [CrossRef]
  4. Du, J.; Yu, X.; Zhou, L.; Ren, Y.; Ao, T. Precipitation Characteristics across the Three River Headwaters Region of the Tibetan Plateau: A Comparison between Multiple Datasets. Remote Sens. 2023, 15, 2352. [Google Scholar] [CrossRef]
  5. Le, M.; Lakshmi, V.; Bolten, J.; Bui, D.D. Adequacy of Satellite-derived Precipitation Estimate for Hydrological Modeling in Vietnam Basins. J. Hydrol. 2020, 586, 124820. [Google Scholar] [CrossRef]
  6. Musuuza, J.L.; Gustafsson, D.; Pimentel, R.; Crochemore, L.; Pechlivanidis, I. Impact of Satellite and In Situ Data Assimilation on Hydrological Predictions. Remote Sens. 2020, 12, 811. [Google Scholar] [CrossRef]
  7. Shan, Y.; Yan, C.; Liu, J.; Liu, C. Predicting velocity and turbulent kinetic energy inside an emergent Phragmites australis canopy with real morphology. Environ. Fluid Mech. 2023, 23, 943–963. [Google Scholar] [CrossRef]
  8. Liu, C.; Shan, Y. Impact of an emergent model vegetation patch on flow adjustment and velocity. Proc. Inst. Civ. Eng. Water Manag. 2022, 175, 55–66. [Google Scholar] [CrossRef]
  9. Hui-Mean, F.; Yusop, Z.; Yusof, F. Drought analysis and water resource availability using standardised precipitation evapotranspiration index. Atmos. Res. 2018, 201, 102–115. [Google Scholar] [CrossRef]
  10. Revilla-Romero, B.; Hirpa, F.A.; Thielen-del Pozo, J.; Salamon, P.; Brakenridge, R.; Pappenberger, F.; De Groeve, T. On the Use of Global Flood Forecasts and Satellite-Derived Inundation Maps for Flood Monitoring in Data-Sparse Regions. Remote Sens. 2015, 7, 15702–15728. [Google Scholar] [CrossRef]
  11. Zhou, L.; Rasmy, M.; Takeuchi, K.; Koike, T.; Selvarajah, H.; Ao, T. Adequacy of Near Real-Time Satellite Precipitation Products in Driving Flood Discharge Simulation in the Fuji River Basin, Japan. Appl. Sci. 2021, 11, 1087. [Google Scholar] [CrossRef]
  12. Hrachowitz, M.; Savenije, H.H.G.; Blöschl, G.; McDonnell, J.J.; Sivapalan, M.; Pomeroy, J.W.; Arheimer, B.; Blume, T.; Clark, M.P.; Ehret, U.; et al. A decade of Predictions in Ungauged Basins (PUB)—A review. Hydrol. Sci. J. 2013, 58, 1198–1255. [Google Scholar] [CrossRef]
  13. Mendez, M.; Maathuis, B.; Hein-Griggs, D.; Alvarado-Gamboa, L. Performance Evaluation of Bias Correction Methods for Climate Change Monthly Precipitation Projections over Costa Rica. Water 2020, 12, 482. [Google Scholar] [CrossRef]
  14. Wang, H.; Wang, L.; He, J.; Ge, F.; Chen, Q.; Tang, S.; Yao, S. Can the GPM IMERG Hourly Products Replicate the Variation in Precipitation During the Wet Season Over the Sichuan Basin, China? Earth Space Sci. 2020, 7, e2020EA001090. [Google Scholar] [CrossRef]
  15. Tang, S.; Li, R.; He, J.; Wang, H.; Fan, X.; Yao, S. Comparative Evaluation of the GPM IMERG Early, Late, and Final Hourly Precipitation Products Using the CMPA Data over Sichuan Basin of China. Water 2020, 12, 554. [Google Scholar] [CrossRef]
  16. Tang, G.; Clark, M.P.; Papalexiou, S.M.; Ma, Z.; Hong, Y. Have satellite precipitation products improved over last two decades? A comprehensive comparison of GPM IMERG with nine satellite and reanalysis datasets. Remote Sens. Environ. 2020, 240, 111697. [Google Scholar] [CrossRef]
  17. Kubota, T.; Shige, S.; Hashizume, H.; Aonashi, K.; Takahashi, N.; Seto, S.; Hirose, M.; Takayabu, Y.N.; Ushio, T.; Nakagawa, K.; et al. Global Precipitation Map Using Satellite-Borne Microwave Radiometers by the GSMaP Project: Production and Validation. IEEE Trans. Geosci. Remote. Sens. 2007, 45, 2259–2275. [Google Scholar] [CrossRef]
  18. Saouabe, T.; El Khalki, E.M.; Saidi, M.E.M.; Najmi, A.; Hadri, A.; Rachidi, S.; Jadoud, M.; Tramblay, Y. Evaluation of the GPM-IMERG Precipitation Product for Flood Modeling in a Semi-Arid Mountainous Basin in Morocco. Water 2020, 12, 2516. [Google Scholar] [CrossRef]
  19. Ma, M.; Wang, H.; Jia, P.; Tang, G.; Wang, D.; Ma, Z.; Yan, H. Application of the GPM-IMERG Products in Flash Flood Warning: A Case Study in Yunnan, China. Remote Sens. 2020, 12, 1954. [Google Scholar] [CrossRef]
  20. Huffman, G.J.; Bolvin, D.T.; Nelkin, E.J.; Wolff, D.B.; Adler, R.F.; Gu, G.; Hong, Y.; Bowman, K.P.; Stocker, E.F. The TRMM Multisatellite Precipitation Analysis (TMPA): Quasi-Global, Multiyear, Combined-Sensor Precipitation Estimates at Fine Scales. J. Hydrometeorol. 2007, 8, 38–55. [Google Scholar] [CrossRef]
  21. Huffman, G.J.; Adler, R.F.; Arkin, P.; Chang, A.; Ferraro, R.; Gruber, A.; Janowiak, J.; McNab, A.; Rudolf, B.; Schneider, U. The Global Precipitation Climatology Project (GPCP) Combined Precipitation Dataset. Bull. Am. Meteorol. Soc. 1997, 78, 5–20. [Google Scholar] [CrossRef]
  22. Joyce, R.J.; Janowiak, J.E.; Arkin, P.A.; Xie, P. CMORPH: A Method that Produces Global Precipitation Estimates from Passive Microwave and Infrared Data at High Spatial and Temporal Resolution. J. Hydrometeorol. 2004, 5, 487–503. [Google Scholar] [CrossRef]
  23. Yang, J.; Zhang, Z.; Wei, C.; Lu, F.; Guo, Q. Introducing the New Generation of Chinese Geostationary Weather Satellites, Fengyun-4. Bull. Am. Meteorol. Soc. 2017, 98, 1637–1658. [Google Scholar] [CrossRef]
  24. Zhou, L.; Koike, T.; Takeuchi, K.; Rasmy, M.; Onuma, K.; Ito, H.; Selvarajah, H.; Liu, L.; Li, X.; Ao, T. A study on availability of ground observations and its impacts on bias correction of satellite precipitation products and hydrologic simulation efficiency. J. Hydrol. 2022, 610, 127595. [Google Scholar] [CrossRef]
  25. Mastrantonas, N.; Bhattacharya, B.; Shibuo, Y.; Rasmy, M.; Espinoza-Dávalos, G.; Solomatine, D. Evaluating the Benefits of Merging Near-Real-Time Satellite Precipitation Products: A Case Study in the Kinu Basin Region, Japan. J. Hydrometeorol. 2019, 20, 1213–1233. [Google Scholar] [CrossRef]
  26. Tan, M.L.; Yang, X. Effect of rainfall station density, distribution and missing values on SWAT outputs in tropical region. J. Hydrol. 2020, 584, 124660. [Google Scholar] [CrossRef]
  27. Tian, Y.; Peters-Lidard, C.D. A global map of uncertainties in satellite-based precipitation measurements. Geophys. Res. Lett. 2010, 37, L24407. [Google Scholar] [CrossRef]
  28. Stisen, S.; Sandholt, I. Evaluation of remote-sensing-based rainfall products through predictive capability in hydrological runoff modelling. Hydrol. Process. 2010, 24, 879–891. [Google Scholar] [CrossRef]
  29. Yatagai, A.; Minami, K.; Masuda, M.; Sueto, N. Development of Intensive APHRODITE Hourly Precipitation Data for Assessment of the Moisture Transport That Caused Heavy Precipitation Events. Sola 2019, 15A, 43–48. [Google Scholar] [CrossRef]
  30. Yatagai, A.; Kamiguchi, K.; Arakawa, O.; Hamada, A.; Yasutomi, N.; Kitoh, A. APHRODITE: Constructing a Long-Term Daily Gridded Precipitation Dataset for Asia Based on a Dense Network of Rain Gauges. Bull. Am. Meteorol. Soc. 2012, 93, 1401–1415. [Google Scholar] [CrossRef]
  31. Ji, X.; Li, Y.; Luo, X.; He, D.; Guo, R.; Wang, J.; Bai, Y.; Yue, C.; Liu, C. Evaluation of bias correction methods for APHRODITE data to improve hydrologic simulation in a large Himalayan basin. Atmos. Res. 2020, 242, 104964. [Google Scholar] [CrossRef]
  32. Ushio, T.; Sasashige, K.; Kubota, T.; Shige, S.; Okamoto, K.; Aonashi, K.; Inoue, T.; Takahashi, N.; Iguchi, T.; Kachi, M.; et al. A Kalman Filter Approach to the Global Satellite Mapping of Precipitation (GSMaP) from Combined Passive Microwave and Infrared Radiometric Data. J. Meteorol. Soc. Jpn. 2009, 87A, 137–151. [Google Scholar] [CrossRef]
  33. Mega, T.; Ushio, T.; Takahiro, M.; Kubota, T.; Kachi, M.; Oki, R. Gauge-Adjusted Global Satellite Mapping of Precipitation. IEEE Trans. Geosci. Remote Sens. 2019, 57, 1928–1935. [Google Scholar] [CrossRef]
  34. Liu, L.; Zhou, L.; Gusyev, M.; Ren, Y. Unravelling and improving the potential of global discharge reanalysis dataset in streamflow estimation in ungauged basins. J. Clean. Prod. 2023, 419, 138282. [Google Scholar] [CrossRef]
  35. Zhu, Y.; Liu, L.; Qin, F.; Zhou, L.; Zhang, X.; Chen, T.; Li, X.; Ao, T. Application of the Regression-Augmented Regionalization Approach for BTOP Model in Ungauged Basins. Water 2021, 13, 2294. [Google Scholar] [CrossRef]
  36. Liu, L.; Ao, T.; Zhou, L.; Takeuchi, K.; Gusyev, M.; Zhang, X.; Wang, W.; Ren, Y. Comprehensive evaluation of parameter importance and optimization based on the integrated sensitivity analysis system: A case study of the BTOP model in the upper Min River Basin, China. J. Hydrol. 2022, 610, 127819. [Google Scholar] [CrossRef]
  37. Takeuchi, K.; Hapuarachchi, P.; Zhou, M.; Ishidaira, H.; Magome, J. A BTOP model to extend TOPMODEL for distributed hydrological simulation of large basins. Hydrol. Process. 2008, 22, 3236–3251. [Google Scholar] [CrossRef]
  38. Soo, E.Z.X.; Jaafar, W.Z.W.; Lai, S.H.; Othman, F.; Elshafie, A.; Islam, T.; Srivastava, P.; Hadi, H.S.O. Evaluation of bias-adjusted satellite precipitation estimations for extreme flood events in Langat river basin, Malaysia. Hydrol. Res. 2020, 51, 105–126. [Google Scholar] [CrossRef]
  39. Serrat-Capdevila, A.; Merino, M.; Valdes, J.B.; Durcik, M. Evaluation of the Performance of Three Satellite Precipitation Products over Africa. Remote Sens. 2016, 8, 836. [Google Scholar] [CrossRef]
  40. Amengual, A.; Homar, V.; Romero, R.; Alonso, S.; Ramis, C. A Statistical Adjustment of Regional Climate Model Outputs to Local Scales: Application to Platja de Palma, Spain. J. Clim. 2012, 25, 939–957. [Google Scholar] [CrossRef]
  41. Khairul, I.; Mastrantonas, N.; Rasmy, M.; Koike, T.; Takeuchi, K. Inter-Comparison of Gauge-Corrected Global Satellite Rainfall Estimates and Their Applicability for Effective Water Resource Management in a Transboundary River Basin: The Case of the Meghna River Basin. Remote Sens. 2018, 10, 828. [Google Scholar] [CrossRef]
  42. Hasan, M.M.; Sharma, A.; Johnson, F.; Mariethoz, G.; Seed, A. Merging radar and in situ rainfall measurements: An assessment of different combination algorithms. Water Resour. Res. 2016, 52, 8384–8398. [Google Scholar] [CrossRef]
  43. Woldemeskel, F.M.; Sivakumar, B.; Sharma, A. Merging gauge and satellite rainfall with specification of associated uncertainty across Australia. J. Hydrol. 2013, 499, 167–176. [Google Scholar] [CrossRef]
  44. Smith, D.F.; Gasiewski, A.J.; Jackson, D.L.; Wick, G.A. Spatial scales of tropical precipitation inferred from TRMM microwave imager data. IEEE Trans. Geosci. Remote Sens. 2005, 43, 1542–1551. [Google Scholar] [CrossRef]
  45. Guzzetti, F.; Peruccacci, S.; Rossi, M.; Stark, C.P. The rainfall intensity–duration control of shallow landslides and debris flows: An update. Landslides 2008, 5, 3–17. [Google Scholar] [CrossRef]
  46. Aviad, Y.; Kutiel, H.; Lavee, H. Variation of Dry Days Since Last Rain (DDSLR) as a measure of dryness along a Mediterranean—Arid transect. J. Arid. Environ. 2009, 73, 658–665. [Google Scholar] [CrossRef]
  47. Valdés-Pineda, R.; Demaría, E.M.C.; Valdés, J.B.; Wi, S.; Serrat-Capdevilla, A. Bias correction of daily satellite-based rainfall estimates for hydrologic forecasting in the Upper Zambezi, Africa. Hydrol. Earth Syst. Sci. 2016, 2016, 1–28. [Google Scholar]
  48. Maghsood, F.F.; Hashemi, H.; Hosseini, S.H.; Berndtsson, R. Ground Validation of GPM IMERG Precipitation Products over Iran. Remote Sens. 2020, 12, 48. [Google Scholar] [CrossRef]
  49. Tapiador, F.J.; Navarro, A.; García-Ortega, E.; Merino, A.; Sánchez, J.L.; Marcos, C.; Kummerow, C. The Contribution of Rain Gauges in the Calibration of the IMERG Product: Results from the First Validation over Spain. J. Hydrometeorol. 2020, 21, 161–182. [Google Scholar] [CrossRef]
Figure 1. The digital elevation model (DEM) and ground observation of Min River Basin. The numbers 1 to 6 represent the Upper Min River Basin, Upper Dadu River Basin, Qingyi River Basin, Middle Min River Basin, Middle-down Dadu River Basin, and Down Min River Basin.
Water 15 03615 g001
Figure 2. Annual (average) precipitation distribution of (a) Asian Precipitation—Highly Resolved Observational Data Integration Towards Evaluation of Water Resources (APHRODITE) over 2001–2015; (b) Global Satellite Mapping of Precipitation NRT (GNRT) over 2001–2015; (c) China Meteorological Administration (CMA) in 2020; (d) GNRT in 2020; (e) Global Satellite Mapping of Precipitation NOW (GNOW) in 2020.
Water 15 03615 g002
Figure 3. The framework of this study.
Water 15 03615 g003
Figure 4. Monthly precipitation of different datasets in 2020.
Water 15 03615 g004
Figure 5. Cumulative precipitation of different precipitation datasets in 2020.
Water 15 03615 g005
Figure 6. Statistical factor map of GSMaP datasets. (a) GNRT and (b) GNOW.
Water 15 03615 g006
Figure 7. Annual precipitation distribution of eight precipitation datasets in 2020. (a) GNRT; (b) GNOW; (c) GNRT-I; (d) GNOW-I; (e) GNRT-II; (f) GNOW-II; (g) SPPs-III; (h) CMA.
Water 15 03615 g007
Figure 8. Cumulative precipitation of eight precipitation data in each subbasin in 2020. (a) Subbasin-1, Upper Min River Basin; (b) Subbasin-2, Upper Dadu River Basin; (c) Subbasin-3, Qingyi River Basin; (d) Subbasin-4, Middle Min River Basin; (e) Subbasin-5, Middle-down Dadu River Basin, and (f) Subbasin-6, Down Min River Basin.
Water 15 03615 g008
Figure 9. Boxplots of classification evaluation results. Ori represents original SPPs. I–III represents the three-step bias correction method.
Water 15 03615 g009
Figure 10. The distribution of classification evaluation indexes. (a) GNOW; (b) GNOW-I; (c) GNOW-II; (d) GNRT; (e) GNRT-I; (f) GNRT-II; (g) SPPs-III.
Water 15 03615 g010
Figure 11. Boxplots of quantitative evaluation results with indexes (a) NSE, (b) BIAS, and (c) MAE. Ori represents original SPPs. I–III represents the three-step bias correction method.
Water 15 03615 g011
Figure 12. The distribution of quantitative evaluation indexes. (a) GNOW; (b) GNOW-I; (c) GNOW-II; (d) GNRT; (e) GNRT-I; (f) GNRT-II; (g) SPPs-III.
Water 15 03615 g012
Figure 13. Precipitation amounts of eight datasets in August 2020. (a) GNRT; (b) GNOW; (c) GNRT-I; (d) GNOW-I; (e) GNRT-II; (f) GNOW-II; (g) SPPs-III; (h) CMA.
Water 15 03615 g013
Figure 14. The hydrological simulation of BTOP with nine precipitation datasets.
Water 15 03615 g014
Table 1. The main features of Min River Basin.
Subbasin ID123456
Average elevation (m)3417 3960 1863 642 2446 782
Max elevation (m)6176 6520 5307 3843 7510 4014
Min elevation (m)728 1303 357 353 357 249
Average temperature (°C)76166161517
Max temperature (°C)35.6/37.739.53839.5
Min temperature (°C)−21−36−3.9−5.9/−5.9
Annual average precipitation (mm)420~840600~7001776100–12001000~1700100~1200
Annual average evaporation (mm)800~11301200~2500700800~1001200~1600800~100
Annual discharge (m3/s)48389548948519882800
Table 2. Evaluation indexes.
Evaluation IndexesFormulasCommentsOptimal Value
Probability Of Detection
(POD)
P O D = H H + M (10)H—days that SPPs and gauge both detect precipitation
M—days that SPPs fail in detecting precipitation
F—days that SPPs detect precipitation while gauge is no precipitation
1
False Alarm Ratio
(FAR)
F A R = H H + F (11)0
Critical Success Index
(CSI)
C S I = H H + M + F (12)1
Nash-Sutcliffe Efficiency
(NSE)
N S E = 1 i = 1 n ( X i S X i O ) 2 i = 1 n ( X i O X ¯ i O ) 2 (13) X i S —SPPs
X i O —gauge precipitation
1
Bias B I A S = i = 1 n ( X i s X i o ) n (14)/0
Mean Absolute Error
(MAE)
M A E = i = 1 n | X i s X i o | n (15)/0
Disclaimer/Publisher’s Note: The statements, opinions and data contained in all publications are solely those of the individual author(s) and contributor(s) and not of MDPI and/or the editor(s). MDPI and/or the editor(s) disclaim responsibility for any injury to people or property resulting from any ideas, methods, instructions or products referred to in the content.

