Article

Study on Characteristics of Water Level Variations and Water Balance of the Largest Lake in the Qinghai-Tibet Plateau

1
College of Atmospheric Sciences, Lanzhou University, Lanzhou 730000, China
2
Qinghai Lake Comprehensive Observation and Research Station, Northwest Institute of Eco-Environment and Resources, Chinese Academy of Sciences, Lanzhou 730000, China
3
University of Chinese Academy of Sciences, Beijing 100049, China
*
Authors to whom correspondence should be addressed.
Water 2023, 15(20), 3614; https://doi.org/10.3390/w15203614
Submission received: 8 August 2023 / Revised: 11 October 2023 / Accepted: 12 October 2023 / Published: 16 October 2023
(This article belongs to the Special Issue Lake Processes and Lake’s Climate Effects under Global Warming)

Abstract

:
Qinghai Lake is the largest lake in Qinghai-Tibet Plateau and China, it is also an important part of the national ecological security strategy. Since 1950s, the water level of Qinghai Lake has been changing rapidly, which induces great effects on the surrounding traffic facilities, residents’ safety and the development of animal husbandry, etc. Therefore, it is necessary to study the water level evolution and water balance of Qinghai Lake under the main impact of climate change. Based on meteorological and hydrological data from Buha River Hydrological Station, Xiashe Hydrological Station, and Gangcha Meteorological Station, CMFD, and water balance equation, this article first analyzes the interannual and intra-year water level evolution characteristics of Qinghai Lake from 1956 to 2020, including lake surface precipitation (P), runoff into the lake ( R s ) and evaporation (E). Secondly, we conducted a study on the water level change characteristics calculated for fixed months. Finally, the contribution rate of each factor to the fluctuation of Qinghai Lake water level was quantitatively calculated using the ridge regression method. Results show that the annual average water level declined at a rate of 0.8 m decade−1 from 1956 to 2004, primarily due to E exceeding the sum of P and R s . However, from 2004 to 2020, the water level increased at a rate of 1.7 m decade−1, mainly attributed to the increase in P and R s . Qinghai Lake exhibits evident intra-year variations, with the water level starting to rise in May and reaching its peak in September, which aligns with the monthly variations of R s , P, and E. Furthermore, the impacts of the current year’s P, R s , and E on the annual water level fluctuations for fixed months of September to December is greater than that of the previous year. Specifically, the contributions of the current year’s P, R s and E to the water level fluctuations calculated based on December data are 10%, 70%, and 20%, respectively. The contribution rate of meteorological factors to the rise and fall of water level was wind speed (33%), downward short-wave radiation (27%), precipitation (27%), downward long-wave radiation (11%) and specific humidity (2%).

1. Introduction

As an essential component of the national ecological security framework, the Qinghai-Tibet Plateau (QTP) is an important part of China’s ecological security construction. There is the highest elevation, the largest area and the largest number of inland lakes on the QTP, which are characterized by the concentration of saltwater lakes and salt lakes [1,2]. In the context of global warming, the overall climate of the plateau tends to be warm and humid [3,4,5]. Under the climate change of increased precipitation, rising temperatures and intensified glacier melting glacier melting [6,7], the water level of 76% of plateau lakes is rising, with an average increase rate of 2.1 m decade−1, among which the water level of lakes located in the middle and northern inner flow areas of the plateau is more obvious [8].
As the largest lake in the QTP and China, Qinghai Lake is an important barrier in maintaining ecological security in the northern part of the plateau, preventing desertification from spreading eastward in the northwest, and ensuring ecological security in the eastern part of the plateau [9]. It is an important water vapor circulation channel and water conservation area in northwest China [10]. It is also an important migration meeting point, breeding ground and wintering ground for waterbirds [11]. In the context of climate change, both temperature and precipitation in Qinghai Lake Basin show a significant increasing trend [10,12]. The annual mean water level of Qinghai Lake showed a trend of first decreasing and then rising, falling to the lowest level in 2004, and then rising continuously [13,14,15]. Qinghai Lake is the heart and soul of the Qinghai Lake Scenic Area, which encompasses the scenery, culture, and natural landscapes around Qinghai Lake, making it not only a beautiful tourist destination but also an important ecological conservation area in western China. The change of lake water level will directly or indirectly affect the transportation facilities, animal husbandry development, residents’ safety, tourism development and the utilization of Qinghai Lake Scenic Reserve [16,17]. Hao et al. indicates that there has been no significant change in the water quality of Qinghai Lake in recent years, but the increase in water level may be an important reason for the expansion of the coverage area of flagella in Qinghai Lake [18]. Hou et al. found that the continuous rise in the water level of Qinghai Lake may result in erosion of shallow lake areas and the suspension of sediment, leading to a decline in water quality [19]. Therefore, it is of great significance to study the evolution law of Qinghai Lake water level under climate change and its mechanism analysis for the understanding of the plateau water cycle and the protection of plateau ecology.
Water level data for Qinghai Lake can be obtained from the Xiashe Hydrological station. In research areas lacking station observations, supplementing with satellite or simulated data can also yield valuable research results [20,21]. Water level variations are primarily influenced by climate and human activities [22], while Qinghai Lake’s water level changes are mainly driven by natural factors [23]. Climate change causes the variations in lake water level by affecting the recharge and loss of water balance. The main factors affecting the changes in water quantity in Qinghai Lake are precipitation (P), evaporation (E) and runoff into the lake ( R s ) [24]. Most previous studies qualitatively revealed that the increase in P and R s was significantly positively correlated with the lake water level, while the increase in E inhibited the increase in the lake water level [19,25,26,27,28,29,30,31]. Li et al. (2020) concluded that the influence of last year’s factors ( R s , P and E) on the water level was more significant than that of the current year, and further quantitatively evaluated the contribution rate of the three variables to the water level fluctuation of Qinghai Lake from 1961 to 2015 by using the principle of water balance and correlation coefficients as R s > P > E. For the same research period, Wang and Gao (2021) conducted work based on the study of Li (2020) and further demonstrated through the quantitative analysis of ridge regression that the contribution rate of the three variables to the water level fluctuation of Qinghai Lake was R s (38.2%) > E (31.4%) > P (30.4%). The rankings of evaporation and precipitation were inconsistent. To sum up, the current studies about the effects of P, R s and E on the water level fluctuation have mainly focused on qualitative analysis, and the results about quantitative analysis are not consistent. Thus, further in-depth research is needed.
Fluctuations of water level and changes in P, R s and E are also affected by land surface meteorological factors, but current studies are mostly limited to temperature, precipitation and wind speed [13,30,32,33] and did not conduct a comprehensive quantitative analysis of their respective contribution rates under the combined action of seven common meteorological variables (2 m air temperature, surface pressure, specific humidity, 10 m wind speed, downward shortwave radiation, downward longwave radiation and precipitation), and the contribution rates of other factors were still unclear. This study overcomes the shortcomings of the current research, such as limited quantitative research on water level changes in Qinghai Lake and insufficient research on the contribution of meteorological variables.
In order to study the water level evolution and water balance of Qinghai Lake under the background of climate change, the following actions are undertaken: (1) Firstly, the evolution characteristics and the annual variation in Qinghai Lake water level in longer series are analyzed; (2) Secondly, the relationship between the rise and fall of water level calculated in fixed months and the synchronous changes in R s , P and E is revealed; (3) Finally, the contribution rates of P, R s , E and their changes to water level evolution are revealed.

2. Study Area, Data and Methods
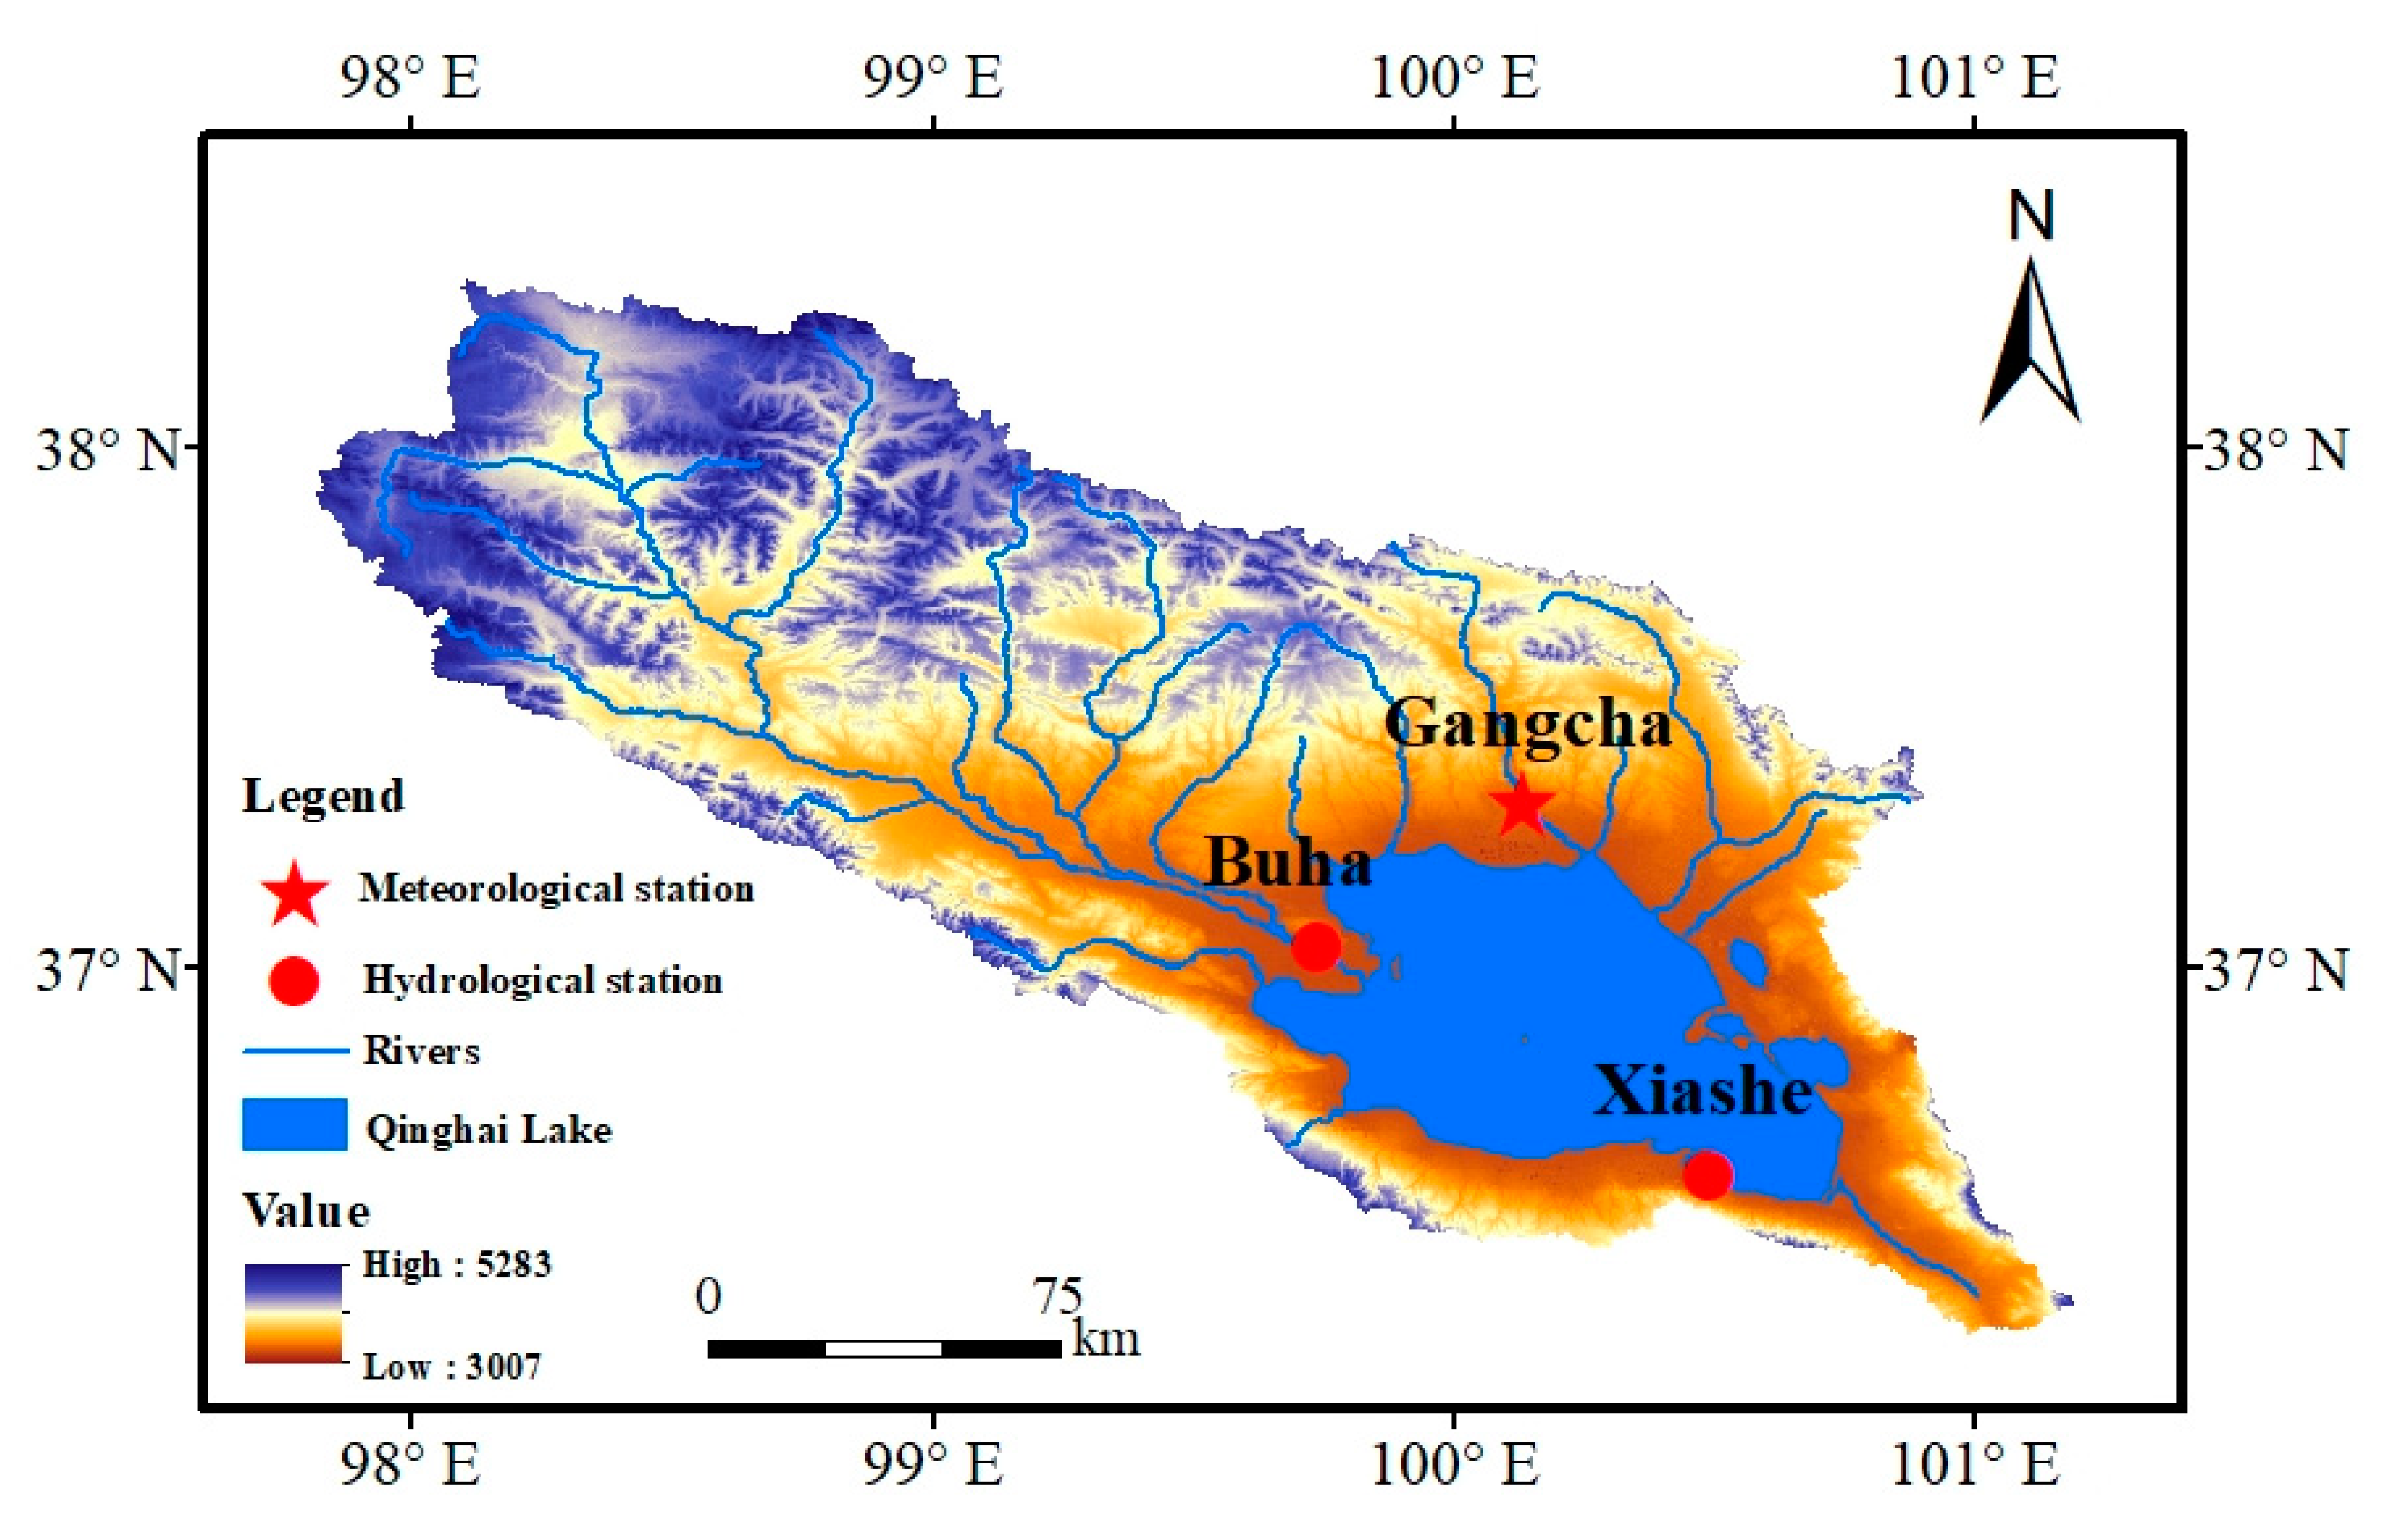
2.1. Study Area

Qinghai Lake (36°32′~37°15′ N, 99°36′~100°47′ E) with an area of 4522.7 km2 in 2020 is the largest lake in China, located in the northeast of the QTP (Figure 1) [34]. It is the confluence of the northwest arid zone, the eastern monsoon zone and the southwest cold zone in China. At an elevation of about 3196 m a.s.l., Qinghai Lake spans roughly 105 km in length and 63 km in width, exhibiting a dimictic nature that includes two seasonal transitions: the first occurs in spring, typically around May, lasting 2–3 weeks, and the second takes place in autumn, between November and December [35]. Annually, Qinghai Lake freezes from mid-December to early January, becoming completely ice-covered by the year’s end, with gradual thawing starting in late March and full melting by early to mid-April, featuring an average ice thickness ranging from 32 to 37 cm over multiple years [36]. Its average and maximum depth are 21 m and 32.8 m, respectively [27]. From 2000 to 2020, its area showed a trend of first decreasing and then increasing, and the area was the lowest in 2004 (4200 km2) during 21 years [34]. During this period, the water volume increased at a rate of 0.54 Gt a−1 [7]. Qinghai Lake Basin is located in the northeast of the QTP (Figure 1), with a total area of 29,661 km2. The terrain decreases from northwest to southeast, with the highest elevation of 5283 m a.s.l. There are about 50 rivers into Qinghai Lake in the basin, mainly Buha River, Quanji River, Heima River, Shaliu River, Hargai River, etc. The flow of the Buha River accounts for about 50% of the total flow into the lake [26]. The basin has a continental climate with an annual average temperature of −4.6~4.0 °C, annual potential evaporation between 1300 and 2000 mm, and annual precipitation ranging from 291 to 579 mm, primarily concentrated from June to September, with rainfall as the main form of precipitation, and snowfall occurring mainly during the ice-covered period [10,37].

2.2. Data

2.2.1. Gangcha Meteorological Station Data

The daily value dataset of China surface climatic data (V3.0) is from the data network of the China Meteorological Administration. It contains the daily value of atmospheric pressure, precipitation, relative humidity, wind direction, wind speed, sunshine duration and other meteorological elements of 824 benchmarks and basic meteorological stations in China. The data records start from January 1951. Since Gangcha meteorological station (37°19′48″ N, 100°7′48″ E) is the nearest national reference station to Qinghai Lake (Figure 1). We extracted the precipitation from 1979 to 2018, which was continuous without any missing data, and used this data to replace the lake surface precipitation, as well as made meteorological attribution analysis.

2.2.2. CMFD Meteorological Data

The China meteorological forcing dataset (CMFD) is the first high spatio-temporal resolution grid-based near-surface meteorological dataset, which is specifically designed to study land surface processes in China. The dataset is composed of ground station data, remote-sensing data and reanalysis data, and contains seven near-surface meteorological elements: air temperature, surface pressure, specific humidity, wind speed, downward shortwave radiation, downward longwave radiation and precipitation rate. The time span is from January 1979 to December 2018, with a temporal resolution of 3 h and a spatial resolution of 0.1°. Due to the larger number of sites used to generate the CMFD dataset, its accuracy for China is better than internationally available reanalysis data. It is also one of the most widely-used climate datasets in China [38,39]. Due to the absence and large error of radiation data of Gangcha meteorological station, the downward shortwave radiation and downward longwave radiation of CMFD from 1979 to 2017 were used to undertake meteorological attribution analysis. Additionally, variables such as wind speed, pressure, specific humidity, temperature, etc., were used to calculate lake surface evaporation.

2.2.3. Hydrographic Station Data

Annual mean water level data from 1956 to 2020 were measured at the Xiashe Hydrology station [40]. The flow of the Buha River accounts for about 50% of the total inflow of rivers into Qinghai Lake, so the inflow change of the lake is mainly affected by the runoff of the Buha River. The actual inflow of the lake was calculated by the runoff recharge data of the hydrology station in Buha hydrology station from 1956 to 2020.

2.3. Methods

2.3.1. Penman–Monteith Equation

Due to the lack of meteorological observations over the lake surface, CMFD meteorological data and the Penman–Monteith equation were used to calculate the lake surface evaporation (E). Typically, the equation is applied to calculate lake surface evaporation during the non-freezing period of a lake. However, the complete freezing period of Qinghai Lake lasts approximately 80 days, and during this time, it is possible to consider it as a freezing period for calculating lake surface evaporation. The Penman–Monteith equation is as follows:
E = Δ Δ + γ ( R n G ) λ + γ Δ + γ E a
where E is the daily evaporation (mm d−1), Δ is the slope of the saturated vapor pressure curve at a given air temperature (kPa °C−1) and γ is the psychrometric constant (kPa °C−1). R n is the net daily radiation at the lake surface (MJ m−2 d−1). G is the daily change in lake water heat storage (MJ m−2 d−1). E a is the evaporative component due to turbulent transport of water vapor by an eddy diffusion process. Detailed equations for calculating R n , G , E a , etc., can be found in another piece of research [41].

2.3.2. Water Balance Equation

According to the water balance relationship, the following equation between water level changes ( Δ H ) and the four variables affecting water balance can be established:
Δ H = P + R s / S E + R g / S
Δ H > 0 represents that the water level is rising, and vice versa represents that the water level is falling. P is the lake surface precipitation, R s is the recharge of surface water into the lake, E is the lake surface evaporation, R g is the recharge of groundwater into the lake, and S signifies the lake surface area. Since observing groundwater runoff into lakes directly is difficult, only the contributions of P, R s and E were considered in the study [2]. For the convenience of calculation, R s is used in the following text to represents R s / S , so that the units of all variables in the two sections of the equation are unified in m or mm.

2.3.3. Mann-Kendall Test Method

The Mann-Kendall (M-K) test method was used to determine whether the time series has a monotonic increased or decreased trend. The details calculated equation can be found in the reference [19]. This method is a non-parametric test closely related to the concept of Kendall’s correlation coefficient. It is widely used for trend analysis, such as the significance of trends in meteorological time series.

2.3.4. Sen’s Slope Analysis

Sen’s slope is a nonparametric medianbased slope estimator, the analysis was used to calculate the difference in climate change trends before and after the change point. It is suitable for trend analysis under nonnormal distribution conditions, which can reduce the influence of data error and outliers [42]. For the set of pairs ( A i , A j ), A i is a time series, the slope is defined as follows:
S = Median { A i A j i j }   i < j  
where S is the trend of climate elements. The negative value indicates a decreasing trend, the positive value indicates an increasing trend, and the absolute value of the slope represents the amplitude of change over the study period.

2.3.5. Ridge Regression

Ridge regression is an improved least square method and a biased estimation method for collinear data analysis. Ridge regression was used to establish the regression equation between water level and its influencing factors, so as to quantify the quantitative contribution of each factor to the water level change. The ridge regression equation is as follows:
Y = β X + ε
where Y is the dependent variable, X is the independent variable, β is the regression coefficient and ε is the error. Ridge regression parameter estimation equation is as follows:
β ^ ( K ) = ( X T X + KI ) 1 X T Y
where β ^ ( K ) is the ridge regression estimate of the regression coefficient, K is the ridge parameter and I is the element matrix [24,43].
The standardized ridge regression equation is further established:
Δ H = a 1 P + b 1 R s + c 1 E
Δ H = a 2 WS + b 2 SR + c 2 P + d 2 LR + e 2 SH
where a 1 ~ e 2 are the standardized regression coefficients of the regression equation. P is the lake surface precipitation, R s is the runoff into the lake and E is the lake surface evaporation. WS is the wind speed, SR and LR are downward shortwave and longwave radiation and SH is the specific humidity.
According to the standardized coefficient of ridge regression, the contribution rate of each factor to the water level change can be obtained:
α P 1 = | a 1 | | a 1 | + | b 1 | + | c 1 |
α R s = | b 1 | | a 1 | + | b 1 | + | c 1 |
α E = | c 1 | | a 1 | + | b 1 | + | c 1 |
α WS = | a 2 | | a 2 | + | b 2 | + | c 2 | + | d 2 | + | e 2 |
α SR = | b 2 | | a 2 | + | b 2 | + | c 2 | + | d 2 | + | e 2 |
α P 2 = | c 2 | | a 2 | + | b 2 | + | c 2 | + | d 2 | + | e 2 |
α LR = | d 2 | | a 2 | + | b 2 | + | c 2 | + | d 2 | + | e 2 |
α SH = | e 2 | | a 2 | + | b 2 | + | c 2 | + | d 2 | + | e 2 |
where α * (* represents seven factors) is the contribution rate of factor * to the water level change. α P 1 and α P 2 are to distinguish the contribution rate of precipitation in the two groups of variables, respectively.

2.3.6. Correlation Analysis

The correlation analysis of the water level and each influencing factor was carried out separately, so as to reveal the influence of each factor on the water level. The correlation coefficient is calculated as follows:
R = i = 1 n ( x i x ¯ ) ( y i y ¯ ) i = 1 n ( x i x ¯ ) 2 i = 1 n ( y i y ¯ ) 2
where R is the correlation coefficient between the variables x and y , x i is the water level of year i , x ¯ is the average water level of all years, y i is an influence factor of year i and y ¯ is the average multi-year value of an influence factor. 0 < R < 1 indicates a positive correlation between x and y , while −1 < R < 0 indicates a negative correlation between x and y [44].

3. Results and Discussions

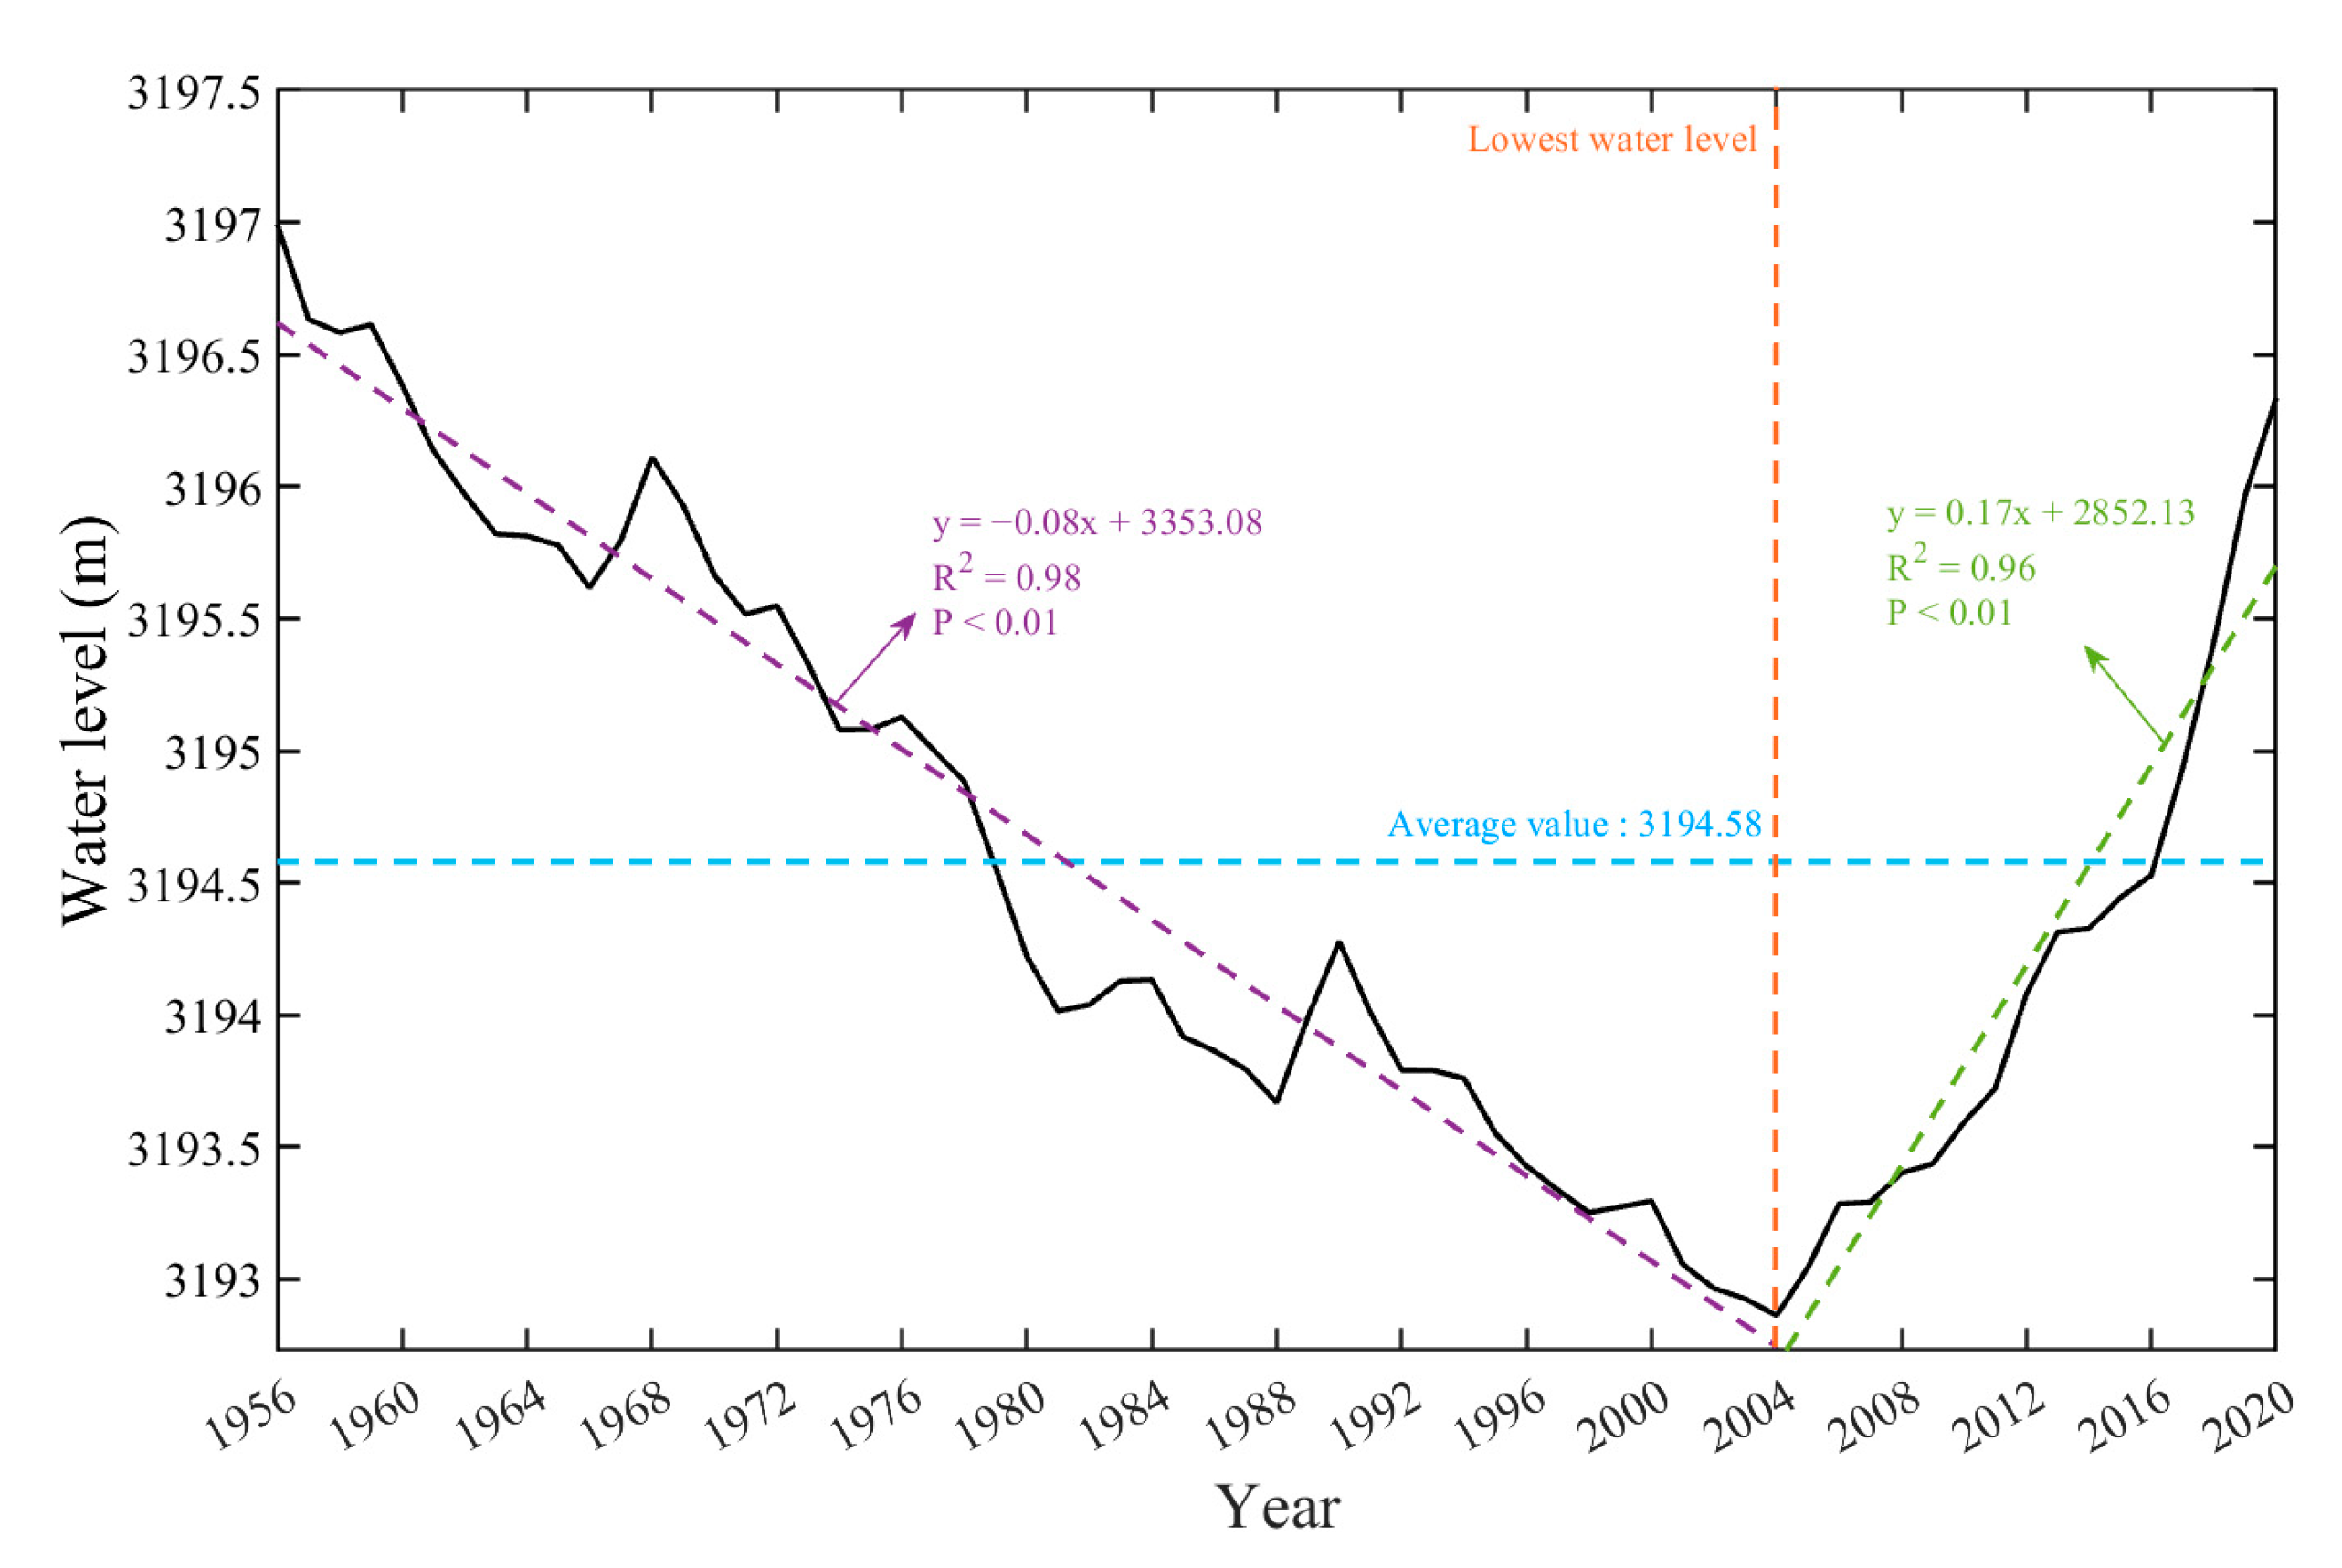
3.1. Interannual Variation Characteristics of Water Level in Qinghai Lake

The multi-year average measured water level of Qinghai Lake is 3194.58 m. From 1956 to 2020, there were significant variations in the water level of Qinghai Lake (Figure 2), showing a trend of initial decrease followed by subsequent increase during the entire study period. From 1956 to 2004, the annual average water level of the lake exhibited a significant decreasing trend with a rate of 0.8 m decade−1. The difference between the highest (3196.99 m in 1956) and lowest (3192.86 m in 2004) lake levels was 4.13 m. The periods of the 1970s and 1990s experienced the most rapid decline in water level, with an annual average decrease exceeding 0.1 m. From 2004 to 2020, the lake water level increased at a rate of 1.7 m decade−1, and the rate of rise was significantly higher than the rate of decline during the period from 1956 to 2004. In recent years, the water level has risen sharply, especially in 2018 and 2019, with increases of 0.47 m and 0.55 m, respectively. By 2020, the lake water level had risen to 3196.34 m, which was 3.48 m higher than that in 2004, reaching the level seen in the early 1960s.

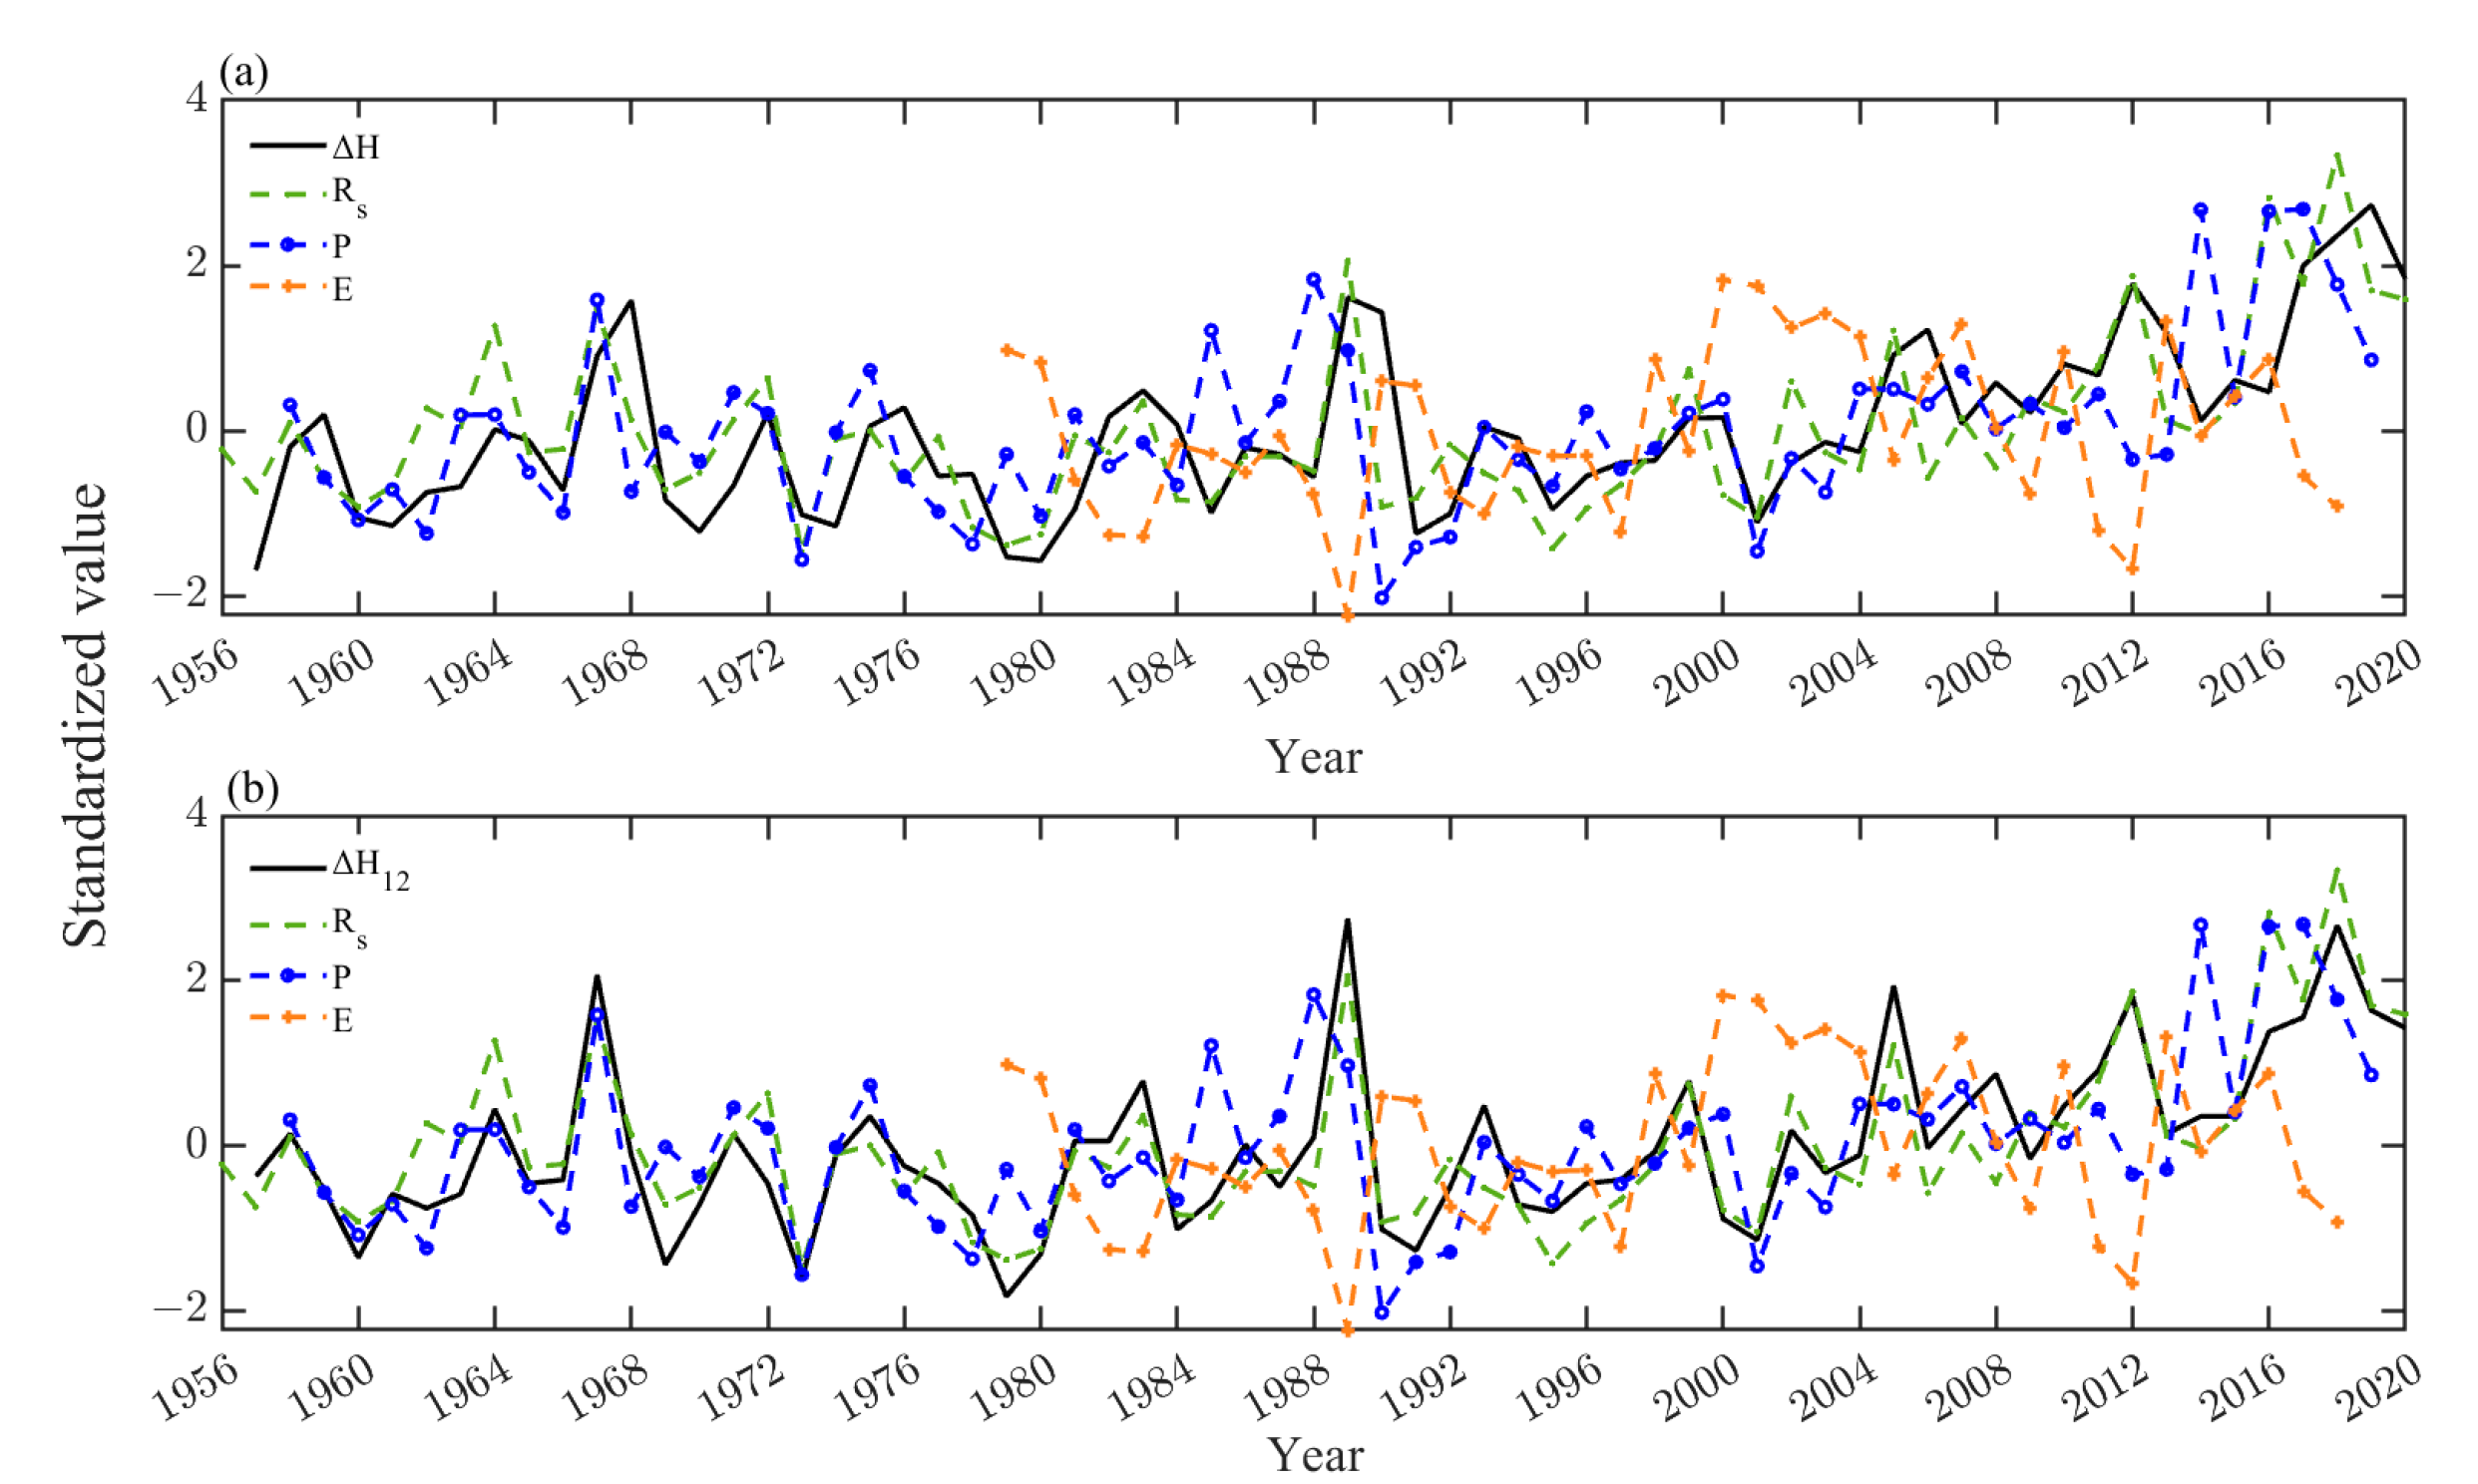
3.2. Variations in Annual Water Level Difference in Qinghai Lake

The difference in the water level of Qinghai Lake is primarily influenced by the combined effects of inflow runoff ( R s ), lake surface precipitation (P) and lake surface evaporation (E) [45]. Among these, R s constitutes the main input to the lake water and accounts for approximately 43.5% of the lake’s water supply, significantly impacting the water level variations [2,19]. According to the findings of Li et al. (2005), the R s from the previous year has a greater influence on the current year’s lake water level than the R s of the current year [46]. The annual water level fluctuations show a lagged response of one year to the fluctuations in annual runoff. Extending their research series to cover the years 1956 to 2020 (Figure 3a), we observed that there were 45 years in which water level changes lagged behind runoff changes by one year, accounting for approximately 69% of the total years, such as the years 1967 to 1968 and 2019 to 2020. Additionally, during years with a higher R s , a more noticeable water level rise was evident. For instance, in 1989, when the Buha River runoff was 61.77 m3 s−1, the water level rose by 0.32 m in the same year. Similarly, in 2012, with the Buha River runoff at 58.76 m3 s−1, the water level rose by 0.36 m in the same year. Conversely, during years with a lower runoff, the water level experienced a significant decline, such as in 1995 and 2001. There were 17 years when these water level differences synchronized with runoff changes, constituting approximately 26% of the total years.
The response of the water level to P also exhibits a similar lagged phenomenon (Figure 3a), where the water level difference in 1989 lagged behind the P of the previous year. Some researchers have also indicated through their studies that the water level difference at Qinghai Lake lags behind changes in precipitation by one year [37,47]. From a comprehensive perspective, the influence of last year’s P on the water level difference is not as significant as the impact of R s . The lagged relationship between E and the water level difference appears to be less apparent (Figure 3a). However, Li et al. (2005) calculated lake surface evaporation using observational data and found that the influence of last year’s E on the current year’s lake water level is also notably greater than the impact of the current year’s E.

3.3. Characteristics of Fixed-Month Water Level Difference at Qinghai Lake

The multi-year average monthly water level, inflow runoff ( R s ), lake surface precipitation (P) and lake surface evaporation (E) from 1956 to 2020 are shown in Figure 4. The lake surface freezes from January to April, with a relatively small R s and P, resulting in a nearly balanced water budget and insignificant water level changes. From May to September, R s and P increase significantly, leading to a more pronounced rise in the lake water level. The majority of the annual runoff and precipitation occur during the summer months, with June to September contributing 83.14% and 82.23% of the total annual R s and P, respectively, and the water level peaks in September. From October to December, although E decreases continuously, the reduction in the lake water supply component ( R s + P) leads to a decreasing trend in water level.
In summary, when the monthly average components of the water balance equation change, the lake water level responds rapidly. This might seem contradictory to the lagged response phenomenon described in Section 3.2. However, this is not the case. Previous studies calculating lake water level changes have often used annual mean water levels, which incorporate a lot of hydro-meteorological information from the previous year, leading to the observed water level lagging behind hydro-meteorological factors in many years. To better reflect that the main influence on Qinghai Lake water level changes is from contemporaneous hydro-meteorological factors, this study adopts a fixed-month water level difference. Specifically, it defines the average water level difference between x month of two consecutive years as Δ H x . Since most hydrological information occurs during the summer, the analysis focuses on x = 9, 10, 11 and 12, representing September, October, November and December, respectively. For example, Δ H 12 in 2020 represents the average water level in December 2020 minus the average water level in December 2019.
The correlations between Δ H 9 to Δ H 12 and the annual average inflow runoff, lake surface precipitation and lake surface evaporation of Qinghai Lake are analyzed and presented in Table 1. The results indicate that the water level differences at Qinghai Lake have significantly higher correlations with the respective factors of the current year compared to the previous year. This suggests that the fixed-month water level difference can effectively remove the interference from the previous year’s data. Additionally, under the significance level α = 0.01, the correlation coefficients among Δ H 9 , Δ H 10 , Δ H 11 and Δ H 12 are all greater than 0.90, and the root mean square errors are all less than 0.1 m. In the subsequent attribution analysis of Qinghai Lake’s water level changes, it is theoretically more effective to use the water level difference ( Δ H 12 ) concurrent with the influencing factors as the dependent variable. Therefore, this study utilizes Δ H 12 for further research. The standardized water level difference ( Δ H 12 ) and the variations in annual average inflow runoff, lake surface precipitation and lake surface evaporation are depicted in Figure 3b, indicating a good synchronous variation pattern between Δ H 12 and each influencing factor.

3.4. Influence of Water Balance Components on Water Level of Qinghai Lake

The trend of the Qinghai Lake water level showed a significant inflection in 2004. Table 2 presents the multi-year average values of lake surface precipitation (P), inflow runoff ( R s ) and lake surface evaporation (E) in two periods, along with their average changes between the phases. During 1979 to 2004, the average P, R s and E were 379.8 mm, 340 mm and 904.9 mm, respectively. Based on the lake water income term (P + R s ), P, R s and E account for 52.8%, 47.2% and 125.7% of the water income, respectively. The water balance equation resulted in an expenditure exceeding the income by 185.1 mm, leading to a water level decline of 1.70 m. In the period of 2004 to 2018, the average P, R s and E were 449.3 mm, 610 mm and 907.8 mm, respectively, accounting for 42.4%, 57.6% and 85.7% of the water income. The income exceeded the expenditure by 151.5 mm, resulting in a water level rise of 2.55 m.
During these two periods, the average P, R s and E increased by 69.5 mm, 270 mm and 2.9 mm, respectively. Despite a slight increase in evaporation, the increase in P and R s was significantly larger. The rise in P and R s after 2004 is the main reason for the continued increase in the Qinghai Lake water level.

3.5. Contributions of Water Balance Components to the Interannual Evolution of Qinghai Lake Water Level

Considering the potential presence of multicollinearity among variables, correlation tests were performed on the independent variables before quantitatively calculating their contributions to the variation in the Qinghai Lake water level. The correlation coefficients between R s and P, as well as R s and E, are 0.57 and −0.34, reaching significance levels of 0.01 and 0.05, respectively, indicating evident interrelationships among the variables.
To address the multicollinearity, ridge regression analysis, a biased estimation method used for collinear data analysis and an improved version of the least squares method, is employed. In this study, ridge regression was used to establish the regression equation between the water level difference at Qinghai Lake and influencing factors, allowing for the quantitative calculation of their contributions to the water level changes. During the study period, when the ridge parameter K was set to 1.396, the relative error between the simulated and observed water level difference reached a minimum value of 0.935, and the correlation coefficient of the regression equation was 0.924 (Figure 5). These results indicate a good fit of the water level model, and the ridge regression coefficients of the variables were relatively stable. Therefore, the ridge parameter was chosen as 1.396, and a standardized ridge regression equation, as shown in Equation (6), was established. In this equation, a, b and c represent the absolute values of standardized regression coefficients and are 0.03, 0.18 and 0.05, respectively.
Based on the regression in Equation (6), the water level differences from 1979 to 2018 were fitted, and the correlation coefficient between the observed and simulated water level difference in Qinghai Lake was 0.92. The significance test at the 0.01 confidence level was passed, indicating that the ridge regression method effectively simulated the lake water level changes (Figure 6).
Using Equations (8)–(10), the contributions of lake surface precipitation (P), inflow runoff ( R s ) and lake surface evaporation (E) to the water level difference were calculated. The factors influencing the Qinghai Lake water level were ranked in terms of contribution percentage as follows: R s (70%) > E (20%) > P (10%).

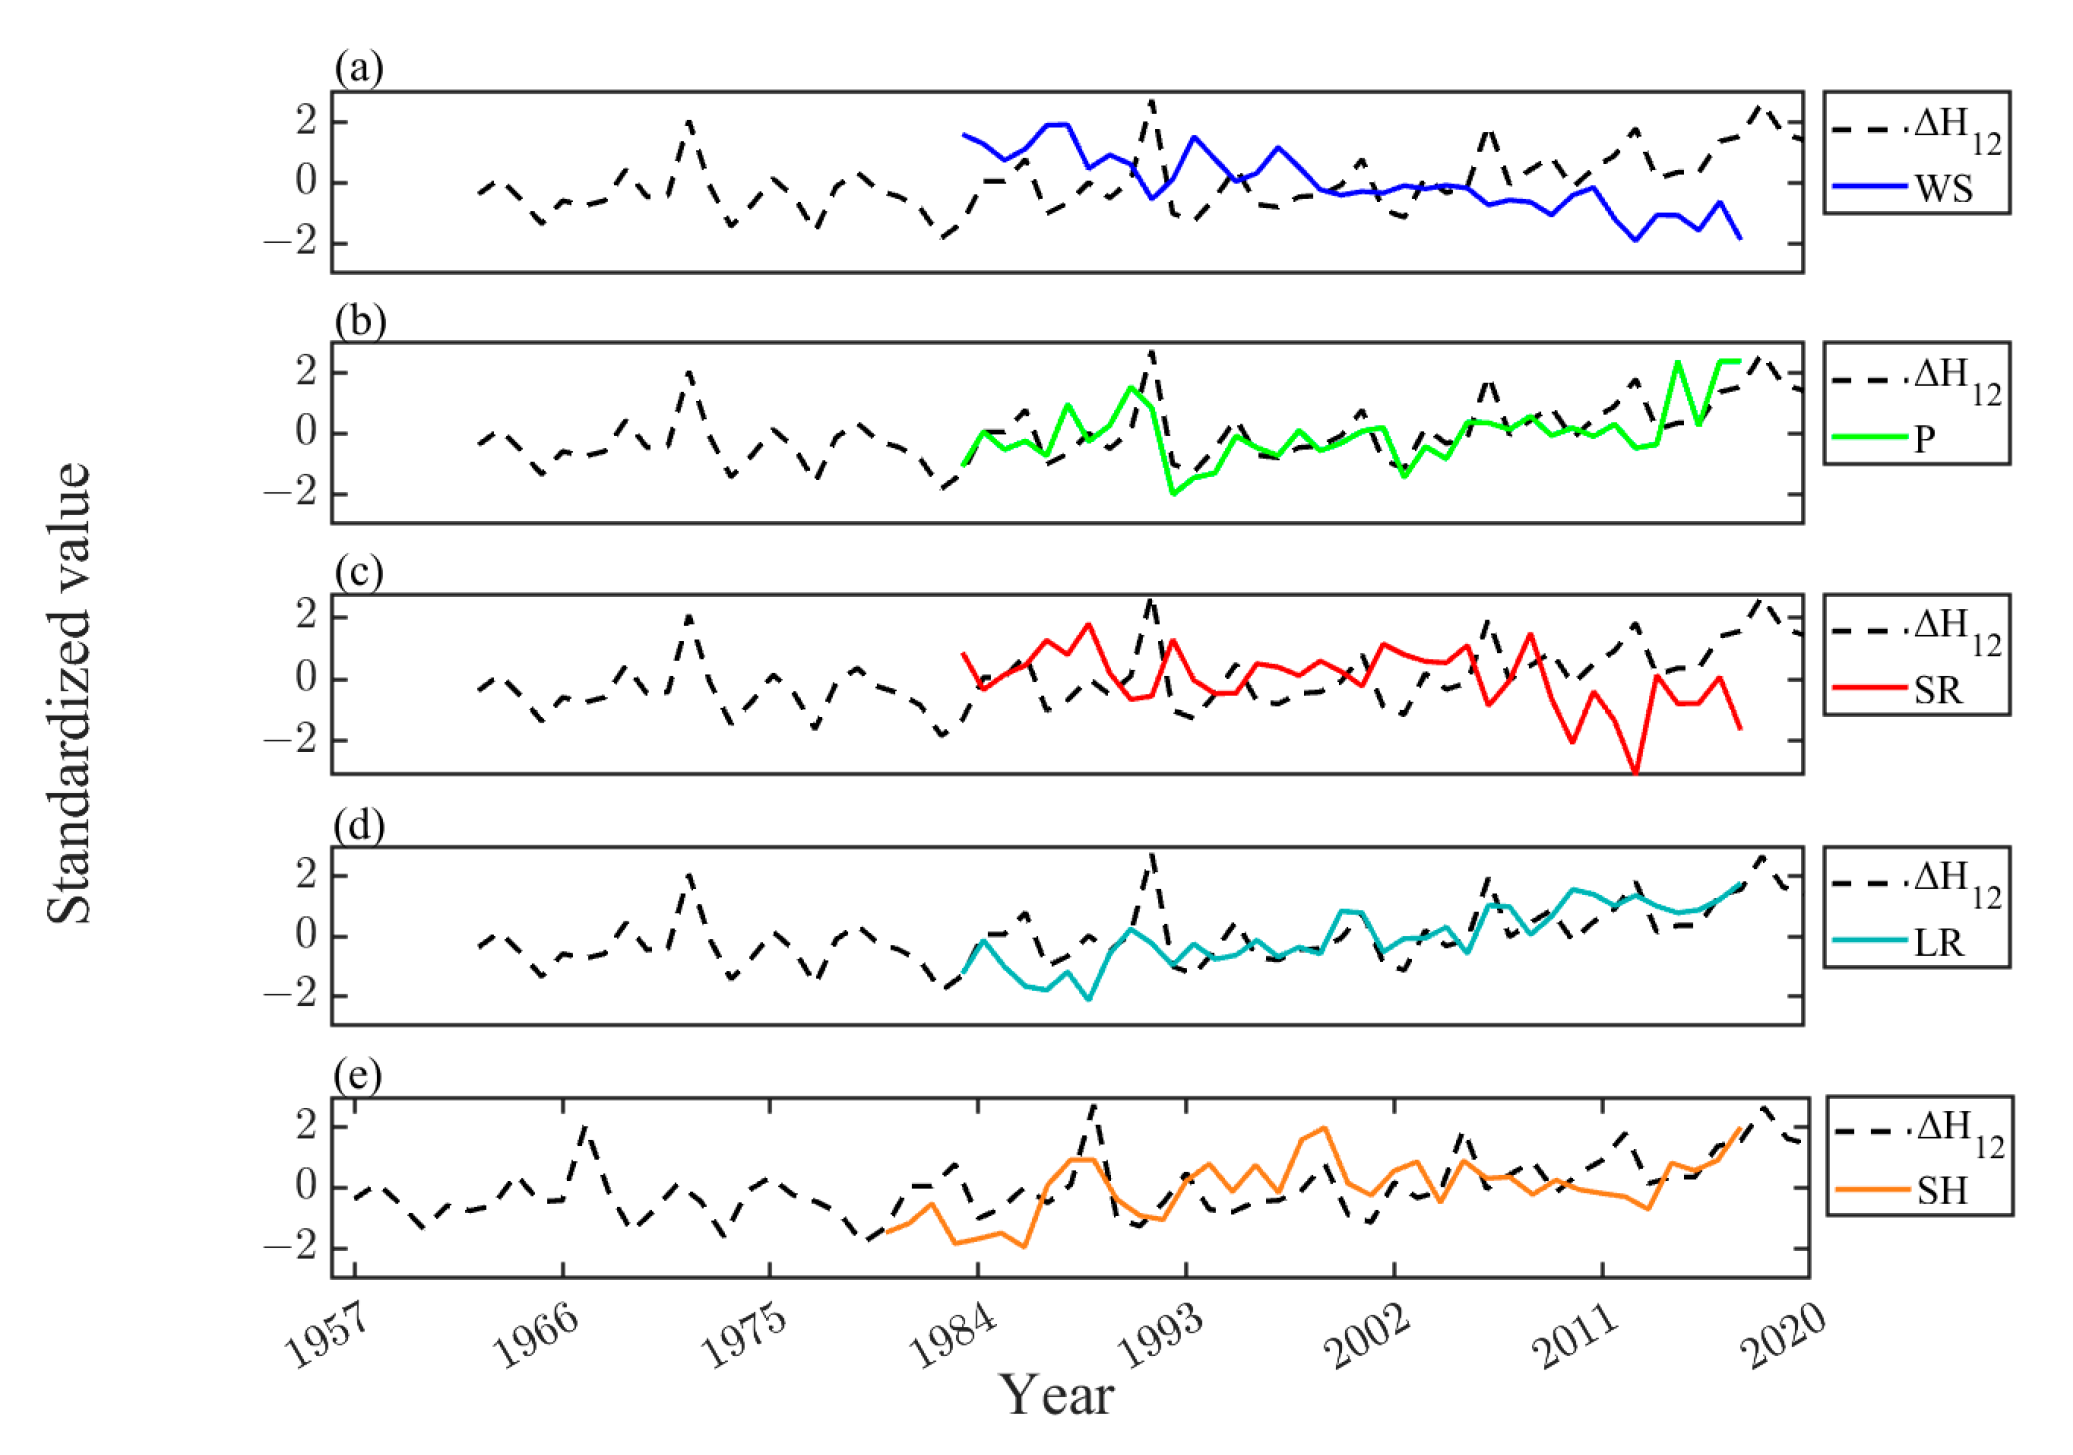
3.6. Contributions of Meteorological Variables to the Interannual Evolution of Qinghai Lake Water Level

The correlation results (Table 3) between Δ H 12 and the concurrent meteorological variables (wind speed, air temperature, specific humidity, air pressure, downward shortwave radiation, downward longwave radiation and precipitation) indicate that the meteorological factors related to the water level difference of Qinghai Lake are ranked in terms of their correlation strength as follows: wind speed (WS), shortwave radiation (SR), precipitation (P), longwave radiation (LR), specific humidity (SH), air temperature (AT) and air pressure (AP). It should be noted that air temperature and air pressure did not pass the significance test, which is consistent with the research findings indicating no significant relationship between temperature and lake volume changes in the Qinghai Lake basin [48].
The factors other than air temperature and air pressure were identified as the main influence factors of Qinghai Lake water level changes, and their multi-year variations are shown in Figure 6. The multi-year average wind speed was 3.32 m s−1, with minimum and maximum annual wind speeds of 2.71 m s−1 (in 2012) and 3.94 m s−1 (in 1985), respectively. The annual average wind speed showed a significant decrease at a rate of 0.025 m (s · a)−1 (Figure 6a). The annual average precipitation was 402.6 mm, with the lowest and highest annual precipitation values being 260.5 mm (in 1990) and 572.3 mm (in 2017), respectively. The growth rate of annual average precipitation was 2.6 mm a−1 (Figure 6b). The annual average downward shortwave radiation was 206.8 W m 2 , with a reduction rate of −0.23 W ( m 2 · a)−1 (Figure 6c), while the annual average downward longwave radiation was 237.3 W m 2 , with an increase rate of 0.30 W ( m 2 · a)−1 (Figure 6d). The annual average specific humidity was 0.31 g g−1, with minimum and maximum annual specific humidity values of 0.28 g g−1 (in 1986) and 0.34 g g−1 (in 2017) (Figure 6e). These meteorological factors can directly or indirectly influence lake water level changes. For example, an increase in precipitation directly affects the water level rise, while the decrease in average wind speed and downward shortwave radiation indirectly impacts the water level rise by reducing lake surface evaporation.
Figure 6. Standardized Δ H 12 and contemporaneous meteorological variables.
Water 15 03614 g006
According to Equation (7), a2, b2, c2, d2 and e2 represent the absolute values of the standardized regression coefficients, which are 0.082, 0.069, 0.068, 0.029 and 0.004, respectively.
The Qinghai Lake water level difference changes were fitted using the regression equation, and the correlation coefficient between the observed and simulated values was found to be 0.77, passing the significance test at a confidence level of 0.01. Using Equations (11)–(15), the contribution rates of various meteorological factors to the changes in the Qinghai Lake water level difference can be calculated (Table 3), which are ranked as: WS (33%) > SR (27%) = P (27%) > LR (11%) > SH (2%).

3.7. Discussions

The limitations of this study and future efforts are as follows:
(1) In this study, the meteorological observation data (such as precipitation) used were obtained from the Gangcha Meteorological Station. Despite being the nearest national reference station to Qinghai Lake, using a single station to represent Qinghai Lake may introduce some degree of error. In future research, selecting the regional average results from multiple meteorological stations near Qinghai Lake may yield a more accurate representation of the lake’s meteorological conditions.
(2) Due to the focus on long-term time series data in this study, underground water data are relatively scarce. Therefore, in the water balance equation, we have omitted the underground water inflow term. However, research by other scholars has indicated that, during the period from 1956 to 2017, the contribution of underground water inflow to the total water supply to Qinghai Lake accounted for approximately 16.2%. Hence, neglecting the impact of this component on the lake’s water level appears to be unwise. In future work, we will conduct an in-depth investigation into underground water data and quantitatively calculate its contribution to the changes in Qinghai Lake’s water level.

4. Conclusions

This study is based on meteorological and hydrological data to investigate the long-term variation trend of the Qinghai Lake water level and analyze the impacts of inflow runoff ( R s ), lake surface precipitation (P) and lake surface evaporation (E) on the annual average and within-year water level variations. The variations in water level difference based on the fixed month of each year are synchronous with the changes in different components of the water balance. Finally, ridge regression analysis is employed, quantitatively calculating the contributions rate of water balance components and meteorological variables to water level changes. The main conclusions are as follows:
(1) The annual average water level of Qinghai Lake shows clear periodic changes: From 1956 to 2004, it decreased at a rate of 0.8 m decade−1, mainly due to the lake’s evaporation exceeding the combined precipitation and inflow runoff. After 2004, the water level increased at a rate of 1.7 m decade−1, primarily driven by the increase in lake surface precipitation and inflow runoff.
(2) The calculation of water level difference based on the annual average includes hydro-meteorological information from the previous year, resulting in a lag of 1 year between the water level difference and hydro-meteorological factors in 45 out of the total 69% of the study years. However, when calculating water level difference based on fixed months, the variations are synchronous with changes in R s , P and E.
(3) By employing ridge regression analysis, from 1979 to 2018, the contribution rates of R s , P and E to the water level difference changes based on the fixed month of December are 70%, 20% and 10%, respectively. The contribution rates of various meteorological factors are ranked as follows: WS (33%) > SR (27%) = P (27%) > LR (11%) > SH (2%).

Author Contributions

Conceptualization, methodology and funding acquisition, L.W. Data curation, J.Z. and L.S. Writing and editing, J.Z. and M.W. Graphic rendering, J.Z. and M.W. Investigation, J.Z., M.W. and L.Y. Review, L.W. and X.L. All authors have read and agreed to the published version of the manuscript.

Funding

This research was jointly funded by the National Natural Science Foundation of China (Grant No. 42275044), the CAS “Light of West China” program (Grant No. E129030101), and the Science and technology Research and Development Program of China National Railway Group (Grant No. P2021G047).

Data Availability Statement

Publicly available datasets were analyzed in the study. The Gangcha meteorological station data can be found in website: http://data.cma.cn/. The hydrologic data can be found in website: https://data.tpdc.ac.cn/zh-hans/data/12cb9320-e6ba-4938-a9ac-5b0ebb656825. The CMFD meteorological data can be found in website: http://poles.tpdc.ac.cn/en/data/8028b944-daaa-4511-8769-965612652c49/.

Acknowledgments

We would like to express our gratitude to the researcher Guoqing Zhang for providing the water level and runoff data.

Conflicts of Interest

The authors declare no conflict of interest.

References

  1. Zhang, Z.; Chang, J.; Xu, C.Y.; Zhou, Y.; Wu, Y.; Chen, X.; Jiang, S.; Duan, Z. The response of lake area and vegetation cover variations to climate change over the Qinghai-Tibetan Plateau during the past 30 years. Sci. Total Environ. 2018, 635, 443–451. [Google Scholar] [CrossRef] [PubMed]
  2. Du, J.; Li, Q.; Liu, X.; Wen, D. Hydrological characteristics of Qinghai Lake, 1956–2017. J. Hydrol. 2020, 41, 27–33. [Google Scholar] [CrossRef]
  3. Yang, K.; Ye, B.; Zhou, D.; Wu, B.; Foken, T.; Qin, J.; Zhou, Z. Response of hydrological cycle to recent climate changes in the Tibetan Plateau. Clim. Chang. 2011, 109, 517–534. [Google Scholar] [CrossRef]
  4. Kuang, X.; Jiao, J.J. Review on climate change on the Tibetan Plateau during the last half century. J. Geophys. Res. Atmos. 2016, 121, 3979–4007. [Google Scholar] [CrossRef]
  5. Duan, A.M.; Xiao, Z.X. Does the climate warming hiatus exist over the Tibetan Plateau? Sci. Rep. 2015, 5, 13711. [Google Scholar] [CrossRef] [PubMed]
  6. Yao, T.; Thompson, L.; Yang, W.; Yu, W.; Gao, Y.; Guo, X.; Yang, X.; Duan, K.; Zhao, H.; Xu, B.; et al. Different glacier status with atmospheric circulations in Tibetan Plateau and surroundings. Nat. Clim. Chang. 2012, 2, 663–667. [Google Scholar] [CrossRef]
  7. Long, D.; Li, X.; Li, X.; Han, P.; Zhao, F.; Hong, Z.; Wang, Y.; Tian, F. Remote sensing retrieval of water storage changes and underlying climatic mechanisms over the Tibetan Plateau during 2000—2020. Adv. Water Sci. 2022, 33, 375–389. [Google Scholar] [CrossRef]
  8. Zhang, G.; Yao, T.; Xie, H.; Kang, S.; Lei, Y. Increased mass over the Tibetan Plateau: From lakes or glaciers? Geophys. Res. Lett. 2013, 40, 2125–2130. [Google Scholar] [CrossRef]
  9. Jiang, B.; Zhang, L.; Ouyang, Z. Ecosystem services valuation of Qinghai Lake. Ying Yong Sheng Tai Xue Bao 2015, 26, 3137–3144. [Google Scholar] [CrossRef]
  10. Han, Y.; Yu, D.; Chen, K.; Yang, H. Spatial distribution characteristics of temperature and precipitation trend in Qinghai Lake Basin from 2000 to 2018. Arid Land Geogr. 2022, 45, 999–1009. [Google Scholar]
  11. Dai, Y.; Wang, X.; Ma, G.; Hou, Y.; Li, D. Diversity characteristics of waterfowl community in Qinghai Lake National Nature Reserve. For. Ecol. Manag. 2018, 02, 74–80. [Google Scholar] [CrossRef]
  12. Sun, Y.; Li, Q.; Liu, T.; Li, Y.; Yang, Y. Analysis of Qinghai Lake’s water level changes and water balance analysis from 1956 to 2019. J. China Hydrol. 2021, 41, 91–96. [Google Scholar] [CrossRef]
  13. Zhou, D.; Zhang, J.; Luo, J.; Guo, G.; Li, B. Analysis on the causes of Qinghai Lake water level changes and prediction of its future trends. Ecol. Environ. Sci. 2021, 30, 1482–1491. [Google Scholar] [CrossRef]
  14. Zhao, L.; Simon Wang, S.Y.; Meyer, J. Interdecadal climate variations controlling the water level of Lake Qinghai over the Tibetan Plateau. J. Hydrometeorol. 2017, 18, 3013–3025. [Google Scholar] [CrossRef]
  15. Li, L.; Shen, H.; Liu, C.; Jiao, R. Response of water level fluctuation to climate warming and wetting scenarios and its mechanism on Qinghai Lake. Clim. Chang. Res. 2020, 16, 600–608. [Google Scholar] [CrossRef]
  16. Yang, X.; Zhang, G.; Jia, Z.; Song, X.; Wang, x. Study on the shoreline evolution of Qinghai Lake and its socioeconomic impact under the Background of global climate change. Plateau Sci. Res. 2021, 5, 1–10. [Google Scholar] [CrossRef]
  17. Wang, L.; Mao, X.; Song, X.; Tang, W.; Wang, W.; Yu, H.; Deng, Y.; Zhang, Z.; Zhang, Z.; Zhou, H. How rising water levels altered ecosystem provisioning services of the area around Qinghai Lake from 2000 to 2020: An InVEST-RF-GTWR combined method. Land 2022, 11, 1570. [Google Scholar] [CrossRef]
  18. Hao, M.; Zhu, H.; Xiong, X.; He, Y.; Ao, H.; Yu, G.; Wu, C.; Liu, G.; Luo, Z.; Liu, J.; et al. Analysis on the distribution and origin of cladophora in the nearshore water of Qinghai Lake. Acta Hydrobiol. Sin. 2020, 44, 1152–1158. [Google Scholar]
  19. Hou, P.; Weidman, R.P.; Liu, Q.; Li, H.; Duan, L.; Zhang, X.; Liu, F.; Gao, Y.; Xu, J.; Li, H.; et al. Recent water-level fluctuations, future trends and their eco-environmental impacts on Lake Qinghai. J. Environ. Manag. 2023, 333, 117461. [Google Scholar] [CrossRef]
  20. Coe, M.T.; Birkett, C.M. Calculation of river discharge and prediction of lake height from satellite radar altimetry: Example for the Lake Chad basin. Water Resour. Res. 2004, 40, W10205.1–W10205.11. [Google Scholar] [CrossRef]
  21. Coe, M.T.; Foley, J.A. Human and natural impacts on the water resources of the Lake Chad basin. J. Geophys. Res. Atmos. 2001, 106, 3349–3356. [Google Scholar] [CrossRef]
  22. Foroumandi, E.; Nourani, V.; Kantoush, S.A. Investigating the main reasons for the tragedy of large saline lakes: Drought, climate change, or anthropogenic activities? A call to action. J. Arid Environ. 2022, 196, 104652. [Google Scholar] [CrossRef]
  23. Yang, G.; Zhang, M.; Xie, Z.; Li, J.; Ma, M.; Lai, P.; Wang, J. Quantifying the Contributions of Climate Change and Human Activities to Water Volume in Lake Qinghai, China. Remote Sens. 2021, 14, 99. [Google Scholar] [CrossRef]
  24. Wang, X.; Gao, B. Study on the change of water balance and its influence on lake level in Qinghai Lake. J. Hydroelectr. Eng. 2021, 40, 60–70. [Google Scholar] [CrossRef]
  25. Chang, B.; He, K.-N.; Li, R.-J.; Sheng, Z.-P.; Wang, H. Linkage of climatic factors and human activities with water level fluctuations in Qinghai Lake in the northeastern Tibetan Plateau, China. Water 2017, 9, 552. [Google Scholar] [CrossRef]
  26. Cui, B.L.; Li, X.Y. Stable isotopes reveal sources of precipitation in the Qinghai Lake Basin of the northeastern Tibetan Plateau. Sci. Total Environ. 2015, 527–528, 26–37. [Google Scholar] [CrossRef] [PubMed]
  27. Cui, B.L.; Li, X.Y. The impact of climate changes on water level of Qinghai Lake in China over the past 50 years. Hydrol. Res. 2016, 47, 532–542. [Google Scholar] [CrossRef]
  28. Fang, J.; Li, G.; Rubinato, M.; Ma, G.; Zhou, J.; Jia, G.; Yu, X.; Wang, H. Analysis of long-term water level variations in Qinghai Lake in China. Water 2019, 11, 2136. [Google Scholar] [CrossRef]
  29. Li, X.; Zhang, T.; Yang, D.; Wang, G.; He, Z.; Li, L. Research on lake water level and its response to watershed climate change in Qinghai Lake from 1961 to 2019. Front. Environ. Sci 2023, 11, 1130443. [Google Scholar] [CrossRef]
  30. Zhang, M.; Song, Y.; Dong, H. Hydrological trend of Qinghai Lake over the last 60 years: Driven by climate variations or human activities? J. Water Clim. Chang. 2019, 10, 524–534. [Google Scholar] [CrossRef]
  31. Zhu, H.; Xiong, X.; Ao, H.; Wu, C.; He, Y.; Hu, Z.; Liu, G. Cladophora reblooming after half a century: Effect of climate change-induced increases in the water level of the largest lake in Tibetan Plateau. Environ. Sci. Pollut. Res. 2020, 27, 42175–42181. [Google Scholar] [CrossRef] [PubMed]
  32. Cui, B.L.; Li, X.Y. Characteristics of stable isotopes and hydrochemistry of river water in the Qinghai Lake Basin, northeast Qinghai-Tibet Plateau, China. Environ. Earth 2015, 73, 4251–4263. [Google Scholar] [CrossRef]
  33. Fan, C.; Song, C.; Li, W.; Liu, K.; Cheng, J.; Fu, C.; Chen, T.; Ke, L.; Wang, J. What drives the rapid water-level recovery of the largest lake (Qinghai Lake) of China over the past half century? J. Hydrol. 2021, 593, 125921. [Google Scholar] [CrossRef]
  34. Zhang, G.; Duan, S. Lakes as sentinels of climate change on the Tibetan Plateau. All Earth 2021, 33, 161–165. [Google Scholar] [CrossRef]
  35. Su, D.; Hu, X.; Wen, L.; Lyu, S.; Gao, X.; Zhao, L.; Li, Z.; Du, J.; Kirillin, G. Numerical study on the response of the largest lake in China to climate change. Hydrol. Earth Syst. Sci. 2019, 23, 2093–2109. [Google Scholar] [CrossRef]
  36. Cao, J.; Yao, X.; Jin, H.; Zhang, T.; Gao, Y.; Zhang, D.; Zhao, Q. Spatiotemporal variation of ice thickness of Lake Qinghai derived from field measurements and model simulation. J. Lake Sci. 2021, 33, 607–621. [Google Scholar]
  37. Yi, W.; Li, X.; Cui, B.; Ma, Y. Climate change and impact on water level of the Qinghai Lake watershed. J. Arid Meteorol. 2010, 28, 375–383. [Google Scholar]
  38. He, J.; Yang, K.; Tang, W.; Lu, H.; Qin, J.; Chen, Y.; Li, X. The first high-resolution meteorological forcing dataset for land process studies over China. Sci. Data 2020, 7, 25. [Google Scholar] [CrossRef]
  39. Yang, K.; He, J.; Tang, W.; Qin, J.; Cheng, C.C.K. On downward shortwave and longwave radiations over high altitude regions: Observation and modeling in the Tibetan Plateau. Agric. Meteorol. 2010, 150, 38–46. [Google Scholar] [CrossRef]
  40. Zhang, G. Qinghai Lake Hydrology and Climate Data (1956–2020). 2021. Available online: https://www.tpdc.ac.cn/zh-hans/data/12cb9320-e6ba-4938-a9ac-5b0ebb656825 (accessed on 10 October 2023).
  41. Zhou, J.; Wang, L.; Zhang, Y.; Guo, Y.; Li, X.; Liu, W. Exploring the water storage changes in the largest lake (Selin Co) over the Tibetan Plateau during 2003–2012 from a basin-wide hydrological modeling. Water Resour. Res. 2015, 51, 8060–8086. [Google Scholar] [CrossRef]
  42. Sen, P.K. Estimates of the Regression Coefficient Based on Kendall’s Tau. J. Am. Stat. Assoc. 1968, 63, 1379–1389. [Google Scholar] [CrossRef]
  43. Yang, N. The unique role of ridge regression analysis in solving multicollinearity problems. New Theor. Explor. 2004, 3, 1–2. [Google Scholar] [CrossRef]
  44. Wang, R.; Niu, Z. Characteristics of lake temperature variation and its response to climate change in China. China Environ. Sci. 2020, 40, 780–788. [Google Scholar] [CrossRef]
  45. Li, L.; Shi, X.; Shen, H.; Dai, S.; Xiao, J. Cause of water level fluctuation in Qinghai Lake from 1960 to 2009 and its future trend forecasting. J. Nat. Resour. 2011, 26, 1566–1574. [Google Scholar]
  46. Li, L.; Zhu, X.; Wang, Z.; Wang, Q. Impacting factors and changing tendency of water level in Qinghai Lake in recent 42 years. J. Desert Res. 2005, 25, 689–696. [Google Scholar]
  47. Jin, Z.; Zhang, F.; Wang, H.; Bai, A.; Qiu, X. Analysis of reasons for the continuous rise of Qinghai Lake water level since 2005. J. Environ. Sci. 2013, 4, 1355–1362. [Google Scholar] [CrossRef] [PubMed]
  48. Wang, H.; Qi, Y.; Lian, X.; Zhang, J.; Yang, R.; Zhang, M. Effects of climate change and land use/cover change on the volume of the Qinghai Lake in China. J. Arid. Land 2022, 14, 245–261. [Google Scholar] [CrossRef]
Figure 1. Water system diagram of Qinghai Lake Basin and locations of Qinghai Lake and three stations.
Water 15 03614 g001
Figure 2. Interannual variations in the Qinghai Lake water level from 1956 to 2020.
Water 15 03614 g002
Figure 3. Subfigures (a,b) respectively represent the multi-year variations of the standardized annual water level difference ( Δ H ) and the water level difference calculated based on December ( Δ H 12 ) with the annual mean P, R s   and   E.
Water 15 03614 g003
Figure 4. Multi-year average monthly variations in water level difference (ΔH), P, R s and E of Qinghai Lake.
Water 15 03614 g004
Figure 5. Comparison of the observed and simulated water level difference in Qinghai Lake from 1979 to 2018.
Water 15 03614 g005
Table 1. Correlation between the water level difference ( Δ H 9 ~ Δ H 12 ) and the annual average P, R s and E of both the current year (CY) and the previous year (PY).
Δ H 9 Δ H 10 Δ H 11 Δ H 12
PYCYPYCYPYCYPYCY
  R s 0.453   * * * 0.83   * * * 0.36   * * * 0.89   * * * 0.33   * * * 0.89   * * * 0.34   * * * 0.88   * * *
P 0.55   * * * 0.57   * * * 0.50   * * * 0.63   * * * 0.48   * * * 0.66   * * * 0.49   * * * 0.65   * * *
E−0.16 0.37   * * −0.09 0.49   * * * −0.05 0.50   * * * 0.34   * * * 0.49   * * *
Note: **, correlation is significant at the 0.05 level (2-tailed); ***, correlation is significant at the 0.01 level (2-tailed).
Table 2. Average value and variation in water balance components at different stages (unit: mm).
P R s E P + R s
1979–2004379.8340904.9719.8
2004–2018449.3610907.81059.3
Variation69.52702.9339.6
Table 3. The correlation between Δ H 12 and contemporaneous meteorological variables, and the contribution rate of meteorological variables to the change in water level difference in Qinghai Lake.
VariablesCorrelation CoefficientContribution Rate (%)
WS 0.63   * * * 33
AT 0.24 -
SH 0.41   * * * 2
AP 0.11 -
SR 0.58   * * * 27
LR 0.51   * * * 11
P 0.55   * * * 27
Note: ***, correlation is significant at the 0.01 level (2-tailed).
Disclaimer/Publisher’s Note: The statements, opinions and data contained in all publications are solely those of the individual author(s) and contributor(s) and not of MDPI and/or the editor(s). MDPI and/or the editor(s) disclaim responsibility for any injury to people or property resulting from any ideas, methods, instructions or products referred to in the content.

