
Combination of Measures to Restore Eutrophic Urban Ponds in The Netherlands


Abstract
:1. Introduction
2. Materials and Methods
2.1. Study Sites
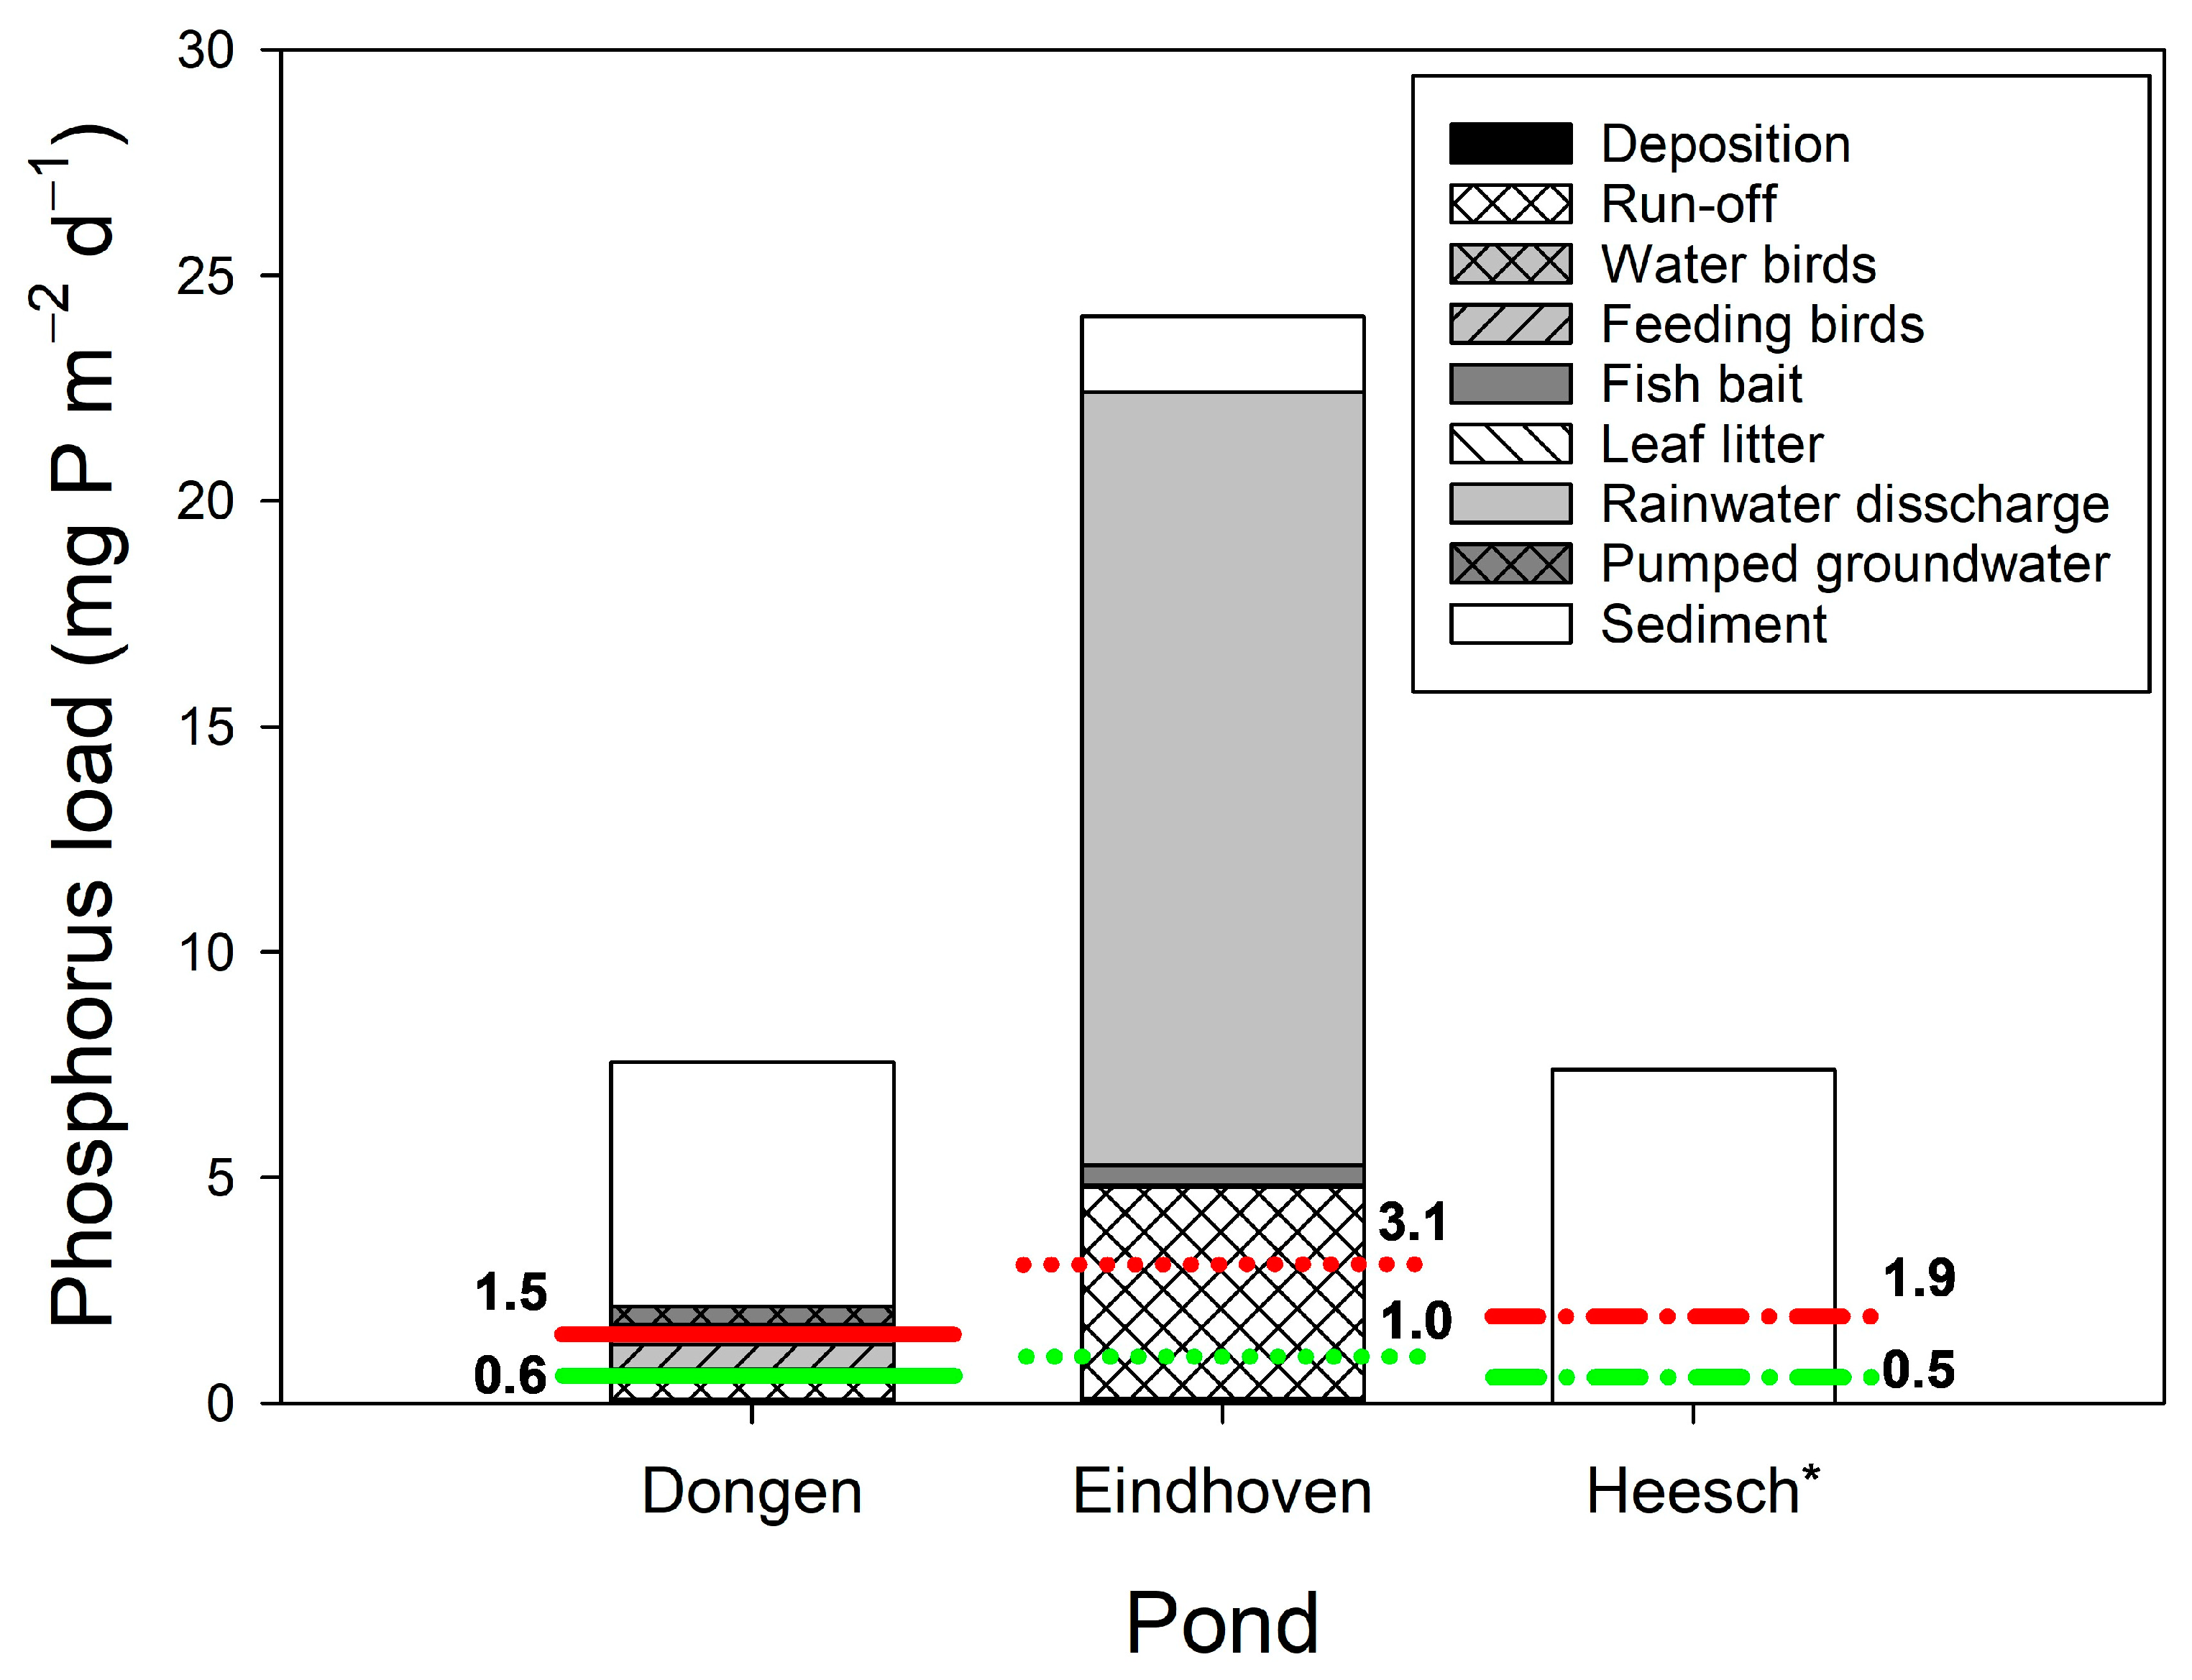
2.2. System Analysis
2.3. Mitigating Measures
2.4. Water Quality Sampling and Analysis
3. Results
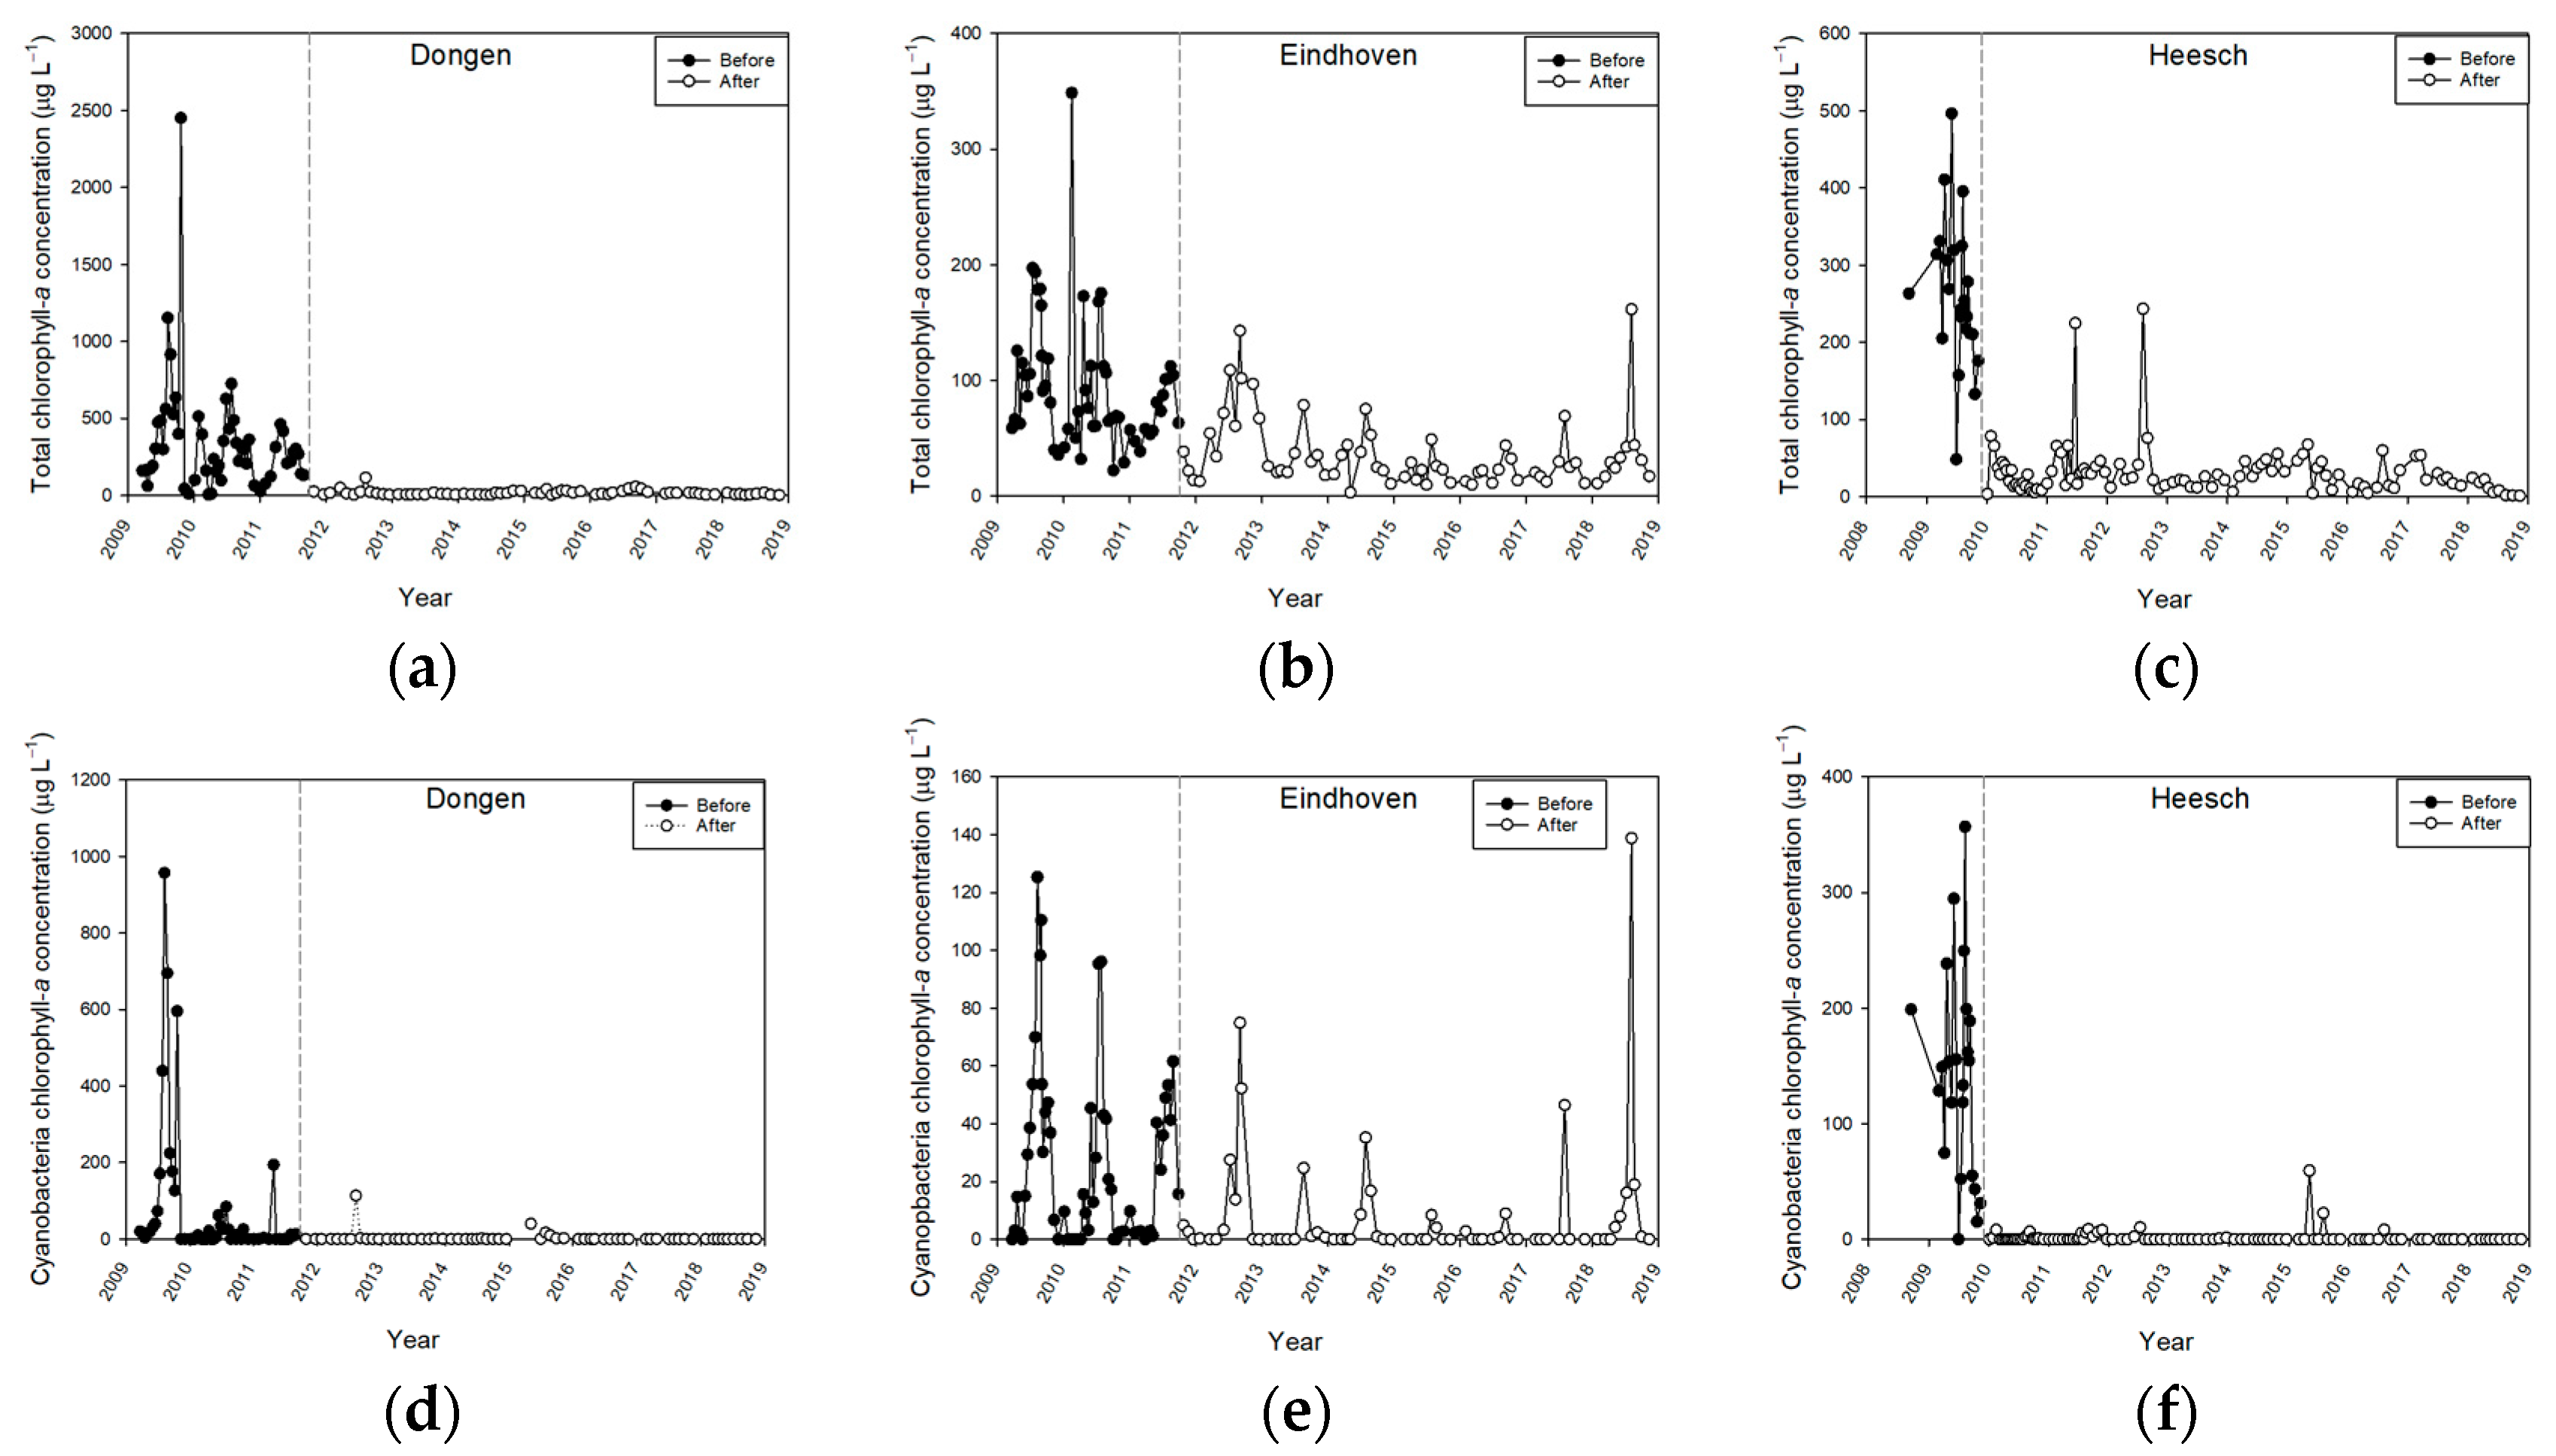
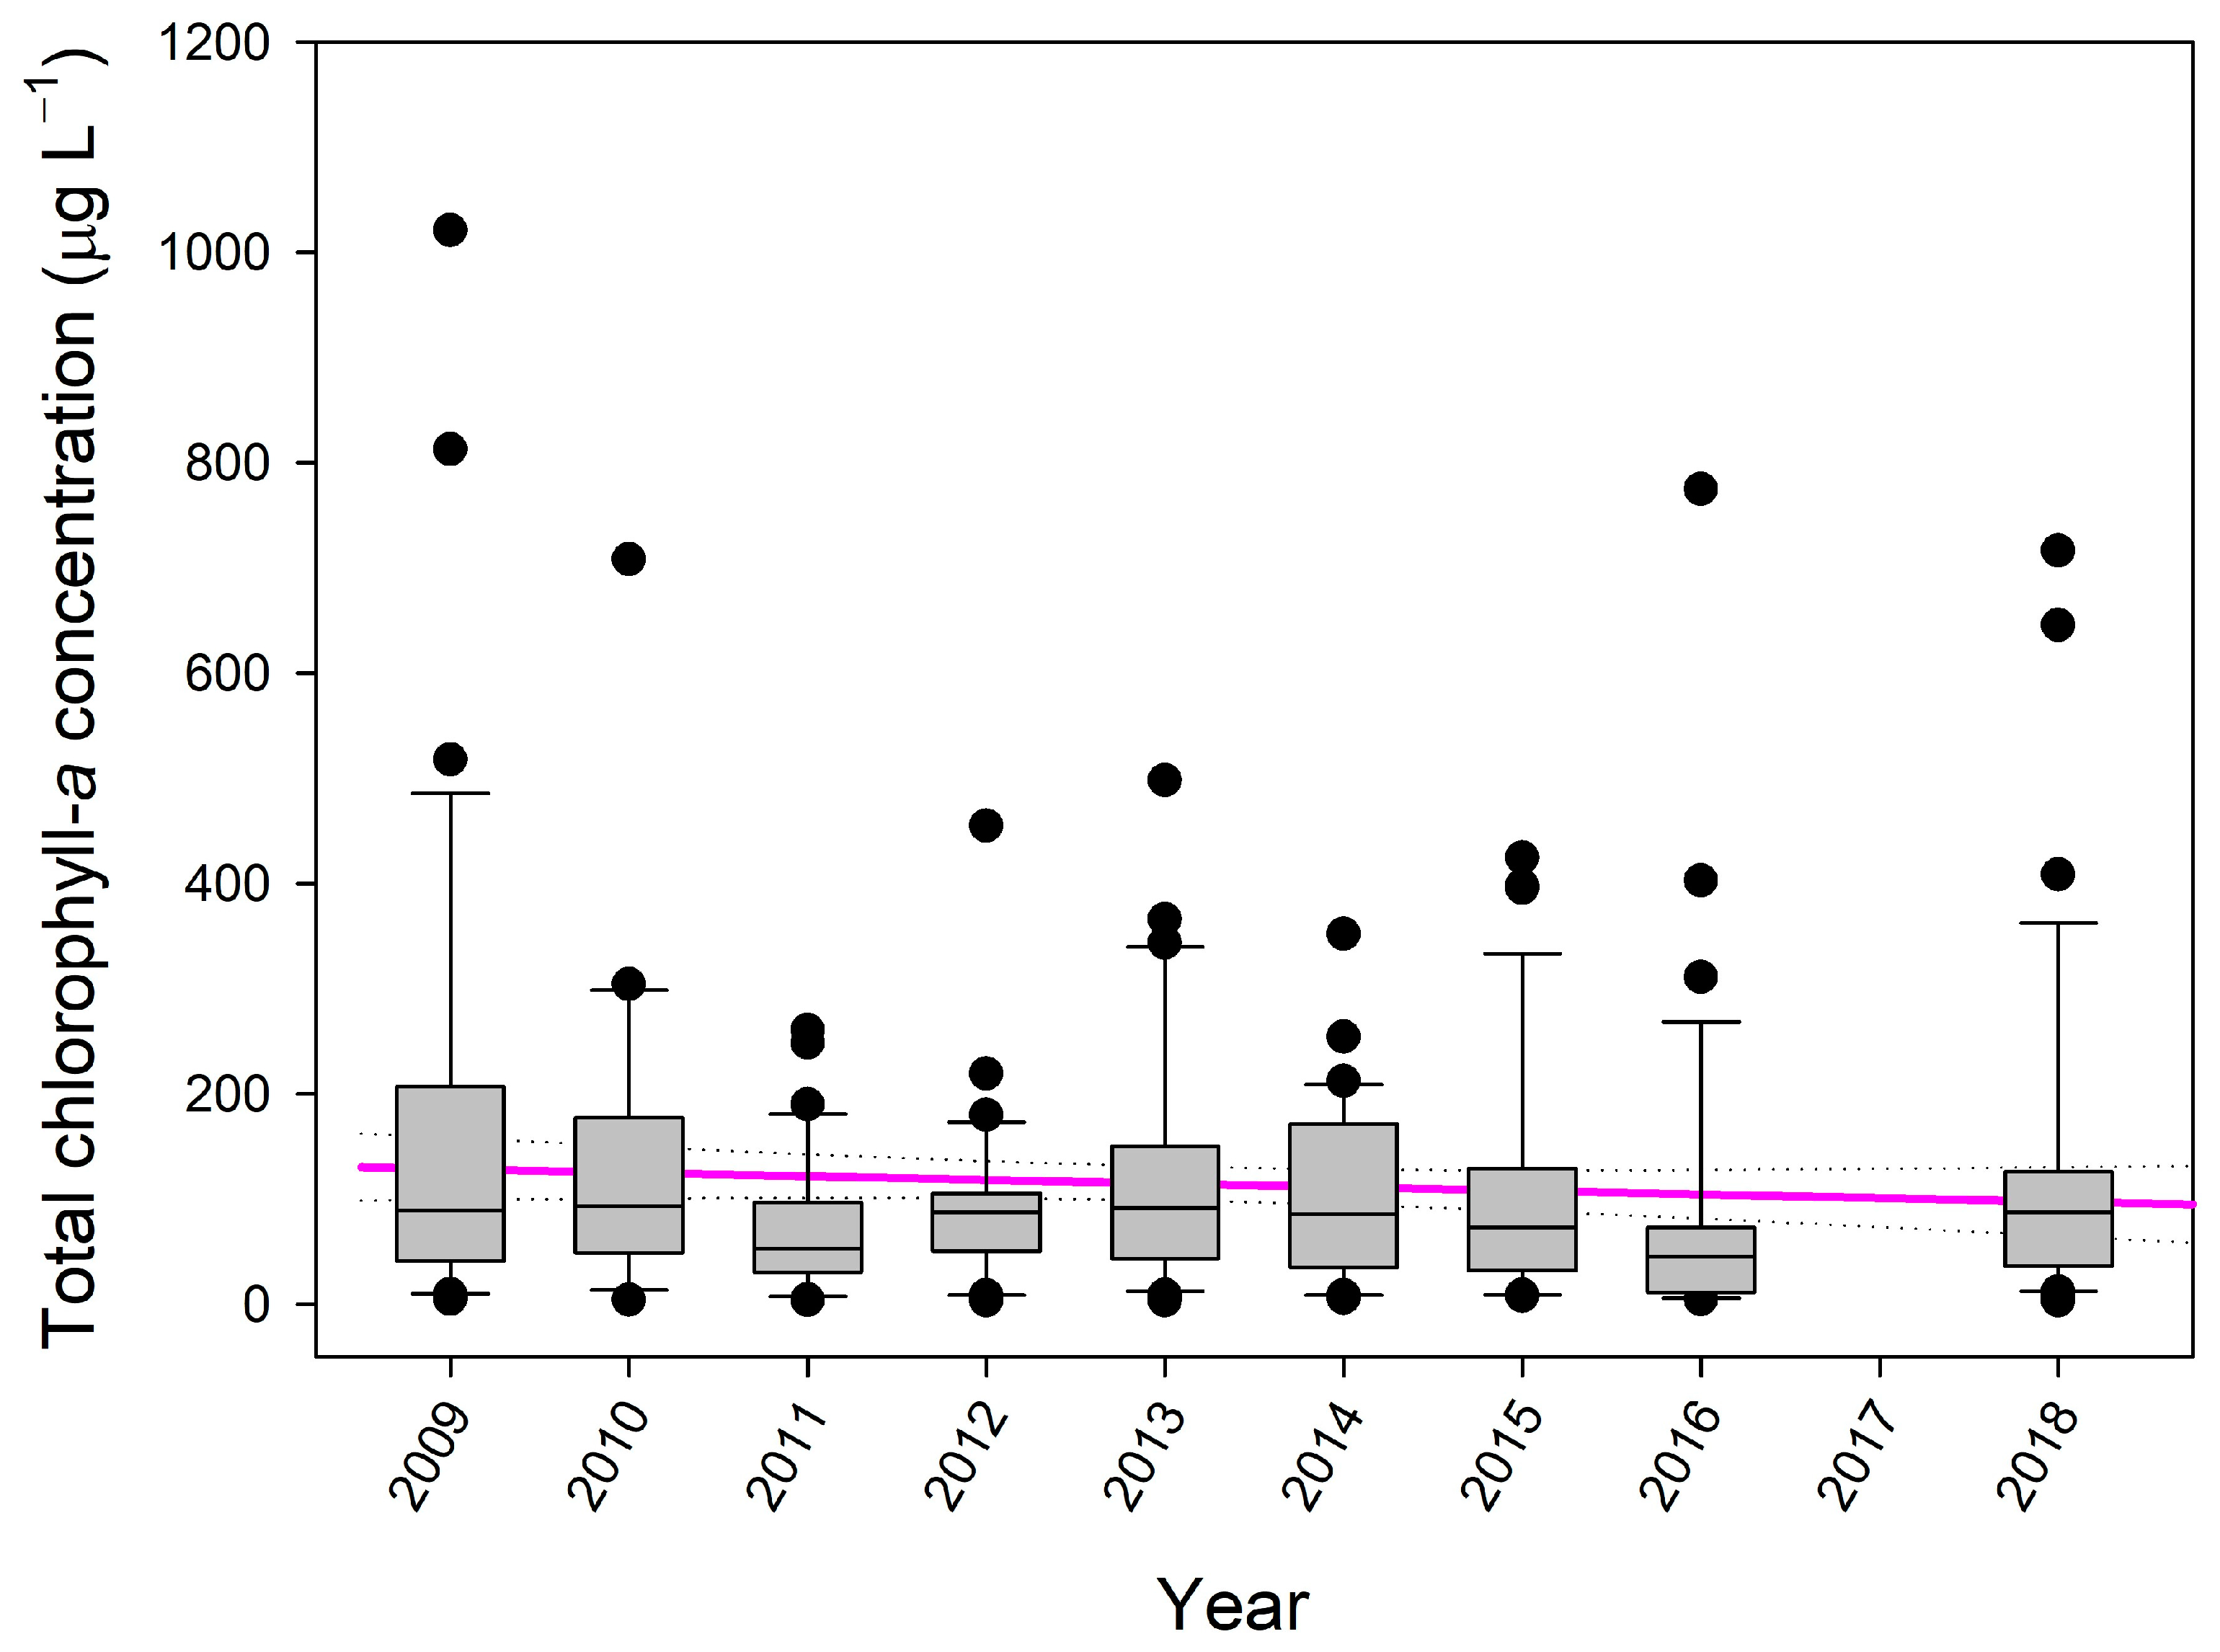
3.1. Chlorophyll-a Concentrations
3.2. Nutrients
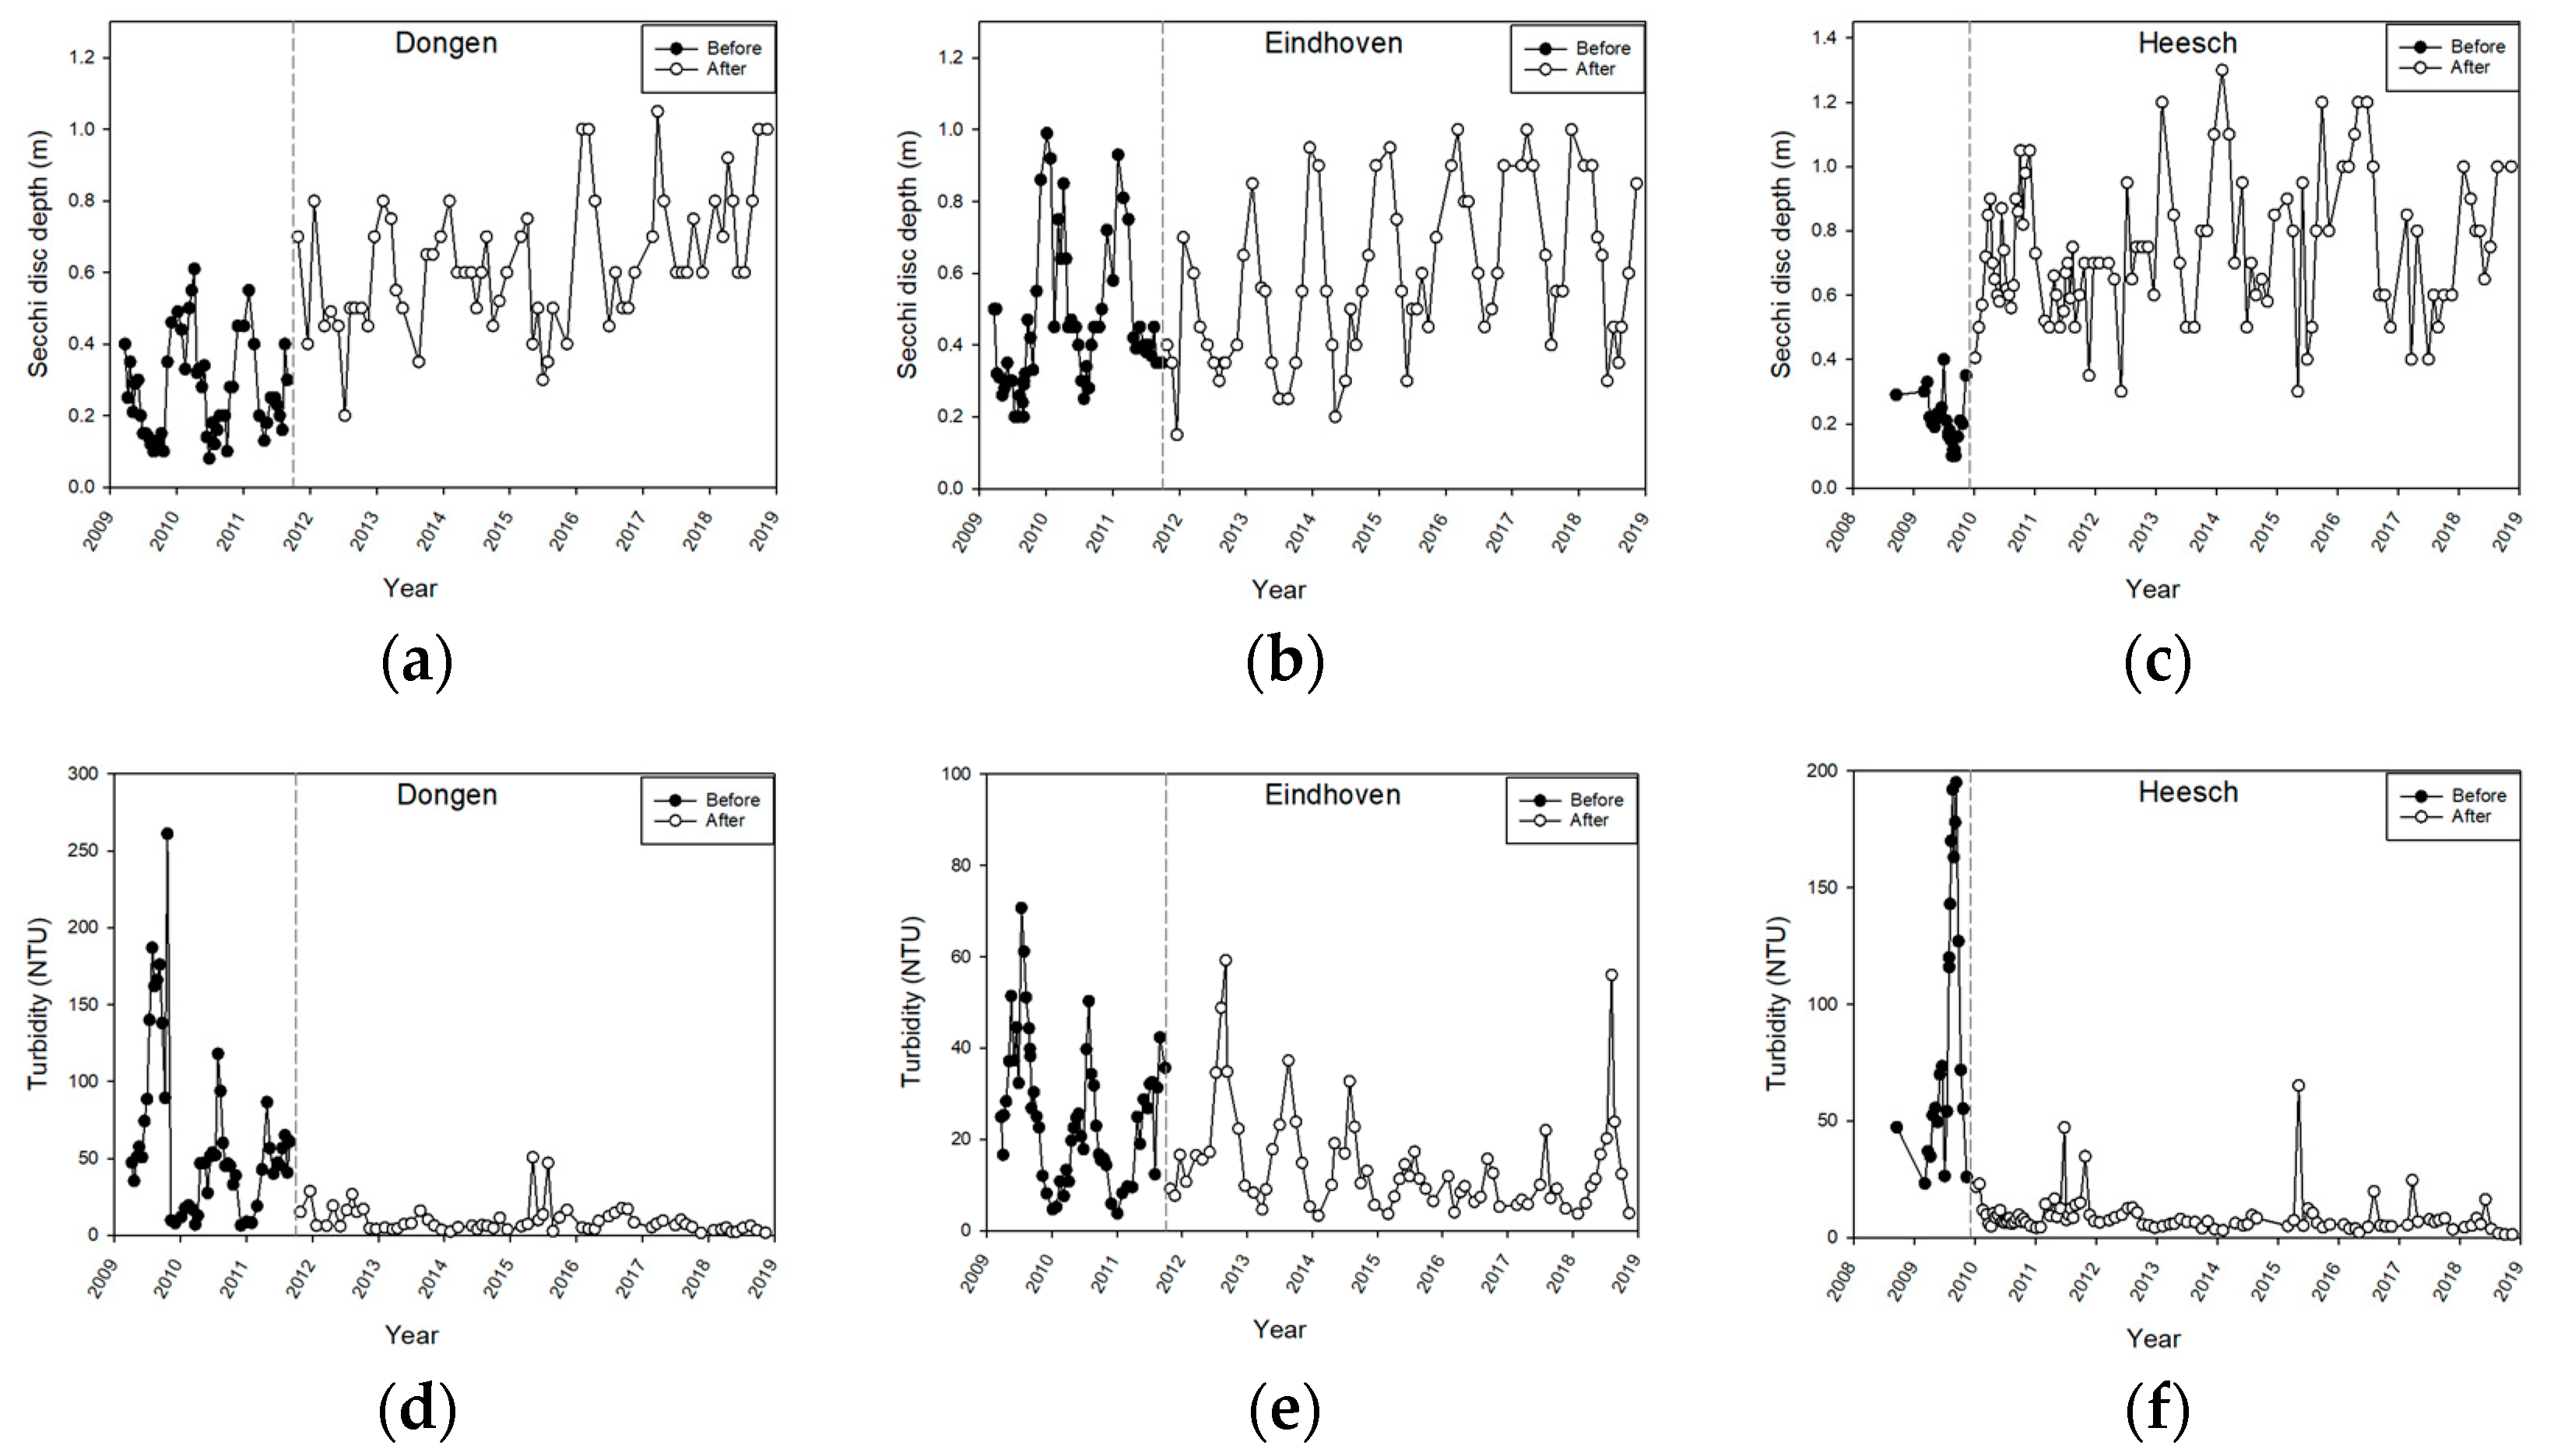
3.3. Water Clarity
3.4. Dissolved Oxygen Saturation and pH
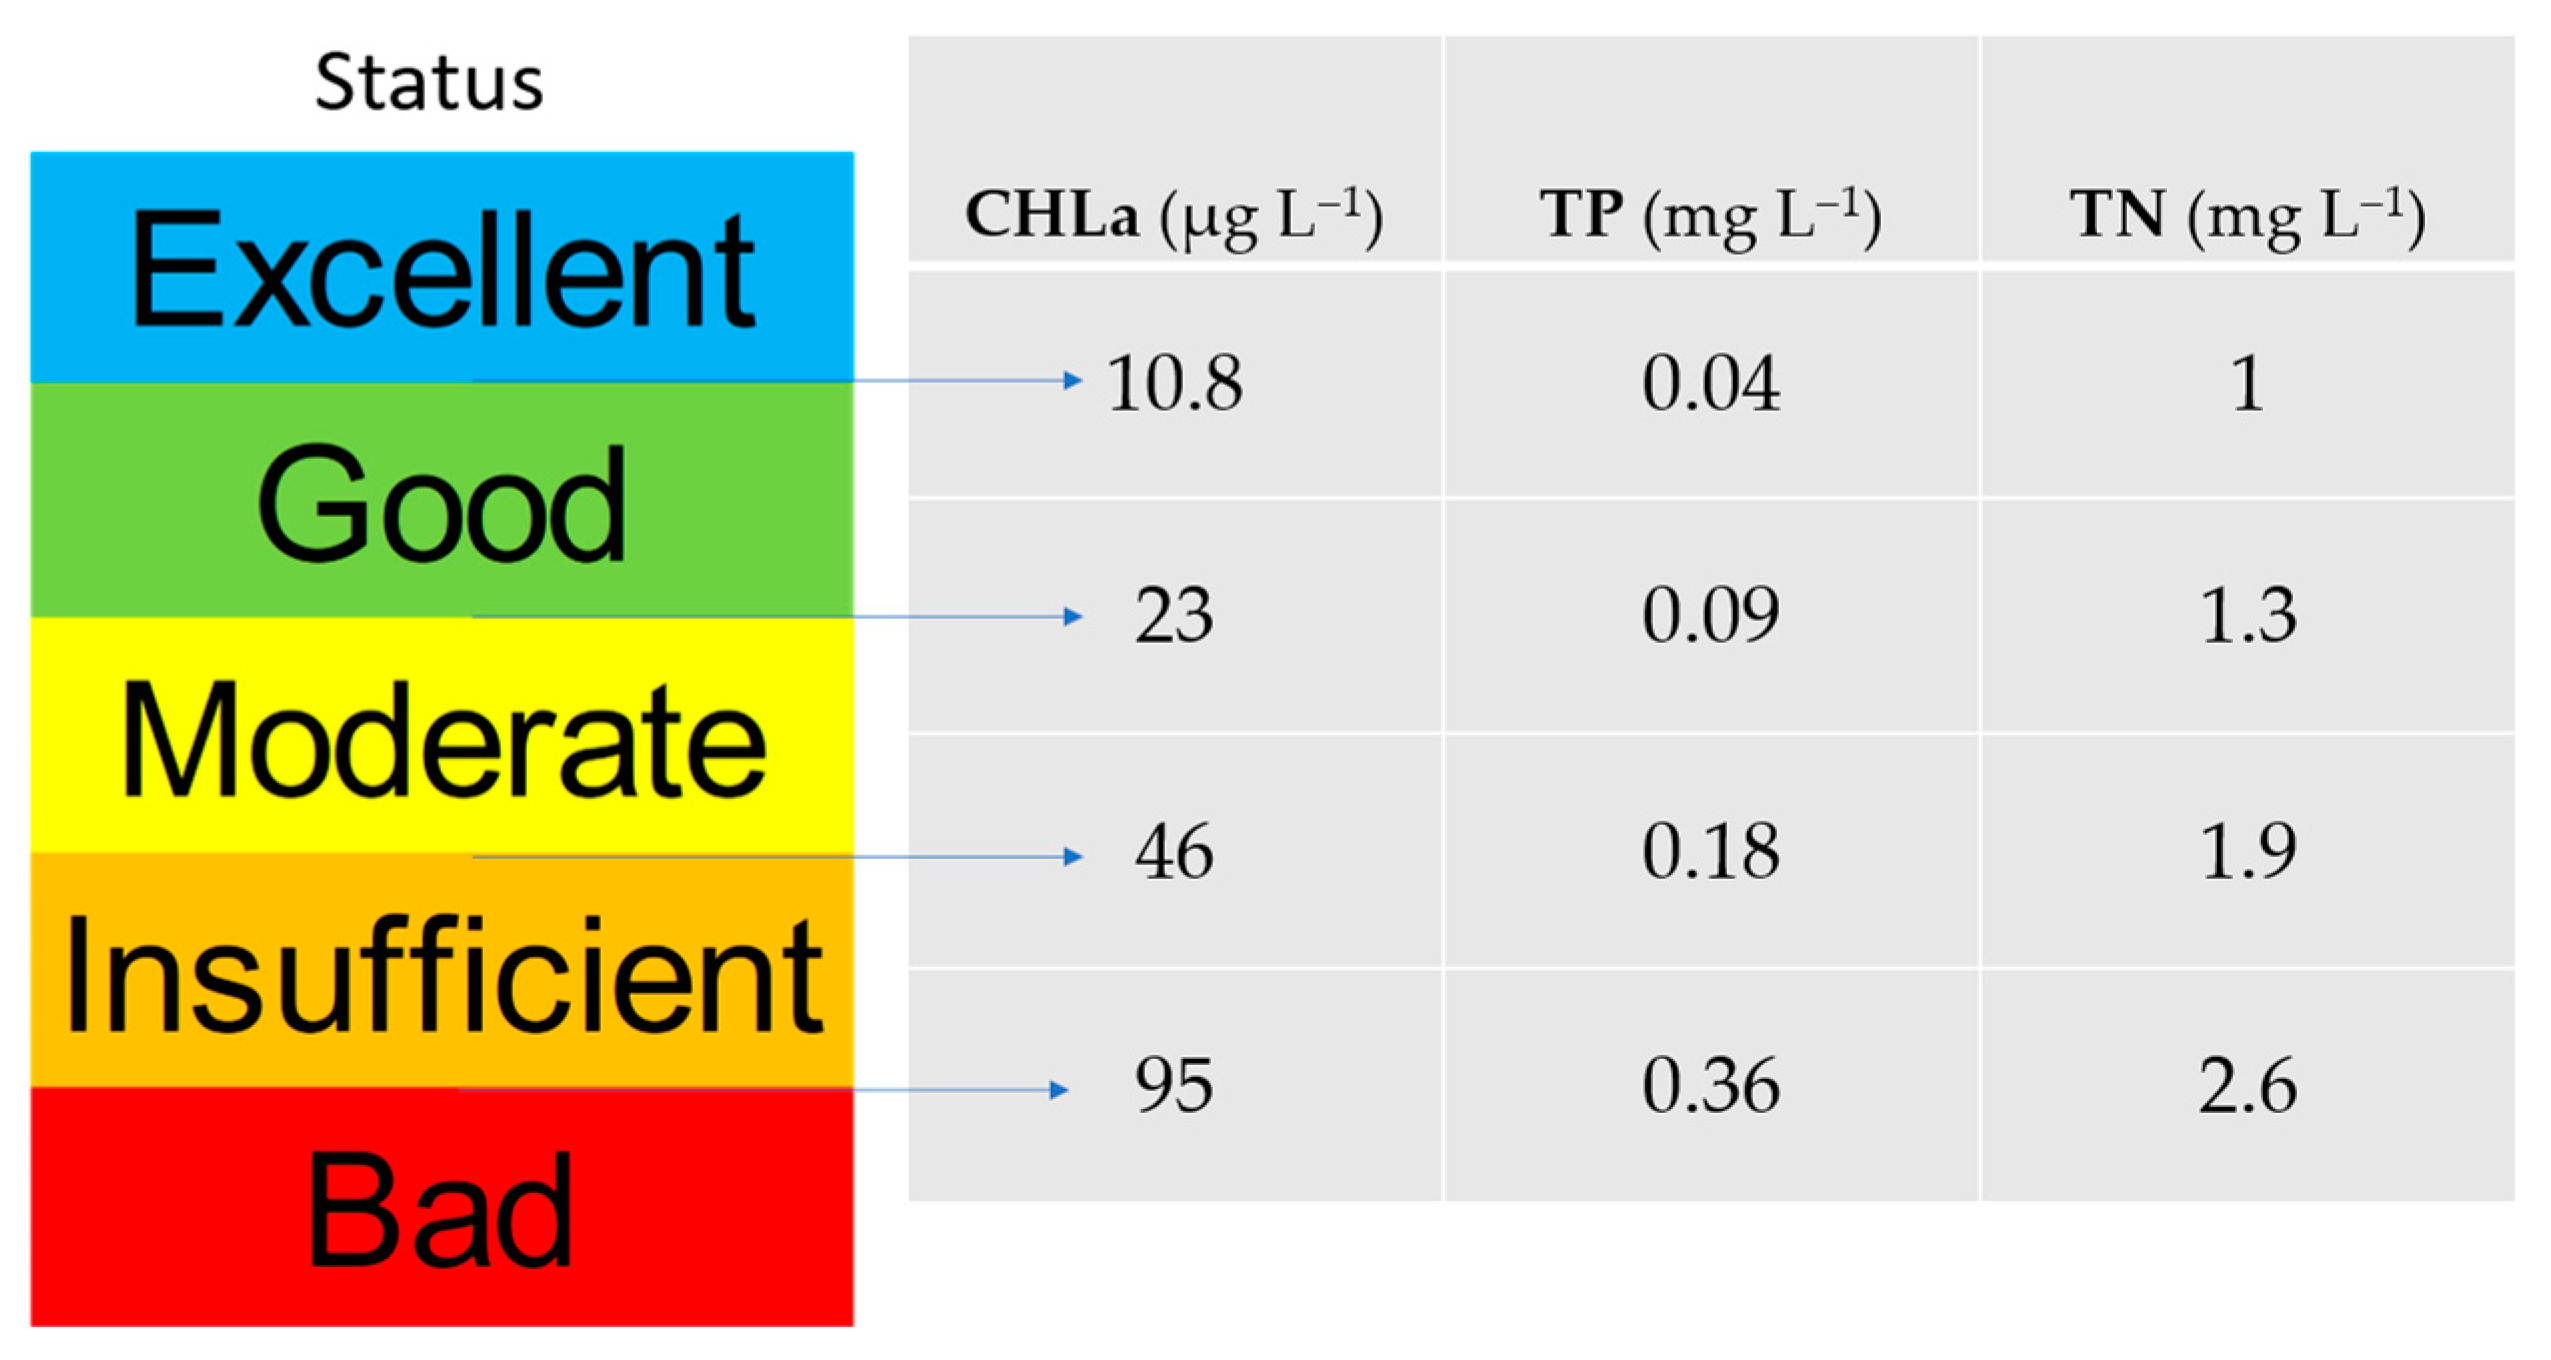
3.5. Water Framework Directive Scores
4. Discussion
5. Conclusions
- A system analysis should take place at the start of each pond and lake rehabilitation.
- Mitigating measures should only be implemented when the system analysis has revealed their feasibility.
- Combining measures that together act on both the nutrient load and water turbidity are recommended in rapid eutrophication abatement.
Author Contributions
Funding
Data Availability Statement
Acknowledgments
Conflicts of Interest
Appendix A

| Place/Location | Latitude | Longitude | Name Water Body |
|---|---|---|---|
| Asten | 51°24′18.38″ | 5°44′53.50″ | Vijver in Burg. Ploegmakerspark |
| Beek and Donk | 51°32′03.63″ | 5°37′41.56″ | Vijver aan Otterweg |
| Bennekom | 51°59′43.91″ | 5°40′11.72″ | Vijver aan Kierkamperweg |
| Boxtel | 51°36′03.94″ | 5°18′54.10″ | Vijver aan Parkweg |
| Boxtel | 51°35′53.55″ | 5°18′22.86″ | Essche Heike |
| Breda | 51°36′00.15″ | 4°46′56.12″ | Vijver in Liniepark |
| Budel | 51°14′02.38″ | 5°35′56.44″ | Ringelsven |
| Deurne | 51°26′55.19″ | 5°47′14.97″ | Vijver Burgemeester Roefslaan |
| Ede (1) | 52°01′27.05″ | 5°38′43.88″ | Vijver aan Verenigde naties |
| Ede (2) | 52°02′03.84″ | 5°38′56.83″ | Vijver aan Jachtlaan |
| Ede (3) | 52°02′20.99″ | 5°38′43.67″ | Vijver bij Valkestein |
| Etten-Leur | 51°34′09.41″ | 4°39′02.74″ | Vijver aan Vlaamse Schuur |
| Grave | 51°45′08.24″ | 5°44′57.30″ | Vijver aan Anna van Burenweg |
| Heesch | 51°44′09.00″ | 5°32′24.65″ | Vijver aan Langven |
| Helmond | 51°29′05.16″ | 5°38′29.25″ | Warandevijver |
| Maarheeze | 51°18′22.25″ | 5°37′04.85″ | Vijver aan Poelsnep |
| Middelrode | 51°39′51.47″ | 5°25′21.73″ | Vijver Christinastraat |
| Roosendaal | 51°30′41.82″ | 4°26′42.02″ | Vijver Dadelberg |
| Roosendaal | 51°30′49.33″ | 4°26′43.82″ | Vijver Dubbelberg |
| Roosendaal | 51°30′52.84″ | 4°26′34.14″ | Vijver Enclaveberg |
| Schijndel | 51°37′14.84″ | 5°26′43.68″ | Vijver Renate Rubinsteinstraat |
| St-Michielsgestel | 51°38′44.51″ | 5°21′49.85″ | Vijver Moerschot |
| Sint-Oedenrode | 51°34′27.41″ | 5°26′58.30″ | Visvijver in Park De Kienehoef |
| Someren | 51°22′54.31″ | 5°42′21.23″ | Vijver aan Wilbertshof |
| Son | 51°30′48.98″ | 5°29′16.10″ | Vijver aan Europalaan |
| Tilburg | 51°32′09.34″ | 5°05′35.02″ | Vijver aan de Berglandweg |
| Tilburg | 51°32′21.42″ | 5°05′05.20″ | Vijver aan de Kaukasusweg |
| Tilburg | 51°32′14.66″ | 5°04′35.74″ | Stappegoor |
| Tilburg | 51°32′36.19″ | 5°06′16.13″ | EsscheStroom Vijver |
| Tilburg | 51°35′32.91″ | 4°59′46.56″ | Vijver Hoge Witsie |
| Valkenswaard | 51°20′19.88″ | 5°28′05.84″ | Dragonder |
| Wageningen | 51°58′07.98″ | 5°40′38.33″ | Dreyenvijver |

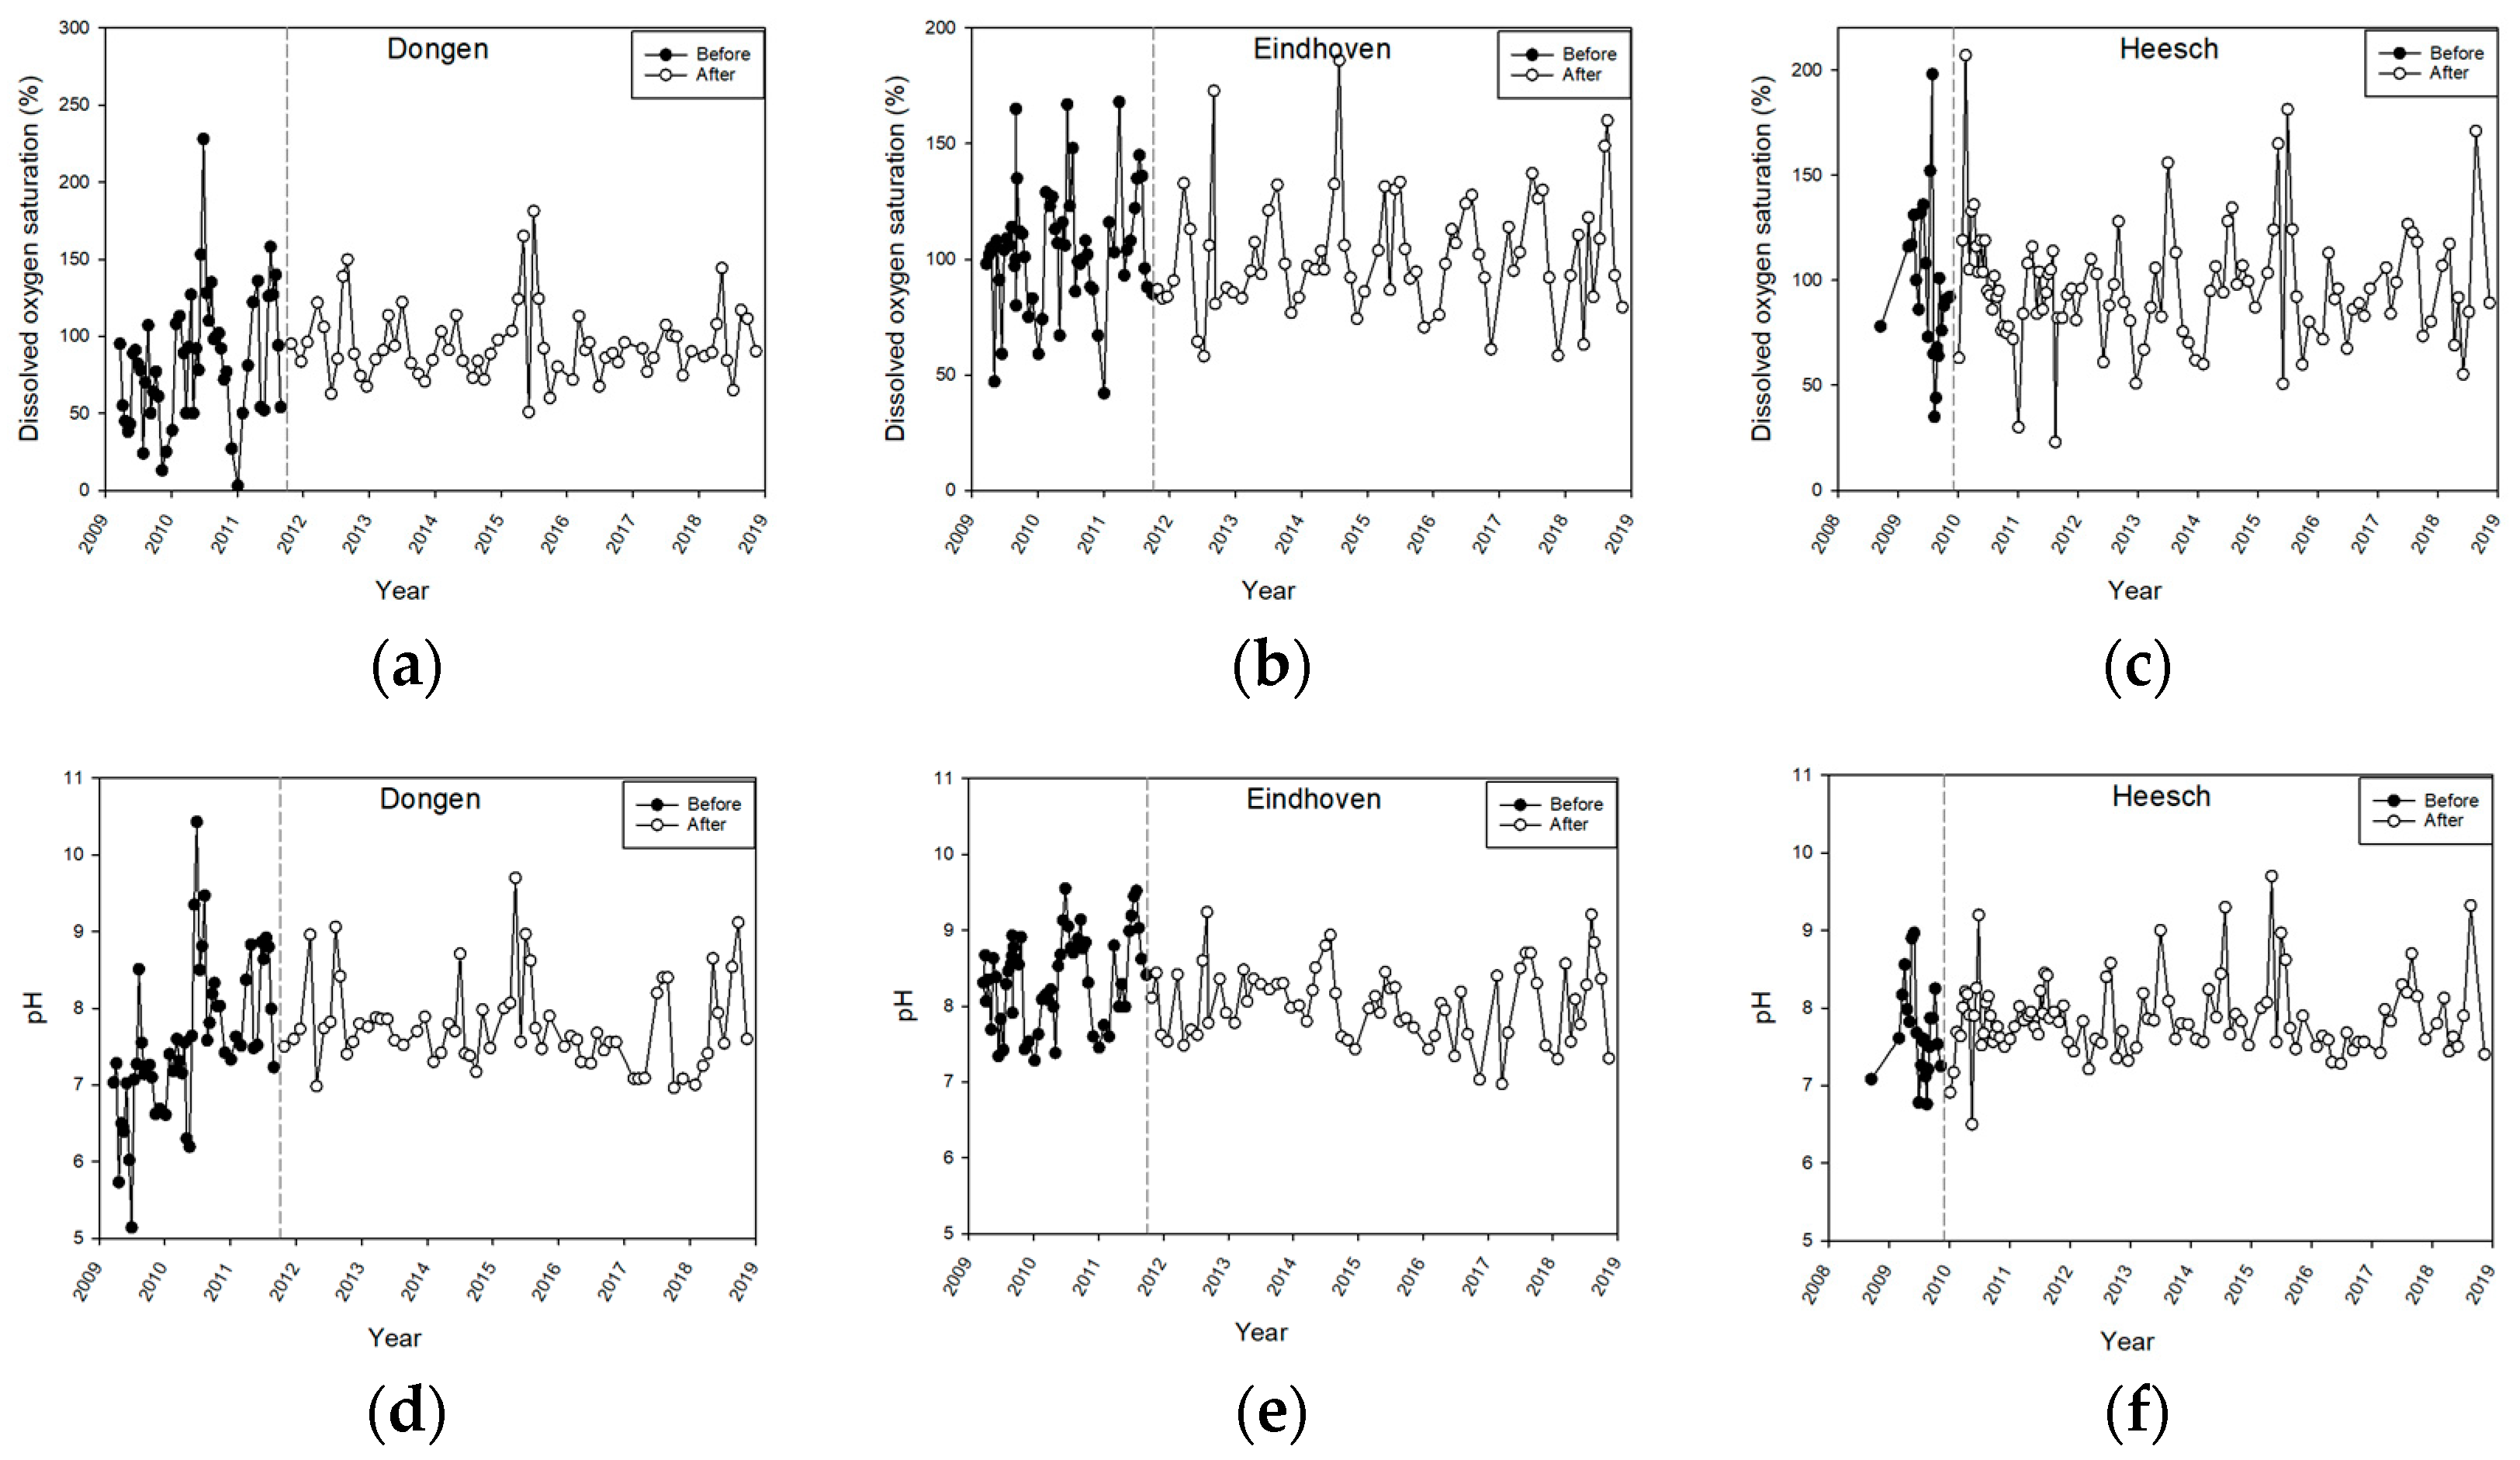
| Dissolved Oxygen Saturation | |||
| Statistical test | Pond Dongen | Pond Eindhoven | Pond Heesch |
| Normality test | p < 0.05 | p < 0.05 | p < 0.05 |
| Mann–Whitney | U = 1398.5 | U = 1759.5 | U = 1104.0 |
| Rank Sum Test | T53,65 = 2829.5 p = 0.080 | T57,68 = 3769.5 p = 0.376 | T23,102 = 1357 p = 0.906 |
| pH | |||
| Statistical test | Pond Dongen | Pond Eindhoven | Pond Heesch |
| Normality test | p < 0.05 | p = 0.213 | p < 0.05 |
| Mann–Whitney/t | U = 1386.5 | U = 972 | U = 882.5 |
| Rank Sum Test | T53,65 = 2817.5 p = 0.069 | T57,67 = 4500 p < 0.001 | T23102 = 1158.5 p = 0.064 |
Appendix B
| Variable | Before | After | ||||
|---|---|---|---|---|---|---|
| corr. | p−Value | n | corr. | p−Value | n | |
| Total Chlorophyll | ||||||
| Dongen | −0.207 | 0.137 | 53 | −0.127 | 0.309 | 66 |
| Eindhoven | −0.263 | 0.050 | 56 | −0.219 | 0.073 | 68 |
| Heesch | −0.321 | 0.135 | 23 | −0.164 | 0.099 | 103 |
| Cya−Chlorophyll | ||||||
| Dongen | −0.334 | 0.014 | 53 | −0.153 | 0.232 | 63 |
| Eindhoven | −0.098 | 0.474 | 56 | 0.062 | 0.619 | 66 |
| Heesch | −0.262 | 0.227 | 23 | 0.001 | 0.990 | 103 |
| Total Phosphorus | ||||||
| Dongen | −0.048 | 0.724 | 56 | −0.047 | 0.710 | 65 |
| Eindhoven | −0.348 | 0.013 | 51 | −0.331 | 0.006 | 67 |
| Heesch | 0.025 | 0.910 | 23 | −0.555 | <0.001 | 101 |
| Total Nitrogen | ||||||
| Dongen | −0.266 | 0.059 | 51 | 0.214 | 0.087 | 65 |
| Eindhoven | −0.072 | 0.617 | 51 | −0.010 | 0.935 | 67 |
| Heesch | 0.259 | 0.244 | 22 | 0.066 | 0.516 | 100 |
| Secchi disc depth | ||||||
| Dongen | 0.055 | 0.697 | 53 | 0.428 | <0.001 | 63 |
| Eindhoven | 0.212 | 0.110 | 58 | 0.385 | 0.001 | 68 |
| Heesch | −0.386 | 0.069 | 23 | 0.181 | 0.071 | 100 |
| pH | ||||||
| Dongen | 0.562 | <0.001 | 53 | −0.055 | 0.664 | 65 |
| Eindhoven | 0.293 | 0.026 | 58 | −0.052 | 0.675 | 67 |
| Heesch | −0.147 | 0.502 | 23 | 0.078 | 0.436 | 102 |
| Turbidity | ||||||
| Dongen | −0.341 | 0.014 | 52 | −0.228 | 0.068 | 65 |
| Eindhoven | −0.280 | 0.035 | 57 | −0.245 | 0.046 | 67 |
| Heesch | 0.455 | 0.029 | 23 | −0.164 | 0.104 | 99 |
| Oxygen saturation | ||||||
| Dongen | 0.309 | 0.024 | 53 | −0.012 | 0.926 | 65 |
| Eindhoven | 0.149 | 0.267 | 57 | 0.111 | 0.367 | 68 |
| Heesch | −0.188 | 0.403 | 22 | 0.007 | 0.941 | 102 |
Appendix C
References
- Biggs, J.; Williams, P.; Whitfield, M.; Nicolet, P.; Weatherby, A. 15 years of pond assessment in Britain: Results and lessons learned from the work of Pond Conservation. Aquatic Conserv. Mar. Freshw. Ecosyst. 2005, 15, 693–714. [Google Scholar] [CrossRef]
- Hassall, C. The ecology and biodiversity of urban ponds. WIREs Water 2014, 1, 187–206. [Google Scholar] [CrossRef]
- Richardson, D.C.; Holgerson, M.A.; Farragher, M.J.; Hoffman, K.K.; King, K.B.; Alfonso, M.B.; Andersen, M.R.; Cheruveil, K.S.; Coleman, K.A.; Farruggia, M.J.; et al. A functional definition to distinguish ponds from lakes and wetlands. Sci. Rep. 2022, 12, 10472. [Google Scholar] [CrossRef]
- Holgerson, M.A.; Raymond, P.A. Raymond. Large contribution to inland water CO2 and CH4 emissions from very small ponds. Nat. Geosci. 2016, 9, 222–226. [Google Scholar] [CrossRef]
- Bolund, P.; Hunhammar, S. Ecosystem services in urban areas. Ecol. Econ. 1999, 29, 293–301. [Google Scholar] [CrossRef]
- Brönmark, C.; Hansson, L.A. Environmental issues in lakes and ponds: Current state and perspectives. Envion. Conserv. 2002, 29, 290–306. [Google Scholar] [CrossRef]
- Robitu, M.; Musy, M.; Inard, C.; Groleau, D. Modeling the influence of vegetation and water pond on urban microclimate. Solar Energy 2006, 80, 435–447. [Google Scholar] [CrossRef]
- Gledhill, D.G.; James, P.; Davies, D.H. Pond density as a determinant of aquatic species richness in an urban landscape. Landsc. Ecol. 2008, 23, 1219–1230. [Google Scholar] [CrossRef]
- Downing, J.A. Emerging global role of small lakes and ponds: Little things mean a lot. Limnetica 2010, 29, 9–24. [Google Scholar] [CrossRef]
- Gledhill, D.G.; James, P. Socio-economic variables as indicators of pond conservation value in an urban landscape. Urban Ecosyst. 2012, 15, 849–861. [Google Scholar] [CrossRef]
- Krivtsov, V.; Forbes, H.; Birkinshaw, S.; Olive, V.; Chamberlain, D.; Buckman, J.; Yahr, R.; Arthur, S.; Christie, D.; Monteiro, Y.; et al. Ecosystem services provided by urban ponds and green spaces: A detailed study of a semi-natural site with global importance for research. Blue-Green Syst. 2022, 4, 1–23. [Google Scholar] [CrossRef]
- Birch, S.; McCaskie, J. Shallow urban lakes: A challenge for lake management. Hydrobiologia 1999, 395/396, 365–377. [Google Scholar] [CrossRef]
- Teurlincx, S.; Veraart, A.; Janssen, A.B.G.; Hoevenaar, E.; Kuiper, J.J.; De Senerpont Domis, L.; Lürling, M.; Brederveld, R.J.; Mooij, W.M. Towards restoring lentic urban waters: Understanding the main pressures. Curr. Opin. Environ. Sustain. 2019, 36, 49–58. [Google Scholar] [CrossRef]
- Grimm, N.B.; Faeth, S.H.; Golubiewski, N.E.; Redman, C.L.; Wu, J.; Bai, X.; Briggs, J.M. Global change and the ecology of cities. Science 2008, 319, 756–760. [Google Scholar] [CrossRef] [PubMed]
- Carey, R.O.; Hochmuth, G.J.; Martinez, C.J.; Boyer, T.H.; Dukes, M.D.; Toor, G.S.; Cisar, J.L. Evaluating nutrient impacts in urban watersheds: Challenges and research opportunities. Environ. Pollut. 2013, 173, 138–149. [Google Scholar] [CrossRef]
- Scheffer, M.; Hosper, S.H.; Meijer, M.-L.; Moss, B.; Jeppesen, E. Alternative equilibria in shallow lakes. Trends Ecol. Evol. 1993, 8, 275–279. [Google Scholar] [CrossRef] [PubMed]
- Watson, S.B.; McCauley, E.; Downing, J.A. Patterns in phytoplankton taxonomic composition across temperate lakes of differing nutrient source. Limnol. Oceanogr. 1997, 42, 487–495. [Google Scholar] [CrossRef]
- Smith, V.H.; Tilman, G.D.; Nekola, J.C. Eutrophication: Impacts of excess nutrient inputs on freshwater, marine, and terrestrial ecosystems. Environ. Pollut. 1999, 100, 179–196. [Google Scholar] [CrossRef] [PubMed]
- Waajen, G.W.A.M.; Faassen, E.J.; Lürling, M. Eutrophic urban ponds suffer from cyanobacterial blooms: Dutch examples. Envion. Sci. Poll. Res. 2014, 21, 9983–9994. [Google Scholar] [CrossRef] [PubMed]
- Fastner, J.; Neumann, U.; Wirsing, B.; Weckesser, J.; Wiedner, C.; Nixdorf, B.; Chorus, I. Microcystins (hepatotoxic heptapeptides) in German fresh water bodies. Envion. Toxicol. 1999, 14, 13–22. [Google Scholar] [CrossRef]
- Rahman, S.; Jewel, M.A.S. Cyanobacterial blooms and water quality in two urban fish ponds. J. Zool. Rajshahi Univ. 2008, 27, 79–84. [Google Scholar] [CrossRef]
- Willame, R.; Jurczak, T.; Iffly, J.F.; Kull, T.; Meriluoto, J.; Hoffmann, L. Distribution of hepatotoxic cyanobacterial blooms in Belgium and Luxembourg. Hydrobiologia 2005, 551, 99–117. [Google Scholar] [CrossRef]
- Dodds, W.K.; Bouska, W.W.; Eitzmann, J.L.; Pilger, T.J.; Pitts, K.L.; Riley, A.J.; Schloesser, J.T.; Thornbrugh, D.J. Eutrophication of U.S. freshwaters: Analysis of potential economic damages. Environ. Sci. Technol. 2009, 43, 12–19. [Google Scholar] [CrossRef]
- Janssen, A.B.G.; Hilt, S.; Kosten, S.; de Klein, J.J.M.; Paerl, H.W.; Van de Waal, D.B. Shifting states, shifting services: Linking regime shifts to changes in ecosystem services of shallow lakes. Freshw. Biol. 2021, 66, 1–12. [Google Scholar] [CrossRef]
- Van Liere, L.; Gulati, R.D. Restoration and recovery of shallow eutrophic lake ecosystems in The Netherlands: Epilogue. Hydrobiologia 1992, 233, 283–287. [Google Scholar] [CrossRef]
- Moss, B. Ecology of Freshwaters. A View for the Twenty-First Century, 4th ed.; Wiley-Blackwell: Chichester, UK, 2010; pp. 363–366. [Google Scholar]
- Cooke, G.D.; Welch, E.B.; Peterson, S.; Nichols, S.A. Restoration and Management of Lakes and Reservoirs; CRC Press, Taylor & Francis: Boca Raton, FL, USA, 2005; pp. 47–85. [Google Scholar]
- Lürling, M.; Mackay, E.; Reitzel, K.; Spears, B.M. Editorial–A critical perspective on geo-engineering for eutrophication management in lakes. Water Res. 2016, 97, 1–10. [Google Scholar] [CrossRef]
- Waajen, G.; van Oosterhout, F.; Douglas, G.; Lürling, M. Geo-engineering experiments in two urban ponds to control eutrophication. Water Res. 2016, 97, 69–82. [Google Scholar] [CrossRef]
- Mooij, W.M.; Trolle, D.; Jeppesen, E.; Arhonditsis, G.; Belolipetsky, P.; Chitamwebwa, D.B.R.; Degermendzhy, A.G.; DeAngelis, D.L.; De Senerpont Domis, L.N.; Downing, A.S.; et al. Challenges and opportunities for integrating lake ecosystem modelling approaches. Aquat. Ecol. 2010, 44, 633–667. [Google Scholar] [CrossRef]
- Lürling, M.; Waajen, G.; Engels, B.; Oosterhout, F.V. Effects of Dredging and Lanthanum-Modified Clay on Water Quality Variables in an Enclosure Study in a Hypertrophic Pond. Water 2017, 9, 380. [Google Scholar] [CrossRef]
- Kalkman, P. Rapportage Visstandonderzoek in de Vijver De Ploeg te Heesch; Visserijbedrijf P. Kalkman: Moordrecht, The Netherlands, 2009. [Google Scholar]
- Kalkman, P. Rapportage Afvissing Stiffelio Vijver te Eindhoven, September–December 2011; Visserijbedrijf P. Kalkman: Moordrecht, The Netherlands, 2011. [Google Scholar]
- Kalkman, P. Rapportage Visstandonderzoek in de Vijver Monseigneur Schaepmanlaan te Dongen; Visserijbedrijf P. Kalkman: Moordrecht, The Netherlands, 2009. [Google Scholar]
- Netherlands Normalization Institute (NEN). Water: Photometric Determination of the Content of Dissolved Orthophosphate and the Total Content of Phosphorous Compounds by Continuous Flow Analysis; NEN 6663; Netherlands Normalization Institute: Delft, The Netherlands, 1986. [Google Scholar]
- Netherlands Normalization Institute (NEN). Water: Photometric Determination of the Content of Ammonium Nitrogen and the Sum of the Contents of Ammoniacal and Organically Bound Nitrogen According to Kjeldahl by Continuous Flow Analysis; NEN 6646; Netherlands Normalization Institute: Delft, The Netherlands, 1990. [Google Scholar]
- Wauchope, H.S.; Amano, T.; Geldmann, J.; Johnston, A.; Simmons, B.I.; Sutherland, W.J.; Jones, J.P.G. Evaluating Impact Using Time-Series Data. Trends Ecol. Evol. 2021, 36, 196–205. [Google Scholar] [CrossRef]
- van der Molen, D.T.; Pot, R.; Evers, C.H.M.; Buskens, R.; van Herpen, F.C.J. Referenties en Maatlatten Voor Overige Wateren (Geen KRW-Waterlichamen); Rapportnummer 2013-14; Stichting Toegepast Onderzoek Waterbeheer (STOWA): Amersfoort, The Netherlands, 2013; pp. 31–37. ISBN 978-90-5773-609-4. [Google Scholar]
- Waajen, G.; Lürling, M.; van de Sande, R. The unfulfilled promise of urban Lake Kleine Melanen (The Netherlands): Diagnostics, experiment on reduction of sediment P-release and in-lake restoration. Lake Reserv. Manag. 2019, 35, 8–24. [Google Scholar] [CrossRef]
- Janse, J.H.; Scheffer, M.; Lijklema, L.; Van Liere, L.; Sloot, J.S.; Mooij, W.M. Estimating the critical phosphorus loading of shallow lakes with the ecosystem model PCLake: Sensitivity, calibrations and uncertainty. Ecol. Modell. 2010, 221, 654–665. [Google Scholar] [CrossRef]
- Janse, J.H.; De Senerpont Domis, L.N.; Scheffer, M.; Lijklema, L.; Van Liere, L.; Klinge, M.; Mooij, W.M. Critical phosphorus loading of different types of shallow lakes and the consequences for management estimated with the ecosystem model PCLake. Limnologica 2008, 38, 203–219. [Google Scholar] [CrossRef]
- Søndergaard, M.; Jensen, A.; Jeppesen, E. Role of sediment and internal loading of phosphorus in shallow lakes. Hydrobiologia 2003, 506, 135–145. [Google Scholar] [CrossRef]
- Peretyatko, A.; Teissier, S.; De Backer, S.; Triest, L. Restoration potential of biomanipulation for eutrophic peri-urban ponds: The role of zooplankton size and submerged macrophyte cover. Hydrobiologia 2009, 634, 125–135. [Google Scholar] [CrossRef]
- Cline, J.M.; East, T.L.; Threlkeld, S.T. Fish interactions with the sediment-water interface. Hydrobiologia 1994, 275/276, 301–311. [Google Scholar] [CrossRef]
- Meijer, M.L.; De Boois, I.; Scheffer, M.; Portielje, R.; Hosper, H. Biomanipulation in shallow lakes in The Netherlands: An evaluation of 18 case studies. Hydrobiologia 1999, 408/409, 13–30. [Google Scholar] [CrossRef]
- Zambrano, L.; Hinojosa, D. Direct and indirect effects of carp (Cyprinus carpio L.) on macrophyte and benthic communities in experimental shallow ponds in central Mexico. Hydrobiologia 1999, 408/409, 131–138. [Google Scholar] [CrossRef]
- Persson, A.; Svensson, J.M. Vertical distribution of benthic community responses to fish predators, and effects on algae and suspended material. Aquat. Ecol. 2006, 40, 85–95. [Google Scholar] [CrossRef]
- Roozen, F.C.J.M.; Lürling, M.; Vlek, H.; Van Der Pouw Kraan, E.A.J.; Ibelings, B.W.; Scheffer, M. Resuspension of algal cells by benthivorous fish boosts phytoplankton biomass and alters community structure in shallow lakes. Freshw. Biol. 2007, 52, 977–987. [Google Scholar] [CrossRef]
- De Backer, S.; van Onsem, S.; Triest, L. Influence of submerged vegetation and fish abundance on water clarity in peri-urban eutrophic ponds. Hydrobiologia 2010, 656, 255–267. [Google Scholar] [CrossRef]
- De Backer, S.; Teissier, S.; Triest, L. Stabilizing the clear-water state in eutrophic ponds after biomanipulation: Submerged vegetation versus fish recolonization. Hydrobiologia 2012, 689, 161–176. [Google Scholar] [CrossRef]
- Teissier, S.; Peretyatko, A.; De Backer, S.; Triest, L. Strength of phytoplankton-nutrient relationship: Evidence from 13 biomanipulated ponds. Hydrobiologia 2012, 689, 147–159. [Google Scholar] [CrossRef]
- Søndergaard, M.; Jeppesen, E.; Lauridsen, T.L.; Skov, C.; Van Nes, E.H.; Roijackers, R.; Lammens, E.; Portielje, R. Lake restoration: Successes, failures and long-term effects. J. Appl. Ecol. 2007, 44, 1095–1105. [Google Scholar] [CrossRef]
- Søndergaard, M.; Liboriussen, L.; Pedersen, A.R.; Jeppesen, E. Lake restoration by fish removal: Short- and long-term effects in 36 Danish lakes. Ecosystems 2008, 11, 1291–1305. [Google Scholar] [CrossRef]
- Jeppesen, E.; Meerhoff, M.; Jacobsen, B.A.; Hansen, R.S.; Søndergaard, M.; Jensen, J.P.; Lauridsen, T.L.; Mazzeo, N.; Branco, C.W.C.C. Restoration of shallow lakes by nutrient control and biomanipulation—The successful strategy varies with lake size and climate. Hydrobiologia 2007, 581, 269–285. [Google Scholar] [CrossRef]
- Sánchez-Carrillo, S.; Angeler, D.G.; Álvarez-Cobelas, M.; Sánchez-Andrés, R. Freshwater Wetland Eutrophication. In Eutrophication: Causes, Consequences and Control; Ansari, A.A., Singh Gill, S., Lanza, G.R., Rast, W., Eds.; Springer: Dordrecht, The Netherlands, 2011; pp. 195–210. [Google Scholar]
- Lürling, M.; Faassen, E.J. Controlling toxic cyanobacteria: Effects of dredging and phosphorus-binding clay on cyanobacteria and microcystins. Water Res. 2012, 46, 1447–1459. [Google Scholar] [CrossRef] [PubMed]
- Pant, H.K.; Reddy, K.R. Potential internal loading of phosphorus in a wetland constructed in agricultural land. Water Res. 2003, 37, 965–972. [Google Scholar] [CrossRef] [PubMed]
- Brouwer, E.; Bobbink, R.; Roelofs, J.G.M. Restoration of aquatic macrophyte vegetation in acidified and eutrophied softwater lakes: An overview. Aquat. Bot. 2002, 73, 405–431. [Google Scholar] [CrossRef]
- Moss, B.; Balls, H.; Irvine, K.; Stansfield, J. Restoration of two lowland lakes by isolation from nutrient-rich water sources with and without removal of sediment. J. Appl. Ecol. 1986, 23, 391–414. [Google Scholar] [CrossRef]
- Peterson, S.A. Lake restoration by sediment removal. Water Resour. Bull. 1982, 18, 423–435. [Google Scholar] [CrossRef]
- Geurts, J.J.M.; Smolders, A.J.P.; Banach, A.M.; Van der Graaf, J.P.M.; Roelofs, J.G.M.; Lamers, L.P.M. The interaction between decomposition, net N and P mineralization and their mobilization to the surface water in fens. Water Res. 2010, 44, 3487–3495. [Google Scholar] [CrossRef]
- Jeppesen, E.; Søndergaard, M.; Lauridsen, T.L.; Davidson, T.A.; Liu, Z.; Mazzeo, N.; Trochine, C.; Özkan, K.; Jensen, H.S.; Trolle, D.; et al. Biomanipulation as a Restoration Tool to Combat Eutrophication: Recent Advances and Future Challenges. Adv. Ecol. Res. 2012, 47, 411–488. [Google Scholar]
- Lin, Y.-T.; Wu, C.H. Response of bottom sediment stability after carp removal in a small lake. Ann. Limnol.—Int. J. Limnol. 2013, 49, 157–168. [Google Scholar] [CrossRef]
- Touwen, J. Vegetatieonderzoek Stadsvijver Dongen; report Aquon 21-245 stadsvijver Dongen; Aquon: Tiel, The Netherlands, 2021. [Google Scholar]
- Madsen, J.D.; Chambers, P.A.; James, W.F.; Koch, E.W.; Westlake, D.F. The interaction between water movement, sediment dynamics and submersed macrophytes. Hydrobiologia 2001, 444, 71–84. [Google Scholar] [CrossRef]
- Moss, B. Engineering and biological approaches to the restoration from eutrophication of shallow lakes in which aquatic plant communities are important components. Hydrobiologia 1990, 200/201, 367–377. [Google Scholar] [CrossRef]
- Olsen, S.; Chan, F.; Li, W.; Zhao, S.; Søndergaard, M.; Jeppesen, E. Strong impact of nitrogen loading on submerged macrophytes and algae: A long-term mesocosm experiment in a shallow Chinese lake. Freshw. Biol. 2015, 60, 1525–1536. [Google Scholar] [CrossRef]
- Chambers, P.A.; Kalff, J. Depth distribution and biomass of submerged aquatic macrophyte communities in relation to Secchi depth. Can. J. Fish. Aquat. Sci. 1985, 42, 701–709. [Google Scholar] [CrossRef]
- Woolway, R.I.; Jennings, E.; Carrea, L. Impact of the 2018 European heatwave on lake surface water temperature. Inland Waters 2020, 10, 322–332. [Google Scholar] [CrossRef]
- Moss, B.; Kosten, S.; Meerhoff, M.; Battarbee, R.W.; Jeppesen, E.; Mazzeo, N.; Havens, K.; Lacerot, G.; Liu, Z.; De Meester, L.; et al. Allied attack: Climate change and eutrophication. Inland Waters 2011, 1, 101–105. [Google Scholar] [CrossRef]
- Paerl, H.W.; Paul, V.J. Climate change: Links to global expansion of harmful cyanobacteria. Water Res. 2012, 46, 1349–1363. [Google Scholar] [CrossRef]
- Copp, G.H.; Wesley, K.J.; Vilizzi, L. Pathways of ornamental and aquarium fish introductions into urban ponds of Epping Forest (London, England): The human vector. J. Appl. Ichthyol. 2005, 21, 263–274. [Google Scholar] [CrossRef]
- Dance, K.W. The role of the neighbourhood in rehabilitation of an urban aquatic ecosystem. Water Qual. Res. J. Can. 1997, 32, 245–256. [Google Scholar] [CrossRef]
- Visserij Service Nederland. Beknopt Vangstverslag Afvissing Vijver Langs de Schaepmanlaan in Dongen, 16 Januari 2018; Visserij Service Nederland: Groot-Ammers, The Netherlands, 2018. [Google Scholar]
- Verpoorter, C.; Kutser, T.; Seekell, D.A.; Tranvik, L.J. A global inventory of lakes based on high-resolution satellite imagery. Geophys. Res. Let. 2014, 41, 6396–6402. [Google Scholar] [CrossRef]
- Kietzka, G.J.; Pryke, J.S.; Gaigher, R.; Samways, M.J. 32 years of essential management to retain value of an urban dragonfly awareness pond. Urban Ecosyst. 2021, 24, 1295–1304. [Google Scholar] [CrossRef]
- van Bergen, T.J.H.M.; Barros, N.; Mendonça, R.; Aben, R.C.H.; Althuizen, I.H.J.; Huszar, V.; Lamers, L.P.M.; Lürling, M.; Roland, F.; Kosten, S. Urban pond as greenhouse gas blowhole. Limnol. Oceanogr. 2019, 64, 2129–2139. [Google Scholar] [CrossRef]
- Epe, T.S.; Finsterle, K.; Yasseri, S. Nine years of phosphorus management with lanthanum modified bentonite (Phoslock) in a eutrophic, shallow swimming lake in German. Lake Reserv. Manag. 2017, 33, 119–129. [Google Scholar] [CrossRef]


 |  |  | ||
|---|---|---|---|---|
| Pond→ | Dongen | Eindhoven | Heesch | |
| Characteristic↓ | ||||
| Surface area | 2500 m2 | 6500 m2 | 1600 m2 | |
| Depth | 0.7 m | 1.5 m | 1.0 m | |
| Constructed | 1970 | 1994 | 1974 | |
| Inflow | no | no | no | |
| Outflow | no | yes | no | |
| Water in | precipitation, (pumped) groundwater | precipitation, stormwater run-off | precipitation, groundwater | |
| Water out | evaporation, infiltration, over-flow | evaporation, over-flow | evaporation, infiltration | |
| Main use | recreation, fishing sewage overflow till 2000 | water storage, recreation, fishing | recreation, fishing sewage overflow till 2009 | |
| Banks | wooden revetment | wooden revetment | wooden revetment | |
| Vegetation | no helo-/macrophytes | no helo-/macrophytes | no helo-/macrophytes | |
| Fish sediment resuspending | 1331 kg ha−1 85% | 1254 kg ha−1 77% | 1444 kg ha−1 85% | |
| Pond Dongen | Pond Eindhoven | Pond Heesch |
|---|---|---|
| Dredging * | Dredging and deepening pond # | Excavation ‡ |
| Creating soft banks | Creating soft banks | Creating soft banks |
| Planting macrophytes | Planting macrophytes | Planting macrophytes |
| Prohibiting dog walking | Informing citizens about dog walking (remove faeces) | Removing sewer overflow |
| Informing citizens about feeding ducks/fish | Informing citizens about feeding ducks/fish | Informing citizens about feeding ducks/fish |
| No carp, less baiting | Less carp, less baiting | --- |
| Allow water level fluctuation (less groundwater pumping) | --- | --- |
| --- | --- | Tree harvesting/pruning (prevent leaves in pond |
| Fish stock manipulation | Fish stock manipulation | Fish stock manipulation |
| Fish Species | Fish Stock (kg ha−1) | |||||
|---|---|---|---|---|---|---|
| Pond Dongen | Pond Eindhoven | Pond Heesch | ||||
| Original 1 | Restocked | Original 2 | Restocked | Original 3 | Restocked | |
| Bleak | --- | 16 | --- | --- | --- | 5 |
| Bream | 22.3 | --- | 207.7 | --- | 3.4 | 5 |
| Carp | 1109.9 | --- | 573.8 | --- | 1011.5 | 10 |
| Catfish | --- | --- | --- | --- | 47.1 | --- |
| Gibel-carp | 16.3 | --- | 180.0 | --- | 218.0 | --- |
| Grass-carp | --- | --- | 9.2 | --- | --- | --- |
| Gudgeon | --- | --- | --- | --- | 0.1 | --- |
| Ide | --- | --- | --- | --- | 0.4 | --- |
| Perch | --- | 16 | 6.3 | --- | 2.6 | 5 |
| Pike | --- | 6 | 70.8 | 31 | --- | 5 |
| Pumpkinseed | --- | 0.5 | --- | 0.8 | --- | |
| Roach | 178.1 | 24 | 189.2 | 46 | 30.2 | 5 |
| Rudd | 2.9 | 12 | 3.1 | --- | 5.0 | 10 |
| Silver bream | 1.8 | --- | --- | --- | --- | --- |
| Silver carp | --- | --- | --- | --- | 124.6 | --- |
| Tench | --- | 16 | 13.8 | --- | --- | 5 |
| Total | 1331 | 90 | 1254 | 77 | 1444 | 50 |
| Total Chlorophyll-a Concentrations | |||
| Statistical test | Pond Dongen | Pond Eindhoven | Pond Heesch |
| Normality test | p < 0.05 | p < 0.05 | p < 0.05 |
| Mann–Whitney | U = 149.0 | U = 443.5 | U = 32.0 |
| Rank Sum Test | T53,66 = 4780 p < 0.001 | T56,68 = 4960.5 p < 0.001 | T23,103 = 2613 p < 0.001 |
| Cyanobacteria Chlorophyll-a Concentrations | |||
| Statistical test | Pond Dongen | Pond Eindhoven | Pond Heesch |
| Normality test | p < 0.05 | p < 0.05 | p < 0.05 |
| Mann–Whitney | U = 824.5 | U = 892 | U = 68.0 |
| Rank Sum Test | T53,66 = 3945.5 p < 0.001 | T56,66 = 4400 p < 0.001 | T23,103 = 2577 p < 0.001 |
| Total Phosphorus Concentrations | |||
| Statistical test | Pond Dongen | Pond Eindhoven | Pond Heesch |
| Normality test | p < 0.05 | p < 0.05 | p < 0.05 |
| Mann–Whitney | U = 1.0 | U = 865 | U = 317 |
| Rank Sum Test | T56,65 = 5235 p < 0.001 | T51,67 = 3878 p < 0.001 | T24,100 = 2383 p < 0.001 |
| Total Nitrogen Concentrations | |||
| Statistical test | Pond Dongen | Pond Eindhoven | Pond Heesch |
| Normality test | p < 0.05 | p < 0.05 | p < 0.05 |
| Mann–Whitney | U = 135 | U = 1332 | U = 118 |
| Rank Sum Test | T51,65 = 4506 p < 0.001 | T51,67 = 3411 p = 0.041 | T22,100 = 2335 p < 0.001 |
| Secchi Disc Depth | |||
|---|---|---|---|
| Statistical test | Pond Dongen | Pond Eindhoven | Pond Heesch |
| Normality test | p < 0.05 | p < 0.05 | p < 0.05 |
| Mann–Whitney | U = 197.5 | U = 1296 | U = 10.0 |
| Rank Sum Test | T53,63 = 1628.5 p < 0.001 | T58,68 = 3007 p < 0.001 | T23,100 = 286 p < 0.001 |
| Turbidity | |||
| Statistical test | Pond Dongen | Pond Eindhoven | Pond Heesch |
| Normality test | p < 0.05 | p < 0.05 | p < 0.05 |
| Mann–Whitney | U = 236 | U = 972 | U = 20.5 |
| Rank Sum Test | T52,65 = 4522 p < 0.001 | T57,67 = 4500 p < 0.001 | T23,99 = 2532.5 p < 0.001 |
| Pond Dongen | Pond Eindhoven | Pond Heesch | |||||||
|---|---|---|---|---|---|---|---|---|---|
| Year | CHLa | TP | TN | CHLa | TP | TN | CHLa | TP | TN |
| 2009 | 499.7 | 0.64 | 4.15 | 110.9 | 0.15 | 1.29 | 262.1 | 0.44 | 2.65 |
| 2010 | 285.9 | 0.46 | 2.95 | 93.5 | 0.05 | 0.73 | 24.4 | 0.11 | 0.91 |
| 2011 | 199.8 | 0.43 | 2.70 | 65.1 | 0.08 | 1.01 | 46.5 | 0.11 | 1.35 |
| 2012 | 26.2 | 0.05 | 0.44 | 75.0 | 0.16 | 1.20 | 50.7 | 0.12 | 0.61 |
| 2013 | 7.7 | 0.02 | 0.84 | 31.8 | 0.04 | 1.08 | 19.2 | 0.05 | 0.85 |
| 2014 | 13.1 | 0.03 | 0.67 | 32.4 | 0.05 | 0.57 | 35.3 | 0.04 | 0.31 |
| 2015 | 21.1 | 0.04 | 0.19 | 22.2 | 0.03 | 0.27 | 35.5 | 0.05 | 1.32 |
| 2016 | 25.7 | 0.04 | 0.72 | 20.8 | 0.04 | 0.62 | 19.0 | 0.03 | 1.12 |
| 2017 | 12.1 | 0.04 | 0.22 | 26.2 | 0.04 | 0.38 | 29.5 | 0.06 | 0.52 |
| 2018 | 6.7 | 0.02 | 1.17 | 40.9 | 0.03 | 1.34 | 10.3 | 0.02 | 1.52 |
Disclaimer/Publisher’s Note: The statements, opinions and data contained in all publications are solely those of the individual author(s) and contributor(s) and not of MDPI and/or the editor(s). MDPI and/or the editor(s) disclaim responsibility for any injury to people or property resulting from any ideas, methods, instructions or products referred to in the content. |
© 2023 by the authors. Licensee MDPI, Basel, Switzerland. This article is an open access article distributed under the terms and conditions of the Creative Commons Attribution (CC BY) license (https://creativecommons.org/licenses/by/4.0/).
Share and Cite
Lürling, M.; van Oosterhout, F.; Mucci, M.; Waajen, G. Combination of Measures to Restore Eutrophic Urban Ponds in The Netherlands. Water 2023, 15, 3599. https://doi.org/10.3390/w15203599
Lürling M, van Oosterhout F, Mucci M, Waajen G. Combination of Measures to Restore Eutrophic Urban Ponds in The Netherlands. Water. 2023; 15(20):3599. https://doi.org/10.3390/w15203599
Chicago/Turabian StyleLürling, Miquel, Frank van Oosterhout, Maíra Mucci, and Guido Waajen. 2023. "Combination of Measures to Restore Eutrophic Urban Ponds in The Netherlands" Water 15, no. 20: 3599. https://doi.org/10.3390/w15203599
APA StyleLürling, M., van Oosterhout, F., Mucci, M., & Waajen, G. (2023). Combination of Measures to Restore Eutrophic Urban Ponds in The Netherlands. Water, 15(20), 3599. https://doi.org/10.3390/w15203599