Article

Numerical Study of the Influence of Horizontal Spatial Distribution of Macropores on Water Infiltration

1
School of Civil Engineering, Hefei University of Technology, Hefei 230009, China
2
Bengbu Investment Group Co., Ltd., Bengbu 233099, China
3
School of Resources and Environmental Engineering, Hefei University of Technology, Hefei 230009, China
*
Authors to whom correspondence should be addressed.
Water 2023, 15(20), 3593; https://doi.org/10.3390/w15203593
Submission received: 20 September 2023 / Revised: 10 October 2023 / Accepted: 11 October 2023 / Published: 13 October 2023
(This article belongs to the Section Soil and Water)

Abstract

:
The existence of macropores acutely enhances the capacity of soil to conduct water, gas, and chemicals. The capacity of macropores to transport water extremely depends on their spatial characteristics. However, the effect of the horizontal spatial distribution of macropores (especially the position characteristics of macropores) on water infiltration is still ambiguous. Therefore, this study utilizes the approach of numerical simulation to investigate the general pattern of the effects of horizontal spatial distribution characteristics of macropores (such as number, pore size and position) on water infiltration. Given the limitations on the ability to characterize the macropore position from the existing spatial characteristic parameters of macropores, two new statistical parameters (spatial dispersion, γ , and spatial deviation, γ * ) are established to characterize the position relationships among macropores and between the macropores and the observation area, respectively. The results show that the larger the macropore number and the more uniformly macropores are distributed, the greater the soil permeability and the preferential flow degree, while the pore size hardly affects the water transport. Additionally, comparison between number and position effects reveals that the macropore number is the dominant factor when the macropore number is relatively small, but this relationship will reverse when the macropore number is relatively large. This study provides a novel meals to investigate the effect of macropore position on water infiltration, and emphasizes that besides the macroporosity, number and position are also significant for quantifying soil permeability.

1. Introduction

In recent decades, soil macropores have received much attention from soil scientists and hydrologists because of their excellent performance in promoting the circulation of water and solutes in soil [1,2,3]. Although the volume of soil occupied by macropores is sometimes relatively small, it can still dominate water transport, particularly when the soil is saturated or near-saturated [4,5,6].
Due to different macropore spatial characteristics, the capacity of soil to conduct water is different [7,8,9]. The capacity of macropores to transport water extremely depends on their spatial characteristics [10,11,12]. For example, macroporosity, number of macropores, pore length, pore size distribution, continuity, tortuosity, connectivity, etc., have been demonstrated to be exceedingly significant factors for the macropore flow [13,14,15,16,17]. Allaire et al. [18] studied artificial macropores with different continuity and tortuosity, and found that tortuosity only affected the spatial distribution of solutes in the soil, while the continuity of macropores was much more important than the tortuosity. Later, Luo et al. [19] noted that macroporosity and path number of macropores are the best predictors of K s a t (saturated hydraulic conductivity) by studying the permeability and dispersion of 8 soil columns with 24 soil layers using computed tomography (CT) technology [20]. Recently, Zhang et al. [21] combined the method of digital tin casting with numerical simulation and found that increasing the length and number of macropores would increase the infiltration efficiency of soil water, and the macroporosity of the through burrows is the best predictor of K s a t (correlation coefficient = 0.96). Among these spatial characteristics, macroporosity (or relative macroporosity at the soil surface, w f ) is significantly correlated with hydraulic conductivity, which has been recognized by many scholars [22,23,24]. Nevertheless, the horizontal spatial distribution characteristics of macropores, which may be caused by the movement of soil organisms [25,26] or the stress–strain [27,28], also affect water infiltration, even with the same macroporosity.
For instance, the movement of soil macrofauna and mesofauna dramatically alters the pore space in the soil and forms macropores [25,26], but the pore spaces altered by them have different structural characteristics [26]. Macropores produced by soil macrofauna tend to be fewer in number and larger in average pore size, while macropores produced by mesofauna tend to be more in number and smaller in average pore size [29]. Additionally, the pore size distribution and position of macropores will also impact water infiltration into soil [19,30]. Xin et al. [30] found that changes in the distribution pattern of macropores seemed to affect the transport of pollutants in the field [31,32,33]. Therefore, the influences of the horizontal spatial distribution characteristics of macropores on water infiltration are worth investigating, and can help us understand the transport dynamics and guide field applications [34,35]. However, there are few studies on the influence of the position of macropores on water infiltration. As far as we know, it is difficult to characterize the macropore position (such as the position relationship among macropores and the position relationship between macropores and observation area) using the existing spatial characteristic parameters of macropores (such as number, pore size, etc.).
In addition, taking into account the influence of all macropore horizontal spatial distribution characteristics via laboratory experiments is difficult, especially the influence of position (macropores may distribute in any position). The numerical simulation method can avoid this experimental limitation and comprehensively analyze the influence of different factors on the results, and generate more basic data for mechanism study [36,37]. By now, numerical simulation has become a popular approach to study soil macropore flow [8,21,38,39], and has performed excellently for studying infiltration [40], preferential flow [41], runoff [42,43], evapotranspiration [44] and so on.
The purposes of this study are: (1) In order to discuss the influence of macropore position on water infiltration, two statistical parameters (spatial dispersion and spatial deviation) are proposed to characterize the macropore position at the soil surface. (2) To investigate the effects of the horizontal spatial distribution characteristics of macropores (number, pore size and position) on water infiltration, the numerical simulation method is used under the condition of keeping macroporosity unchanged. (3) The influence of each macropore parameter on water infiltration is compared to provide a reference for laboratory experiments, numerical simulations and even field research on macropore flow.

2. Materials and Methods

2.1. Modeling Scheme

The model is a cuboid with a length of 50 cm width of 50 cm and height of 25 cm (as shown in Figure 1a). In order to exclude the influence of other factors (such as tortuosity, circularity, connectivity, etc.) on the results and avoid a high computing cost when dealing with irregular macropores and generating meshes [45], a simplified macropore structure is utilized for numerical simulation in this study (the horizontal spatial distribution state of macropores can be represented by the distribution state of macropores at the soil surface) [30,44,46]. The model consists of macropores (surface-connected vertical cylindrical macropores with a length of 14 cm) and a matrix. To investigate the influence of the horizontal spatial distribution characteristics of macropores on water infiltration, we keep the relative macroporosity at the soil surface unchanged at 0.6‰ and carry out numerical simulations. As shown in Figure 1b, the simulations include 30 cases with different macropore numbers (including 1 to 20, 25, 30, 35, 40, 50, 60, 70, 80, 90 and 100) and each case also includes 400 numerical simulations of random pore sizes and positions (both the sectional area and the position coordinates of macropores at the soil surface are subject to uniform distribution; see Appendix A for details). The values of characteristic parameters (such as macroporosity and length, etc.) in this study are based on the shape parameters measured at Lvyuan Experimental Station [21,47]. Abundant random simulations are conducted here to ensure the spatial distribution of modeled macropores is close to the spatial distribution of inartificial macropores, and to reduce the influence of accidental factors on obtaining the general conclusions and rules of the projects we study [48,49].

2.2. COMSOL Simulation

COMSOL Multiphysics is computer software for simulating physical field issues based on the finite element method, which has efficient computational performance and outstanding analysis capability for coupling multi-physics field. It has been applied to geoscience [50,51], electricity [52], mechanical engineering [53], and so on. It is favorable to identify the relationship between macropore structure and soil hydraulic parameters [45,54]. In this study, the Subsurface Flow module of COMSOL Multiphysics 6.0 is used to simulate the water transport in soil. Simulations are produced under saturation conditions. The Darcy law is applied to all domains of the model [55,56,57]:
K · H p + z = 0
where K is the hydraulic conductivity [MT−1], Hp is the pressure head [L] and z is height, which is positive upwards [L]. As shown in Figure 1a, water flows in from the surface of the soil (pressure head equals 0) and out from the bottom of the soil (pressure head equals 0), and other boundaries are set as no-flow boundary conditions [58,59]. Water is driven entirely by gravity. Following Xin et al. [30], the macropore domain in the model is defined as the super-permeability zone [60,61]. The hydraulic conductivities of the macropore and matrix domain in the model are 1 m/s and 1.23 × 10⁻⁵ m/s, respectively, and the porosities of the macropore and matrix domain in the model are 1 and 0.41, respectively [21].

2.3. Statistical Parameters for Characterizing Macropore Position

The macropore position can affect the water and solute transport capacity of soil [30], and the existing parameters describing the spatial characteristics of macropores (such as macroporosity, number, pore size, connectivity, tortuosity, hydraulic radius, path number, mean angle, etc. [62,63,64]) are difficult to use to characterize the macropore position. Therefore, this study establishes two two-dimensional statistical parameters to characterize the position relationships among macropores and between the macropores and the observation area, which can be combined to characterize the macropore position to a certain extent.

2.3.1. Spatial Dispersion, γ (Position Relationship among Macropores)

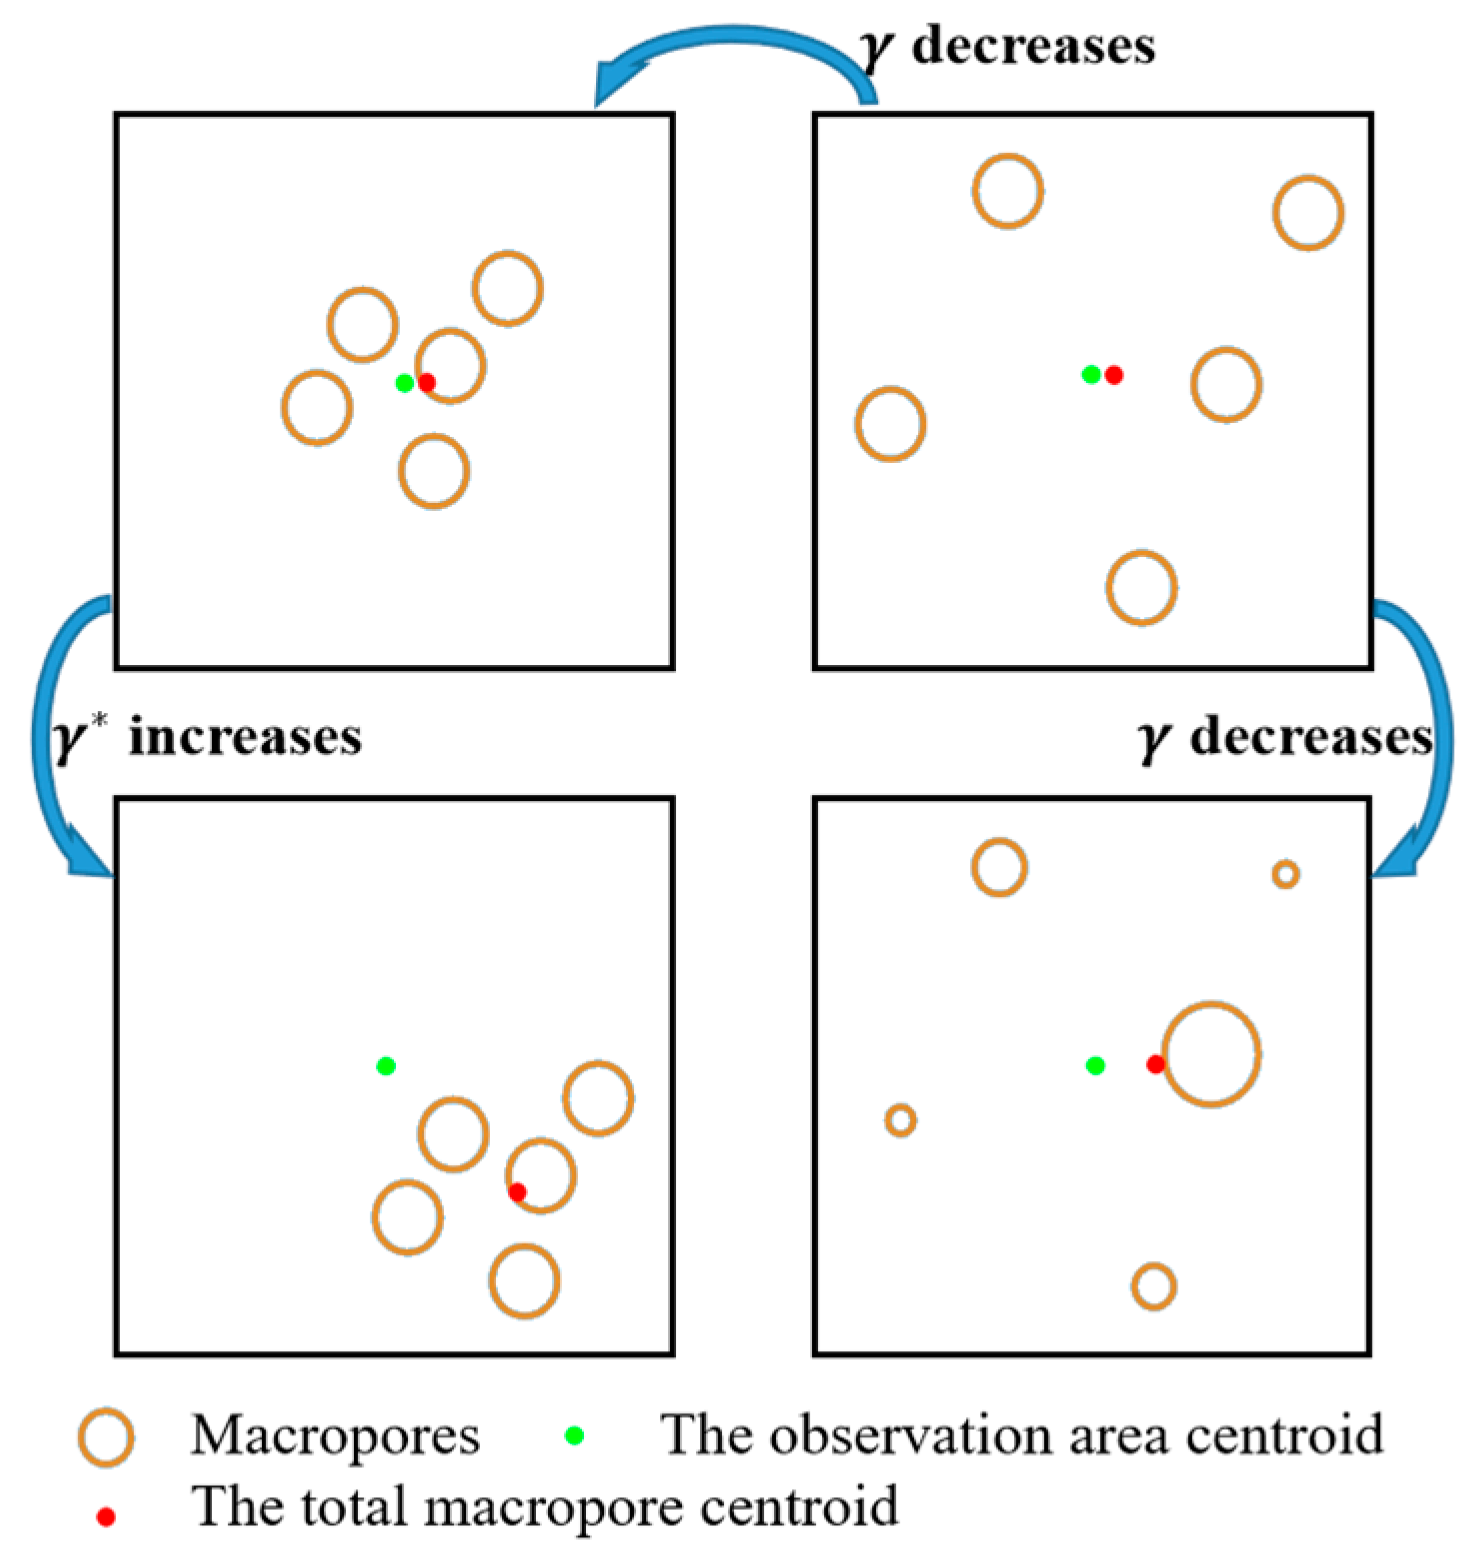
The position of the sectional centroid [65,66] of the macropores at the soil surface represents the macropore position in this study. The concept of weighted mean distance is used to establish the spatial dispersion. First, a Cartesian coordinate system is established at the soil surface; then, the coordinates of the total macropore position are calculated as:
x c = i = 1 N S i x i i = 1 N S i
y c = i = 1 N S i y i i = 1 N S i
where x i is the abscissa of the centroid of the i-th macropore [L], y i is the ordinate of the centroid of the i-th macropore [L], x c is the abscissa of the total macropore centroid [L], y c is the ordinate of the total macropore centroid [L], and S i is the sectional area of the i-th macropore at the soil surface [L2] (as shown in Figure 2). Subsequently, the spatial dispersion, γ , is calculated as follows:
γ = i = 1 N S i L i S w f
where L i is the distance between the centroid of the i-th macropore and the total macropore centroid [L], S is the soil surface area [L2], and w f is the relative macroporosity at the soil surface (dimensionless).
Spatial dispersion can characterize the position relationship among macropores at the soil surface. The more concentrated the horizontal spatial distribution of macropores, the smaller spatial dispersion (as shown in Figure 2) (see Appendix B for details).

2.3.2. Spatial Deviation, γ * (Position Relationship between the Macropores and Observation Area)

In the previous section, we established the spatial dispersion to characterize the position relationship among macropores. However, describing only the position relationship among macropores cannot completely characterize the position of the macropores. We need another parameter to characterize the position relationship between the macropores and the observation area. Therefore, another parameter (spatial deviation) for co-working with spatial dispersion is established. The formula for calculating spatial deviation, γ * , is as follows:
γ * = 2 L * S
where L * is the distance between the total macropore centroid and the observation area centroid. Obviously, deviating the position of all macropores from the observation area centroid will increase the spatial deviation (as shown in Figure 2).

3. Results and Discussion

3.1. The Effect of Macropore Number

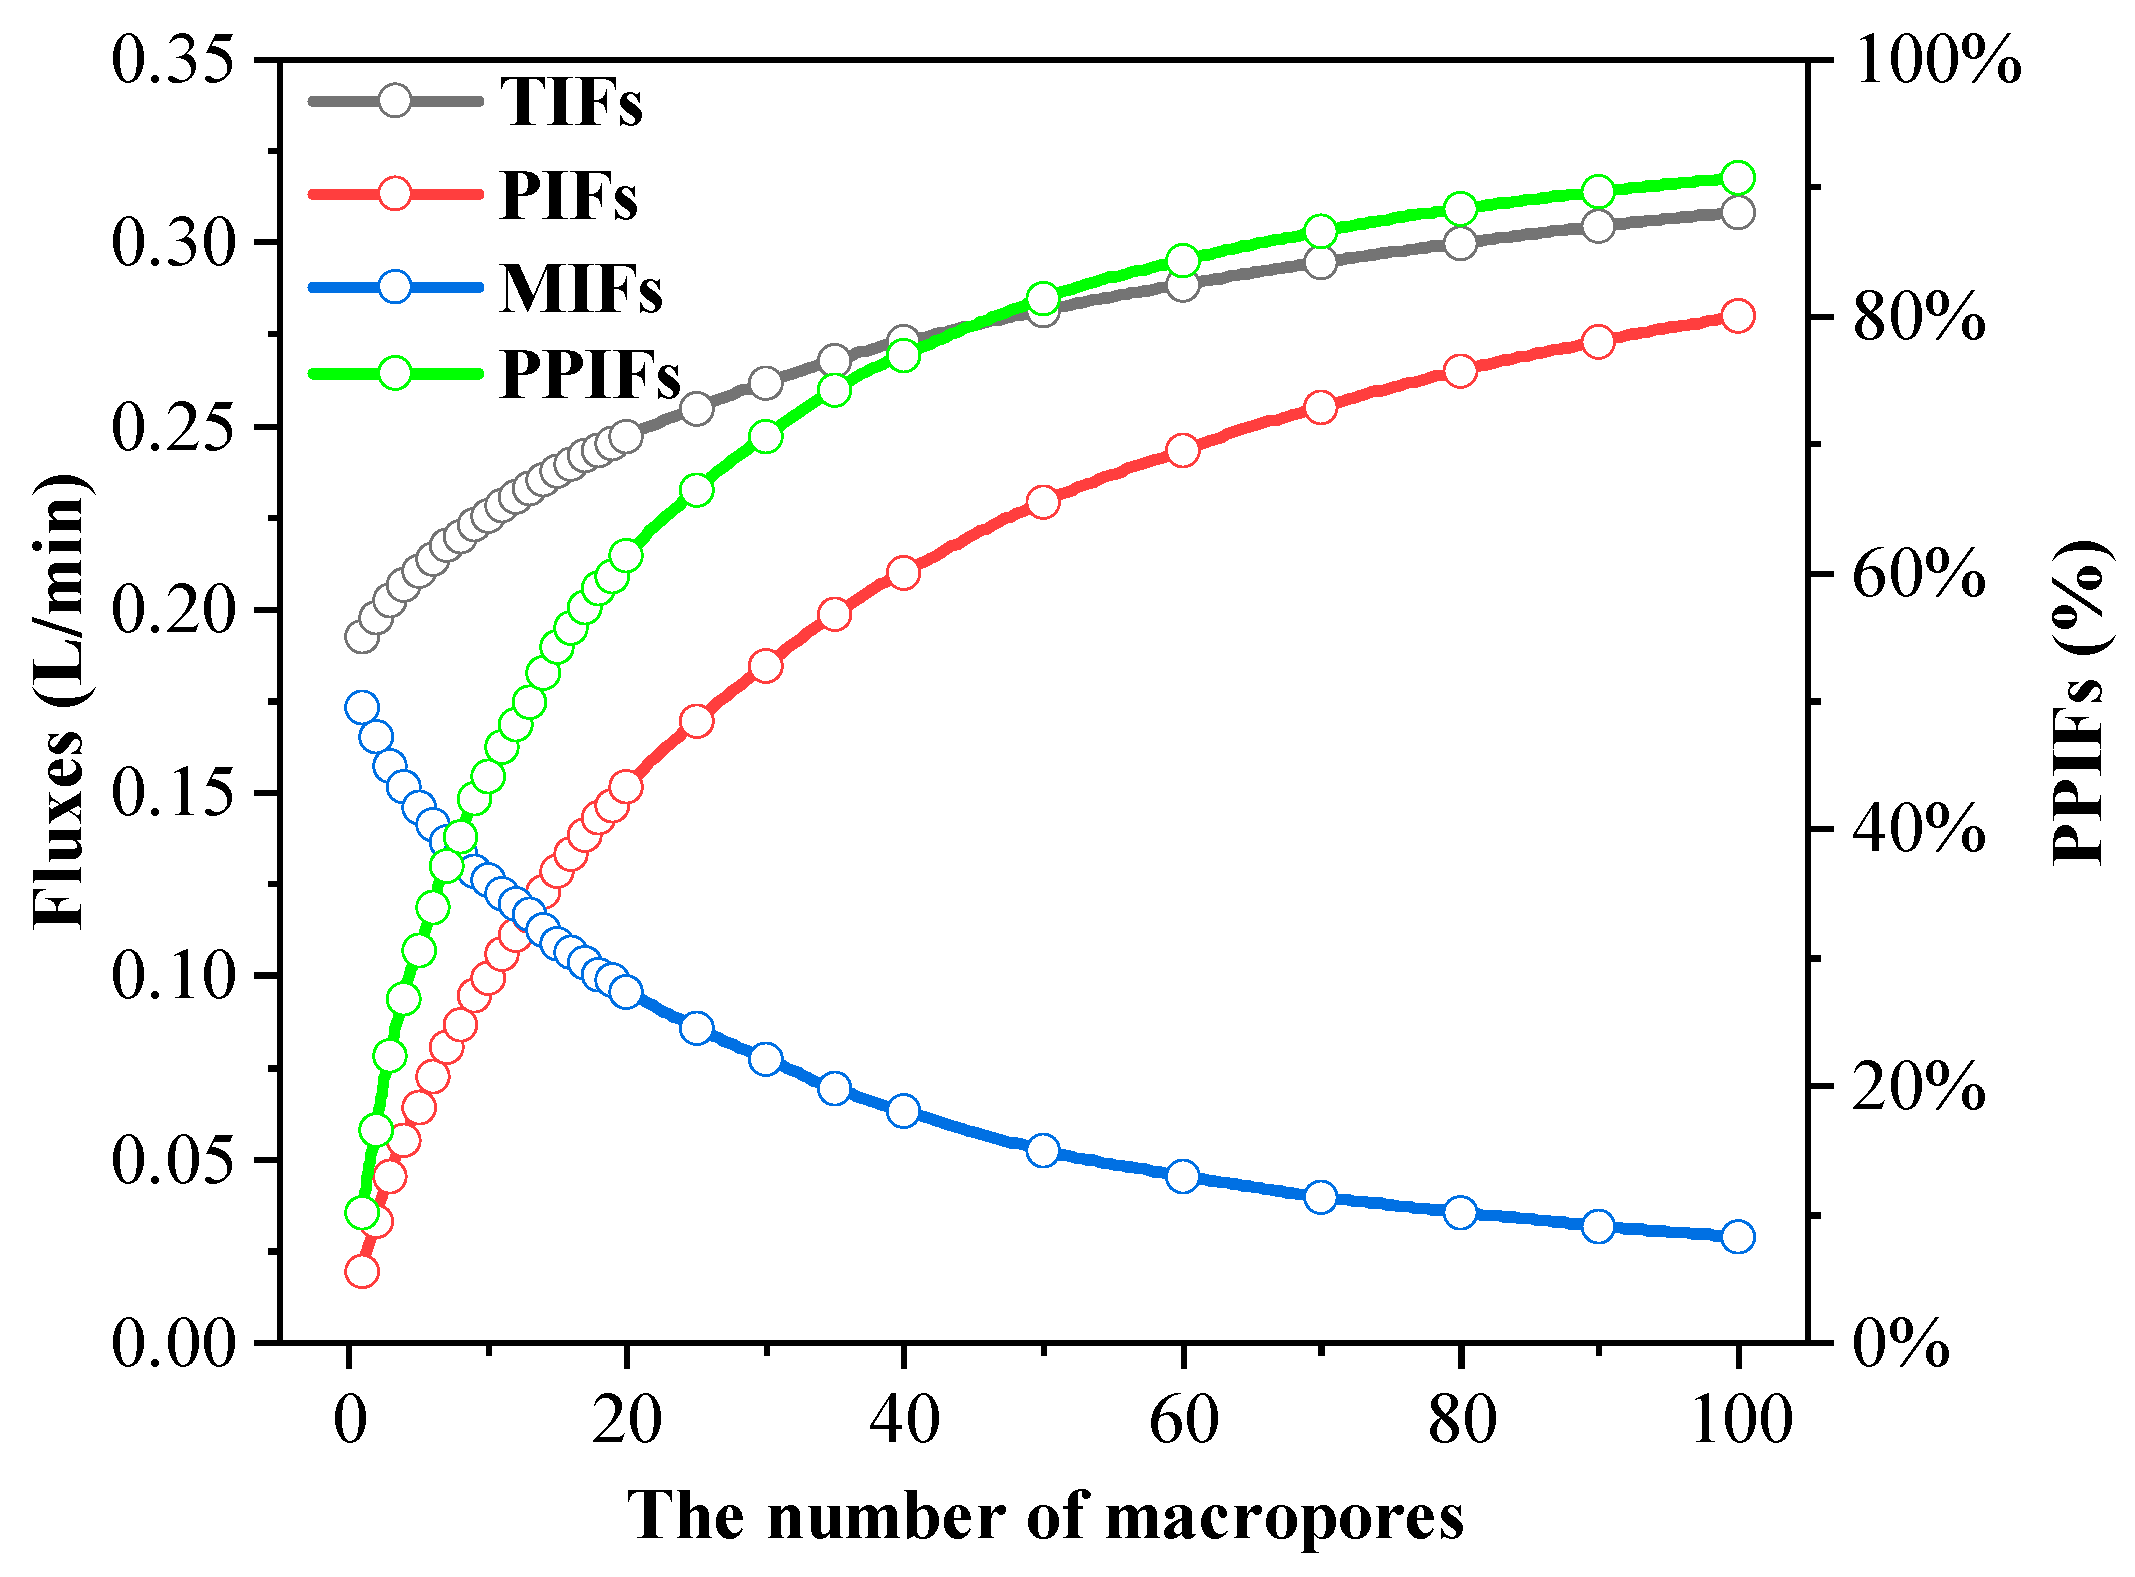
To diminish the influence of other macropore characteristics on results and obtain general conclusions about the effect of number on soil permeability, 400 numerical simulations of random pore sizes and positions are included for each macropore number. We calculated the expected value of the total infiltration fluxes (TIFs), the preferential infiltration fluxes (PIFs) at the soil surface (seepage into the soil through macropores), the matrix infiltration fluxes (MIFs) at the soil surface (seepage into the soil through the matrix) and the proportion of preferential infiltration fluxes (PPIFs) (the ratio of PIFs to TIFs) with different number of macropores (as shown in Figure 3). Figure 3 indicates that there is a significant correlation between the soil permeability and the macropore number. As the macropore number increases from 1 to 100, the TIFs increase from 0.1926 L/min to 0.3082 L/min and the PPIFs increase from 10.07% to 90.76%. The existence of macropores enhances the water conductivity of the soil. Water can be transported much more quickly to deep soil through macropores [67]. Although macroporosity (the key factor) remains unchanged in this study, the increase in the number of macropores still significantly enhances the soil permeability and the preferential flow degree, which denotes that the macropore number is also a considerable factor when evaluating macropore flow (or preferential flow). This is in agreement with previous conclusions [19,21,22,68]. The difference is that the influence of number shows asymptotic behavior in this study (as shown in Figure 3), while soil permeability is linearly correlated with number in previous reports. In previous studies, a greater number of macropores is usually associated with greater macroporosity [63,69,70]. However, we keep macroporosity constant, which may be the reason for the asymptotic behavior of the influence of number in this study.
In addition, with an increase in macropore number, PIFs increase from 0.0194 L/min to 0.2798 L/min, while MIFs decrease from 0.1732 L/min to 0.0285 L/min. Water infiltration gradually converts from matrix-dominated to macropore-dominated. Compared to TIFs (minimum equals 0.193 L/min and maximum equals 0.308 L/min), macropore number more significantly impacts PPIFs (minimum value of 10.07% and maximum value of 90.76%). More than 50% of the water will infiltrate to deep soil through macropores when the macropore number exceeds 14, which will accelerate the invasion of surface pollutants into the soil [71,72] and make removing pollutants that are already attached to the soil more difficult [73,74,75].

3.2. The Effect of Pore Size

Even when both macroporosity and number are the same, different pore sizes and positions have an effect on the water infiltration [30,76]. Therefore, in this section, the mean and standard deviation of pore diameter are used as indicators to discuss the effect of pore size on water infiltration.
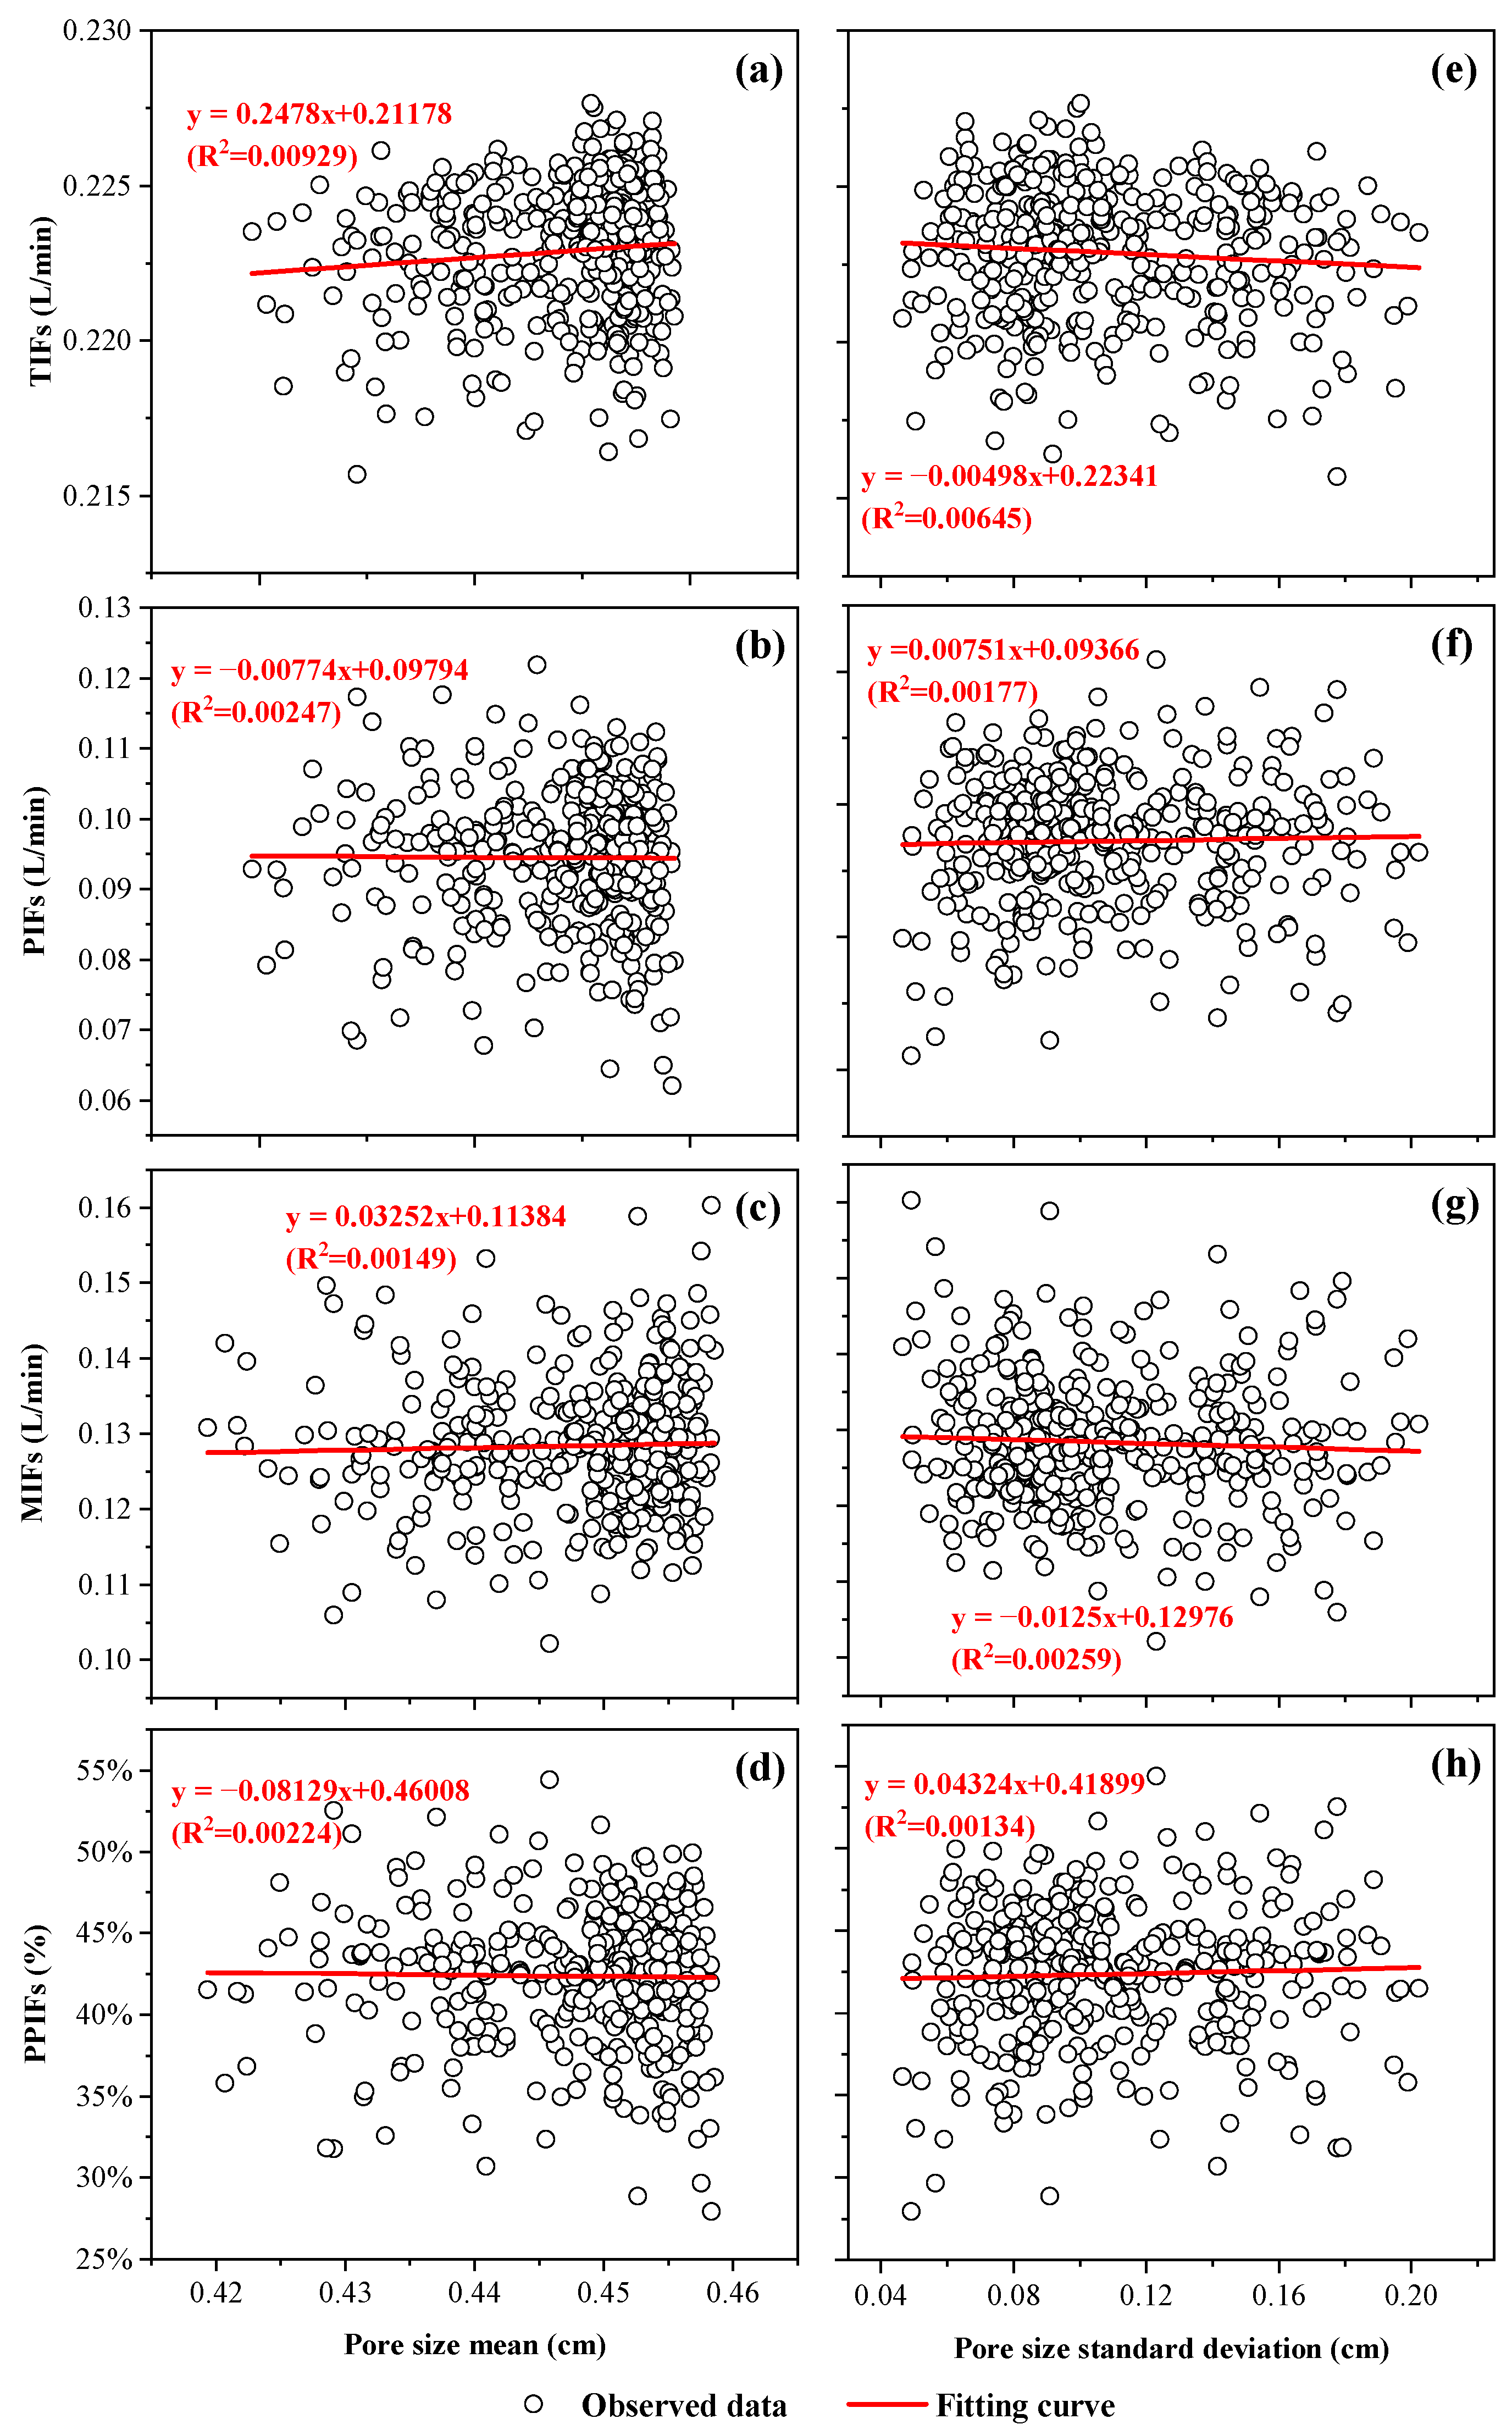
The macropore number of 9 is taken as an example in this section (conclusions obtained with different numbers are basically the same; see https://doi.org/10.5281/zenodo.8354308 (accessed on 10 October 2023) for details). Figure 4 shows the regression relationship between four hydraulic evaluation indexes (TIFs, PIFs, MIFs and PPIFs) and the mean and standard deviation of pore size. Figure 4 indicates that although the soil permeability and preferential flow degree tend to increase with augmentation in the mean pore size and reduction in the pore size standard deviation (that is, the diameters of the macropores tend to be equal), the correlation between them is very low. The threshold values of these evaluation indexes are practically invariable when the pore size changes. Alterations in pore size will hardly affect the soil permeability and preferential flow degree. We also analyzed the effect of pore size distribution and median on water transport, which comes to the same conclusion (not shown here since the results are identical). In fact, the effect of pore size on water infiltration is a very controversial issue. Zhang et al. [21] considered other characteristics of macropores (such as connectivity, length, etc.) to be more important than pore size [77,78,79], while Cheik et al. [22] believed that pore size is the most important factor to explain K s a t in addition to macroporosity [76,80]. Jačka et al. [81] even discovered that overall porosity does not correspond with infiltration of tracer dye and K s a t , which seem to be driven more by pore size distribution and pore connectivity, when studying the effects of different tree species on water infiltration and preferential flow. Due to the randomness and complexity of macropore development in nature, different pore size distributions in macropores always imply other different characteristics [70,82,83,84], which inevitably leads to the conclusion that undisturbed soil experiments cannot exclude other factors from interfering with the results. This study avoids this problem by controlling factors when conducting numerical simulation, which may make the conclusions obtained in this study more valuable.

3.3. The Effect of Macropore Position

The pore size hardly affects the water infiltration, which means the effect of position may be more pronounced. Therefore, the effect of macropore position is discussed in this section.
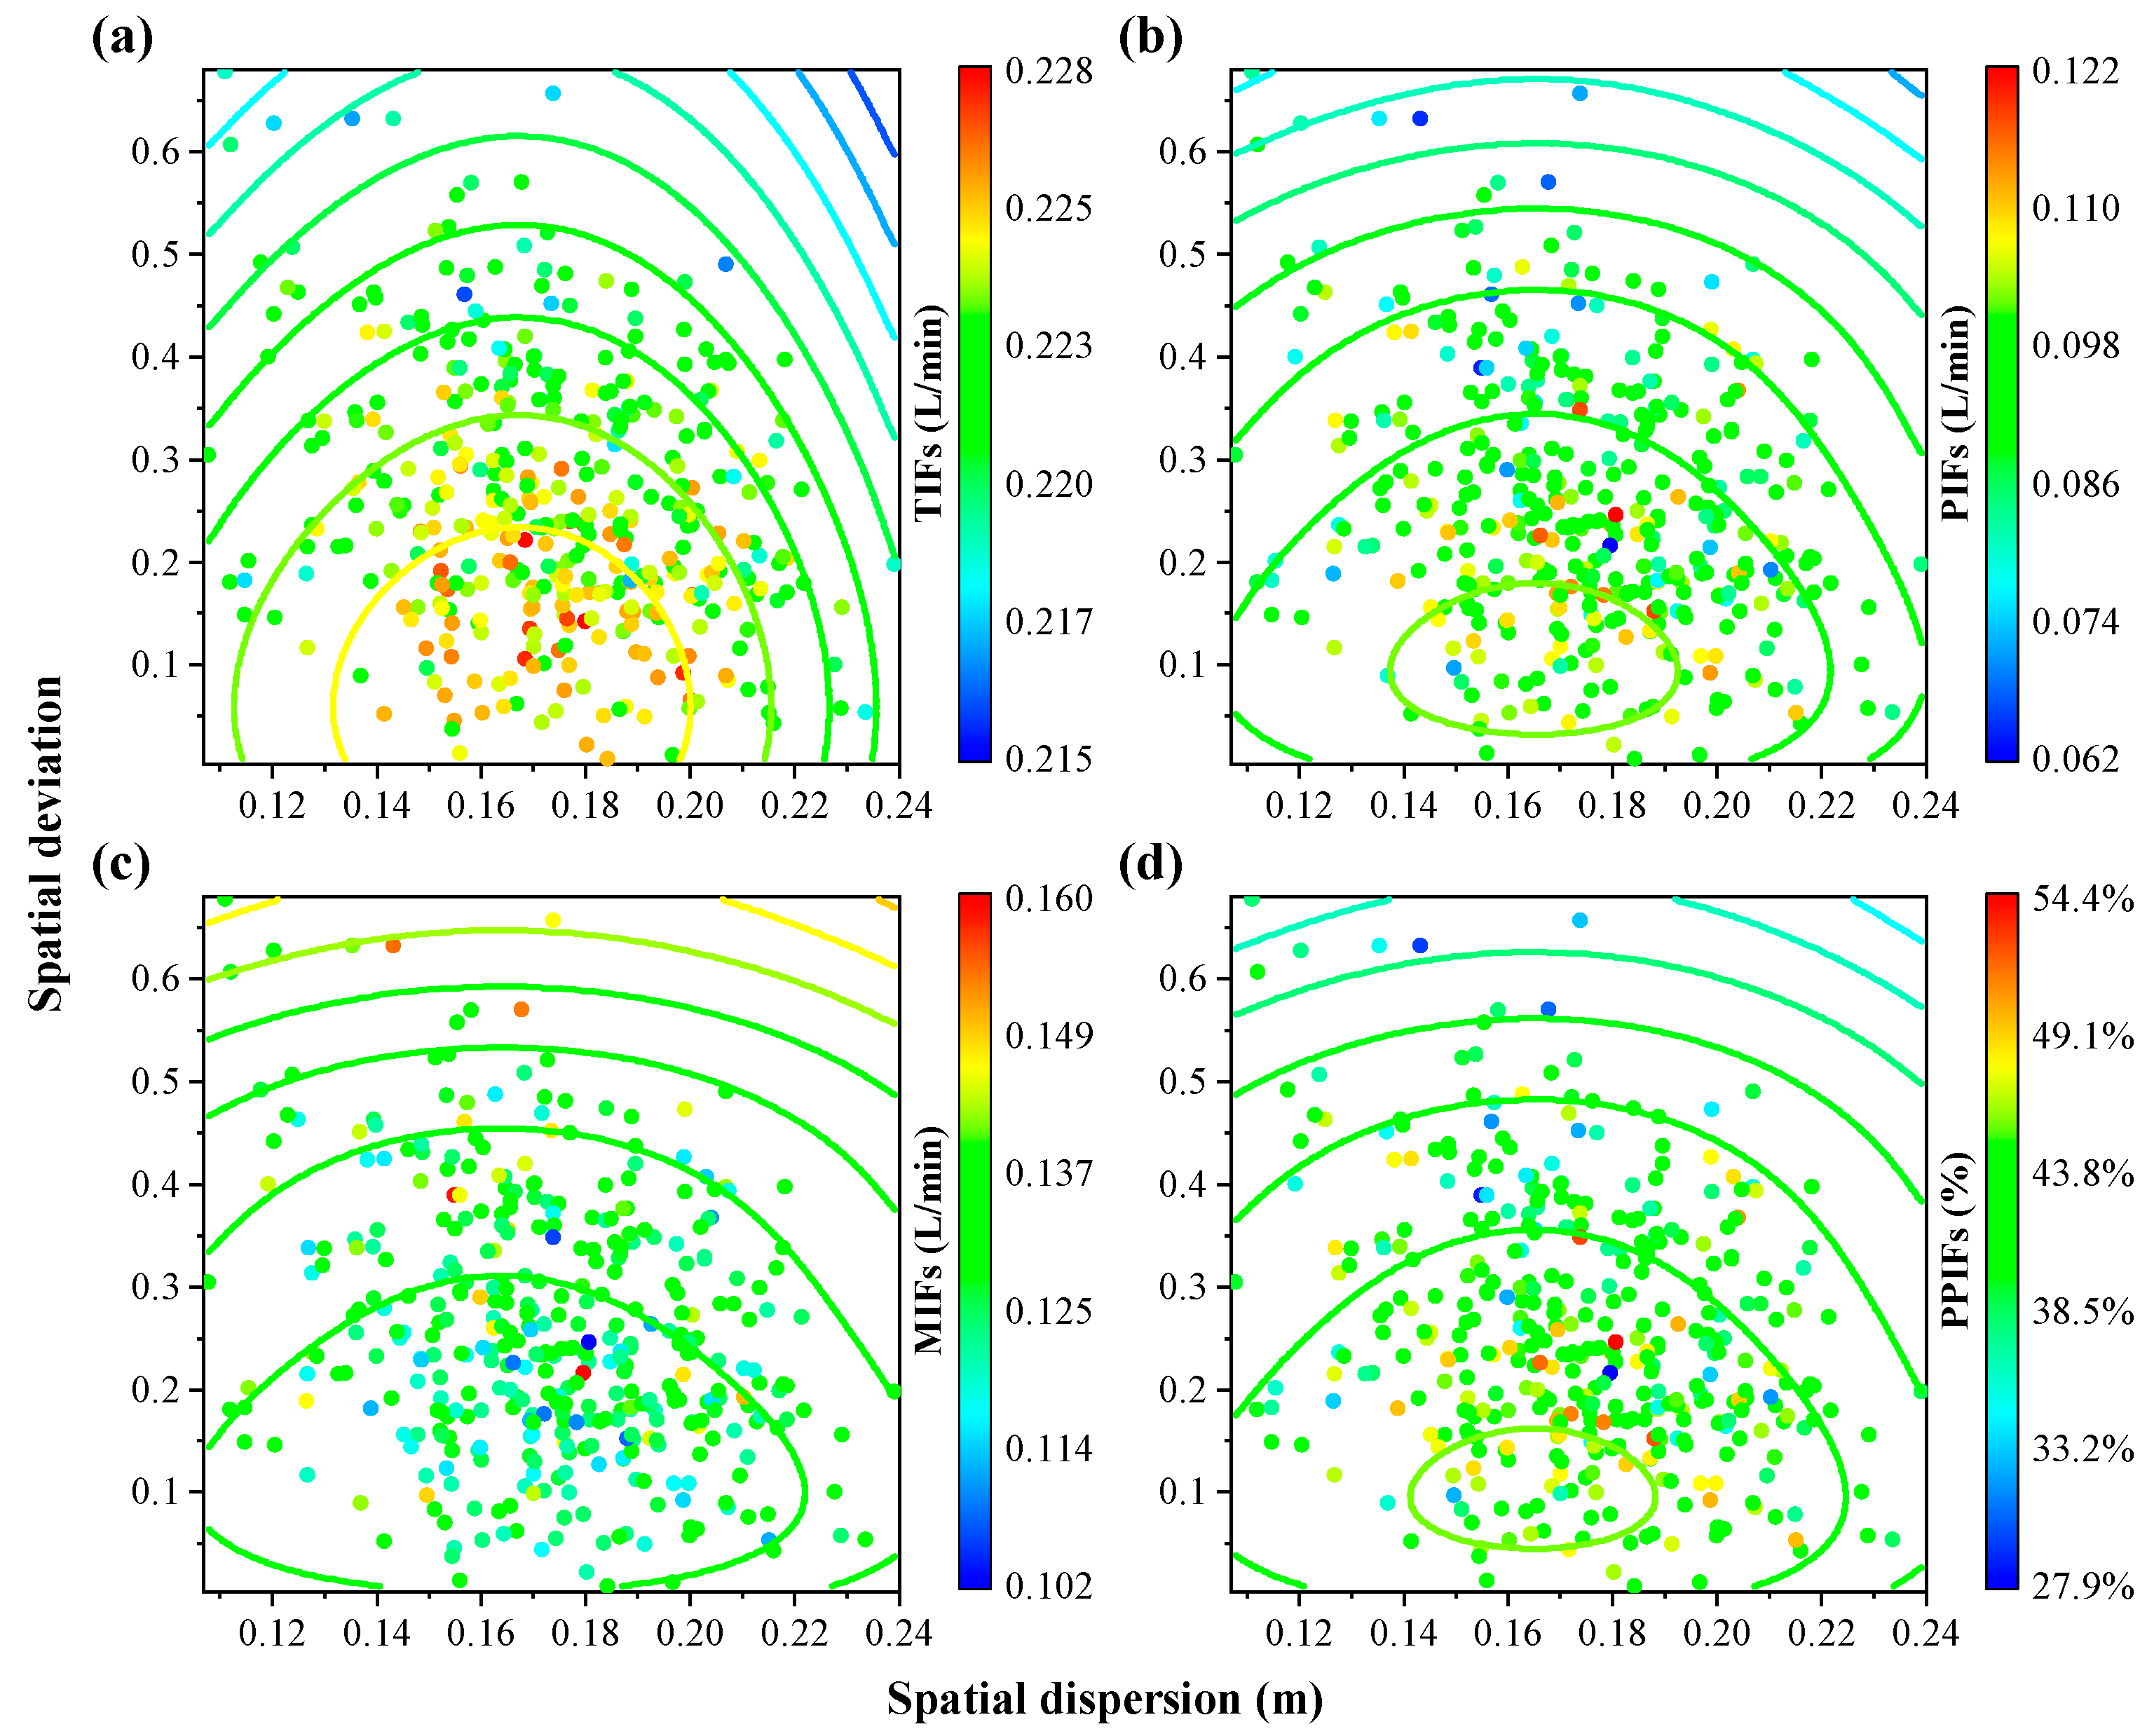
The macropore number of 9 is still taken as an example in this section (conclusions obtained with different numbers are basically the same; see https://doi.org/10.5281/zenodo.8354308 (accessed on 10 October 2023) for details); we calculated γ and γ * for each simulation and plotted the relationship between these two parameters and four hydraulic evaluation indexes (TIFs, PIFs, MIFs and PPIFs) as shown in Figure 5 (the equation used for surface fitting is the binary fifth order polynomial without cross terms). Figure 5 shows that TIFs, PIFs, and PPIFs increase with an increase in spatial deviation, while MIFs display the opposite. Furthermore, TIFs, PIFs and PPIFs initially increase and decrease afterwards as the spatial dispersion increases (MIFs display the opposite), and this phenomenon is more obvious with a decrease in spatial deviation.
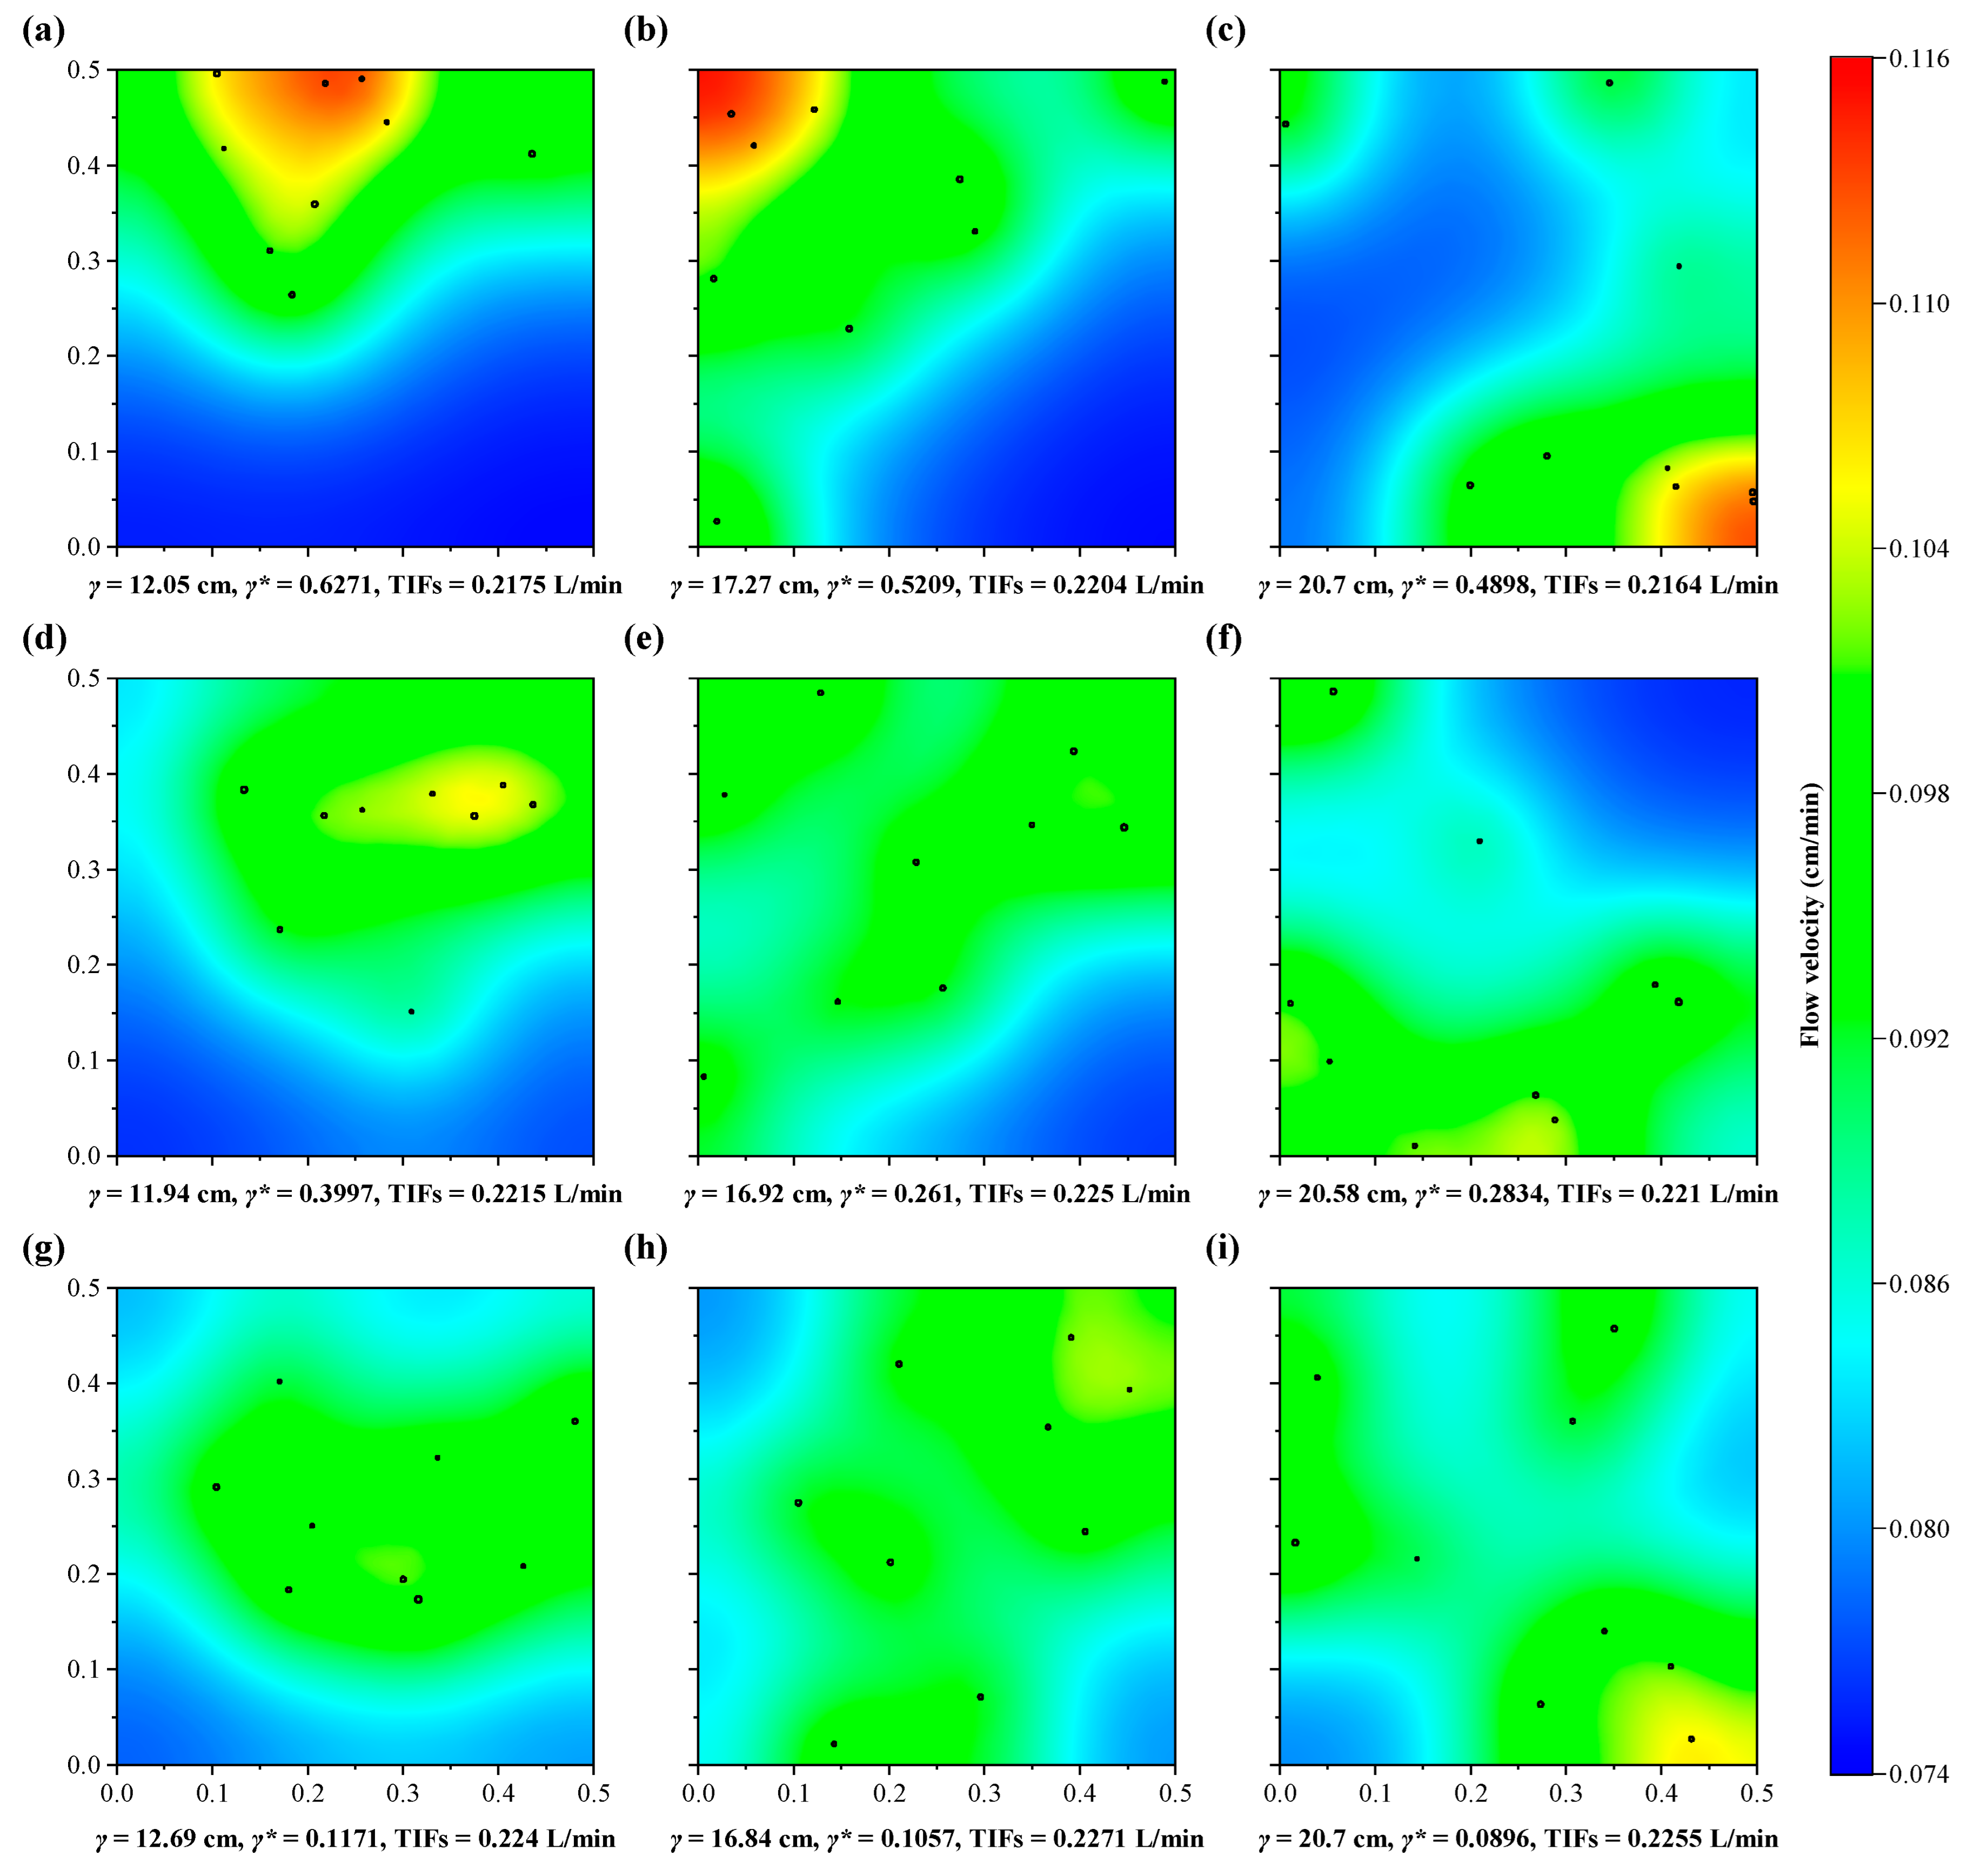
We further analyzed the above phenomena. The flow rate distribution at the bottom of the model was calculated (as shown in Figure 6, the spatial deviation decreases from top to bottom, and the spatial dispersion increases from left to right). Figure 6 indicates that the influence of macropores on the flow rate seems to have a range effect. The flow rate is drastically affected in this range, while the flow rate outside this range seems to be scarcely affected by macropores. The influence ranges of different macropores can even be interconnected and superimposed if there is not only one macropore. However, similar to well flow, the superimposed result is smaller than the sum of individual results [85,86,87]. The interaction between the macropores is particularly dramatic when the spatial dispersion is relatively small, which limits the promoting effect of each macropore. The side walls also restrict macropores from transporting water when the spatial dispersion is relatively large (which is also the reason why the flow rate is small when the space deviation is relatively large) (as shown in Figure 6). Thus, the more uniformly macropores distribute, the stronger the promotion by macropores of soil permeability and preferential flow degree.
In addition, the effect of macropore position on preferential flow degree is more significant (minimum equals 27.93%, maximum equals 54.39%) compared with the influence on TIFs (minimum equals 0.2158 L/min, maximum equals 0.2277 L/min), which is similar to the effect of number on water transport. This phenomenon denotes that the preferential flow degree is more sensitive to this parameter than the equivalent hydraulic conductivity. In nature, the spatial morphology and distribution of macropores is highly variable [83,88], and biological activities in the soil will also produce different soil structures [89,90,91]. Utilizing spatial dispersion and spatial deviation simultaneously can effectively characterize the positions of macropores and study their influence on water transport, which also provides a new approach for studying macropore structure characteristics.

3.4. Comparison between Number and Position Effects

Based on the above analysis, we can note that both number and position can significantly affect water infiltration, but it is not clear which plays the predominant role.
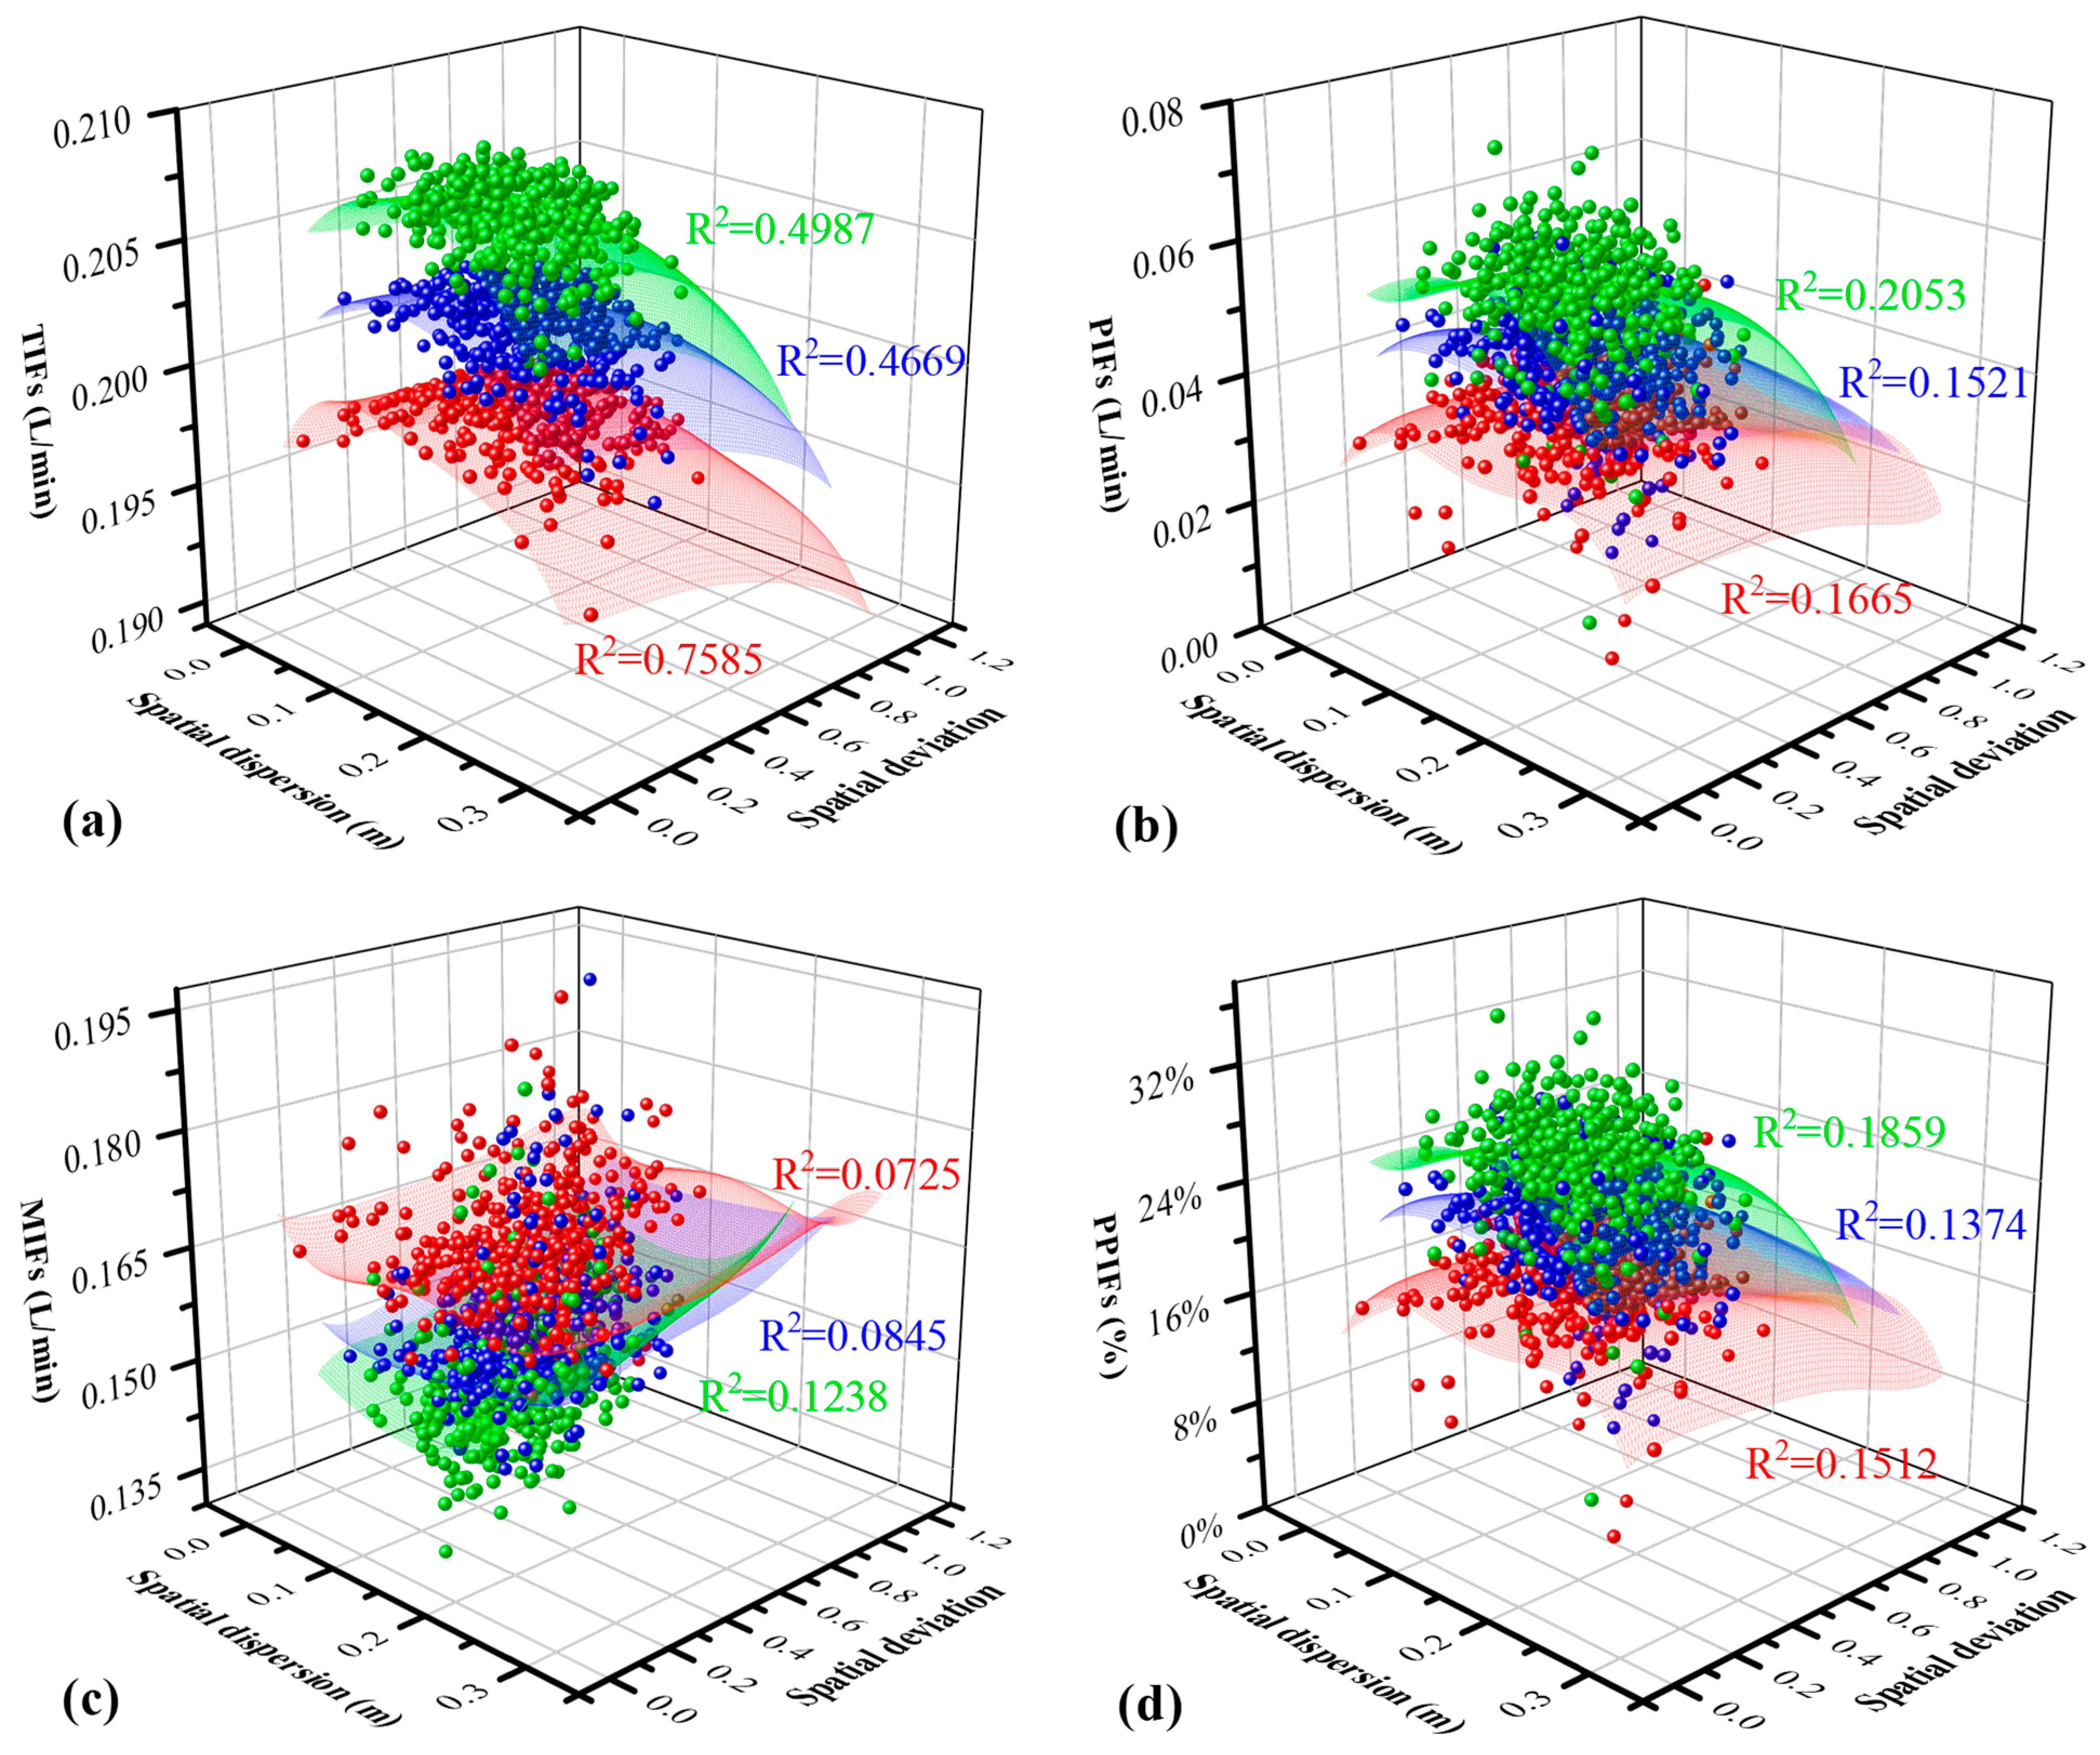
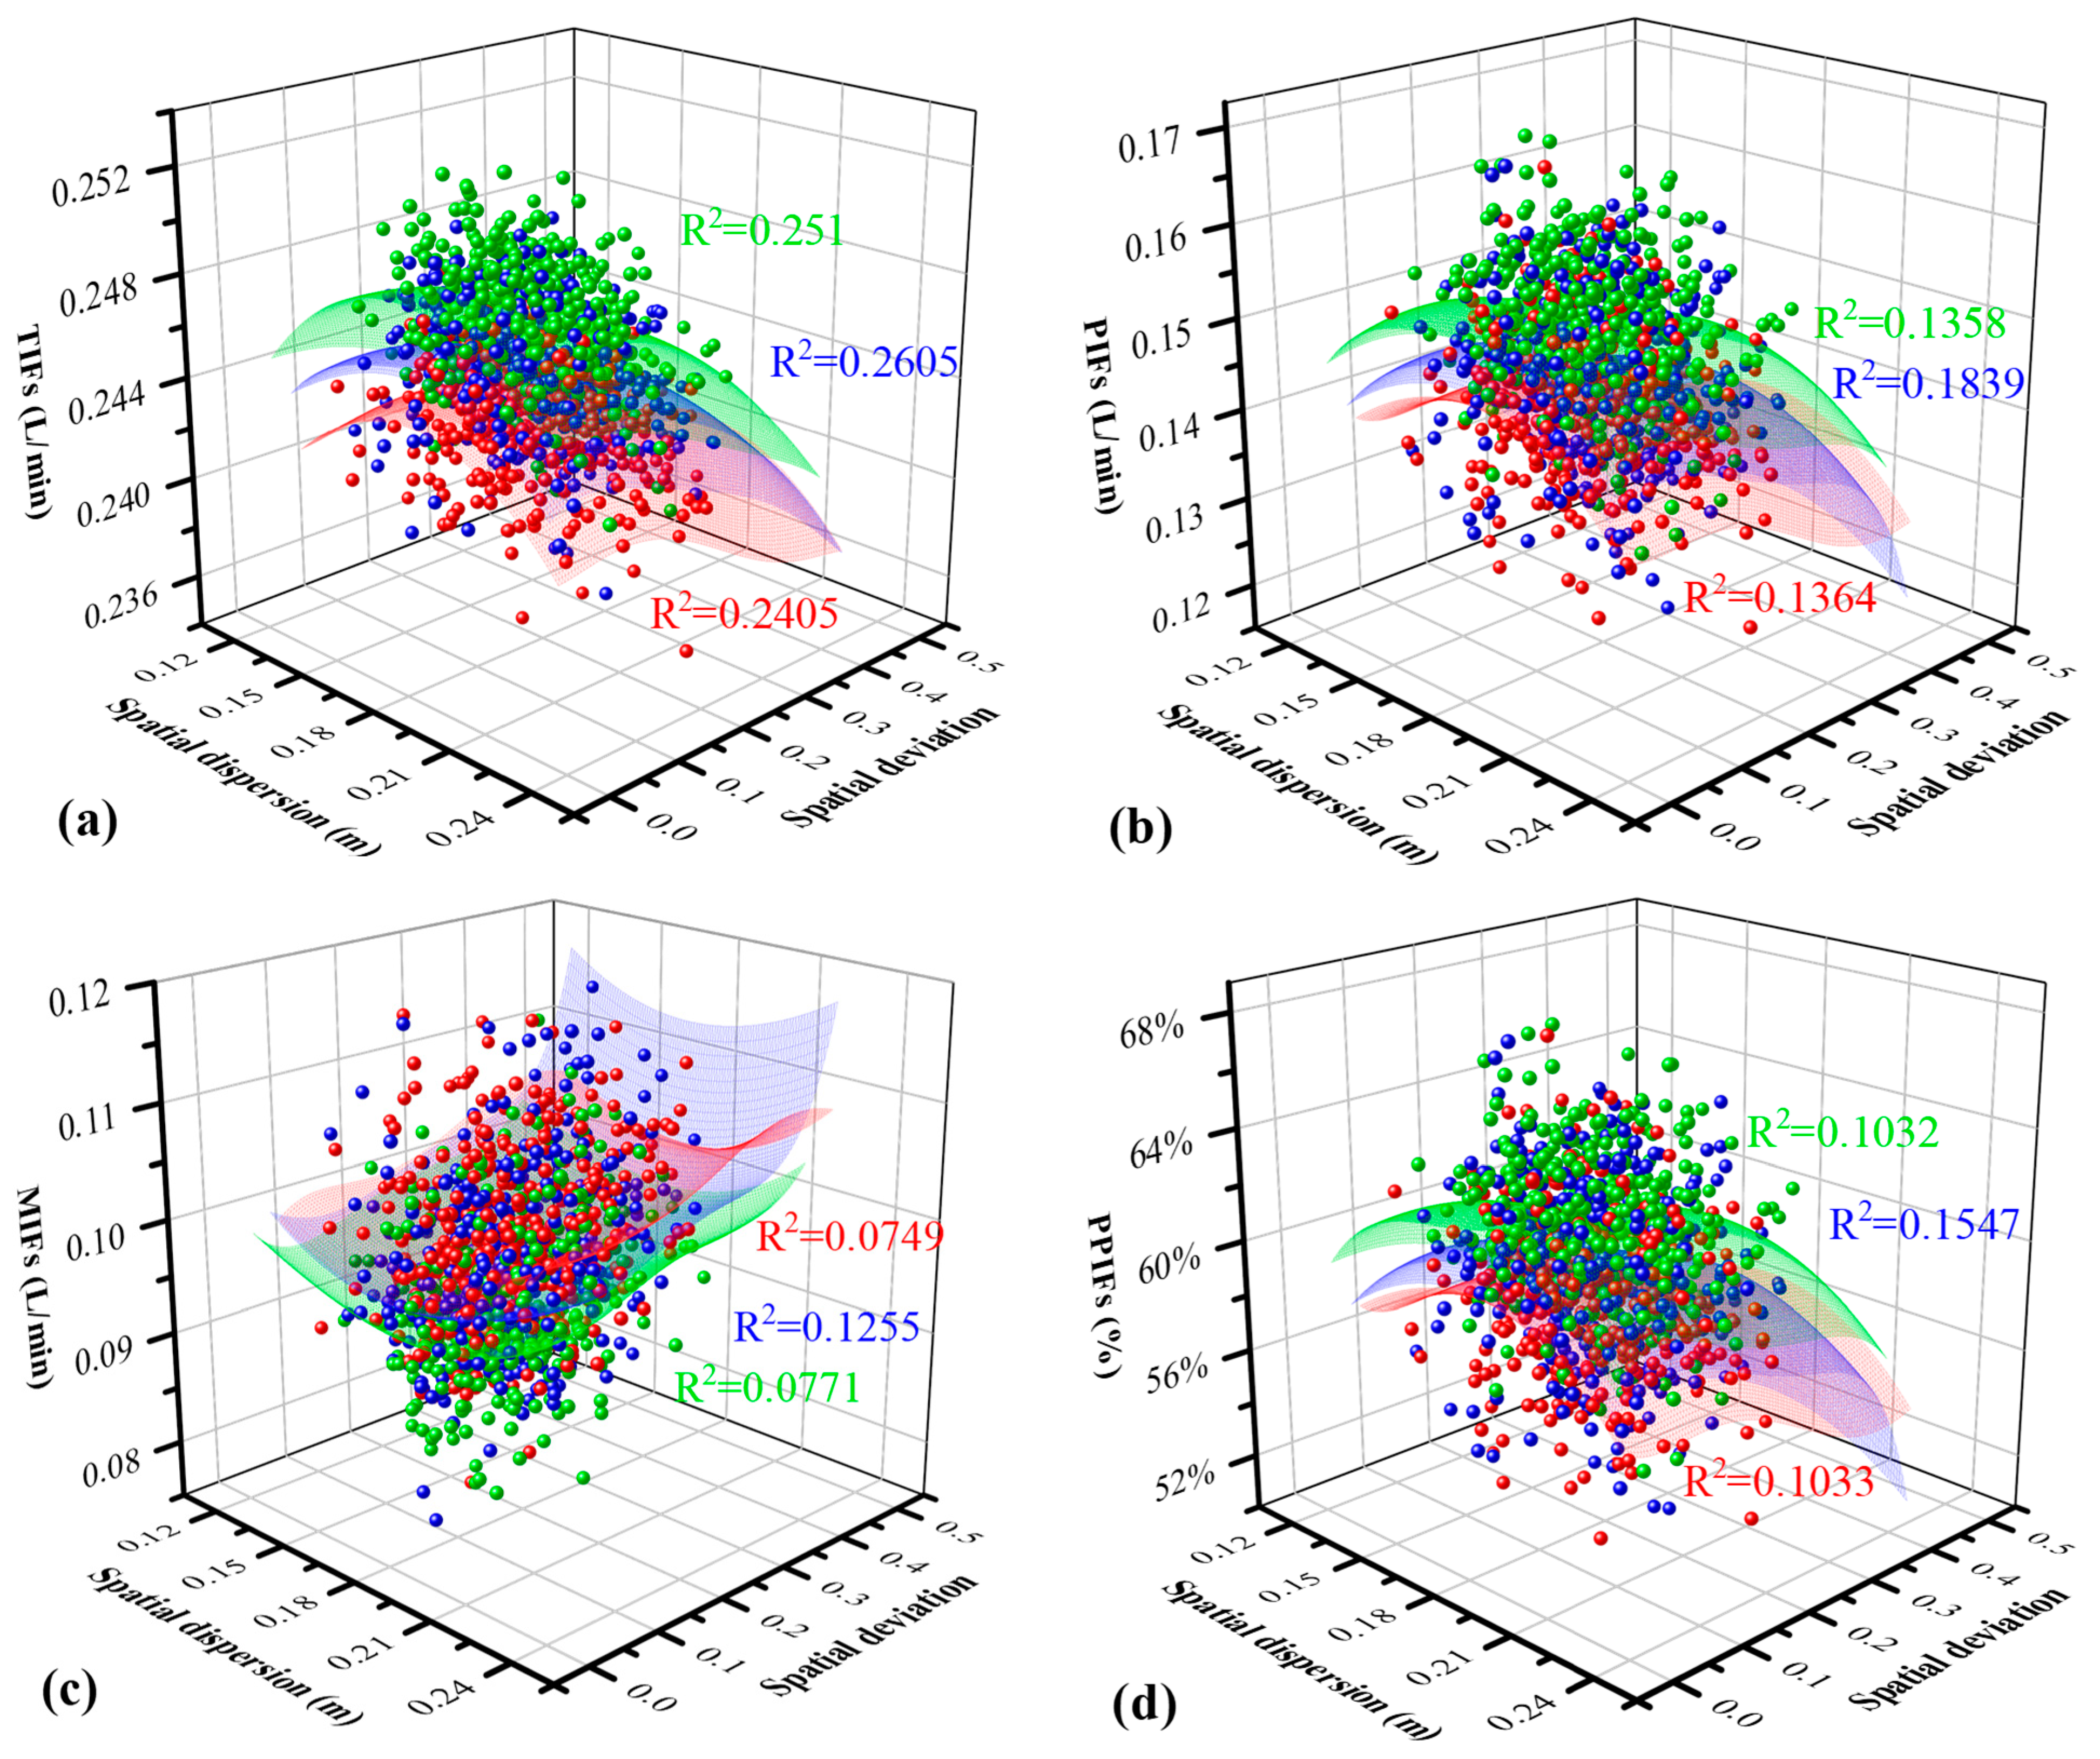
We plotted the relationship between γ , γ * and four hydraulic evaluation indexes (TIFs, PIFs, MIFs and PPIFs) under different number conditions (as shown in Figure 7 and Figure 8). It can be clearly observed from Figure 7 that number is the dominant factor when the number of macropores is relatively small, because the position characteristic affects water infiltration much less than the macropore number. However, this does not mean that macropore position can be ignored, as the influence of number displays progressive behavior (as shown in Figure 3). Figure 8 indicates that when the number is relatively large, the influence of macropore number on water infiltration is reduced, while position affects water infiltration more acutely. The macropore position becomes the dominant factor. In addition, we also note that the smaller the macropore number, the smaller the correlation between the water transport capacity of the soil and the macropore position, which could be related to the fact that there are few simulations under extreme conditions due to random simulations producing random pore sizes and positions.

4. Conclusions

In this study, two statistical parameters that can characterize the position of macropores are established, utilizing the concepts of centroid and weighted mean distance. The effect of the horizontal spatial distribution of macropores on water infiltration is examined using numerical simulation, under the condition that macroporosity remains unchanged. The results show that the macropore position parameters, spatial dispersion and spatial deviation, proposed in this study can characterize the position of macropores to a certain extent. Both number and position will significantly affect water infiltration, while pore size hardly affects water transport. Soil permeability and preferential flow degree increase with increases in spatial deviation, and initially increase and decrease afterwards as the spatial dispersion increases, which is more obvious with a decrease in spatial deviation. The preferential flow degree is more sensitive to these parameters than the soil permeability. Moreover, comparison between number and position reveals that macropore number is the dominant factor when the macropore number is relatively small, but this relationship reverses when the macropore number is relatively large. This study investigates the effect of macropore position on water infiltration in a novel manner. However, the position characteristic studied in this study is in two-dimensional space, and the three-dimensional structure of macropores can also impact water transport. The influence of macropore position in three-dimensional space needs to be further studied.

Author Contributions

Conceptualization, R.Z. and X.H.; methodology, R.Z. and X.H.; software, X.H.; validation, R.Z., X.H., J.Q. and Y.X.; formal analysis, X.H.; investigation, X.H.; resources, R.Z. and J.Q.; data curation, X.H.; writing-original draft preparation, R.Z. and X.H.; writing-review and editing, R.Z., J.Q. and Y.X.; visualization, X.H.; supervision, R.Z.; project administration, R.Z. and X.H.; funding acquisition, J.Q. All authors have read and agreed to the published version of the manuscript.

Funding

This research was funded by the National Natural Science Foundation of China (No. U2267218; No. 41831289; No. 42072276) and the Public Welfare Geological Survey Program of Anhui Province (Grant No. 2015-g-26).

Data Availability Statement

The numerical simulation data in this study are available at ZENODO via https://doi.org/10.5281/zenodo.8354339 (accessed on 10 October 2023).

Acknowledgments

The authors are grateful to all participants for their efforts.

Conflicts of Interest

The authors declare no conflict of interest.

Appendix A. Generation Approach for Random Pore Sizes and Positions

The generation of random pore sizes and positions in this study is realized using MATLAB. The specific methods are as follows.
Assume that the number of macropores is N , the radii of macropores are R = r 1 ,   r 2 ,   ,   r i ,   ,   r n , the sectional areas of macropores at the soil surface are S = S 1 ,   S 2 ,   ,   S i ,   ,   S n , the abscissas of macropores are X = x 1 ,   x 2 ,   ,   x i ,   ,   x n , the ordinates of macropores are Y = y 1 ,   y 2 , ,   y i ,   ,   y n , the relative macroporosity at the soil surface is w f and the side length of the observation area is a (the units of length are meters and the units of area are square meters). Then, the following equations are obtained:
i = 1 N S i = a 2
0 < x , y < a
x i x j 2 + y i y j 2 > r i + r j   ,     i j
0 < x i + r i · c o s θ < a   ,     θ 0 ,   2 π
0 < y i + r i · s i n θ < a   ,     θ 0 ,   2 π
Random pore sizes and positions are generated in the following three steps. Firstly, we randomly generate three independent N-dimensional vectors, A = a 1 ,   a 2 ,   ,   a i , ,   a n , B = b 1 ,   b 2 ,   ,   b i ,   ,   b n and C = c 1 ,   c 2 ,   ,   c i ,   ,   c n , which obey a standard uniform distribution. Secondly, the sectional area and radius of each macropore are calculated with Equation (A1), and the abscissa and ordinate of each macropore are calculated with Equation (A2). The computational formulas are as follows:
S i = l + a i · a 2 i = 1 N l + a i
r i = S i π
x i = a · b i
y i = a · c i
where l is a constant (equaling 0.05 in this study). The existence of l can limit the computing burden resulting from the small grid cells caused by the small pore size. Finally, check whether the calculated position and size satisfy Equations (A3)–(A5). If the inequalities are not true, then start over from the first step until these inequalities are true.

Appendix B. Spatial Dispersion (Weighted Mean Distance)

The spatial dispersion shown in Equation (4) is actually the weighted mean distance between the centroid of each macropore and the overall macropore centroid, whose weighted coefficient is the proportion of each macropore to the total macropore surface area. The size of the weighted mean distance is influenced by the combined effect of pore size and distance between the macropores, which enables it to capture alterations in both distance among macropores (dispersion increases with increases in distance among macropores) and the distribution ratio of macroporosity among macropores (dispersion decreases when macroporosity is concentrated in one macropore). Although it cannot accurately represent the position of all macropores (which is obviously very difficult), it can characterize the position relationships among macropores as well as between the macropores and the observation area, which is very meaningful. Next, Equation (4) is applied to two cases to demonstrate that it can exhibit both of the above characteristics.

Appendix B.1. Case 1: When the Distance among Macropores Increases
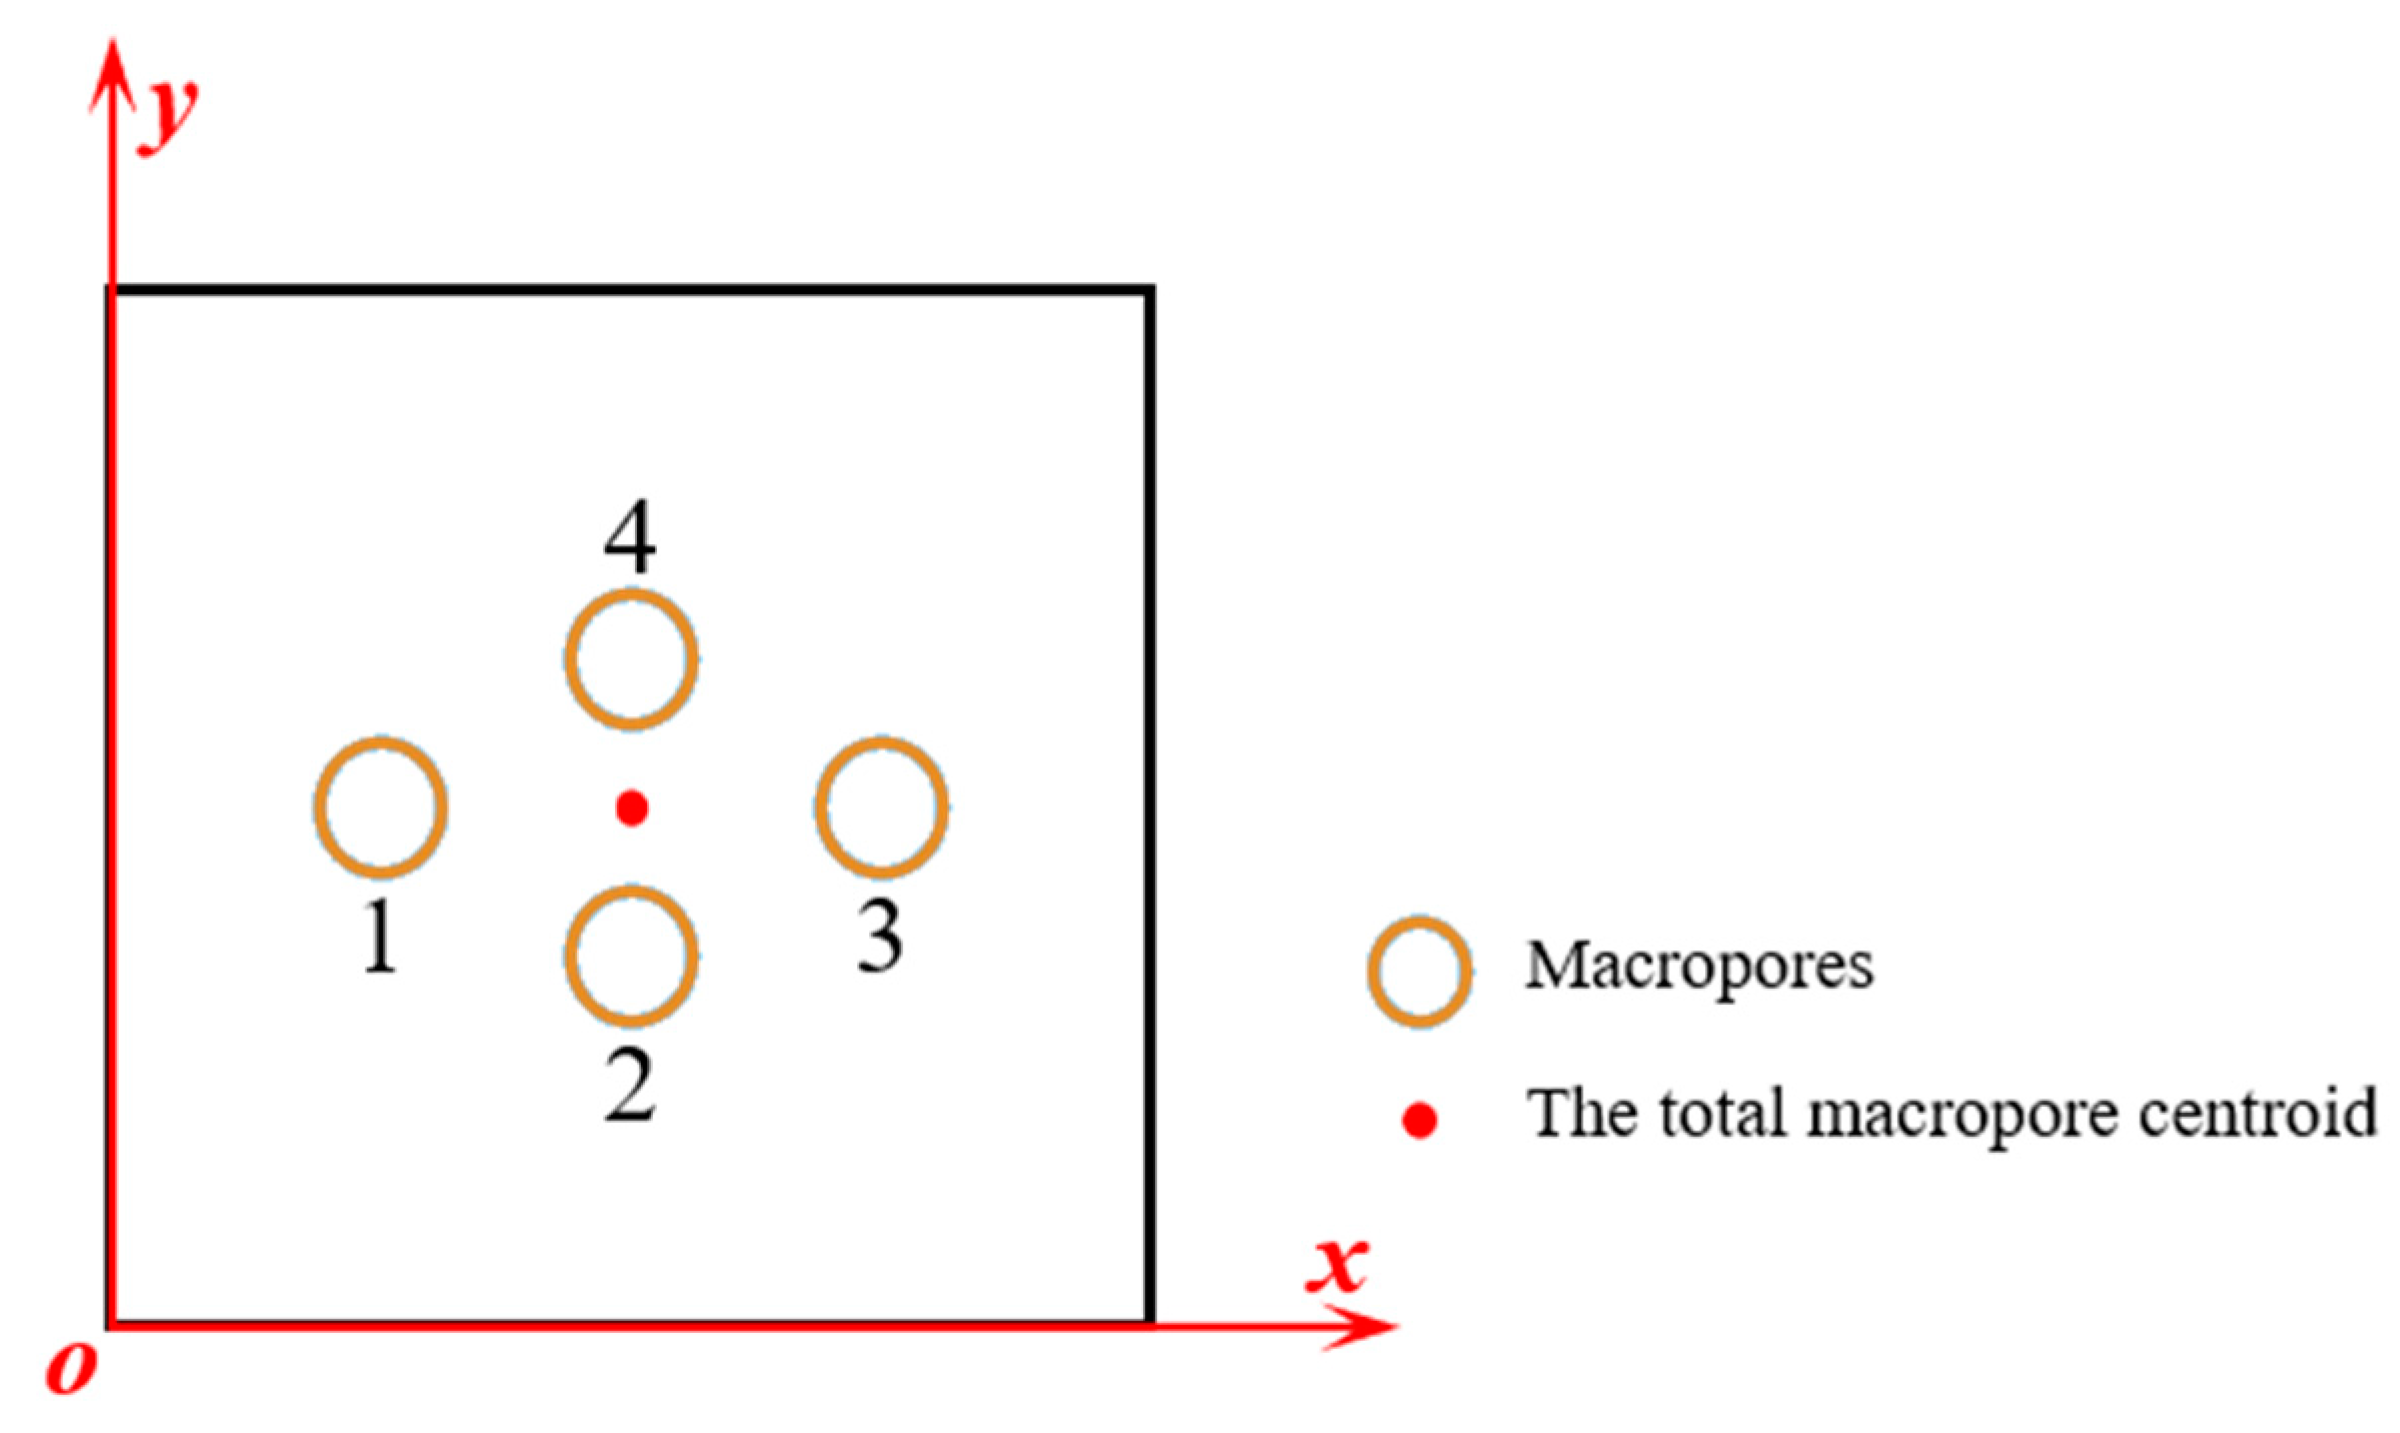
The surface of the observation area is a square with a side length of 1 m (as shown in Figure A1), in which the proportion of macropores is 3%, and there are four cylindrical macropores (numbered 1, 2, 3 and 4) whose diameters are equal. They are located at (0.25, 0.5), (0.5, 0.4), ( x 3 , 0.5) and (0.5, 0.6) respectively (unit in meters). By calculation, we plot the relationship between x 3 and γ (weighted mean distance) in Figure A2a. This shows that γ keeps increasing as pore 3 gradually moves away from other pores, which illustrates that γ can characterize the distance between the macropores.
Figure A1. Schematic diagram of case 1 at the soil surface, where the circles represent macropores and the red dots represent the total macropore centroid.
Water 15 03593 g0a1

Appendix B.2. Case 2: When the Macroporosity Is Concentrated in One Macropore
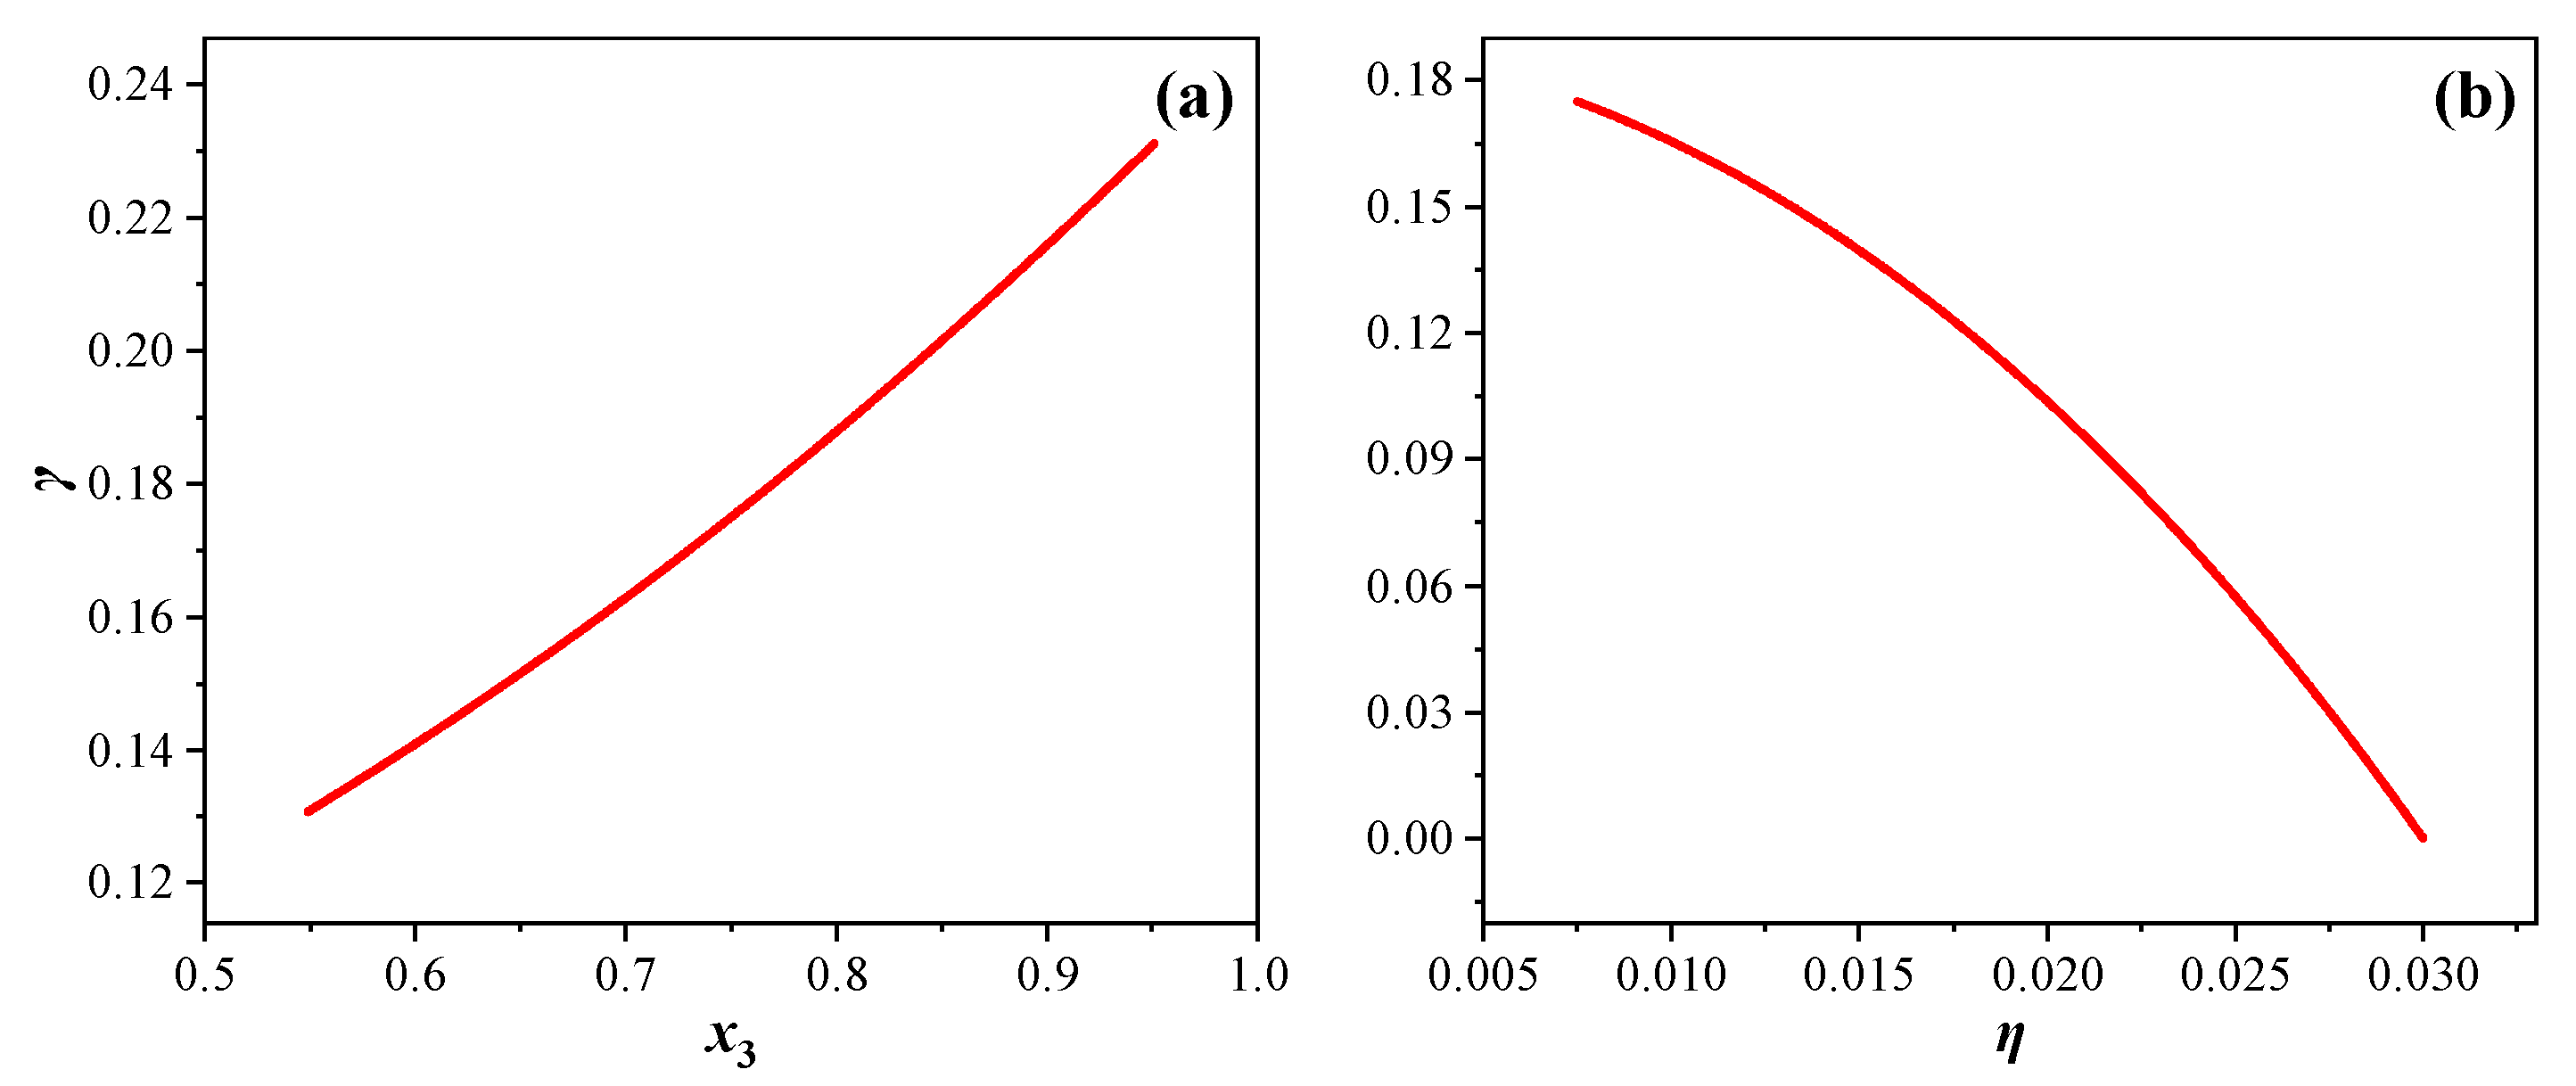
The observation area is set as the same as case 1, and x 3 is 0.75 this time, while the size of the four macropores is different. Assume that the size of macropores 1, 3, and 4 is equal, and the area of pore 2 is η times the total area of four macropores. By calculation, we plot the relationship between η and γ (weighted mean distance) in Figure A2b. This shows that γ keeps decreasing when macroporosity is concentrated in pore 2 ( η increases from 0.25 (diameters of four macropores are equal) to 1 (only pore 2 is present)). This demonstrates that γ can be used to characterize the distribution ratio of macroporosity among macropores.
Figure A2. (a) is the relationship between x 3 and γ for case 1; (b) is the relationship between η and γ for case 2.
Water 15 03593 g0a2

References

  1. Beven, K.; Germann, P. Macropores and water flow in soils. Water Resour. Res. 1982, 18, 1311–1325. [Google Scholar] [CrossRef]
  2. Jarvis, N.; Koestel, J.; Larsbo, M. Understanding preferential flow in the vadose zone: Recent advances and future prospects. Vadose Zone J. 2016, 15, 1–11. [Google Scholar] [CrossRef]
  3. Jarvis, N.J. A review of non-equilibrium water flow and solute transport in soil macropores: Principles, controlling factors and consequences for water quality. Eur. J. Soil Sci. 2020, 71, 279–302. [Google Scholar] [CrossRef]
  4. Koestel, J.; Larsbo, M. Imaging and quantification of preferential solute transport in soil macropores. Water Resour. Res. 2014, 50, 4357–4378. [Google Scholar] [CrossRef]
  5. Luxmoore, R.J.; Jardine, P.M.; Wilson, G.V.; Jones, J.R.; Zelazny, L.W. Physical and chemical controls of preferred path flow through a forested hillslope. Geoderma 1990, 46, 139–154. [Google Scholar] [CrossRef]
  6. Raimbault, J.; Peyneau, P.; Courtier-Murias, D.; Bigot, T.; Roca, J.G.; Béchet, B.; Lassabatère, L. Investigating the impact of exit effects on solute transport in macroporous media. Hydrol. Earth Syst. Sci. 2021, 25, 671–683. [Google Scholar] [CrossRef]
  7. Abou Najm, M.R.; Jabro, J.D.; Iversen, W.M.; Mohtar, R.H.; Evans, R.G. New method for the characterization of three-dimensional preferential flow paths in the field. Water Resour. Res. 2010, 46, W02503. [Google Scholar] [CrossRef]
  8. Gackiewicz, B.; Lamorski, K.; Kochiieru, M.; Sławiński, C.; Hsu, S.; Chang, L. Hybrid modelling of saturated water flow in percolating and non-percolating macroporous soil media. Geoderma 2022, 406, 115467. [Google Scholar] [CrossRef]
  9. Yi, J.; Yang, Y.; Liu, M.; Hu, W.; Lou, S.; Zhang, H.; Zhang, D. Characterising macropores and preferential flow of mountainous forest soils with contrasting human disturbances. Soil Res. 2019, 57, 601–614. [Google Scholar] [CrossRef]
  10. Allaire, S.E.; Roulier, S.; Cessna, A.J. Quantifying preferential flow in soils: A review of different techniques. J. Hydrol. 2009, 378, 179–204. [Google Scholar] [CrossRef]
  11. Kim, Y.-J.; Steenhuis, T.S.; Nam, K. Movement of heavy metals in soil through preferential flow paths under different rainfall intensities. CLEAN-Soil Air Water 2008, 36, 984–989. [Google Scholar] [CrossRef]
  12. Smet, S.; Beckers, E.; Plougonven, E.; Léonard, A.; Degré, A. Can the pore scale geometry explain soil sample scale hydrodynamic properties? Front. Environ. Sci. 2018, 6, 20. [Google Scholar] [CrossRef]
  13. Pierret, A.; Capowiez, Y.; Belzunces, L.; Moran, C.J. 3D reconstruction and quantification of macropores using X-ray computed tomography and image analysis. Geoderma 2002, 106, 247. [Google Scholar] [CrossRef]
  14. Bastardie, F.; Capowiez, Y.; de Dreuzy, J.R.; Cluzeau, D. X-ray tomographic and hydraulic characterization of burrowing by three earthworm species in repacked soil cores. Appl. Soil Ecol. 2003, 24, 3–16. [Google Scholar] [CrossRef]
  15. Luo, L.; Lin, H.; Halleck, P. Quantifying soil structure and preferential flow in intact soil using X-ray computed tomography. Soil Sci. Soc. Am. J. 2008, 72, 1058–1069. [Google Scholar] [CrossRef]
  16. Peth, S.; Horn, R.; Beckmann, F.; Donath, T.; Fischer, J.; Smucker, A.J.M. Three-dimensional quantification of intra-aggregate pore-space features using synchrotron-radiation-based microtomography. Soil Sci. Soc. Am. J. 2008, 72, 897–907. [Google Scholar] [CrossRef]
  17. Saravanathiiban, D.S.; Kutay, M.E.; Khire, M.V. Effect of macropore tortuosity and morphology on preferential flow through saturated soil: A Lattice Boltzmann study. Comput. Geotech. 2014, 59, 44–53. [Google Scholar] [CrossRef]
  18. Allaire, S.E.; Gupta, S.C.; Nieber, J.; Moncrief, J.F. Role of macropore continuity and tortuosity on solute transport in soils—1. Effects of initial and boundary conditions. J. Contam. Hydrol. 2002, 58, 299–321. [Google Scholar] [CrossRef]
  19. Luo, L.; Lin, H.; Schmidt, J. Quantitative relationships between soil macropore characteristics and preferential flow and transport. Soil Sci. Soc. Am. J. 2010, 74, 1929–1937. [Google Scholar] [CrossRef]
  20. Hu, X.; Li, Z.-C.; Li, X.-Y.; Liu, L.-Y. Quantification of soil macropores under alpine vegetation using computed tomography in the Qinghai Lake Watershed, NE Qinghai–Tibet Plateau. Geoderma 2016, 264, 244–251. [Google Scholar] [CrossRef]
  21. Zhang, J.; Wen, N.; Sun, Q.; Horton, R.; Liu, G. The effect of macropore morphology of actual anecic earthworm burrows on water infiltration: A COMSOL simulation. J. Hydrol. 2023, 618, 129261. [Google Scholar] [CrossRef]
  22. Cheik, S.; Bottinelli, N.; Minh, T.T.; Doan, T.T.; Jouquet, P. Quantification of three dimensional characteristics of macrofauna macropores and their effects on soil hydraulic conductivity in Northern Vietnam. Front. Environ. Sci. 2019, 7, 31. [Google Scholar] [CrossRef]
  23. Müller, K.; Katuwal, S.; Young, I.; McLeod, M.; Moldrup, P.; de Jonge, L.W.; Clothier, B. Characterising and linking X-ray CT derived macroporosity parameters to infiltration in soils with contrasting structures. Geoderma 2018, 313, 82–91. [Google Scholar] [CrossRef]
  24. Rasse, D.P.; Smucker, A.J.M.; Santos, D. Alfalfa root and shoot mulching effects on soil hydraulic properties and aggregation. Soil Sci. Soc. Am. J. 2000, 64, 725–731. [Google Scholar] [CrossRef]
  25. Meurer, K.; Barron, J.; Chenu, C.; Coucheney, E.; Fielding, M.; Hallett, P.; Herrmann, A.M.; Keller, T.; Koestel, J.; Larsbo, M.; et al. A framework for modelling soil structure dynamics induced by biological activity. Glob. Chang. Biol. 2020, 26, 5382–5403. [Google Scholar] [CrossRef]
  26. Porre, R.J.; van Groenigen, J.W.; De Deyn, G.B.; de Goede, R.G.M.; Lubbers, I.M. Exploring the relationship between soil mesofauna, soil structure and N2O emissions. Soil Biol. Biochem. 2016, 96, 55–64. [Google Scholar] [CrossRef]
  27. Chen, L.; Ghorbani, J.; Zhang, C.; Dutta, T.T.; Kodikara, J. A novel unified model for volumetric hardening and water retention in unsaturated soils. Comput. Geotech. 2021, 140, 104446. [Google Scholar] [CrossRef]
  28. Ghorbani, J.; Chen, L.; Kodikara, J.; Carter, J.P.; McCartney, J.S. Memory repositioning in soil plasticity models used in contact problems. Comput. Mech. 2022, 71, 385–408. [Google Scholar] [CrossRef]
  29. Capowiez, Y.; Bottinelli, N.; Sammartino, S.; Michel, E.; Jouquet, P. Morphological and functional characterisation of the burrow systems of six earthworm species (Lumbricidae). Biol. Fertil. Soils 2015, 51, 869–877. [Google Scholar] [CrossRef]
  30. Xin, P.; Yu, X.; Lu, C.; Li, L. Effects of macro-pores on water flow in coastal subsurface drainage systems. Adv. Water Resour. 2016, 87, 56–67. [Google Scholar] [CrossRef]
  31. Chen, X.; Cheng, J.; Chen, Y.; Zhang, H.; Zhang, F.; Yao, J. Study of soil macropore spatial structure based on stand spatial structure analysis method. Trans. Chin. Soc. Agric. Mach. 2015, 46, 174–186. [Google Scholar] [CrossRef]
  32. Weiler, M.; Naef, F. Simulating surface and subsurface initiation of macropore flow. J. Hydrol. 2003, 273, 139–154. [Google Scholar] [CrossRef]
  33. Droogers, P.; Stein, A.; Bouma, J.; de Boer, G. Parameters for describing soil macroporosity derived from staining patterns. Geoderma 1998, 83, 293–308. [Google Scholar] [CrossRef]
  34. Li, L.; Gu, Z.; Xu, W.; Tan, Y.; Fan, X.; Tan, D. Mixing mass transfer mechanism and dynamic control of gas-liquid-solid multiphase flow based on VOF-DEM coupling. Energy 2023, 272, 127015. [Google Scholar] [CrossRef]
  35. Li, L.; Xu, W.; Tan, Y.; Yang, Y.; Yang, J.; Tan, D. Fluid-induced vibration evolution mechanism of multiphase free sink vortex and the multi-source vibration sensing method. Mech. Syst. Signal. Process. 2023, 189, 110058. [Google Scholar] [CrossRef]
  36. Xing, K.; Qian, J.; Ma, L.; Ma, H.; Zhao, W. Characterizing the scaling coefficient ω between viscous and inertial permeability of fractures. J. Hydrol. 2021, 593, 125920. [Google Scholar] [CrossRef]
  37. Xing, K.; Qian, J.; Zhao, W.; Ma, H.; Ma, L. Experimental and numerical study for the inertial dependence of non-Darcy coefficient in rough single fractures. J. Hydrol. 2021, 603, 127148. [Google Scholar] [CrossRef]
  38. Xu, Z.; Hu, B.X.; Ye, M. Numerical modeling and sensitivity analysis of seawater intrusion in a dual-permeability coastal karst aquifer with conduit networks. Hydrol. Earth Syst. Sci. 2018, 22, 221–239. [Google Scholar] [CrossRef]
  39. Lepore, B.J.; Morgan, C.L.S.; Norman, J.M.; Molling, C.C. A mesopore and matrix infiltration model based on soil structure. Geoderma 2009, 152, 301–313. [Google Scholar] [CrossRef]
  40. Bronstert, A.; Niehoff, D.; Schiffler, G.R. Modelling infiltration and infiltration excess: The importance of fast and local processes. Hydrol. Process. 2023, 37, e14875. [Google Scholar] [CrossRef]
  41. Sheng, F.; Liu, H.; Wang, K.; Zhang, R.; Tang, Z. Investigation into preferential flow in natural unsaturated soils with field multiple-tracer infiltration experiments and the active region model. J. Hydrol. 2014, 508, 137–146. [Google Scholar] [CrossRef]
  42. Herbst, M.; Diekkrüger, B. The influence of the spatial structure of soil properties on water balance modeling in a microscale catchment. Phys. Chem. Earth. Parts A/B/C 2002, 27, 701–710. [Google Scholar] [CrossRef]
  43. Herbst, M.; Diekkrüger, B.; Vanderborght, J. Numerical experiments on the sensitivity of runoff generation to the spatial variation of soil hydraulic properties. J. Hydrol. 2006, 326, 43–58. [Google Scholar] [CrossRef]
  44. Zhou, T.; Xin, P.; Li, L.; Barry, D.A.; Šimůnek, J. Effects of large macropores on soil evaporation in salt marshes. J. Hydrol. 2020, 584, 124754. [Google Scholar] [CrossRef]
  45. Liu, G.; Li, B.; Hu, K.; van Genuchten, M.T. Simulating the gas diffusion coefficient in macropore network images: Influence of soil pore morphology. Soil Sci. Soc. Am. J. 2006, 70, 1252–1261. [Google Scholar] [CrossRef]
  46. Rosenbom, A.E.; Binning, P.J.; Aamand, J.; Dechesne, A.; Smets, B.F.; Johnsen, A.R. Does microbial centimeter-scale heterogeneity impact MCPA degradation in and leaching from a loamy agricultural soil? Sci. Total Environ. 2014, 472, 90–98. [Google Scholar] [CrossRef]
  47. Wen, N.; Zhang, J.; Zeng, H.; Liu, G.; Horton, R. In-situ tin casting combined with three-dimensional scanner to quantify anecic earthworm burrows. Vadose Zone J. 2022, 21, e20198. [Google Scholar] [CrossRef]
  48. Anderson, B.; Newman, M.A.; Grim Ii, P.A.; Hardin, J.M. A Monte Carlo simulation framework for reject inference. J. Oper. Res. Soc. 2022, 74, 1133–1149. [Google Scholar] [CrossRef]
  49. Mallants, D.; Jacques, D.; Vanclooster, M.; Diels, J.; Feyen, J. A atochastic approach to simulate water flow in a macroporous soil. Geoderma 1996, 70, 299–324. [Google Scholar] [CrossRef]
  50. Liu, G.; Si, B.C. Soil ice content measurement using a heat pulse probe method. Can. J. Agric. Sci. 2011, 91, 235–246. [Google Scholar] [CrossRef]
  51. Shao, W.; Bogaard, T.; Bakker, M. How to use COMSOL Multiphysics for coupled dual-permeability hydrological and slope stability modeling. Procedia Earth Planet. Sci. 2014, 9, 83–90. [Google Scholar] [CrossRef]
  52. Zhu, H.; Tang, H.; Cheng, Y.; Li, Z.; Qiu, J.; Tong, L. Electrostatic separation of pea proteins assisted by COMSOL simulation. J. Food Eng. 2022, 335, 111175. [Google Scholar] [CrossRef]
  53. Yu, X.; Song, M.; Wang, Z. Simulation and verification of effect of arc duration on arc temperature based on COMSOL. Machines 2023, 11, 289. [Google Scholar] [CrossRef]
  54. Sang, Y.; Liu, G.; Horton, R. Wind effects on soil thermal properties measured by the dual-probe heat pulse method. Soil Sci. Soc. Am. J. 2020, 84, 414–424. [Google Scholar] [CrossRef]
  55. Feehley, C.E.; Zheng, C.; Molz, F.J. A dual-domain mass transfer approach for modeling solute transport in heterogeneous aquifers: Application to the Macrodispersion Experiment (MADE) site. Water Resour. Res. 2000, 36, 2501–2515. [Google Scholar] [CrossRef]
  56. Hakoun, V.; Comolli, A.; Dentz, M. Upscaling and prediction of Lagrangian velocity dynamics in heterogeneous porous media. Water Resour. Res. 2019, 55, 3976–3996. [Google Scholar] [CrossRef]
  57. Ma, L.; Gao, D.; Qian, J.; Han, D.; Xing, K.; Ma, H.; Deng, Y. Multiscale fractures integrated equivalent porous media method for simulating flow and solute transport in fracture-matrix system. J. Hydrol. 2023, 617, 128845. [Google Scholar] [CrossRef]
  58. Hou, X.; Fan, H. Study on rainfall infiltration characteristics of unsaturated fractured soil based on COMSOL Multiphysics. Rock Soil Mech. 2022, 43, 563–572. [Google Scholar] [CrossRef]
  59. Zhou, Y.; Liang, X.; Ma, E.; Chen, K.; Zhang, J.; Zhang, Y.-K. Effect of unsaturated flow on groundwater-river interactions induced by flood event in riparian zone. J. Hydrol. 2023, 620, 129405. [Google Scholar] [CrossRef]
  60. Akay, O.; Fox, G.A.; Šimůnek, J. Numerical simulation of flow dynamics during macropore–subsurface drain interactions using HYDRUS. Vadose Zone J. 2008, 7, 909–918. [Google Scholar] [CrossRef]
  61. Xin, P.; Jin, G.; Li, L.; Barry, D.A. Effects of crab burrows on pore water flows in salt marshes. Adv. Water Resour. 2009, 32, 439–449. [Google Scholar] [CrossRef]
  62. Cai, H.; Zhang, Q.; Ye, G.; Lu, L.; Wu, C.; Ji, F. Investigation on strong vertical permeability and micro-pore characteristics of Jinan red clay using X-ray micro-tomography. Environ. Earth Sci. 2023, 82, 122. [Google Scholar] [CrossRef]
  63. Luo, L.; Lin, H.; Li, S. Quantification of 3-D soil macropore networks in different soil types and land uses using computed tomography. J. Hydrol. 2010, 393, 53–64. [Google Scholar] [CrossRef]
  64. Scheibe, T.D.; Perkins, W.A.; Richmond, M.C.; McKinley, M.I.; Romero-Gomez, P.D.J.; Oostrom, M.; Wietsma, T.W.; Serkowski, J.A.; Zachara, J.M. Pore-scale and multiscale numerical simulation of flow and transport in a laboratory-scale column. Water Resour. Res. 2015, 51, 1023–1035. [Google Scholar] [CrossRef]
  65. Veeraraghavan, P. The G-convexity and the G-centroids of composite graphs. Mathematics 2020, 8, 1927. [Google Scholar] [CrossRef]
  66. Yan, H.; Tao, J.; Dong, L. Analysis on the centroid offset of coupling beam in array-composite resonator due to process variations. Sens. Mater. 2018, 30, 2727–2745. [Google Scholar] [CrossRef]
  67. Cey, E.E.; Rudolph, D.L. Field study of macropore flow processes using tension infiltration of a dye tracer in partially saturated soils. Hydrol. Process. 2009, 23, 1768–1779. [Google Scholar] [CrossRef]
  68. Arora, B.; Mohanty, B.P.; McGuire, J.T. Inverse estimation of parameters for multidomain flow models in soil columns with different macropore densities. Water Resour. Res. 2011, 47, W04512. [Google Scholar] [CrossRef]
  69. Meng, C.; Niu, J.; Li, X.; Luo, Z.; Du, X.; Du, J.; Lin, X.; Yu, X. Quantifying soil macropore networks in different forest communities using industrial computed tomography in a mountainous area of North China. J. Soils Sediments 2016, 17, 2357–2370. [Google Scholar] [CrossRef]
  70. Zhang, Z.; Liu, K.; Zhou, H.; Lin, H.; Li, D.; Peng, X. Linking saturated hydraulic conductivity and air permeability to the characteristics of biopores derived from X-ray computed tomography. J. Hydrol. 2019, 571, 1–10. [Google Scholar] [CrossRef]
  71. Zhang, J.; Liu, T.; Duan, L.; Chen, Z.; Wang, Y.; Li, Y.; Zhao, X.; Wang, G.; Singh, V.P. Processes of preferential flow in a eurasian steppe under different scenarios. J. Hydrol. 2022, 612, 128166. [Google Scholar] [CrossRef]
  72. Zhang, J.; Xu, Z. Dye tracer infiltration technique to investigate macropore flow paths in Maka Mountain, Yunnan Province, China. J. Cent. South Univ. 2016, 23, 2101–2109. [Google Scholar] [CrossRef]
  73. Akhtar, M.S.; Stüben, D.; Norra, S.; Memon, M. Soil structure and flow rate-controlled molybdate, arsenate and chromium(III) transport through field columns. Geoderma 2011, 161, 126–137. [Google Scholar] [CrossRef]
  74. Torrentó, C.; Prasuhn, V.; Spiess, E.; Ponsin, V.; Melsbach, A.; Lihl, C.; Glauser, G.; Hofstetter, T.B.; Elsner, M.; Hunkeler, D. Adsorbing vs. nonadsorbing tracers for assessing pesticide transport in arable soils. Vadose Zone J. 2017, 17, 1–18. [Google Scholar] [CrossRef]
  75. Xie, S.; Wen, Z.; Jakada, H. A new model approach for reactive solute transport in dual-permeability media with depth-dependent reaction coefficients. J. Hydrol. 2019, 577, 123946. [Google Scholar] [CrossRef]
  76. Larsbo, M.; Koestel, J.; Jarvis, N. Relations between macropore network characteristics and the degree of preferential solute transport. Hydrol. Earth Syst. Sci. 2014, 18, 5255–5269. [Google Scholar] [CrossRef]
  77. Akay, O.; Fox, G.A. Experimental investigation of direct connectivity between macropores and subsurface drains during infiltration. Soil Sci. Soc. Am. J. 2007, 71, 1600–1606. [Google Scholar] [CrossRef]
  78. Alberti, D.R.; Cey, E.E. Evaluation of macropore flow and transport using three-dimensional simulation of tension infiltration experiments. Vadose Zone J. 2011, 10, 603–617. [Google Scholar] [CrossRef]
  79. Jarvis, N.; Larsbo, M.; Koestel, J. Connectivity and percolation of structural pore networks in a cultivated silt loam soil quantified by X-ray tomography. Geoderma 2017, 287, 71–79. [Google Scholar] [CrossRef]
  80. Julich, S.; Kreiselmeier, J.; Scheibler, S.; Petzold, R.; Schwärzel, K.; Feger, K.-H. Hydraulic properties of forest soils with stagnic conditions. Forests 2021, 12, 1113. [Google Scholar] [CrossRef]
  81. Jačka, L.; Walmsley, A.; Kovář, M.; Frouz, J. Effects of different tree species on infiltration and preferential flow in soils developing at a clayey spoil heap. Geoderma 2021, 403, 115372. [Google Scholar] [CrossRef]
  82. Hellner, Q.; Koestel, J.; Ulén, B.; Larsbo, M.; Goss, M. Effects of tillage and liming on macropore networks derived from X-ray tomography images of a silty clay soil. Soil Use Manag. 2018, 34, 197–205. [Google Scholar] [CrossRef]
  83. Lucas, M.; Schlüter, S.; Vogel, H.-J.; Vetterlein, D. Soil structure formation along an agricultural chronosequence. Geoderma 2019, 350, 61–72. [Google Scholar] [CrossRef]
  84. Pagenkemper, S.K.; Athmann, M.; Uteau, D.; Kautz, T.; Peth, S.; Horn, R. The effect of earthworm activity on soil bioporosity—Investigated with X-ray computed tomography and endoscopy. Soil Tillage Res. 2015, 146, 79–88. [Google Scholar] [CrossRef]
  85. Ahmadi, A.; Chitsazan, M.; Mirzaee, S.Y.; Nadri, A. The effects of influence radius and drawdown cone on the areas related to the protection of water wells. J. Hydrol. 2023, 617, 129001. [Google Scholar] [CrossRef]
  86. Li, L.; Hou, X.; Li, Y. A finite element method for calculating the influence radius of foundation pit dewatering. Rock Soil Mech. 2021, 42, 574–580. [Google Scholar] [CrossRef]
  87. Liu, H.-B.; Zhou, J.-Q.; Li, C.; Tan, J.; Hou, D. Semi-empirical models for predicting stable water inflow and influence radius of a tunnel considering non-Darcian effect. J. Hydrol. 2023, 621, 129574. [Google Scholar] [CrossRef]
  88. Budhathoki, S.; Lamba, J.; Srivastava, P.; Malhotra, K.; Way, T.R.; Katuwal, S. Temporal and spatial variability in 3D soil macropore characteristics determined using X-ray computed tomography. J. Soils Sediments 2022, 22, 1263–1277. [Google Scholar] [CrossRef]
  89. Hallam, J.; Berdeni, D.; Grayson, R.; Guest, E.J.; Holden, J.; Lappage, M.G.; Prendergast-Miller, M.T.; Robinson, D.A.; Turner, A.; Leake, J.R.; et al. Effect of earthworms on soil physico-hydraulic and chemical properties, herbage production, and wheat growth on arable land converted to ley. Sci. Total Environ. 2020, 713, 136491. [Google Scholar] [CrossRef]
  90. Lipiec, J.; Turski, M.; Hajnos, M.; Świeboda, R. Pore structure, stability and water repellency of earthworm casts and natural aggregates in loess soil. Geoderma 2015, 243–244, 124–129. [Google Scholar] [CrossRef]
  91. Van Groenigen, J.W.; Van Groenigen, K.J.; Koopmans, G.F.; Stokkermans, L.; Vos, H.M.J.; Lubbers, I.M. How fertile are earthworm casts? A meta-analysis. Geoderma 2019, 338, 525–535. [Google Scholar] [CrossRef]
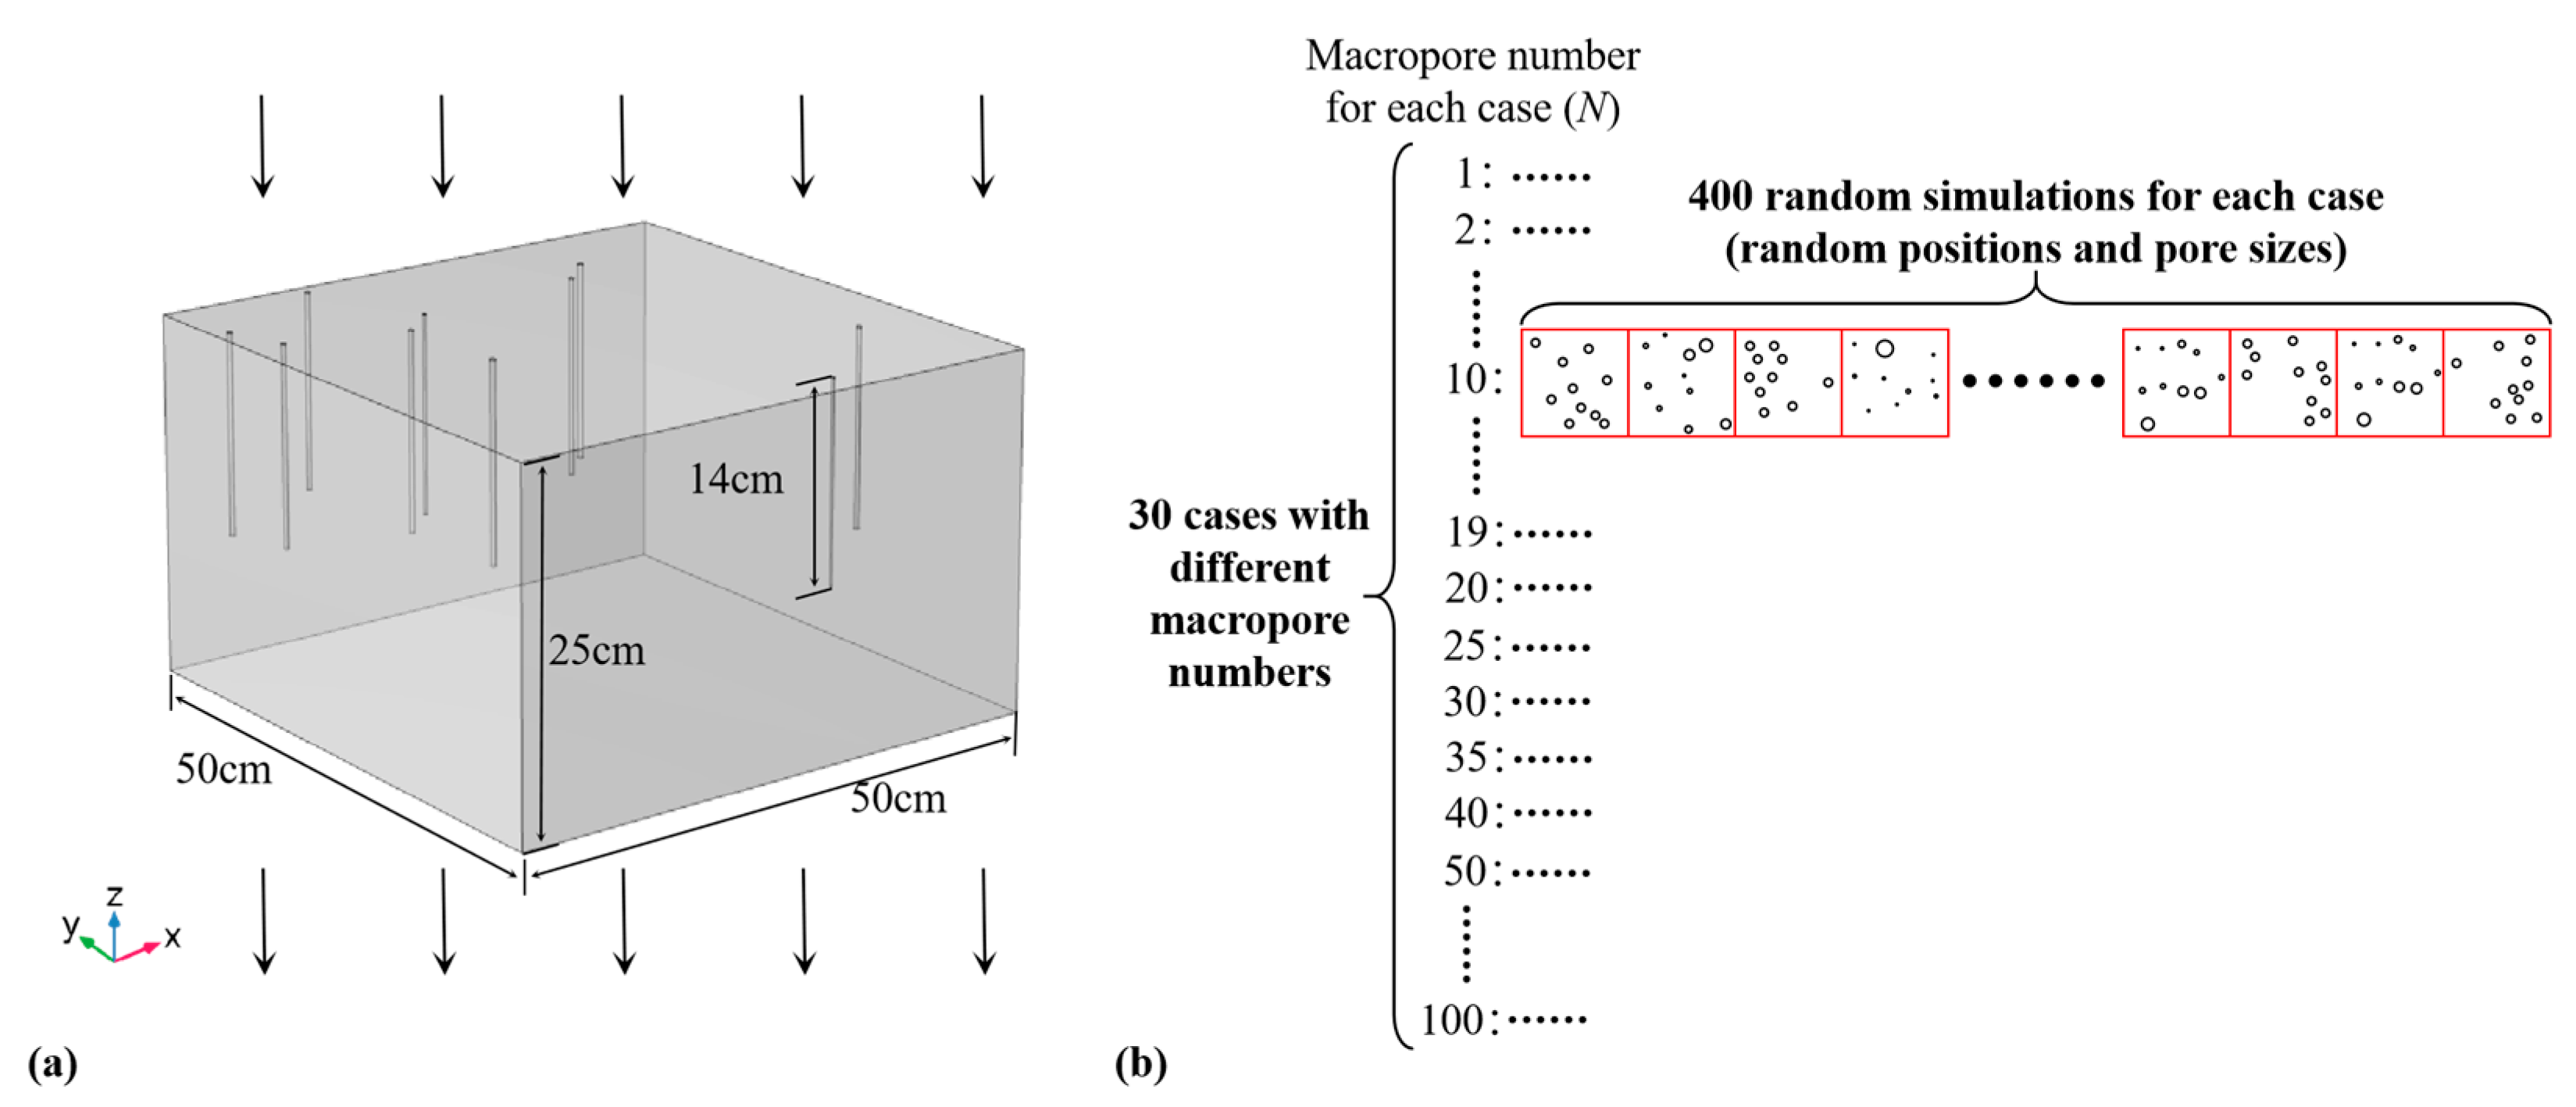
Figure 1. (a) is a schematic diagram of the model. (b) is a schematic diagram of the simulation scheme.
Water 15 03593 g001
Figure 2. The implication of spatial dispersion and spatial deviation, where circles represent macropores, red dots represent the total macropore centroid, and green dots represent the centroid of the observation area.
Water 15 03593 g002
Figure 3. The relationship between four hydraulic evaluation indexes (the total infiltration fluxes (TIFs), the preferential infiltration fluxes (PIFs), the matrix infiltration fluxes (MIFs) and the proportion of preferential infiltration fluxes (PPIFs)) and the macropore number.
Water 15 03593 g003
Figure 4. The relationship between pore size mean and four hydraulic evaluation indexes (which are TIFs (a), PIFs (b), MIFs (c) and PPIFs (d), respectively), and the relationship between pore size standard deviation and four hydraulic evaluation indexes (which are TIFs (e), PIFs (f), MIFs (g) and PPIFs (h), respectively) when N = 9. The red lines are regression lines, and the red text is the expressions and correlation coefficients of these regression lines.
Water 15 03593 g004
Figure 5. The relationship between macropore position and four hydraulic evaluation indexes (which are TIFs (a), PIFs (b), MIFs (c) and PPIFs (d), respectively) when N = 9. The points are the simulated results, and the curves are the contour lines of the fitting surfaces whose correlation coefficients are 0.32113, 0.14672, 0.08565 and 0.12265, respectively.
Water 15 03593 g005
Figure 6. The relationship between flow rate distribution at the bottom and macropore position at the surface when N = 9, in which the black circles represent macropores at the surface. (ai) show the cases of different spatial dispersion and spatial deviation. The spatial deviation decreases from top figures to bottom figures, and the spatial dispersion increases from left figures to right figures.
Water 15 03593 g006
Figure 7. The competitive relationship between number and position in four hydraulic evaluation indexes (which are TIFs (a), PIFs (b), MIFs (c) and PPIFs (d), respectively). The dots are the simulated data, the meshes are the fitting surfaces, and the text is the correlation coefficients of the fitting surfaces. Red, blue, and green represent N = 2, N = 3, and N = 4, respectively.
Water 15 03593 g007
Figure 8. The competitive relationship between number and position in four hydraulic evaluation indexes (which are TIFs (a), PIFs (b), MIFs (c) and PPIFs (d), respectively). The dots are the simulated data, the meshes are the fitting surfaces, and the text is the correlation coefficients of the fitting surfaces. Red, blue, and green represent N = 18, N = 19, and N = 20, respectively.
Water 15 03593 g008
Disclaimer/Publisher’s Note: The statements, opinions and data contained in all publications are solely those of the individual author(s) and contributor(s) and not of MDPI and/or the editor(s). MDPI and/or the editor(s) disclaim responsibility for any injury to people or property resulting from any ideas, methods, instructions or products referred to in the content.