Article

A Framework to Quantify Riverine Dissolved Inorganic Nitrogen Exports under Changing Land-Use Patterns and Hydrologic Regimes

Fujian Key Laboratory of Coastal Pollution Prevention and Control, Xiamen University, Xiamen 361102, China
*
Author to whom correspondence should be addressed.
These authors contributed equally to this work and should be considered co-first authors.
Water 2023, 15(20), 3528; https://doi.org/10.3390/w15203528
Submission received: 14 September 2023 / Revised: 6 October 2023 / Accepted: 7 October 2023 / Published: 10 October 2023

Abstract

:
Riverine dissolved inorganic nitrogen (DIN), when elevated by human activities (e.g., land-use change), can accelerate the nitrogen cycle and downstream dispersal. However, estimating DIN export coefficients for individual land-use types can be complex due to mosaic land-use patterns and interactions between fertilizers and hydrological processes. We propose a framework that integrates an empirical model, a moving-window method, and an elasticity method to quantify seasonal DIN export coefficients for each land use in the Shixi Creek catchment, southeast China. Our model showed good agreement with field observations according to root mean square error and a normalized objective function. The export coefficients of farmland and forest were the highest (9.16 mg L−1) and lowest (2.91 mg L−1) ones, resulting in annual DIN exports, respectively, for farmland and forests of 1951 kg km−2 yr−1 and 619 kg km−2 yr−1, respectively. Urbanization was a dominant factor influencing DIN export; the export coefficient of built-up areas showed the highest elasticity and highest uncertainty, with abrupt fluctuations from dry to wet years. Our framework revealed the complex role of built-up areas in nitrogen export. Our results can shed light on how to improve riverine N management in a catchment by considering the interactive effects of climate and land use.

1. Introduction

Dissolved inorganic nitrogen (DIN) is a key indicator of the trophic status of aquatic ecosystems and is considered to be the essential form of reactive nitrogen (N) that supports ecosystem functioning [1,2]. Despite their small size, DIN dynamics in headwater streams make a significant contribution to the global N cycle by receiving most of the water and dissolved nutrients from adjacent ecosystems, and this has recently received considerable attention [3]. Stream and catchment processes, such as hydrological, biogeochemical, and sedimentary processes, are critical components of terrestrial ecosystems and have a major influence on the export of land-based nutrients in terrestrial systems [4,5]. However, the saturation of terrestrial ecosystems with N and the excessive input of land-based N nutrients have worsened eutrophication, hypoxia, and fishery resources in aquatic ecosystems [2,4]. Therefore, the understanding of land-based DIN exports in headwater streams is crucial for the achievement of sustainable development for aquatic ecosystems.
DIN consists primarily of nitrate and ammonium and is the largest fraction of total riverine N as well as the most bioavailable form of nitrogen [1,6]. It has become evident in recent decades that human activity has accelerated the N cycle and enriched the landscape with reactive N, which has become an issue of global significance [3,5]. Human activities have resulted in land-use changes, and extensive land use has dramatically increased N exports, contributing to eutrophication and hypoxia along the freshwater marine continuum [4,5,7]. Thus, land-use change has increased the release of reactive N in the environment and accelerated the N cycle in recent decades, becoming an issue of global significance [7,8]. Land-use patterns can predict riverine N exports [6,9] and many watershed models, including SPARROW (SPAtially Referenced Regression on Watershed Attributes), SWAT (Soil and Water Assessment Tool), HSPF (Hydrological Simulation Program—FORTRAN), and the N-runoff model, account for land use in their estimates of riverine N exports [1,10,11,12,13]. The performance of these models relies on accurate observed N export and export coefficients for different land-use types [6,14]; therefore, estimating the N export coefficients of different land uses is critical for watershed modeling and subsequent watershed management.
Conceptually, riverine N exports are strongly controlled by land-use patterns; however, few studies have been performed to quantify the impacts of individual land use. For example, Huang et al. (2012) applied an empirical model to inversely estimate the DIN export coefficient of each land use from riverine DIN exports [14]. Shih et al. (2016) considered the sources of DIN from point and non-point and runoff variation with some modification and then applied it to the Taiwan river with satisfactory performance for the identification of the DIN export coefficient for individual land use [6]. However, few studies have evaluated export coefficients in south Asia, where a high population density and intensive agriculture pose serious potential risks to the environment. Due to these environmental conditions, the response of N export coefficients to climate variability must be investigated.
N export from landscapes to watersheds is a complex and nonlinear process influenced by multiple factors, including intra-annual variation in rainfall and associated biogeochemical processes [11,15,16]. Meanwhile, as a result of climate variability, an altered hydrological regime would impact the variations of N exports [5,8,11]. Several studies have been conducted on the balance, export, and consequent alterations in the natural cycle of N and concluded that environmental policies are fundamental to managing the nutrient cycle [17,18]. Although export coefficients can quantify N exports for each land use, the relationship between runoff and N loads varies with time and is often poorly accounted for [17,19,20]. For example, storms can increase N export due to excessive water in the soil and decreasing biogeochemical transformation, especially during wet years [11,21,22]. Since southeast China is a hotspot of global DIN export and is regulated by urbanization, population, and runoff [11,23], the response of export coefficients to runoff variation should be discussed.
Many studies have tried to link the landscape and N exports across the world [5,8,23]. Anthropogenic lands always act as net sources in N circulation [24]. Increasing riverine N exports was significantly positively correlated with the expansion of agricultural and urban land [23]. As a result of rapid urbanization, the expansion of impervious surfaces has increased the transport of N, leading to increased N export in river systems; sewage effluent significantly contributes to N export to river systems from urbanized watersheds [4,11,23]. Through leaching and erosion, fertilizers applied to agricultural land are considered one of the most important sources of N in the watershed [9,23]. On the contrary, natural lands (e.g., forest and grass) act as net sinks in nutrient circulation [23]. Although it is clear that riverine N export is controlled by land-use patterns, understanding the link between landscape and N export remains challenging due to the scarcity of data, particularly in regions characterized by small drainage basins with intense human activities, such as Southeast Asia.
Accelerated land-use pattern changes have been observed in many regions of East Asia, which has one of the fastest-growing populations in the world [23]. The emission of N and the export of DIN in Southeast China are expected to be very high as a result of intensive land use and heavy rainfall. Therefore, in this study, we (1) quantified riverine DIN export according to land-use patterns; (2) assessed the impact of hydrological regimes on those export coefficients; and (3) conducted a scenario analysis to test different land management strategies. This study is crucial for watershed modeling and management.

2. Material and Methods

2.1. Study Area

The Shixi Creek catchment is located in an area with a subtropical Asian monsoon climate and a drainage area of 38.17 km2 with four tributaries in the middle of Fujian Province (Figure 1). The average annual temperature and precipitation are 20.5 °C and 1600~2100 mm, respectively. Notably, more than 80% of the annual precipitation occurs during the wet season, characterized by intensive Meiyu rains and typhoon storms [25]. As the headwater creek of the Jingjiang River, the watershed consists mainly of secondary vegetation containing coniferous and broad-leaved forests and artificial vegetation containing horsetail pine, bamboo forests, tea plantations, rutabagas, and various economic forests [26]. Approximately half of the catchment is covered with forest, and another third is used as orchards and farmland. Notably, most urbanized areas, constituting approximately 10% of the drainage area, are situated in close proximity to the banks of Shixi Creek (Figure 1). It is important to note that the streamflow originating from Shixi Creek serves as the primary water source for domestic, industrial, and agricultural activities, supporting the livelihoods of over 20,000 local residents [25].

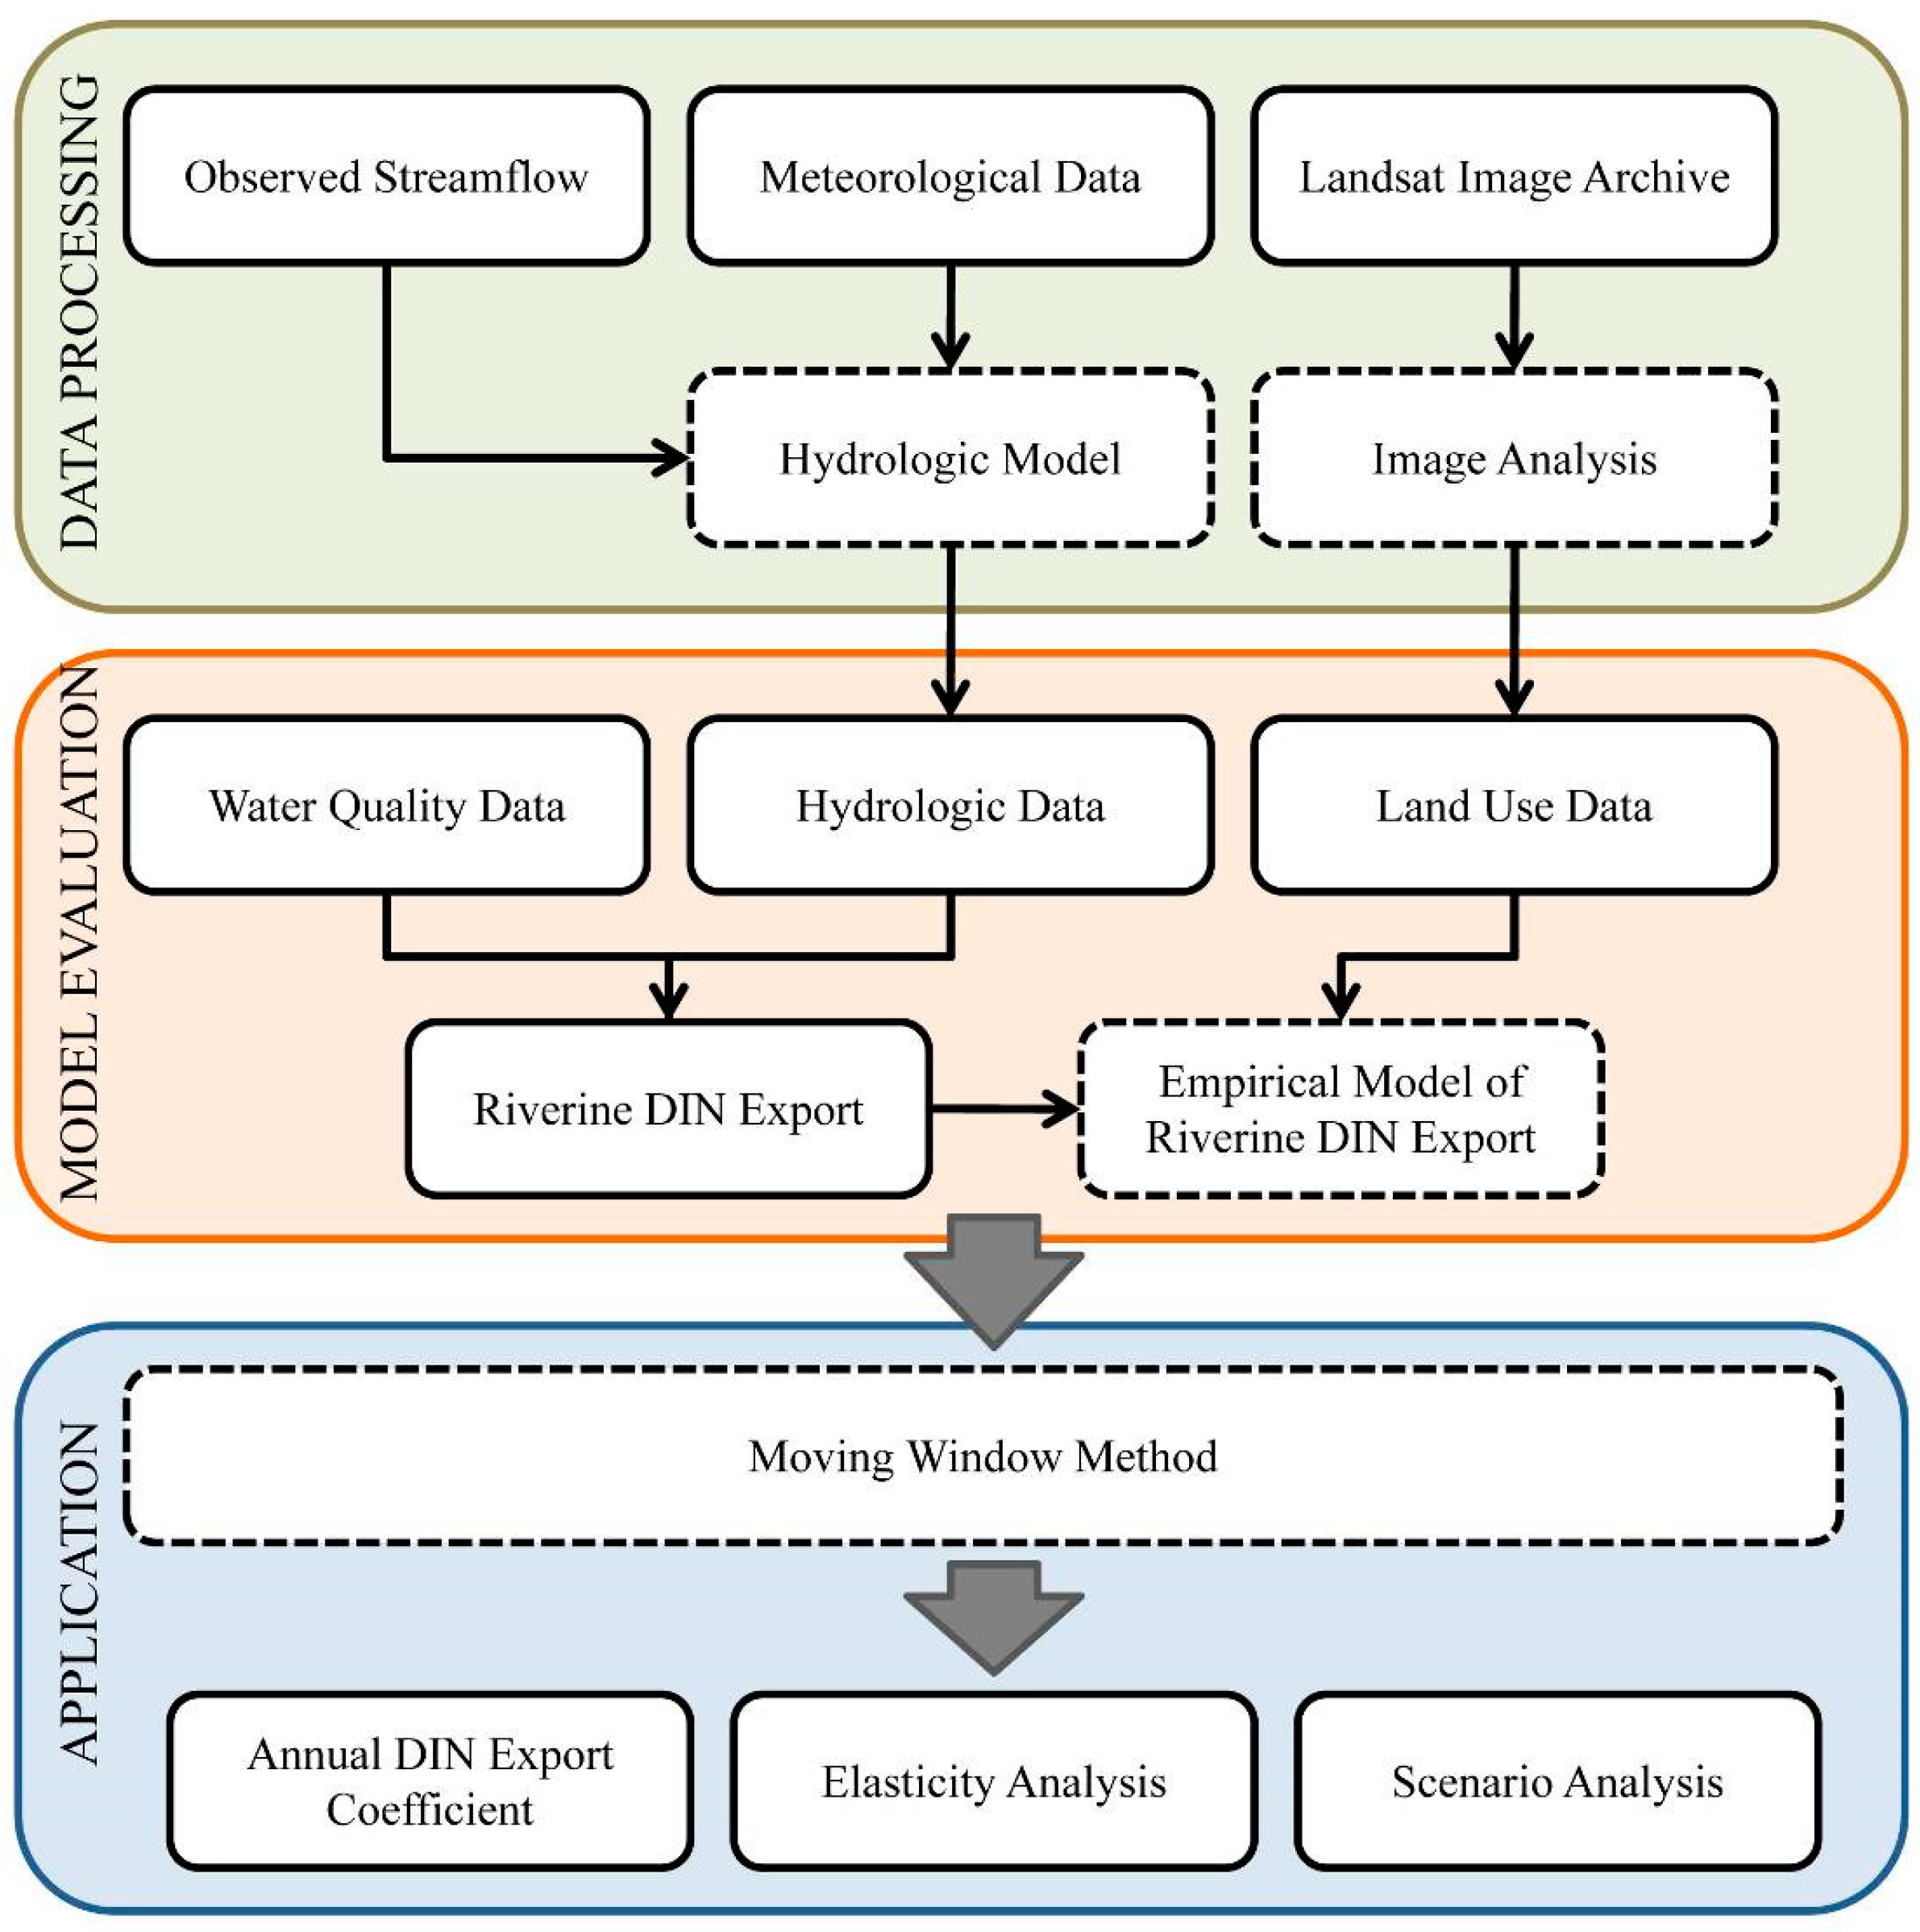
2.2. Analytical Framework

We devised a framework integrating an empirical model with moving-window and elasticity methods to apportion riverine DIN exports to land-use patterns and streamflow regimes using three steps: (1) data processing; (2) model evaluation; and (3) model application (Figure 2).

2.2.1. Data Processing

Water samples were collected from 16 sites from March 2017 to February 2019 (Figure 1). The samples were kept at 4 °C, and amounts of nitrate, nitrite, and ammonium were measured using standard methods [23] within 24 h of collection. To minimize the influence of sediments, we filtered the water immediately. To quantify land use and streamflow for ungauged sampling sites, we used Landsat-8 images in 2017 and set up a hydrological model for Shixi Creek. Land use was classified into six categories: forest, built-up areas, orchards, farmland, bare lands, and water. Four land-use categories were selected for model development (Table 1).
Discharge was simulated for each sampling site using a simplified conception model, which was proposed by Jackson-Blake et al. (2017) [27]. Streamflow measures were taken for each sampling site with doppler flow meters (Greyline MantaRay 71915) in February and July 2017 to calibrate and validate the model. Meteorological data (i.e., precipitation and temperature) were obtained from the China Meteorological Administration (http://data.cma.cn/ (accessed on 14 December 2019)) to simulate the discharge of Shixi Creek in 2017–2019.
The surface runoff, soil water, and groundwater were considered the main sources of streamflow in Shixi Creek and were estimated as follows:
Q s = f · P
where Qs is the surface runoff, f is the proportion of precipitation that exceeds the infiltration, and P is the precipitation.
Q s o i l = ( V s o i l f s ) · f l T s
d V s o i l d t = ( 1 f ) · P a l p h a · P E T · ( 1 e u V s o i l ) Q s o i l
where Qsoil is the soil water flow, Vsoil is the soil water volume, fs is the soil field capacity, fl is the threshold between soil and groundwater flow, Ts is the soil water time constant, PET is the potential evapotranspiration, alpha is the correction factor for the potential evapotranspiration, and μ is the parameter that determines the shape of the curve that links the relationship between evapotranspiration and soil water content [28].
d V g d t = b e t a · Q s o i l Q g
Q g = V g T g o r d V g d V g = 1 T g
d Q g d t = d V g d t · d Q g d V g = ( b e t a · Q s o i l Q g ) · 1 T g
where Vg is the groundwater volume, beta is the baseflow index, Tg is the groundwater time constant, and Qg is the groundwater flow.

2.2.2. Model Evaluation

Riverine DIN load or yield estimation varies with sampling frequency, estimation method, substance characteristics, flow regimes, and watershed characteristics [6,29,30]. Previous studies have concluded that many methods (e.g., linear interpolation, global mean, and flow-weighted) can be used to estimate riverine DIN exports, with no single method clearly outperforming the others [6,14]. Both the global mean and flow-weighted methods could be applied with our sample size. The global mean method multiplies the average concentration of all samples by the total discharge within the period; hence, this method does not account for hydrological responses [23]. The flow-weighted method was therefore selected to estimate annual riverine DIN exports (Equation (1)). This method weighs concentration by discharge, so flux equals annual discharge volume multiplied by flow-weighted DIN concentrations:
L = k i = 1 n C i Q i i = 1 n Q i × Q t
where L is the river DIN load; Ci is the sample concentrations; Qi is the discharge at sampling time; k is the constant unit conversion factor; and Qt is the total discharge.
Empirical models, in contrast to physical models, usually require fewer data points for calibration. For riverine N export, land-use patterns and relative proportions are important factors. The Pollutant Load Application (PLOAD) model was developed by the US Environmental Protection Agency (EPA) and uses the empirical N yield of each land-use type to estimate the N load at the outlet [31]. However, this model may not be applicable to different regional settings. Huang et al. (2012) and Shih et al. (2016) inversed the PLOAD model, where riverine DIN export at the outlet was calculated as the superimposition of different land uses [6,14]:
L A = i = 1 n C i R F i
where LA is the riverine DIN export normalized by drainage area; Fi is the proportion of land use in the catchment; R is runoff depth; and Ci is the concentration of DIN export for different land uses. This model does not account for complex in-stream processes but can be applied when stream length is short and flow velocity is high [14], as was the case in our mountainous catchment.
The normalized objective function (NOF) and percent bias (PBIAS) were used to evaluate model performance by matching the simulation results with field data measured in 2017 (calibration) and 2018 (validation).
R M S E = i = 1 n ( Q o b s Q s i m ) 2 n
N O F = R M S E Q a v e
P B I A S = i = 1 n Q o b s Q s i m i = 1 n Q o b s × 100
where RMSE, Qobs, Qsim, Qave, and n are the root mean square error, observed values, simulated values, the average of observed values, and the number of measurements, respectively.
Model predictions are acceptable for NOF values from 0.0 to 1.0 [32]. Model performance can be evaluated as “very good” (PBIAS < ±25), “good” (±25 ≤ PBIAS < ±40), “satisfactory” (±40 ≤ PBIAS < ±70), and “unsatisfactory” (PBIAS ≥ ±70) [33]. Meanwhile, we used Spearman’s correlation coefficient (ρ) to characterize the relationships between land use and DIN export. A notable advantage of this approach is its ability to determine correlations without the need to consider sample sizes or the overall distribution characteristics of the variables, making it a quick and reliable method. In addition, the Spearman correlation method imposes minimal constraints, making it highly efficient. As a result, it has been extensively used in many studies investigating the relationship between land-use patterns and water quality, demonstrating its usefulness and versatility in such studies [34].

2.2.3. Model Application

To identify inter-annual patterns in riverine DIN exports, a moving-window approach was used to account for changing hydrological regimes. The moving-window method requires the specification of a window length and overlap size between sequential windows [35,36]. A moving one-year window with a one-month overlap was used to normalize data from March 2017 to February 2019.
Elasticity analysis was used to quantify the impacts of streamflow regimes on DIN export coefficients. Based on previous studies [37,38], the annual runoff elasticity of riverine DIN export for each land-use pattern was described as:
E = C C ¯ R R ¯ R ¯ C ¯
where C ¯ and R ¯ are the means of the DIN export coefficients and runoff depths, respectively, and C and R are the DIN export coefficients and runoff depths at any given time. The median of the value was used to estimate overall elasticity [39]. After setting up the model, the baseline riverine DIN export for the catchment was estimated using the 2017 land-use data with different streamflow regimes. These baseline output values were compared to outputs from land-use policy scenarios. We used two land-use policy scenarios: (1) a certain proportion of forest is converted to agricultural land, and (2) a certain proportion of forest is converted to built-up land. We assumed that the proportions of agricultural sub-classes would remain unchanged, with a farmland to orchard ratio of 1:2.5.

3. Results

3.1. Linkage between Land Use and DIN Export Using Empirical Model

The evaluation of the linkage between DIN concentration and land use requires the determination of export coefficients for each land type (Figure 3). Observed DIN concentrations were positively correlated with the percentage of orchards (ρ = 0.62) and negatively correlated with the percentage of forests (ρ = −0.63).
DIN export coefficients for each land use were estimated with Equation (8) based on the 2017 riverine DIN export and runoff depth data, with 2018 data used for validation. DIN export coefficients for forests, built-up areas, orchards, and farmland were 2.91 mg L−1, 3.91 mg L−1, 3.7 mg L−1, and 9.16 mg L−1, respectively (Table 2).
The PBIAS and NOF calculated for the calibration period were −0.4 and 0.17, respectively. The PBIAS and NOF calculated for the validation period were −22.4 and 0.32, respectively (Table 3).

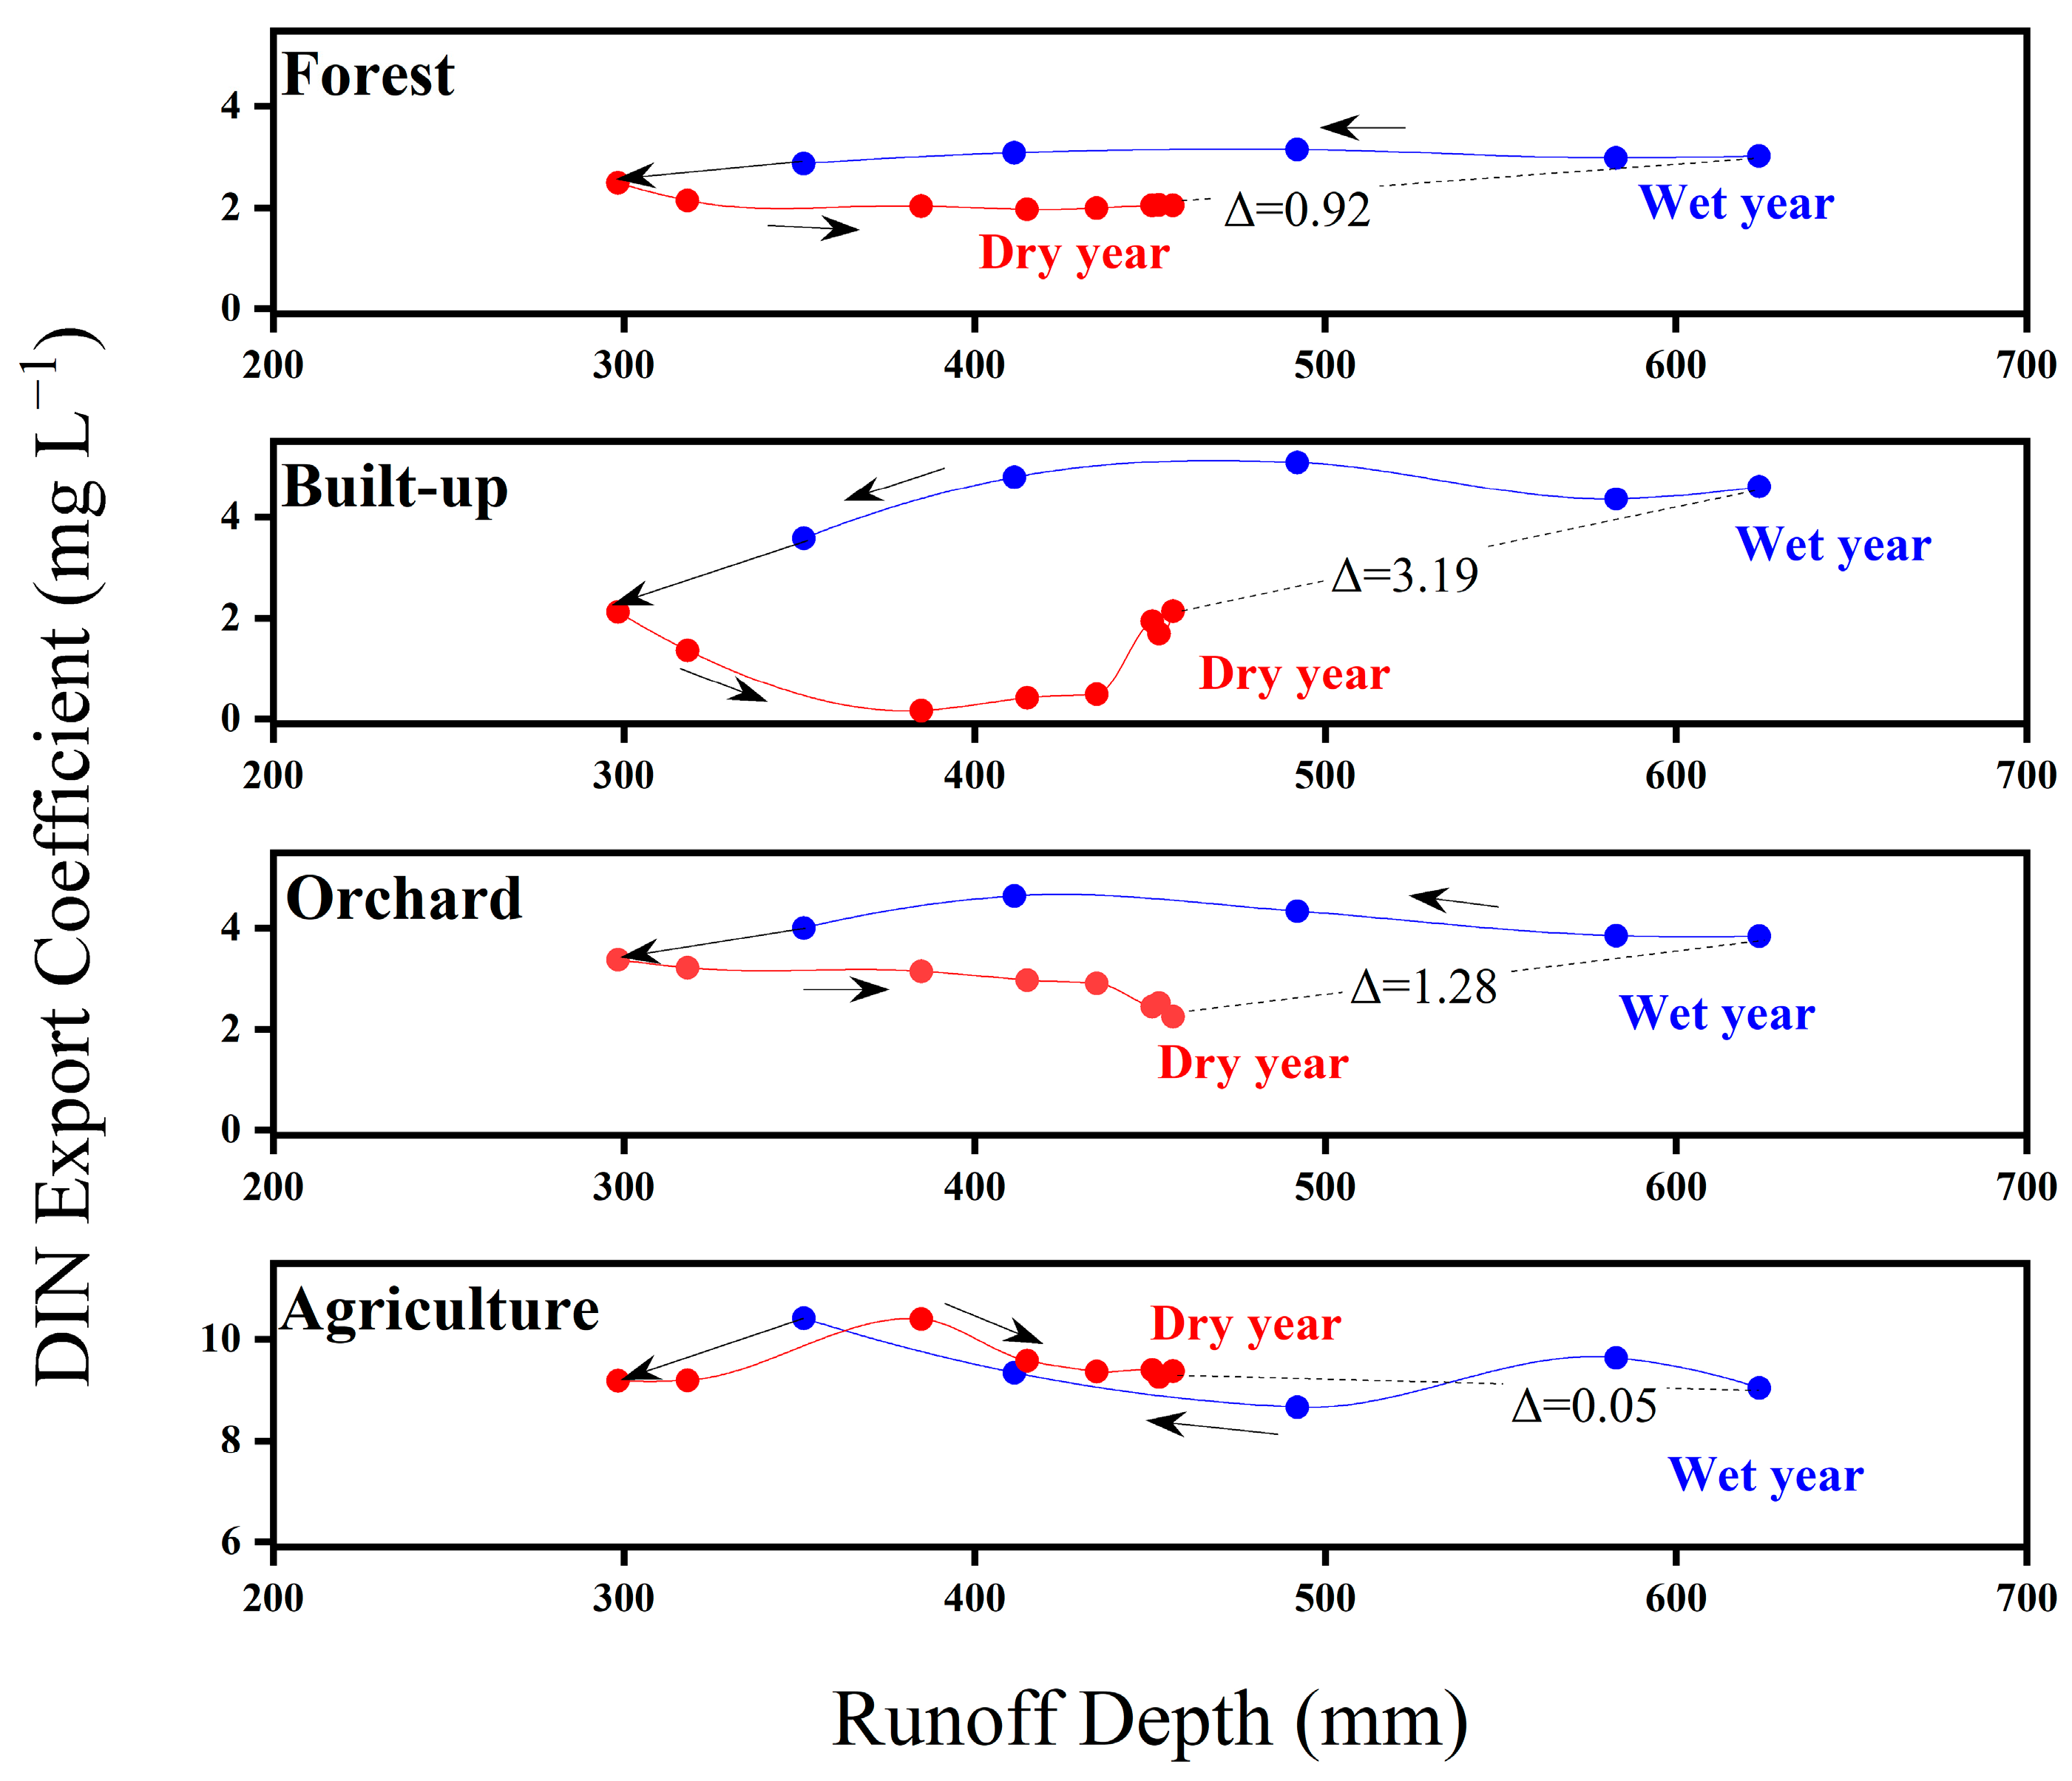
3.2. Impact of Hydrologic Regime on DIN Export

The DIN in Shixi Creek was highly related to the land-use pattern and hydrology regime in the creek (Figures S1–S4). The variation in N exports from upstream to downstream in different land-use categories is shown in Figure 4. N exports in the mainstream decreased under low streamflow conditions and increased under high flow conditions, indicating that DIN exports were mainly controlled by a hydrological regime.
We used the moving-window method to evaluate the annual DIN export coefficients of various land-use patterns (Figure 5). Farmland DIN export coefficients were higher under all runoff conditions. The DIN export coefficients of forests and orchards changed slightly and shared the same trend under the same conditions. The DIN export coefficients of built-up areas were high during wet years and low during dry years.
The DIN export coefficients for forests, built-up areas, and orchards were positively elastic to runoff (Figure 6). Though the DIN export coefficients of farmland were always high (Figure 5), the annual runoff elasticity of farmland was low (Figure 6), with a median value close to zero. The elasticity of built-up areas was the highest among the four land uses.

3.3. Pollution Control Scenario Analysis

Based on the DIN export coefficients shown above, riverine DIN exports were estimated under different land-use policies with changing streamflow regimes. Increases in anthropogenic land use were predicted to increase riverine DIN exports (Figure 7). DIN exports in built-up areas were sensitive to changes in climatic conditions (i.e., dry and wet years; Figure 7a).

4. Discussion

4.1. DIN Export Associated with Mosaic Land-Use Patterns

Relationships between land use and water quality have been proposed in a number of studies, with anthropogenic land use being negatively correlated with water quality and natural land use being positively correlated with water quality [5,6,14]. Our study confirmed these previously noted relationships and highlighted the capacity of export coefficient models to reliably evaluate N export in a catchment [6,14]. The distinct linkage between DIN concentration and land-use pattern in this catchment shows the necessity of determining export coefficients for individual land (Figure 3). Agricultural activities, which are often associated with fertilizer application, are regarded as the major non-point source of riverine N exports, coupled with reductions in riparian and wetland areas [9,22]. We observed the highest DIN export coefficients for agricultural land use (e.g., farmland: 9.16 mg L−1), indicating that riverine DIN export from farmland (1951 kg km−2 yr−1, derived from an annual discharge of 213 mm) accounted for about half of the riverine DIN export in the catchment. To put this number in context, the highest recorded riverine N exports from farmlands ranged from 400 to 3265 kg km−2 yr−1 globally [6,39].
Although orchards are also a type of agricultural land use, their riverine DIN export coefficients were low compared to farmland and showed similar trends to those for forests (Figure 5). Leaching and runoff are two major N export routes in catchments, which may be controlled by the different land cover [17,40]. Indeed, although fertilizer was applied intensively to farmlands and orchards, trees grown in orchards tended to better retain N in the soil under the same hydrological regime (Figure 5).
The lowest riverine DIN export was found for forests (619 kg km−2 yr−1), though forests can remove or retain N efficiently (Figure 3). Similar observations were conducted across China with annual deposition values of DIN as high as 1318–1521 kg km−2 yr−1 [41,42] and the natural processes in the N cycle in wet subtropical environments [6].

4.2. Interactive Impact of Land Use and Hydrologic Regime on Riverine DIN Export

It is difficult to evaluate the impacts of land use on riverine DIN export alone since the coupled impacts of climate and associated hydrological variables should be considered, especially for long-term evaluations [16,23]. A hydrological regime is a holistic driver regulating material and energy flows in a catchment [17,39], and storm events play an important role in N export. Increased discharge can drive N surplus in the soil; thus, an increase in N export is usually observed in wet years, especially during storm events [5,23].
The DIN export coefficient of built-up areas was linked to the streamflow regime (Figure 5), indicating that it is necessary to evaluate coefficients under changing streamflow regimes. Compared with dry years, increased runoff in wet years can drive more DIN to the watershed (Figure 7). Biogeochemical transformation may also decrease with increased runoff [21,43]. Decreased N export can be observed mainstream in the Shixi catchment under low flow conditions. This trend was less visible under high flow conditions (Figure 4). The major components of riverine DIN found in this study were ammonia nitrogen and nitrate nitrogen. The decreasing trend in ammonia nitrogen was more significant than that of nitrate nitrogen, since ammonia uptake is more preferential than nitrate. Thus, ammonia nitrogen’s fraction of DIN declines from the upstream to the downstream area. Nitrate nitrogen could accumulate in the catchment to promote greater microbial ammonia oxidation, as the ammonia oxidation rate is higher than the nitrite oxidation rate. Compared with the effect of biogeochemical transformation, land use was the major factor driving N export during storm events through changing headwater variability and hydrological connectivity [5].
It has been suggested that external ammonia nitrogen could be exported in a catchment when a river passes through an urban area as a result of sewage discharge [44]. The mainstream of the Shixi catchment also passes through an urban area, but elevated ammonia nitrogen was only observed in sites with high flow conditions (Figure 4). In addition to sewage discharge, N from impervious surfaces in the urban area could be a source of N. Large amounts of N could be stored on impervious surfaces during the dry season or under low flow conditions and flushed out during the wet season or under high flow conditions [5,23]. Our elasticity analysis revealed that DIN export coefficients from urban areas were high during wet years and low during dry years (Figure 5).
Human-impacted areas tend to be more sensitive to inter-annual variability (including climate variability) than natural land-use types [38]. Riverine DIN exports for built-up areas and farmland were more sensitive to streamflow than those for forests. However, riverine DIN export found in orchards was less sensitive to streamflow change than that of forests (Figure 6). The slope of the catchment could be a critical factor inducing this phenomenon, as poor water quality was observed in the high-slope area [22].

4.3. Applicability and Implications

Our results can shed light on how to improve riverine N management in a catchment by considering the interactive effects of climate and land use. Our results can also be used to illustrate the evolution of biogeochemical cycles in response to changes in land use, management, and policy [5,23]. Higher levels of riverine DIN exports were observed with increased runoff. Such amplification is proportional to anthropogenic N inputs associated with fertilizer applications and point-source pollution and should be emphasized for nitrogen reduction strategies during wet years. Built-up land was also a predominant factor in riverine DIN loads [6]. Built-up land can change the apportionment of inter-annual N exports, which were negatively related to riverine DIN exports during dry years and positively related to riverine DIN exports during wet years. In other words, changes in built-up areas have the capacity to influence patterns of riverine DIN exports in this catchment.
Furthermore, our work can be applied to evaluate N exports under different streamflow regimes. It was difficult to evaluate N export coefficients in human-impacted land use, especially in the urbanizing watershed where N export may be amplified by intensive precipitation, such as typhoons, which are common in Southeast China [5,23]. An effective framework was proposed in this study to evaluate the N export coefficient under different streamflow regimes, and this can shed light on our understanding of N export at a landscape scale. In addition, this framework may be used to understand other nutrient exports at a landscape scale.

4.4. Limitations and Potential Options for Improvements

The framework may only apply in specific watersheds where the stream length is short and the flow velocity is high, as in-stream processes were not ignored in this study. In future studies, we will consider in-stream N decay in our model and apply it to a large watershed.

5. Conclusions

This study proposed a framework to assess riverine DIN exports associated with changing land-use patterns and hydrological regimes. The proportion of human-impacted land use was negatively related to water quality. Though the DIN export coefficient of farmland was the highest among the four types of land use investigated, urbanization contributed to high runoff elasticity and high uncertainty. However, urbanized areas can rarely be converted to other uses; therefore, more attention may be paid to agricultural land management. The framework devised in this study can be used as an effective tool for water management.

Supplementary Materials

The following supporting information can be downloaded at https://www.mdpi.com/article/10.3390/w15203528/s1, Figure S1: Impact of Land Use (%) on NH4+-N concentration (mg L−1), Figure S2: Impact of Land Use (%) on NO3-N concentration (mg L−1), Figure S3: Impact of Land Use (%) on NO2-N concentration (mg L−1), and Figure S4: Impact of Discharge (mm day−1) on NH4+-N. NO3-N, and NO2-N concentration (mg L−1).

Author Contributions

J.H. conceived of the presented idea and supervised the findings of this work. Z.Z. and Y.L. verified the analytical methods. All authors have read and agreed to the published version of the manuscript.

Funding

This study was supported by the National Natural Science Foundation of China (Grant No. 41471154; Grant No. 41971231).

Data Availability Statement

The datasets used in the current study are available from the corresponding author on reasonable request.

Acknowledgments

Hefan Zeng, Juntao Cai, Boqiang Huang, Jihui Liu, and Cairong Xiao provided assistance with in situ monitoring and experiments. We thank anonymous reviewers for their constructive comments, which helped improve this paper.

Conflicts of Interest

The authors declare that they have no known competing financial interest or personal relationship that could have appeared to influence the work reported in this paper.

References

  1. Lu, M.-C.; Chang, C.-T.; Lin, T.-C.; Wang, L.-J.; Wang, C.-P.; Hsu, T.-C.; Huang, J.-C. Modeling the terrestrial N processes in a small mountain catchment through INCA-N: A case study in Taiwan. Sci. Total Environ. 2017, 593–594, 319–329. [Google Scholar] [CrossRef] [PubMed]
  2. Begstrom, A. The use of TN:TP and DIN:TP ratios as indicators for phytoplankton nutrient limitation in oligotrophic lakes affected by N deposition. Aquat. Sci. 2010, 72, 277–281. [Google Scholar] [CrossRef]
  3. Peterson, B.J.; Wollheim, W.M.; Mulholland, P.J.; Webster, J.R.; Meyer, J.L.; Tank, J.L.; Marti, E.; Bowden, W.B.; Valett, H.M.; Hershey, A.E.; et al. Control of nitrogen export from watersheds by headwater streams. Science 2001, 292, 86–90. [Google Scholar] [CrossRef]
  4. Chen, Y.; Cheng, W.; Zhang, H.; Qiao, J.; Liu, J.; Shi, Z.; Gong, W. Evaluation of the total maximum allocated load of dissolved inorganic nitrogen using a watershed–coastal ocean coupled model. Sci. Total Environ. 2019, 673, 734–749. [Google Scholar] [CrossRef] [PubMed]
  5. Kaushal, S.S.; Mayer, P.M.; Vidon, P.G.; Smith, R.M.; Pennino, M.J.; Newcomer, T.A.; Duan, S.; Welty, C.; Belt, K.T. Land use and climate variability amplify carbon, nutrient, and contaminant pulses: A review with management implications. JAWRA J. Am. Water Resour. Assoc. 2014, 50, 585–614. [Google Scholar] [CrossRef]
  6. Shih, Y.-T.; Lee, T.-Y.; Huang, J.-C.; Kao, S.-J. Chang Apportioning riverine DIN load to export coefficients of land uses in an urbanized watershed. Sci. Total Environ. 2016, 560–561, 1–11. [Google Scholar] [CrossRef]
  7. Akhtar, N.; Ishak, M.; Bhawani, S.A.; Umar, K. Various Natural and anthropogenic factors responsible for water quality degradtation: A review. Water 2021, 13, 2660. [Google Scholar] [CrossRef]
  8. Kamari, M.; Huttunen, I.; Valkama, P.; Huttunen, M.; Korppoo, M.; Tattari, S.; Lotsari, E. Modelling inter- and intra-annual variation of riverine nitrogen/nitrate losses from snowelt-affected basins under agricultural and mixed land use captured with high frequency monitoring. Catena 2019, 176, 227–244. [Google Scholar] [CrossRef]
  9. Huang, J.-C.; Lee, T.-Y.; Lin, T.-C.; Hein, T.; Lee, L.-C.; Shih, Y.-T.; Kao, S.-J.; Shiah, F.-K.; Lin, N.-H. Effects of different N sources on riverine DIN export and retention in a subtropical high-standing island, Taiwan. Biogeosciences 2016, 13, 1787–1800. [Google Scholar] [CrossRef]
  10. Zhang, Z.; Montas, H.; Shirmohammadi, A.; Leisnham, P.T.; Negahban-Azar, M. Impacts of land cover change on the spatial distribution of nonpoint source pollution based on SWAT model. Water 2023, 15, 1174. [Google Scholar] [CrossRef]
  11. Zhang, Z.; Huang, J.; Zhou, M.; Huang, Y.; Lu, Y. A Coupled modeling approach for water management in a river–reservoir system. Int. J. Environ. Res. Public Health 2019, 16, 2949. [Google Scholar] [CrossRef]
  12. Mander, U.; Kull, A.; Kuusements, V.; Toomas, T. Nutrient runoff dynamics in a rural catchment: Influence of land use changes, climatic fluctuations and ecotechnological measures. Ecol. Eng. 2000, 14, 405–417. [Google Scholar] [CrossRef]
  13. Pärn, J.; Henine, H.; Kasak, K.; Kauer, K.; Sohar, K.; Tournebize, J.; Uuemaa, E.; Välik, K.; Mander, U. Nitrogen and phosphorus discharge from small agricultural catchments predicted from land use and hydroclimate. Land Use Policy 2018, 75, 260–268. [Google Scholar] [CrossRef]
  14. Huang, J.-C.; Lee, T.-Y.; Kao, S.-J.; Hsu, S.-C.; Lin, H.-J.; Peng, T.-R. Land use effect and hydrological control on nitrate yield in subtropical mountainous watersheds. Hydrol. Earth Syst. Sci. 2012, 16, 699–714. [Google Scholar] [CrossRef]
  15. Lee, M.; Shevliakova, E.; Malyshev, S.; Milly, P.C.D.; Jaffé, P.R. Climate variability and extremes, interacting with nitrogen storage, amplify eutrophication risk. Geophys. Res. Lett. 2016, 43, 7520–7528. [Google Scholar] [CrossRef]
  16. Zhou, Y.; Xu, J.; Yin, W.; Ai, L.; Fang, N.; Tan, W.; Yan, F.; Shi, Z. Hydrological and environmental controls of the stream nitrate concentration and flux in a small agricultural watershed. J. Hydrol. 2017, 545, 355–366. [Google Scholar] [CrossRef]
  17. De Girolamo, A.M.; Spanò, M.; D’ambrosio, E.; Ricci, G.F.; Gentile, F. Developing a nitrogen load apportionment tool: Theory and application. Agric. Water Manag. 2019, 226, 105806. [Google Scholar] [CrossRef]
  18. Tzoraki, O.A.; Dörflinger, G.; Kathijotes, N.; Kontou, A. Nutrient-based ecological consideration of a temporary river catchment affected by a reservoir operation to facilitate efficient management. Water Sci. Technol. 2013, 69, 847–854. [Google Scholar] [CrossRef] [PubMed]
  19. Tomer, M.D.; Meek, D.W.; Jaynes, D.B.; Hatfield, J.L. Evaluation of nitrate-nitrogen fluxes from a tile-drained watershed in central Iowa. J. Environ. Qual. 2003, 32, 642–653. [Google Scholar] [PubMed]
  20. Zhang, Y.-K.; Schilling, K. Temporal variations and scaling of streamflow and baseflow and their nitrate-nitrogen concentrations and loads. Adv. Water Resour. 2005, 28, 701–710. [Google Scholar] [CrossRef]
  21. Greaver, T.L.; Clark, C.M.; Compton, J.E.; Vallano, D.; Talhelm, A.F.; Weaver, C.P.; Band, L.E.; Barson, J.S.; Davidson, E.A.; Tague, C.I.; et al. Key ecoligcal responses to nitrogen are altered by climate change. Nat. Clim. Chang. 2016, 6, 836–843. [Google Scholar] [CrossRef]
  22. Li, W.; Liu, H.; Zhai, L.; Yen, H.; Hu, W.; Lei, Q.; Stewart, R.J.; Guo, S.; Ren, T. Evaluation of concentration-discharge dynamics and nitrogen export on anthropogenic inputs and stormflow across alternative time-scales. Ecol. Indic. 2019, 98, 879–887. [Google Scholar] [CrossRef]
  23. Huang, Y.; Huang, J.; Ervinia, A.; Duan, S.; Kaushal, S.S. Land use and climate variability amplifies watershed nitrogen exports in coastal China. Ocean Coast. Manag. 2018, 207, 104428. [Google Scholar] [CrossRef]
  24. Delkash, M.; Furat, A.M.; AI-Faraj Scholz, M. Impacts of anthropogenic land use changes on nutrient concentration in surface waterbodies: A review. Clean Soil Air Water 2018, 46, 1800051. [Google Scholar] [CrossRef]
  25. Zhang, Z.Y.; Huang, J.L.; Xiao, C.R.; Huang, J.C. Simulation-based method to develop strategies for nitrogen pollution control in a creek watershed with sparse data. Environ. Sci. Pollut. Res. 2020, 27, 38849–38860. [Google Scholar] [CrossRef]
  26. Lin, F.; Chen, X.; Yao, H.; Lin, F. SWAT model-based quantification of the impact of land-use change on forest-regulated water flow. Catena 2022, 2011, 105975. [Google Scholar] [CrossRef]
  27. Jackson-Blake, L.A.; Sample, J.E.; Wade, A.J.; Helliwell, R.C.; Skeffington, R.A. Are our dynamic water quality models too complex? A comparison of a new parsimonious phosphorus model, SimplyP, and INCA-P. Water Resour. Res. 2017, 53, 5382–5399. [Google Scholar] [CrossRef]
  28. Fenicia, F.; Kavetski, D.; Savenije, H.H.G. Elements of a flexible approach for conceptual hydrological modeling: 1. Motivation and theoretical development. Water Resour. Res. 2011, 47, W11510. [Google Scholar] [CrossRef]
  29. Ferguson, R.I. Accuracy and precision of methods for estimating river loads. Earth Surf. Process. Landforms 1987, 12, 95–104. [Google Scholar] [CrossRef]
  30. Preston, S.D.; Bierman, V.J.; Silliman, S.E. An evaluation of methods for the estimation of tributary mass loads. Water Resour. Res. 1989, 25, 1379–1389. [Google Scholar] [CrossRef]
  31. US EPA. User’s Manual of PLOAD Version 3.0: An Arcview GIS Tool to Calcuate Nonpoint Sources of Pollution in Watershed and Storm Water Projects; US EPA: Washington, DC, USA, 2001.
  32. Gikas, G.D. Water quality of drainage canals and assessment of nutrient loads using QUAL2Kw. Environ. Process. 2014, 1, 369–385. [Google Scholar] [CrossRef]
  33. Moriasi, D.N.; Arnold, J.G.; van Liew, M.W.; Bingner, R.L.; Harmel, R.D.; Veith, T.L. Model evaluation guidelines for systematic quantification of accuracy in watershed simulations. Trans. ASABE 2007, 50, 885–900. [Google Scholar] [CrossRef]
  34. Wu, J.; Zeng, S.; Yang, L.; Ren, Y.; Xia, J. Spatiotemporal characteristics of the water quality and its multiscale relationship with land use in the Yangtze River Basin. Remote Sens. 2021, 13, 3309. [Google Scholar] [CrossRef]
  35. Gall, W.; Duftschmid, G.; Dorda, W. Moving time window aggregates over patient histories. Int. J. Med. Inform. 2001, 63, 133–145. [Google Scholar] [CrossRef] [PubMed]
  36. Choi, H.T.; Beven, K. Multi-period and multi-criteria model conditioning to reduce prediction uncertainty in an application of TOPMODEL within the GLUE framework. J. Hydrol. 2007, 332, 316–336. [Google Scholar] [CrossRef]
  37. Sankarasubramanian, A.; Vogel, R.M.; Limbrunner, J.F. Climate elasticity of streamflow in the United States. Water Resour. Res. 2001, 37, 1771–1781. [Google Scholar] [CrossRef]
  38. Jiang, J.; Sharma, A.; Sivakumar, B.; Wang, P. A global assessment of climate–water quality relationships in large rivers: An elasticity perspective. Sci. Total Environ. 2014, 468–469, 877–891. [Google Scholar] [CrossRef]
  39. Shields, C.A.; Band, L.E.; Law, N.; Groffman, P.M.; Kaushal, S.S.; Savvas, K.; Fisher, G.T.; Belt, K.T. Streamflow distribution of non-point source nitrogen export from urban-rural catchments in the Chesapeake Bay watershed. Water Resour. Res. 2008, 44, W09416. [Google Scholar] [CrossRef]
  40. Billy, C.; Birgand, F.; Ansart, P.; Peschard, J.; Sebilo, M.; Tournebize, J. Factors controlling nitrate concentrations in surface waters of an artificially drained agricultural watershed. Landsc. Ecol. 2013, 28, 665–684. [Google Scholar] [CrossRef]
  41. Zhang, Q.; Wang, Q.; Xu, L.; Zhu, J.; He, N. Monthly dynamics of atmospheric wet nitrogen deposition on different spatial scales in China. Environ. Sci. Pollut. Res. 2018, 25, 24417–24425. [Google Scholar] [CrossRef]
  42. Zhu, J.; He, N.; Wang, Q.; Yuan, G.; Wen, D.; Yu, G.; Jia, Y. The composition, spatial patterns, and influencing factors of atmospheric wet nitrogen deposition in Chinese terrestrial ecosystems. Sci. Total Environ. 2015, 511, 777–785. [Google Scholar] [CrossRef] [PubMed]
  43. Gallo, E.L.; Meixner, T.; Aoubid, H.; Lohse, K.A.; Brooks, P.D. Combined impact of catchment size, land cover, and precipitation on streamflow and total dissolved nitrogen: A global comparative analysis. Glob. Biogeochem. Cycles 2015, 29, 1109–1121. [Google Scholar] [CrossRef]
  44. Simsek, H.; Kasi, M.; Wadhawan, T.; Bye, C.; Blonigen, M.; Khan, E. Fate of dissolved organic nitrogen in two stage trickling filter process. Water Res. 2012, 46, 5115–5126. [Google Scholar] [CrossRef] [PubMed]
Figure 1. Study area.
Water 15 03528 g001
Figure 2. Flow diagram of the study.
Water 15 03528 g002
Figure 3. Impact of Land Use (%) on DIN concentration (mg L−1) (Note: ** indicated p < 0.01).
Water 15 03528 g003
Figure 4. Variability of DIN, NO3-N, and NH4+-N exports in the mainstream of Shixi Creek (kg km−2 yr−1) as a function of the streamflow. Based on the average streamflow of each sampling site, the mainstream was classified into three categories with equal size. The low flow category contains all values less than or equal to the 33rd percentile of streamflow; the medium flow category contains all values falling in the range of 34th to 66th percentiles; and the high flow category contains all values greater than the 67th percentile of streamflow.
Water 15 03528 g004
Figure 5. Seasonal variation in DIN export coefficients (mg L−1) as a function of Runoff Depth (mm) in the distinct land types.
Water 15 03528 g005
Figure 6. Runoff elasticities of DIN export coefficients.
Water 15 03528 g006
Figure 7. Riverine DIN exports (kg km−2 yr−1) under different scenarios of Runoff Depth (mm) and human land use (%).((a): impacts of built-up, (b): impacts of agricultural land).
Water 15 03528 g007
Table 1. Catchment Characteristics.
Site IDLandscape AttributesLand-Use Composition
AreaLengthForest Built-UpOrchardFarmland
(Km2)(m)(%)(%)(%)(%)
S11.85104661.6414.056.2214.87
S24.87173472.015.897.1613.49
S37.92431366.928.628.5612.76
S48.05504365.728.6810.2111.80
S52.51175660.172.1224.709.94
S612.73833156.797.7820.1511.54
S714.97989953.058.1622.3412.31
S816.1410,05550.868.9023.0612.83
S93.53289139.349.9337.237.67
S1020.9813,10046.289.8626.7512.23
S1121.1913,46545.8410.1326.7412.36
S121.486014.4025.5429.9023.59
S1324.1315,57243.0111.6426.9213.22
S1426.6716,11142.5711.9827.0913.19
S1527.3216,92142.2312.2427.3413.09
S1633.6518,66246.0510.7026.6112.32
Note: Landscape attributes and land-use composition were estimated by the sub-catchment upstream of the sampling sites.
Table 2. Set up of Models based on the Data of 2017.
Forest
(mg L−1)
Built-Up
(mg L−1)
Orchard
(mg L−1)
Farmland
(mg L−1)
2.913.91 3.70 9.16
Table 3. Performance of Models.
CalibrationValidation
PBIASNOFPBIASNOF
−0.40.15 −22.40.44
Disclaimer/Publisher’s Note: The statements, opinions and data contained in all publications are solely those of the individual author(s) and contributor(s) and not of MDPI and/or the editor(s). MDPI and/or the editor(s) disclaim responsibility for any injury to people or property resulting from any ideas, methods, instructions or products referred to in the content.

