Article

Spatial–Temporal Distribution and Ecological Risk Assessment of Microplastic Pollution of Inland Fishing Ground in the Ubolratana Reservoir, Thailand

by
Pattira Kasamesiri
*,
Ruamruedee Panchan
and
Wipavee Thaimuangphol
Department of Agricultural Technology (Fisheries), Faculty of Technology, Mahasarakham University, Kantarawichai District, Maha Sarakham 44150, Thailand
*
Author to whom correspondence should be addressed.
Water 2023, 15(2), 330; https://doi.org/10.3390/w15020330
Submission received: 25 November 2022 / Revised: 6 January 2023 / Accepted: 11 January 2023 / Published: 12 January 2023
(This article belongs to the Special Issue Microplastics Pollution and Solutions)

Abstract

:
Microplastic pollution has been identified as a potential threat to the aquatic environment and humans globally, with widespread occurrence in ecosystems, including reservoirs that constitute a key role in ecosystem services for humans. However, the evaluation of microplastic pollution in reservoirs is limited, especially in inland fishing ground reservoirs. The spatial and temporal distributions of microplastics in surface water and sediment at 13 stations of the Ubolratana Reservoir, Thailand, were assessed during the wet and dry seasons. The abundance and morphological characteristics of the microplastics were identified and classified by color, shape, size and polymer type. Microplastic abundance in surface water and sediment ranged between 25 and 3363 particles/m3 and 6 and 81 particles/kg, respectively. Seasonal variations impacted microplastic abundance in surface water, while tourism activity in the reservoir also influenced the abundance and morphological characteristics of microplastics. A microplastic risk assessment showed that the pollution load index reached extremely high levels in surface water during the dry season in tourist areas. The results provide a database to assess the risk of microplastic contamination and to monitor plastic pollution in lentic ecosystems, including preserving the health of aquatic habitats.

1. Introduction

Plastic pollution in aquatic environments has recently gained global attention. A total of 367 million tons of plastics were produced in 2020 [1]. Plastic litter leakage into aquatic ecosystems has steadily increased since 1950, and is closely correlated with production and usage [2]. Mismanagement of plastic waste generates plastic pollution, and the plastic debris degrades, due to chemical, physical and biological factors, into microplastics (small particles < 5 mm) [3,4,5]. Microplastics were first reported in the marine environment [3]. They are distributed from terrestrial to lentic and lotic ecosystems through domestic sewage discharge, wind and overland runoff [6,7], and finally flow into the ocean [8]. Continental areas are the main source of microplastics in aquatic environments [9].
Small-sized microplastic particles are easily distributed over aquatic ecosystems and accumulate in aquatic biota such as zooplankton [10], benthic invertebrates [11] and fish [12] with transfer through trophic levels of the food chain [13,14]. Additives and sorbed contaminants from microplastics, such as heavy metals and persistent organic pollutants (POPs), disrupt the physiological systems of aquatic animals [15]. Microplastics smaller than 150 μm can translocate across the human gastrointestinal tract into the lymphatic system [16], leading to health issues [17]. Moreover, microplastics in freshwater systems have impacts on microorganisms that relate to biogeochemical cycles and greenhouse gas emissions [18].
Reservoirs, as lentic ecosystems, are important catchment areas that serve as water resources for human activities. Reservoirs accumulate microplastic particles that are transported to riverine systems [8]. Factors in the environmental matrix, such as flood discharge, inflow, water storage levels, ion concentrations including seasonal variation and anthropogenic sources, affect the abundance and morphological characteristics of microplastics [8,19,20]; however, the effects of fishing activities, aquaculture and tourism during different seasons, and ecological risk assessment in reservoirs, are poorly documented.
The Ubolratana Reservoir is an important fishing ground in the northeastern region of Thailand. A total of 900 tons of freshwater animals are captured per year, with a commercial value of more than 1,290,000 USD [21]. The Ubolratana Reservoir is also a popular tourist attraction. This study demonstrated how anthropogenic activities in the Ubolratana Reservoir impacted the abundance and morphological characteristics of microplastics. Microplastic pollution in the Ubolratana Reservoir was investigated for (i) the spatial and temporal distribution of the abundance and morphological characteristics (color, shape, size and polymer type) of microplastics, and (ii) a risk assessment of microplastic pollution in the fishing ground reservoir.

2. Materials and Methods

2.1. Sampling Sites

Microplastic sampling sites were located on the Ubolratana Reservoir (16°44′–16°48′ N; 102°31–102°34′ E) in the northeastern region of Thailand. This man-made catchment area was commissioned in 1966 with multipurposes including electricity generation, flood control, irrigation for agriculture, aquaculture, fisheries and as a tourist attraction. The reservoir impounds water from the Nam Phong River, with a storage capacity of 2431 million cubic meters and a catchment area of 12,104 square kilometers [22] covering two provinces. Water from the reservoir flows into the Chi River (the longest river in Thailand) and then to the tributaries of the Mekong River basin. Four sources of microplastics within the reservoir were classified as small-scale fisheries (MP1, 2, 3, 8, 9, 12, 13); tourism (MP4, 5, 6); fishing and aquaculture (MP7, 11); and tourism and aquaculture (MP10). The reservoir was divided into 3 regions by considering the water flow direction as upper (MP1, 2, 3, 12, 13), middle (MP4, 8, 9, 10, 11), and lower (MP5, 6, 7) (Figure 1).

2.2. Sample Collection

Surface water (0–30 cm in depth) and bottom sediments were collected from 13 study sites around the Ubolratana Reservoir with 3 replicates (Figure 1). The sampling was conducted between November 2020 (wet season) and January 2021 (dry season). Sample collection was performed one time in each season. Although the rainy season starts in June, heavy rainfall and the highest water levels were found in November, which was therefore selected to represent the wet season. The dry season is from January to May. A low water level, without water flowing into the reservoir, was found at the end of January resulting in being unable to collect water and sediment samples after that time. January, therefore, was selected as the dry season for the study [23] (Figure S1). Water samples of 100 L were collected using a stainless steel bucket and filtered through a stainless steel sieve (mesh size 63 μm; Cole-Parmer, Vernon Hills, IL, USA), then microparticles on the sieve were washed with distilled water to a glass funnel that fitted with a glass bottle (final volume approximately 50 mL). Sediments were collected using a stainless steel Ekman grab sampler. Approximately 500 g of surface sediment (0–5 cm depth) from the littoral zone (1 m water depth) of each sampling site was homogenized, wrapped in aluminum foil and then transferred to the laboratory. All samples were stored at 4 °C in a refrigerator until the microplastic extraction.

2.3. Microplastic Extraction

Microplastic extraction protocols were adapted from Yan et al. (2021) [4]. Water samples with particles were treated with 20 mL of 30% H2O2 and 0.05M Fe (II) solution (7.5 g FeSO4.7H2O, 500 mL distilled water and 3 mL 0.1M H2SO4) for 24 h at room temperature to digest other organic particles. The samples were filtered through a glass microfiber filter with 1.2 μm pore size (GF/C, Whatman, Maidstone, UK) using a vacuum pump (Rocker, Taiwan) and washed with filtered distilled water.
The sediment samples were dried for 48 h at 60 °C. Then, each 300 g sample was added to 500 mL of saturated NaCl solution (approximately 300 g/L). After mixing the NaCl and sediment samples, the samples were vigorously stirred with a glass stirring rod for 10 min. The samples were left to settle overnight, and the floating particle supernatant was pipetted into a 500 mL beaker. We repeated this procedure twice in order to collect some of the MP particles that may not have floated in the first round. Moreover, we randomly checked the sediment sample by mixing NaCl in round 3 and checking for nondetected MP particles. The organic substances contained in the supernatant solution were treated with the same chemical solution as the water sample and filtrated onto a Whatman GF/C (pore size 1.2 μm).

2.4. Identification of Microplastic Morphological Characteristics

The abundance and physical characteristics (color, shape, size) of the microplastics on the Whatman GF/C were observed under a stereomicroscope (Nikon SMZ745/745T; Nikon Instruments Inc., Japan). The particles were measured along their longest dimension using built-in measuring software (Zeiss AxioVision SE64 Rel.4.9.1) with size ranges 1000–5000 μm, 500–1000 μm, 150–500 μm, and smaller than 150 μm. The microplastics’ shapes were classified into fibers, pellets, foam, sheets and fragments. Polymers were analyzed using a micro-Fourier transform infrared spectroscope (Spectrum Two with Spotlight 200i, PerkinElmer, Waltham, MA, USA) and compared with the FTIR spectral library (PerkinElmer Spectrum IR Version 10.6.2).

2.5. Quality Assurance and Quality Control

In this study, plastic materials were avoided during sample processing. All the equipment in the laboratory was rinsed two times with distilled water. The chemical solution for microplastic extraction was filtered through washed glass microfiber filters (GF/C). Distilled water, chemical solution (H2O2, Fe (II) and NaCl), and the sample extraction protocol were filtered through washed GF/C. In order to exclude background contamination in all stages of the sample process, three replicate blank controls (distilled water and all sample treatment reagents) were also processed in the same way as all the water and sediment samples, and contamination was investigated under a stereomicroscope and FTIR for correcting microplastic sample counts. No microplastics were observed in any control bank, indicating that there was no contamination in the laboratory procedure or sample treatment reagents. Non-microplastic particles in the sample were identified and excluded from the total number of microplastic particles using FTIR.

2.6. Microplastic Ecological Risk Assessment

The pollution load index (PLI) [24] was used for a risk assessment of microplastic pollution in the reservoir and calculated according to the following equations [13].
      C F i = C i C 0
P L I = C F i
where Ci is the abundance of microplastics at each station, and C0 is the lowest microplastic abundance in the reservoir based on the literature [19]. The risk of pollution criteria followed Wang et al. (2020) [13] (Table S1).
A second model to assess the potential ecological risk of microplastic pollution used the polymer hazard index (H) [13,25] as the following equation:
H = P n × S n
where Pn is the percentage of each polymer type at each sampling station, and Sn is the polymer hazard score according to Lithner et al. (2011) [13].

2.7. Statistical Analysis

Microplastic abundances were compared among sampling stations, seasons, anthropogenic activities and reservoir regions using the nonparametric Kruskal–Wallis and Mann–Whitney tests, with significant difference set as p-value less than 0.05. The total numbers of microplastic colors were compared among seasons and environmental media using nonparametric Mann–Whitney tests.

3. Results and Discussion

3.1. Microplastic Abundance and Spatial–Temporal Distribution in Surface Water and Sediment

Microplastic particles were detected in the water and sediment of all sampling sites around the Ubolratana Reservoir. Microplastic abundance in water and sediment ranged between 25–3363 particles/m3 and 6–81 particles/kg, respectively. The average concentration of microplastics was 230 ± 710 particles/m3 in surface water and 20 ± 18 particles/kg in sediment. Most microplastic abundances in reservoirs in this study were higher than those in Three Gorges Reservoir, Danjiangkou Reservoir, and Dafangying Reservoir [7,8,20,26,27,28] (Table 1). Microplastic accumulation in sediment was significantly different among the sampling sites (p < 0.05), but no significant difference was recorded in surface water. The highest abundance in surface water was located at site MP6, the main tourism area of the Ubolratana Reservoir, during the dry season (3363 ± 1915 particles/m3) (Figure 2b). MP10, another tourist attraction area, also showed high abundance of microplastics. The abundance of microplastics in sediment showed the highest concentration at MP2 for both seasons (81 ± 45 particles/kg in wet season and 35 ± 15 particles/kg in dry season) (Figure 2c,d). This site is one of the largest fishing communities in the reservoir, and particles from the upper reaches of the reservoir settled at MP2.
There was no significant difference in the abundance of microplastics between the four types of anthropogenic activities; additionally, no difference was found among the upper, middle and lower regions of the reservoir (Figure 3). Microplastic particles in sediment were more abundant in the upper region of the reservoir (Figure 2c,d and Figure 3b), while surface water contained more microplastics in the lower region (Figure 2a,b and Figure 3d). The tourism area, located in the lower region, had a high abundance of microplastics in the water column. The abundance of anthropogenic activities, such as the number of tourists, may influence microplastic spatial distribution in the surface water of the Ubolratana Reservoir, while some microplastics may settle into the sediment in the upper region of the reservoir.
The abundance of microplastics during the wet season varied from 25–254 particles/m3 in surface water, and 9–81 particles/kg in sediment, with 63–3363 particles/m3 and 6–35 particles/kg recorded in the dry season. Microplastic abundance in surface water during the wet season was lower than during the dry season (p < 0.05), caused by dilution from rainfall and the high volume of water in the catchment area during the wet season [7,29]. Seasonal variation was one of the main factors affecting microplastic abundance in the reservoir [19]. Microplastic accumulation in the water was also impacted by weak hydrodynamic forces in the reservoir during the dry season [7].

3.2. Microplastic Characteristics

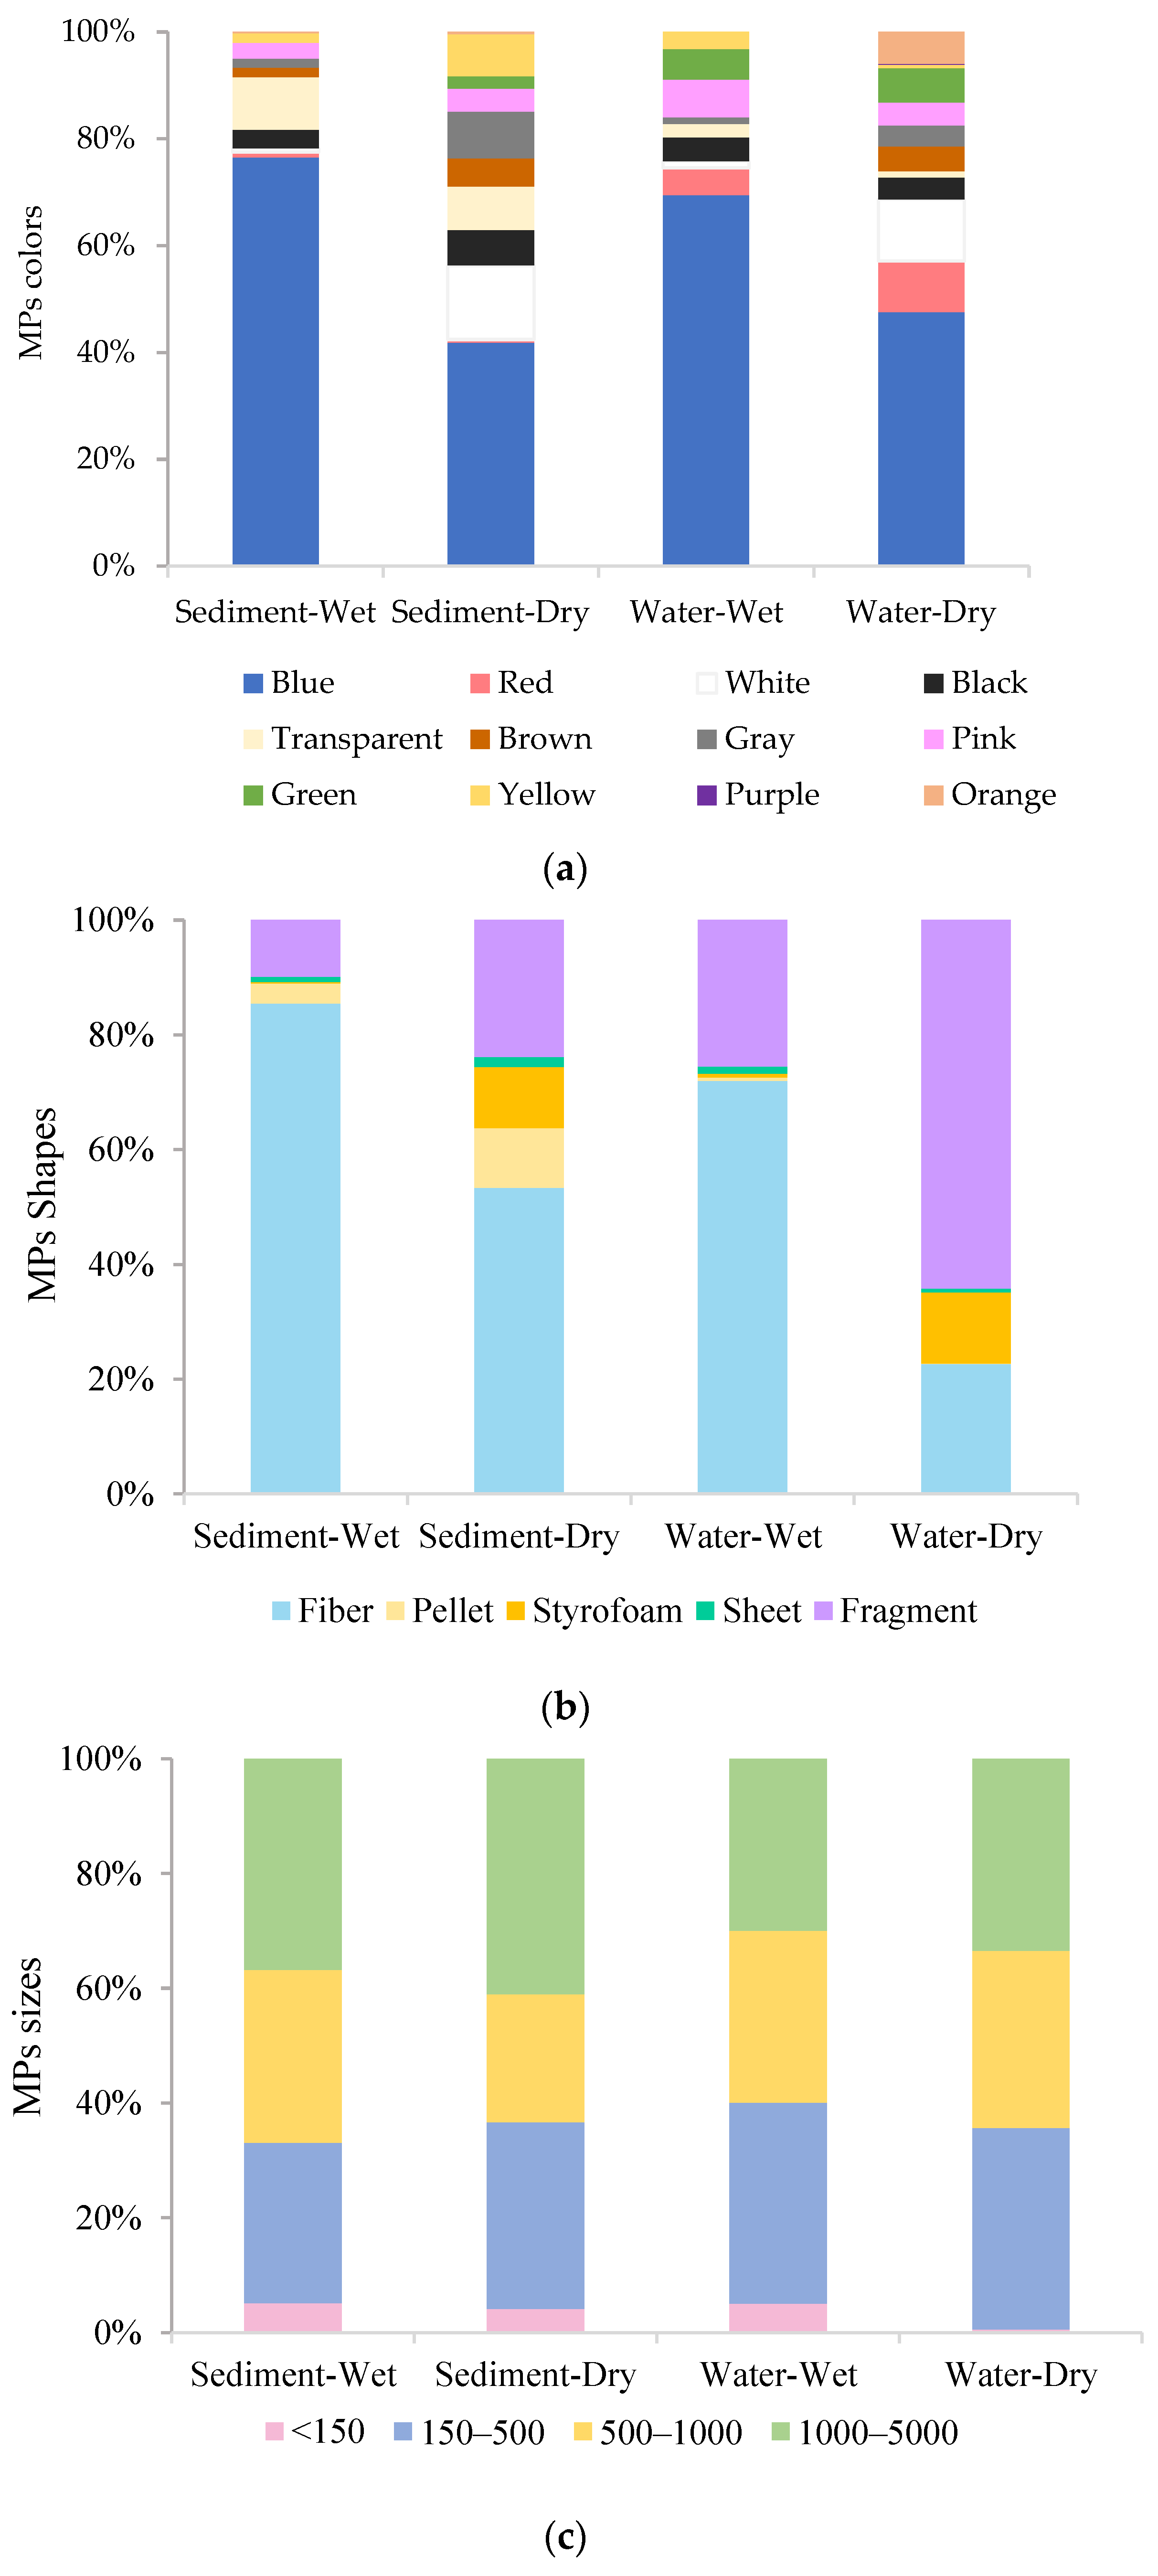
Several microplastic colors were observed; there was a total of 12 colors including basic colors (white, black, blue, green and red) and others, e.g., gray. The water surface during the dry season had the highest color composition (12 colors), while in sediment 10 colors were found (Figure 4a). Microplastic color composition was influenced by concentration, location and water sampling depth [19]. The total number of microplastic colors in the Ubolratana Reservoir was not significantly different among environmental media (water and sediment) (p > 0.05). Dry season samples had more colors than wet season samples (p < 0.01); this is possibly related to microplastic abundance. The dominant color of microplastics was blue (51%) at all sampling sites and seasons, followed by white (10%), red (6%) and others. Previous reports of freshwater environments also observed blue as the most common color of microplastics in the Danjiangkou Reservoir [27], Huangjinxia Reservoir [30] and the Qinhuai River [4]. Fishery activities abound in the Ubolratana Reservoir and blue fishing nets might influence microplastic color abundance [27], while white plastic products used in daily life include plastic bags and food packaging foam [4].
Microplastic shapes were dominated by fragments, fibers and styrofoam (46%, 40% and 10%, respectively). Numerous previous reports also determined fragments and fibers as the main shapes of microplastics in aquatic environments [4,7,8,28,31]. A higher fiber percentage was recorded during the wet season in both environmental media (water 72% and sediment 86%), while only surface water showed a high abundance of fragment shapes (64%) during the dry season (Figure 4b). Higher fiber accumulation was found in sediment than in water during both seasons. This result concurred with the reported results from the Muozhou River [29]; because the surface area of fiber microplastic particles is lower than that of sheet or fragment shapes, more are found deposited in the sediment than suspended in surface water. Fiber microplastics in the reservoir may originate from the breakdown of large plastic fibers used in fishery activities, such as fishing nets and fish cages in aquaculture [20,32], and domestic sewage from laundry [4]. Improperly discarded face masks during the COVID-19 pandemic could also be a new potential source of fiber microplastics in aquatic environments [33,34].
Microplastic samples ranged from 40–4950 μm in size. Small-sized microplastics (<1000 μm) were the most abundant (65%), with the proportions of small-sized microplastics similar between seasons (67% in wet and 63% in dry season) (Figure 4c). The water turbulence of inflow between the two seasons in the Ubolratana Reservoir did not affect the particle size. Microplastics smaller than 500 μm are easily ingested by fish [13]. Microplastic sizes of 300–600 μm were found to be the most abundant in fish intestines from the Han River, South Korea [35], while microplastics smaller than 150 μm can translocate across the digestive system to the lymphatic system of mammals and humans [34].
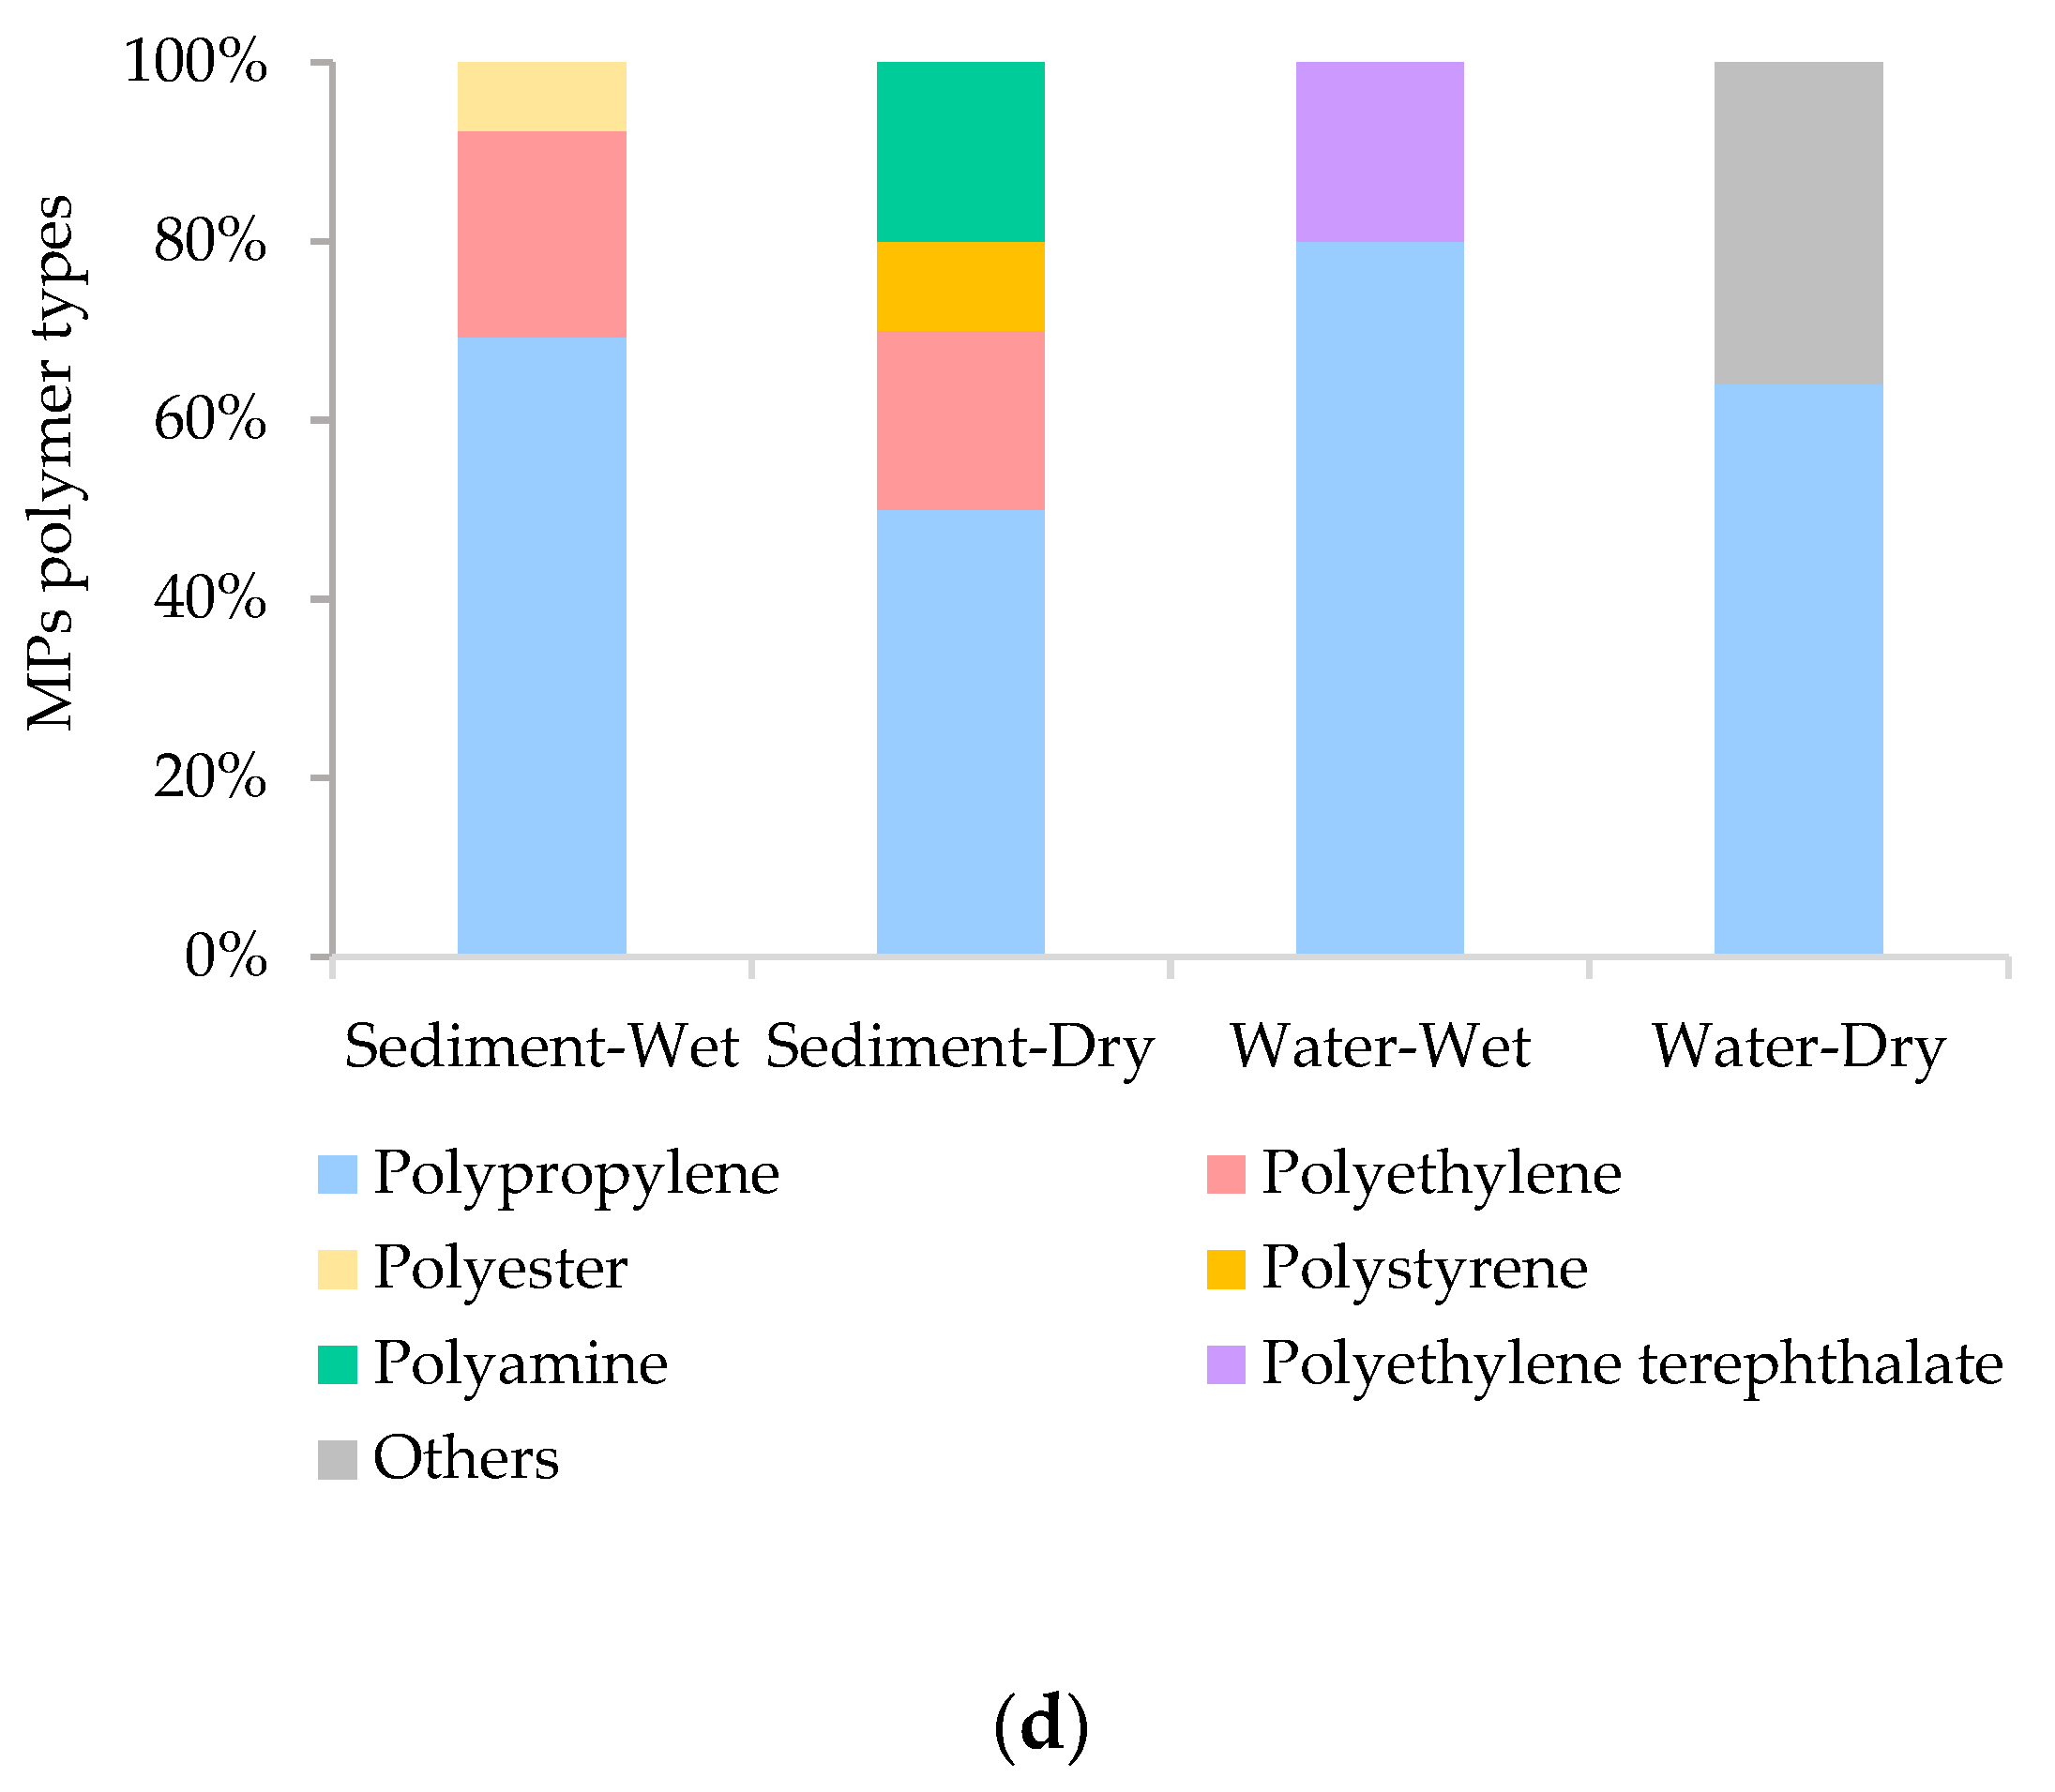
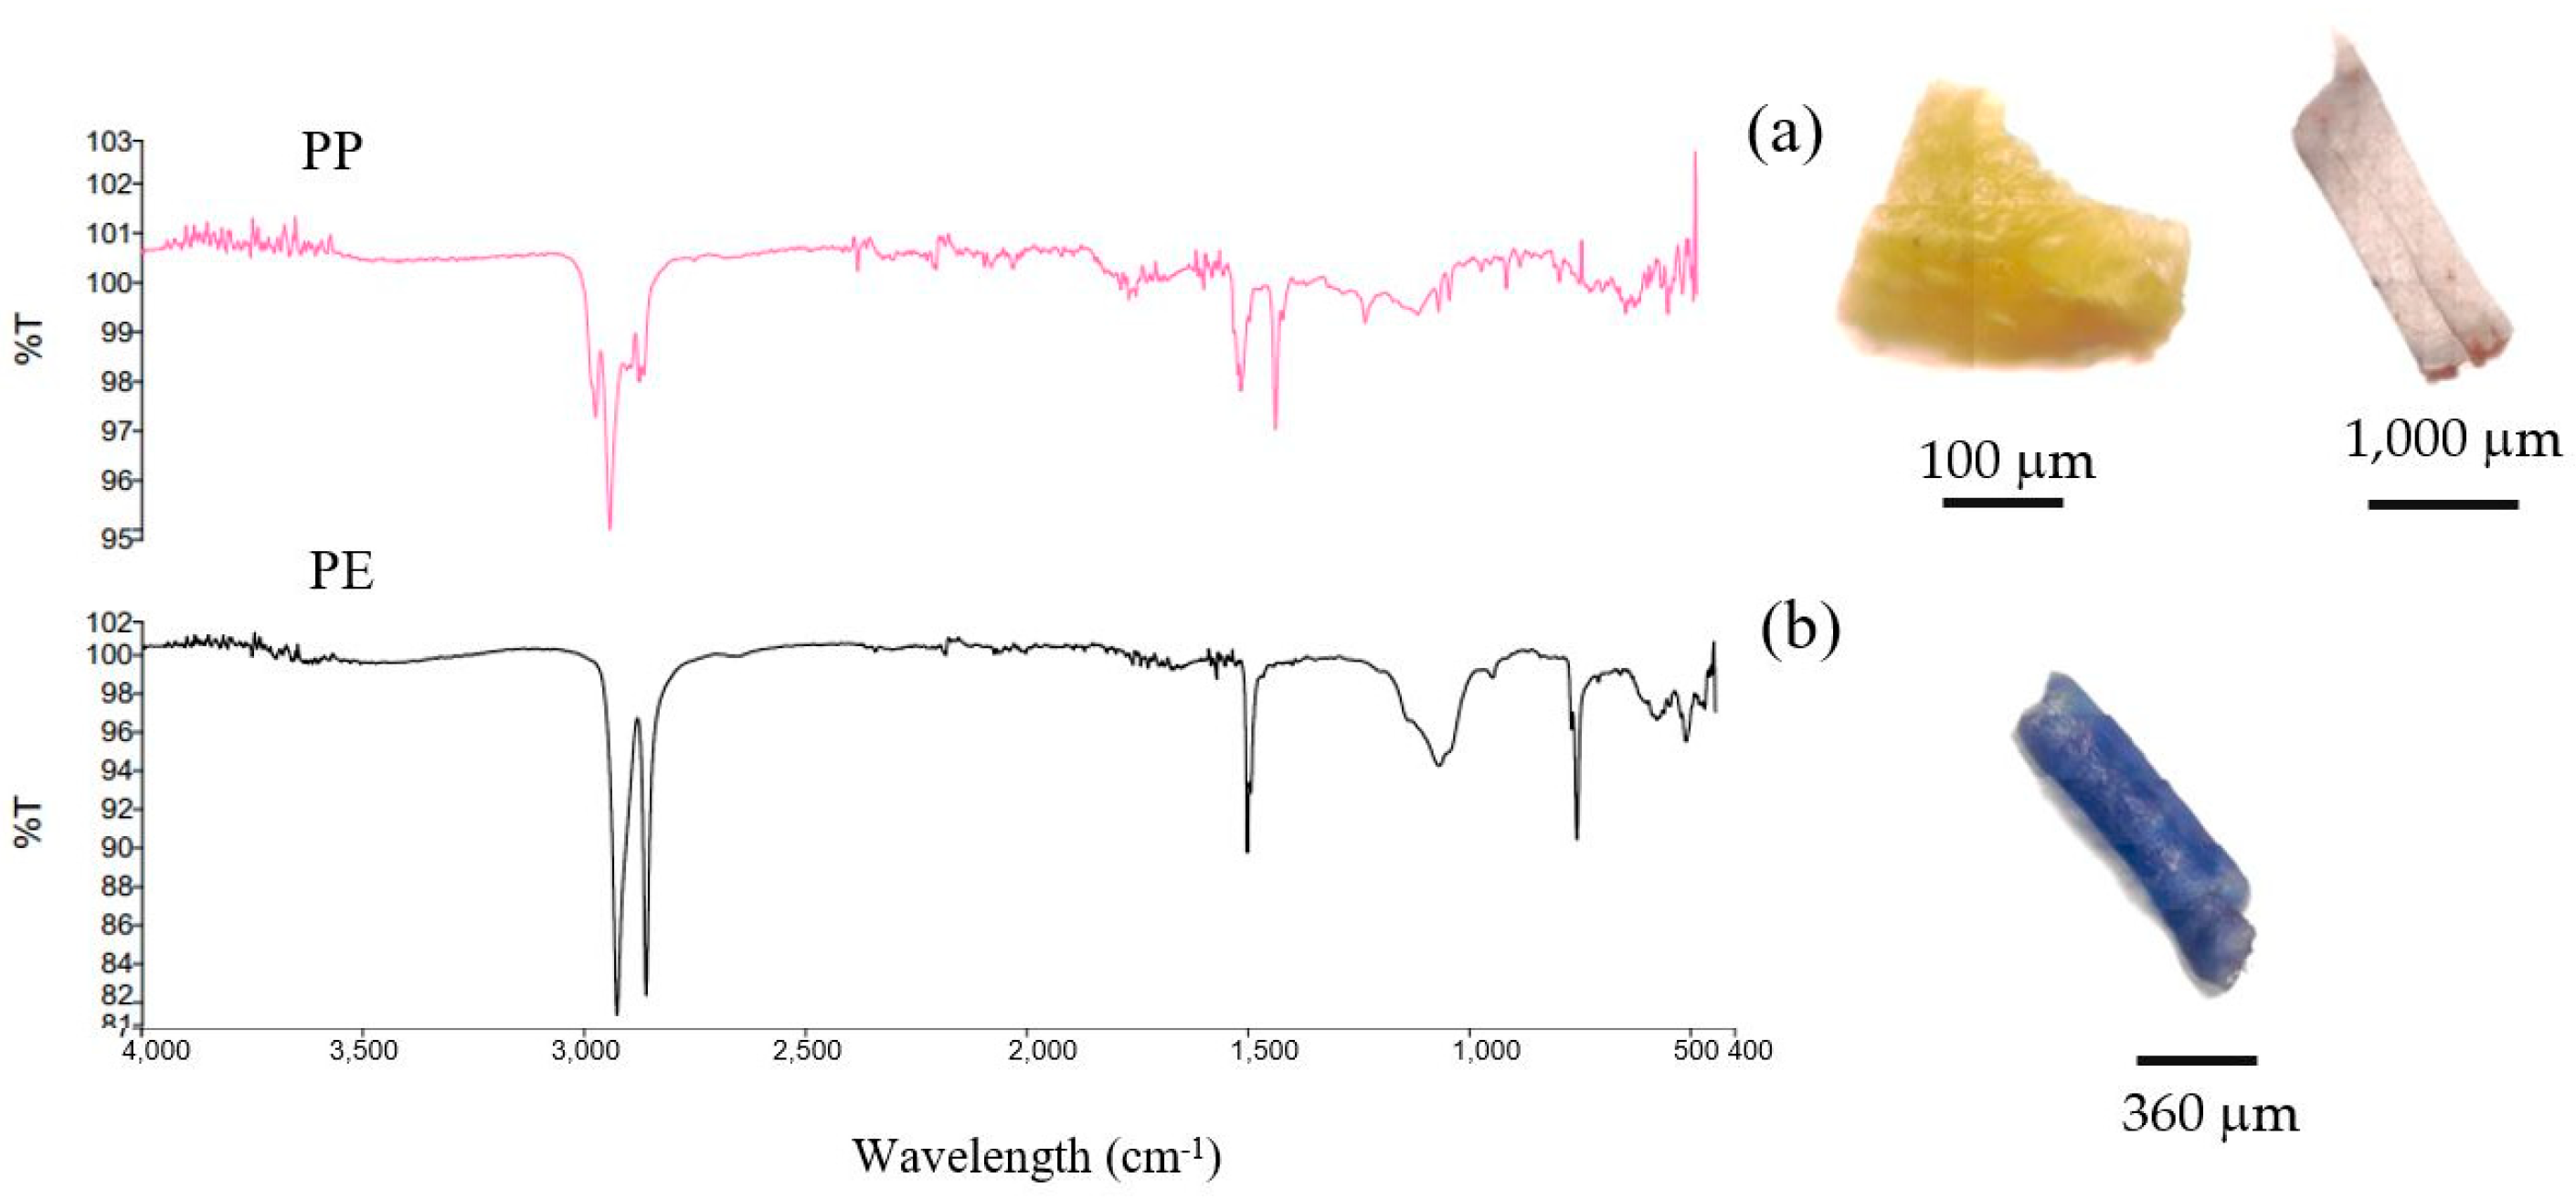
Microplastic polymer types were identified using FTIR and classified into polypropylene (PP), polyethylene (PE) (Figure 5), polystyrene (PS), polyamine (PA), polyethylene terephthalate (PET), polyester and others. Polypropylene was the most common polymer (66% of all particles) in all seasons and environmental media (water and sediment) (Figure 4d). Polypropylene is a nonbiodegradable plastic commonly used for single-use food containers, ropes, bottle caps and fishing gear [36,37], including PP fibers from face masks for COVID-19 prevention [38]. Polypropylene microplastics were mainly present as fragments and fibers, while polyethylene microplastics were only found in sediment samples near agriculture, fishing and tourism activities (MP2, 4, 10, and 12). Secondary microplastics, such as PE polymers, mostly originate from plastic bags, storage containers and agricultural material [4,36]. PE has a low density but the surface area of film particles may induce the colonization of microbial biofilms, causing the microplastics to sink [39].

3.3. Microplastic Pollution Risk Assessment

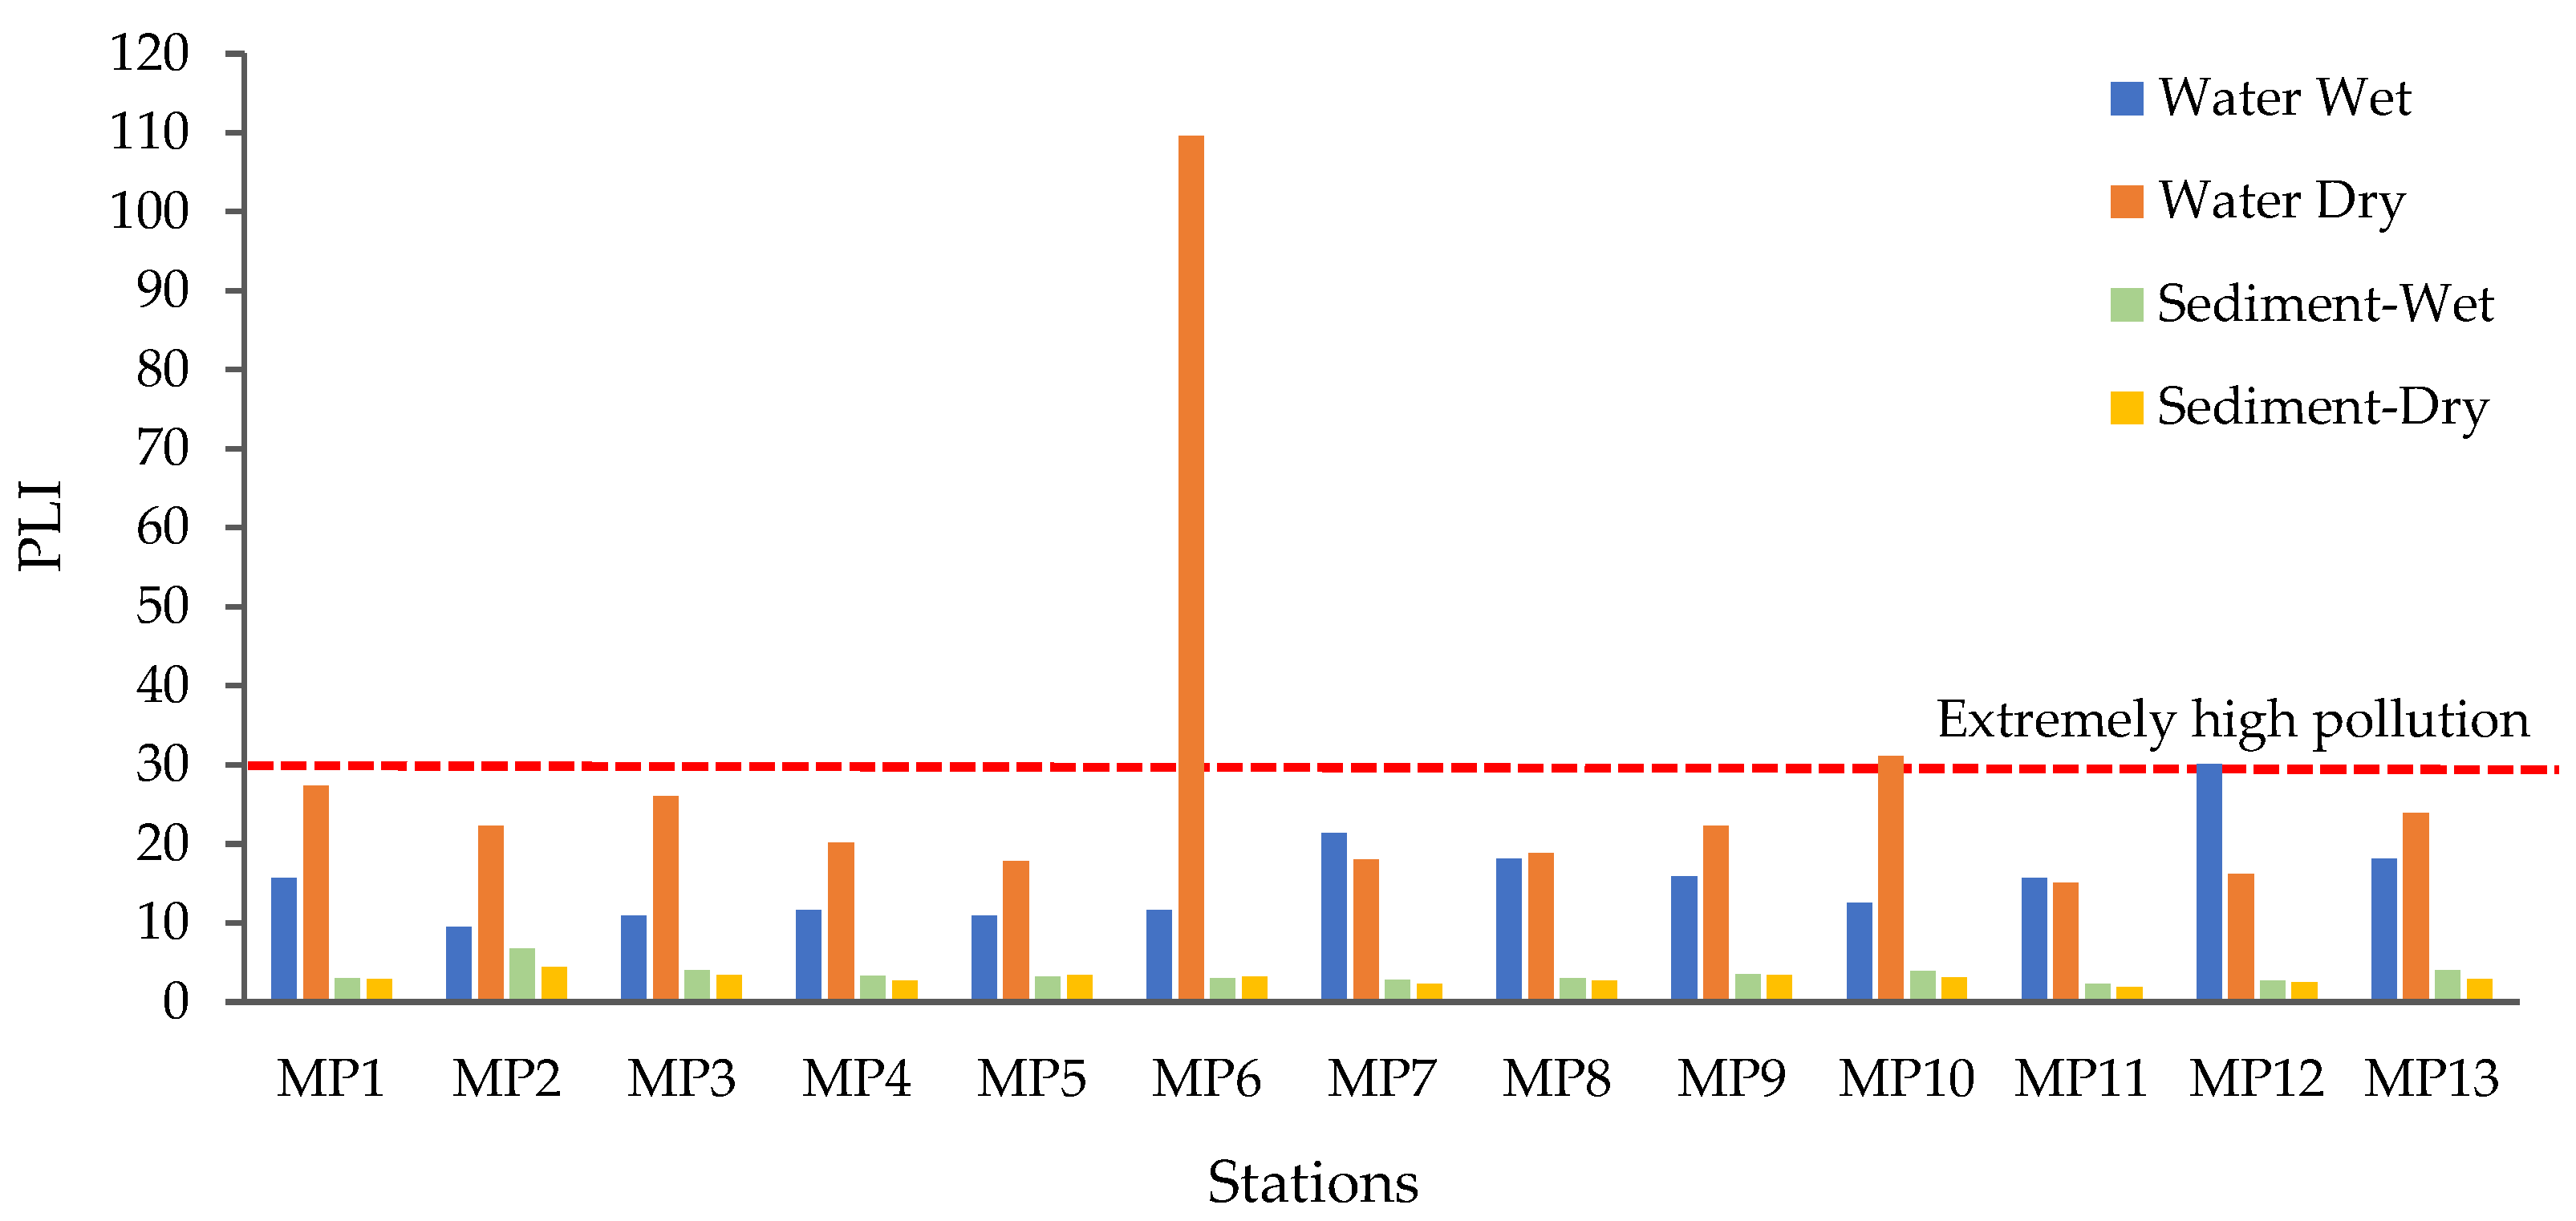
The pollution load index (PLI) was calculated based on microplastic concentration. Variations in the pollution load index in the Ubolratana Reservoir samples were categorized into four levels including low, moderate, high and extremely high pollution (Table 2 and Table S1). The PLI of surface water showed low levels of microplastic pollution at MP2 during the wet season (PLI = 9), while extremely high levels were recorded at MP6 (PLI = 110) and MP10 (PLI = 31) during the dry season (Figure 6). Tourism activity in the areas of MP6 and MP10 impacted microplastic pollution levels. All sediment sampling stations showed low levels of microplastic pollution (PLI < 10). Microplastic risk assessment using PLI was conducted in surface water [8,40,41,42], with few reports in sediment [43]. Microplastic pollution in surface water showed moderate–high levels (PLI = 11–30), while reservoir sediments had low pollution levels (PLI = 2–7). This result was consistent with a previous study that recorded 43% of bottom sediments in other reservoirs worldwide with low levels of microplastic pollution [19]. Microplastic pollution in surface water sampled during the wet season was moderate (PLI = 16), while dry season sampling showed high microplastic pollution (PLI = 28). High pollution levels of microplastics in the reservoir may adversely impact commercial fishing [32].
The polymer hazard index (H) values in the sediment samples were higher than in the surface water samples (Table 2), with a reasonably high polymer hazard score of PE (score 11) [25] in sediment. The pollution load index values in reservoirs were not related to the polymer hazard index [19]. The highest polymer hazard score in the Ubolratana Reservoir was that of polyamine (score 47) (Table S2) found in sediment during the dry season. Polyamine (PA, Nylon) microplastic originates from degraded fishing nets and rope [36], related to anthropogenic activity in the Ubolratana Reservoir.

4. Conclusions

In this study, the spatial–temporal distribution and risk assessment of microplastic pollution was investigated in the Ubolratana Reservoir, which is a region of intensive inland fishing. The spatial distribution of microplastics in the sediment was impacted by anthropogenic activities, while seasonal variation played an important role in the concentration of microplastics in surface water, in terms of dilution by rainwater. The dominant characteristics of the microplastics studied were blue color (51%), fragment shape (46%), smaller size than 1000 μm (65%) and PP polymer type (66%). These microplastic characteristics could indicate that fishing gear, aquaculture equipment and disposable single-use plastics from tourism were major sources of microplastics in the fishing ground reservoir. A pollution load index assessment showed high pollution levels in surface water. The polymer hazard index also showed high pollution with a high hazard score for polymers. This study identified the factors contributing to microplastic pollution in order to develop campaign material and lobby to regulate aquatic environmental degradation. However, further study is required to evaluate the efficiency of microplastic detoxification and residue in aquatic animals, to optimize post-harvest treatments in such a way that microplastic contamination into aquatic commercial species can be reduced.

Supplementary Materials

The following supporting information can be downloaded at: https://www.mdpi.com/article/10.3390/w15020330/s1, Figure S1: Water inflow of the Ubolratana Reservoir from January 2020–January 2021 [22]; Table S1: Risk level criteria for microplastic pollution [13]; Table S2: Polymer hazard score [25].

Author Contributions

Conceptualization, P.K.; methodology, P.K.; software, R.P.; validation, P.K. and W.T.; formal analysis, P.K.; investigation, P.K.; resources, W.T.; data curation, R.P.; writing—original draft preparation, P.K.; writing—review and editing, P.K., W.T. and R.P.; visualization, P.K. and R.P.; supervision, W.T.; project administration, P.K.; funding acquisition, P.K. All authors have read and agreed to the published version of the manuscript.

Funding

This research project was financially supported by Mahasarakham University 2021, grant number 6408077/2564.

Data Availability Statement

Not applicable.

Acknowledgments

Laboratory facilities were provided by the Department of Agricultural Technology (Fisheries), Faculty of Technology, Mahasarakham University. We would like to convey our special thanks to Ekkalak Yotsakun and Natthakritta Feangarwut for assisting with field operations and ensuring project success.

Conflicts of Interest

The authors declare that they have no known competing financial interest or personal relationship that could have appeared to influence the work reported in this paper. The funders had no role in the design of the study; in the collection, analyses, or interpretation of data; in the writing of the manuscript; or in the decision to publish the results.

References

  1. PlasticsEurope. Plastics the fact 2021: Plastics-the fact 2021: An analysis of European plastics production, demand and waste data. Available online: https://plasticseurope.org/knowledge-hub/plastics-the-facts-2021 (accessed on 7 September 2022).
  2. Okoffo, E.D.; Donner, E.; McGrath, S.P.; Tscharke, B.J.; O’Brien, J.W.; O’Brien, S.; Ribero, F.; Burrows, S.D.; Toapanta, T.; Rauert, C.; et al. Plastics in biosolids from 1950 to 2016: A function of global plastic production and consumption. Water Res. 2021, 201, 117367. [Google Scholar] [CrossRef] [PubMed]
  3. Thompson, R.C.; Ylva, O.; Mitchell, R.P.; Anthony, D.; Rowland, S.J.; John, A.W.G.; Daniel, M.G.; Russell, A.E. Lost at sea: Where is all the plastic? Science 2004, 304, 838. [Google Scholar] [CrossRef] [PubMed]
  4. Yan, Z.; Chen, C.; Bao, X.; Zhang, X.; Ling, X.; Lu, G. Microplastic pollution in an urbanized river affected by water diversion: Combining with active biomonitoring. J. Hazard. Mater. 2021, 417, 126058. [Google Scholar] [CrossRef] [PubMed]
  5. Lin, Z.; Jin, T.; Zou, T.; Xu, L.; Xi, B.; Xu, D.; He, J.; Xiong, L.; Tang, C.; Peng, J.; et al. Current progress on plastic/microplastic degradation: Fact influences and mechanism. Environ. Pollut. 2022, 304, 119159. [Google Scholar] [CrossRef] [PubMed]
  6. Horton, A.A.; Walton, A.; Spurgeon, D.J.; Lahive, E.; Svendsen, C. Microplastics in freshwater and terrestrial environments: Evaluating the current understanding to identify the knowledge gaps and future. Sci. Total Environ. 2017, 586, 127–141. [Google Scholar] [CrossRef] [PubMed] [Green Version]
  7. Wu, J.; Jiang, Z.; Liu, Y.; Zhao, X.; Liang, Y.; Lu, W.; Song, J. Microplastic contamination assessment in water and economic fishes in different trophic guilds from an urban water supply reservoir after flooding. J. Environ. Manage. 2021, 299, 113667. [Google Scholar] [CrossRef] [PubMed]
  8. Xu, D.; Gao, B.; Wan, X.; Peng, W.; Zhang, B. Influence of catastrophic flood on microplastics organization in surface water of the Three Gorges Reservoir, China. Water Res. 2022, 211, 118018. [Google Scholar] [CrossRef] [PubMed]
  9. Sun, Y.; Cao, L.; Wang, Y.; Chen, W.; Li, Y.; Zhao, X. Sources and distribution of microplastics in the east China sea under a three-dimensional numerical modelling. Environ. Pollut. 2022, 311, 119910. [Google Scholar] [CrossRef]
  10. Taha, Z.D.; Amin, R.M.; Anuar, S.T.; Nasser, A.A.A.; Sohaimi, E.S. Microplastics in seawater and zooplankton: A case study from Terengganu estuary and offshore waters, Malaysia. Sci. Total Environ. 2021, 786, 147466. [Google Scholar] [CrossRef]
  11. Yasaka, S.; Pitaksanurat, S.; Laohasiriwong, W.; Neeratanaphan, L.; Jungoth, R.; Donprajum, T.; Taweetanawanit, P. Bioaccumulation of microplastics in fish and snails in the Nam Pong River, Khon Kaen, Thailand. EnvironmentAsia 2022, 15, 81–93. [Google Scholar]
  12. Kasamesiri, P.; Thaimuangphol, W. Microplastics ingestion by freshwater fish in the Chi River, Thailand. Int. J. GEOMATE 2020, 18, 114–119. [Google Scholar] [CrossRef]
  13. Wang, S.; Zhang, C.; Pan, Z.; Sun, D.; Zhou, A.; Xie, S.; Wang, J.; Zou, J. Microplastics in wild freshwater fish of different feeding habits from Beijiang and Pearl River Delta regions south China. Chemosphere 2020, 258, 127345. [Google Scholar] [CrossRef]
  14. Bertoli, M.; Pastorino, P.; Lesa, D.; Renzi, M.; Anselmi, S.; Prearo, M.; Pizzul, E. Microplastics accumulation in functional feeding guilds and functional habit groups of freshwater macrobenthic invertebrates: Novel insights in a riverine ecosystem. Sci. Total Environ. 2022, 804, 150207. [Google Scholar] [CrossRef] [PubMed]
  15. Li, W.; Chen, X.; Li, M.; Cai, Z.; Gong, H.; Yan, M. Microplastics as an aquatic pollution affect gut microbiota with aquatic animals. J. Hazard. Mater. 2022, 423, 127094. [Google Scholar] [CrossRef] [PubMed]
  16. Revel, M.; Chatel, A.; Mouneyrac, C. Micro(nano)plastics: A threat to human health? Curr. Opin. Environ. Sci. 2018, 1, 17–23. [Google Scholar] [CrossRef]
  17. Elizalde-Velazquez, G.A.; Gomez-Olivan, L.M. Microplastics in aquatic environments: A review on occurrence, distribution, toxic effects, and implications for human health. Sci. Total Environ. 2021, 780, 146551. [Google Scholar] [CrossRef]
  18. Kumar, A.; Upadhyay, P.; Prajapati, S.K. Impact of microplastics on riverine greenhouse gas emissions: A view point. Environ. Sci. Pollut. Res. 2022. [Google Scholar] [CrossRef]
  19. Guo, Z.; Boeing, W.J.; Xu, Y.; Borgomeo, E.; Mason, S.A.; Zhu, Y.G. Global meta-analysis of microplastic contamination in reservoirs with a novel framework. Water Res. 2021, 207, 117828. [Google Scholar] [CrossRef]
  20. Mao, R.; Hu, Y.; Zhang, S.; Wu, R.; Guo, X. Microplastics in the surface water of Wuliangsuhai Lake, Northern China. Sci. Total Environ. 2020, 723, 137820. [Google Scholar] [CrossRef]
  21. Department of Fisheries. Statistics of the Freshwater Animals Captured from Natural Sources in 2020. Available online: https://www4.fisheries.go.th/doffile/fkey/ref84142 (accessed on 13 January 2022).
  22. Chaleeraktrakoon, C.; Chinsomboon, Y. Dynamic rule curves for flood control of a multipurpose dam. J. Hydro-Environ. Res. 2015, 9, 133–144. [Google Scholar] [CrossRef]
  23. Thaiwater. Available online: https://tiwrm.hii.or.th (accessed on 13 January 2022).
  24. Tomlinson, D.L.; Wilson, J.G.; Harris, C.R.; Jeffrey, D.W. Problems in the assessment of heavy-metal levels in estuaries and the formation of a pollution index. Helgol. Meeresum 1980, 33, 566–575. [Google Scholar] [CrossRef]
  25. Lithner, D.; Larsson, A.; Dave, G. Environmental and health hazard ranking and assessment of plastic polymers based on chemical composition. Sci. Total Environ. 2011, 409, 3309–3324. [Google Scholar] [CrossRef]
  26. Di, M.; Wang, J. Microplastics in surface waters and sediments of the Three Gorges Reservoir, China. Sci. Total Environ. 2018, 616–617, 1620–1627. [Google Scholar] [CrossRef] [PubMed]
  27. Di, M.; Liu, X.; Wang, W.; Wang, J. Pollution in drinking water source area: Microplastics in the Danjiangkou Reservoir, China. Environ. Toxicol. Pharmacol. 2019, 65, 82–89. [Google Scholar] [CrossRef] [PubMed]
  28. Lin, L.; Pan, X.; Zhang, S.; Li, D.; Zhai, W.; Wang, Z.; Tao, J.; Mi, C.; Li, Q.; Crittenden, J.C. Distribution and source of microplastics in China’s second largest reservoir-Danjiangkou Reservoir. J. Environ. Sci. 2021, 102, 74–84. [Google Scholar] [CrossRef] [PubMed]
  29. Wu, P.; Tang, Y.; Dang, M.; Wang, S.; Jin, H.; Liu, Y.; Jing, H.; Zheng, C.; Yi, S.; Cai, Z. Spatial-temporal distribution of microplastics in surface water and sediments of Maozhou River within Guangong-Hong Kong-Macao Greater Bay Area. Sci. total Environ. 2020, 717, 135187. [Google Scholar] [CrossRef] [PubMed]
  30. Li, C.; Gan, Y.; Dong, J.; Fang, J.; Chen, H.; Quan, Q.; Liu, J. Impact of microplastics on microbial community in sediments of the Huangjinxia Reservoir-water source of a water diversion project in Western China. Chemosphere 2020, 253, 126740. [Google Scholar] [CrossRef]
  31. Jian, M.; Zhang, Y.; Yang, W.; Zhou, L.; Lui, S.; Xu, E.G. Occurrence and distribution of microplastics in China’s largest freshwater lake system. Chemosphere 2020, 261, 128186. [Google Scholar] [CrossRef]
  32. Kasamesiri, P.; Meksumpun, C.; Meksumpun, S.; Ruengsorn, C. Assessment on microplastics contamination in freshwater fish: A case study of the Ubolratana Reservoir, Thailand. Int. J. GEOMATE 2021, 20, 62–68. [Google Scholar] [CrossRef]
  33. Saliu, F.; Veronelli, M.; Raguso, C.; Barana, D.; Galli, P. The release process of microfibers: From surgical face masks into the marine environment. Environ. Adv. 2021, 4, 100042. [Google Scholar] [CrossRef]
  34. Ray, S.S.; Lee, H.K.; Huyen, D.T.T.; Chen, S.S.; Kwon, Y.N. Microplastics waste in environment: A perspective on recycling issues from PPE kits and face masks during the COVID-19 pandemic. Environ. Technol. Innov. 2022, 26, 102290. [Google Scholar] [CrossRef] [PubMed]
  35. Park, T.J.; Lee, S.H.; Lee, M.S.; Lee, J.K.; Lee, S.H.; Zoh, K.D. Occurrence of microplastics in the Han River and riverine fish in South Korea. Sci. Total Environ. 2020, 708, 134535. [Google Scholar] [CrossRef] [PubMed]
  36. Lusher, A.; Hollman, P.; Mendoza-Hill, J. Microplastics in Fisheries and Aquaculture: Status of Knowledge on Their Occurrence and Implications for Aquatic Organisms and Food Safety; FAO Fisheries and Aquaculture Technical Paper 615; FAO: Roma, Italy, 2017; 126p.
  37. Singh, R.; Kumar, N.; Mehrotra, T.; Bisaria, K.; Sinha, S. Environmental hazards and biodegradation of plastic waste: Challenges and future prospects. In Bioremediation for Environmental Sustainability: Toxicity, Mechanisms of Contaminants Degradation, Detoxification and Challenges; Saxena, G., Kumer, V., Shah, M.P., Eds.; Elsevier Inc.: New York, NY, USA, 2020; pp. 193–214. [Google Scholar] [CrossRef]
  38. Fadare, O.O.; Okoffo, E.D. COVID-19 face masks: A potential source of microplastic fibers in the environment. Sci. Total Environ. 2020, 737, 140279. [Google Scholar] [CrossRef] [PubMed]
  39. Leiser, R.; Wu, G.M.; Neu, T.R.; Wedt-Potthoff, K. Biofouling, metal sorption and aggregation are related to sinking of microplastics in a stratified reservoir. Water Res. 2020, 176, 115748. [Google Scholar] [CrossRef]
  40. Xu, P.; Peng, G.; Su, L.; Gao, Y.; Gao, L.; Li, D. Microplastic risk assessment in surface waters: A case study in the Changjiang Estuary, China. Mar. Pollut. Bull. 2018, 133, 647–654. [Google Scholar] [CrossRef] [PubMed]
  41. Pico, Y.; Soursou, V.; Alfarhan, A.H.; El-Sheikh, M.A.; Barcelo, D. First evidence of microplastics occurrence in mixed surface and treated wastewater from two major Saudi Arabian cities and assessment of their ecological risk. J. Hazard. Mater. 2021, 416, 125747. [Google Scholar] [CrossRef] [PubMed]
  42. Bian, P.; Liu, Y.; Zhao, K.; Hu, Y.; Zhang, J.; Kang, L.; Shen, W. Sptial variability of microplastic pollution on surface of rivers in a mountain-plain transitional area: A case study in the Chin Ling-Wei River Plain, China. Ecotoxicol. Environ. Saf. 2022, 232, 113298. [Google Scholar] [CrossRef]
  43. Ranjani, M.; Veerasingam, S.; Venkatachalapathy, R.; Mugilarasan, M.; Bagaev, A.; Mukhanov, V.; Vethamony, P. Assessment of potential ecological risk of microplastics in the coastal sediments of India: A meta-analysis. Mar. Pollut. Bull. 2021, 163, 111969. [Google Scholar] [CrossRef]
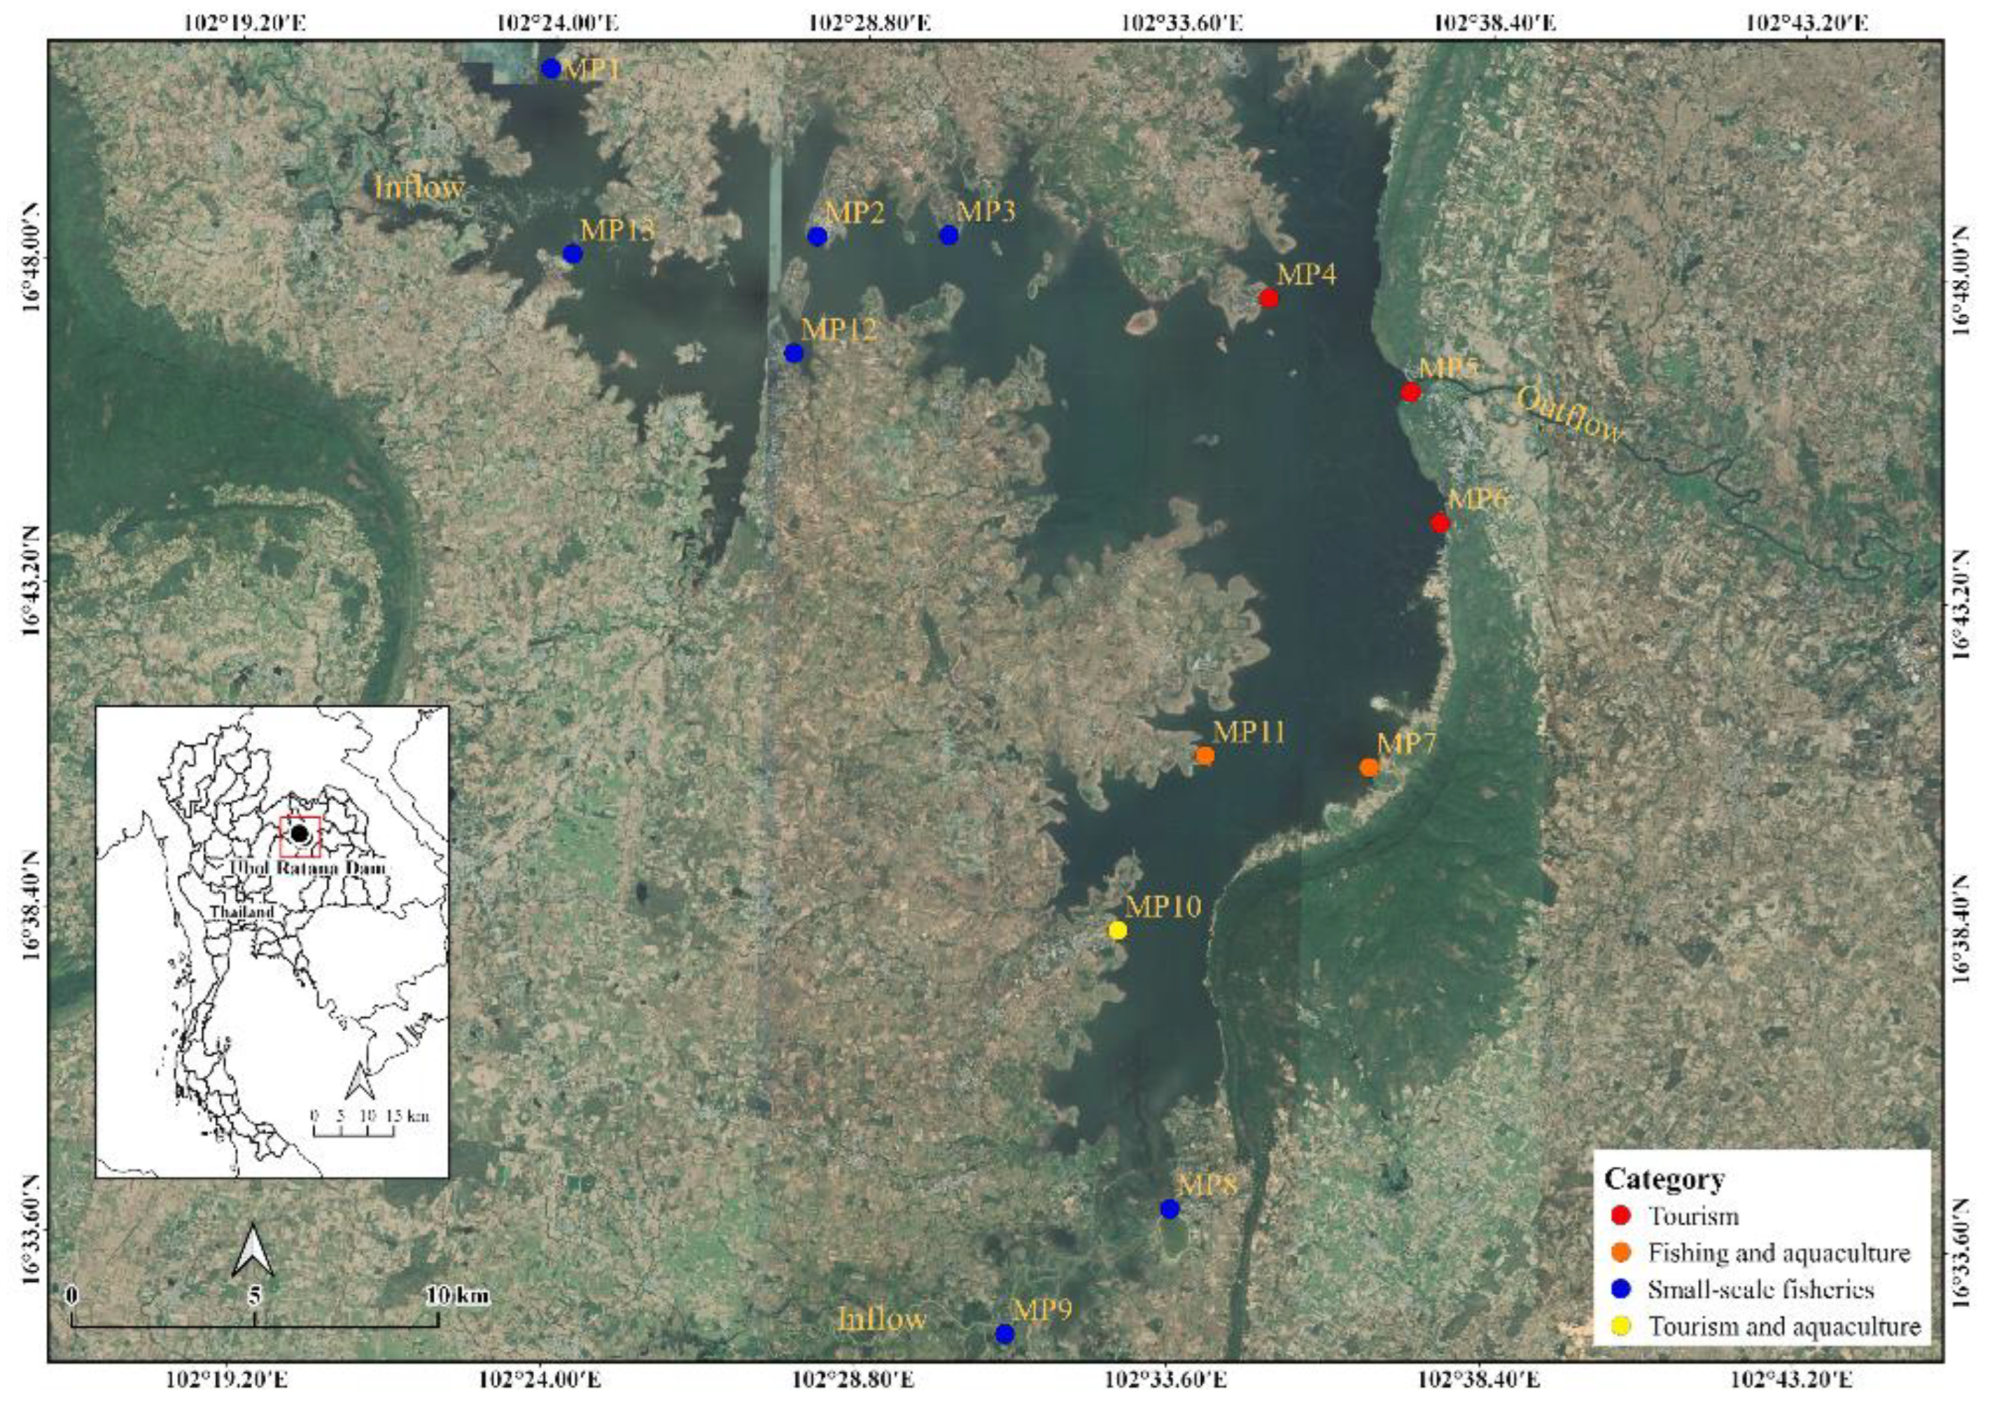
Figure 1. Surface water and sediment sampling sites in the Ubolratana Reservoir, Thailand.
Water 15 00330 g001
Figure 2. Spatial distribution of microplastics in (a) surface water (particles/m3) during the wet season, (b) dry season, and in (c) sediment (particles/kg) during the wet season, and (d) dry season, of the Ubolratana Reservoir.
Water 15 00330 g002
Figure 3. Box plot of microplastic abundance (sediment data were transformed to log(10) and surface water transformed to log(X + 1)) from 4 anthropogenic activities (F: fishing; FA: fishing and aquaculture; T: tourism; TA: tourism and aquaculture) and 3 regions (lower, middle and upper regions) in the Ubolratana Reservoir; (a,b) microplastic abundance in sediment and (c,d) in surface water.
Water 15 00330 g003
Figure 4. Microplastics’ morphological characteristics: (a) color, (b) shape, (c) size (μm) and (d) polymer type.
Water 15 00330 g004aWater 15 00330 g004b
Figure 5. Microplastic fragment polymer types analyzed using FTIR spectra; (a) polypropylene (PP), (b) polyethylene (PE).
Water 15 00330 g005
Figure 6. Microplastic pollution load index of surface water and sediment during wet and dry seasons.
Water 15 00330 g006
Table 1. Previous studies detailing microplastic abundance in reservoirs.
Sample LocationEnvironmental MediaAbundance RangeReference
Dafangying Reservoir, ChinaWater8800–32,050 particles/m3[7]
Three Gorges Reservoir, ChinaWater974–21,132 particles/m3[8]
Wuliangsuhai Lake, MongoliaWater3120–11,250 particles/m3[20]
Three Gorges Reservoir, ChinaWater1597–12,611 particles/m3[26]
Sediment25–300 particles/kg
Danjiangkou Reservoir, ChinaWater467–15,017 particles/m3[27]
Sediment15–40 particles/kg
Danjiangkou Reservoir, ChinaWater530–24,798 particles/m3[28]
Sediment708–3237 particles/kg
Ubolratana Reservoir, ThailandWater25–3363 particles/m3This study
Sediment6–81 particles/kg
Table 2. Risk level criteria of microplastics in the reservoir during wet and dry seasons.
Polymer Hazard IndexRisk Level CriteriaPLIRisk Level Criteria
Sediment-Wet322III3I
Sediment-Dry1510IV3I
Water-Wet160III16II
Water-Dry64II28III
Disclaimer/Publisher’s Note: The statements, opinions and data contained in all publications are solely those of the individual author(s) and contributor(s) and not of MDPI and/or the editor(s). MDPI and/or the editor(s) disclaim responsibility for any injury to people or property resulting from any ideas, methods, instructions or products referred to in the content.