Article

Simulation Study on the Environmental Impact of Rare Earth Ore Development on Groundwater in Hilly Areas: A Case Study in Nuodong, China

1
Guangxi Key Laboratory of Environmental Pollution Control Theory and Technology, Guilin University of Technology, Guilin 541004, China
2
Collaborative Innovation Center of Water Pollution Control and Water Security in Karst Area, Guilin University of Technology, Guilin 541004, China
3
Geological Team, Guangxi Bureau of Geology & Mineral Prospecting and Exploitation, Nanning 536000, China
4
College of Earth Sciences, Guilin University of Technology, Guilin 541004, China
*
Authors to whom correspondence should be addressed.
Water 2023, 15(2), 263; https://doi.org/10.3390/w15020263
Submission received: 16 November 2022 / Revised: 2 January 2023 / Accepted: 4 January 2023 / Published: 8 January 2023
(This article belongs to the Section Hydrogeology)

Abstract

:
Mineral extraction can significantly affect the groundwater flow and hydrochemical environment. However, for hilly areas, significant ground elevation changes and complex geological conditions make it difficult to accurately analyze and predict the impact of mineral mining. This study takes the Nuodong rare earth mining area as an example. Based on field investigations and experiments, GOCAD software (version 2022) was used to establish a geological model in combination with GMS numerical simulation software, which was used to build a groundwater flow model and a solute transport model. The flow model in the hilly area indicated that the absolute error between the simulated and measured water levels of each observation well is 0.554 m. The solute-transport model showed that the maximum pollutant concentration of ammonia-nitrogen (NH3-N) in the liquid injection area, stream area, and village area monitoring wells reaches 139.15, 27.9, and <0.5 mg/L, respectively. During the mining period, streams in the area are affected by NH3-N, which threatens the safety of the water for mine area residents. To control pollutant transport, two stages of pumping were adopted to reduce NH3-N concentrations in groundwater. After adopting the first stage, the peak concentration of the stream area monitoring wells decreased significantly, with the maximum peak concentration decreasing from 27.9 mg/L to 5.51 mg/L. Based on the results of the first stage of the pump-out treatment, a second stage was adopted. The model results showed that the peak concentration of NH3-N pollutants discharged into the stream is less than 0.5 mg/L. The results provide a theoretical basis and reference for groundwater monitoring and pollution control after mining in this area.

1. Introduction

With the rapid development in science, technology, economics, and society, the demand for rare earth elements (REEs) has dramatically increased, and their specific applications have caused them to become a global essential strategic resource [1,2]. Chinese deposits account for 80% of the total global REE reserves and have a wide distribution in southern China [3]. The continuous mining of REEs in recent years has led to serious environmental pollution problems, mainly related to the mining process, the most common being in situ leaching. Specifically, through the longitudinal injection holes, ammonium sulfate ((NH4)2SO4) solution is injected into the mining body. After that, the rare earth ions can be eluted into a leaching solution through an ion-exchange reaction. Finally, the leaching solution is collected by a ditch or tunnel in the mining area [4,5,6]. In this process, it is impossible for the collection system to completely collect the injected leaching agent. Generally, REE mines in the lower part of the collection system are not equipped with effective anti-seepage measures. Therefore, the uncollected leachate continues to seep down and contaminates the groundwater, resulting in an unparalleled risk to the environment [7]. For example, Zhu et al. [8] have found that rare earth mining areas had a relatively serious leachate loss and this has caused the REE and ammonia-nitrogen content downstream from the mining site to exceed the standard values. For example, the ammonia-nitrogen concentration can reach approximately 100 mg/L. Wu et al. [9] have found that the levels of the ammonia-nitrogen in surface water and groundwater of ion-adsorbed rare earth mining areas in Longnan County, Ganzhou City, exceeded the limits of the Class V standard in the Surface Water Environmental Quality Standard (GB/3838-2002) and Groundwater Environmental Quality Standard (GB/T 14848-93) by between 10 and several hundred times. Meanwhile, regular ammonia isotope monitoring shows that ammonia-nitrogen pollution mainly originates from ammonia-containing leaching agents.
Ammonia-nitrogen pollution in groundwater caused by REE mining is becoming increasingly serious due to inappropriate mining methods [10]. Therefore, many researchers have tried to intensify the leaching process of rare earth [11] and develop methods to prevent and control ammonia-nitrogen pollution caused by rare earth mining [12]. Gong et al. [13] proposed the use of a modified soil-bentonite barrier for ammonia-nitrogen pollution control in ion-adsorbed rare earth mining areas and studied its barrier benefits. Xiao et al. [14] explored the use of magnesium sulfate as a leaching agent instead of (NH4)2SO4 to solve the problem of ammonia-nitrogen pollution. Yan et al. [15] described that the use of a compound leaching agent composed of QZX-02 and (NH4)2SO4 can alleviate the ammonia pollution generated during the mining process. The previous studies mainly focused on the investigation of mine pollution, the harmlessness of leaching solutions, and the improvement of the leaching process. However, analyses and predictions of the migration patterns in the rare earth mining process are relatively scarce.
Currently, analytical and numerical methods are the primary approaches for studying contaminant transport in groundwater [16,17,18]. Among them, numerical methods are more effective and intuitive than analytical methods in simulating contaminant transport under complex geological conditions. A commonly used numerical simulation software is Modflow, which was developed by the US Geological Survey (USGS) in the 1980s [19]. There are a large number of successful case studies using Modflow for pollutant transport simulation of a chemical plant. For example, Shen [20] used this software to simulate the contaminant transport pattern of groundwater at a chemical plant in Shanghai. Liu et al. [16] used the Groundwater Modeling System (GMS) software to study the contaminant transport pattern in groundwater after the “8–12” explosion in Tianjin Port. Li et al. [21] used the software to simulate and predict groundwater contamination in a typical region of the Hunhe River alluvial fan. However, for hilly areas, the recharge and runoff of groundwater systems become very complex and variable because of their large variations in ground elevation (relative elevation differences are sometimes above 200 m) and higher hydraulic gradients under different combinations of geomorphic units, such as washes, river valleys, and equatorial ridges [22]. A simple portrayal of submerged aquifers often results in simulations that differ significantly from the actual results [23]. To address this problem, geological objects’ computer-aided design (GOCAD) software can be introduced for geological modeling and coupled with the groundwater flow models. For example, Woloszyn et al. [24] have built a three-dimensional (3D) geological model of the Berzdorf–Radomierzyce basin on the Polish–German border and used it as a basis for importing groundwater simulation software to investigate groundwater flow and contaminant flow in Miocene and Quaternary aquifer systems. Zhu et al. [22] have applied GOCAD software to the construction of a 3D geological model in conjunction with the numerical groundwater simulation software FEFLOW to quantify the release flux of nuclides to the marine environment through the groundwater pathway under an offshore nuclear power plant drainage line leakage scenario. Ross et al. [25] and Watson et al. [26] have proposed importing the GOCAD geological model in ASCII or TIN formats into the GMS. The above studies have shown the feasibility of converting 3D geological models to 3D water flow models.
In this study, the research focus is the shallow groundwater of Nuodong rare earth ores, and the mining borehole data and hydrogeological parameters obtained by field investigation, pumping tests, and water injection tests are analyzed based on the geological and hydrogeological characteristics of the research area. First, a 3D geological model is established using GOCAD to extract the top and bottom plate data of each layer in the geological model, and then a groundwater flow model is established using GMS software. A solute-transport model is established to quantitatively analyze and predict the groundwater pollution status and pollutant migration patterns during the mineral extraction process in the study area.

2. Study Area

The study area, with an area of approximately 14.6 km2, is located in Cenxi, Wuzhou City, in the southeast of Guangxi (between latitudes 23°2′24′’ and 23°4′46′’ N and longitudes 110°59′3′′ and 111°2′20′′ E). The No. 5-1 ore body (mining area) is located in the middle of the study area. The study area has a subtropical monsoon climate with a mean annual precipitation of 1466.7 mm, with the majority of rainfall occurring in the summer months (May to September), and a mean annual evaporation of 1085.2 mm. The area consists of a combination of different geomorphic units, such as gullies, valleys, and ridges, with large undulating terrain. The mountains roughly cover the northwest area, the peak elevation is 200–360 m and the gully is vertical with a cutting depth of 130–220 m. Surface water bodies are developed in the area, among which are the Nuodong River, which flows through the mine area from east to west with the widest riverbed measuring up to 50 m, and two larger surface water bodies with a measured flow rate of 30 L/s. Other streams are smaller, mainly originating in the area, and are developed in a southeast-northwest direction (Figure 1).

3. Model Construction

3.1. Geological Model

To reasonably generalize the hydrogeological conditions of the hilly mountainous area, while scientifically and accurately portraying its groundwater flow characteristics, this study uses GOCAD to establish a 3D geological model based on the analysis of the geological structure and lithology of the study area to realize the pre-processing of its stratigraphy. The modeling process is illustrated in Figure 2.
  • The 1:5000 hydrogeological map contours (contour line spacing of 5 m) are extracted using MapGIS software (version 6.7) and integrated into GOCAD as the model surface elevation (Figure 2a);
  • A borehole database is established using 742 geological boreholes in the study area, and the thickness of each rock layer in the model is constrained based on the stratigraphic markers corresponding to the boreholes (Figure 2b);
  • The borehole and ground elevation data is corrected to ensure that the borehole elevation closely follows the topographic surface prevents errors from different data sources. In the case of the groundwater model, water levels of the observation wells, evaporation, and rainfall infiltration are closely related to the surface elevation (Figure 2c);
  • A stratigraphic geological model is constructed using the structural and stratigraphic workflow of GOCAD. To ensure more accurate and intuitive simulation results of groundwater flow and contaminant transport according to different permeability properties, the order of stratum is divided into the following strata from top to bottom: quaternary alluvium, strongly weathered granite, partly weathered granite, and bedrock (Figure 2d). Specifically, the quaternary is mainly distributed in the low-lying areas in front of the mountains on both sides of the river valley. Weathered granite is dominated by fracture water of the weathering zone network state, which is widely distributed, and mining injection holes fall on top of this aquifer.
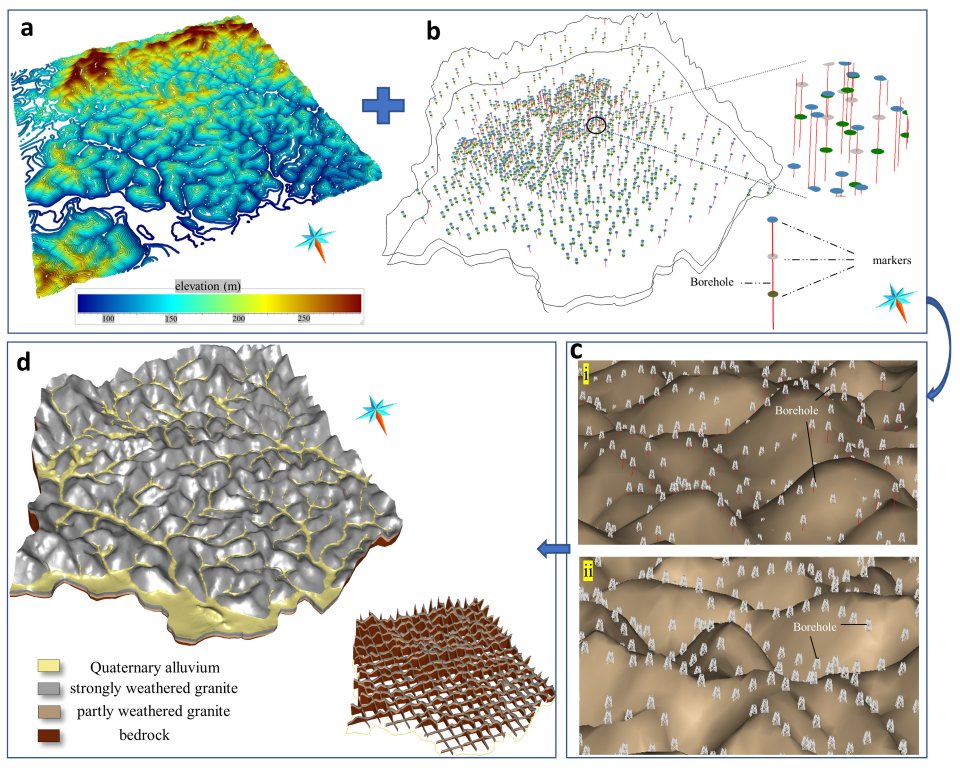
Figure 2. Geological model modeling process. (a) 1:5000 hydrogeological map contours. (b) 3D view of the study area borehole data. (c) Comparison of borehole and ground elevation before and after correction, where (i) is before correction and (ii) is after correction. (d) The 3D geological model and section.
Water 15 00263 g002
The corrected strata are stored in “ASCII” point files for later construction of the groundwater flow field model.

3.2. Groundwater Flow Model

3.2.1. Boundary Condition

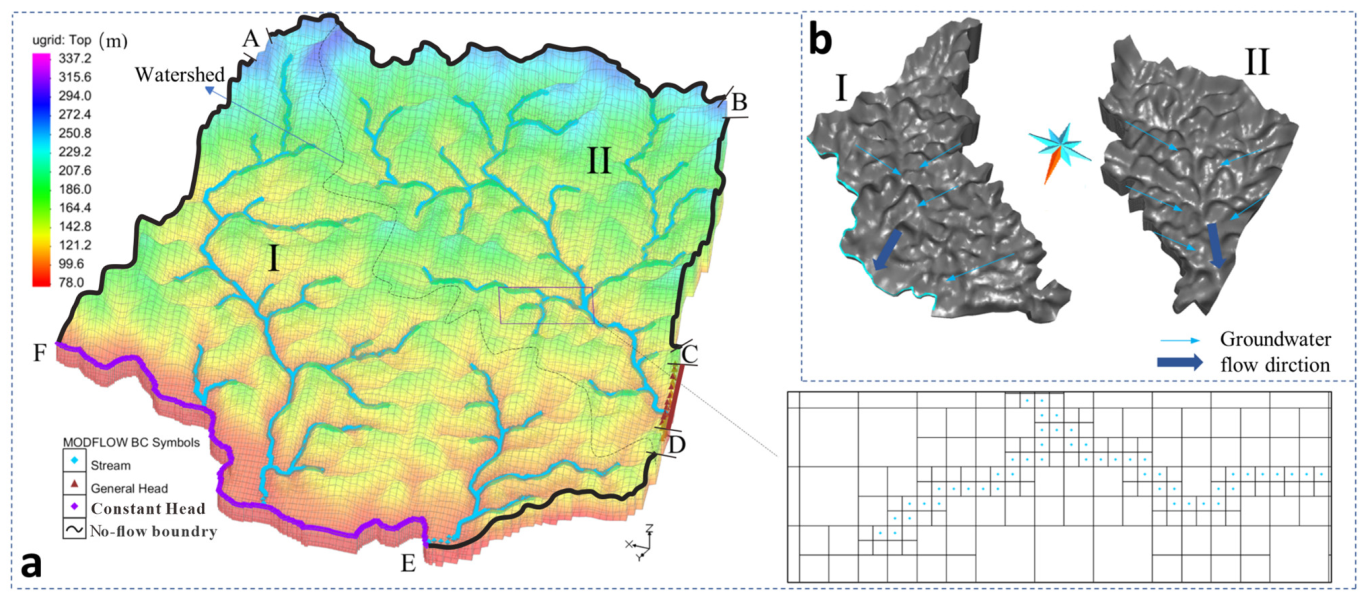
For the groundwater flow model, the boundary conditions describe the water flow exchange between the model and the external system, and the objectivity and accuracy of their settings determine the reasonableness of the model and the possibility of a simulation solution [27]. Based on a preliminary hydrogeological investigation of the study area, its natural boundaries mainly include the perennial river (Constant Head) and a northwest-trending watershed that crosses the entire mine area (Figure 3a). The watershed divides the study area into two, forming two secondary hydrogeological units with the branch gully system as the confluence area. In these two sub-hydrogeological units, the main source of recharge is rainfall infiltration. The groundwater flow direction is mainly controlled by the topography, from the topographic peaks to the troughs, emerging at the surface in the slightly deeper cut gully and eventually discharging into streams (Figure 3b). In addition, the mining region is located in these two sub-hydrogeological units. To accurately analyze the effects of mining on the study area, they were combined into one large hydrogeological unit in the groundwater modeling process.
The model represents each boundary by letters for convenience (AB, BC, CD, DE, EF, and AF section in Figure 3a). The model boundary is set as follows: in the horizontal direction, the EF section is set as the constant head boundary in the study area; the AB section in the southern bedrock outcrop area, the AF, BC, and DE sections in the ridges on both sides, which do not contribute much to aquifer recharge and they are defined as the no-flow boundaries; and the CD section is located downstream of the groundwater runoff direction in the study area and is regarded as the general head boundary. The surface water network is represented in MODFLOW using the Stream (STR1) package (Figure 3a). In the vertical direction, the model boundary receives direct recharge from atmospheric rainfall.

3.2.2. Mesh Profile

The surface water network is dense in the district, and the areas to be encrypted are numerous and scattered. To improve accuracy and computational efficiency, the study area model is constructed based on an unstructured grid (MODFLOW-USG) on a quadtree grid. Using MODFLOW-USG, refinement can effectively reduce the area occupied by stream cells, thus enhancing the drainage area near the stream and making the model calculation more accurate and efficient [28,29,30]. The model was composed of three layers with a total of 46,038 active cells referring to the stratigraphic structure of the geological model. The mesh accuracy of the streams, rivers, and observation wells is set to a 10 × 10 m cell size, and that of the rest is set to a 50 × 50 m cell size.

3.2.3. Hydrogeological Parameters

The hydrogeological parameters include the hydraulic conductivity (Kx, Ky, and Kz) of each stratum in the x, y, and z directions, atmospheric rainfall recharge infiltration coefficients, and hydrodynamic dispersion parameters. The hydraulic conductivities of the four primary lithologies in the study area from the field pumping tests and water injection tests are summarized in Table 1. The vertical hydraulic conductivity (Kz) is one-fifth of the horizontal hydraulic conductivity (Kx). According to the rainfall data for the study area, the average annual rainfall is 1466.7 mm. The infiltration coefficient of precipitation for hillsides ranges between 0.09–0.15, depending on the slope, with a minimum value for steep areas. The infiltration coefficient of precipitation in the gullies and valleys ranges between 0.15–0.27. No relevant hydrodynamic dispersion tests are conducted in the study area; therefore, the hydrodynamic dispersion parameters are given based on empirical values from similar areas [31].

3.2.4. Model Calibration

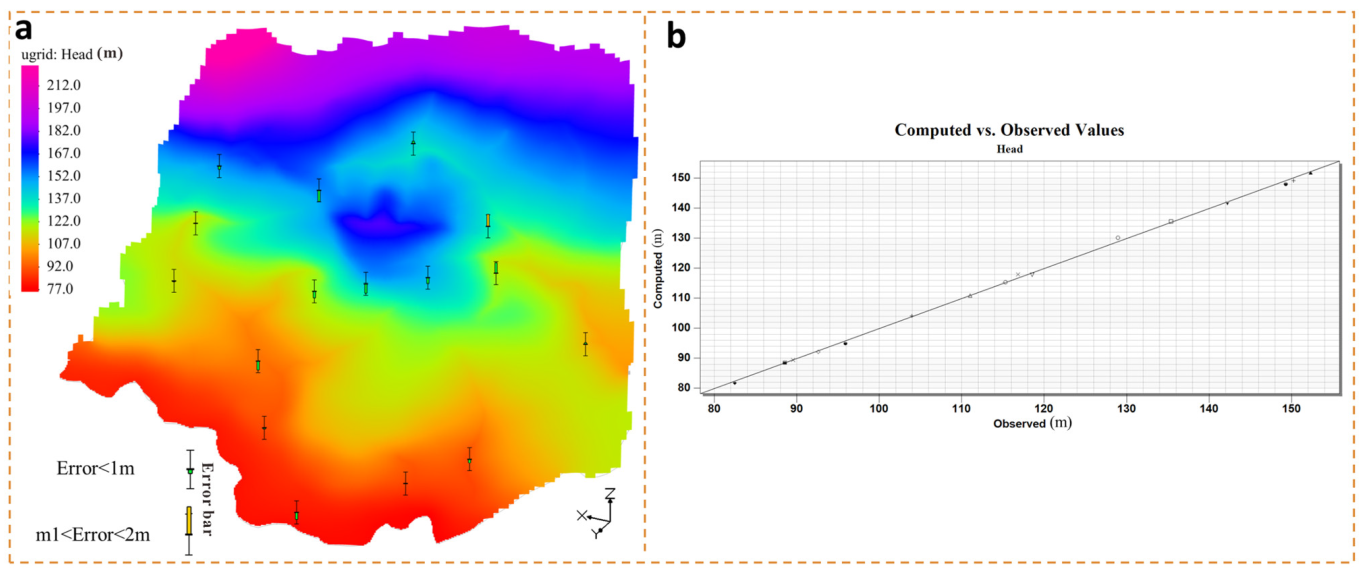
The stratigraphic structure, boundary conditions, and hydrogeological parameters were substituted into the model for steady-state flow operations. During the verification of the groundwater flow model, 16 water level observation wells were distributed in an orderly manner, covering the entire study area (Figure 4). The rationality and accuracy of the model were determined by comparing the calculated mean absolute (MA) and root-mean-square (RMS) errors [32]. The model was adjusted and corrected, and it was used for the simulation and analysis of solute transport.

3.3. Solute-Transport Model

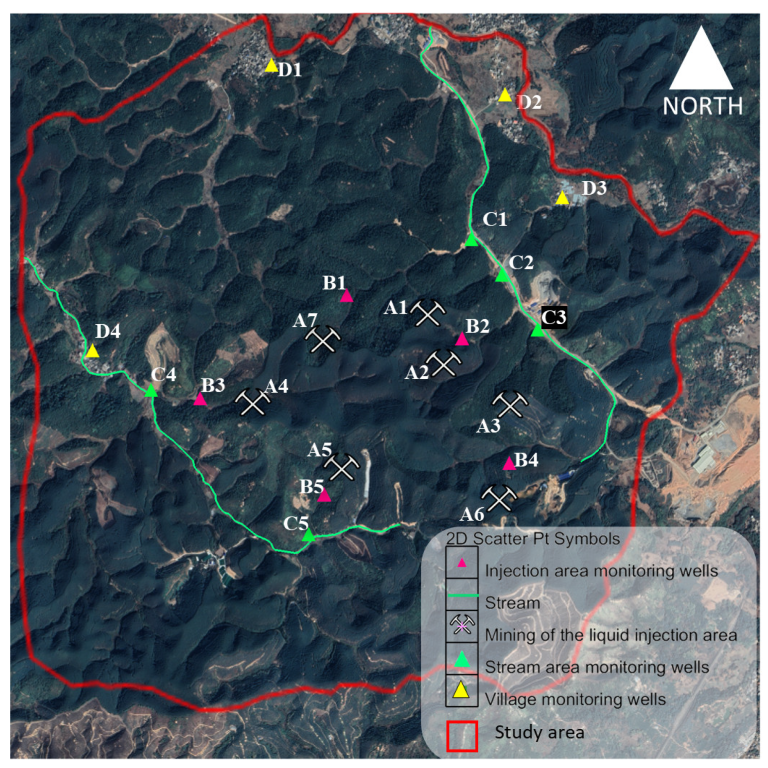
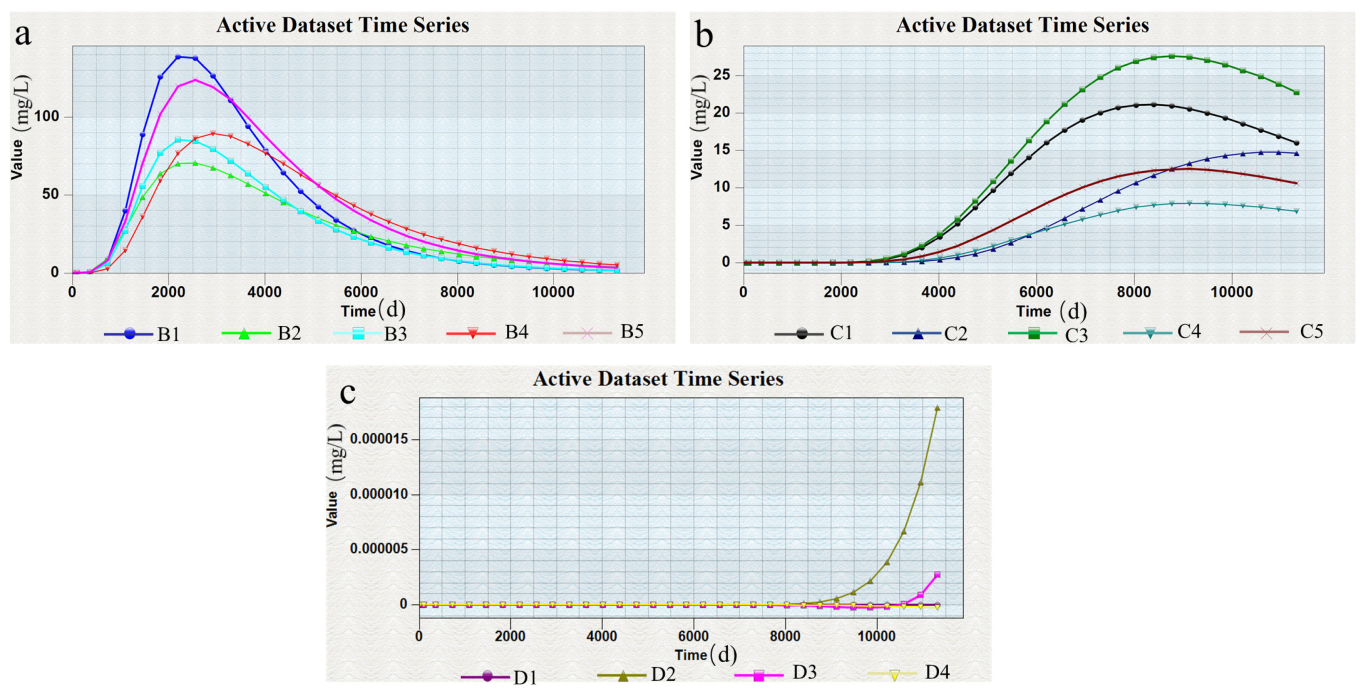
The source of groundwater contamination in the study area is dominated by the large amounts of leaching agents injected into the rare earth ore body. Leaching agents infiltrate the groundwater system through the rock body at the bottom of the deposit and contaminate the area around the mining area within a certain range. The size of the pollution range is closely related to four factors: the number of leaching agents injected into the rare earth ore, characteristic pollutants, duration of liquid injection, and hydraulic connection between the groundwater system and pollution source. Each factor is evaluated as follows: (1) The primary pollutant of the rare earth in situ leach mine is ammonia-nitrogen, and the groundwater in the study area is mainly used as drinking water and for agricultural irrigation. According to the Groundwater Quality Standard (GB/T14818-2017) of China, the Class III standard expresses the medium content of chemical components in groundwater which is suitable for drinking, industrial production, and agricultural irrigation. In this solute-transport simulation, when the concentration of ammonia-nitrogen in groundwater is higher than the Class III standard (0.5 mg/L), mining is considered to have a negative impact on the surrounding groundwater environment. (2) The amount of leaching agent injection is based on production practices and references relevant research results [33,34]. Eight square meters of (NH4)2SO4 with a concentration of 3% are injected per square meter of the ore body in the mining area, and the recovery rate of the mother liquor is 90% after the adoption of roadway liquid collection and anti-seepage measures. The remaining 10% of the mother liquor is infiltrated into the aquifer according to the maximum risk consideration. (3) The duration of liquid injection combined with the mining plan of the area is set to 30 years (10,950 d). The first year is the production time of the liquid injection. After the end of leaching, water is injected to clean the contaminants remaining in the ore body, and the concentration of ammonia-nitrogen seeping into the groundwater each year during the cleaning phase was reduced by 50% until the eighth year. The rainfall filtration period is 9–30 years. The liquid injection areas are numbered A1–A7 and are located as shown in Figure 5. (4) Based on the corrected groundwater flow model, the Block-Centered Transport (BCT) package is embedded for the modeling of transport through MODFLOW-USG [35]. Fourteen monitoring wells are deployed to observe the spatial distribution differences of pollutants to further study the variation in ammonia-nitrogen concentration. The location and properties of the monitoring wells are divided into three groups. The first group is distributed at the edge of the liquid injection area (B1–B5) to grasp the transport pattern of ammonia-nitrogen after mining; the second group is located at the stream (C1–C5) to study the impact of mining on surface water in the area, and the third group is located in each village in the study area (D1–D4) to analyze whether mining posed a threat to safety of groundwater in residential areas. The locations of the monitoring wells are shown in Figure 4. The concentrations of ammonia-nitrogen can be measured by the nashi reagent spectrophotometry method [36].

4. Simulation Results and Discussion

4.1. Characteristics of Groundwater Flow Field

By fitting the measured data of the water level observation wells to the simulated values and using the forward method to continuously correct the parameters in the proposed model so that the errors are within the allowable range, the groundwater flow field in the study area was calculated (Figure 5a). Figure 5b shows the fitting results of the water level in each observation well. It can be seen that the errors are closely scattered on both sides of the y = x curve. The MA between each observation well’s simulated and measured values in the corrected groundwater flow model are 0.554 m. The number of observation wells with an MA < 0.5 m accounts for 50%, and the number of observation wells between with an MA of 0.5–0.8 m accounts for 31.2%. The RMS error of each observation well is 0.693 m. The calibration of the water flow model was satisfactory. In summary, the established model appears to be reliable for representing the groundwater flow field in the study area and can be used as the basis for the next stage of the solute transport model.

4.2. Characteristics of Solute Transport in the Liquid Injection Areas

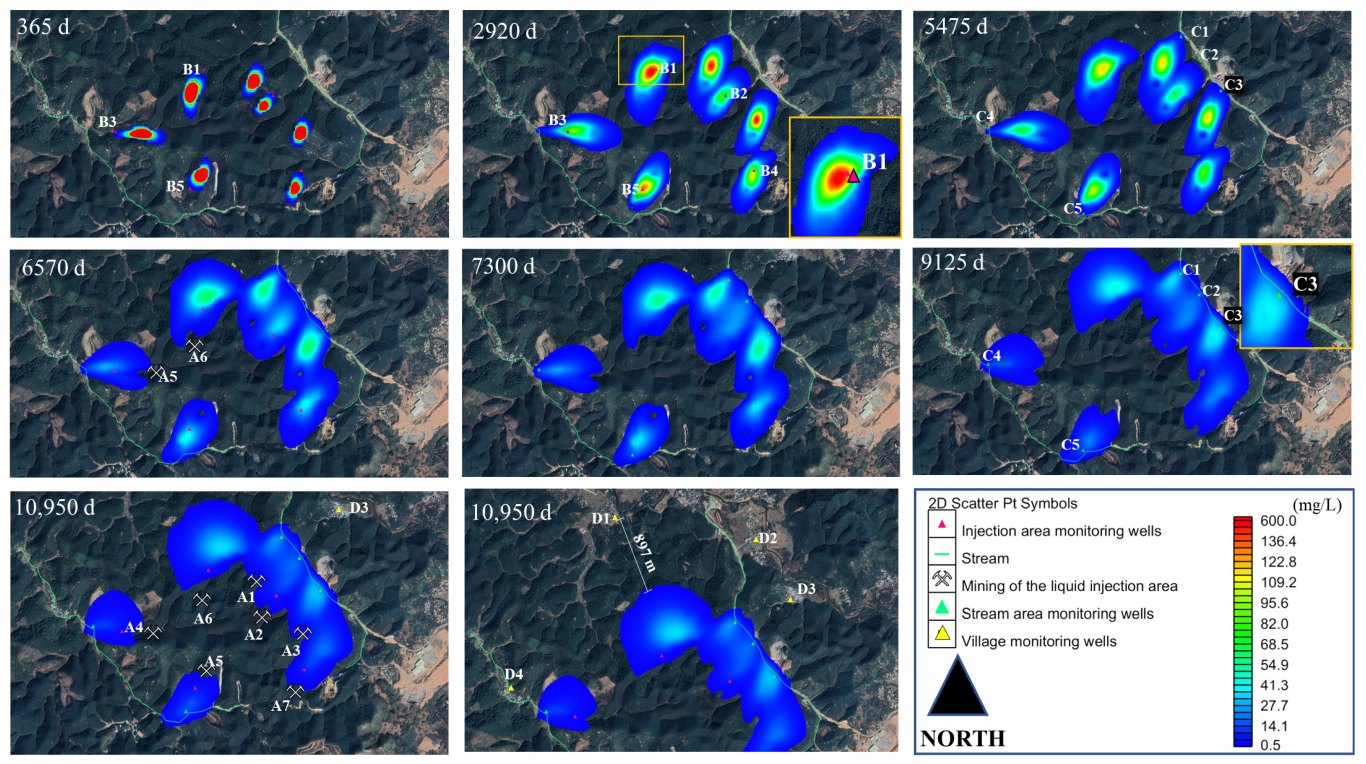
The spatial distribution time points of the prediction model are 365 d, 2920 d, 5475 d, 6570 d, 7300 d, 9125 d, and 10,950 d. The effects of Guangxi Nuodong rare earth ores on the distribution of ammonia-nitrogen in groundwater as predicted by the model are shown in Figure 6. The concentration change curve of ammonia-nitrogen in each group of monitoring wells is shown in Figure 7. The ammonia-nitrogen pollutants migrated to the downstream gully under the influence of convection over time. The contamination plume reached the monitoring wells in each liquid injection area over one year. With continued liquid injection in the mining area and subsequent hole washing, the ammonia-nitrogen concentration in each monitoring well increased rapidly. At the end of the production period (2920 d), the center of the contamination plume reached each monitoring well successively. In addition, the maximum peak concentration in the monitoring wells (B1) reached 139.15 mg/L (Figure 7a), which exceeded the Class III standard by nearly 278 times with a cumulative contaminated area of approximately 1.4 km2. Subsequently, with the effect of rainfall dilution, the ammonia concentration curve decreased and eventually stabilized, and the contamination plume center gradually migrated downstream of the injection area. After 18a of the model run, the plume had left the A5 and A6 injection areas. At the end (10,950 d) of the model run, the concentration of ammonia-nitrogen in all injection areas was lower than the Class III standard. The farthest migration distance of the contamination plume in the injection area was approximately 981 m, and the contaminated area was approximately 1.95 km2.

4.3. Characteristics of Solute Transport in the Stream Area

With the dilution effect of rainfall leaching, the maximum peak concentration in the monitoring wells (C3) was 27.9 mg/L (Figure 7b), which is significantly lower than the monitoring wells in the injection area but still exceeded the Class III standard by nearly 56 times. In the absence of prevention and control measures and with only rainfall dilution, ammonia and nitrogen pollutants will continue to be discharged downstream at relatively high concentrations, endangering the safety of surface water in the study area. Meanwhile, by comparing the concentration curves of the monitoring wells in the injection and stream areas, it is found that the closer the monitoring wells are to the injection area, the faster the ammonia-nitrogen concentration reached its peak. Furthermore, the second group of pollutant concentrations increased and reached a peak with a significant lag. During the 7300 d–10,950 d period, the pollution plume in the A1–A5 injection zone migrated very slowly along the groundwater direction, and the farthest migration of the plume during this period is approximately 61 m. The diffusion range of the plume did not expand significantly, probably because surface water bodies, such as streams and trap pollutants, limit the diffusion rate and range of the plume [37].

4.4. Characteristics of Solute Transport in the Village Area

As shown in Figure 7c, the concentration of ammonia-nitrogen in the groundwater of each village did not exceed the Class III standard during the model run. This is mainly a result of the distance between the villages and the mining area. At the end of the model run, D1 was approximately 897 m from the edge of the contaminated plume. In addition, some villages are separated from the mining area by ridges and lack hydraulic connections. Therefore, the impact of rare earth development on the groundwater environment in the village area is limited. However, it should be noted that ammonia-nitrogen can contaminate streams and reservoirs within the mine site during mining, which can threaten the safety of the water for residents of the mine site.

4.5. Groundwater Protection Measures and Effects

During the model run phase, the maximum concentration of ammonia-nitrogen pollutants discharged into the stream could reach 27.9 mg/L. Based on the results of the solute transport model and rare earth mining plan, an effective groundwater remediation option needs to be designed and selected. The remediation goal is to achieve a maximum peak concentration of less than 0.5 mg/L when the contaminated plume reaches the stream. Optimizing the number and placement of pumping wells with the best results is also required to reduce remediation costs and economically prevent and control groundwater pollution.
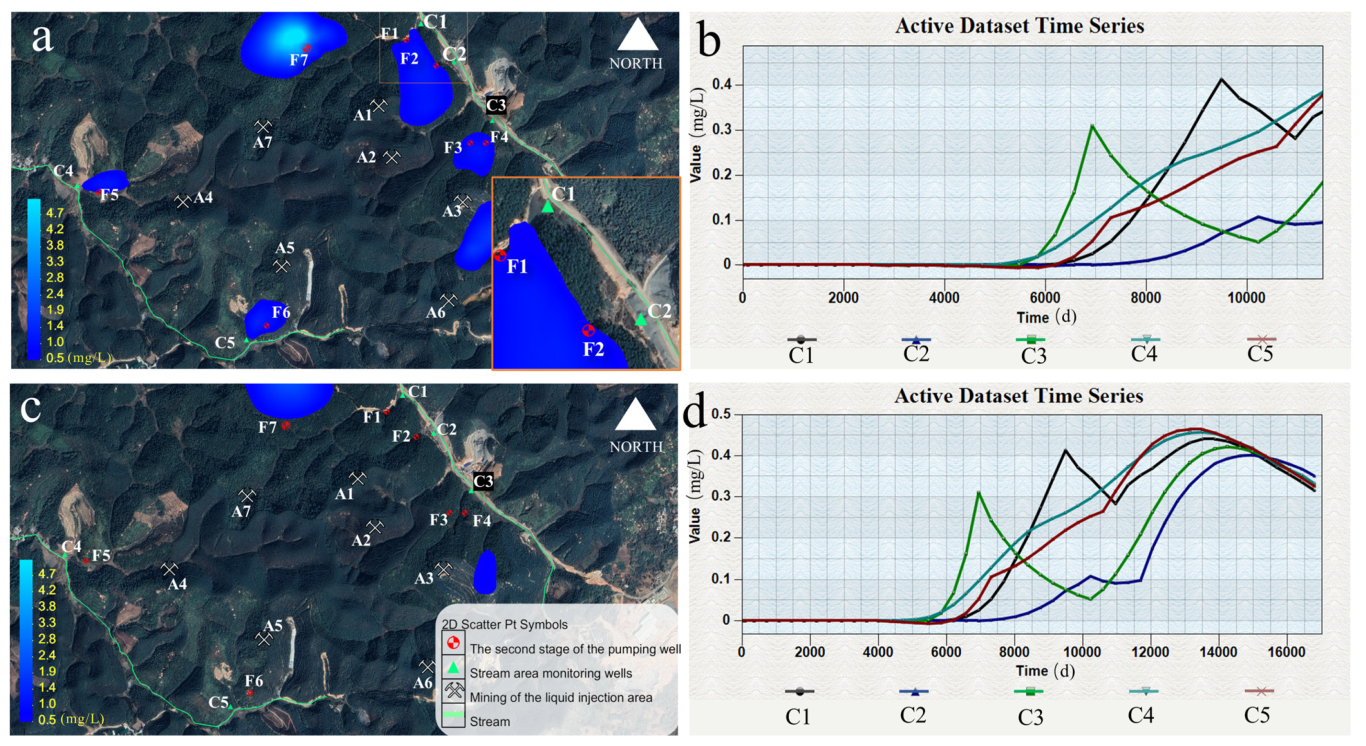
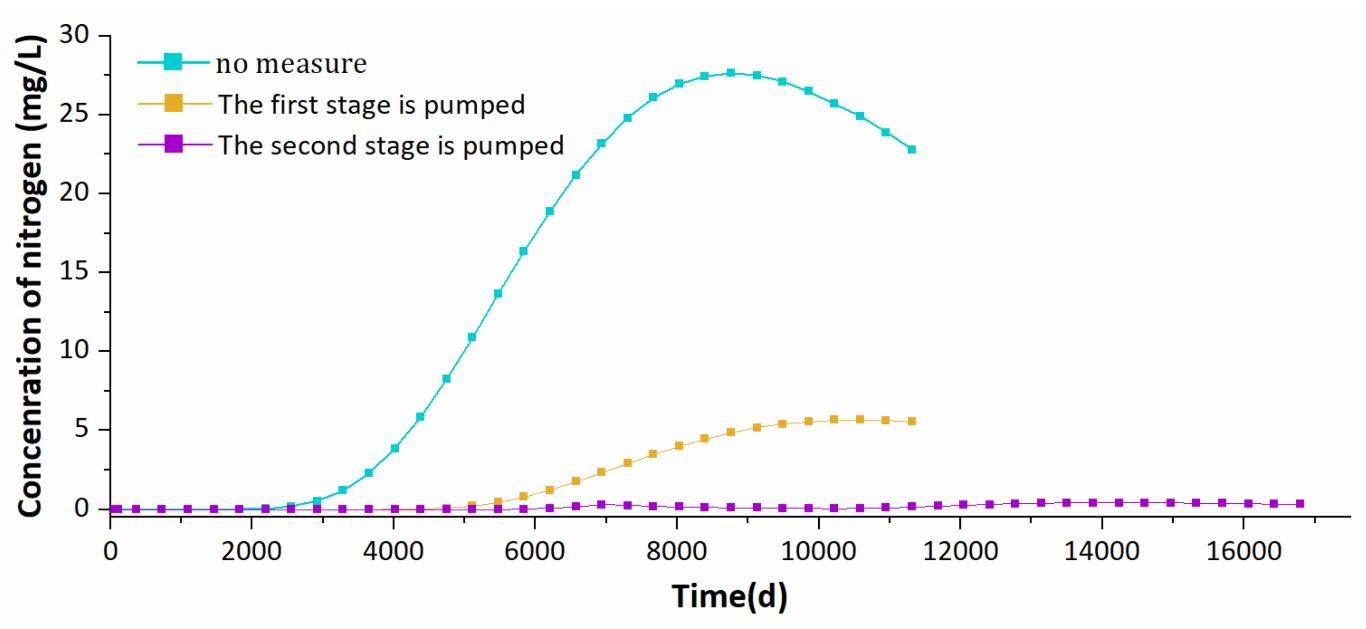
The simulation results are shown in Figure 8. For economic consideration, combined with the mining plan, contaminant remediation wells (pumping wells; numbered E1–E7) were set up 200 m from each injection area (the first stage) (Figure 8a). Pumped groundwater was used as the water supply source for the wash hole phase (930 d–2920 d), and the pumping wells were run for the same time as the mining plan, simulating the contamination plume at the end of the model run (10,950 d) after adding the pumping well intervention conditions and the concentration change curve of each monitoring in the stream area. The simulated predictions of this scenario showed that the pump-out treatment option can rapidly reduce the concentration of ammonia-nitrogen in the aquifer. This pump-out treatment is effective for removing the diffusion of high concentrations of pollutants from the aquifer during the operation of the pump-out wells, and the peak concentrations in each stream monitoring well were significantly reduced, with the maximum peak concentration (C3 monitoring well) decreasing from 27.9 mg/L to 5.51 mg/L, a reduction of 80%. However, the control over the range of low-concentration contamination is limited. After the pumping wells stopped pumping, pollutants continued to migrate to the downstream gullies, and the area with exceeded pollution levels at the end of the model run was approximately 1.9 km2, a reduction of 0.4 km2 compared to the no-action scenario, and the maximum ammonia-nitrogen concentration discharged into the streams was 11 times higher than the Class III standard. Therefore, further control measures are needed to control the spread of the pollution.
The pumping wells in the first stage still could not completely control the spread of pollutants beyond the standard; therefore, 1–2 hydraulic interception wells were placed at the foot of each plume to further control the spread of pollutants into the stream (the second stage). The interception wells were numbered F1–F7 (Figure 9a). The A6 injection area is far from the stream; thus, no interception wells were installed. The pumping volume and operation time of the second-stage hydraulic interceptor wells were determined through calculations to ensure the best remediation effect and reduce remediation cost (Table 2).
It can be seen that at the end of the model run (10,950 d), the pollution plume does not reach the monitoring wells in the stream area, but is controlled in the mountain front area (Figure 9a). In addition, the exceedance area of the study area is reduced to 0.33 km2, ammonia-nitrogen pollution is effectively controlled, and the peak ammonia-nitrogen concentration in each stream monitoring well does not exceed 0.5 mg/L. However, when the pumping is stopped, the pollutants mainly change to a diffusion effect, the ammonia-nitrogen concentration in the aquifer began to increase gradually, and the concentration curve of each monitoring well showed an increasing trend (Figure 9b). This may be due to pollutants more likely being retained in areas with slow groundwater flow rates, and the diffusive effect of pollutants in low-flow aquifers being an essential factor in the rebound effect [38]. To determine if the concentration profile of each monitoring well will exceed 0.5 mg/L after the concentration rebound, the model run time was increased to 16,425 d without any remediation measures (Figure 9c,d). The results show that, under the effect of rainfall leaching, the pollution plume in the A1–A5 injection area disappeared after 16,425 d (Figure 9c), and the continued migration of A7 to the north had less impact on the regional surface water. The concentration curves of the monitoring wells in each stream (Figure 9d) indicated that the peak concentration of ammonia-nitrogen pollutants discharged into the stream after natural attenuation was less than 0.5 mg/L. This indicates that the pollutant concentrations are effectively controlled using two-stage pumping wells to pump out the water.
Meanwhile, the change curves of ammonia-nitrogen concentrations in the C3 monitoring well under the three working conditions are compared (Figure 10), that conditions are: (1) no measures, (2) only the one round of pump-out treatment, and (3) pumping out treatment including two round of pump-out. The comparison results show that the effect of taking control measures on the pollutant concentration is pronounced, and the peak concentration in the C3 monitoring well is reduced by 80% after adopting the first stage of pumping out wells, which effectively controls the spread of high concentration pollutants. When the first and second stage pump-out treatments are adopted, the pollutant control effect is the best, and the peak ammonia-nitrogen concentration discharged into the stream is lower than the standard limit of 0.5 mg/L.

5. Conclusions

To scientifically analyze and evaluate the impact of mineral mining in hilly areas on the water environment, this study uses the Nuodong rare earth mining area in Guangxi as an example. Based on field investigations and experiments, GOCAD software was used to establish a geological model in combination with GMS numerical simulation software, which was used to build a groundwater flow model and a solute transport model. This paper focused on analyzing and predicting the groundwater ammonia-nitrogen pollutant migration patterns and spatial distribution differences in the mining area, and also simulated and evaluated the effect of the hydraulic method on the control of ammonia-nitrogen pollution. The main conclusions are as follows:
(1)
The water level fitting results of the groundwater flow model show that the absolute error between the simulated and measured water levels of each observation well is 0.554 m. The number of observation wells with MA < 0.5 m accounts for 50% of the total, the number of observation wells between 0.5 and 0.8 m accounts for 31.2%, and the RMS error of each monitoring well is 0.693 m. The established model reflected the groundwater flow field in the study area.
(2)
After rare earth mining, the maximum peak concentration of pollutants in the monitoring wells in the injection area reached 139.15 mg/L, exceeding the Class III standard by nearly 280 times. The maximum concentration in the monitoring wells in the stream area is 27.9 mg/L, significantly lower than that in the liquid injection area, but still exceeding the Class III standard by nearly 56 times. The cumulative ammonia-nitrogen contamination area reached 1.95 km2, and the farthest migration distance of the contamination plume was approximately 981 m. During the model run (10,950 d), the ammonia-nitrogen concentration of all monitoring wells in the village area did not exceed the standard, and the impact of rare earth metal mining on the groundwater environment is limited. However, pollutants during mining seriously affect the streams and reservoirs in the area, which could threaten the safety of the water for residents.
(3)
After adopting the first-stage pumping measure, ammonia-nitrogen transport is effectively controlled, and the peak concentration of the monitoring wells decreased significantly, with the maximum peak concentration decreasing from 27.9 mg/L to 5.51 mg/L, a reduction of 80%. However, the low concentration of the ammonia-nitrogen control range was limited, and the contaminated area was only reduced by 0.4 km2. Based on these results, a second pumping stage was adopted. The model results showed that the peak concentration of ammonia-nitrogen pollutants discharged into the stream after natural attenuation was less than 0.5 mg/L and the ammonia-nitrogen pollutants in the mine area could be effectively controlled.

Author Contributions

Conceptualization, H.H. and H.S.; methodology, H.S.; software, H.H.; validation, H.H., H.S. and S.P.; formal analysis, Y.L.; investigation, Y.C.; resources, D.M.; data curation, M.C.; writing—original draft preparation, H.H.; writing—review and editing, H.S.; visualization, D.M.; supervision, Z.Y.; project administration, M.C.; funding acquisition, H.S. All authors have read and agreed to the published version of the manuscript.

Funding

Funding for this research is provided by the National Natural Science Foundation of China (No. 41877194, No. 42167026), the Natural Science Foundation of Guangxi (2022GXNSFBA035600), Guangxi Education Department (Qiangu Program), Guangxi Key Laboratory of Theory and Technology for Environmental Pollution Control, and Guilin University of Technology Program (GLUTQD 2016047).

Data Availability Statement

All data, models, and code generated or used during the study appear in the submitted article.

Conflicts of Interest

The authors declare that they have no conflict of interest.

References

  1. Dutta, T.; Kim, K.H.; Uchimiya, M.; Kwon, E.E.; Jeon, B.-H.; Deep, A.; Yun, S.-T. Global demand for rare earth resources and strategies for green mining. Environ. Res. 2016, 150, 182–190. [Google Scholar] [CrossRef] [PubMed]
  2. Golev, A.; Scott, M.; Erskine, P.D.; Ali, S.H.; Ballantyne, G.R. Rare earths supply chains: Current status, constraints and opportunities. Resour. Policy 2014, 41, 52–59. [Google Scholar] [CrossRef]
  3. Packey, D.J.; Kingsnorth, D. The impact of unregulated ionic clay rare earth mining in China. Resour. Policy 2016, 48, 112–116. [Google Scholar] [CrossRef]
  4. Deng, Z.X.; Qin, L.; Wang, G.S.; Luo, S.H.; Peng, C.L. Ammonia nitrogen pollution and rogress in its treatment of ionic rare earth mines. Chin. Rare Earths 2019, 40, 120–129. [Google Scholar]
  5. Zhou, F.; Liu, Q.; Feng, J.; Su, J.; Liu, X.; Chi, R. Role of initial moisture content on the leaching process of weathered crust elution-deposited rare earth ores. Sep. Purif. Technol. 2019, 217, 24–30. [Google Scholar] [CrossRef]
  6. Zhang, Z.; He, Z.; Yu, J.; Xu, Z.; Chi, R. Novel solution injection technology for in-situ leaching of weathered crust elution-deposited rare earth ores. Hydrometallurgy 2016, 164, 248–256. [Google Scholar] [CrossRef]
  7. Zhang, Q.; Ren, F.; Li, F.; Chen, G.; Yang, G.; Wang, J.; Du, K.; Liu, S.; Li, Z. Ammonia nitrogen sources and pollution along soil profiles in an in-situ leaching rare earth ore. Environ. Pollut. 2020, 267, 115449. [Google Scholar] [CrossRef]
  8. Zhu, Y.B.; Zhou, L.B.; Li, Q. Water pollution prevention method for in-situ leach mining of ion-absorbed rare-earth mineral. Nonferrous Met. 2011, 6, 46–49. [Google Scholar]
  9. Wu, D.Y. Study on the stability of residual matter in southern ion rare earth mines. Master’s Thesis, China University of Geosciences, Beijing, China, 2018. [Google Scholar]
  10. Zhao, Y.H.; Zheng, T.; Cheng, X.X. Advance of ammonia nitrogen pollution and control techniques for soil and water environment in ion-adsorption rare earth mines. Chin. Rare Earths 2020, 41, 24–132. [Google Scholar]
  11. Feng, J.; Zhou, F.; Chi, R.; Liu, X.; Xu, Y.; Liu, Q. Effect of a novel compound on leaching process of weathered crust elution-deposited rare earth ore. Miner. Eng. 2018, 129, 63–70. [Google Scholar] [CrossRef]
  12. He, Q.; Qiu, J.; Chen, J.; Zan, M.; Xiao, Y. Progress in green and efficient enrichment of rare earth from leaching liquor of ion adsorption type rare earth ores. J. Rare Earths 2022, 40, 353–364. [Google Scholar] [CrossRef]
  13. Gong, R.; Ye, C.W.; Cheng, R. Resistance and control of ammonia nitrogen pollution of ionic rare earth ores with modified soil-bentonite barrier. Chin. J. Environ. Eng. 2020, 14, 1394–1403. [Google Scholar]
  14. Xiao, Y.F.; Feng, Z.Y.; Huang, X.W.; Huang, L.; Yingying, C.; Liangshi, W.; Zhiqi, L. Recovery of rare earths from weathered crust elution-deposited rare earth ore without ammonia-nitrogen pollution: I. leaching with magnesium sulfate. Hydrometallurgy 2015, 153, 58–65. [Google Scholar]
  15. Yan, H.S.; Liang, T.M.; Liu, Q.S.; Qiu, T.S.; Ai, G.H. Compound leaching behavior and regularity of ionic rare earth ore. Powder Technol. 2018, 333, 106–114. [Google Scholar] [CrossRef]
  16. Liu, L.; Liang, S.P.; Liu, H.C.; Tan, W.; Zhu, G.R. Migration of Cr2O72− and butanone in soil and groundwater system after the Tianjin port 8·12 Explosion. Trans. Tianjin Univ. 2018, 24, 522–531. [Google Scholar] [CrossRef]
  17. Liu, M.Z.; Chen, H.H.; Hu, L. Numerical modeling of transport of organic pollutants in shallow groundwater in a certain city of northern China. Geol. China 2005, 32, 507–511. [Google Scholar]
  18. Liu, S.L.; Wer, J.; Shen, Y.Y. Pollution risk evaluation of Dawu groundwater source site in Zibo City, Shandong. J. Saf. Environ. 2013, 13, 142–148. [Google Scholar]
  19. McDonald, M.G.; Harbaugh, A.W. A modular three-dimensional finite-difference ground-water flow model. In Open-File Report; US Geological Survey: Reston, VA, USA, 1984. [Google Scholar]
  20. Shen, T.T. Numerical simulation of solute transport in groundwater at a chemical plant. Environ. Sci. Technol. 2015, 38, 378–382. [Google Scholar]
  21. Li, X.; Du, J.; Cui, J.; Chai, L.; Di, Z.; Wang, X. Migration and prediction of groundwater organic contamination intypical region of Hunhe River alluvial fan. J. Cent. South Univ. 2014, 45, 2529–2537. [Google Scholar]
  22. Zhu, J.; Chen, C.; Li, T.; Zhang, A.M. Numerical simulation of groundwater flow characteristics and radionuclide migration in hilly area. J. Shanxi Univ. 2019, 42, 465–472. [Google Scholar]
  23. Zhu, J.; Li, T.; Chen, C.; Xie, T.; Zhang, A. Model calculation method of radionuclide groundwater release flux of offshore nuclear power plants. J. Jilin Univ. 2021, 51, 201–211. [Google Scholar]
  24. Woloszyn, I.; Merkel, B.; Stanek, K. 3D geological modeling of the transboundary Berzdorf–Radomierzyce basin in Upper Lusatia (Germany/Poland). Int. J. Earth Sci. 2016, 106, 1651–1663. [Google Scholar] [CrossRef]
  25. Ross, M.; Aitssi, L.; Martel, R.; Parent, M. From Geological to Groundwater Flow Models: An Example of Interoperability for Semi-regular Grids; Natural Resources Canada/CMSS/Information Management: Salt Lake City, UT, USA, 2006. [Google Scholar]
  26. Watson, C.; Richardson, J.; Wood, B.; Jackson, C.; Hughes, A. Improving geological and process model integration through TIN to 3D grid conversion. Comput. Geosci. 2015, 82, 45–54. [Google Scholar] [CrossRef] [Green Version]
  27. Lachaal, F.; Chekirbane, A.; Chargui, S.; Sellami, H.; Tsujimura, M.; Hezzi, H.; Faycel, J.; Mlayah, A. Water resources management strategies and its implications on hydrodynamic and hydrochemical changes of costal groundwater: Case of Grombalia shallow aquifer, NE Tunisia. J. Afr. Earth Sci. 2016, 124, 171–188. [Google Scholar] [CrossRef]
  28. Cui, W.Z.; Hao, Q.C. Comparing Q-Tree with nested grids for simulating managed river recharge of groundwater. Water 2020, 12, 3516. [Google Scholar] [CrossRef]
  29. Ezzeldin, M.M.; ElAlfy, K.S.; Gawad, H.A.A.; Elmaboud, M.E.A. Comparison between structured and unstructured MODFLOW for simulating groundwater flow in Three-Dimensional multilayer Quaternary aquifer of East Nile Delta, Egypt. Hydrol. Curr. Res. 2018, 9, 297. [Google Scholar] [CrossRef]
  30. Karan, S.; Jacobsen, M.; Kazmierczak, J.; Reyna-Gutiérrez, J.; Breum, T.; Engesgaard, P. Numerical representation of groundwater-surface water exchange and the effect on streamflow contribution estimates. Water 2021, 13, 1923. [Google Scholar] [CrossRef]
  31. Yuan, S.D.; Zhang, W.J.; Yuan, S.S. Dispersion values in solute migration tests. Rock Soil Mech. 2020, S2, 1–6. [Google Scholar]
  32. Anderson, M.P.; Woessner, W.W. The role of the postaudit in model validation. Adv. Water Resour. 1992, 15, 167–173. [Google Scholar] [CrossRef]
  33. Ju, X.L. Study on the Simulation Prediction of Groundwater Ammonia-Nitrogen Pollution in Rare Earth Area of Southern Jiangxi Province. Master’s Thesis, Liaoning Normal University, Dalian, China, 2015. [Google Scholar]
  34. Xu, S.T.; Xiang, Y.; Liu, Z.Y. Simulation and predication of ammonia nitrogen contamination of groundwater in ionic adsorption rare earth in-situ leaching mining. Nonferrous Met. Sci. Eng. 2016, 7, 140–146. [Google Scholar]
  35. Panday, S. Block-Centered Transport (BCT) process for MODFLOW-USG. In GSI Environmental; US Geological Survey: Reston, VA, USA, 2017. [Google Scholar]
  36. Song, K.; Ren, X.; Mohamed, A.K.; Liu, J.; Wang, F. Research on drinking-groundwater source safety management based on numerical simulation. Sci. Rep. 2020, 10, 15481. [Google Scholar] [CrossRef] [PubMed]
  37. Xu, Y.Q.; Zhang, Y.K. Twofold significance of groundwater pollution prevention in China’s water pollution control. Acta Sci. Circumstantiae 2009, 29, 474–481. [Google Scholar]
  38. Pu, M. Reviews on groundwater contaminants control and remediation technology: Rump and treat. Environ. Eng. 2017, 35, 6–10. [Google Scholar]
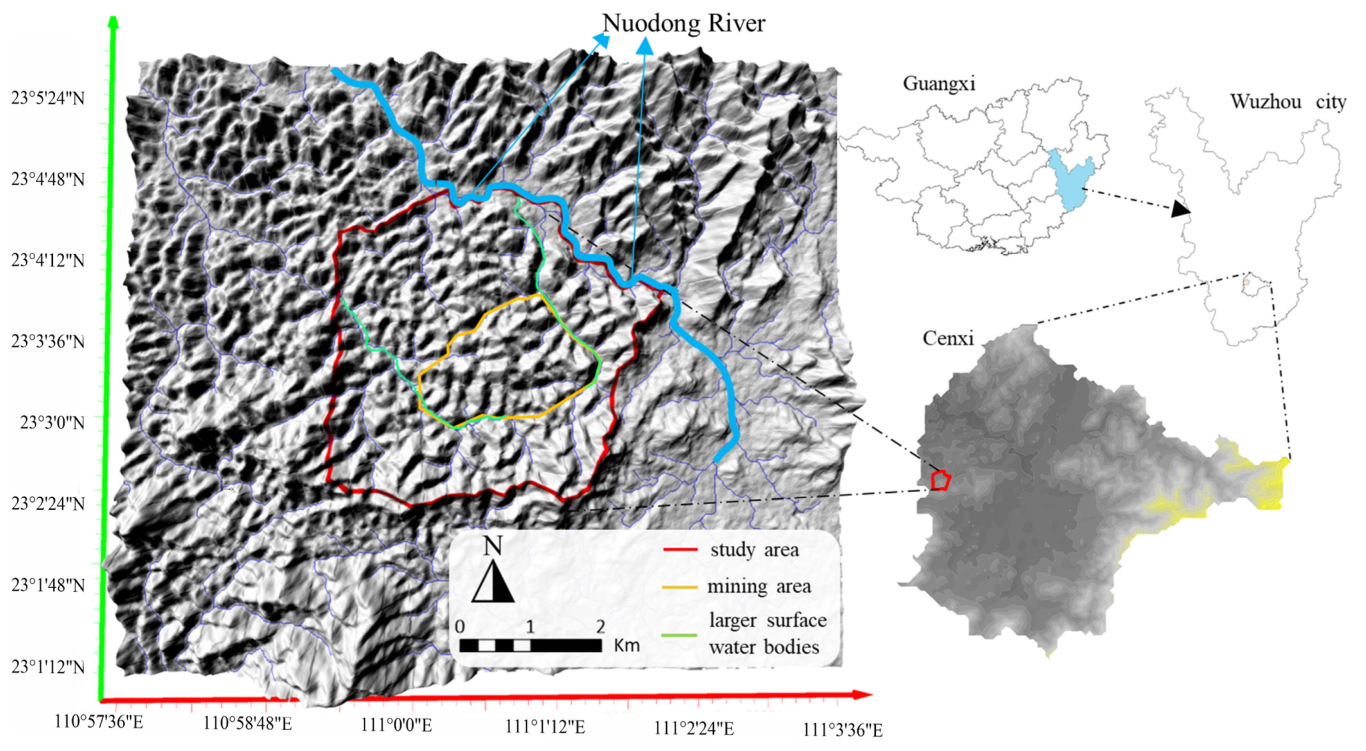
Figure 1. Location of the study area.
Water 15 00263 g001
Figure 3. Conceptual model of the study area. (a) Boundary conditions and grid discretization in the MODFLOW-USG model. (b) Sub-hydrogeological units and their groundwater flow direction.
Water 15 00263 g003
Figure 4. Location of monitoring wells and liquid injection area.
Water 15 00263 g004
Figure 5. Cloud map and simulation error of groundwater head. (a) The groundwater flow field in the study area. The green error bar means the error between the observation and simulation head is less than 1 m and the yellow error bar means the error is between 1 and 2 m. (b) Scatter plot of computed versus observed values.
Water 15 00263 g005
Figure 6. Ammonia-nitrogen migration map of the study area (no measurements).
Water 15 00263 g006
Figure 7. The concentration changes curve of ammonia-nitrogen in each group. (a) Injection area monitoring wells. (b) Stream area monitoring wells. (c) Village area monitoring wells.
Water 15 00263 g007
Figure 8. Results of the first stage of the extraction treatment model. (a) Spatial distribution of characteristic pollutants at 10,950 d. (b) Change curve of ammonia-nitrogen concentration in monitoring wells in the stream area.
Water 15 00263 g008
Figure 9. Results of the second stage of the extraction treatment model. (a) Spatial distribution of characteristic pollutants at 10,950 d. (b) Change curve of ammonia-nitrogen concentration in monitoring wells in the stream area. (c) Spatial distribution of characteristic pollutants at 16,425 d. (d) Change curve of ammonia-nitrogen concentration in monitoring wells in the stream area.
Water 15 00263 g009
Figure 10. Comparison diagram of ammonia-nitrogen concentration change curve in the C3 monitoring well under three working conditions.
Water 15 00263 g010
Table 1. Hydraulic conductivity of four different lithologies.
NO.LithologyKx (m/d)Ky (m/d)Kx/Kz
1Quaternary alluvium2.39~3.542.39~3.545
2Strongly weathered granite0.09~2.3590.09~2.3595
3Partly fractionated granite0.018~0.470.018~0.475
4Bedrock0.005~0.0090.005~0.0095
Note: Kx, Ky, and Kz are the hydraulic conductivity along the x, y, and z directions, respectively. Kx/Kz means vertical anisotropy.
Table 2. Basic information of each pumping well in the second stage of the pump-out treatment.
Well NumberRunning Time (d)Pumping Capacity (m3/d)Location
F19490–10,585200A1 pollution plume downstream
F29855–10,950200A2 pollution plume downstream
F36935–10,220200A3 pollution plume downstream
F46935–10,220200A3 pollution plume downstream
F55475–7665250A4 pollution plume downstream
F67300–10,220200A5 pollution plume downstream
F77300–9490200A7 pollution plume downstream
Disclaimer/Publisher’s Note: The statements, opinions and data contained in all publications are solely those of the individual author(s) and contributor(s) and not of MDPI and/or the editor(s). MDPI and/or the editor(s) disclaim responsibility for any injury to people or property resulting from any ideas, methods, instructions or products referred to in the content.