Article

Application of Machine Learning Coupled with Stochastic Numerical Analyses for Sizing Hybrid Surge Vessels on Low-Head Pumping Mains

by
Ahmed M. A. Sattar
1,2,*,
Abedalkareem Nedal Ghazal
1,
Mohamed Elhakeem
3,
Amgad S. Elansary
1 and
Bahram Gharabaghi
4
1
Department of Irrigation and Hydraulics, Cairo University, Giza 12613, Egypt
2
Department of Civil Engineering, German University in Cairo, Cairo 11835, Egypt
3
Civil Engineering Department, Abu Dhabi University, Abu Dhabi P.O. Box 59911, United Arab Emirates
4
School of Engineering, University of Guelph, Guelph, ON N1G 2W1, Canada
*
Author to whom correspondence should be addressed.
Water 2023, 15(19), 3525; https://doi.org/10.3390/w15193525
Submission received: 23 July 2023 / Revised: 18 September 2023 / Accepted: 1 October 2023 / Published: 9 October 2023

Abstract

:
In surge protection, low-head profiles are deemed a challenge in pump failure events since they are prone to severe negative pressure surges that require an uneconomical surge vessel volume. A hybrid surge vessel with a dipping tube can provide required protection with reasonable economic volume. This work presents novel analyses for the hybrid surge vessel and develops a simple model for its optimum sizing using a stochastic numerical approach coupled with machine learning. Practical ranges for correct sizing of vessel components, such as ventilation tube, inlet/outlet air valves, and compression chamber, are presented for optimal protection and performance. The water hammer equations are iteratively solved using the hybrid surge vessel’s revised boundary conditions within the method of characteristics numerical framework to generate 2000 cases representing real pump failures on low-head pipelines. Genetic programming is utilized to develop simple relations for prediction of the hybrid vessel initial and expanded air volumes in addition to the compression chamber volume. Moreover, the developed model presented a classification index for low-head pipelines on which the hybrid vessel would be most economical. The developed model yielded good prediction error statistics. The developed model proves to be more accurate and easier to use than the classical design charts for the low-head pumping mains. The model clearly showed the relation between various hydraulic and pipe parameters, with pipe diameter and static head as the most influencing parameters on compression chamber volume and expanded air volume. The developed model, together with the classification indices, can be used for preliminary surge protection sizing for low-head pipelines.

1. Introduction

When a pump trips or loses power, a negative pressure wave is generated at the pump. Cavitation and water column separation may occur if the negative pressure wave falls below the water vapor pressure, which is 10 m below atmospheric pressure at 20 °C. Water columns oscillate as a result of the separation, and they can reassemble when air bubbles collapse and create excess pressure in the pipeline. This excess pressure can cause severe damage to the water supply system and economic losses. Thus, protection of water supply systems from transient events, positive and negative, has been the focus of much research and practical studies.
Since the transient wave is greatly influenced by the pipeline material, the replacement of metallic pipes in hydropower plants and water supply systems with viscoelastic material has begun [1]. These viscoelastic pipes would suppress the pressure transient waves due to low impedance and fast damping when compared with rigid metallic pipes. Metallic-polymeric pipes were proposed by [2] to upgrade existing steel pipes in negative transient events. Moreover, for upgrading the existing steel pipe network, ref. [3] proposed the replacement of a short section of steel pipe with branching plastic pipe to avoid major modifications. It has also been reported that glass reinforced plastic pipe was more effective in control of negative transients when compared to high-density polyethylene [1]. Recently, ref. [4] proposed a combination of glass reinforced pipe and steel pipe for controlling negative transients. However, most of this work concentrated on hydropower plant conduits, and reported shortcomings such as requirements of major modifications in existing systems to accommodate new plastic pipes, and manufacturing limitations of pressure and size of plastic pipes [4], in addition to ineffectively eliminating the initial generated negative surge wave generated by pump trip.
Many devices have been developed and successfully used to protect pipelines from hydraulic transients, e.g., surge vessels, one-way surge tanks, air valves, and relief valves. Of these, air valves, one-way surge tanks, and surge vessels are effectively used to control negative transients in pumping mains [5]. For a water intake pumping station, the protective effect against negative transients was studied and confirmed by [6] following a pump trip using an air valve on a discharge line of pump. Using a combination of air valves, ref. [7] showed that long pumped pipelines can be effectively protected against negative transients using an air valve in addition to two-staged close butterfly valves. On the other hand, ref. [8] showed that negative transients can be controlled in a cascading pumping station by using a system of air vent valves along the pipelines for prevention of vacuum cavities. Using a pressure relief valve and safety membrane has been shown by [9] to effectively reduce positive transients and, to a lesser extent, limit the negative transients in a small hydropower plant. The operation of air valves following pump trip transients have been studied by [10], where they stated that two-step closure of air valves would reduce negative transients compared to one-step valve closure. However, calculation of air valve size and location is extremely sensitive and, if not correctly sized and placed on pumping mains, can lead to destructive effects during negative transients [9]. Moreover, the usage of air valves only on pumping mains for protection against negative transients can fail to reach the required efficiency especially for large-diameter pipes [11].
To allow for larger air volumes to enter the pipeline following pump trip transient, the one-way surge tank can be used. It would effectively control negative transients by allowing atmospheric air to enter into the tank and push more water to enter the pipeline during negative transient wave, but would need a large height to prevent water spillage outside the tank during the positive transient wave making it an uneconomic solution. For a deep well pump group, ref. [12] studied the effect of one-way surge tank on pump trip negative transients and found that a combination of one-way surge tank and multiple air valves would be needed and would only be effective in small flow systems [12].
Surge vessels can be the efficient solution to protect pipelines from these transients. They can effectively alleviate negative transients in addition to reduction of positive transients in pumping mains [5]. Ref. [13] studied transients generated on a rising pump main due to pump failure. They used the rigid column theory and developed design charts for initial air volume of surge vessels. Adding differential orifice plates to the surge vessel, ref. [14] proposed design charts for initial air volume with reduced size compared to those provided by [13]. Other simpler charts for initial air volume were developed by [15] for the surge vessel on a rising pump main considering various diameters of the inlet and outlet tank connecting pipe. With the help of the artificial neural network, ref. [16] collected data from [13] charts and developed a model for the surge vessel initial air volume. The range of parameters used were not reported and surge vessel throttling was not included. Two approximate expressions for the calculation of pipeline pressure for quick sizing of surge vessel volume and orifice resistance were presented by [17]. However, all these models have many shortcomings, making them not applicable for even preliminary stages of surge vessel design [17]. They are based on the rigid column theory’s simplifying assumption and the De Sparre rule, which restricts their applicability. Many models have not considered pipe friction, which can impact the final size of the surge vessel. Furthermore, only the initial air volume could be predicted from any model; none of them offered the final expanded air volume. To optimize design of the surge vessel, ref. [18] used the sequential quadratic programming method for solution of transients following a pump trip. The optimization algorithms have been further developed and used by many researchers, compiled with numerical analyses to optimize surge vessel volume [19] and installation position on pipeline [20]. While there are many tank variables and hydraulic operating conditions, the optimization-numerical approach involves lots of calculations and is case specific, with no general formula to be applied easily in the planning phases of the project. Based on the incompressible flow theory and simple harmonic vibration model, an approximate formula for the optimal size of the air vessel was presented [21]. The formula did not include the pipeline diameter, despite being an important influential parameter on the size of the surge vessel, and the formula was tested on only one test case. Using evolutionary algorithms, a simple model was developed for the prediction of initial and final air volumes in a surge tank considering various pipe and operational conditions [22]. The developed formulae are easy to apply and have been developed based on thousands of generated numerical pump failure cases. Based on the Krylov–Mitropolsky method, an analytical mode for the water level oscillations in the surge vessel was developed [23]. They used the developed model for optimal volume selection of the air vessel and used two practical cases for testing. An intelligent self-controlled surge tank was developed, including a damper to reduce required volume of normal surge tank [24]. The damper adjusted flow depending on the differential pressure on both sides of the connector; this helped more flow volume to be pushed out of the vessel at higher rates in case of pump trips. In addition to the importance of surge vessel size in protection against pump tri negative transients, the location of the surge vessel on the pump main was reported to have an influence on the pressure waves’ amplitude [21].
In addition to the above-mentioned shortcomings, none of the available models has addressed low-head pumping profiles. In surge protection design, a low-head profile is deemed as a challenge for hydraulic engineers especially in pump failure events. A low static head makes the pipeline prone to more severe negative pressure surges that require a quick supply of water from the surge vessel to compensate for the generated sub-atmospheric pressure regions. This means that the initial compressed air volume in the surge tank has to be substantially more than in vessels installed on steep profiles so that when expanded, it will deliver the required volume of water with adequate energy. These models produce huge surge vessels with uneconomical volumes on low-head pumping mains, reaching 1000 cubic meters in some cases. Bladder surge vessels have been proposed to provide quite economical surge vessels for these low-head profiles. However, the vessel did not provide the required economical volumes (even if they are less than standard surge vessels) in addition to the imposed risk of connection pipe obstruction when used in sewage systems [22].
Charlatte [25] filed a patent for a self-regulating water hammer protection wastewater tank (ARAA). The new tank has a central ventilation tube or dipping tube, providing more economical vessel volumes and requiring less maintenance than bladder vessels. This hybrid surge vessel combines the principle of operations of a standard surge vessel, an open-vented surge vessel, and an air valve during the operation cycle and thus is called, in this work, a hybrid vessel. The general principles and working scheme of the AARA-vessel was presented as an effective solution for the negative surges following pump trip [26]. They provided a couple of practical field applications to support their study analyses. Ref. [27] presented design charts for surge pressure rise in pipe lines with pump failure and check valve closure cases. They were concerned about the process rather than the surge device installation and only studied the effect of friction and pump characteristics on the surge pressure. However, they were the first to provide charts that are directed only to low head pump lines, though they did not mention a clear description or physical range for a low head line. When presenting guidelines for choosing the transient control devices, the hybrid vessel with a dipping tube was included and a brief description was given in [28]. However, no further analysis was performed on the dipping tube tank in their work and no guidelines for where to use such device was provided. A surge study was performed for a 250 km pipeline, diameter 1.6 m, from the Shuweihat desalination plant [29]. They reported that the pipeline profile was flat with few local high points, and that this resulted in excessive negative transients. To control them, Deltares presented an innovative vertical air vessel equipped with a passive air release valve installed on the air vessel. It was referred to as a hybrid air vessel and a hydraulic model was described; a cost saving of 50% was reported using the hybrid vessel. They were the only study that mentioned that normal surge vessels would be not economic for flat profiles, but they did not give any clear numerical model for the vessel, nor did they define a definition of flat profiles, where the hybrid vessel would be useful. Refs. [30,31] stated that the hybrid vessel with a dipping tube would be the most efficient solution for protection of long pipe lines following a pump failure. They presented a simple, yet comprehensive, internal boundary conditions for the dipping tube vessel based on hydraulic characteristics of the dipping tube and how they would interact with existing equations for surge vessel. Their model was developed in the context of the Method of Characteristics and could enable the correct sizing of the dipping tube vessel. A combination of air chamber and air-inlet valves is studied to optimize transient protection [32]. This combined method obtained the best protective scheme where transient pressures are maintained in a safe standard while minimizing the protection cost. Recently, an air chamber with an adjustable standpipe tank was proposed [33]. A simple numerical study was performed, and a new tank was compared to surge vessel, but the study reported the need for a larger volume novel tank when compared to a normal surge vessel and recommended more research work on tank parameters and their impact on surge protection.
While a considerable amount of research work for sizing surge vessels and other protection devices on pumping mains has been made, the hybrid vessel with a dipping tube lacks similar research. To the authors’ knowledge, no research has addressed the sizing of the hybrid vessel with a dipping tube. There are no available practical ranges for the hybrid surge vessel initial gas volume, compression chamber volume, and ventilation tube length/diameter. There is no clear definition and limiting range of pump main physical and operational parameters that define a low-head profile, where the hybrid vessel with dipping tube would be best suited for. This would be beneficial to hydraulic practical engineers, especially because the hybrid vessel with a dipping tube has been included in some commercial water network design software [34].
The primary goal of this work is to contribute to the literature a hybrid surge vessel with a dipping tube on pump mains. In addition, this study seeks to create a new, rough approximation model that will allow for the prediction of the ideal hybrid surge vessel size for the protection of low-head pumping mains in the event of a pump failure. This will be achieved by: (i) providing in-depth analysis on the operation concept of the hybrid surge vessel in protection of pumping mains against pump failures, (ii) providing practical ranges for low-head profiles where a hybrid surge vessel would be more economical to use than standard surge vessels, (iii) providing practical ranges for correct sizing of vessel components, such as ventilation tube, inlet/outlet air valves, and compression chamber, and (iv) developing simple straight forward relations that can calculate the initial air volume, expanded air volume, and the compression chamber volume for the hybrid vessel. The developed model enables the practical usage of hybrid surge vessels on low-head pumping mains and thus overcomes the economic limitations of using standard surge vessels. Moreover, they would be easily adopted by non-experienced users for preliminary choice and sizing of hybrid vessels when compared to complex commercial software that need many iterations and experienced users.
To develop model, random inputs covering a variety of pumping scenarios are generated using Monte Carlo simulation (MCS) as a tool for stochastic analysis in combination with the numerical solution using the Method of Characteristics. Prediction models for the initial air volume, final tank volume, and compression chamber volume are developed using genetic programming (GP). Statistics are used to evaluate and compare the generated genetic programming models to the classical existing design charts. Error analysis is carried out to verify the predicted uncertainties with additional quantification. In addition, parametric analysis is used to verify the physical trends of new model predictions.

Hybrid Surge Vessels

In a pump failure, the surge vessel is regarded as the most effective method of controlling created transients. It can prevent negative transients and minimize the effect of positive transients. When a pump fails, the hydraulic grade line (HGL) drops suddenly below the pipe centerline, creating a region in the liquid with sub-atmospheric pressure. Starting at the upstream pipeline, this created negative pressure wave moves continuously downstream until dampened. The initial negative peak can result in the worst hydraulic condition for the pipe. with the formation of vapor cavities leading to column separations in case pressure drops to the liquid vapor pressure. To compensate for the negative pressure transient and to maintain the positive momentum of the water flowing downstream of the pipe, compressed air in the surge vessel pushes the water out to the pipeline. In addition to the pipeline friction and initial static head, the action of the surge vessel also reduces additional pressure oscillations. The initial drop in the hydraulic grade line following pump failure will be more severe for low-head pipeline profiles than in typical rising profiles because of the low static head, which increases the likelihood of column separation. Due to the low static head, the generated negative pressure wave is only damped by the pipeline friction with no resistance from the static head, leading to faster prolonged negative pressure oscillations. Using a surge vessel in this situation would require a very large vessel volume in order to provide the adequate amount of water to compensate for the pressure loss at the pump location and continuously decelerate the returning pressure wave. When water is forced into the pipeline, the vessel volume must be large enough to hold the full expanded air volume. Therefore, a hybrid surge vessel is recommended to be used in this situation for better performance and reasonably reduced vessel volume. The hybrid surge vessel with a ventilation tube is shown in Figure 1. The tank has a height of Htank and a diameter of Dtank. The central tube is used for ventilation and is termed, in the following work, as a dipping tube or ventilation tube. The ventilation tube has the height and diameter of Hdt and Ddt, respectively. The total vessel volume, t a n k , is equal to the initial compressed air volume, a i r o , in addition to the water volume below it. The compression chamber is the part of the vessel surrounding the central ventilation tube having the same diameter as the vessel and the height of the ventilation tube, and volume c c is equal to 0.25 π ( D t a n k 2 D d t 2 ) H d t . Air entry and exit to/from the ventilation tube is conducted through inlet and outlet air valves, as shown in the figure. The vacuum valve is equipped with a check valve to allow air only in the ventilation tube, while the release valve is smaller in diameter to let air out more slowly [30].
This is called a hybrid vessel since it combines the principles of operation of various protection devices during its operation cycle. When air is trapped in the compression chamber, it functions as a regular surge vessel, a vented surge vessel when the ventilation pipe’s float is open, and an air valve when all the water has been forced into the pipeline. When the pump main starts to fill, water enters the hybrid vessel, expelling air from the ventilation pipe while the float is still open. The level of water increases in the hybrid vessel until it reaches the bottom of the ventilation tube. Then, it continues to increase in the central ventilation pipe as the upper float is still open to the atmosphere. The air in the compression chamber is being compressed. When the rising water pushes the float to the upper limit of the central ventilation pipe, the shutoff valve is closed while the air in the compression chamber is being compressed until the system is balanced and water ceases to enter the hybrid vessel. Following pump failure, the compressed air at the top of the hybrid vessel pushes water to the pipeline until the elastic energy of the compressed gas is depleted. This is when all the water stored above the bottom of the ventilation tube has been delivered to the pipeline and the ventilation tube starts to empty and float open. From this instant, the vessel is opened to the atmosphere and water is delivered to the pipeline under constant atmospheric pressure. The water level continues to decrease until a low level is reached when the reverse pressure wave reaches the location of the vessel. The initial hydraulic grade line is reached following the damping of pressure oscillations by the cushioning effect in the hybrid vessel and pipe friction. Due to the recent application of the hybrid surge vessel in practical projects, there are no available practical ranges for the initial gas volume, compression chamber volume, and ventilation tube length/diameter.

2. Materials and Methods

2.1. Allowable Safe Pressure Limits

The maximum positive Hmax pressure surge has no generally accepted upper limit, notably in countries including the USA and England. Engineering standards and pipe material rating play a large role in regulating this restriction. However, some scholars proposed that the zero gauge pressure head limits the minimum pressure Hmin surge; others reported negative gauge pressures of −7 m, e.g., ref. [22]. Practice, however, showed that compared to the scenario of zero pressure head, a −3 m pressure head led to a significant reduction in vessel size with no impact on pipe integrity. To avoid the worst-case situation for the pipe, the surge vessel size is determined in this work to keep Hmax 40% above the steady-state hydraulic grade and to keep the pipe’s rated pressure from being exceeded. On the other hand, Hmin is restricted to a value of −3 m. These restrictions can be verified by looking at the calculated pressure profiles along the pipeline following a pump failure. The calculation of these transient profiles is briefly explained in the following section.

2.2. Numerical Modelling of Pressure Profile along the Pipeline

The one-dimensional continuity and momentum equations describing unsteady ideal flow in pipes are written as:
H x + 1 g A Q t = 0
Q x + g A a 2 H t = 0
where x = the distance along the pipe measured positive in the downstream direction (m); t = time step of solution (s); H = the piezometric head (m); Q = water flow in pipeline (m3/s); a = the wave speed (m/s); A = cross-sectional area of pipeline (m2); and g = the gravitational acceleration (m/s2).
Using the Method of Characteristics (MOC), the one-dimensional continuity and momentum equations for pipe transient flow can be written as follows along the +ve and −ve characteristics lines, respectively:
Q b t + Δ t + C a H b t + Δ t = Q a t + C a H a t R t Q a Q a t
Q a t + Δ t C a H a t + Δ t = Q b t C a H b t R t Q b Q b t
where a, b are any two arbitrary consecutive points along the solution grid along the pipe length; C a = g × A / a ; t denotes the time step at current values (s); while t + t denotes the following time step (s); R = f / 2 D A ; D = the pipe diameter (m); and f is the Darcy–Weisbach friction coefficient.
Modeling the hybrid surge vessel requires including the ventilation tube and the compression chamber in numerical simulations. The numerical model for the hybrid surge vessel was developed by [30,31]; equation from this study shall be adopted in this work. The continuity equation inside the hybrid vessel can be described as the summation of flows of the dipping tube and the compression chamber:
Q s = Q d t + Q c c
where Q c c = water flow inside hybrid vessel to/from compression chamber (m3/s); Q d t = water flow inside hybrid vessel to/from dipping tube (m3/s); and Q s = water flow to and from the hybrid vessel (m3/s). The air pressure inside the hybrid vessel can be written as:
H a i r = H + H b a r Z s h l o s s
H a i r = air pressure inside the hybrid surge vessel (m); Z s = the water height in the vessel (m); Hbar = atmospheric head (m); H = the piezometric head inside hybrid vessel (m); and h l o s s = losses of flow through vessel connecting pipe (m), and defined as h l o s s = C l o s s Q s Q s , and Closs = loss coefficient. The air mass flow rate inside the hybrid vessel is written as [30]:
Q m = 0.6 ρ o A o r v m a x 1 H a i r / H b a r 1 1 / n 0.5
where Q m = mass flow rate of air inside hybrid tank (kg/s); ρ o = air density at atmospheric pressure (kg/m3); A o r = the cross-sectional area of the air in/out flow orifice (m2); n = polytropic gas equation exponent; and v m a x = the maximum air velocity through air orifice and defined as [30]:
v m a x = 2 n H a i r / n 1 ρ o 0.5
The variations in the air volume a i r in the hybrid vessel during the transient event can be written as follows:
a i r t + Δ t = a i r t 0.5 Δ t Q s t + Δ t Q s t
where a i r = volume of the air enclosed in the hybrid surge vessel (m3); and Δ t = solution time step (sec.).
Modeling the behavior of the hybrid surge vessel requires the knowledge of the water level inside the vessel concerning the ventilation tube bottom level, Z d p [30]. When the water level is in the middle of the ventilation tube, Qs can be calculated as follows:
Q s t + Δ t = 2 Δ t a i r t d t + a i r t c c H b a r H a i r t + Δ t c c a i r t c c A t a n k A d t + a i r t d t A d t 1 / n m d t t 0.5 Δ t Q m t + Δ t Q m t d t ρ o H b a r H a i r t + Δ t c c 1 / n a i r t + Δ t c c Q s t
Otherwise, when the water level is below the ventilation tube bottom, Qs can be calculated as follows:
Q s t + Δ t = 2 Δ t a i r t t a n k H b a r H a i r t + Δ t 1 / n m t 0.5 Δ t Q m t + Δ t Q m t ρ o Q s t
where A t a n k = the cross-sectional area of the hybrid tank (m2); A d t = cross-sectional area of the dipping tube (m2); ρ o = air density at atmospheric pressure (kg/m3); m = mass of air inside the hybrid surge vessel (kg); m d t t = mass of air inside the dipping tube (kg); Q m t + Δ t = mass flow rate of air inside hybrid tank (kg/s); and n = polytropic gas equation exponent with value of 1.2 assuming the contained air in the tank satisfies the polytropic equation for a perfect gas.
The hybrid surge vessel is connected to the pipeline downstream pump discharge. Since the pipe on the suction side of the pump is expected to be short, it is not considered in the study. The hybrid surge vessel is modelled, inside the method of characteristics, as an internal boundary condition with the following equations at the location of the vessel:
Q a t + Δ t = Q b t + Δ t + Q s t + Δ t
H a t + Δ t = H b t + Δ t
where H a , b is the piezometric head along pipeline just before and after hybrid vessel (m) and Q a , b is the water flow in pipeline just before and after the hybrid vessel (m3/s).
The rate at which the pump decelerates after losing power primarily depends on the rotational speed and inertia of the pump. The sum of the inertias, I t o t , of the rotating components of the pump is determined by [35]:
I t o t = I m o t o r + I p u m p   i m p e l l e r = 118 P N 1.48 + 1.5 × 10 7 P N 3 0.955
where I = inertia (N-m2); N = the speed of the pump rotation (rpm), with an average value of 1500 rpm for wind range of centrifugal pumps; and P = pump power (KW) given by the following:
P = ρ g Q H p u m p 3.6 × 10 6 η
where η = total efficiency with average value of 0.85, and Q = flow rate (m3/h); H p u m p = pump head at operating point (m). Pump operation in different zones is represented using the four-quadrant as follow:
N s = N Q H p u m p 3 / 4
where Q is pump flow at operating point (L/s). The pump and the surge vessel boundary conditions are numerically solved using the MOC [22,35], and the air volume and water level fluctuations inside the hybrid vessel are modelled as developed by [30,31].

2.3. Hybrid Surge Vessel Optimum Sizing Approach

Using the above equations and boundary conditions, the water hammer problem in pumping mains is solved numerically for: the expanded volume of the air a i r f , the volume of the compression chamber c c , and eventually the total volume of the hybrid surge vessel t a n k . The maximum and minimum permitted pressure surges are identified and an iterative approach is used to optimize the solution within those bounds. In every iteration, the numerical model is solved using the Method of Characteristics for the transient pressure wave along the pipeline. In other words, given a series of model inputs, the results (volume of compression chamber, initial volume of air, and final tank volume) are uniquely determined. This deterministic case covers only a unique pipeline profile with related hydraulic characteristics.
However, to create enough data that describe the process of hybrid surge vessel operation during the protection cycle, a broad range of input pipeline and pump parameters with diverse random combinations would be required. Thus, in this study, a stochastic technique utilizing the Monte Carlo Simulations is used to propagate input parameter uncertainty via the numerical model in order to predict the associated volumes of the hybrid surge vessel. The framework of surge attenuation and control in a hybrid surge vessel using stochastic Method of Characteristics as shown in Figure 2:
  • A uniform probability distribution is allocated to input parameters for sampling within predetermined realistic ranges.
  • According to a predetermined number of Monte Carlo Simulations, random samples are taken from input parameters’ distribution.
  • For each stochastic run, which is a different pipeline profile and hydraulic situation, combinations of random variables are inserted into the numerical model, which is then solved deterministically for the pressure change throughout the pipeline. In order to optimize the volume of the hybrid surge vessel, each deterministic run is repeated through numerous iterations.
  • The least-square linearization (LSL) method is used to determine the lowest influencing input parameters, which may be eliminated without affecting accuracy, using the result of the Method of Characteristic in the previous phase using the parameter coefficient of sensitivity, S V i :
    S V i = 100 × w i 2 σ v i 2 i = 1 n w i 2 σ v i 2
    where wi is the coefficient of regression, v i = v i m v i , difference between parameter and mean, and σ δ v i 2 is the variance of v i .
  • Then, an approximation relation can be generated using machine learning utilizing generated matrices with random parameters and the associated optimal vessel volume.

2.4. Sizing Predictive Model Development

The required volumes can be obtained in a simple relation as a function of the related input parameters generated by the Monte Carlo Simulation and the Least-square linearization, MCS/LSL. In many hydraulic engineering applications, genetic programming (GP) has outperformed other machine learning techniques such as artificial neural networks (ANN). It has shown its superiority in predicting complex relations between parameters using simple equations. The genetic programming code developed by [36] is utilized in this study. According to Table 1, the genetic programming developed model is evaluated based on a set of performance metrics.

3. Results and Discussions

3.1. Model Setup—Deterministic Run

As previously mentioned, a single deterministic run for the hybrid surge vessel’s volume is an optimization process that involves repeatedly solving the water hammer equations until the ideal size is determined per predetermined pressure constraints. A schematic of a typical pumping problem with a flat profile and a downstream reservoir is shown in Figure 3. The steady state pump head Hpump, is the summation of the pipeline static head Hs, and the pipe friction loss head, Hf. The hybrid surge vessel is placed shortly after the pump. A hypothetical case is considered for a low-head profile and governing down surge, with the following data; a = 750 m/s, v = 1.5 m/s, L = 3000 m, D = 1.0 m, Hs = 5 m, f = 0.015, Dcon = 0.75 m, and n =1.2. As discussed before, in low-head profiles, the negative pressure surge governs the hybrid surge vessel’s optimization process is presented with Hmin equal to −5.2 m following a sudden pump failure without surge protection.
The vessel connecting pipe is throttled be decreasing its diameter compared to the main pipe diameter with a recommended ratio of 70%. On the other hand, there would be no need to throttle the inflow to the vessel, which would not affect vessel size in limiting negative transients in low-head pipelines.
Sizing of the hybrid surge vessel starts with assuming a normal closed surge vessel without a ventilation tube, where the initial air volume a i r o , and expanded air volume a i r f , and the final tank volume t a n k can be calculated using the model developed in [22]:
a i r o = 0.11 D c o n / D 3 v 0.11 D 2.38 ( L / H s ) 0.20 f 1
a i r f = 1.2 a i r o ( L / H s ) 0.08
where a i r o = initial volume of air in hybrid vessel before transient event (m3); a i r f = maximum expanded air volume in the hybrid vessel (m3); D c o n = diameter of hybrid vessel connecting pipe (m); L = pipeline length (m); H s = static head (m); and v = steady flow velocity in pipelines (m/s).

3.2. Hybrid Surge Vessel Sizing

The hybrid surge vessel reduces volume compared to the normal surge vessel in cases of down surge transients. From the authors’ practical experience and thousands of numerical simulations, the reduction in volume would be in the range of 10% to 50% depending on the specific case parameters. Therefore, an excellent initial guess for the volume of the hybrid surge vessel, t a n k , would be 70% of the volume calculated from Equation (19). Work in this paper shall follow [25] commercial ARRA-hybrid vessel size, which is limited to 35 m3 per vessel. Larger vessels would be possible; however, they would be custom made and this would affect hybrid vessel choice from an economical point of view. Thus, the number of hybrid vessels, N t a n k s , for a specific case shall be calculated from the following relation:
N t a n k s = 1 if   t a n k 35 m 3 t a n k / 2   if   35 m 3 < t a n k 70 m 3 t a n k / 3   if   70 m 3 < t a n k 105 m 3
Afterwards, the hybrid tank diameter,   D t a n k , and height, H t a n k , can be determined such that D t a n k = 0.0651 t a n k + 1 3 m . The diameter of the dipping tube is calculated as D d t = 0.15 D t a n k with a minimum value of 0.20 m to avoid small unreasonable tube diameters in case of small vessels. On top of the central ventilation tube, air release and vacuum valves are installed with diameters of 0.050 m and 0.080 m, respectively. Similar to the standard surge vessel, the numerical solution of the water hammer equations with surge protection commences with the assumption of the initial air volume a i r o . In the hybrid surge vessel, additional vital parameters to be set before a solution are the total tank volume t a n k and the volume of the compression chamber c c . From authors’ experience, a i r o 0.2 t a n k and c c 0.2 0.5 t a n k a i r o can be used as initial guesses. The height of the dipping tube can be directly calculated from the compression chamber volume. Table 2 shows iterations used to reach the economical hybrid vessel volume that satisfies the maximum positive and negative pressure head limits: H m a x 1.4 H p u m p and H m i n 3 m, respectively. In this study, an optimum solution a i r f in each deterministic run was calculated in 6 to 12 iterations. If a i r f t a n k , then the tank would be emptied and air would enter the pipeline causing cavitation, which is not a desirable hydraulic condition. In this case, we need a bigger tank volume. If a i r f < t a n k and the pressure limits are satisfied, then tank volume can be decreased and optimized more, as shown in the table. This optimization and reduction in the size of the hybrid vessel would have the stop condition of t a n k = 1.10 a i r f to ensure the tank is always filled with water. In this example run, the volume of the hybrid vessel is reduced from 35 m3 with t a n k / a i r f = 1.48 to an optimum value of 23 m3 with t a n k / a i r f = 1.11 through 10 iterations. For protection against negative pressure surges, water is pushed from the hybrid vessel with high rate to compensate for sub-atmospheric pressure in the pipeline and the atmospheric air enters the vessel when the water level in the vessel drops below the dipping tube bottom. Thus, the final expanded air volume, a i r f = 20.5 m 3, which is around 10 times the initial air volume inside the vessel, is a i r o =1.8 m3. The atmospheric pressure compensated for most of this expanded volume through the ventilation tube.
In the above case, two hybrid tanks were required to protect the pump main from down surge pressure, considering the size constraint set in Equation (20). When using multiple hybrid tanks for protection against down surge, their hydraulic operation must be identical so that each would supply the same volume of water to the pipeline and reach the same expanded air volume, a i r f , in the vessel at the same time instance. This requires that the height of all tanks, H t a n k , and the ventilation tube bottom level, Z d p , are the same. Accordingly, the multiple tank operation shall be identical to having a single tank with a summation of their volumes. Table 3 shows the initial expanded air and tank volumes for two hypothetical cases in the case of using one big hybrid tank versus multiple tanks for protection. Case one; a = 750 m/s, v = 2 m/s, L = 4000 m, D = 0.90 m, Hs = 6.5 m, f = 0.015, Dcon = 0.65 m, and n =1.2. Case two; a = 750 m/s, v = 2.25 m/s, L = 5000 m, D = 1.0 m, Hs = 10 m, f = 0.014, Dcon = 0.85 m, and n =1.2. The tank height is considered 4.3 m constant for one big tank and multiple small tanks, and the ventilation tube bottom is constant for all tanks. It is observed that the final expanded air volume in all tanks is the same, and their summation is equal to the expanded air volume for one big tank, with a minor difference of 1%.

3.3. Hybrid Surge Vessel Versus Standard Surge Vessel

To study the hydraulic performance of the hybrid tank versus that of the surge tank, the previous down surge case is considered with the protection of each tank. The needed final surge vessel volume was 102 m3, while the hybrid vessel volume was smaller by 30%, with t a n k = 70 m3. Figure 4 shows the changes in air volume inside the normal and hybrid surge vessels during a protection cycle following a down surge caused by pump failure. The hybrid tank’s economic size is attributed mainly to the much smaller initial air volume required, which is 4 m3, compared to the surge tank, which requires an initial air volume of 50 m3. Accordingly, the expanded air volume reached 40 m3 in the hybrid vessel and a larger value of 91 m3 in the surge vessel. In the surge vessel, compensation for low pressure in the pipeline depends mainly on the initial air volume inside the vessel before the surge event, which would push water from the tank to the pipeline with the required volume. The hybrid tank works by the same principle of pushing water to the pipeline, but the ventilation tube would allow the atmospheric pressure to support releasing water from the tank when the water level drops below the compression chamber level. It is to be noted that the efficiency of the hybrid vessel is shown in the expanded air volume that reached 10 times the initial air volume, while it reached only 1.8 times in the surge vessel. However, the amount of water supplied to the pipeline, Qs, during the first peak of the negative pressure wave for both tanks are the same. It can be calculated from Figure 4 as the difference between the final expanded air volume and the initial air volume, which has an average value of 38 m3. This is also shown in Figure 5, which demonstrates the water flow from the vessel to the pipeline during the transient protection case. Fluctuations of water flow from and to the pipeline are lower in the case of a hybrid vessel than the surge vessel, as shown in Figure 5, and as supported by vessel air volume fluctuations in Figure 4.
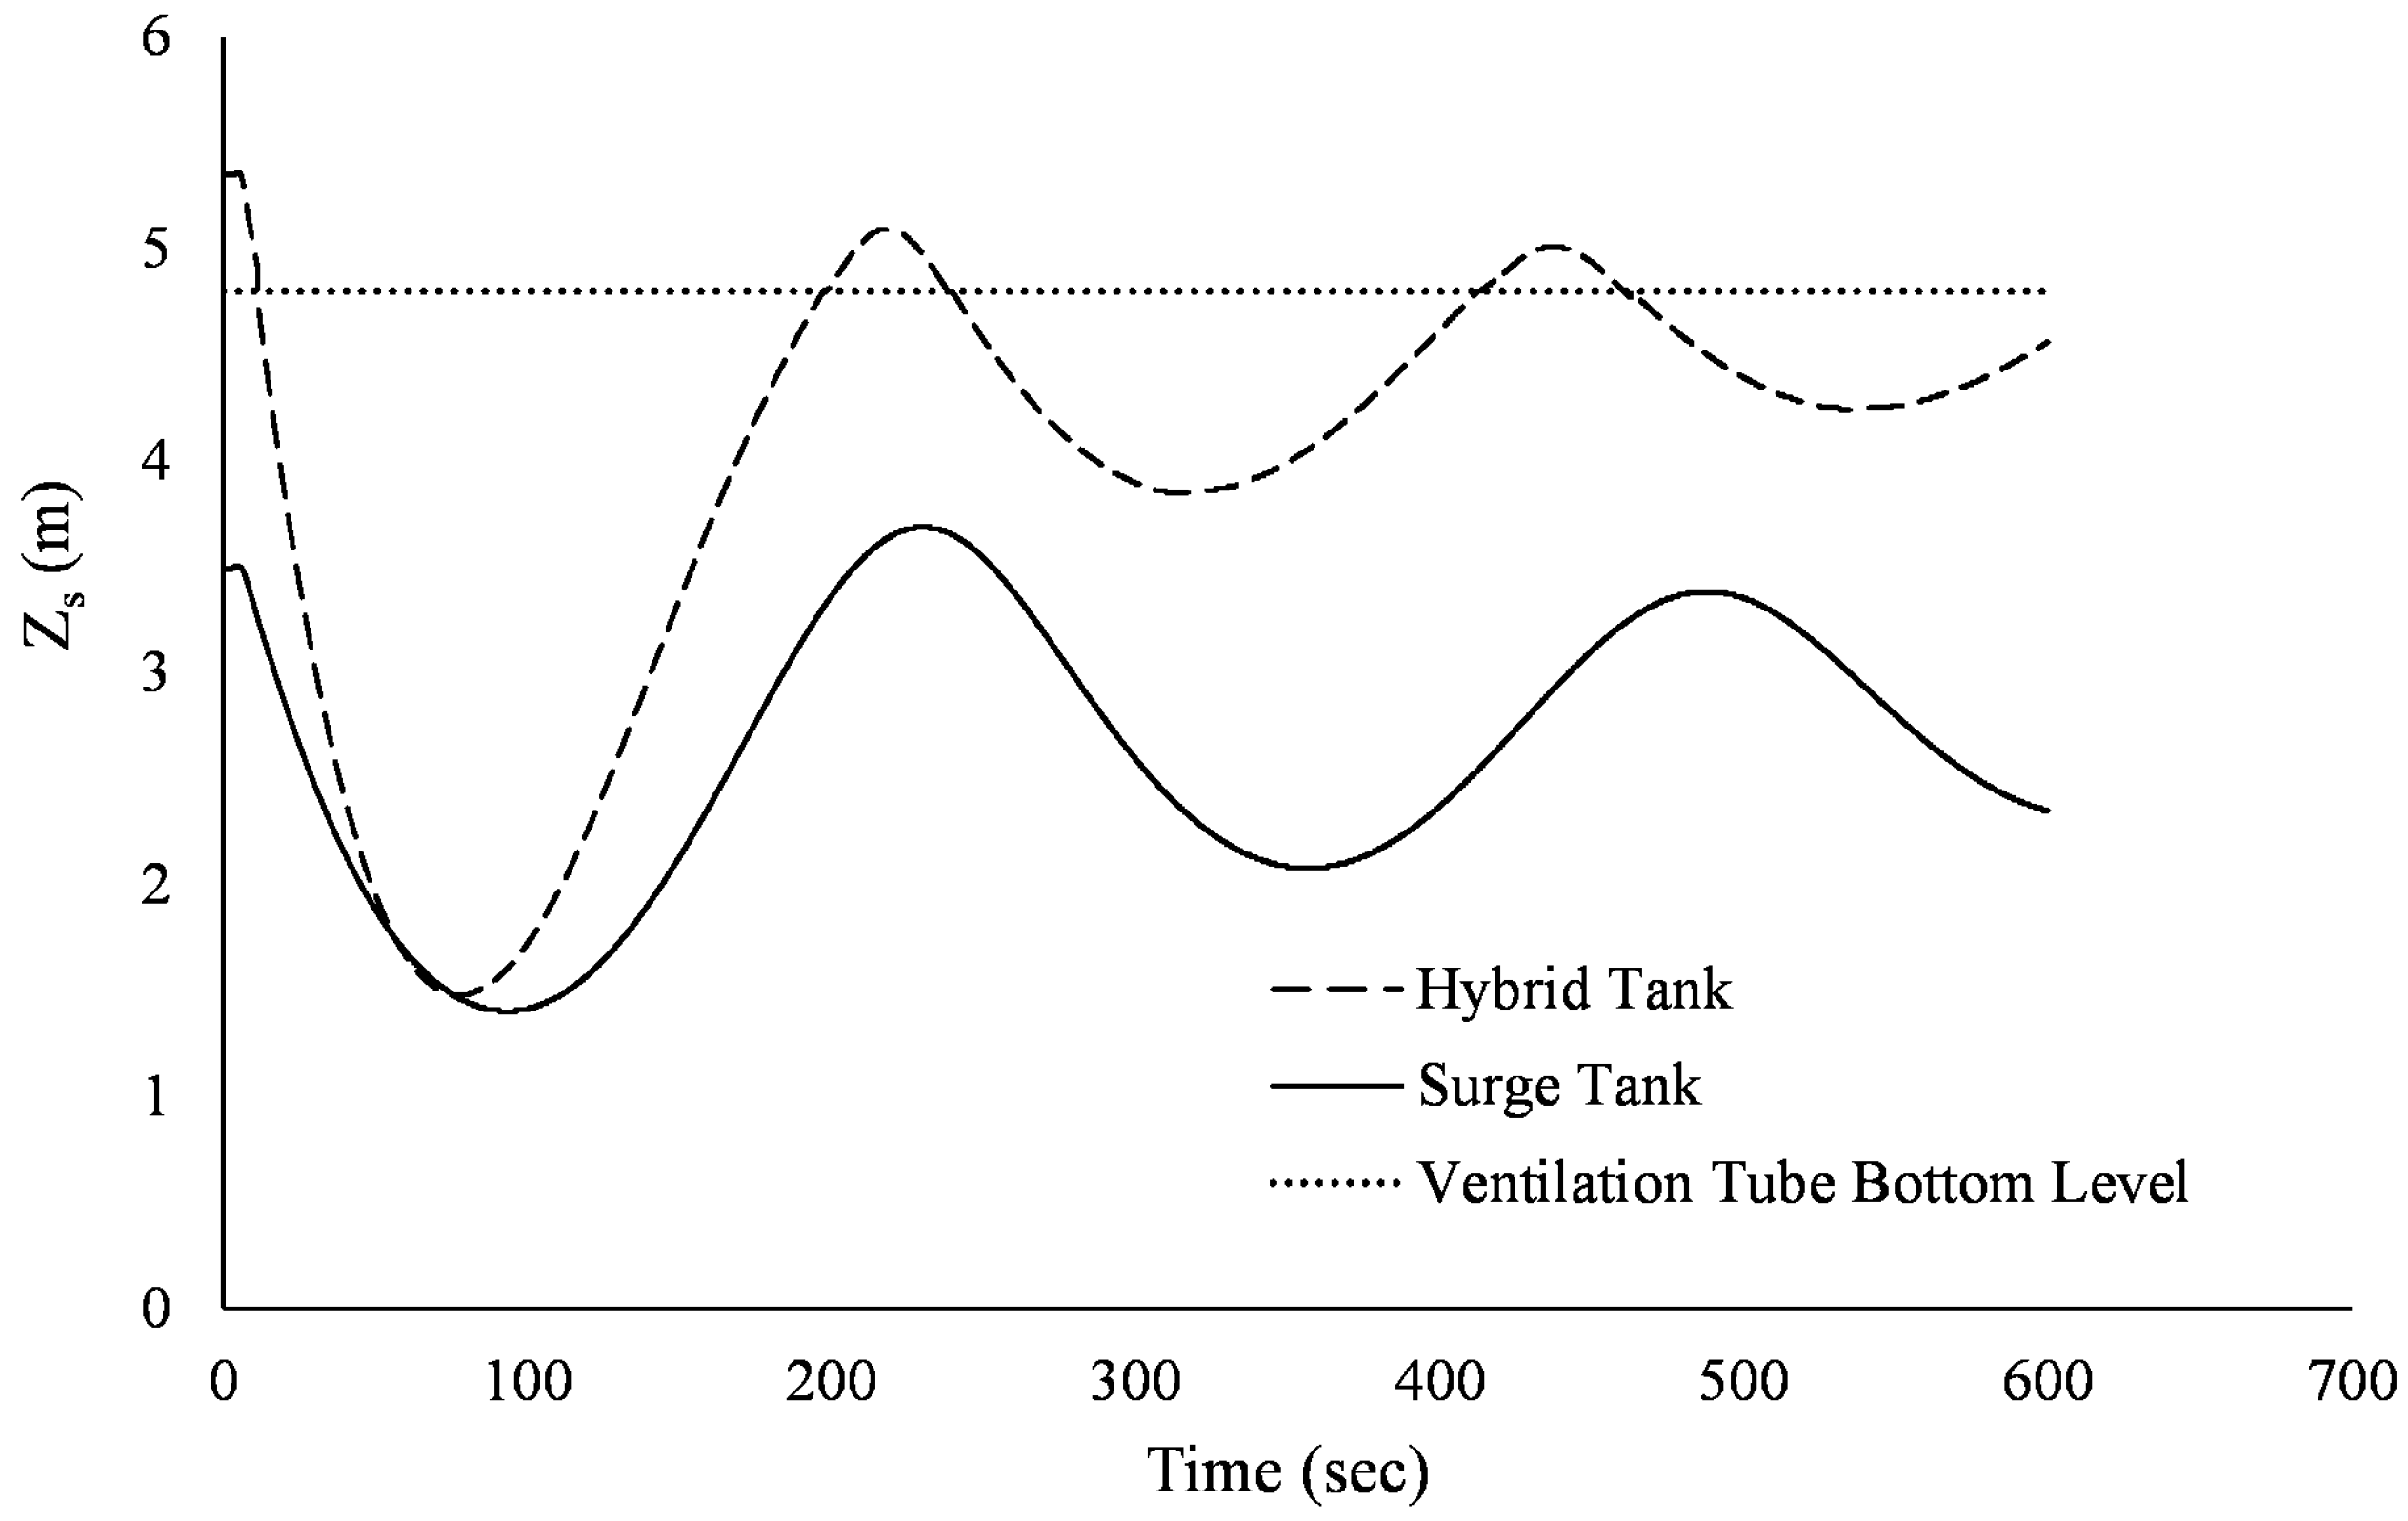
Water level fluctuations inside the hybrid and surge vessels during surge protection are shown in Figure 6. Both tanks are designed to have a 10–15% margin of volume safety so that water would not be emptied during a surge event. Therefore, during the first peak of the negative wave, the maximum drop of the water in both tanks is close for both tanks at an average level of +1.5 m, which is higher than the bottom level of tanks by +0.5 m. Considering the initial water level in both tanks, the relative water level fluctuations are similar. During the complete negative transient event, the hybrid vessel has been working as a vented vessel, where the water level in the hybrid vessel was below the compression chamber’s lower level of +4.90 m. The compression chamber contained water inside the vessel at high pressure instances of the reflecting negative transient wave.
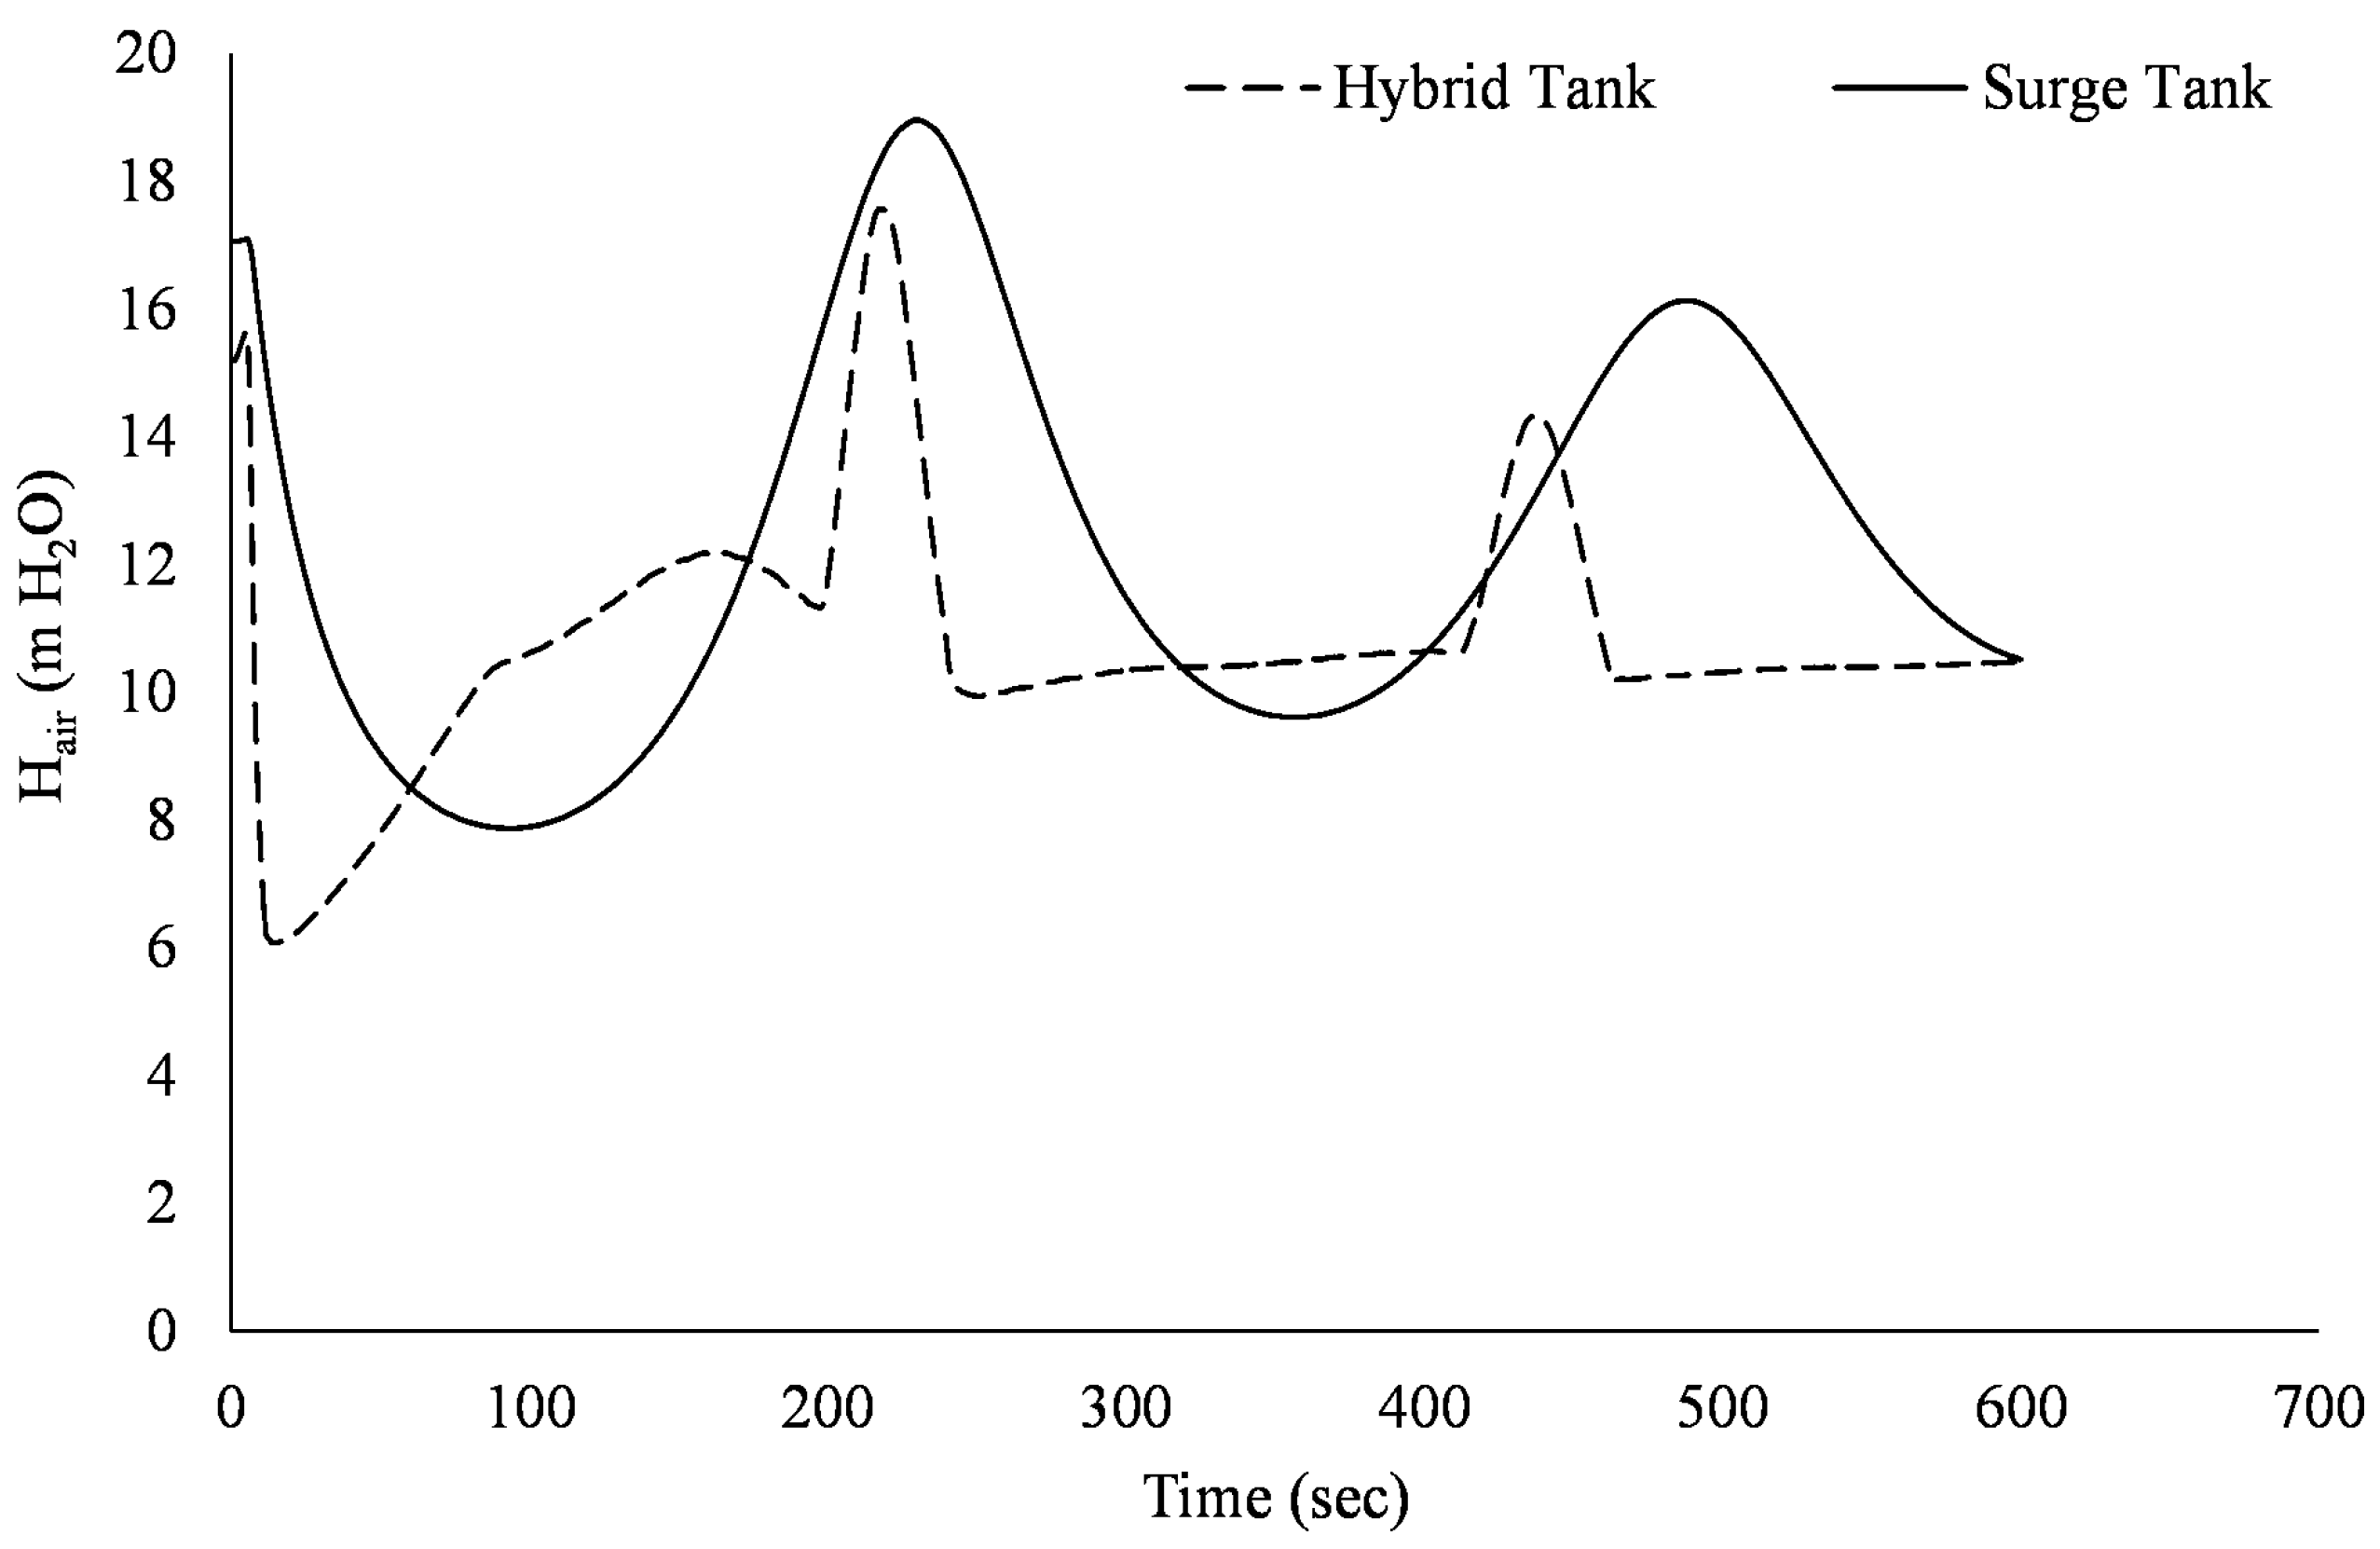
Figure 7 shows the air pressure variations inside hybrid and surge vessels, calculated in m H2O. Initially, both tanks’ water level and air pressure above water is maintained by the steady-state hydraulic grade line of the pump main. Thus, the air pressure inside the two tanks is equal, with a slight difference of 2 m accounting for the difference in water level between the two tanks. After a pump fails and down surge waves are created, both tanks release water into the pipeline, which lowers the air pressure inside the tanks.
The drop is faster in the case of the hybrid vessel and reaches a low air pressure value of 6 m H2O following operation of the vented tube, while this drop is gradual in the case of the surge vessel with a longer time span. The fast drop in air pressure in the hybrid vessel is due to the smaller initial air volume [31]. It is observed that the air pressure inside the hybrid vessel vacuum valve maintained an atmospheric value of 10 m H2O during the whole down surge following the initial drop, except when water level inside the hybrid vessel passed the ventilation tube bottom, as seen in Figure 6. The compression chamber is closed by water below it, the air is pressurized above atmospheric value, and the air release valve in the ventilation tube works to maintain air pressure in the tube as the air pressure in the compression chamber.
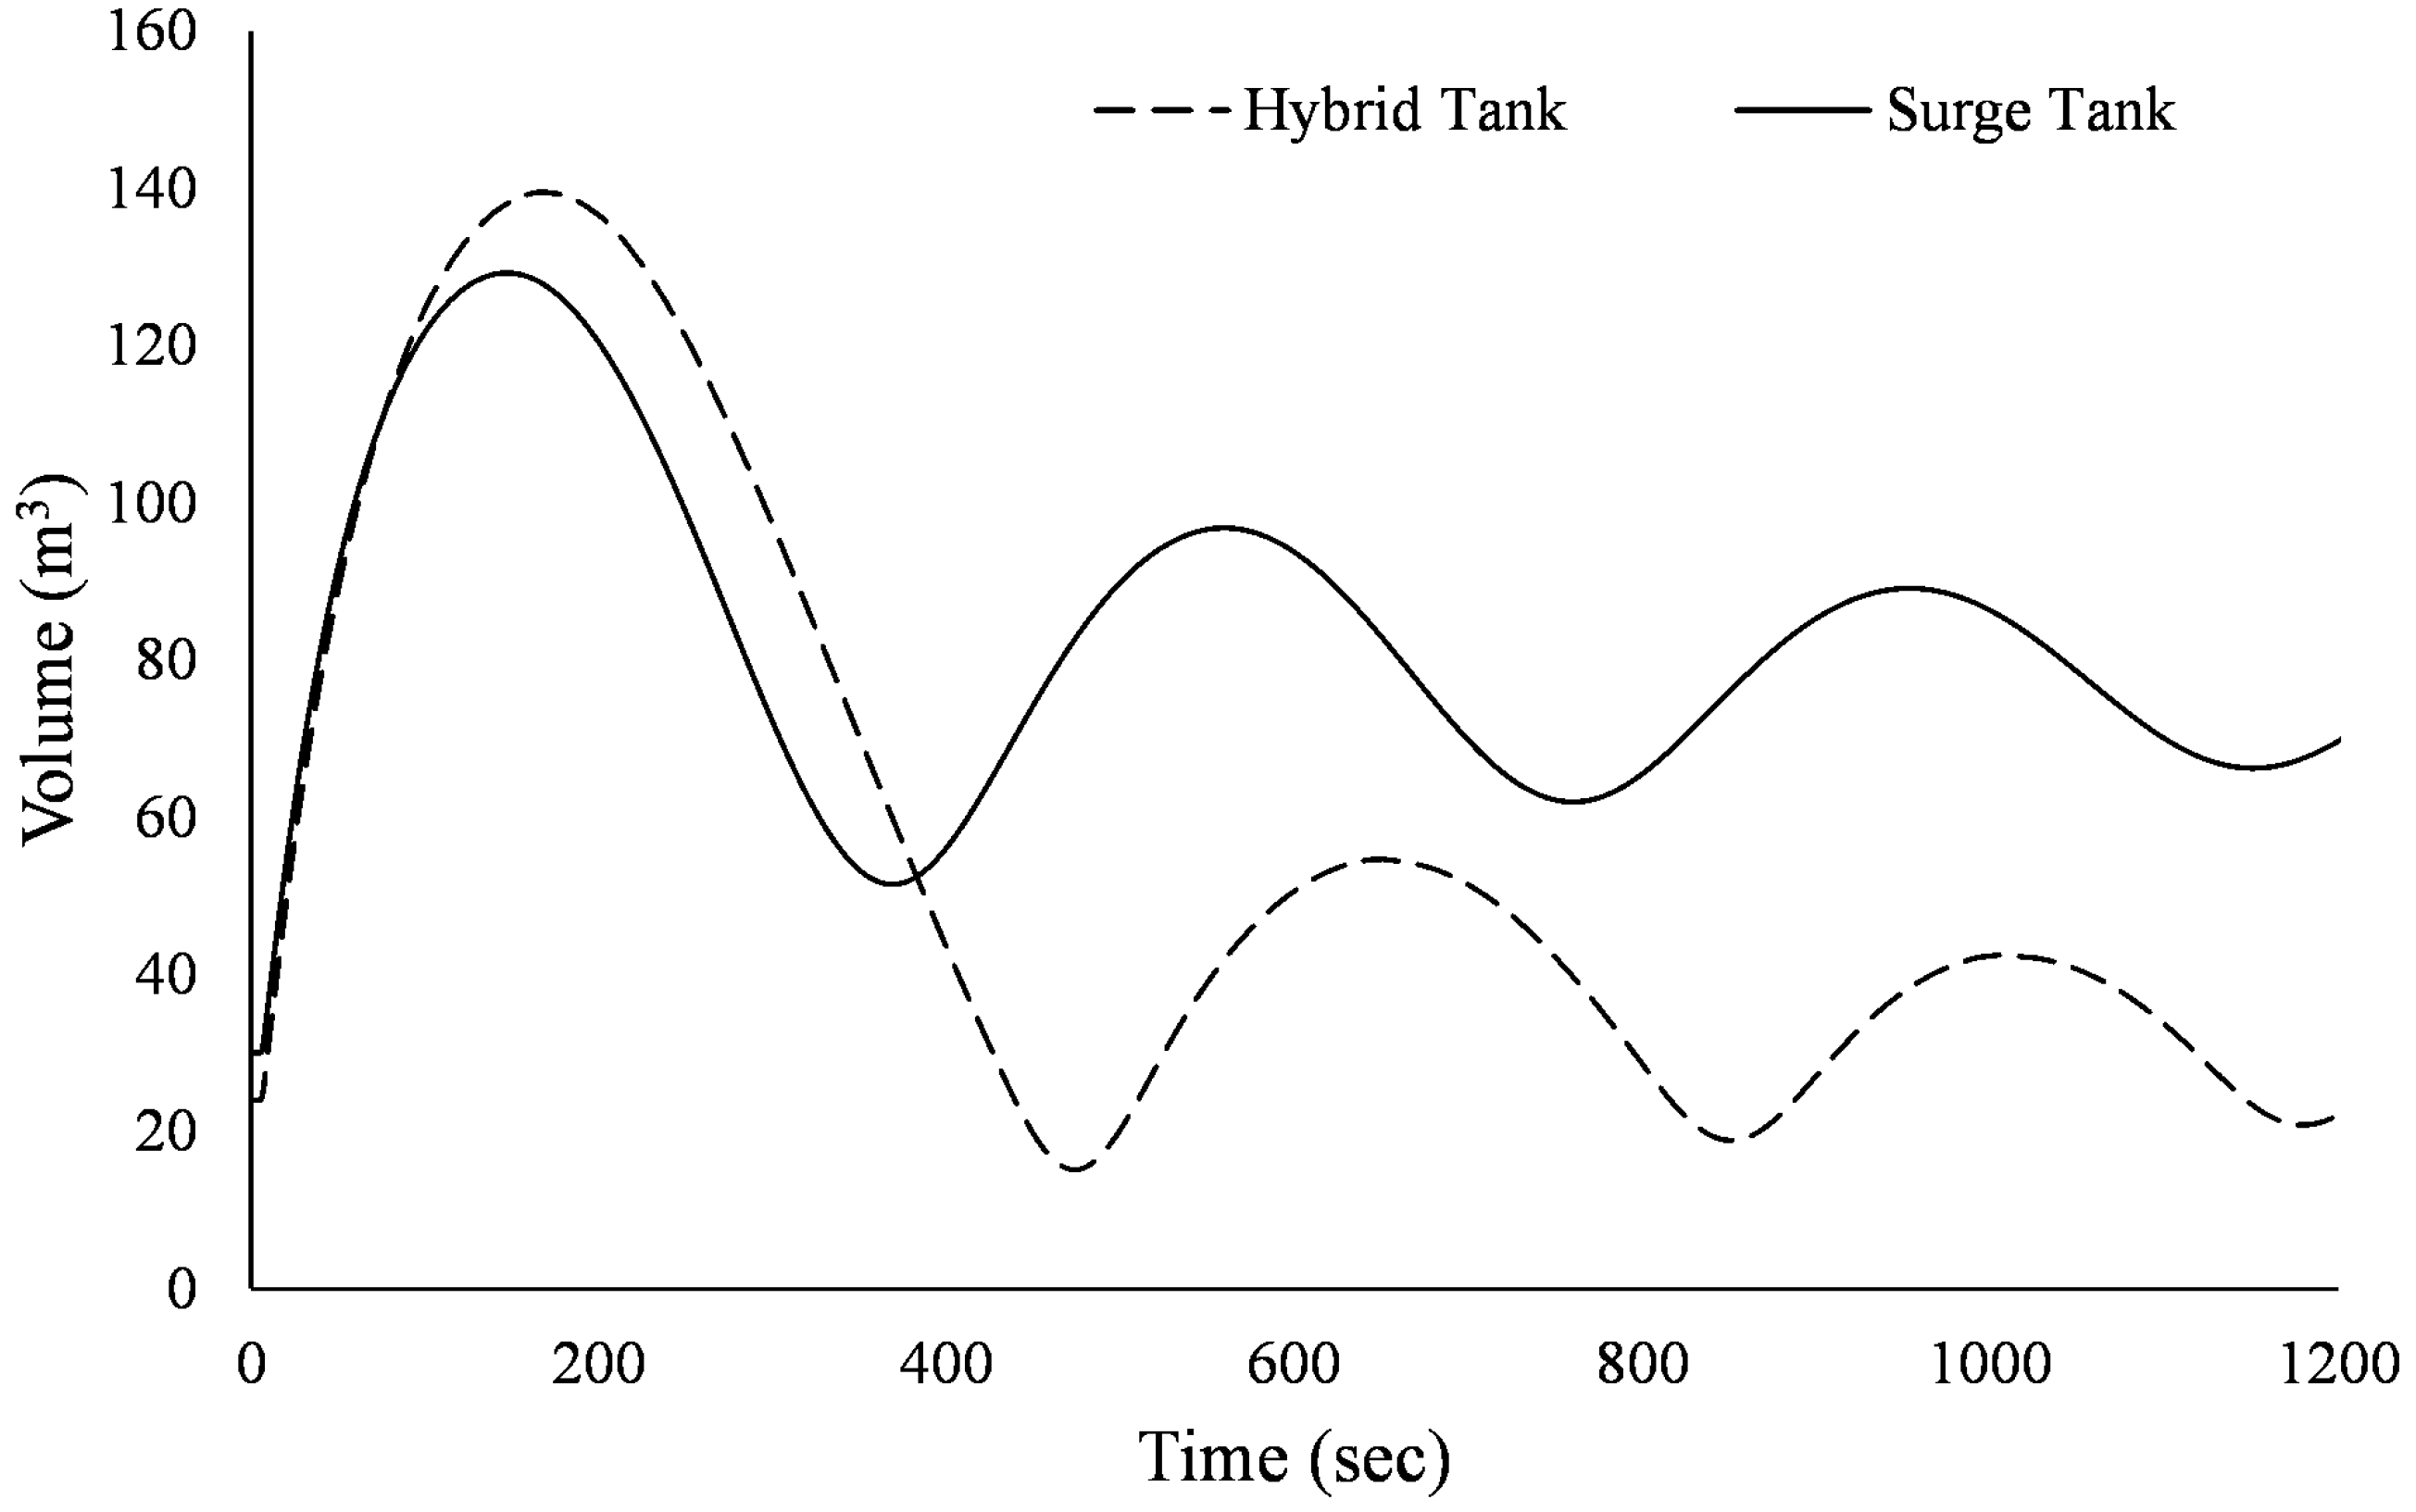
As discussed, the ventilation tube allows the hybrid surge vessel to effectively compensate for negative pressure in low-head pipelines using minimum initial air volume compared to a normal surge vessel. Thus, lower total vessel volume would be needed as shown in a previous case, in which the hybrid vessel’s initial air volume was 4 m3 and the surge vessel initial air volume was 50 m3. However, in some low-head pipelines, the initial air volume required for down surge protection in the normal surge vessel would be close to that required in the hybrid surge vessel. In these cases, the expanded air volumes for the two vessels would be similar, implying similar tank volumes and, in some cases, larger hybrid vessel volumes. This can be observed in Figure 8, which shows the variation in air volume inside a normal and hybrid surge vessel. The pump failure case parameters are: a = 1000 m/s, v = 2.5 m/s, L = 6000 m, D = 1.0 m, Hs = 6 m, f = 0.015, Dcon = 0.85 m, and n =1.2. The initial air volumes for the surge and hybrid vessels were close; 30 m3 and 24 m3, respectively. Both vessels compensated for pressure loss in the pipeline, as shown in Figure 9, and kept Hmin above −3 m. The expanded air volume following the first wave of the down surge was higher in the hybrid vessel by 7% compared to the surge vessel, with values of 140 m3 and 130 m3, respectively. Many trials for different ranges of hydraulic and pipe parameters were attempted; results showed that the hybrid vessel volume was larger than the surge vessel volume by about 50% for some cases. Thus, despite being a low-head pipeline with a down surge governing transient, the hybrid vessel would not be economical for design engineers.
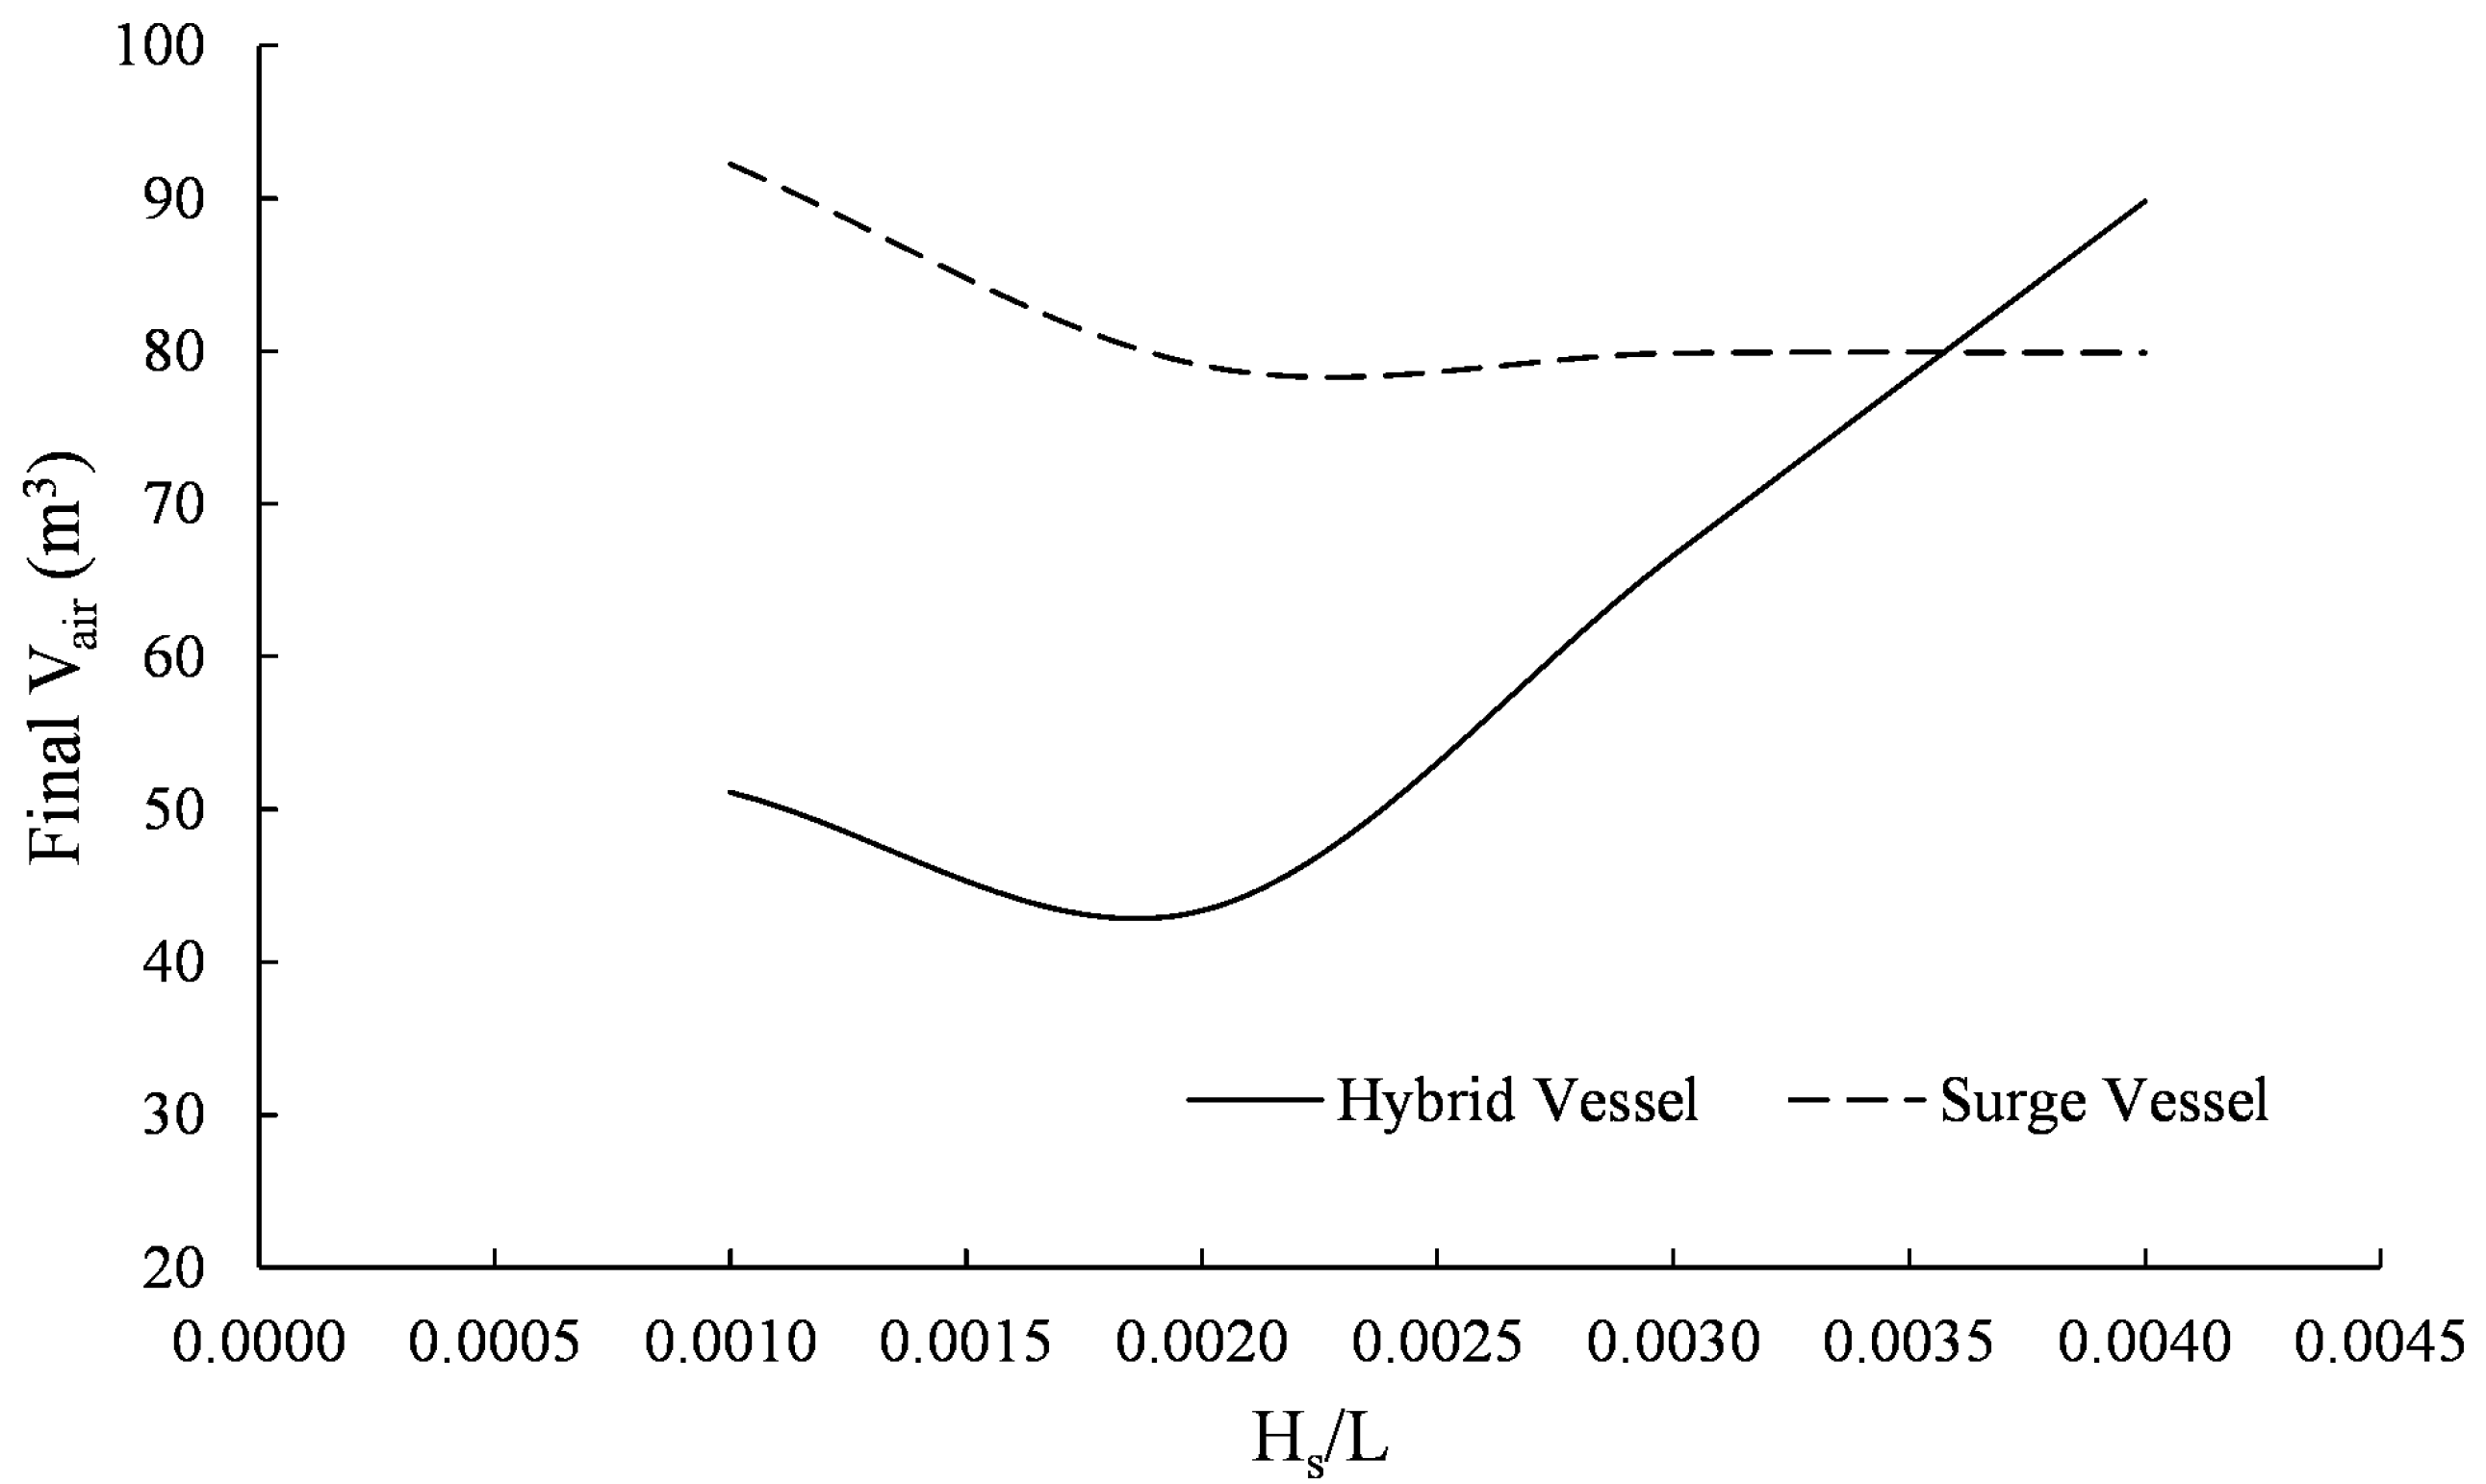
Figure 10 shows the expanded air volume in cases using the normal and the hybrid surge vessels on the above test case, calculated for various pipe slope values Hs/L. It is observed from the figure that the hybrid vessel is an economical choice compared to the surge vessel for pipe slope Hs/L ≤ 0.0025. For other values of pipe slope Hs/L > 0.0025, both vessels’ final air volume starts to close until reaching the inflection point at Hs/L = 0.0035, where the hybrid vessel volume becomes more than the surge vessel. Analyses showed that a hybrid vessel would be most economical to use on low-head pipelines with slopes Hs/L ≤ 0.001–0.003. This pipe slope range was found to be highly dependent on pipe diameter and flow velocity.

3.4. Model Setup—Stochastic Runs

The stochastic Method of Characteristics numerical analysis is presented in this section. Table 4 shows the pumping main cases considered in this work and their range of input parameters. The steady-state velocity is used thereafter instead of discharge to describe flow in system. This is similar to previous research on surge vessels, in which surge vessel size is presented in terms of the steady velocity, e.g., refs. [13,14,15]. The steady-state velocity varies from 0.5 m/s to 2.5 m/s, and the pressure wave celerity from 250 to 1400 m/s. Various types of pipe material, from plastic to concrete, are modeled with Darcy–Weisbach friction coefficient from 0.015 to 0.3, length of pipe main from 2500 m to 15,000 m, and diameter from 0.25 m to 2.0 m. The specific speed of pumps is calculated according to Equation (16). Radial-flow and mixed-flow pumps are considered with specific speeds of 600 to 8000 (US units). The initial discharge is set as the pump operating point on the pump and system curves. Various discharge values correspond to a random choice of pumps.
Various input parameters for the hydraulic problem of water hammer and hybrid vessel protection are modelled, considering equal probabilities of inputs. Thus, the uniform probability distribution density function is evaluated and bounded by the range of parameters shown in Table 4. A surge index has been developed to differentiate between upsurge and down surge cases based on work on surge vessels [22]. The index has been extended and modified in this work according to the hybrid vessel with dipping tube operation mechanism to define only down surge cases, I D S , as follow:
I D S = 7.89 ( D × H s / L ) 0.2 × 1.44 v 1.6
For each of the input parameters, 5000 cases are randomly generated, such that all generated cases would comply with the down surge index set, I D S . When each random case scored less than 1.6 in the above index, a down surge condition would govern the transient problem. The hybrid vessel would probably be more economical to use than normal surge vessel. Many random combinations of input parameters are prepared. Each random realization is used as input to the numerical model to solve as a single deterministic Method of Characteristics run; 5000 deterministic simulations using a new random combination of input parameters were considered. If the final volume of the hybrid tank is less than that initially calculated in case of a surge tank then the run is considered; otherwise, the run is neglected. Out of the initial 5000 cases, only 2500 cases were considered. The accuracy of the stochastic Monte Carlo simulation solution depends largely on the realization number considered. The accuracy of the Monte Carlo simulation is probed using the variance of the output, which is the initial and expanded air volumes in our case. It is observed that the variance started to reach a steady value after 1800 Monte Carlo realizations. Therefore, the 2000 random cases would be accurate enough for utilization in the stochastic analyses. From Figure 11, the calculated initial, expanded, and compression chamber volumes is best fitted with the generalized extreme distribution. Most of the optimized vessels had an initial air volume ≤ 20 m3, and the expanded air volume ≤ 150 m3, and the compression chamber volume ≤ 65 m3.

3.5. Parameters Selection

From the authors’ practical experience and previous literature, the compression chamber volume and initial/expanded air volumes for the hybrid vessel can be a function of the following flow and pipe parameters:
= F v , a , D , L , f , H s , H m a x , H m i n , c c
where v = flow velocity (m/s); a = wave speed (m/s); D = pipeline diameter (m); L = pipeline length (m); Hs = static head (m); Hmax, min = pressure limits (m) and c c = compression chamber volume (m3). The maximum allowable pipe pressure, Hmax, has been set to 1.4 Hpump, while the minimum pressure, Hmin, has been set to a value of −3 m. Other parameters controlling the air volume and, thus, the hybrid vessel volume have varying effects on the volume; however, their contribution to the hybrid vessel initial and expanded air volumes has not been discussed before. Using the least-square realization method, various flow and pipe parameters are ranked according to their contribution to the final tank volume. Table 5 shows the least-square realization regression hybrid vessel sensitivity results, S V i for various input parameters, as presented in Equation (22). It is found that the compression chamber volume, c c , is largely sensitive to the pipeline’s diameter with the contribution of 94% followed by the system static head, Hs with 2% and the pipe friction coefficient with 3%, other parameters; L, v, and a had negligible impact on the chamber volume. On the other hand, the compression chamber volume contributed to the initial air volume, a i r o , as an input parameter with more than 95%; with all other input parameters contributing 5%, the highest impact was for the pipe diameter with 2.8%, followed by the wave speed with 1.7%, and the static head with 0.4%. The friction coefficient and flow velocity had zero contribution to the initial air volume. Results in Table 5 show that the wave velocity had the least contribution to the expanded air volume. Other parameters had a larger contribution; the pipe diameter was the highest with 89%, followed by the velocity with 3%, pipe length with 2.7%, and pipe friction with 3.7%. Calculation showed that the hybrid tank volume is mostly influenced by the pipe diameter as the major contributing parameter, followed by the line static head.

3.6. Developed Genetic Programming Models

Using the most influential input parameters calculated in Table 5, the machine learning-based models were developed for the compression chamber volume, initial air volume, and the final expanded air volume. Correlation analysis was conducted between all input predictive variables, and no interdependency was found amongst them. Thus, any problem that could arise in the model development due to dependency between input parameters is omitted. The random database was divided into training and testing sets with consistent statistical measures of both sets. The 2000 cases are divided randomly into a set used for model training (1500 cases) and another set for testing the developed model (500 cases). The algorithm defined the parameter setting with a mutation rate of 0.06, a chromosome number of 25, and a transposition rate of 1. The developed Genetic Programming models for the compression chamber volume, the initial air volume, and the expanded air volume can be written as follows:
c c = D 3 H s 1.04 f 0.33
a i r o = 5.127 D 0.333 H s 0.111 a 0.33 c c
a i r f = D 2.667 H s 0.4 v 1.2 L 0.5 f 0.05
where c c is the compression chamber volume (m3), a i r o is the initial gas volume (m3), a i r f is the expanded air volume (m3), v is the steady state velocity (m/s), D is the pipeline diameter (m), L is the pipeline length (m), Hs is the static head (m), and f is the Darcy–Weisbach friction coefficient. The compression chamber volume is an influential predictive input for the initial air volume Genetic Programming model only, as shown in Equation (23).
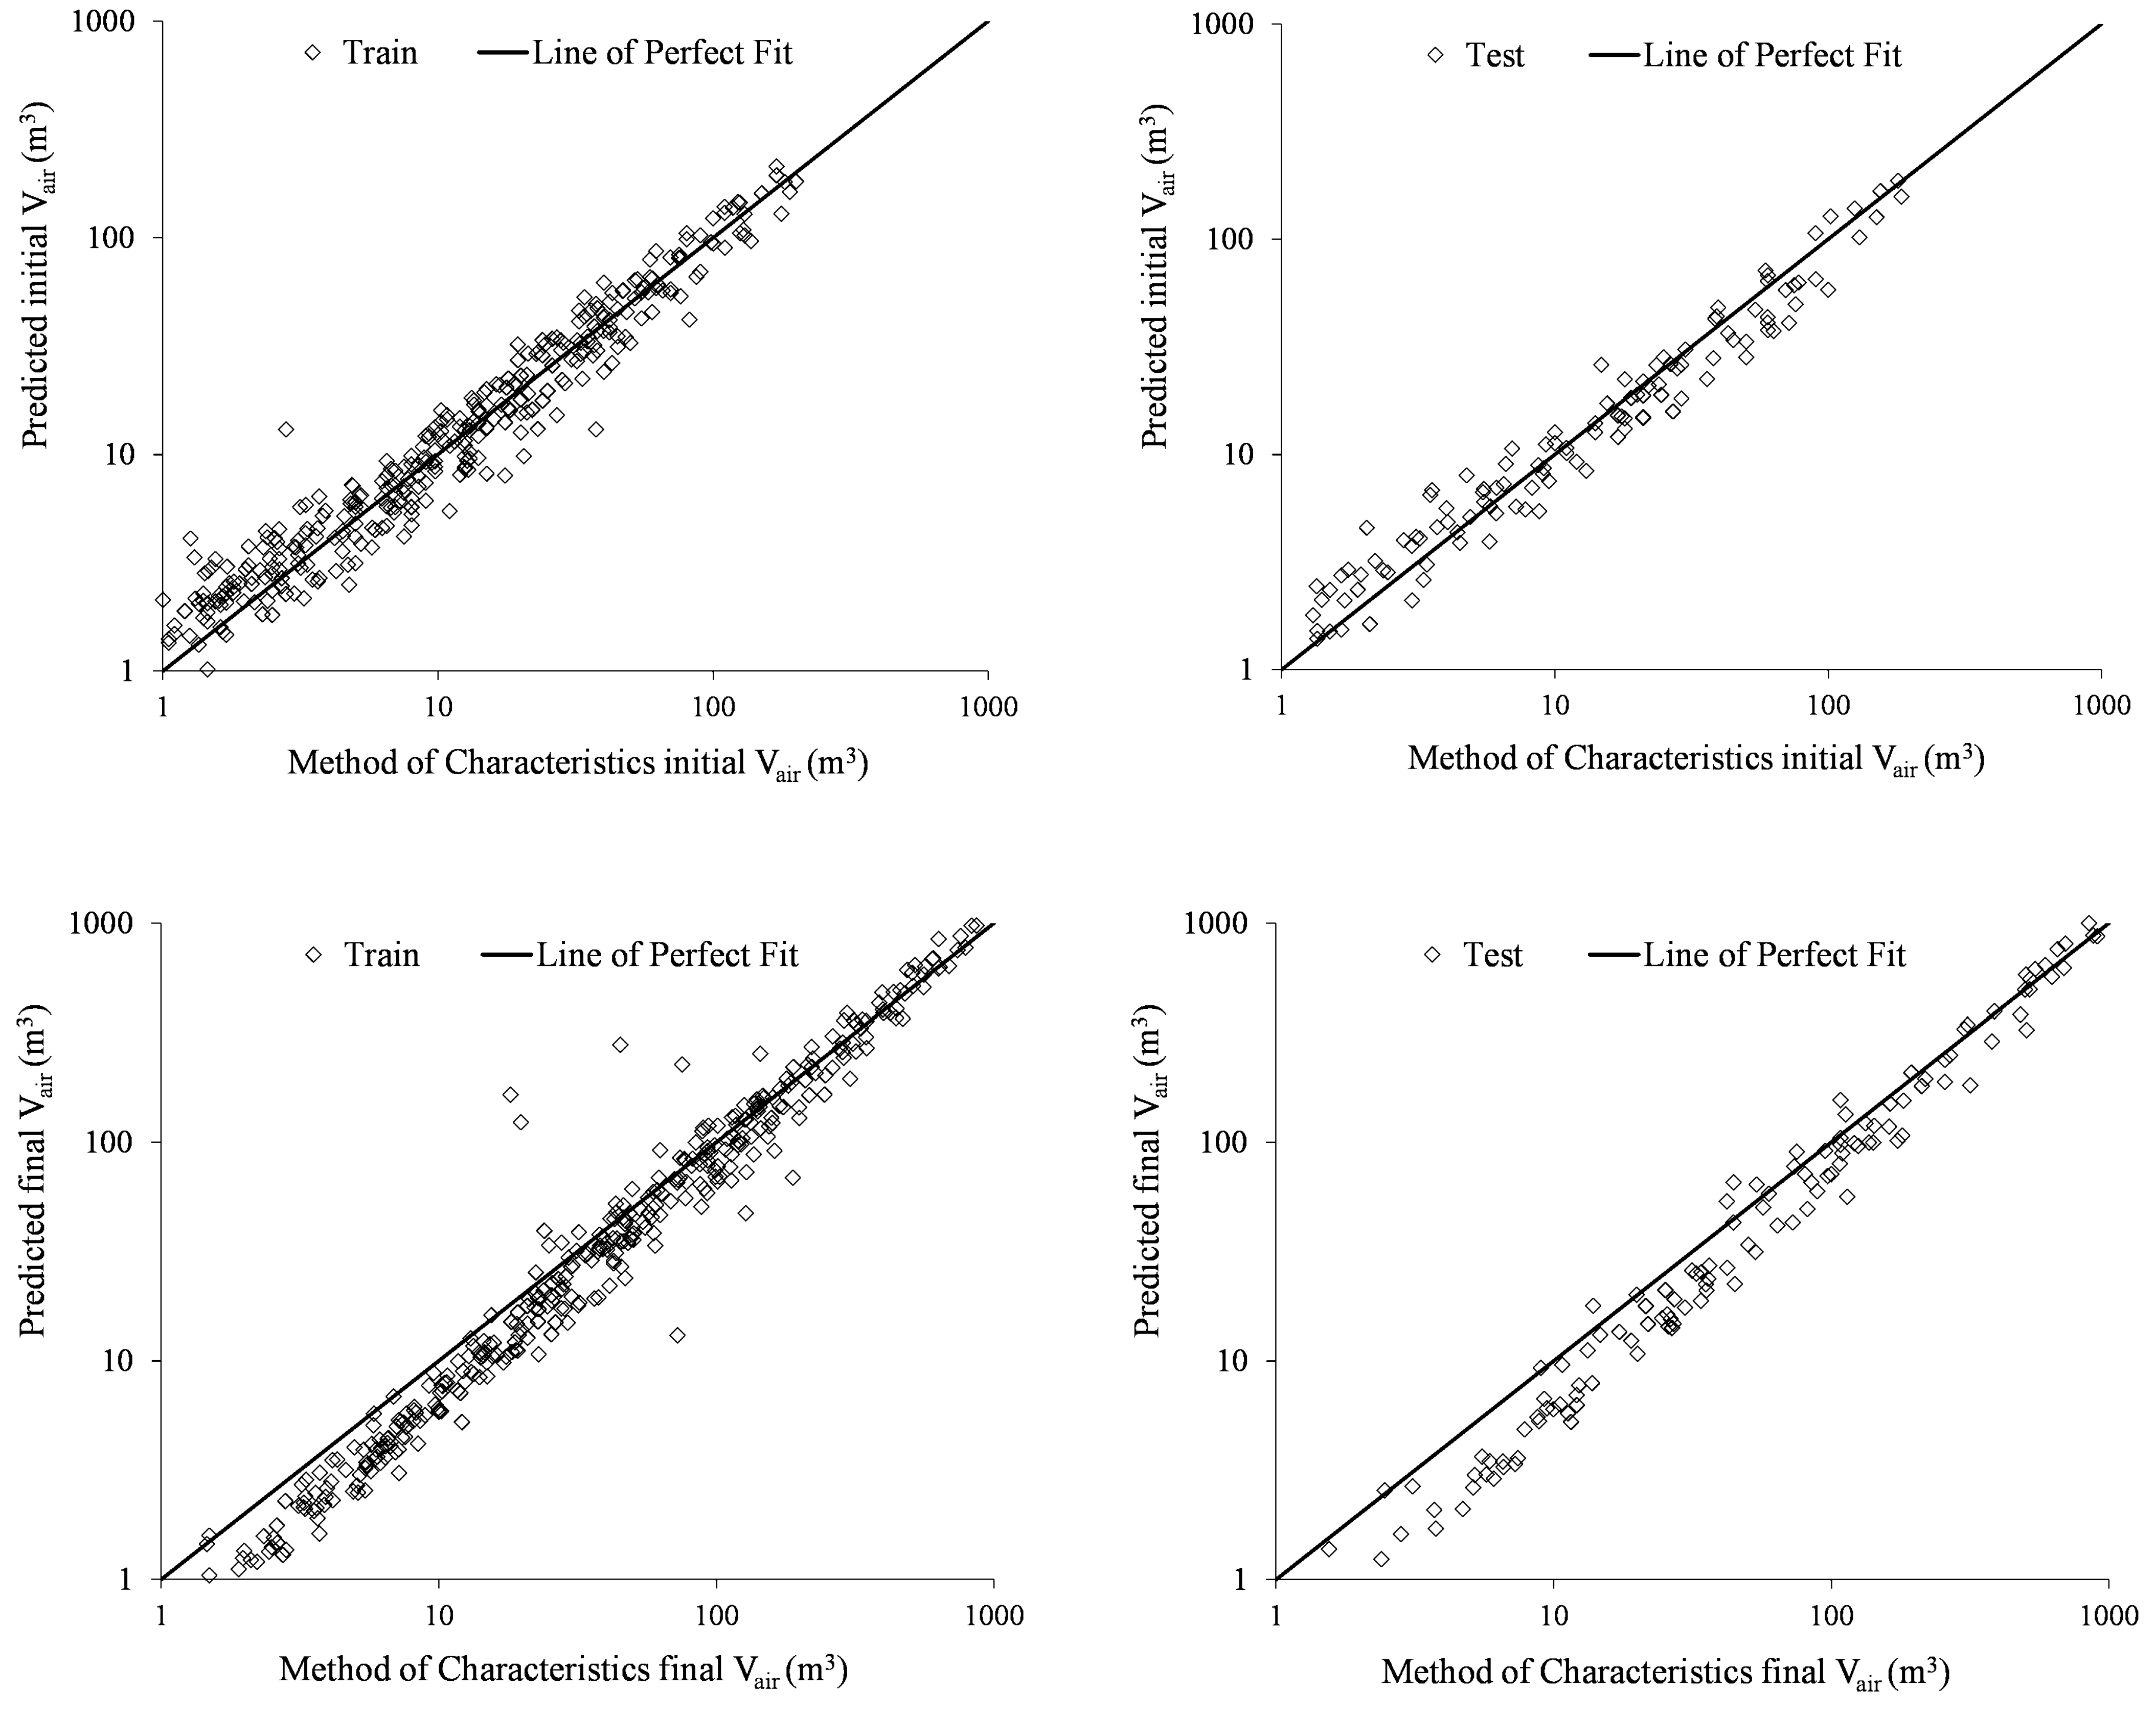
Table 6 shows the general statistical performance of the developed hybrid vessel compression chamber, initial air, and expanded air volumes. The developed models were scored in R2, and an average of 0.92 for training and 0.91 for testing datasets. The error measures, root mean square error, RMSE, and root absolute error, RAE, showed close figures of training and testing datasets for compression chamber and expanded air volumes. The root mean square error for c c is 33 and 44 for the training and testing sets, respectively. The root absolute error is 0.25 and 0.33, respectively, for training and testing sets. The root mean square error for a i r f is 32 and 40, respectively, for training and testing sets, while the root absolute error is 0.14 for both the training and testing sets. the error measures showed lower values for the initial air volume. The root mean square error for a i r o is 8 and 10, respectively, for training and testing sets, while the root absolute error is 0.19 and 0.21, respectively, for training and testing sets. On the other hand, the indices Esn and Dag showed satisfying values with averages of 0.92 and 0.89 for the training and testing subset, respectively. Figure 12 shows the Q-Q plot of the Method of Characteristics numerical calculated volumes; c c , a i r o and a i r f versus those predicted by the developed genetic programming models using Equations (23)–(25). There was no substantial over- or under-prediction, and the created models demonstrated extremely good agreement with numerical estimated volumes with minor mistakes. The developed model for a i r o showed a slight under-predict volume with about 4%.

3.7. Comparison with Classical Design Charts

Up to the authors’ knowledge, there is no current research in literature for hybrid vessels. All existing research discusses the surge vessel performance and the initial air volume in these vessels. Two classical charts have been developed by [13,15] for calculating the surge vessel initial air volumes for rising pumping mains. They have been developed for normal surge vessels to protect rising pump mains from pump failures that are accounted for by a sudden valve closure and using the rigid column theory. They are regarded as traditional benchmark pillar models for the initial vessel air volume, and thus, it shall be used in this work for comparison with the developed model on a hybrid model, though it would be expected that they would oversize vessel volume. While it would be unfair to utilize the classical charts for comparison with the developed genetic programming models, the classical charts would provide rough benchmarking. Table 7 shows the range of parameters for the classical charts and the developed genetic programming models in this study, including the vessel initial air volume using classical non-dimensional parameters. Despite having charts developed without considering practical limits for their input parameters, the ranges of the non-dimensional parameters are very close.
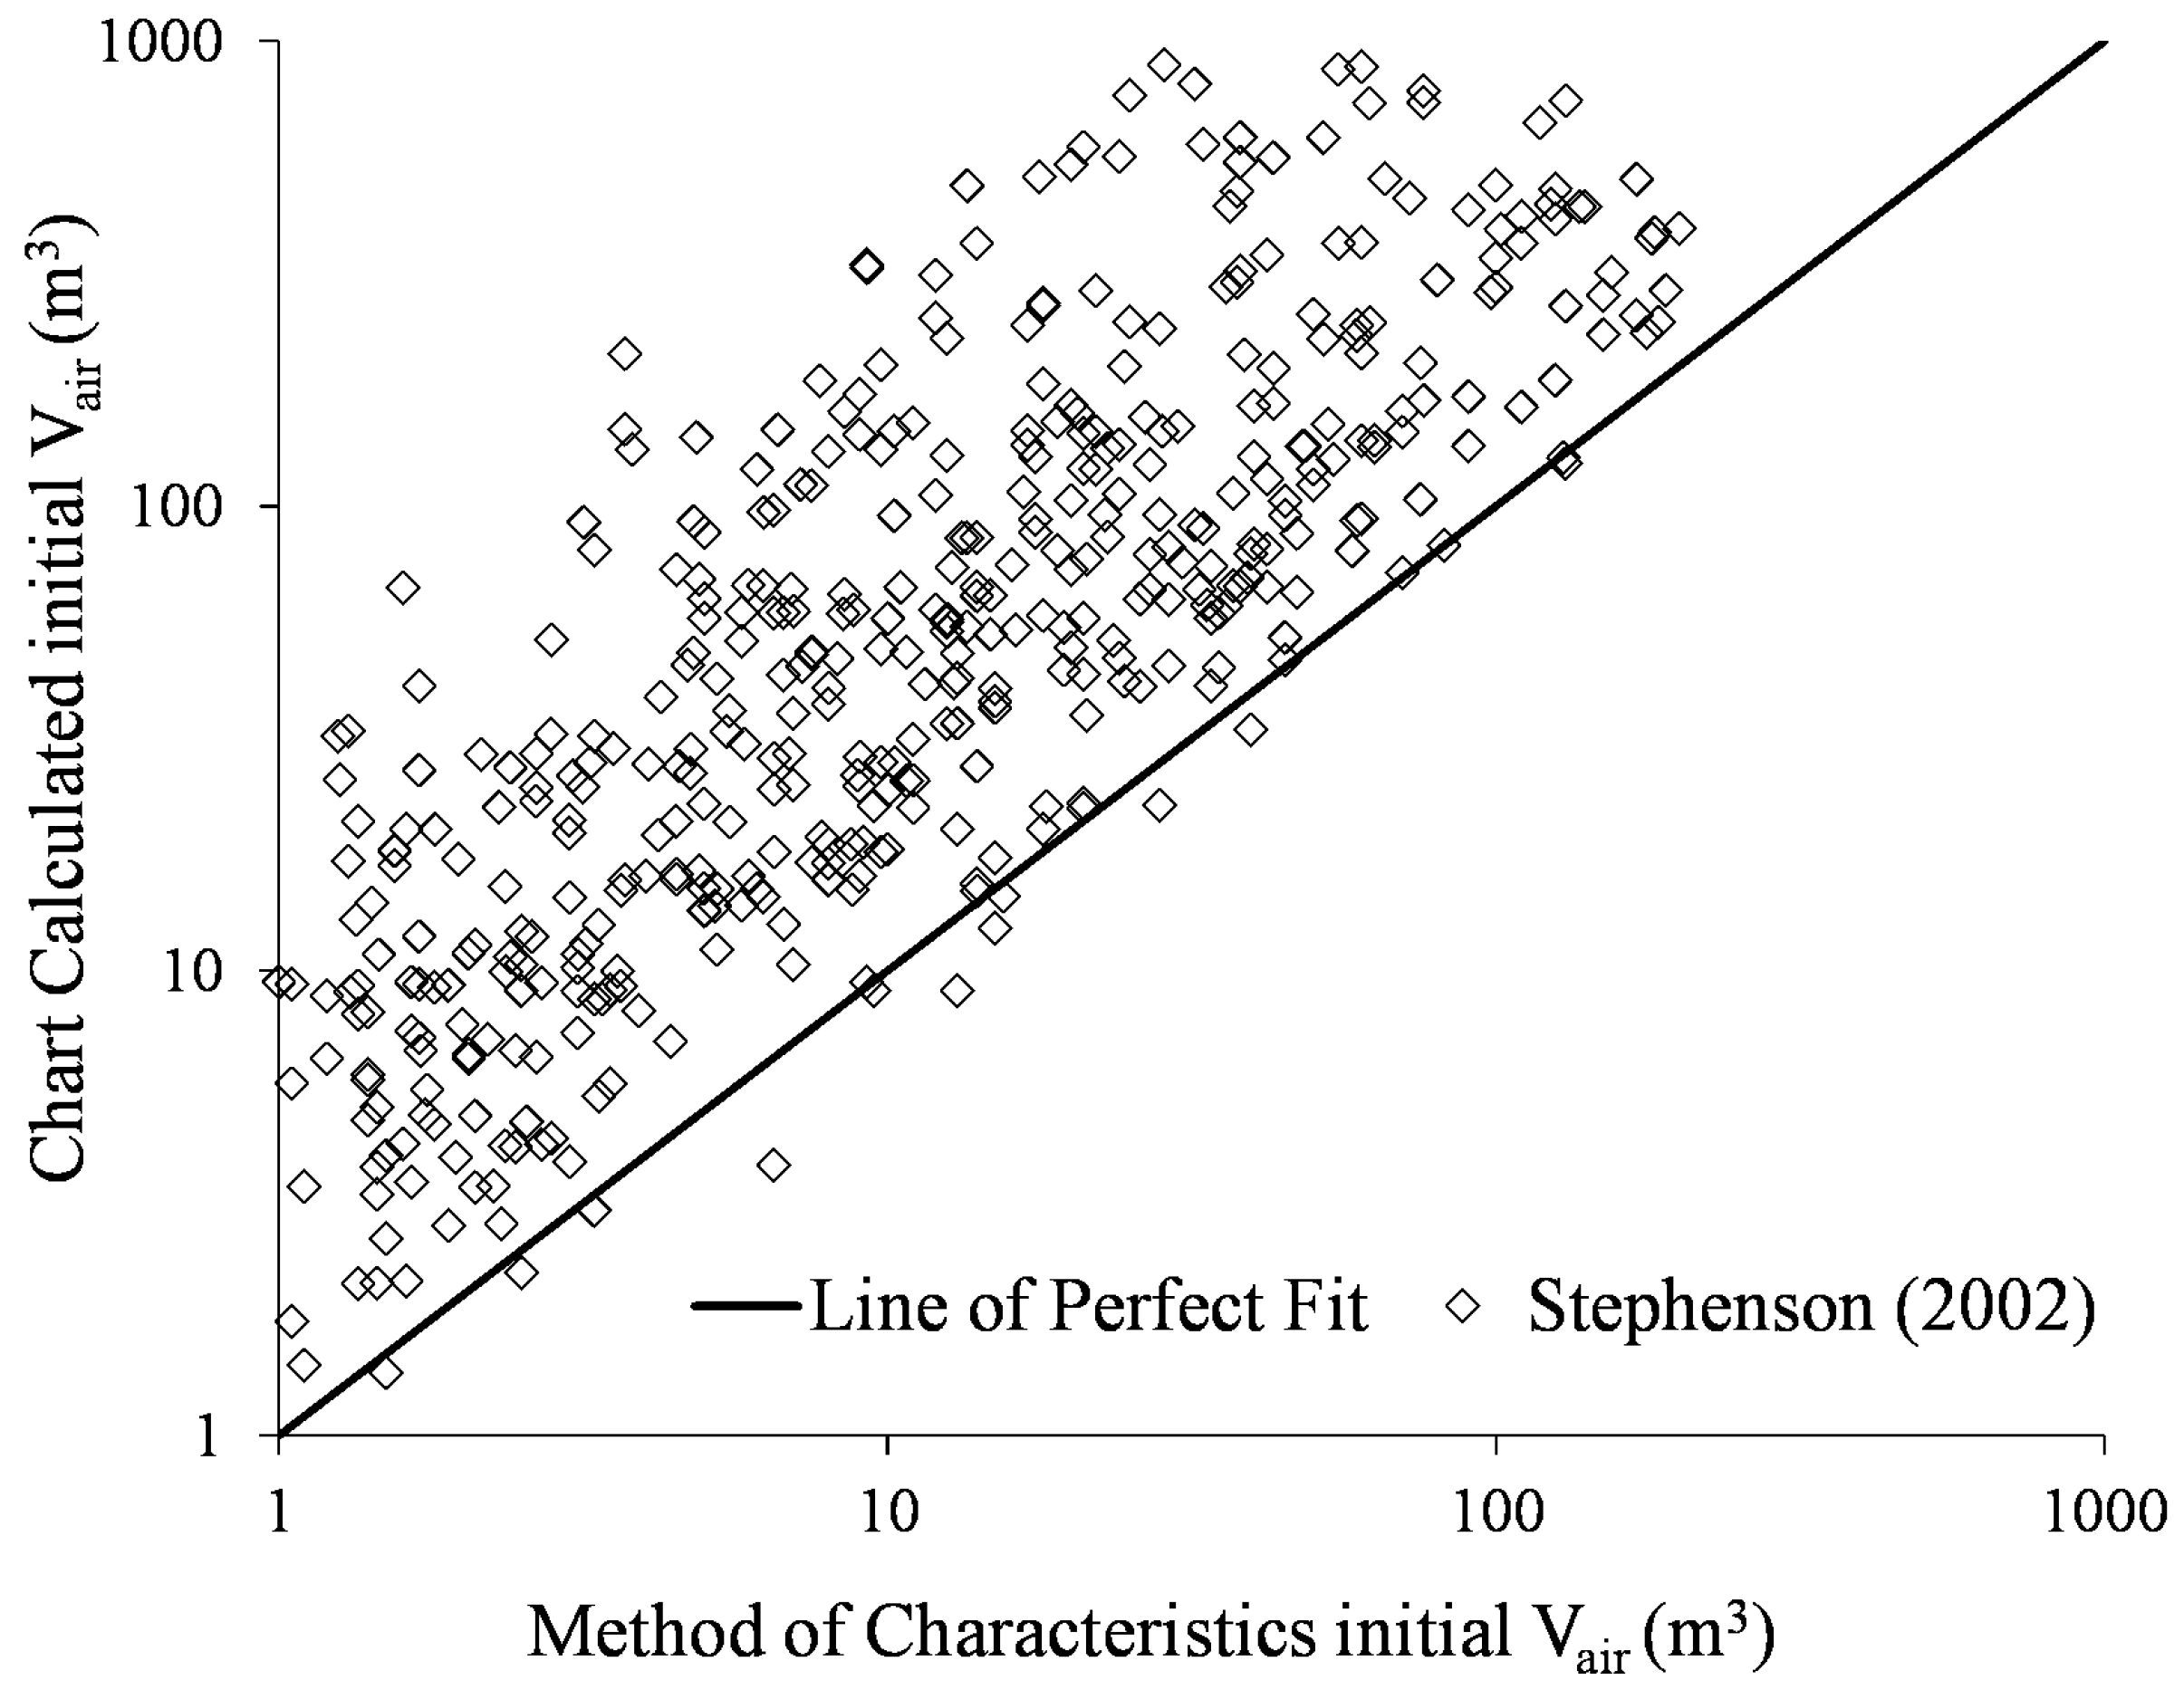
Both classical charts yielded an extremely low R2 value, as shown in Table 6. The chart developed by [15] had the lowest R2 value of 0.17, and 0.25 for [13] chart. Thus, the classical charts can only represent 20% of the data. The other statistical error values showed higher values when compared to the developed genetic programming models. The root mean square error for these classical charts showed values ranging from 98 to 339, which are 3 to 10 times higher than those of the genetic programming models. These errors are confirmed in Figure 13, which shows the scatter between the Method of Characteristics solution and the classical charts predictions. It is observed that the solutions by the classical charts show a spread of values around the line of fit with high over-prediction for initial vessel volume for the [15] chart. The chart in [13] was based on the rigid column theory, while [15]’s chart was based on the incompressible flow equations. An overestimation for the rigid column and incompressible flow theories in the initial vessel air volume computation were reported in [15]. Moreover, results in Table 6 showed that Esn and Dag indices for the classical charts yielded 89 and 0.5 respectively, indicating the charts’ failure to predict the initial volume. Lower error values and excellent value of Esn and Dag indices were calculated using the developed models; these can predict more economical vessel sizes.

3.8. Testing and Validation of the Developed Models

As shown in Table 8, model testing is applied to the test set. The slope of regression line between the predicted versus the Method of Characteristics calculated volumes were near 1 and in the suggested range of 0.85 to 1.15. In addition, models scored favorable values for the regression line’s coefficient of determination, which had average values of −0.05. As a result, when tested against test datasets, the created model’s performance can be said to be good and acceptable.
Table 9 displays the differences in prediction uncertainty between the created models and traditional charts. The table shows the average prediction errors of the different models, the width of the uncertainty band, and the error within the 95% confidence interval. It is based on the test data subsets. The developed models for c c , a i r o , and a i r f showed a mean prediction error less than that of classical charts, with average values of 0.05. The classical charts had higher mean prediction errors, three and six orders of magnitude larger than the developed model for the initial air volume.
The genetic programming models prediction errors had a deviation of 1/2 to 1/4 that of the available classical charts, with values of 0.10 and 0.45, respectively. Since the classical charts were developed for the surge vessels on high-head pumping mains, they are expected to overestimate the initial air volume. This is confirmed by the mean prediction error positive signs in predictions of the [13,15] charts. The uncertainty with for the developed models are close, with values of + / 0.47, + / 0.26, and + / 0.25 for c c , a i r o , and a i r f , respectively.

3.9. Parametric Analysis of the Developed MODELS

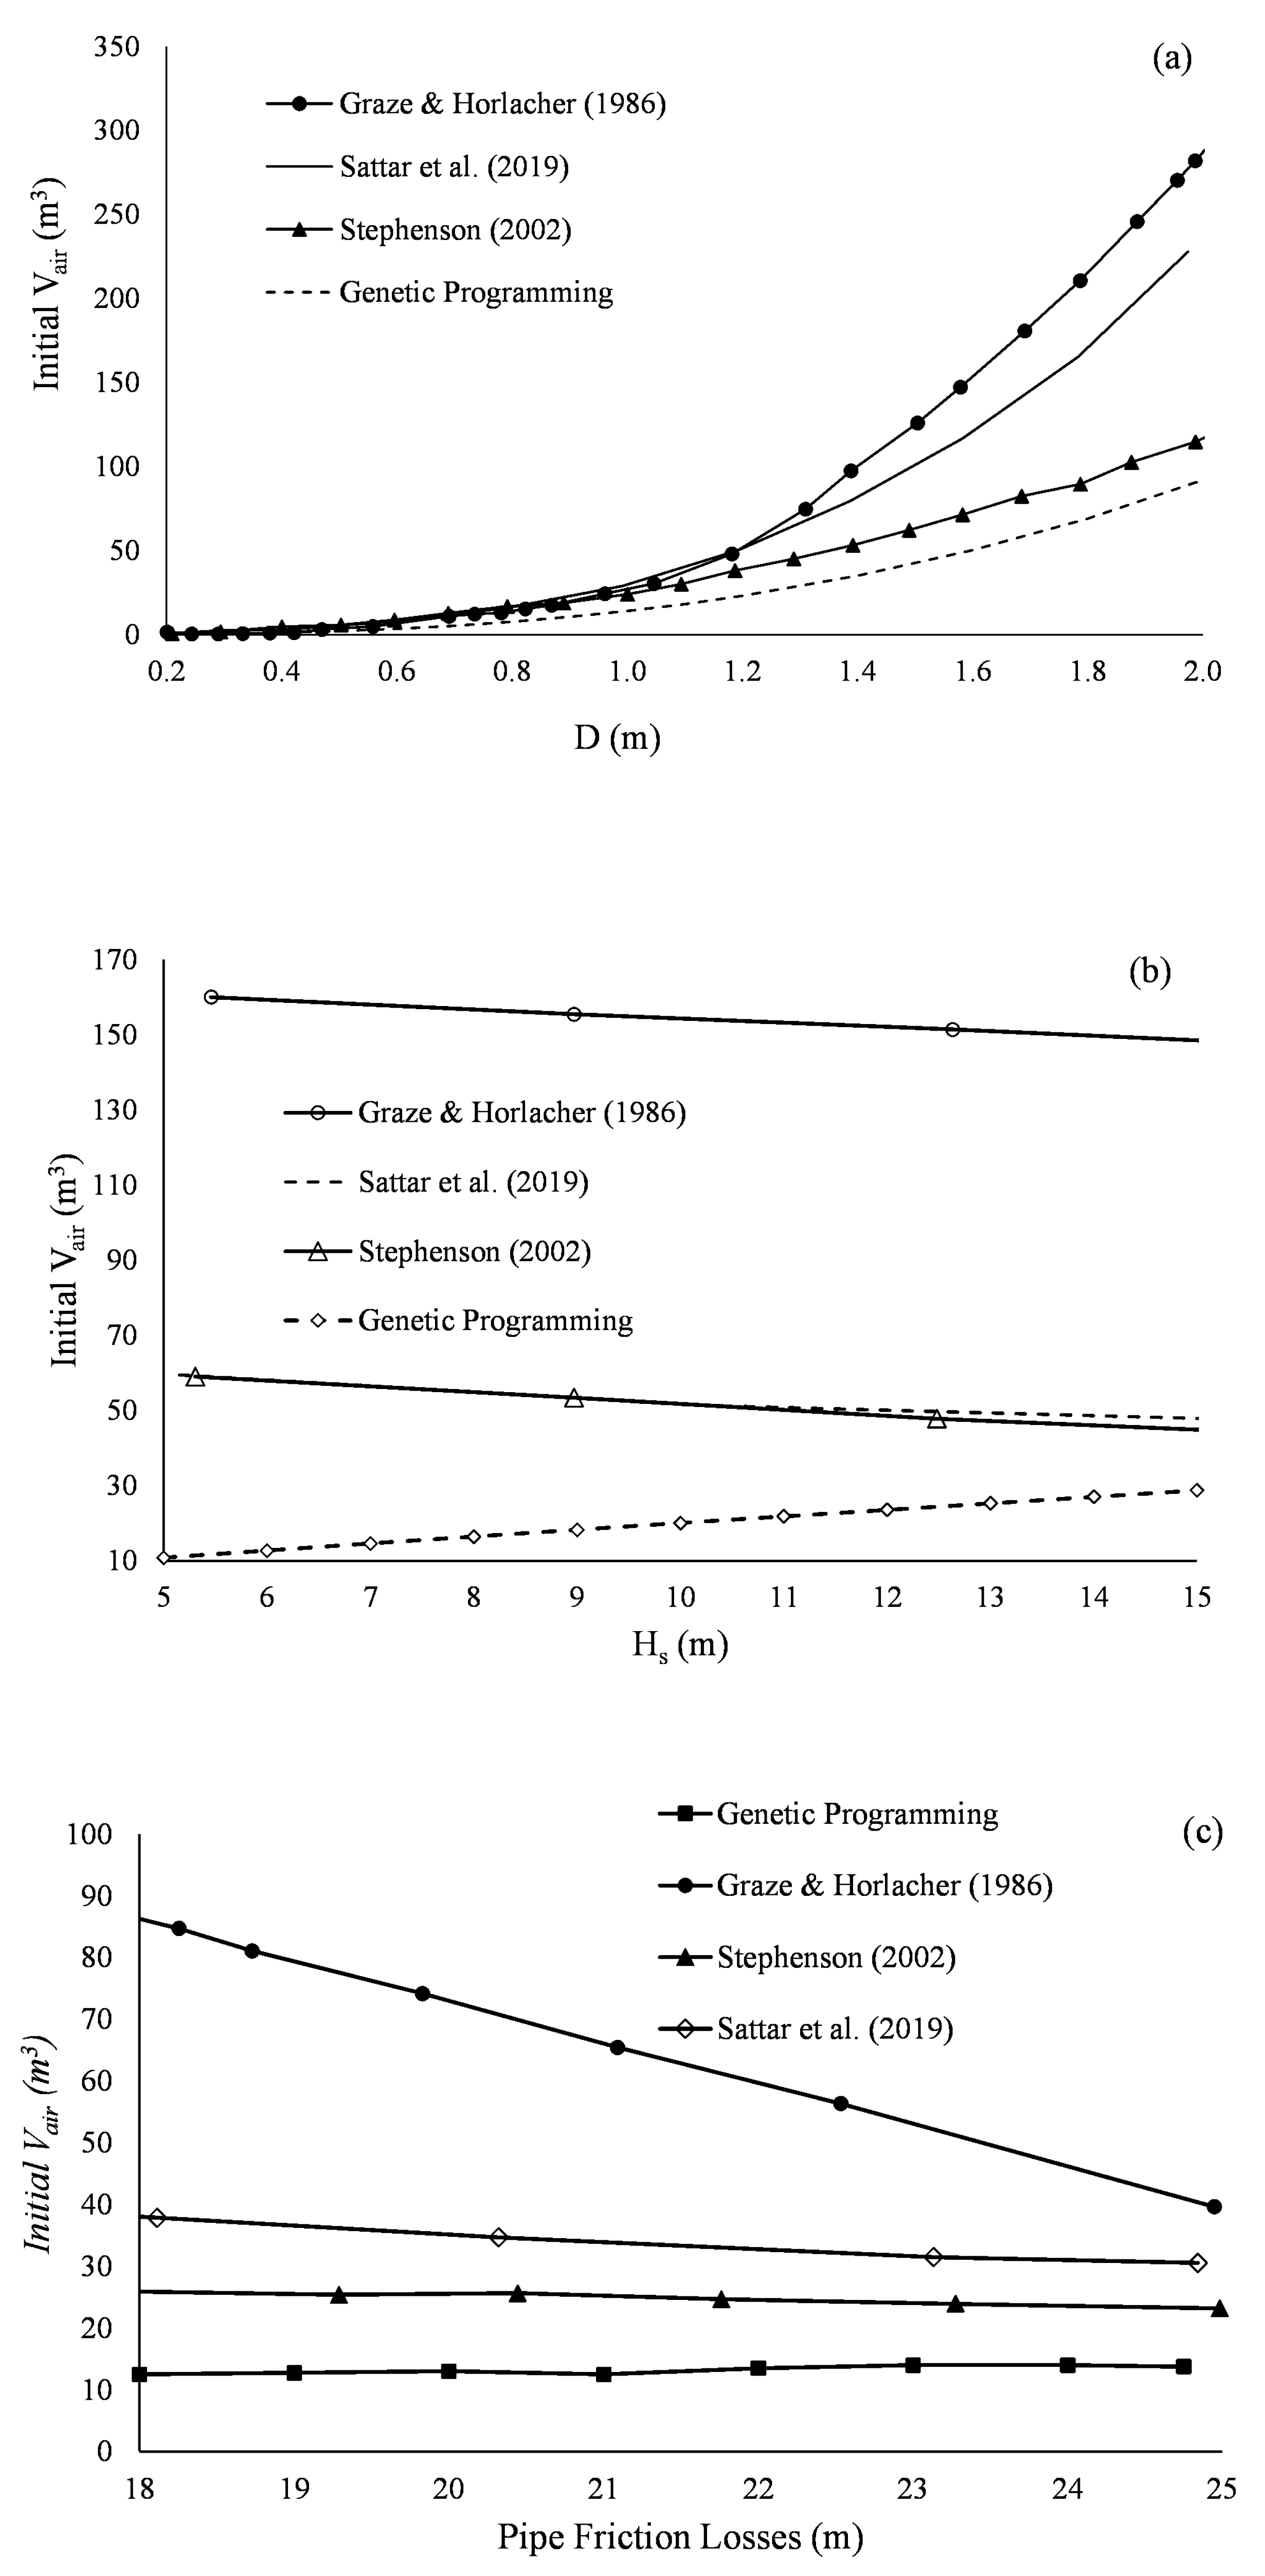
Figure 14 shows the variation of the initial vessel volume versus pipeline diameter, static head, and the friction head as calculated by the genetic programming models, [22], and classical design charts of [13,15]. It is observed that the initial air volume calculated by the genetic programming model is the lowest amongst all other models since the genetic programming model is developed for the hybrid vessel, which would have a smaller volume than surge vessel in low-head pipelines. Moreover, the initial air volume increased with the increase in pipeline diameter for all models. The increase in the vessel volume is the smallest for D ≤ 0.60 m, while it is more noticeable and with an increasing gradient for D > 0.60 m. The largest gradient of increase is observed for [13,37]’s chart, and the lowest is observed for the genetic programming model. When the pipe diameter is larger and the pump fails, a larger sub-atmospheric region is created. This would require more water to be pushed from the vessel to account for the low-pressure region. It was confirmed by [15] that the volume of the liquid zone formed in pipe with sub-atmospheric pressure.
According to [15,38], the pipe diameter and the volume of the liquid zone formed by the pump failure with sub-atmospheric pressure are directly proportional. For previous models, the initial air volume decreased with the increase in the static head with a near constant gradient for all models with the highest initial air volume, -due to [13] model, of around 150 m3 compared to 50 m3 for [15,22]. In contrast to earlier design models, the genetic programming model exhibited an opposing pattern in the change of the initial air volume with the pipe static head. The chances that the down surge wave following pump failure will fall below the pipe hydraulic grade is reduced as the static head of the pipeline rises. Thus, less initial air volume would be needed to compensate for the sub-atmospheric pressure in the pipeline in case of a surge vessel (as shown for previous models) and more initial air volume would be needed to act as a cushion inside the vessel against reflected upsurges (as shown in genetic programming model).
For the initial air volume variations in a vessel with the pipe friction head, as shown in Figure 14, a similar trend is observed for the genetic programming model and previous models, except for [13]’s chart, with a slight decrease in initial air volume when friction head increased. The trend of initial air volume calculated by the genetic programming model was close to that calculated by [15,22]. Relative to [13]’s model, all of these demonstrate a lower dependence on the initial air volume on the friction head. When the friction head increased by 40% (from 18 m to 25 m), the initial air volume decreased by an average of 5% for all models; this is compared to 50% for [13]’s model. The work of [37], who stated that an increase in pipe friction head would minimize positive transients and make it highly probable that the upsurge would never reach the original hydraulic grade, illustrates this declining trend.

3.10. Genetic Programming Models’ Application Range

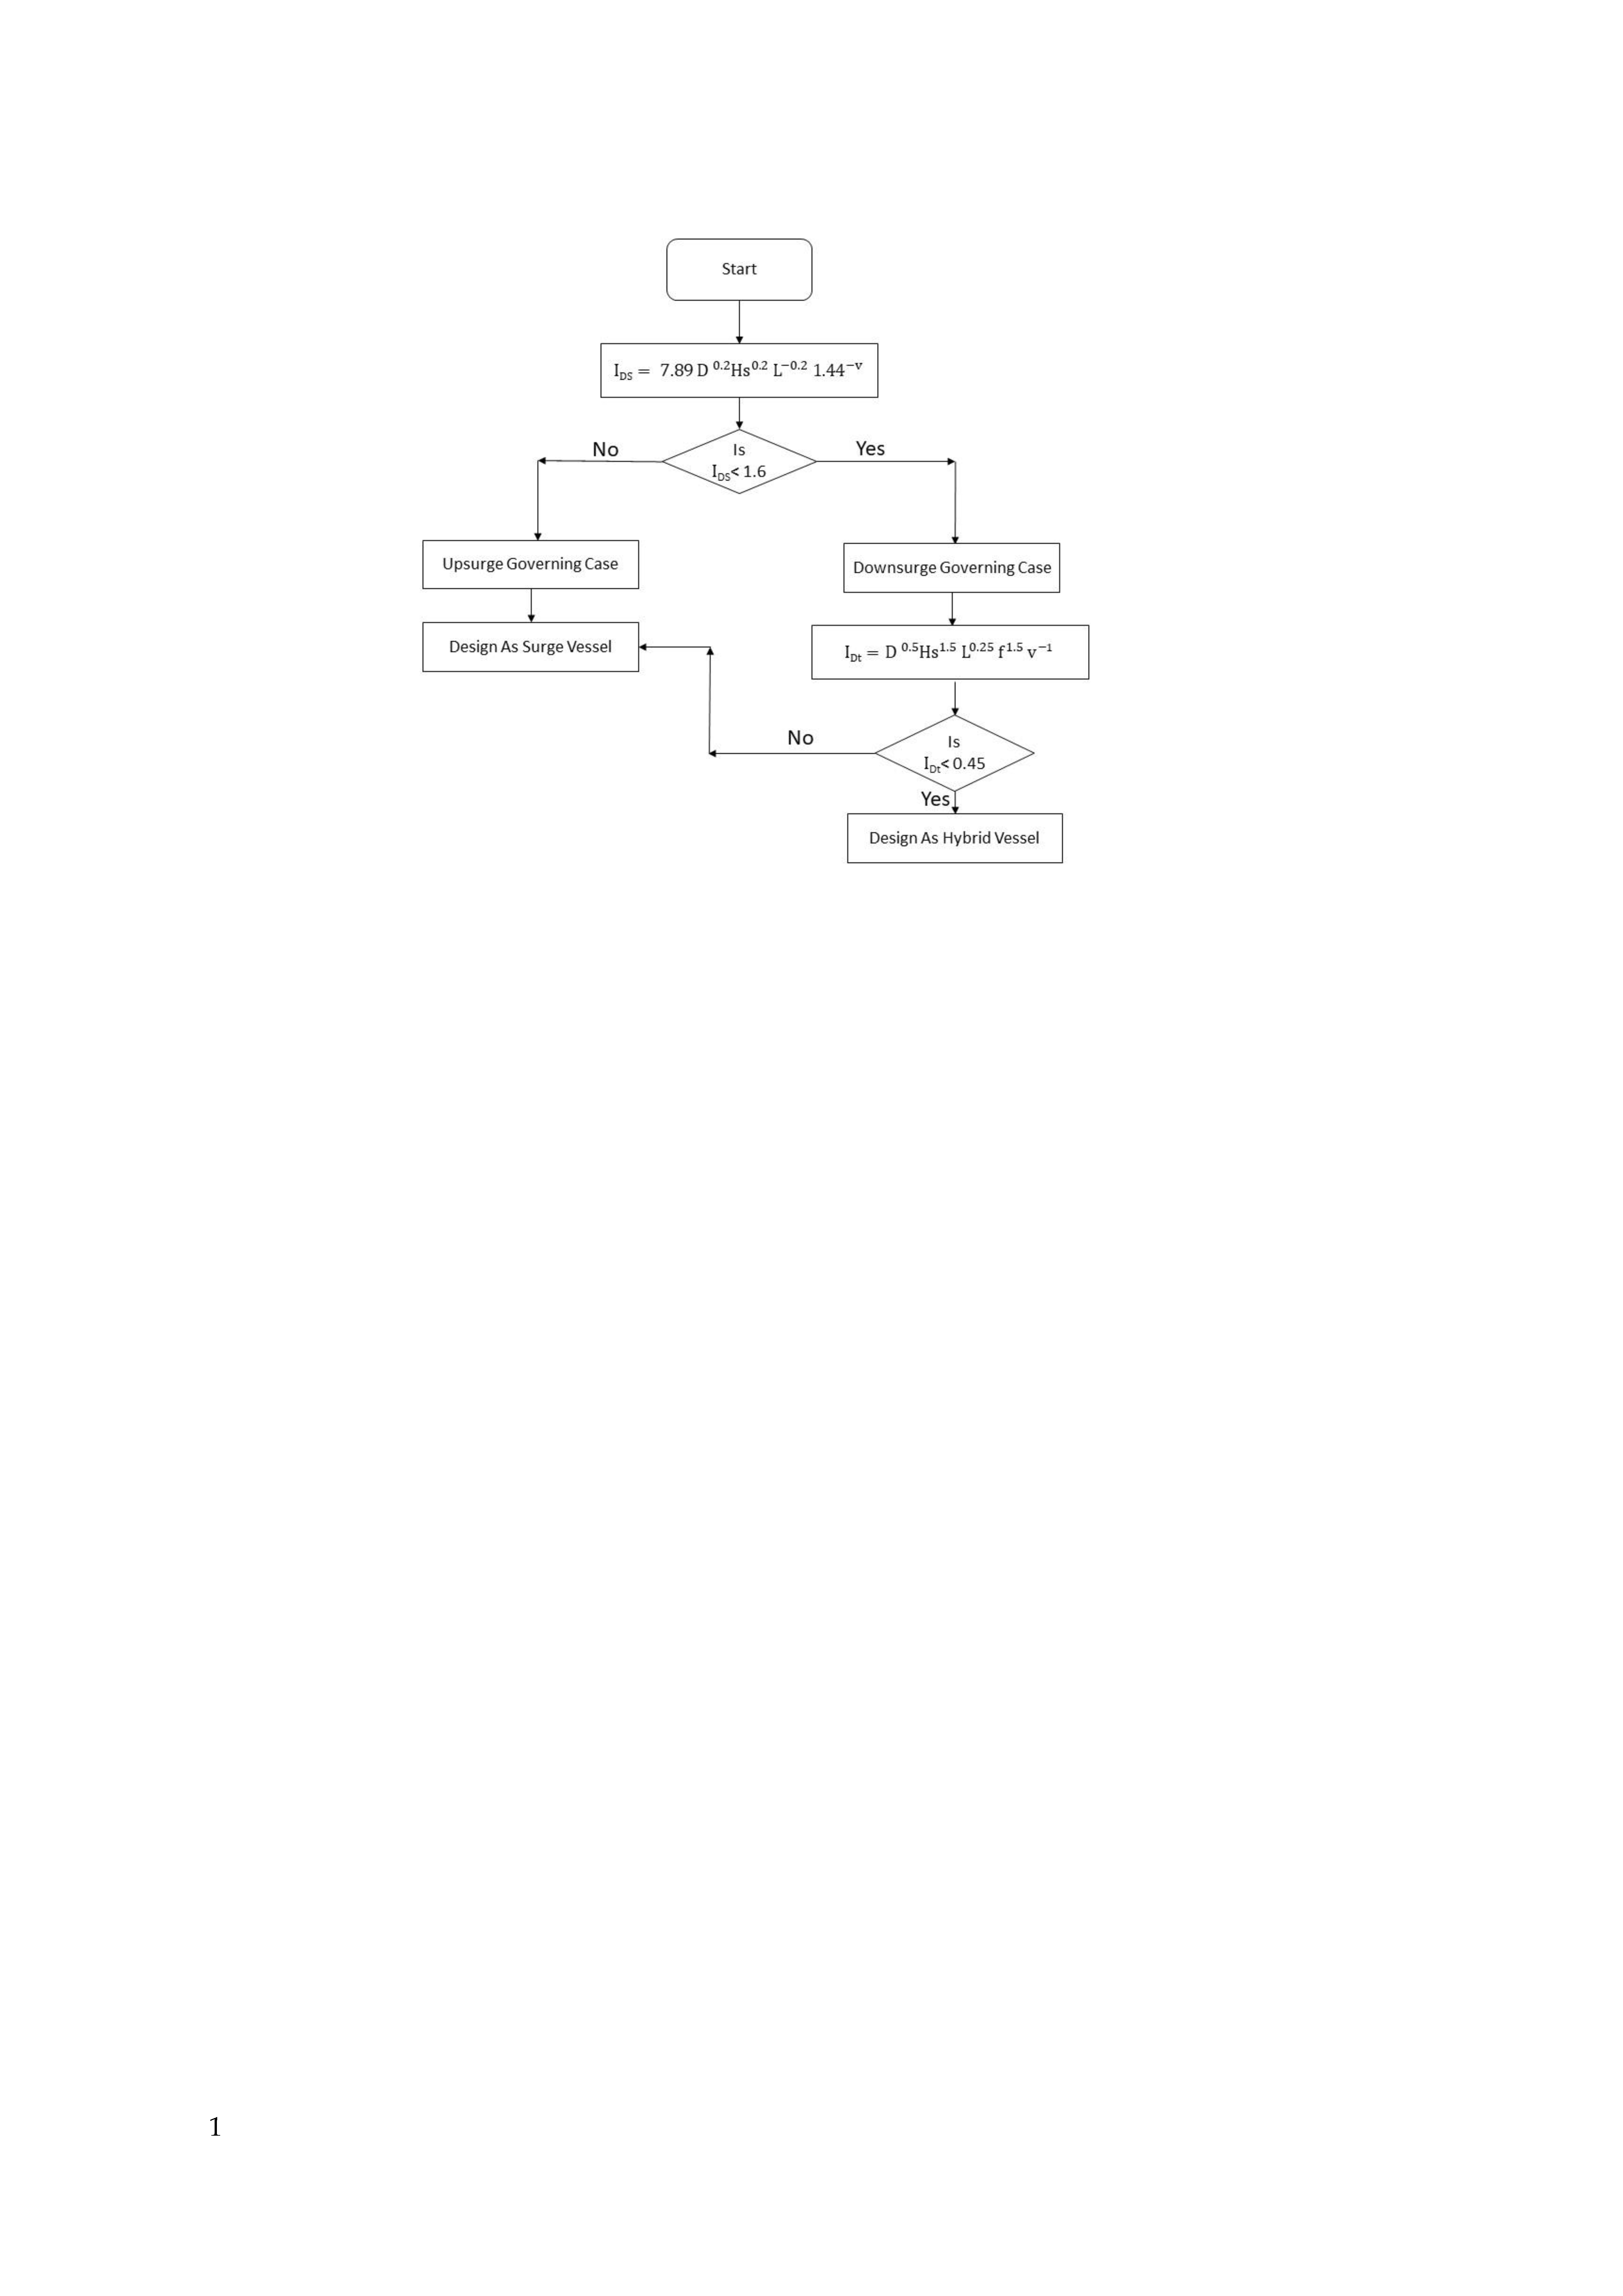
The developed genetic programming model can be used for providing hybrid vessel volume on linear varying low-head pipeline profiles with no intermediate high points and where down surge is the governing transient event. The applicability of the developed model has not been tested outside the range specified in Table 4. As discussed, the hybrid vessel might not be economical for some down surge cases. Thus, based on 2500 random cases, a genetic programming classification index, I D t has been developed (with R2 of 0.70) to help guide design engineers to down surge cases where hybrid vessels would be most economical, as shown in Figure 15 and as follows:
I D t = D 0.5 L 0.25 H s 1.5 v 1 f 1.5 0.45
The proposed model has been built using radial-flow and mixed-flow centrifugal pump categories with the average rotational speed of 1500 rpm and average efficiency of 0.85. Using the genetic programming model would imply that no other surge protection device is installed on the pipeline, such as surge relief valves or vacuum breakers. Installation of these devices would benefit the system and interact with the surge vessel, which may further reduce the required size of the vessel. The genetic programming model developed using −3 m as set for the minimum head would allow backflow into pipelines during pump trip events at locations of existing leaks and thus might be a concern where water quality is a priority.

4. Conclusions

Surge vessels are known to be effective means of controlling pressure transients following pump failures. For low-head pipelines, the pump trip would create a sub-atmospheric pressure liquid region, which requires a large amount of water to flow from the vessel to compensate. Using a surge vessel would imply a high initial air volume and thus a high tank volume. However, the hybrid vessel can be utilized to effectively and efficiently compensate for the negative surge using the atmospheric pressure and lower initial air volume compared to the surge vessel. This research presented a hybrid vessel for protection against negative transients in low-head pipelines and developed a novel and simple approximate model for the estimation of the volumes of the compression chamber, initial air, and expanded air in the hybrid vessel. The developed model showed very good statistical performance, with a high coefficient of determination of 0.90 and a low mean prediction error of 0.1. The model clearly shows the relation between various hydraulic and pipe parameters with pipe diameter and static head as the most influencing parameters on compression chamber and air volumes. In addition, the developed model presented classification criteria for low-head pipelines on which the hybrid vessel would be most economical. The developed machine learning model with equations and indices can be utilized as a general framework used for the selection of hybrid surge vessels and their sizing. It can be associated with commercial software, e.g., Bentley HAMMER [34], in the design phase.

Author Contributions

Conceptualization, A.S.E.; Data curation, M.E.; Formal analysis, A.M.A.S. and A.N.G.; Investigation, A.M.A.S. and M.E.; Methodology, A.M.A.S.; Project administration, B.G.; Resources, M.E. and B.G.; Software, A.M.A.S. and A.N.G.; Supervision, B.G.; Validation, A.M.A.S. and A.N.G.; Visualization, A.M.A.S. and A.S.E.; Writing—original draft, A.M.A.S.; Writing—review and editing, B.G. All authors have read and agreed to the published version of the manuscript.

Funding

This research was funded by the Natural Sciences and Engineering Research Council of Canada (NSERC), Discovery Grant #400675.

Data Availability Statement

The data presented in this study are available on request from the corresponding author. The data are not publicly available due to having commercial real cases.

Conflicts of Interest

The authors declare no conflict of interest.

References

  1. Laiq, S.J. Analyzing Transient Behavior and Cost Effectiveness of a TSE Transmission Line Considering Different Pipeline Materials. In Pipelines 2014: From Underground to the Forefront of Innovation and Sustainability; ASCE Library: Reston, VA, USA, 2014; pp. 2201–2210. [Google Scholar] [CrossRef]
  2. Triki, A.; Chaker, M.A. Compound technique-based inline design strategy for water-hammer control in steel pressurized-piping systems. Int. J. Press. Vessel. Pip. 2019, 169, 188–203. [Google Scholar] [CrossRef]
  3. Chaker, M.A.; Triki, A. Investigating the branching redesign strategy for surge control in pressurized steel piping systems. Int. J. Press. Vessel. Pip. 2020, 180, 104044. [Google Scholar] [CrossRef]
  4. Garg, R.K.; Kumar, A. Experimental and numerical investigations of water hammer analysis in pipeline with two different materials and their combined configuration. Int. J. Press. Vessel. Pip. 2020, 188, 104219. [Google Scholar] [CrossRef]
  5. Ostfeld, A. (Ed.) Water Supply System Analysis—Selected Topics [Internet]; InTech: London, UK, 2012. [Google Scholar] [CrossRef]
  6. Zhu, M.L.; Shen, B.; Zhang, Y.H.; Wang, T. Research on protection of water hammer in long-distance pressurized water transfer pipeline project. J. Xi’an Univ. Archit. Technol. (Nat. Sci. Ed.) 2007, 39, 40–43. [Google Scholar]
  7. Zhiyong, L. Comparative research on protective measures of pump-stopping water hammer in water intake pumping station along river. Trans. Chin. Soc. Agric. Mach. 2005, 7, 61–64. [Google Scholar]
  8. Feng, T.; Jia, Y.; Xie, R. Characteristics and protective measures of water hammer in cascade pumping station for long distance pressure water delivery. China Water Wastewater 2008, 14, 16. [Google Scholar]
  9. Calamak, M.; Bozkus, Z. Comparison of performance of two run-of-river plants during transient conditions. J. Perform. Constr. Facil. 2013, 27, 624–632. [Google Scholar] [CrossRef]
  10. Wu, Y.; Xu, Y.; Wang, C. Research on air valve of water supply pipelines. Procedia Eng. 2015, 119, 884–891. [Google Scholar] [CrossRef]
  11. Arefi, M.H.; Ghaeini-Hessaroeyeh, M.; Memarzadeh, R. Numerical modeling of water hammer in long water transmission pipeline. Appl. Water Sci. 2021, 11, 140. [Google Scholar] [CrossRef]
  12. Li, G.; Wu, X.; Li, L.; Qiu, W.; Cui, W. Research on water hammer protection for a long-distance water supply system of a deep well pump group. IOP Conf. Ser. Earth Environ. Sci. 2021, 826, 012047. [Google Scholar] [CrossRef]
  13. Graze, H.R.; Horlacher, H.B. Air Chamber Design charts. In Proceedings of the 8th Australian Fluid Mechanics Conference, University of Newcastle, Newcastle, NSW, Australia, 28 November–2 December October 1982; Volume 28, pp. 14–18. [Google Scholar]
  14. Ruus, E.; Karney, B.W. Applied Hydraulic Transients; Ruus Consulting Ltd., Ken Fench: British Columbia, BC, Canada, 1997. [Google Scholar]
  15. Stephenson, D. Simple guide for design of air vessels for water hammer protection of pumping lines. J. Hydraul. Eng. 2002, 128, 792–797. [Google Scholar] [CrossRef]
  16. Izquierdo, J.; Lopez, P.A.; Lopez, G.; Martinez, F.J.; Perez, R. Encapsulation of air vessel design in a neural network. Appl. Math. Model. 2006, 30, 395–405. [Google Scholar] [CrossRef]
  17. De Martino, G.; Fontana, N. Simplified approach for the optimal sizing of throttled air chambers. J. Hydraul. Eng. 2012, 138, 1101–1109. [Google Scholar] [CrossRef]
  18. Sun, Q.; Wu, Y.B.; Xu, Y.; Jang, T.U. Optimal sizing of an air vessel in a long-distance water-supply pumping system using the SQP method. J. Pipeline Syst. Eng. Pract. 2016, 7, 05016001. [Google Scholar] [CrossRef]
  19. Shi, L.; Zhang, J.; Yu, X.; Chen, S. Water hammer protective performance of a spherical air vessel caused by a pump trip. Water Supply 2019, 19, 1862–1869. [Google Scholar] [CrossRef]
  20. Wang, X.; Zhang, J.; Yu, X.; Shi, L.; Zhao, W.; Xu, H. Formula for selecting optimal location of air vessel in long-distance pumping systems. Int. J. Press. Vessel. Pip. 2019, 172, 127–133. [Google Scholar] [CrossRef]
  21. Miao, D.; Zhang, J.; Chen, S.; Li, D.Z. An approximate analytical method to size an air vessel in a water supply system. Water Sci. Technol. Water Supply 2017, 17, 1016–1021. [Google Scholar] [CrossRef]
  22. Sattar, A.M.; Soliman, M.; El-Ansary, A. Preliminary sizing of surge vessels on pumping mains. Urban Water J. 2019, 16, 738–748. [Google Scholar] [CrossRef]
  23. Shi, L.; Zhang, J.; Yu, X.D.; Wang, X.T.; Chen, X.Y.; Zhang, Z.X. Optimal volume selection of air vessels in long-distance water supply systems. AQUA—Water Infrastruct. Ecosyst. Soc. 2021, 70, 1053–1065. [Google Scholar] [CrossRef]
  24. Wan, W.; Zhang, B. Investigation of water hammer protection in water supply pipeline systems using an intelligent self-controlled surge tank. Energies 2018, 11, 1450. [Google Scholar] [CrossRef]
  25. Charlatte FAYAT Group. A.R.A.A. Dipping Tube Surge Vessel. SPT 140-04-GB. 1978. Available online: https://www.charlattereservoirs.fayat.com (accessed on 17 September 2023).
  26. Verhoeven, R.; Van Poucke, L.; Huygens, M. Waterhammer Protection with Air Vessels A Comparative Study. WIT Trans. Eng. Sci. 1998, 18, 3–14. Available online: https://www.witpress.com/elibrary/wit-transactions-on-engineering-sciences/18/6215 (accessed on 17 September 2023).
  27. Ruus, E.; Karney, B.; El-Fitiany, F.A. Charts for water hammer in low head pump discharge lines resulting from water column separation and check valve closure. Can. J. Civ. Eng. 1984, 11, 717–742. [Google Scholar] [CrossRef]
  28. Boulos, P.F.; Karney, B.W.; Wood, D.J.; Lingireddy, S. Hydraulic transient guidelines for protecting water distribution systems. J. Am. Water Work. Assoc. 2005, 97, 111–124. [Google Scholar] [CrossRef]
  29. Leruth, P.; Pothof, I. Innovative air vessel design for long distance water transmission pipelines. In Proceeding of the 11th International Conference on Pressure Surges, Lisbon, Portugal, 24–26 October 2012; BHR Group Ltd.: Lisbon, Portugal, 2012. [Google Scholar]
  30. Wang, R.; Li, P.; Wang, Z.; Zhang, F. Dipping Tube Hydropneumatic Tank Theory and Application in Water Distribution Systems. In Proceedings of the 2012 Second International Conference on Electric Technology and Civil Engineering, Washington, DC, USA, 18–20 May 2012; IEEE Computer Society: Washington, DC, USA, 2012; pp. 958–961. Available online: https://dl.acm.org/doi/proceedings/10.5555/2373291 (accessed on 17 September 2023).
  31. Wang, R.H.; Wang, Z.X.; Zhang, F.; Sun, J.L.; Wang, X.X.; Luo, J.; Yang, H.B. Hydraulic transient prevention with dipping tube hydropneumatic tank. Appl. Mech. Mater. 2013, 316, 762–765. [Google Scholar] [CrossRef]
  32. Moghaddas, S.M.; Samani, H.M.; Haghighi, A. Transient protection optimization of pipelines using air-chamber and air-inlet valves. KSCE J. Civ. Eng. 2017, 21, 1991–1997. [Google Scholar] [CrossRef]
  33. Hu, J.; Zhai, X.; Hu, X.; Meng, Z.; Zhang, J.; Yang, G. Water Hammer Protection Characteristics and Hydraulic Performance of a Novel Air Chamber with an Adjustable Central Standpipe in a Pressurized Water Supply System. Sustainability 2023, 15, 29730. [Google Scholar] [CrossRef]
  34. Bentley Systems. Bentley HAMMER Connect. 2023. Available online: https://www.bentley.com (accessed on 17 September 2023).
  35. Zhang, Z. Hydraulic Transients and Computations, 1st ed.; Springer International Publishing: Cham, Switzerland, 2020. [Google Scholar]
  36. Radi, A.; Poli, R. Genetic programming discovers efficient learning rules for the hidden and output layers of feedforward neural networks. In Genetic Programming: Second European Workshop, EuroGP’99 Göteborg, Sweden, 26–27 May 1999 Proceedings 2; Springer Science & Business Media: New York, NY, USA, 1999; pp. 120–134. [Google Scholar] [CrossRef]
  37. Ruus, E. Charts for water-hammer in pipelines with air chambers. Can. J. Civ. Eng. 1977, 4, 293–313. [Google Scholar] [CrossRef]
  38. Sharif, F.; Siosemarde, M.; Merufinia, E.; Esmatsaatlo, M. Comparative hydraulic simulation of water hammer in transition pipe line systems with different diameter and types. J. Civ. Eng. Urban. 2014, 4, 282–286, pii: S225204301400043-4. [Google Scholar]
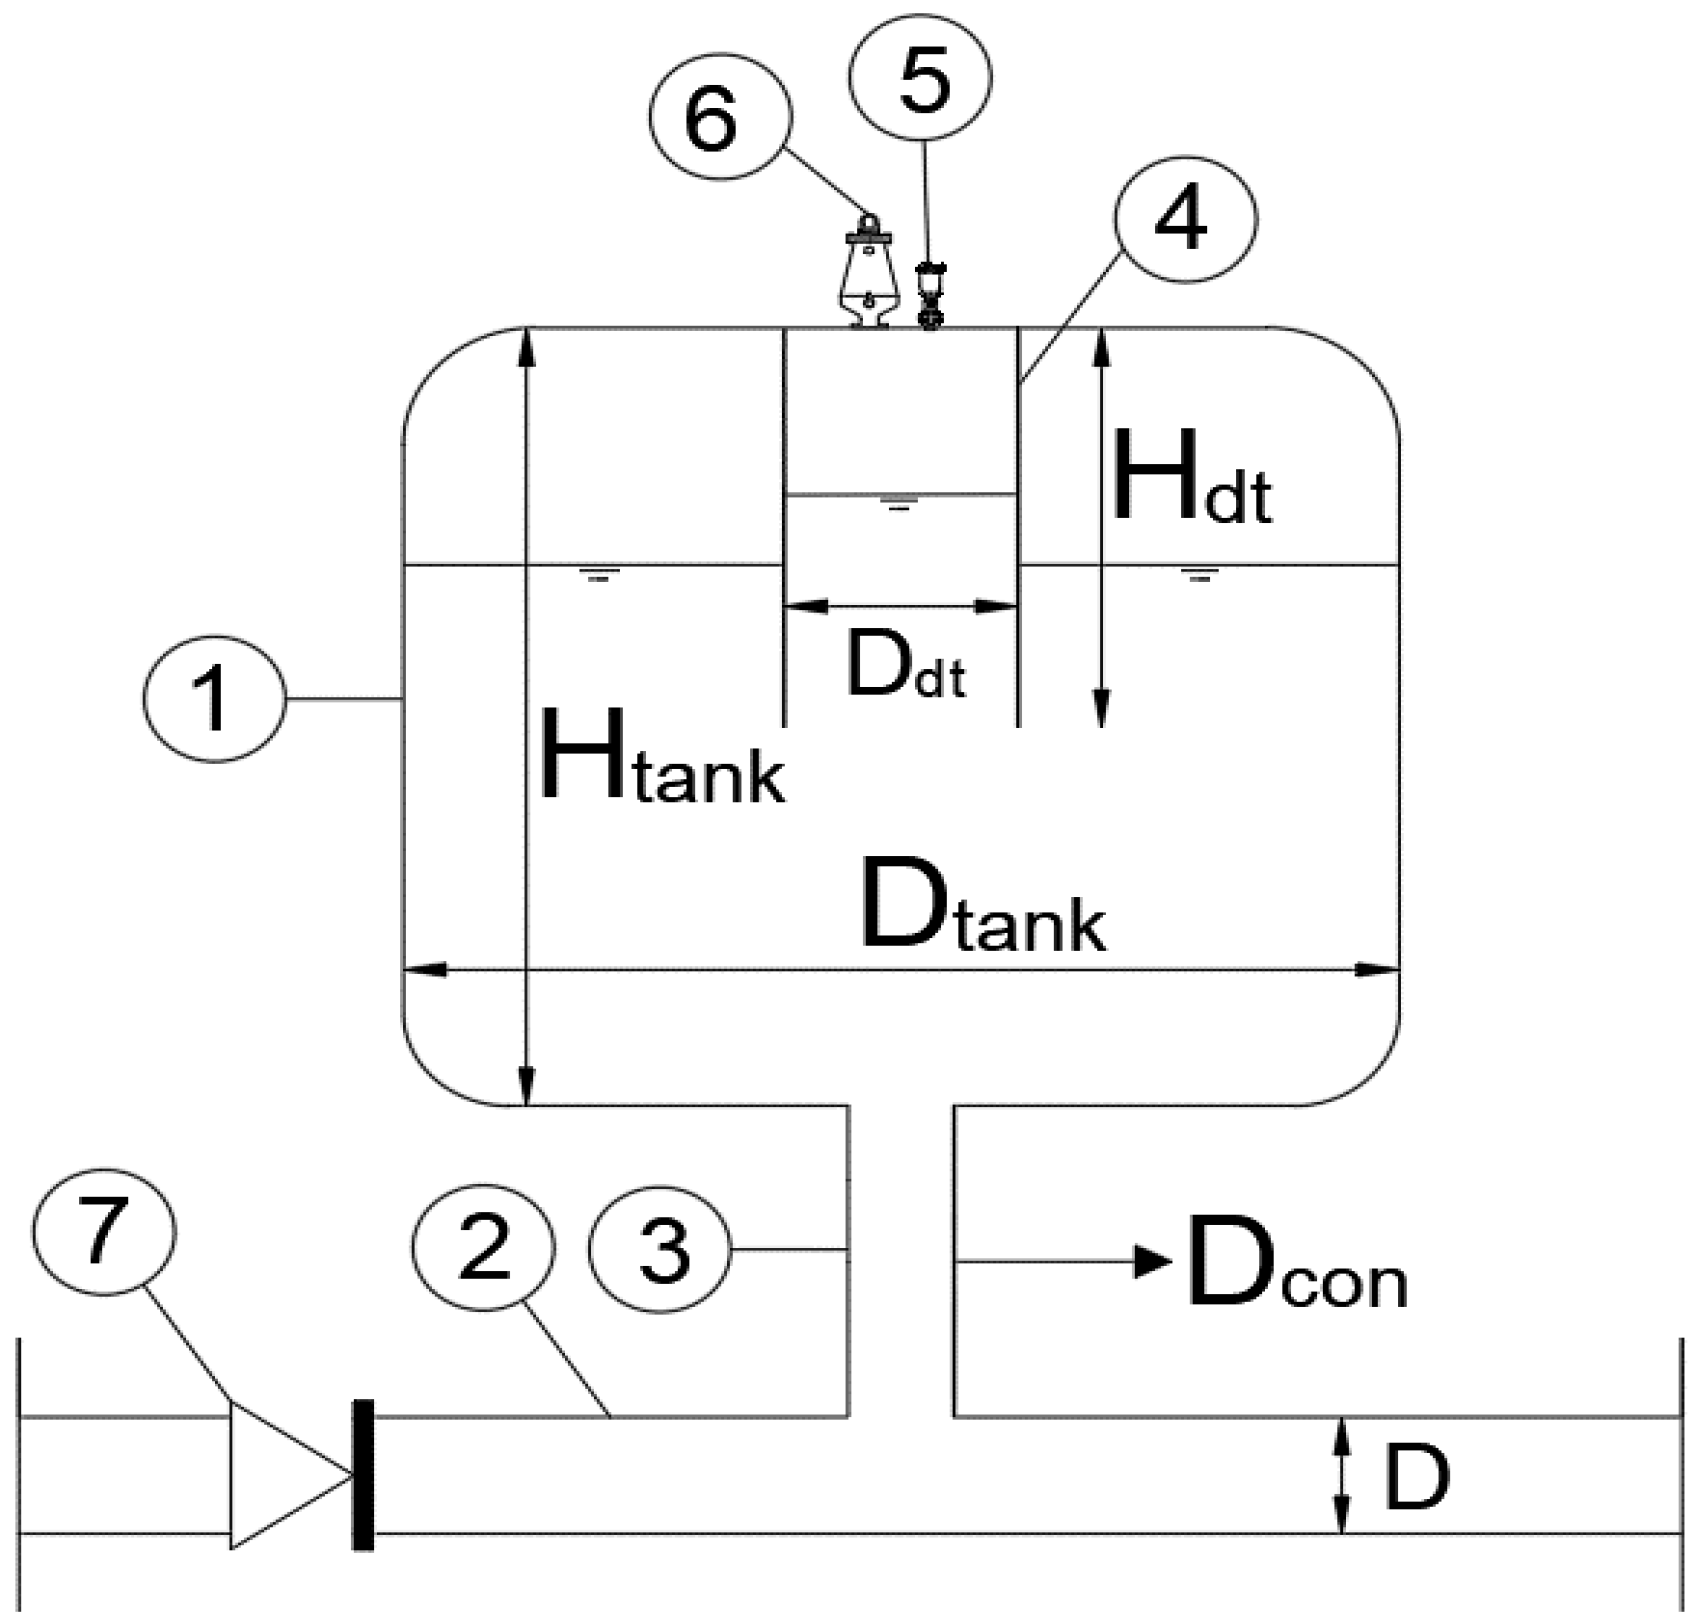
Figure 1. A schematic of a typical hybrid surge vessel for protection of low head pipelines (1-Hybrid surge vessel, 2-water main, 3-hybrid vessel inlet pipe, 4-dipping tube, 5-air release valve, 6-vacuum valve, 7-check valve).
Water 15 03525 g001
Figure 2. Stochastic Method of Characteristics/Monte Carlo Simulation framework for hybrid vessel sizing model development.
Water 15 03525 g002
Figure 3. Schematic of pumping main problem with hybrid vessel for surge protection.
Water 15 03525 g003
Figure 4. Changes in air volume during down surge protection inside surge vessel and hybrid surge vessel for the same pump failure case.
Water 15 03525 g004
Figure 5. Changes in vessel water flow during surge protection for surge and hybrid vessels for the same pump failure case.
Water 15 03525 g005
Figure 6. Changes in water level inside surge and hybrid vessel during surge protection for the same pump failure case.
Water 15 03525 g006
Figure 7. Variations in air pressure inside surge and hybrid vessel during surge protection for the same pump failure case.
Water 15 03525 g007
Figure 8. Changes in air volume inside normal and hybrid surge vessels for the same pump failure case.
Water 15 03525 g008
Figure 9. Maximum and minimum pressure heads with protection using normal and hybrid surge tanks.
Water 15 03525 g009
Figure 10. Expanded air volume for surge vessel and hybrid vessel versus pipeline slope.
Water 15 03525 g010
Figure 11. Probability distributions of (a) the calculated compression chamber; (b) initial; and (c) expanded air volumes.
Water 15 03525 g011aWater 15 03525 g011b
Figure 12. Method of Characteristic optimized c c , a i r o and a i r f versus that predicted by the genetic programming (GP) model.
Water 15 03525 g012aWater 15 03525 g012b
Figure 13. Method of Characteristics, MOC-optimized. a i r o versus that predicted by the classical design charts of [13,15].
Water 15 03525 g013aWater 15 03525 g013b
Figure 14. Method of Characteristics optimized initial air volume, a i r o versus: (a) D; (b) Hs; and (c) pipe friction losses as predicted by the genetic programming model and the classical design charts of [13,15] and GEP design model of [22].
Water 15 03525 g014
Figure 15. Hybrid Vessel selection based on developed down surge indices.
Water 15 03525 g015
Table 1. Performance indicators used for validation and testing of developed models.
Performance IndicatorEquationVariables
Coefficient of determination R i 2 = 1 n j = 1 n T j T ¯ P i j P ¯ j = 1 n T j T ¯ 2 / n j = 1 n P i j P ¯ 2 / n 2 P(ij) is the value predicted by the program, Tj is the target value, and n is the number of samples, P ¯ = 1 / n j = 1 n P j , R O 2 , R O 2 = 1 i = 1 n P i 2 1 k , k 2 / i = 1 n P i P ¯ 2
Root mean square error R M S E = j = 1 n T i P i 2 n
Coefficient of efficiencyEsn = 1 − i = 1 n ( T i P i ) 2 i = 1 n ( T i T ¯ ) 2
Index of agreementDag = 1 − i = 1 n ( T i P i ) 2 i = 1 n ( P i T ¯ + T i T ¯ ) 2
Gradients of the regression k = i = 1 n T i × P i / P i 2   or   k = i = 1 n T i × P i / T i 2
Slope of regression line m = R 2 R O 2 / R 2 and n = R 2 R O 2 / R 2
Cross testing coefficient R m = R 2 × 1 R 2 R O 2
Standard deviation errors S e = 1 / n 1 j = 1 n e j e ¯ 2 e j = P j T j
Table 2. Iterations required for reaching optimal hybrid vessel volume.
Iteration
Number
N t a n k t a n k
(m3)
H t a n k (m) D t a n k (m) a i r o
(m3)
c c
(m3)
a i r f
(m3)
t a n k / a i r f H m a x / H p u m p H m i n
(m)
12355.003.001.007.0021.361.641.03−5.21
22355.003.001.507.0021.761.601.05−4.51
32355.003.002.007.0022.681.551.04−3.70
42355.003.002.507.0023.511.481.04−3.00
52265.352.501.505.2521.001.231.05−3.34
62265.352.502.005.2521.721.201.04−2.51
72244.952.501.504.7520.391.171.15−3.59
82244.952.501.754.7520.741.151.14−3.12
92244.952.501.804.7520.901.141.15−2.91
102234.752.501.804.6220.501.111.21−3.00
Table 3. Single versus multiple hybrid surge vessels.
Case N t a n k D t a n k (m) H t a n k (m) t a n k (m3) a i r o (m3) a i r f (m3) a i r f (m3)
1134.3607.253.9653.96
22.95303.627.2354.46
32.45202.518.4655.38
21* 5.24.3901887.2487.24
3330629.4788.41
42.622.54.521.5986.36
Note: * Diameter is not feasible from manufacturing point of view, but shown as illustration.
Table 4. Range of input parameters used in the Monte Carlo simulations.
ParameterRange
Lower BoundUpper Bound
f0.0150.030
L (m)250015,000
v (m/s)0.52.5
D (m)0.252.0
Hs (m)540
a (m/s)2501400
Table 5. Least-square regression-vessel volume sensitivity results, S V i in percentage.
Volume (m3)fL
(m)
v (m/s)D
(m)
Hs (m)a
(m/s)
c c (m3)
c c 3.380.0010.0594.232.320.01--
a i r o 0.0010.2002.800.381.7595.11
a i r f 3.72.713.4389.390.660.066--
Table 6. Statistical performance of developed Genetic Programming prediction models.
ModelData PartitioningR2RMSERAEEsnDag
[13]NA0.25981.82−6.48−0.06
[15]NA0.173394.92−89.35−0.67
GP- c c Train0.88330.2580.880.94
Test0.81440.3340.780.89
GP- a i r o Train0.9480.190.940.97
Test0.94100.210.930.96
GP- a i r f Train0.96320.1490.950.98
Test0.97400.1440.970.98
Table 7. Range of parameters of classical design charts and the developed genetic programming models.
Parameter[13] GP - a i r o Parameter[15] GP - a i r o
S = a i r o a n A L v 0 to 1600 to 18 S = a i r o g H s + H B a r A L v 2 0.5 to 80.02 to 4.2
H m a x H s a v / g 0.1 to 10.03 to 2.6 H m a x + H B a r H s + H B a r 1 to 2.21.2 to 17.8
H m i n H s a v / g −0.8 to −0.1−0.74 to −0.03 H m i n + H B a r H s + H B a r 0.2 to 0.70.15 to 0.48
Table 8. Testing statistical measures for genetic programming prediction models (based on test dataset).
ModelR
(R > 0.8)
K
(0.85 < K < 1.15)
K′
(0.85 < K′ < 1.15)
m′
(m′ < 0.1)
n′
(n′ < 0.1)
GP- c c 0.961.010.97−0.09−0.09
GP- a i r o 0.981.020.97−0.03−0.03
GP- a i r f 0.991.040.95−0.010.00
Table 9. Uncertainty estimates for genetic programming prediction models (based on test dataset).
ModelMean Prediction ErrorDeviation of Prediction ErrorWidth of Uncertainty Band95% Prediction Error Interval
[13]- a i r o +0.310.51±1.01+0.01 to +51
[15]- a i r o +0.660.40±0.78+0.01 to +7.88
GP- c c −0.080.24±0.47+0.14 to +10.59
GP- a i r o 00.13±0.26+0.30 to +3.30
GP- a i r f −0.120.13±0.25+0.43 to +4.14
Disclaimer/Publisher’s Note: The statements, opinions and data contained in all publications are solely those of the individual author(s) and contributor(s) and not of MDPI and/or the editor(s). MDPI and/or the editor(s) disclaim responsibility for any injury to people or property resulting from any ideas, methods, instructions or products referred to in the content.