
Seepage Prediction Model for Roller-Compacted Concrete Dam Using Support Vector Regression and Hybrid Parameter Optimization


Abstract
:1. Introduction
- (1)
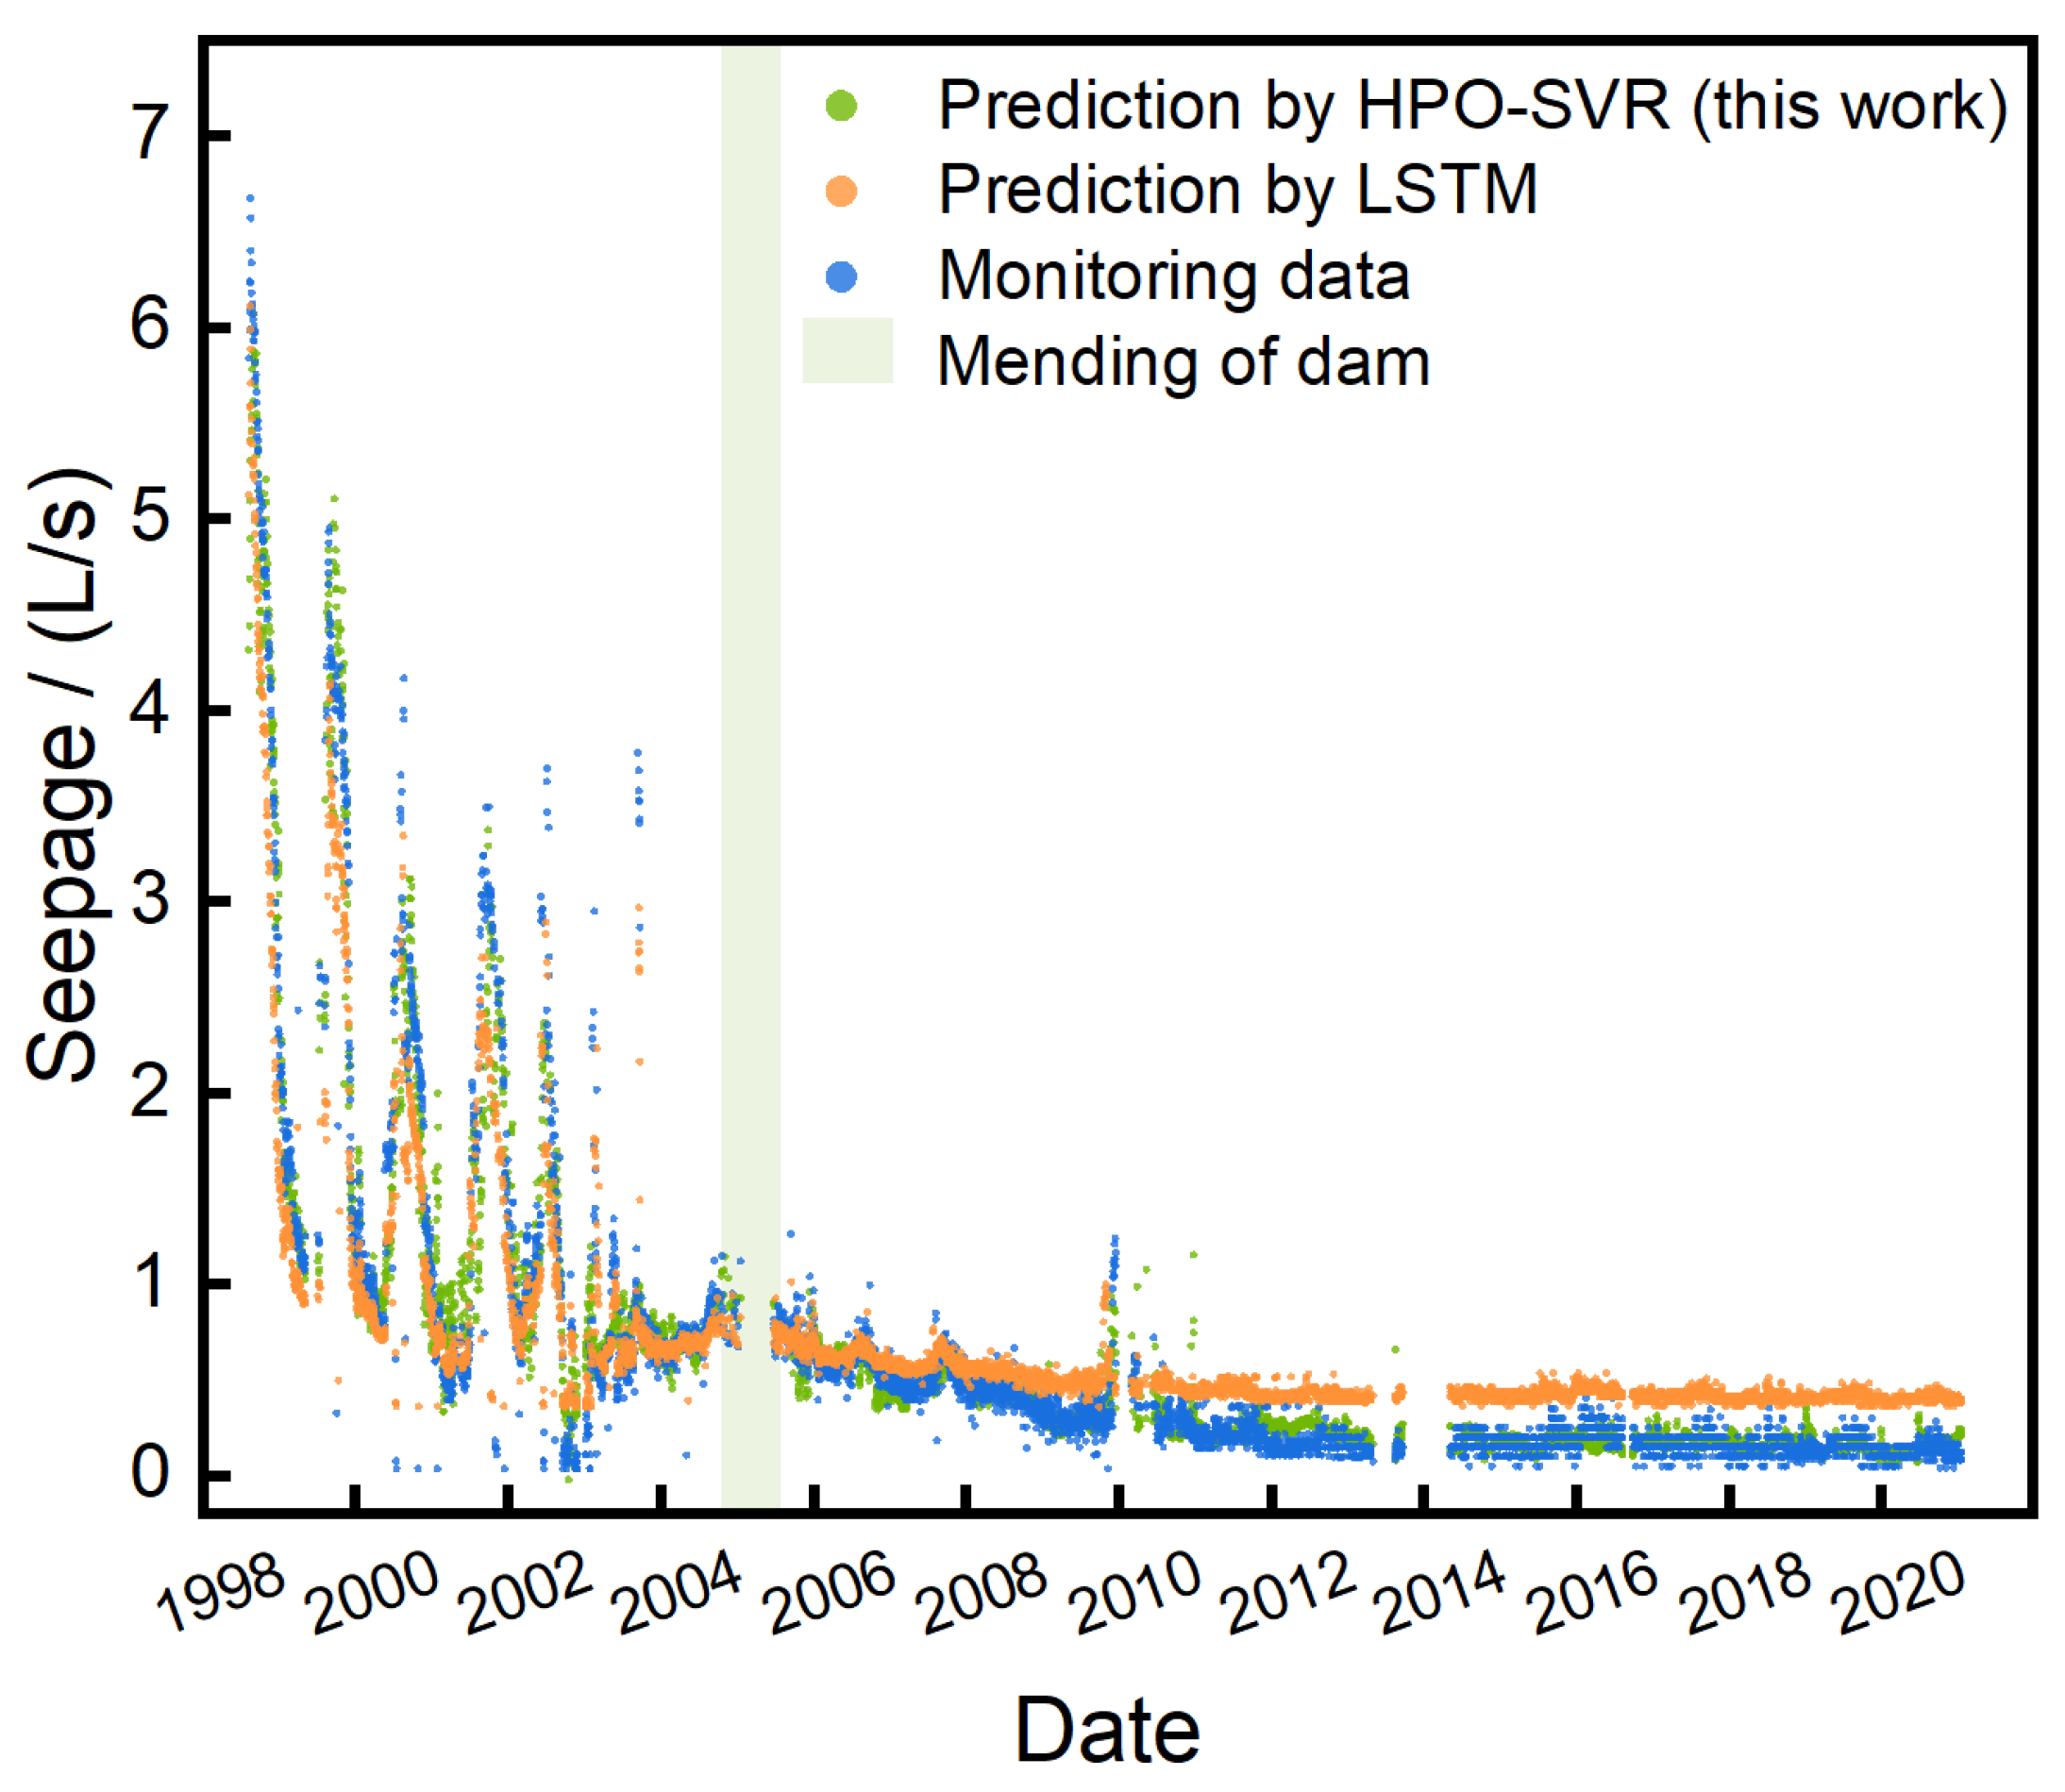
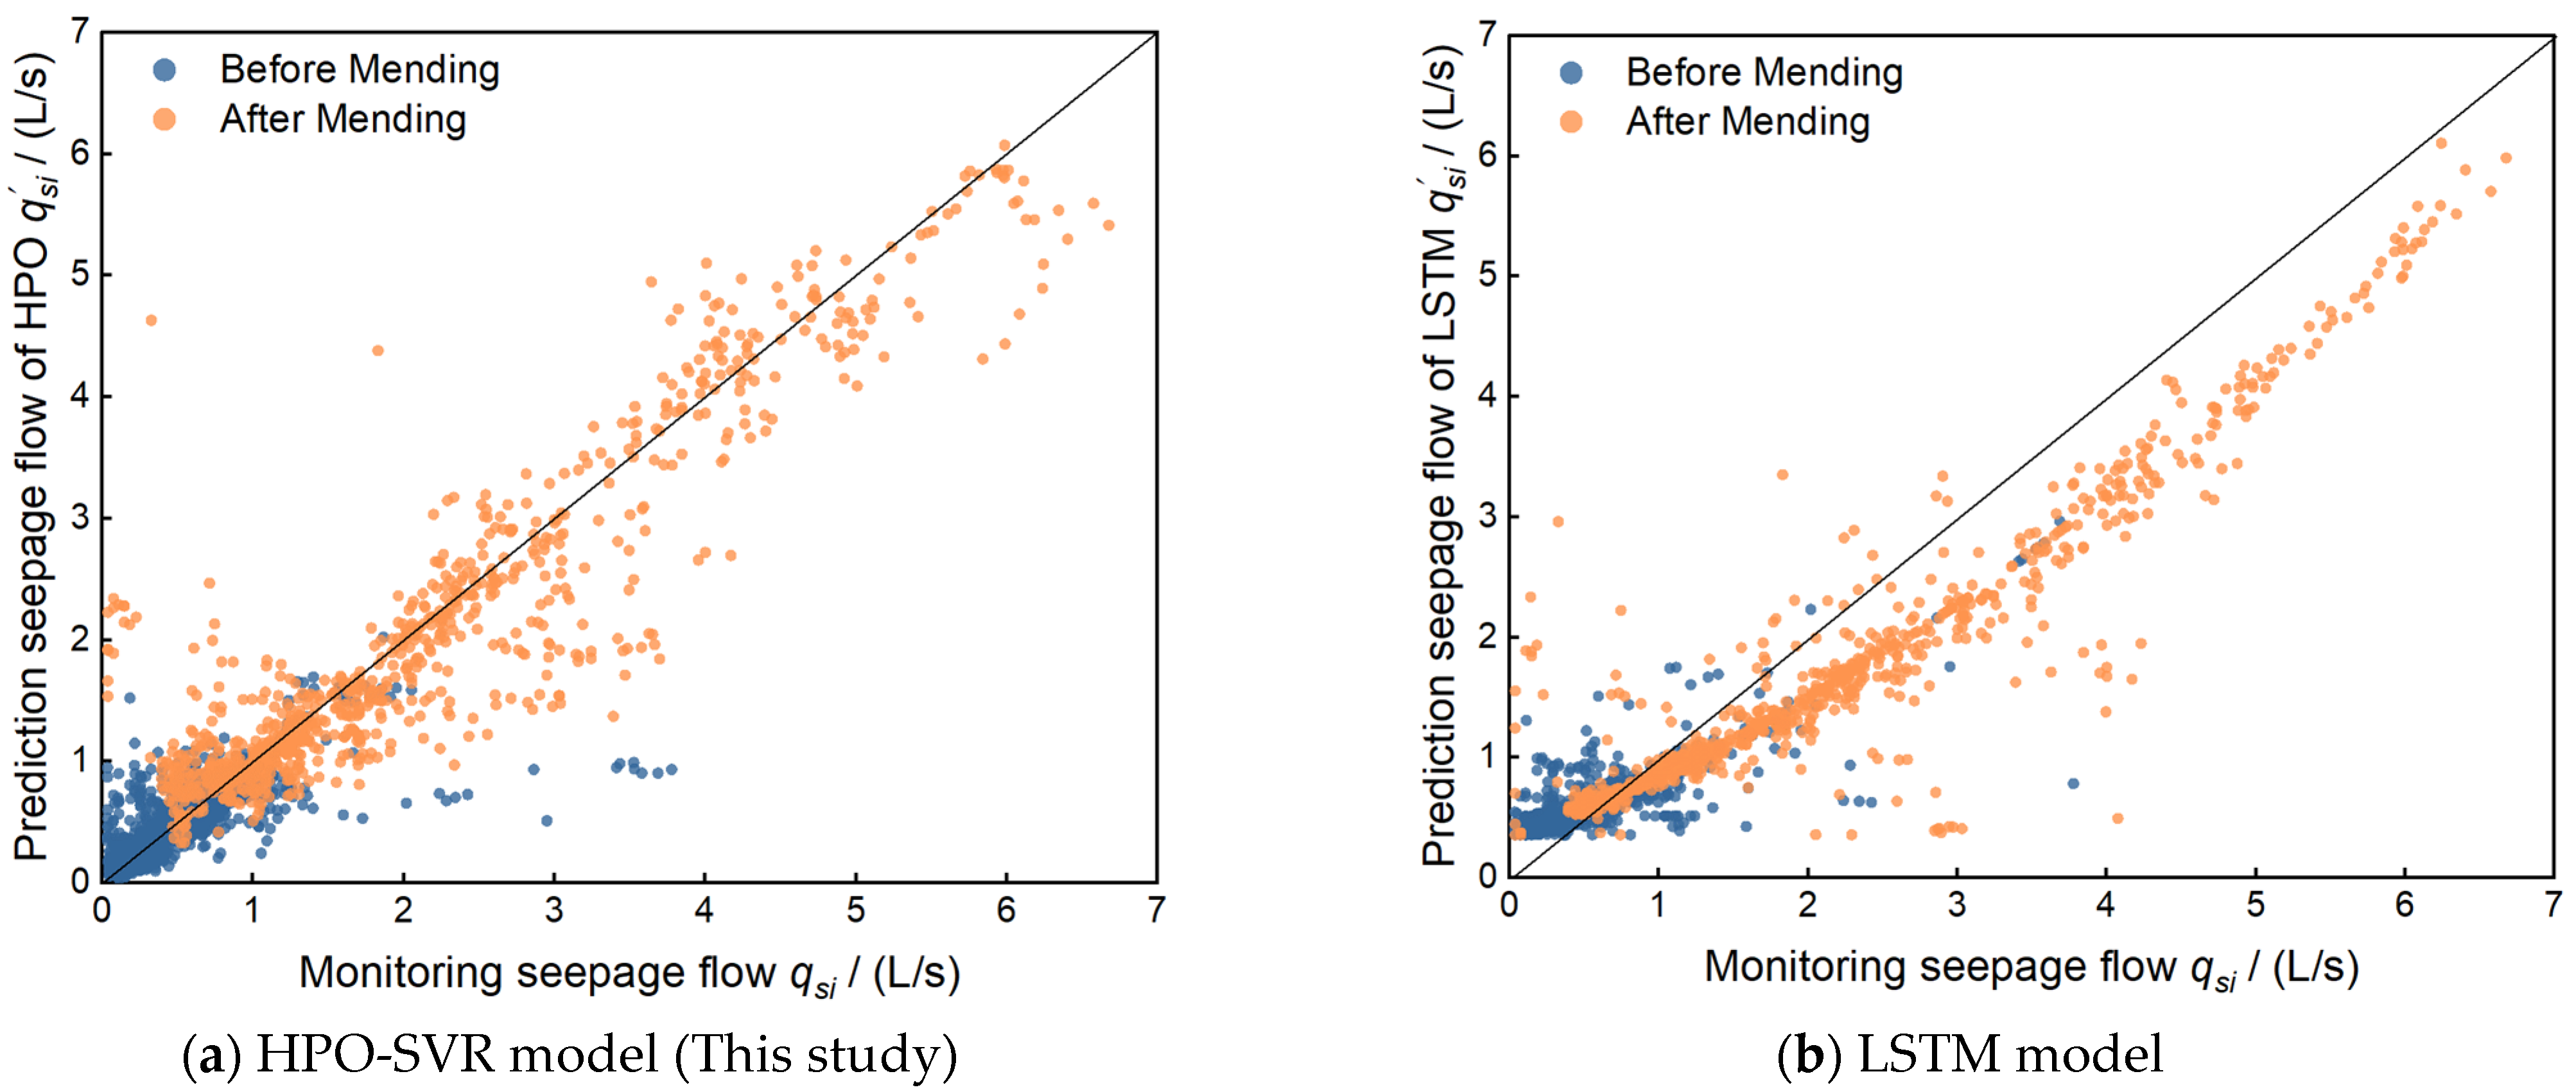
- A novel SVR-based prediction model for RCC dam seepage is proposed and evaluated using 22 years of monitoring data with two distinct seepage patterns (before and after dam reinforcements), demonstrating good prediction accuracy and robustness.
- (2)
- An HPO approach is introduced to screen the input factors of the SVR model, which combines the correlation analysis ability of GRA and the data dimensionality reduction capability of PCA.
- (3)
- The proposed SVR model incorporating HPO provides new insights for seepage research and safety monitoring of RCC dams, including the placement of uplift pressure orifices as well as the selection of the type and frequency of dam-monitoring data.
- (4)
- The methodology employed by HPO for the selection and screening of input parameters in seepage prediction models exhibits broader application potential in advanced prediction modeling work.
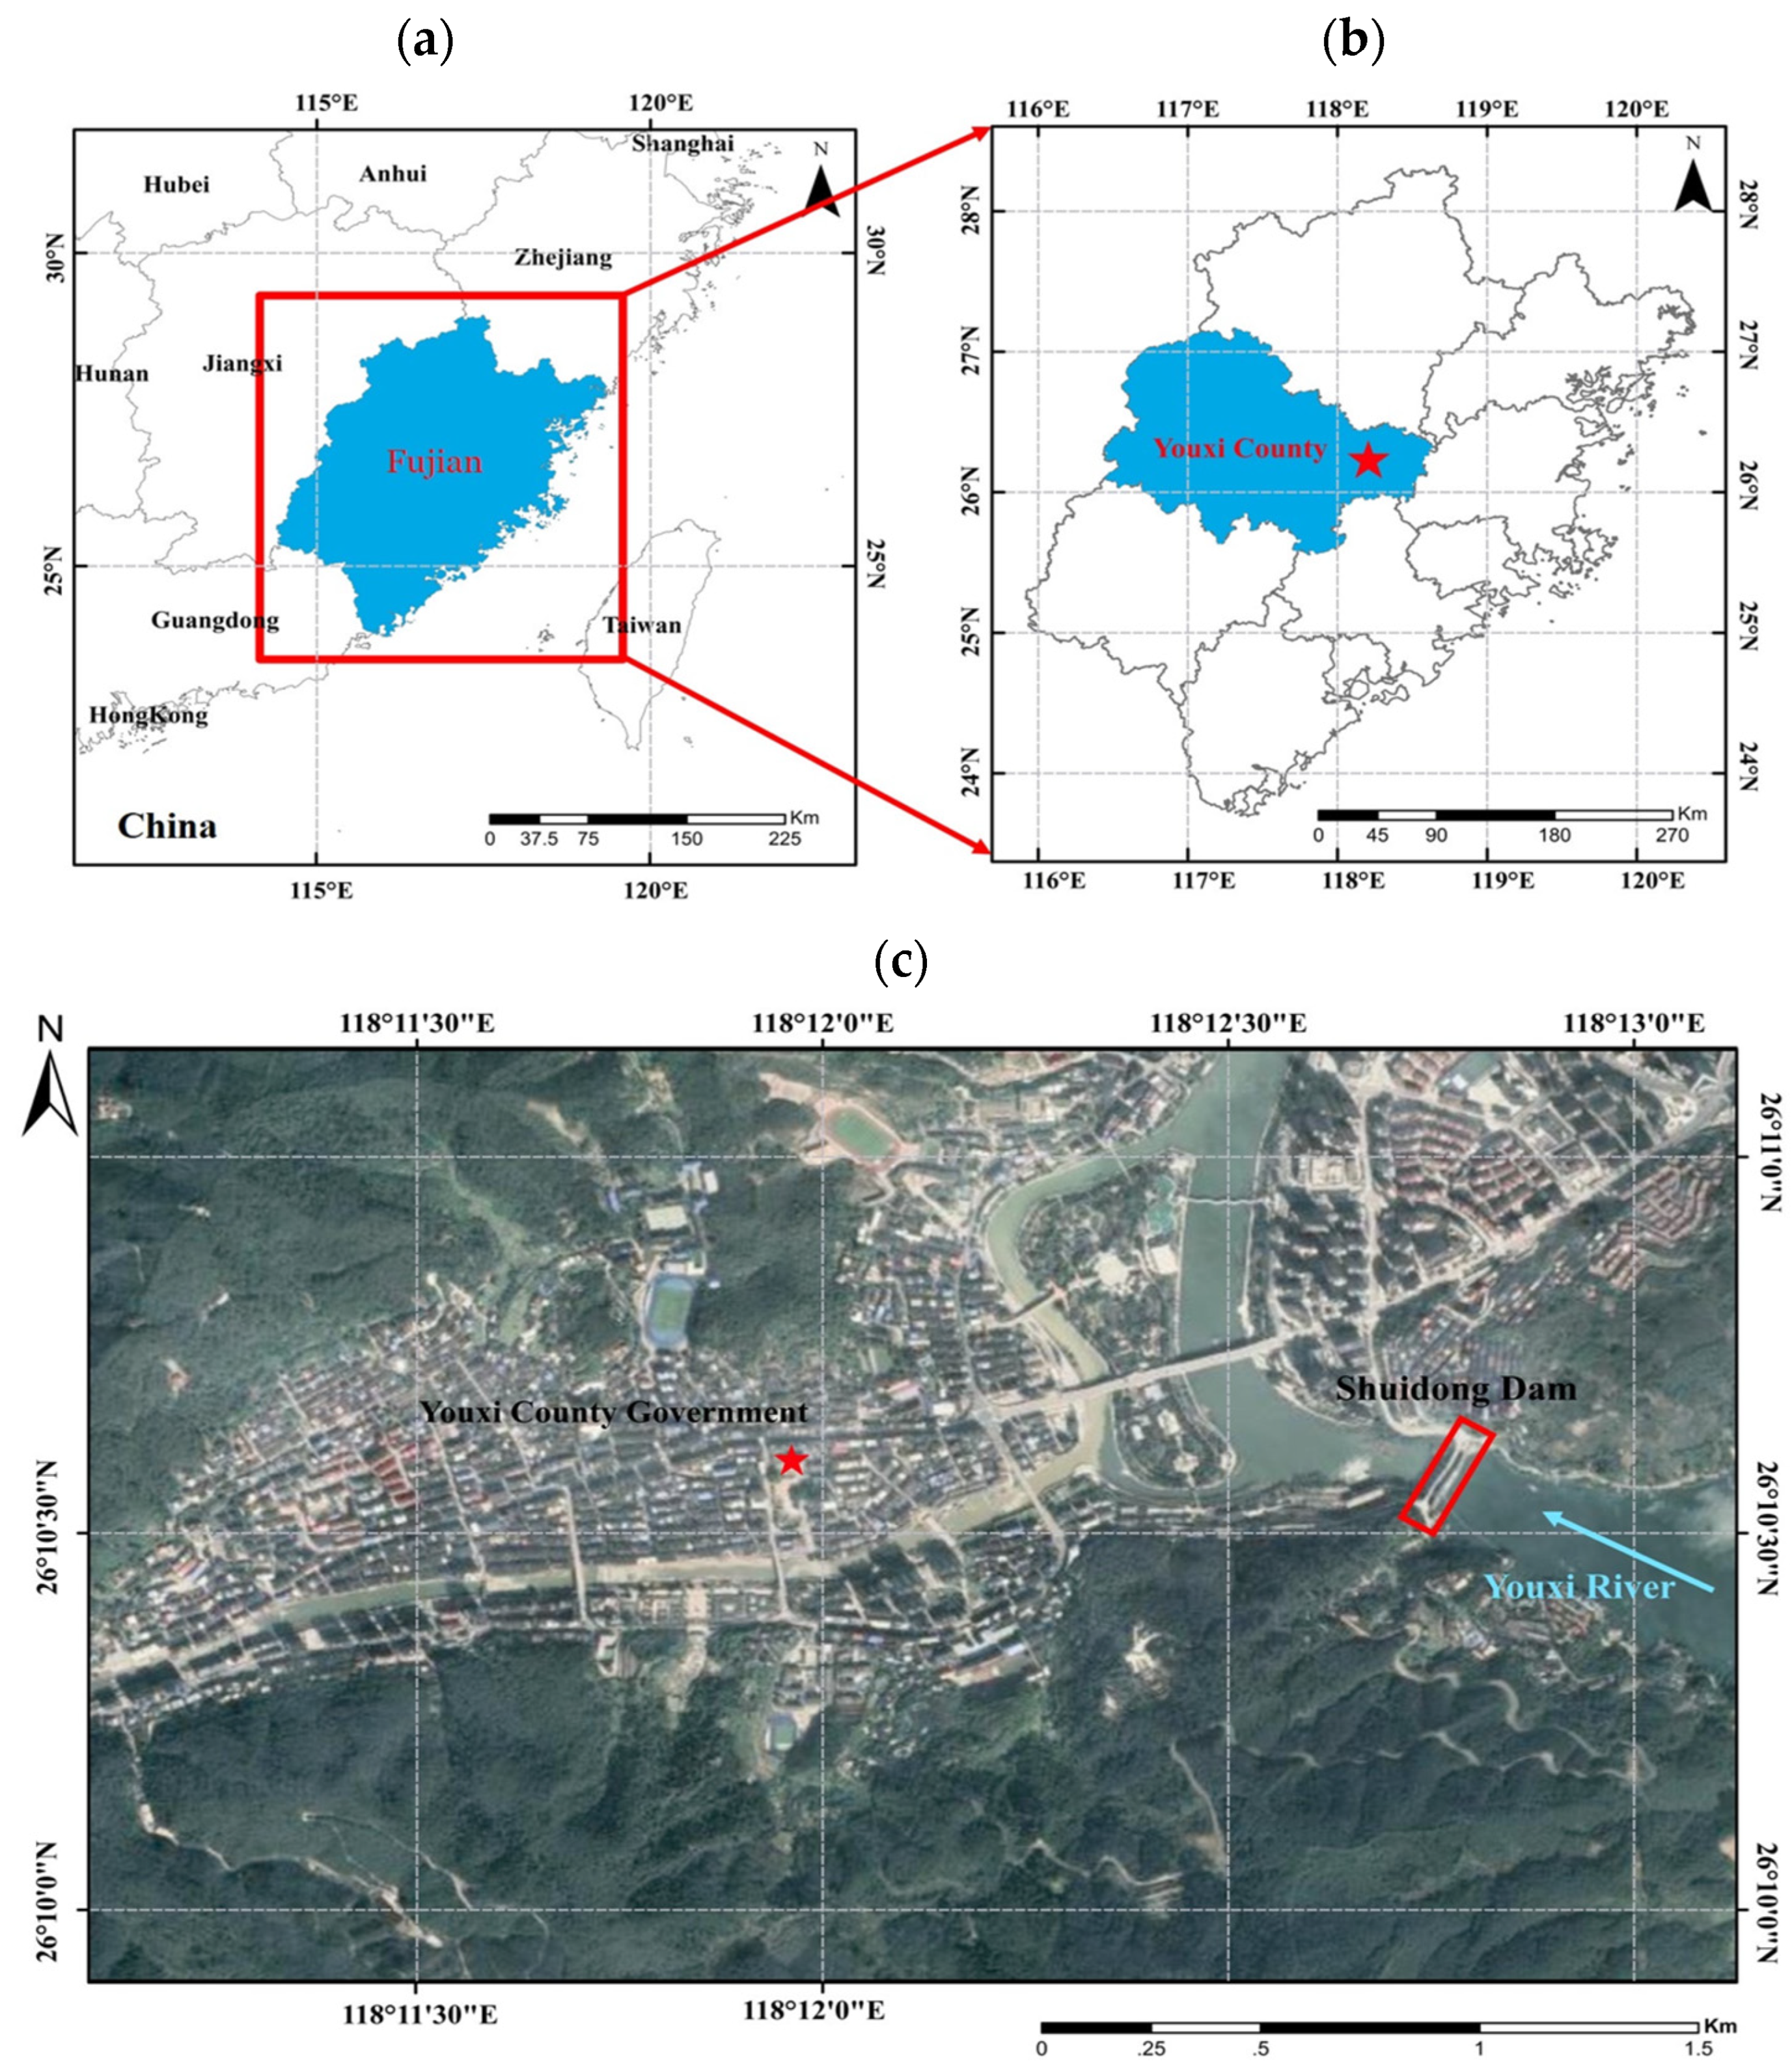
2. Study Area
2.1. Background on Shuidong Dam
2.2. Dataset Description
3. Methodology: Dam Seepage Model with Hybrid Parameter Optimization (HPO)
3.1. HPO
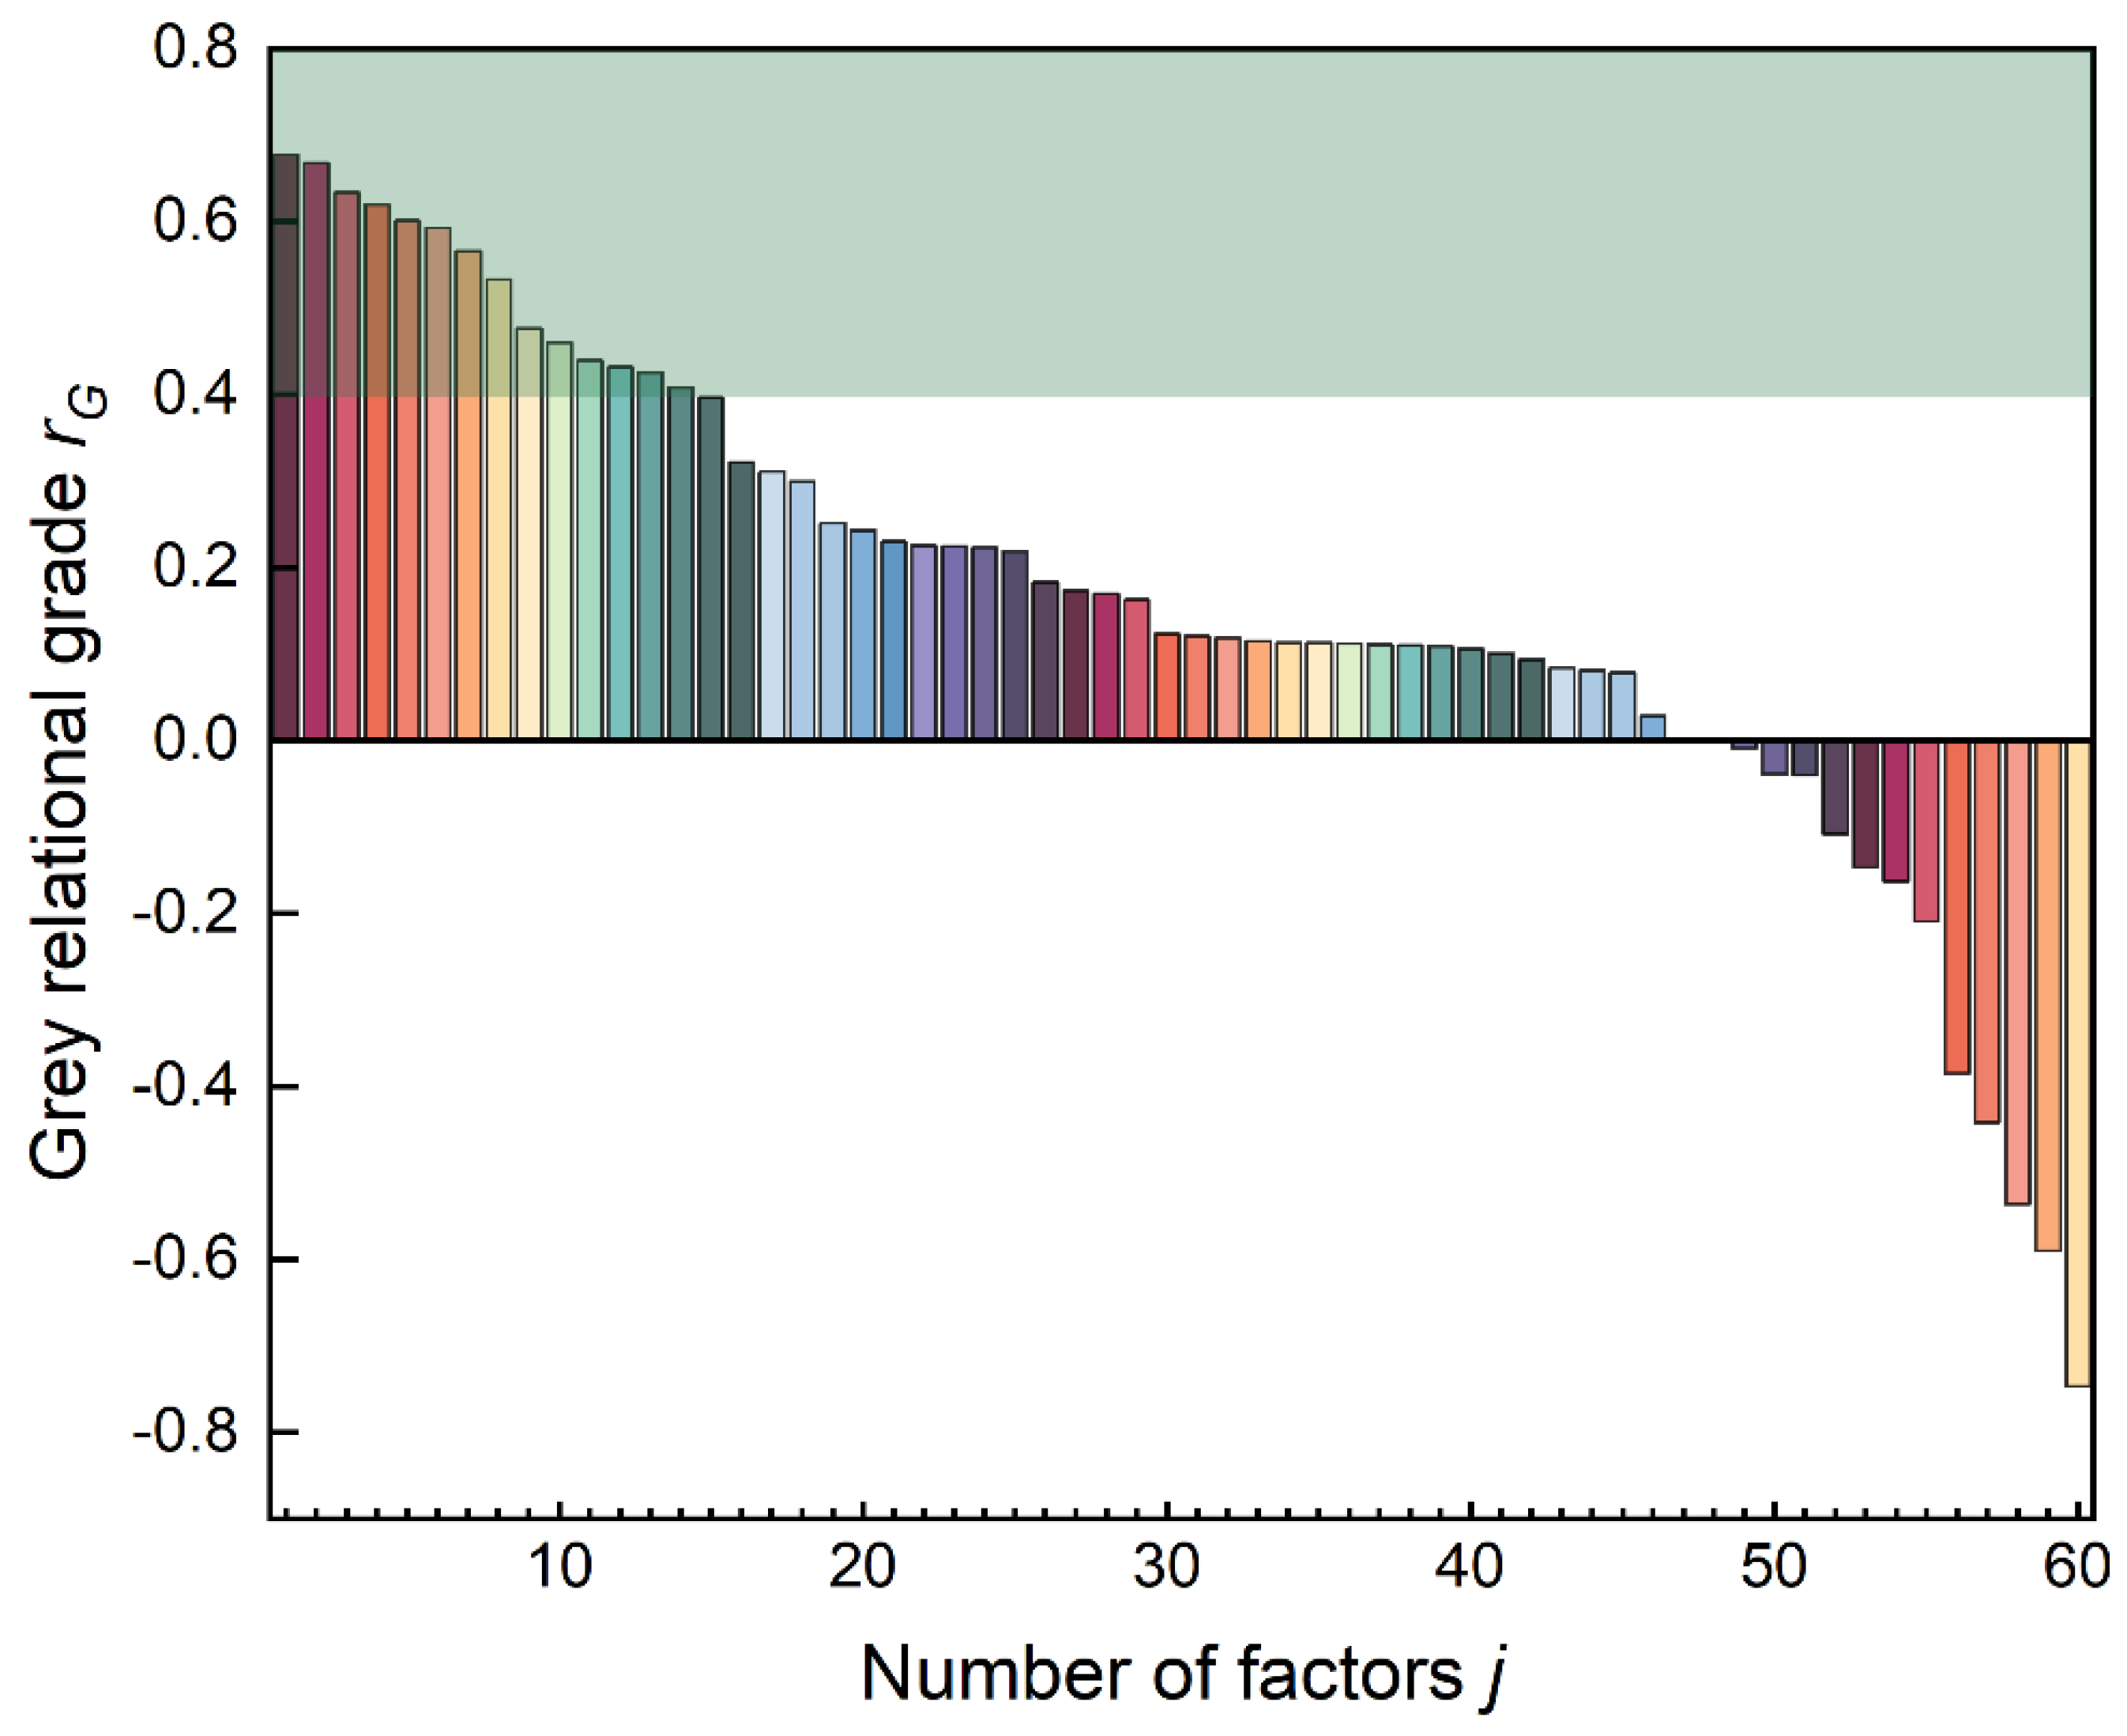
3.2. Grey Relational Analysis (GRA)
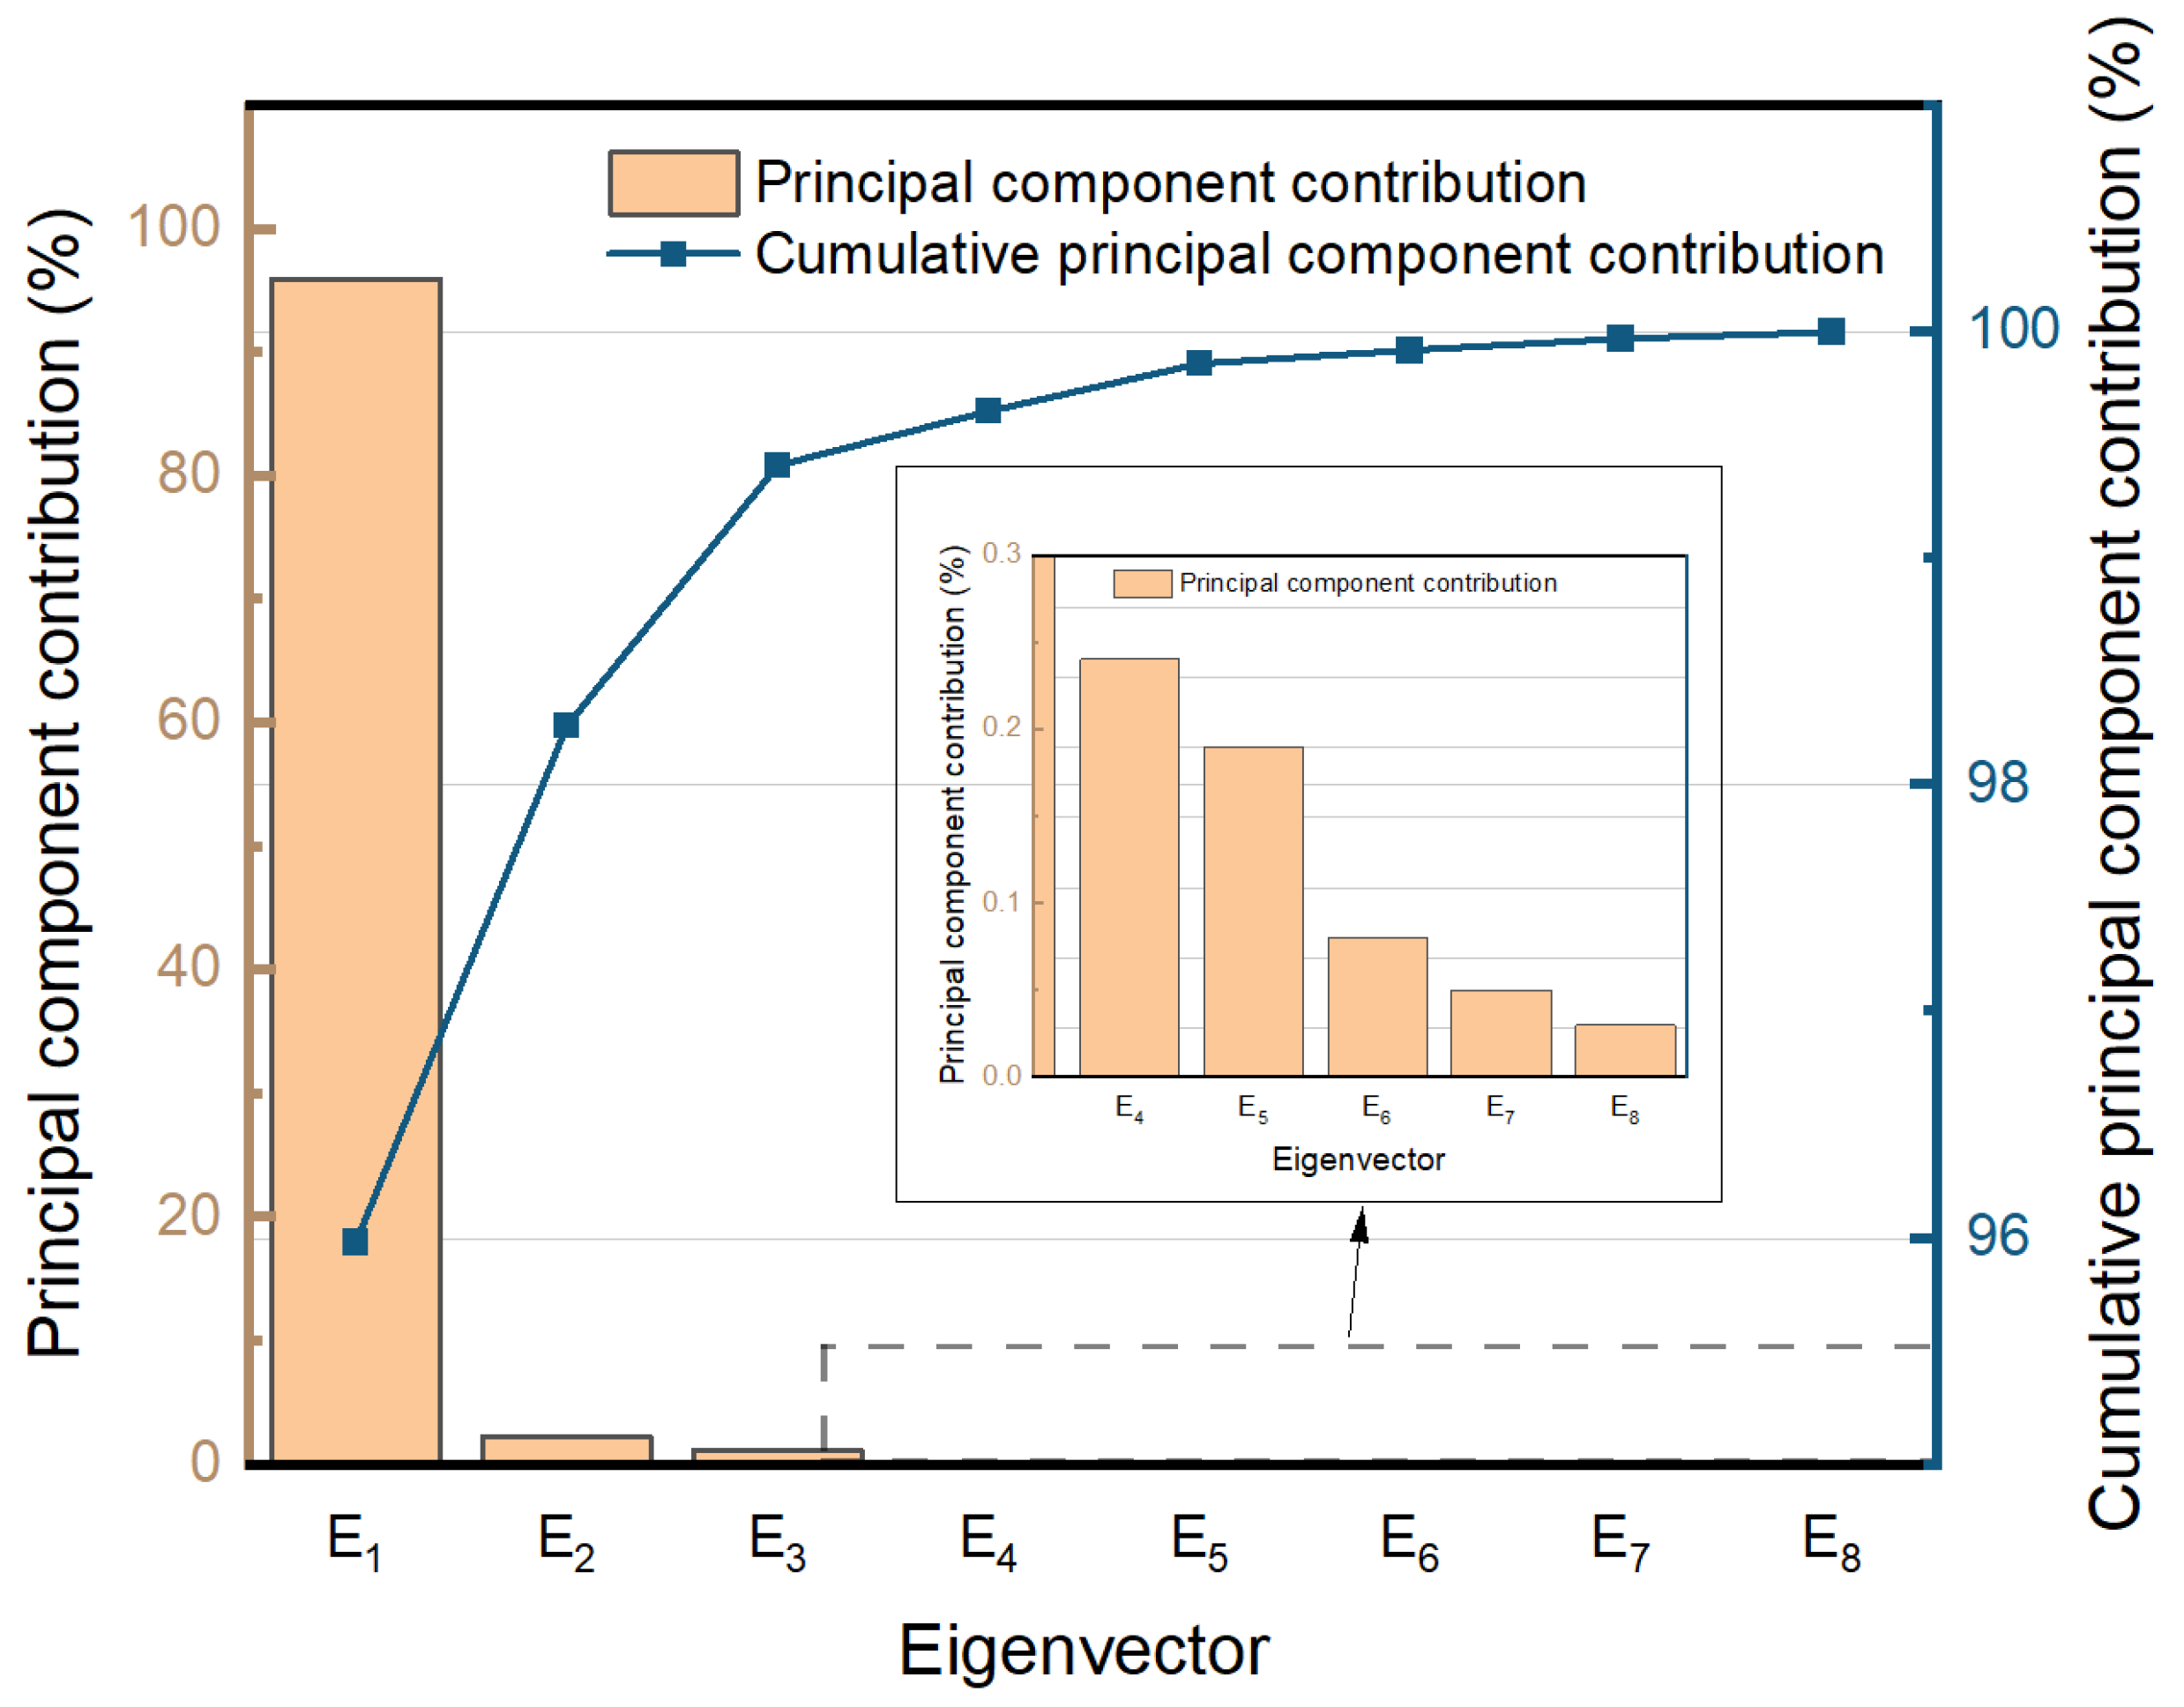
3.3. Principal Component Analysis (PCA)
3.4. Support Vector Regression (SVR)
4. Results and Discussions
4.1. HPO
4.1.1. GRA
4.1.2. Comparison with On-Site Investigation
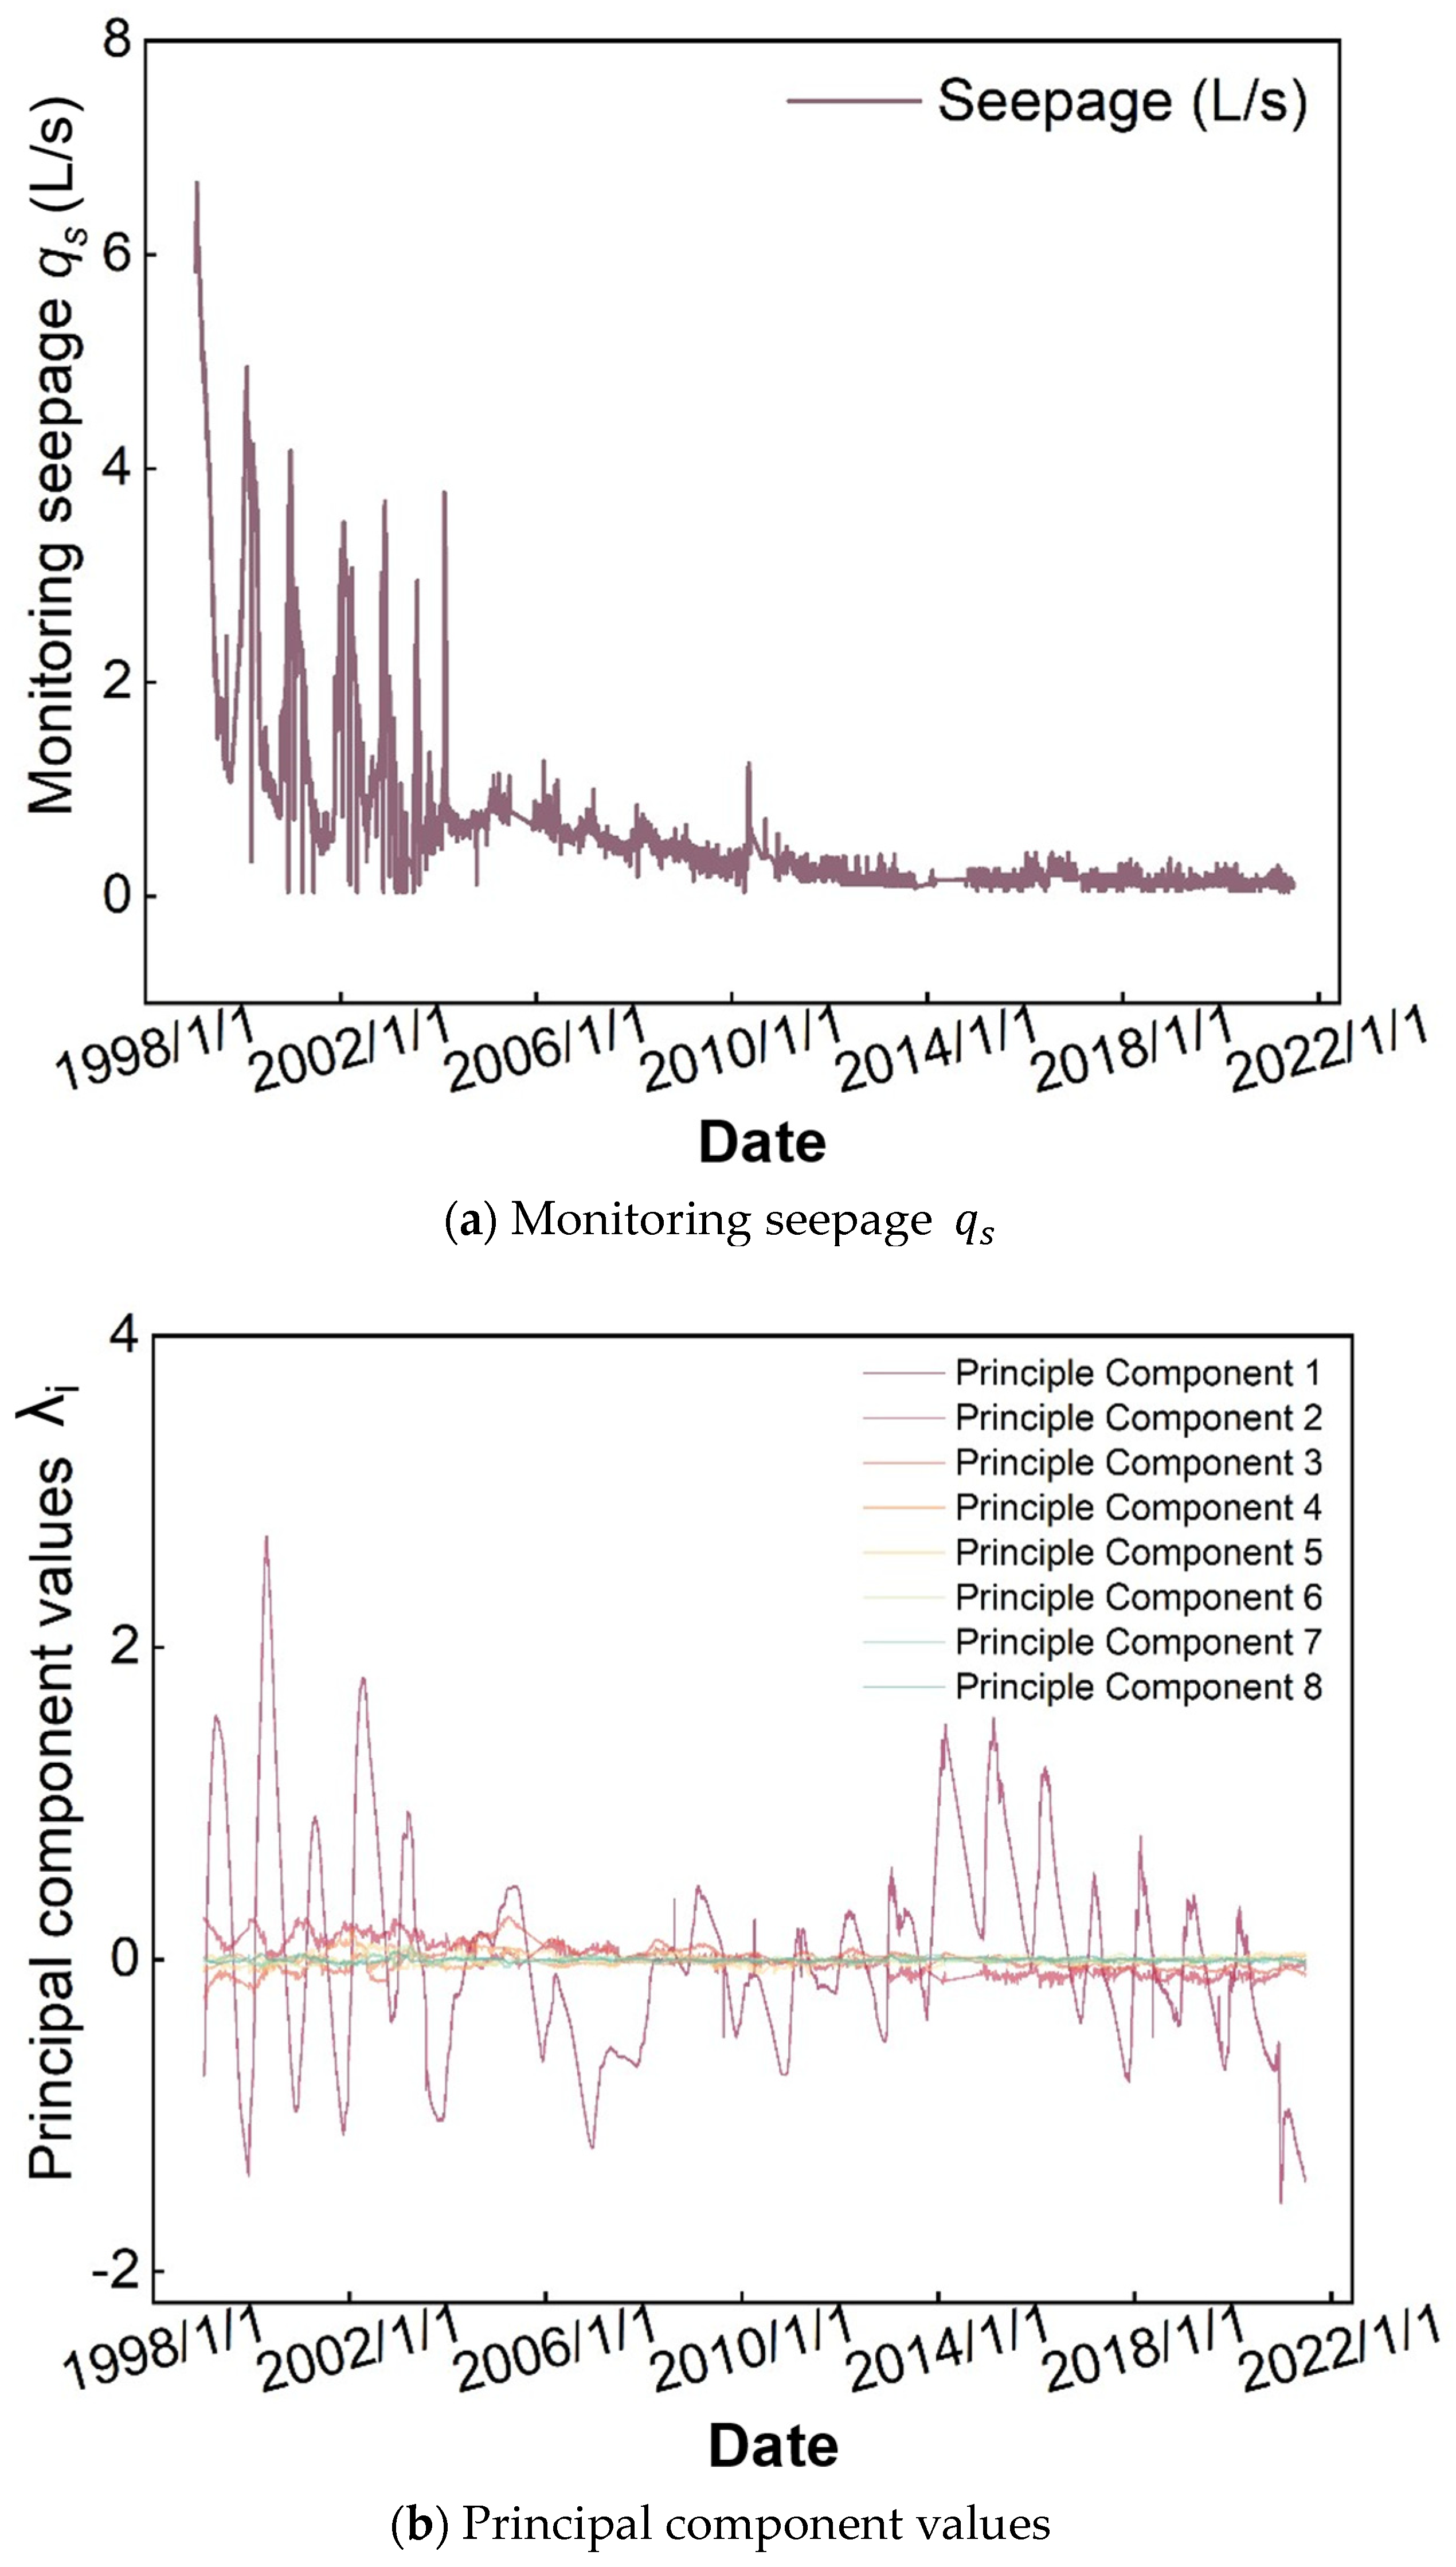
4.1.3. PCA
4.2. Dam Seepage Model Based on SVR
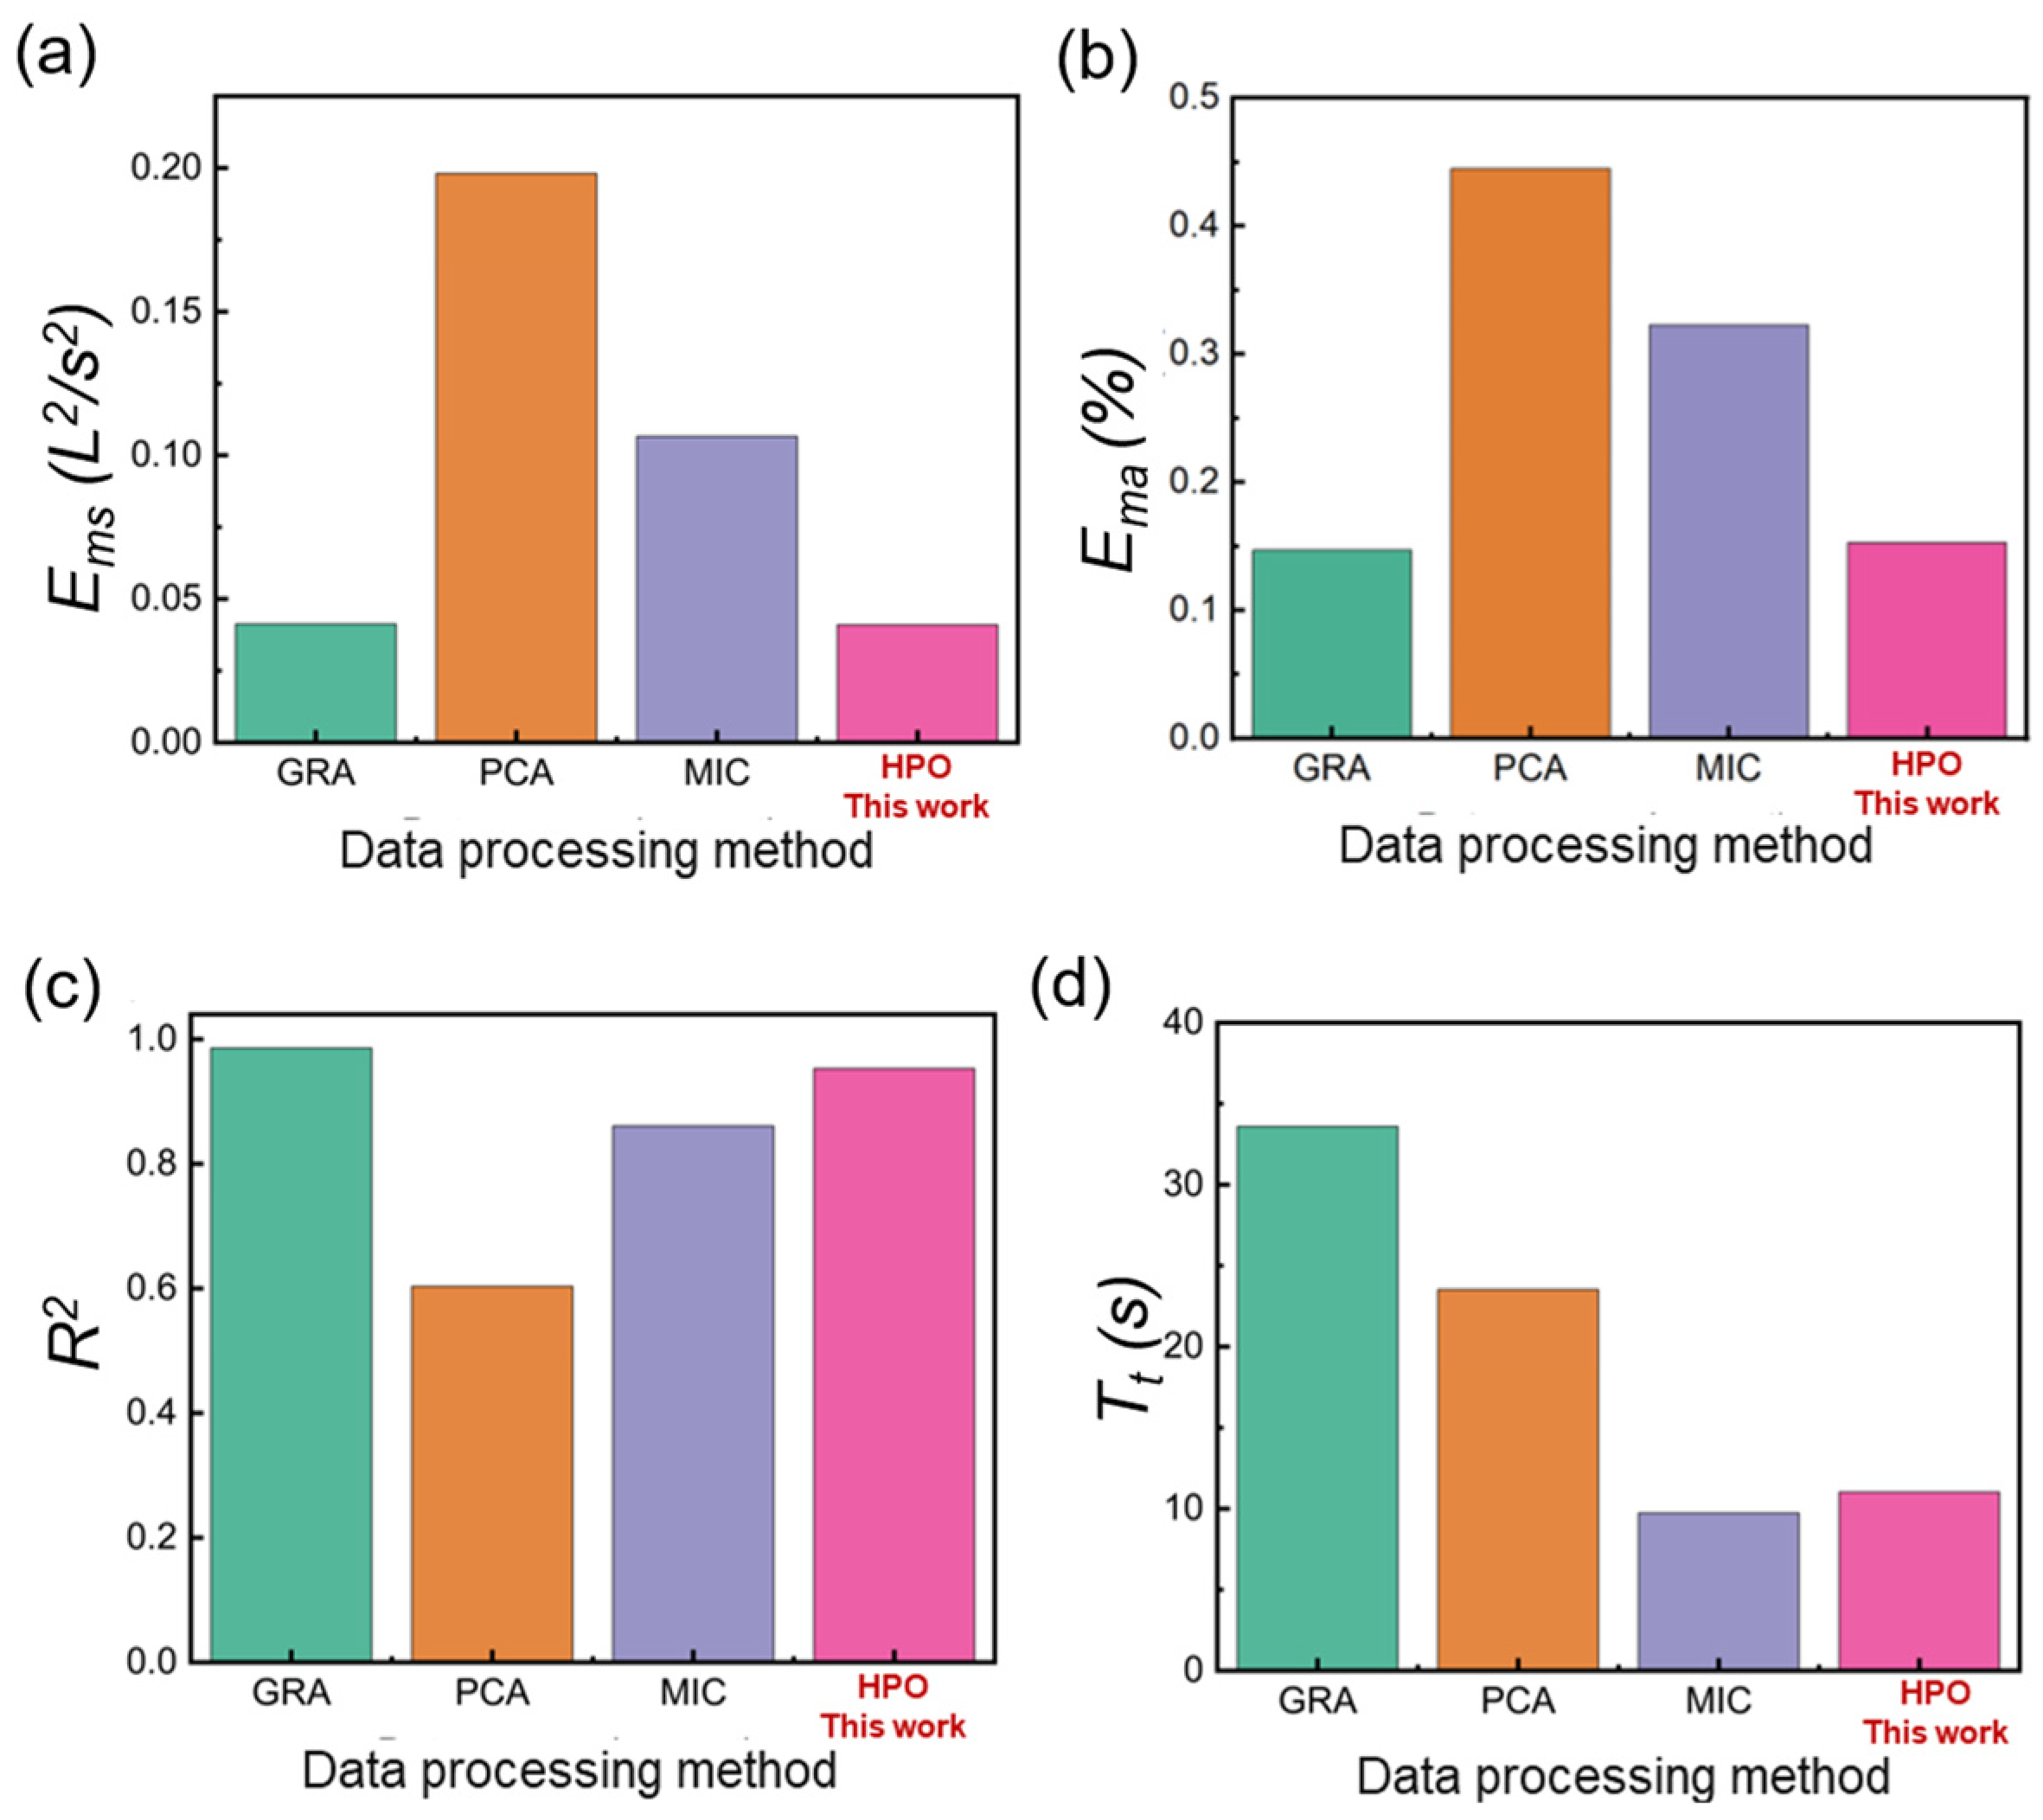
4.3. Comparison with Other Data Processing Methods
4.4. Comparison of Models
5. Conclusions and Recommendations
5.1. Conclusions
5.2. Recommendations
Author Contributions
Funding
Data Availability Statement
Acknowledgments
Conflicts of Interest
Appendix A
Appendix A.1. Input Factors xj of GRA

| Number j | Factors xj |
|---|---|
| 1 | : Uplift pressure coefficient at location UP11 |
| 2 | : Uplift pressure coefficient at location UP01 |
| 3 | : Accumulated vertical displacement at location L2 (mm) |
| 4 | : Uplift pressure coefficient at location UP04 |
| 5 | : Uplift pressure coefficient at location UP06 |
| 6 | : Uplift pressure coefficient at location UP12 |
| 7 | : Accumulated horizontal displacement at location I3 (mm) |
| 8 | : Uplift pressure coefficient at location UP02 |
| 9 | : Accumulated vertical displacement at location L7 (mm) |
| 10 | : Accumulated horizontal displacement at location I1 (mm) |
| 11 | : Uplift pressure coefficient at location UP03 |
| 12 | : Accumulated vertical displacement at location L5 (mm) |
| 13 | : Air temperature at location UP04 (°C) |
| 14 | : Accumulated horizontal displacement at location I2 (mm) |
| 15 | : Accumulated vertical displacement at location L3 (mm) |
| 16 | : Uplift pressure coefficient at location UP10 |
| 17 | : Water level difference between upstream and downstream water levels, (m) |
| 18 | : Air temperature at location UP08 (°C) |
| 19 | Upstream water level (m) |
| 20 | Elevation at location L8 (m) |
| 21 | Elevation at location L4 (m) |
| 22 | Date in day |
| 23 | : Accumulated vertical displacement at location L4 (mm) |
| 24 | Elevation at location L6 (m) |
| 25 | Date in month |
| 26 | Date in quarter |
| 27 | : Interval horizontal displacement at location I2 (mm) |
| 28 | : Uplift pressure coefficient at location UP05 |
| 29 | : Accumulated vertical displacement at location L6 (mm) |
| 30 | : Interval horizontal displacement at location I1 (mm) |
| 31 | : Interval horizontal displacement at location I3 (mm) |
| 32 | : Interval vertical displacement at location L3 (mm) |
| 33 | : Interval vertical displacement at location L2 (mm) |
| 34 | : Interval vertical displacement at location L7 (mm) |
| 35 | : Uplift pressure coefficient at location UP09 |
| 36 | : Interval vertical displacement at location L6 (mm) |
| 37 | : Uplift pressure coefficient at location UP08 |
| 38 | : Interval vertical displacement at location L5 (mm) |
| 39 | : Accumulated vertical displacement at location L8 (mm) |
| 40 | : Air temperature at location UP02 (°C) |
| 41 | : Interval vertical displacement at location L8 (mm) |
| 42 | : Air temperature at location UP05 (°C) |
| 43 | : Air temperature at location UP03 (°C) |
| 44 | : Air temperature at location UP10 (°C) |
| 45 | : Interval vertical displacement at location L4 (mm) |
| 46 | : Air temperature at location UP07 (°C) |
| 47 | : Air temperature at location UP13 (°C) |
| 48 | : Uplift pressure coefficient at location UP13 |
| 49 | : Air temperature at location UP01 (°C) |
| 50 | : Air temperature at location UP11 (°C) |
| 51 | : Air temperature at location UP12 (°C) |
| 52 | : Air temperature at location UP06 (°C) |
| 53 | : Air temperature at location UP09 (°C) |
| 54 | : Uplift pressure coefficient at location UP07 |
| 55 | Downstream water level (m) |
| 56 | Elevation at location L3 (m) |
| 57 | Elevation at location L7 (m) |
| 58 | Elevation at location L2 (m) |
| 59 | Elevation at location L5 (m) |
| 60 | Date in year |
Appendix A.2. Hyperparameter Optimization
| K | Training R2 | Prediction R2 |
|---|---|---|
| 2 | 0.9187 | 0.8931 |
| 3 | 0.9088 | 0.9077 |
| 4 | 0.9065 | 0.9211 |
| 5 | 0.9078 | 0.9378 |
| 6 | 0.8993 | 0.9122 |
| 7 | 0.8913 | 0.8999 |
| 8 | 0.9021 | 0.9080 |
| 10 | 0.8773 | 0.8957 |

References
- Brigandì, G.; Candela, A.; Aronica, G.T. Analysis of the Effects of Reservoir Operating Scenarios on Downstream Flood Damage Risk Using an Integrated Monte Carlo Modelling Approach. Water 2023, 15, 550. [Google Scholar]
- Fang, C.; Duan, Y. Statistical Analysis of Dam-Break Incidents and Its Cautions. Yangtze River 2010, 41, 96–101. (in Chinese). [Google Scholar] [CrossRef]
- Terzaghi, K. Theoretical Soil Mechanics; John Wiley & Sons, Inc.: Hoboken. NJ, USA, 1943. [Google Scholar] [CrossRef]
- Chai, J. On Mathematical Model for Coupled Seepage and Temperature Field in Concrete Dam. Chin. J. Hydroelectr. Power 2000, 1, 27–35. [Google Scholar]
- Wu, Z.; Song, H. Study on Shallow Geothermal Field and Seepage Field Coupling Based on Lu Model. J. Hydraul. Eng. 2015, 46, 326–333. [Google Scholar]
- Cao, B.; Yang, J.; Chen, L.; Zhang, A.; Mao, H. Finite Element Simulation of Seepage Thermal Monitoring of Earth-Rock Dam Based on COMSOL. In Proceedings of the Third International Conference on Optoelectronic Science and Materials (ICOSM 2021), Hefei, China, 10–12 September 2021; Chen, S., Wang, P., Eds.; SPIE: Bellingham, WA, USA, 2021; p. 38. [Google Scholar] [CrossRef]
- Chen, S.; Gu, C.; Lin, C.; Zhao, E.; Song, J. Safety monitoring model of a super-high concrete dam by using RBF neural network coupled with kernel principal component analysis. Math. Probl. Eng. 2018, 2018, 1712653. [Google Scholar]
- Yu, Y.; Liu, X.; Wang, E.; Fang, K.; Huang, L. Dam safety evaluation based on multiple linear regression and numerical simulation. Rock Mech. Rock Eng. 2018, 51, 2451–2467. [Google Scholar]
- Tatin, M.; Briffaut, M.; Dufour, F.; Simon, A.; Fabre, J.P. Thermal displacements of concrete dams: Accounting for water temperature in statistical models. Eng. Struct. 2015, 91, 26–39. [Google Scholar] [CrossRef]
- Milillo, P.; Perissin, D.; Salzer, J.T.; Lundgren, P.; Lacava, G.; Milillo, G.; Serio, C. Monitoring dam structural health from space: Insights from novel InSAR techniques and multi-parametric modeling applied to the Pertusillo dam Basilicata, Italy. Int. J. Appl. Earth Obs. Geoinf. 2016, 52, 221–229. [Google Scholar] [CrossRef]
- Ren, Q.; Li, M.; Song, L.; Liu, H. An optimized combination prediction model for concrete dam deformation considering quantitative evaluation and hysteresis correction. Adv. Eng. Inform. 2020, 46, 101154. [Google Scholar]
- Jin, X.-B.; Wang, Z.-Y.; Kong, J.-L.; Bai, Y.-T.; Su, T.-L.; Ma, H.-J.; Chakrabarti, P. Deep Spatio-Temporal Graph Network with Self-Optimization for Air Quality Prediction. Entropy 2023, 25, 247. [Google Scholar] [CrossRef]
- Jiang, W.; Zhu, G.; Shen, Y.; Xie, Q.; Ji, M.; Yu, Y. An Empirical Mode Decomposition Fuzzy Forecast Model for Air Quality. Entropy 2022, 24, 1803. [Google Scholar] [CrossRef] [PubMed]
- Lang, Z.; Wen, Q.H.; Yu, B.; Sang, L.; Wang, Y. Forecast of Winter Precipitation Type Based on Machine Learning Method. Entropy 2023, 25, 138. [Google Scholar] [CrossRef] [PubMed]
- Sun, A.Y.; Wang, D.; Xu, X. Monthly Streamflow Forecasting Using Gaussian Process Regression. J. Hydrol. 2014, 511, 72–81. [Google Scholar] [CrossRef]
- Campolo, M.; Solddti, A.; Andreussi, P. Artificial Neural Network Approach to Flood Forecasting in the River Arno. Hydrol. Sci. J. 2003, 48, 381–398. [Google Scholar] [CrossRef]
- El Bilali, A.; Moukhliss, M.; Taleb, A.; Nafii, A.; Alabjah, B.; Brouziyne, Y.; Mazigh, N.; Teznine, K.; Mhamed, M. Predicting daily pore water pressure in embankment dam: Empowering machine learning-based modeling. Environ. Sci. Pollut. Res. 2022, 29, 47382–47398. [Google Scholar]
- Xiang, C.; Li, Q.; Zhou, Z.; Luo, Z.; Liu, M.; Liu, L. Research on a seepage monitoring model of a high core rockfill dam based on machine learning. Sensors 2018, 18, 2749. [Google Scholar]
- Lin, C.; Li, T.; Chen, S.; Liu, X.; Lin, C.; Liang, S. Gaussian process regression-based forecasting model of dam deformation. Neural Comput. Appl. 2019, 31, 8503–8515. [Google Scholar]
- Wei, B.; Yuan, D.; Xu, Z.; Lin, L. Modified hybrid forecast model considering chaotic residual errors for dam deformation. Struct. Control. Health Monit. 2018, 25, e2188. [Google Scholar] [CrossRef]
- Wei, B.; Gu, M.; Li, H.; Xiong, W.; Xu, Z. Modeling method for predicting seepage of RCC dams considering time-varying and lag effect. Struct. Control. Health Monit. 2018, 25, e2081. [Google Scholar]
- Wang, S.W.; Xu, Y.L.; Gu, C.S.; Bao, T.F. Monitoring models for base flow effect and daily variation of dam seepage elements considering time lag effect. Water Sci. Eng. 2018, 11, 344–354. [Google Scholar]
- Roushangar, K.; Garekhani, S.; Alizadeh, F. Forecasting Daily Seepage Discharge of an Earth Dam Using Wavelet–Mutual Information–Gaussian Process Regression Approaches. Geotech. Geol. Eng. 2016, 34, 1313–1326. [Google Scholar]
- Ranković, V.; Grujović, N.; Divac, D.; Milivojević, N. Development of support vector regression identification model for prediction of dam structural behavior. Struct. Saf. 2014, 48, 33–39. [Google Scholar] [CrossRef]
- Su, H.; Chen, Z.; Wen, Z. Performance improvement method of support vector machine-based model monitoring dam safety. Struct. Control Health Monit. 2016, 23, 252–266. [Google Scholar] [CrossRef]
- Su, H.; Li, X.; Yang, B.; Wen, Z. Wavelet support vector machine-based prediction model of dam deformation. Mech. Syst. Sig. Process. 2018, 110, 412–427. [Google Scholar]
- Sharghi, E.; Nourani, V.; Behfar, N.; Tayfur, G. Data Pre-Post Processing Methods in AI-Based Modeling of Seepage through Earthen Dams. Measurement 2019, 147, 106820. [Google Scholar] [CrossRef]
- Kang, F.; Li, J.; Dai, J. Predictionoflong-termtemperatureeffectinstructuralhealth monitoring of concrete dams using support vector machines with Jaya optimizer and salp swarm algorithms. Adv. Eng. Softw. 2019, 131, 60–76. [Google Scholar] [CrossRef]
- Stojanovic, B.; Milivojevic, M.; Milivojevic, N.; Antonijevic, D. A self-tuning system for dam behavior modeling based on evolving artificial neural networks. Adv. Eng. Softw. 2016, 97, 85–95. [Google Scholar] [CrossRef]
- Kao, C.Y.; Loh, C.H. Monitoring of long-term static deformation data of Fei-Tsui arch dam using artificial neural network-based approaches. Struct. Control Health Monit. 2013, 20, 282–303. [Google Scholar]
- Zhang, X.; Chen, X.; Li, J. Improving Dam Seepage Prediction Using Back-Propagation Neural Network and Genetic Algorithm. Math. Probl. Eng. 2020, 2020, 1404295. [Google Scholar] [CrossRef]
- Zhang, J.; Li, W.; Hu, B.; Yang, H.; Wang, H. Design of an LSTM model for dam leakage prediction. In Proceedings of the Fifth International Conference on Mechatronics and Computer Technology Engineering, Chongqing, China, 19–21 August 2022. [Google Scholar] [CrossRef]
- Kang, F.; Liu, J.; Li, J.; Li, S. Concrete dam deformation prediction model for health monitoring based on extreme learning machine. Struct. Control Health Monit. 2017, 24, e1997. [Google Scholar] [CrossRef]
- Bui, K.T.T.B.; Bui, D.T.; Zou, J.; Doan, C.; Revhaug, I. A novel hybrid artificial intelligent approach based on neural fuzzy inference model and particle swarm optimization for horizontal displacement modeling of hydropower dam. Neural Comput. 2018, 29, 1495–1506. [Google Scholar]
- Kang, F.; Li, J.; Zhao, S.; Wang, Y. Structural health monitoring of concrete dams using long-term air temperature for thermal effect simulation. Eng. Struct. 2019, 180, 642–653. [Google Scholar]
- Li, X.; Wen, Z.; Su, H. An approach using random forest intelligent algorithm to construct a monitoring model for dam safety. Eng. Comput. 2019, 37, 39–56. [Google Scholar]
- Salazar, F.; Toledo, M.Á.; González, J.M.; Oñate, E. Early detection of anomalies in dam performance: A methodology based on boosted regression trees. Struct. Control Health Monit. 2017, 24, e2012. [Google Scholar] [CrossRef]
- Zhang, K.; Gu, C.; Zhu, Y.; Chen, S.; Dai, B.; Li, Y.; Shu, X. A novel seepage behavior prediction and lag process identification method for concrete dams using HGWO-XGBoost Model. IEEE Access 2021, 9, 23311–23325. [Google Scholar] [CrossRef]
- Song, L.; Hao, L.; Tao, H.; Xu, C.; Guo, R.; Li, Y.; Yao, J. Research on Black-Box Modeling Prediction of USV Maneuvering Based on SSA-WLS-SVM. J. Mar. Sci. Eng. 2023, 11, 324. [Google Scholar] [CrossRef]
- Gu, C.S.; Wei, B.W.; Xu, Z.K.; Liu, D.W. Fluid-solid coupling model based on endochronic damage for roller compacted concrete dam. J. Cent. S. Univ. 2013, 20, 3247–3255. (in Chinese). [Google Scholar]
- Aburomman, A.A.; Reaz, M.B.I. A Novel Weighted Support Vector Machines Multiclass Classifier Based on Differential Evolution for Intrusion Detection Systems. Inf. Sci. 2017, 414, 225–246. [Google Scholar] [CrossRef]
- Yang, X.; Yu, Q.; He, L.; Guo, T. The One-against-All Partition Based Binary Tree Support Vector Machine Algorithms for Multi-Class Classification. Neurocomputing 2013, 113, 1–7. [Google Scholar] [CrossRef]
- Lu, H.S.; Chang, C.K.; Hwang, N.C.; Chung, C.T. Grey Relational Analysis Coupled with Principal Component Analysis for Optimization Design of the Cutting Parameters in High-Speed End Milling. J. Mater. Process. Technol. 2009, 209, 3808–3817. [Google Scholar] [CrossRef]
- Huang, Y.; Shen, L.; Liu, H. Grey Relational Analysis, Principal Component Analysis and Forecasting of Carbon Emissions Based on Long Short-Term Memory in China. J. Clean. Prod. 2019, 209, 415–423. [Google Scholar] [CrossRef]
- Chen, B.P. The Application of the Grey Correlation Method in the Principal Component Analysis. In Advanced Engineering Forum; Trans Tech Publications Ltd.: Zurich, Switzerland, 2012; Volume 6, pp. 676–681. [Google Scholar]
- Deng, J.L. Introduction to Grey System Theory. J. Grey Syst. 1989, 1, 1–24. [Google Scholar]
- Wang, Z.; Zhang, H.; Wang, Y.; Wang, Y.; Lei, L.; Liang, C.; Wang, Y. Deficit Irrigation Decision-Making of Indigowoad Root Based on a Model Coupling Fuzzy Theory and Grey Relational Analysis. Agric. Water Manag. 2023, 275, 107983. [Google Scholar] [CrossRef]
- Yuan, D.; Jang, G. Coupling Coordination Relationship between Tourism Industry and Ecological Civilization: A Case Study of Guangdong Province in China. Sustainability 2023, 15, 92. [Google Scholar] [CrossRef]
- Cadima, J.F.C.L.; Jolliffe, I.T. Size- and Shape-Related Principal Component Analysis. Biometrics 1996, 52, 2710–2716. [Google Scholar] [CrossRef]
- Ding, K.; Zeng, Y.; Wang, Y.; Lv, D.; Yan, X. AGIM-Net Based Subject-Sensitive Hashing Algorithm for Integrity Authentication of HRRS Images. Geocarto Int. 2023, 38, 2168071. [Google Scholar] [CrossRef]
- Li, J.; Liu, X.; Yao, Q.; Xu, L.; Li, W.; Tan, W.; Wang, Q.; Xing, W.; Liu, D. Tolerance and Adaptation Characteristics of Sugar Beet (Beta Vulgaris L.) to Low Nitrogen Supply. Plant Signal. Behav. 2022, 18, 2159155. [Google Scholar] [CrossRef]
- Fantahun, B.; Woldesemayate, T.; Fadda, C.; Gebrehawaryat, Y.; Pe, E.; Acqua, M.D. Multivariate Analysis in the Dissection of Phenotypic Variation of Ethiopian Cultivated Barley (Hordeum Vulgare ssp. Vulgare L.) Genotypes. Cogent Food Agric. 2023, 9, 2157104. [Google Scholar] [CrossRef]
- Smola, A.J.; Schölkopf, B. A Tutorial on Support Vector Regression. Stat. Comput. 2004, 14, 199–222. [Google Scholar] [CrossRef]
- Lin, K.; Lin, Q.; Zhou, C.; Yao, J. Time Series Prediction Based on Linear Regression and SVR. In Proceedings of the Third International Conference on Natural Computation, Haikou, China, 24–27 August 2007; pp. 688–691. [Google Scholar]
- Guo, Y.; Han, S.; Shen, C.; Li, Y.; Yin, X.; Bai, Y. An Adaptive SVR for High-Frequency Stock Price Forecasting. IEEE Access 2018, 6, 11397–11404. [Google Scholar] [CrossRef]
- Jiang, S.; Xue, H.; Glover, A.; Rutherford, M.; Rueckert, D.; Hajnal, J.V. MRI of Moving Subjects Using Multislice Snapshot Images with Volume Reconstruction (SVR): Application to Fetal, Neonatal, and Adult Brain Studies. IEEE Trans. Med. Imaging 2007, 26, 967–980. [Google Scholar] [CrossRef] [PubMed]
- He, G.; Cai, G.; Li, Y.; Xia, T.; Li, Z. Weighted Split-Flow Network Auxiliary with Hierarchical Multitasking for Urban Land Use Classification of High-Resolution Remote Sensing Images. Int. J. Remote Sens. 2022, 43, 6721–6740. [Google Scholar] [CrossRef]
- Yao, X. Application of Optimized SVM in Sample. Int. J. Adv. Comput. Sci. Appl. 2022, 13, 540–547. [Google Scholar]
- Yigit, E.; Duysak, H. Determination of Flowing Grain Moisture Contents by Machine Learning Algorithms Using Free Space Measurement Data. IEEE Trans. Instrum. Meas. 2022, 71, 2507608. [Google Scholar] [CrossRef]
- Cortes, C.; Vapnik, V. Support-Vector Networks. Mach. Learn. 1995, 20, 273–297. [Google Scholar] [CrossRef]
- Yao, H.; Liu, D. Study on Seepage Monitoring and Analysis of SL Gravity Dam. In Proceedings of the 2021 7th International Conference on Hydraulic and Civil Engineering & Smart Water Conservancy and Intelligent Disaster Reduction Forum (ICHCE & SWIDR), Nanjing, China, 6–8 November 2021; pp. 1475–1478. [Google Scholar] [CrossRef]
- Simon, A.; Collison, A.J.C. Pore-Water Pressure Effects on the Detachment of Cohesive Streambeds: Seepage Forces and Matric Suction. Earth Surf. Process. Landf. 2001, 26, 1421–1442. [Google Scholar] [CrossRef]
- Huang, Z.; Bai, Y.; Xu, H.; Cao, Y.; Hu, X. A Theoretical Model to Predict the Critical Hydraulic Gradient for Soil Particle Movement under Two-Dimensional Seepage Flow. Water 2017, 9, 828. [Google Scholar] [CrossRef]
- Liu, L.; Liang, J.; Ma, L.; Zhang, H.; Li, Z.; Liang, S. Gas Pipeline Flow Prediction Model Based on LSTM with Grid Search Parameter Optimization. Processes 2022, 11, 63. [Google Scholar] [CrossRef]


| Monitoring Parameter | Monitoring or Recording Method | Recoding Frequency | Size of Sample |
|---|---|---|---|
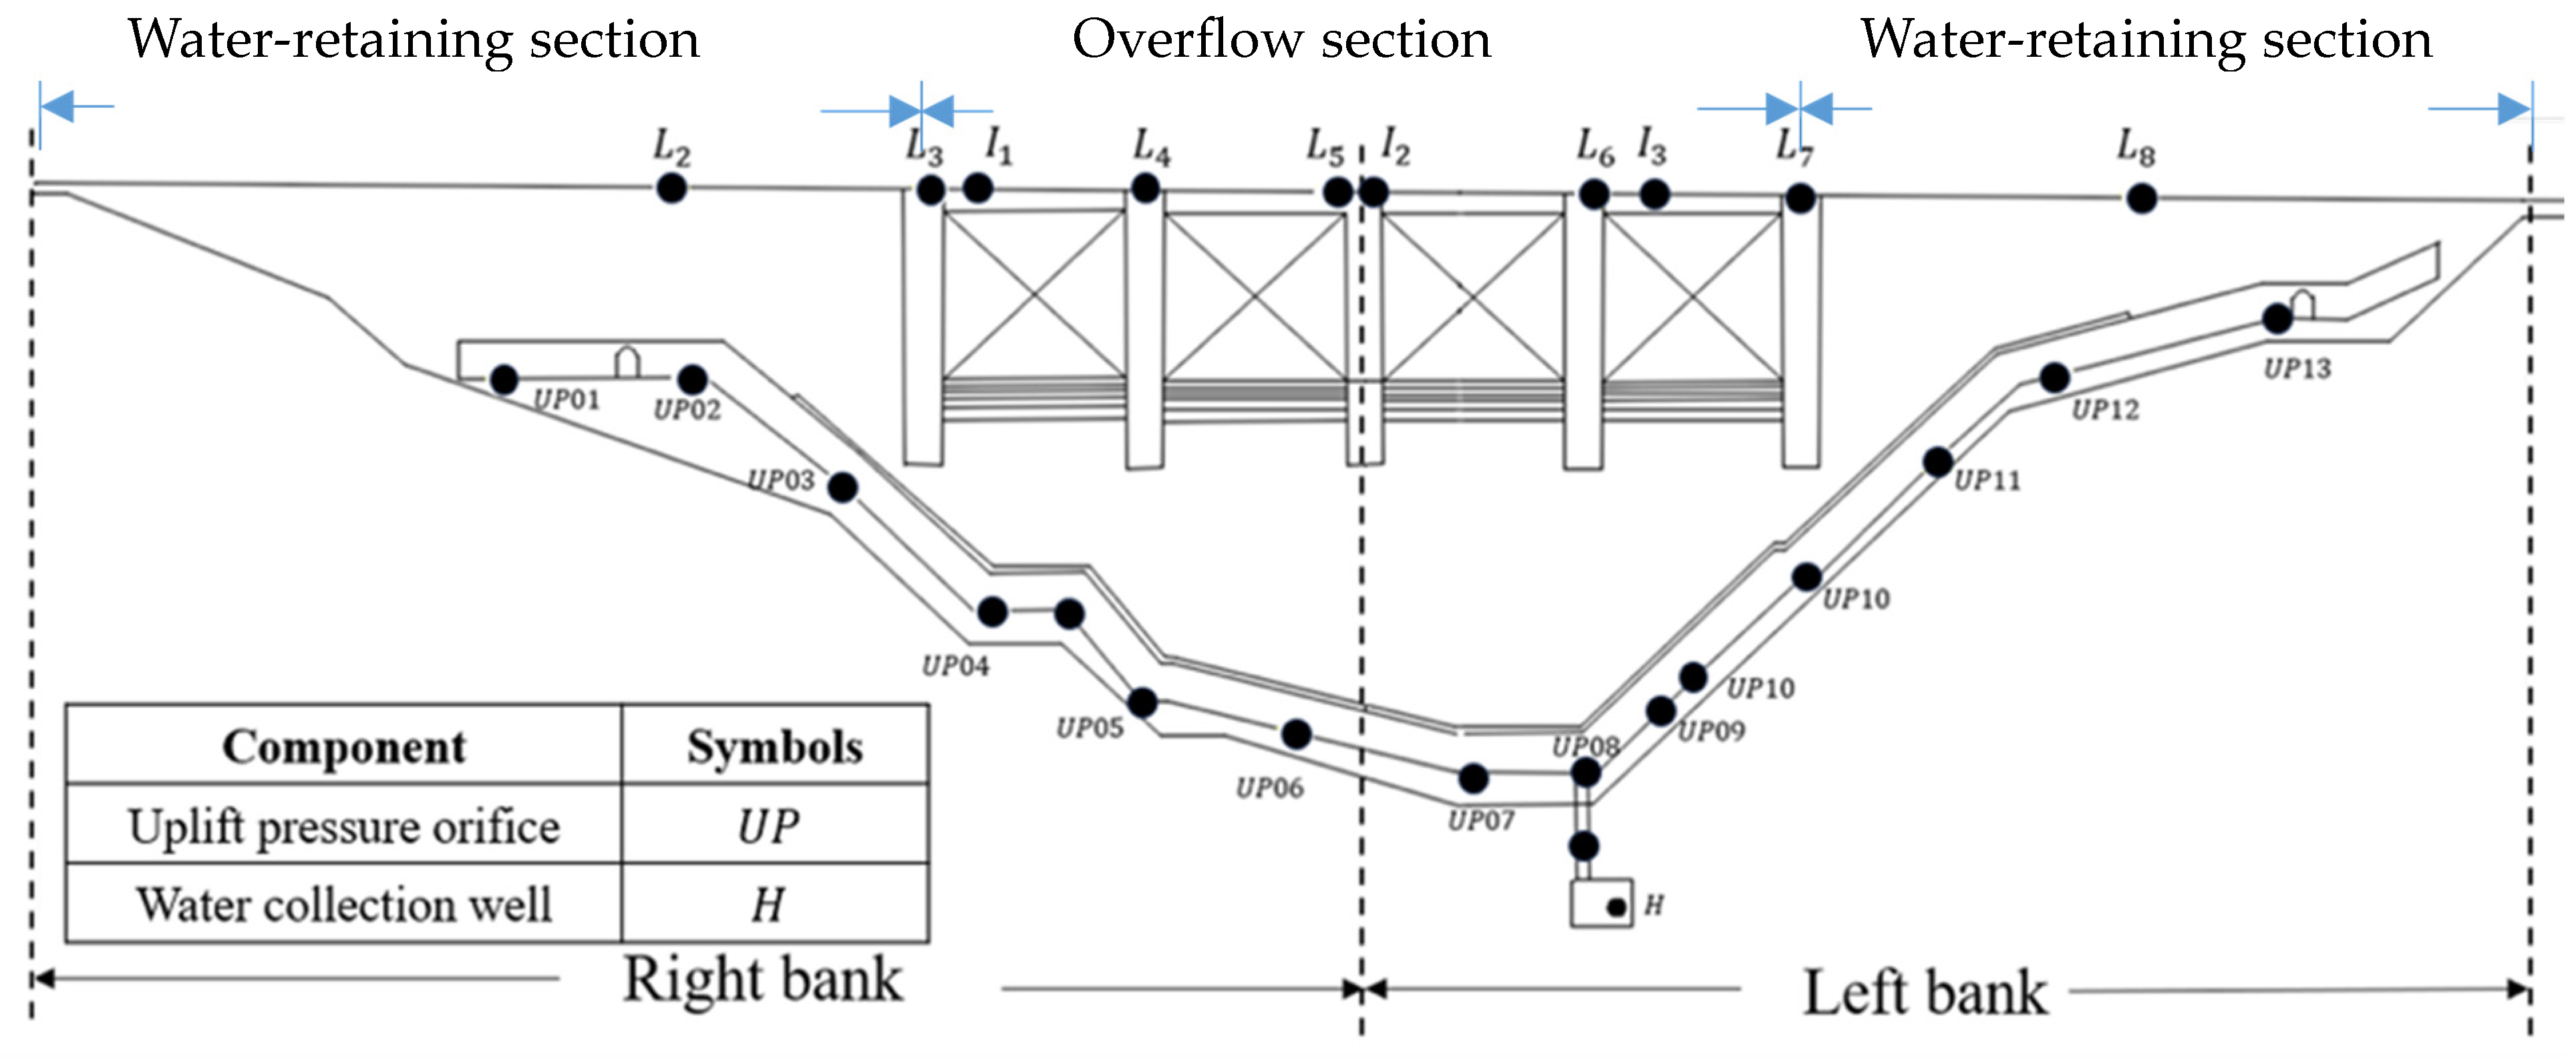
| Seepage flow qs (l/h) | A collection well at H (Figure 2) collected the total seepage flow rate qs from the dam body and the dam base at the right and left banks of the dam; qs was determined by water level changes at the well, measured using an electromagnetic water level gauge with an accuracy of ≤0.02 mm. | Data are generally recorded once a day. In special circumstances, such as heavy rainfall or abnormal seepage, some parameters will be measured multiple times a day. | 9097 |
| Upstream water level hu | The upstream water level was monitored at the water inlet of the dam. A pontoon water level gauge was used to measure the water level with an accuracy of ≤0.01 m. | 8253 | |
| Downstream water level hd | The downstream water level was monitored at the tailwater of the dam. A pontoon water level gauge was used to measure the water level with an accuracy of ≤0.01 m. | 8253 | |
| Uplift pressure coefficients Cli | Piezometers were installed at 13 locations, UP01–UP13 (Figure 2), to determine Cli through water levels or rock bed level *. The piezometer was manufactured by Geokon (GK4500AL-70KPa model) with a measurement range of 170 KPa and an accuracy of 0.025% FS. | 8339–9061 | |
| Air temperature Ti | The temperature was measured using a thermistor at the same 13 positions, UP01–UP13 (Figure 2), with an accuracy of ±0.02 °C. | 9195–9559 | |
| Elevation Eli | Elevation Eli was observed at 7 points, L2–L8 (Figure 2), at the dam top, using 1st-class digital levels (Leica DNA03) with an accuracy of 0.2″. | Data are generally recorded once a month. In special circumstances, such as heavy rainfall or abnormal monitoring values, some parameters will be measured multiple times a month. | 288 |
| Vertical displacement, dVi and DVi (mm) | Changes in elevation, including interval vertical displacement dVi (mm) and accumulated vertical displacement DVi (mm), were calculated at 7 observation points, L2–L8 (Figure 2), at the dam top. DVi is the summation of dVi calculated from 1 January 1999. dVi was determined by 1st-class digital levels (Leica DNA03) with an accuracy of 0.2″. | 288 | |
| Horizontal displacement, dHi and DHi (mm) | Interval horizontal displacement dHi (mm) and accumulated horizontal displacement DHi (mm) were measured at 3 observation points, I1–I3 (Figure 2), at the dam top. DHi is the summation of dHi calculated from 1 January 1999. dHi was determined using a total station (Leica TS60i) with an accuracy of 0.5″. | 308 |
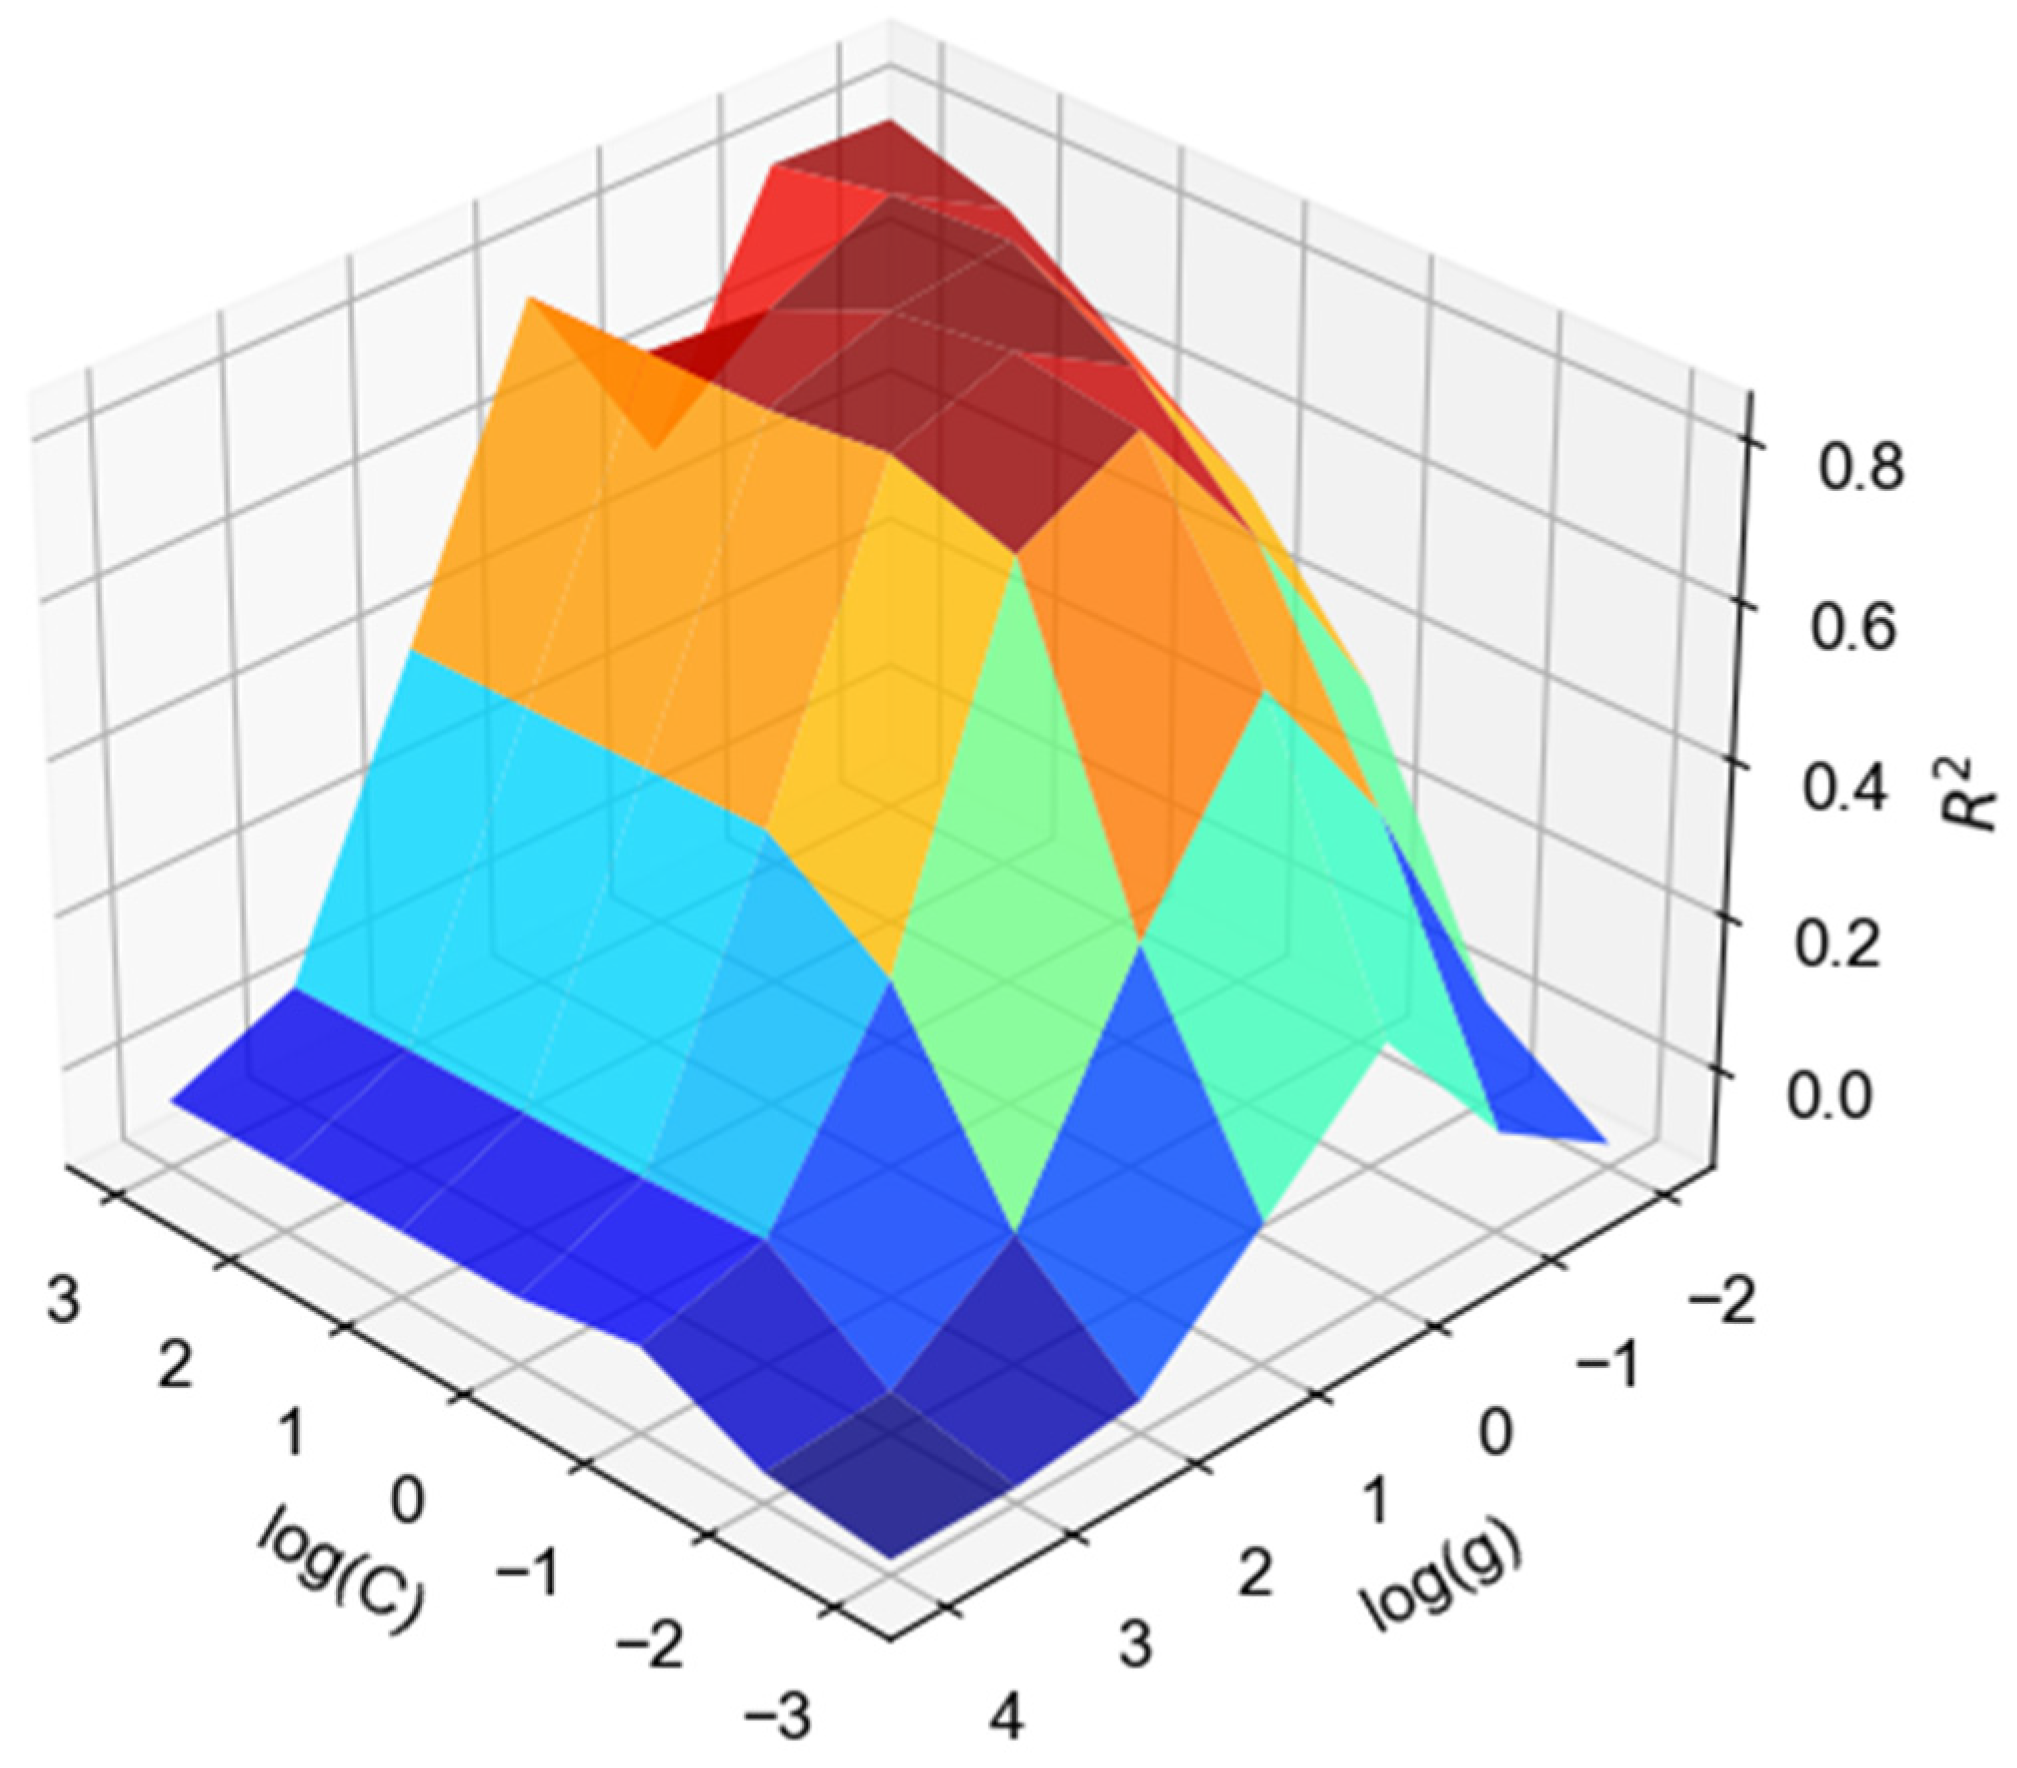
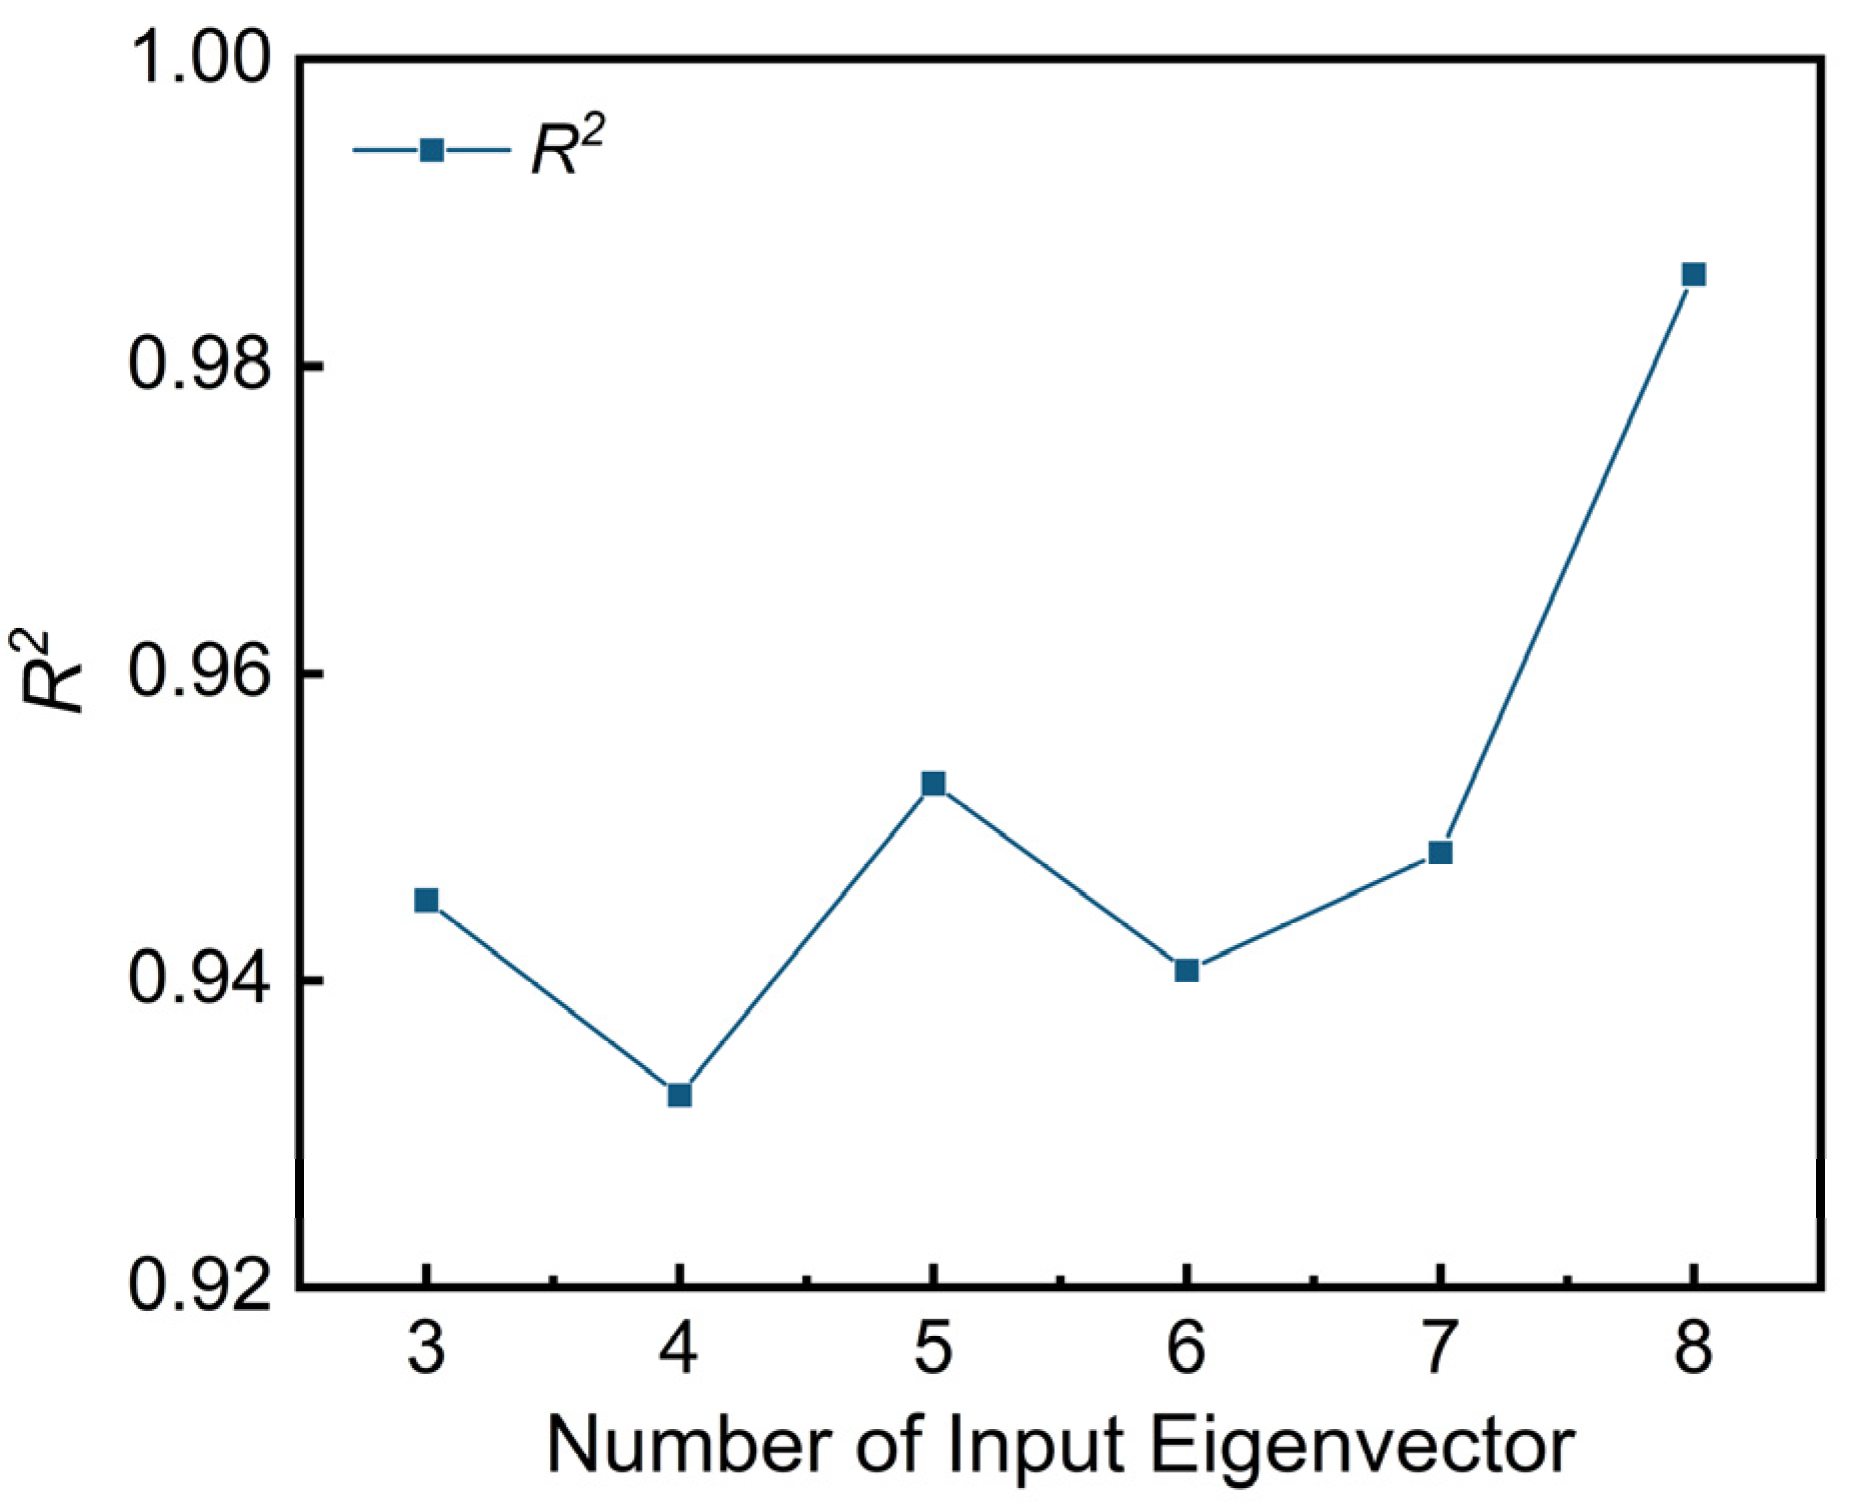
| Number of Inputted Eigenvectors k | c | g | Training and Validation Time Tt (s) | File I/O Time Tio (s) | R2 (Testing) | Ems (L/s)2 (Testing) | Ema (Testing) |
|---|---|---|---|---|---|---|---|
| 3 | 10 | 0.1 | 9.843 | 0.910 | 0.945 | 0.045 | 17.19% |
| 4 | 10 | 0.1 | 10.024 | 1.005 | 0.933 | 0.096 | 25.11% |
| 5 | 10 | 0.1 | 11.031 | 1.103 | 0.953 | 0.041 | 16.41% |
| 6 | 100 | 0.01 | 15.123 | 1.399 | 0.941 | 0.056 | 19.18% |
| 7 | 100 | 0.01 | 16.255 | 1.309 | 0.948 | 0.035 | 15.16% |
| 8 | 100 | 0.01 | 20.518 | 1.456 | 0.986 | 0.041 | 16.41% |
| Performance Indicators | Statement | HPO-SVR (This Work) | LSTM | HPO-LSTM |
|---|---|---|---|---|
| R2 | dam before reinforcement | 0.9323 | 0.9628 | 0.9581 |
| dam after reinforcement | 0.9558 | 0.8867 | 0.8912 | |
| Total period * | 0.9407 | 0.9173 | 0.9256 | |
| Ems (L/s)2 | dam before reinforcement | 0.5711 | 0.4656 | 0.3422 |
| dam after reinforcement | 0.0421 | 0.0878 | 0.0573 | |
| Total period * | 0.0751 | 0.1130 | 0.0776 | |
| Ema | dam before reinforcement | 21.52% | 19.43% | 16.66% |
| dam after reinforcement | 36.49% | 52.70% | 42.57% | |
| Total period * | 22.21% | 27.24% | 22.57% |
| Model | HPO-SVR (This Work) | LSTM | HPO-LSTM |
|---|---|---|---|
| Tt (s) | 11 | 146 | 87 |
Disclaimer/Publisher’s Note: The statements, opinions and data contained in all publications are solely those of the individual author(s) and contributor(s) and not of MDPI and/or the editor(s). MDPI and/or the editor(s) disclaim responsibility for any injury to people or property resulting from any ideas, methods, instructions or products referred to in the content. |
© 2023 by the authors. Licensee MDPI, Basel, Switzerland. This article is an open access article distributed under the terms and conditions of the Creative Commons Attribution (CC BY) license (https://creativecommons.org/licenses/by/4.0/).
Share and Cite
Zhuo, M.-Y.; Chen, J.-C.; Zhang, R.-L.; Zhan, Y.-K.; Huang, W.-S. Seepage Prediction Model for Roller-Compacted Concrete Dam Using Support Vector Regression and Hybrid Parameter Optimization. Water 2023, 15, 3511. https://doi.org/10.3390/w15193511
Zhuo M-Y, Chen J-C, Zhang R-L, Zhan Y-K, Huang W-S. Seepage Prediction Model for Roller-Compacted Concrete Dam Using Support Vector Regression and Hybrid Parameter Optimization. Water. 2023; 15(19):3511. https://doi.org/10.3390/w15193511
Chicago/Turabian StyleZhuo, Mei-Yan, Jinn-Chyi Chen, Ren-Ling Zhang, Yan-Kun Zhan, and Wen-Sun Huang. 2023. "Seepage Prediction Model for Roller-Compacted Concrete Dam Using Support Vector Regression and Hybrid Parameter Optimization" Water 15, no. 19: 3511. https://doi.org/10.3390/w15193511
APA StyleZhuo, M.-Y., Chen, J.-C., Zhang, R.-L., Zhan, Y.-K., & Huang, W.-S. (2023). Seepage Prediction Model for Roller-Compacted Concrete Dam Using Support Vector Regression and Hybrid Parameter Optimization. Water, 15(19), 3511. https://doi.org/10.3390/w15193511