Article

Source Apportionment and Health Risk Assessment of Heavy Metals in Karst Water from Abandoned Mines in Zhangqiu, China

1
801 Institute of Hydrogeology and Engineering Geology, Shandong Provincial Bureau of Geology & Mineral Resources, Jinan 250014, China
2
Shandong Engineering Research Center for Environmental Protection and Remediation on Groundwater, Jinan 250014, China
3
School of Management, Shandong University, Jinan 250100, China
4
College of Energy and Mining Engineering, Shandong University of Science and Technology, Qingdao 266590, China
5
College of Environmental Science and Engineering, Ocean University of China, Qingdao 266100, China
6
Shandong Transportation Institute, Jinan 250000, China
*
Authors to whom correspondence should be addressed.
Water 2023, 15(19), 3440; https://doi.org/10.3390/w15193440
Submission received: 17 August 2023 / Revised: 25 September 2023 / Accepted: 27 September 2023 / Published: 29 September 2023

Abstract

:
This study investigated the hydrochemical characteristics and human health risks of groundwater in a pollution accident site. By collecting 27 samples, the content of the heavy metal(oid)s (As, Cd, Cr, Cu, Hg, Ni, Pb, and Zn) was tested, statistical analysis of heavy metal ion concentration was conducted, and the Nemerow comprehensive contamination index was determined. The health risk assessment was conducted based on the test results, and correlation analysis, as well as principal component analysis, were used to resolve the possible sources of heavy metal contamination. The results showed that the total hardness and total dissolved solids were significantly higher, and the potassium permanganate index and ammonia nitrogen content were higher in some samples. The heavy metal content was higher than the Class III groundwater quality standard (GB/T14848-2017). The health risk assessment showed that the total health risks posed by the eight heavy metal(oid)s in the study area through drinking water and dermal contact exceeded the maximum acceptable level. In general, the health risk is slightly higher for adults than for children. The groundwater in the abandoned mines has unsafe levels of heavy metal(oid)s for human health, but the normal drinking water remains safe for surrounding residents. Carcinogenic heavy metal(oid)s are the main source of health risks in the region, and the impact of Cr on human health requires further attention.

1. Introduction

Groundwater is an important source of drinking water and domestic water, especially in arid and semiarid areas with fragile ecosystems and scarce water resources [1,2]. In recent decades, with economic development and the continuous improvement of living standards, the contamination of groundwater by heavy metal(oid)s is becoming an increasingly serious problem [3]. Heavy metal(oid)s in groundwater have the characteristics of high toxicity, persistence, enrichment, concealment, and resistance to degradation [4,5]. When consumed through drinking water, heavy metal(oid)s tend to accumulate in the human body and combine with other toxins in the body to form more toxic substances, thus posing serious threats to human health [6]. Accordingly, the study and health risk assessment of heavy metal(oid)s in groundwater have become the focus of attention. The pollution risk of heavy metal(oid)s to human health can be estimated using the health risk assessment approach. Therefore, it is of great practical significance to study heavy metal pollution in combination with health risk assessment models.
Most cities in the world use groundwater as a source of drinking water because of its reliability [7]. However, human activities such as mining have affected the groundwater in many cities [8,9,10]. Mine drainage has a serious impact on the groundwater environment, which not only pollutes the aquifer, but also has a negative impact on the groundwater environment, thereby seriously endangering the health and safety of residents [8,9,10]. Especially in recent years, the karst water produced by some abandoned coal mines will affect the local water resources and ecological environment [11,12]. Studying the health risk of heavy metal pollution in the groundwater around abandoned mines can help us understand whether the groundwater is seriously polluted by coal mining activities, thereby providing a basis for groundwater protection policies [13,14,15]. The impact of such industrial agglomerations on the regional ecological environment needs urgent attention [12].
The human body is primarily exposed to heavy metal pollutants in water through drinking water and dermal contact, thus accounting for more than 90% of the pollutants entering the human body [16]. The potential health risks to human health can be divided into two categories: carcinogenic and noncarcinogenic. Therefore, heavy metal pollutants in the groundwater of the study area can be divided into two categories: carcinogenic heavy metal(oid)s (As, Cr, and Cd) and noncarcinogenic heavy metal(oid)s (Cu, Zn, Ni, Pb, and Hg) [17,18]. According to the health risk assessment model recommended by the United States Environmental Protection Agency (USEPA), the calculation methods for carcinogenic and noncarcinogenic heavy metal elements through drinking water and dermal contact are different.
At present, the research on water quality evaluation methods focuses on the advantages and disadvantages, the improvement and application of the single factor index method, the Nemerow comprehensive index method, the fuzzy comprehensive method, and the water quality biological comprehensive evaluation method [19,20,21,22,23,24,25]. Furthermore, health risk assessment is commonly conducted in relation to electroplating plants, reservoirs, drinking water sources, sewage irrigation areas, and others [26,27,28,29,30], while only few studies have evaluated groundwater quality in combination with health risk assessment. The combination of health risk assessment and water quality assessment will facilitate a more comprehensive evaluation of the quality of the groundwater environment, provide a deeper understanding of the safety status of groundwater, help strengthen management against the risks associated with groundwater, and support the formulation and implementation of corresponding pollutant control strategies [31].
In this study, the groundwater in an abandoned coal mine in the eastern Zhangqiu District was comprehensively analyzed with respect to its chemical components and other indicators, hydrochemical characteristics, and water quality. Based on the test results of the conventional indicators and the mass concentration of metal elements in the groundwater, with well water as the main type of water, the quality level of the groundwater in the study area was analyzed. The health risk assessment model was used to evaluate the health risk of the metal elements in the groundwater in terms of oral intake and dermal contact. The findings will provide a scientific basis for water quality risk management, water resource protection, and human health protection against groundwater heavy metal pollution.

2. Materials and Methods

2.1. Site Overview

The abandoned mine is located in a closed pit coal mine field. The surface of the site includes subsidence areas and roadways related to coal mining, and fault fracture zones are distributed underground. Due to artificial dumping activities, pollutants enter the coal mine roadway through the shaft at the site, which may flow along the roadway, fault fissures, and goaf, and some of them reside in a collapsed area around an accident well. Therefore, pollutants primarily affect the carbonate fissure karst water and clastic rock with carbonate karst fissure water, which are the sources of irrigation water for local villagers. The site is about 140 m long from east to west, about 100 m wide from north to south, and covers a total area of approximately 14,000 m2. The study area has a warm, temperate, semihumid continental monsoon climate, with four distinct seasons. It experiences a dry and windy spring; a rainy and humid summer; a cool and dry autumn; and a cold and snowless winter. The annual average temperature is 13.5 °C, and the annual average relative humidity is 58%. Precipitation in this area shows distinct monsoon climate characteristics, and the precipitation is mostly concentrated in summer, with an average annual precipitation of 627.9 mm [32].
The study area belongs to the monoclinic hydrogeological structure dominated by fissure karst water in the northern part of Taishan and the hydrogeological unit of the Mingshui spring area. The Paleozoic Cambrian and Ordovician carbonate rock strata are covered by monoclinic occurrences on the metamorphic rock series, which is essentially consistent with the topographic tendency, and these occurrences tilt northward. To the north, it is hidden under Quaternary strata in the piedmont, and under the Quaternary, Permian, and Carboniferous strata in the northern plain area. In the area of Wenzu and Puji, Carboniferous and Permian strata are falsely integrated with Ordovician strata. According to the movement and occurrence characteristics of aquifer media and groundwater in the aquifers, aquifers in the region are divided into four categories: loose rock pore water, carbonate rock fissure karst water, clastic rock with carbonate rock karst fissure water, and bedrock weathering fissure water [33].
The strata in the site primarily comprise the Quaternary Dazhan Formation and Carboniferous Permian Taiyuan Formation (as shown in Figure 1). The B-B’ section is a typical geological section in the study area. The strata are Ordovician Majiagou Formation, Carboniferous Yuemengou Group Taiyuan Formation, Benxi Formation and Quaternary from bottom to top.The groundwater is dominated by pore fissure water mixed with karst fissure water, and the runoff is slow. Groundwater is recharged by atmospheric precipitation infiltration, and the main discharge pathways are evaporation and artificial mining [34].

2.2. Sample Collection and Determination

In this study, 27 groundwater samples were collected in the study area, including 22 groundwater monitoring wells on the site and 5 civil wells in the periphery. The location of the study area is shown in Figure 2. The groundwater-level depths of the sampling points were different, and the contour map is drawn according to the data of each point (as shown in Figure 2).
In accordance with the ‘Groundwater Quality Standard’ (GB/T 14848-2017), a total of 35 indicators, such as sulfate, chloride, total hardness, and total dissolved solids, were selected. The groundwater samples were collected on site, and three water samples were collected at each sampling point. The water samples were divided into three parts before the test. One was used for on-site sampling, and the test items included pH, temperature, conductivity, and other indicators. The PH value, ORP, DO, TDS, and other indicators of water samples were determined using a portable AP-700 multi-parameter instrument. A water sample was filtered, and then nitric acid was added to make its pH lower than 2 for the determination of heavy metal(oid)s. Another water sample was not treated, and all were stored in polyethylene bottles. After the sampling bottle was filled, it was sealed with waterproof tape. After sampling, it was immediately sent to the laboratory to test the metal elements (Al, As, Cd, Cr, Cu, Fe, Hg, Mn, Pb, and Zn) using an atomic absorption spectrophotometer (AA-7020), an atomic fluorescence photometer (AF-7500), and an ultraviolet–visible spectrophotometer (UV-1200). These equipments are from Beijing Puxi General Instrument Co., Ltd., Beijing, China. The anions such as SO4, Cl, and NO3 were analyzed using a Thermo Scientific ion chromatography instrument (ICS-5000). According to the quality control requirements, the quality control analysis of blank samples, parallel double samples, and matrix standard addition control samples were performed. The qualified rate reached 95%, which met the requirements of quality control documents.

2.3. Data Statistics and Analysis

Descriptive statistical analysis of sampling data was performed using IBM SPSS Statistics 17. The maximum, minimum, mean, standard deviation, and coefficient of variation of each test index were calculated. The Spearman correlation coefficient method was used to calculate the correlation between each test index, and factor analysis was performed on heavy metal ions.
PCA is a commonly used data dimension reduction technique, which is usually used to explore the internal patterns of complex data sets [35,36]. In this study, the selection criterion was thus set as an eigenvalue greater than 1. The cumulative contribution rate shows that the higher the amount of information contained in the first k principal components, the stronger the explanatory power of the original data [37,38].
The steps of principal component analysis in this study can be divided into the following:
(1)
Conduct the KMO and Bartlett tests to determine the possibility of subjecting the data to PCA. The Kaiser–Meyer–Olkin (KMO) test statistic is an indicator used to compare simple correlation coefficients and partial correlation coefficients between variables.
(2)
Calculate the homogeneity and standard deviation of each index to obtain standardized data and eliminate the influence of variables based on the order of magnitude or dimension.
(3)
Calculate the covariance matrix to describe the relationship between the variables in the data set.
(4)
Calculate the eigenvalues and eigenvectors of the covariance matrix, and select the first k corresponding vectors with larger eigenvalues from the eigenvectors to form the principal components.
(5)
Calculate the principal component score, and analyze the significance represented by the principal component according to the coefficient.

2.4. Evaluation of Heavy Metal Pollution in Groundwater

The single-factor evaluation method was used to determine the pollution degree of a single index, and the Nemero index method was used to comprehensively evaluate the groundwater pollution level. As, Cd, Cr, Cu, Hg, Ni, Pb, and Zn were selected as evaluation items. The single-factor pollution index (Wi) and the comprehensive pollution index (Wn) were calculated as follows [39]:
W i = c i H i
W n = W imax 2 + W iave 2 2
Among them, ci is the measured concentration of heavy metal i, Hi is the corresponding groundwater quality standard III water quality limit of heavy metal i, Wimax is the maximum value of heavy metal single-factor pollution index, and Wiave is the average value of the single-factor pollution index for each heavy metal.

2.5. Human Health Risk Assessment

2.5.1. Health Risk Assessment Model of Drinking Water Pathway

The following equation calculates the carcinogenic health risk of heavy metal(oid)s through drinking water exposure:
R i c = A D D i · S F i L
When the calculated R i c is greater than 0.01, we have
R i c = 1 e x p A D D i · S F i L
The following equation calculates the noncarcinogenic risk of heavy metal(oid)s through drinking water exposure:
R i n = A D D i R F D i L × 10 6
A D D i = c w · I R · E D · E F B W · A T
In the formula, R i c and R i n are the annual health risks of carcinogenic heavy metal w and noncarcinogenic heavy metal w through drinking water, respectively, in units of a−1; i denotes access to drinking water; ADDi is the daily average exposure dose per unit weight of drinking water exposure in mg (kg × d)−1; SFi is the z-carcinogenic slope factor for drinking water exposure in (kg × d) mg−1; RFDi is the reference dose for the daily intake of drinking water exposure in mg (kg × d) −1 [40,41]; cw is the measured value of heavy metal element concentration; ED is the exposure time in a; and AT denotes the average exposure time in d. The meaning and value of the parameters in the formula are shown in Table 1 and Table 2.

2.5.2. Health Risk Assessment Model of Dermal Contact Pathway

The carcinogenic health risks of heavy metal(oid)s through the dermal contact pathway can be determined as follows:
R d c = A D D d · S F d L
When the R d c calculation result is greater than 0.01, we have
R d c = 1 e x p A D D d · S F d L
The noncarcinogenic risk of heavy metal(oid)s through the dermal contact pathway can be determined as follows:
R d n = A D D d R F D d L × 10 6
A D D d = c w · S A · P C · E T · E D · E F · C F B W · A T
In the formula, R d c and R d n are the annual average health risks of carcinogenic heavy metal w and noncarcinogenic heavy metal w through dermal contact, respectively, in a−1; d represents the dermal contact pathway; ADDd is the average daily exposure dose per unit body weight through the dermal contact pathway in mg·(kg × d)−1; SFd is the carcinogenic slope factor of drinking water exposure in (kg × d)·mg−1; RFDd is the daily intake reference dose of drinking water exposure in mg·(kg × d)−1; cw is the measured value of heavy metal concentration; ED is the exposure time in a; AT represents the average exposure time in d; and PC is the skin permeation constant in cm × h−1 [41,42]; the meaning and values of the parameters in the formula are shown in Table 1 and Table 2.

2.5.3. Total Health Risk Assessment of Water Body

Assuming that the toxic effects of heavy metal(oid)s in water on human health are cumulative, the total health risk RZ of heavy metal(oid)s in water can be expressed as follows:
R Z = R

3. Result and Discussion

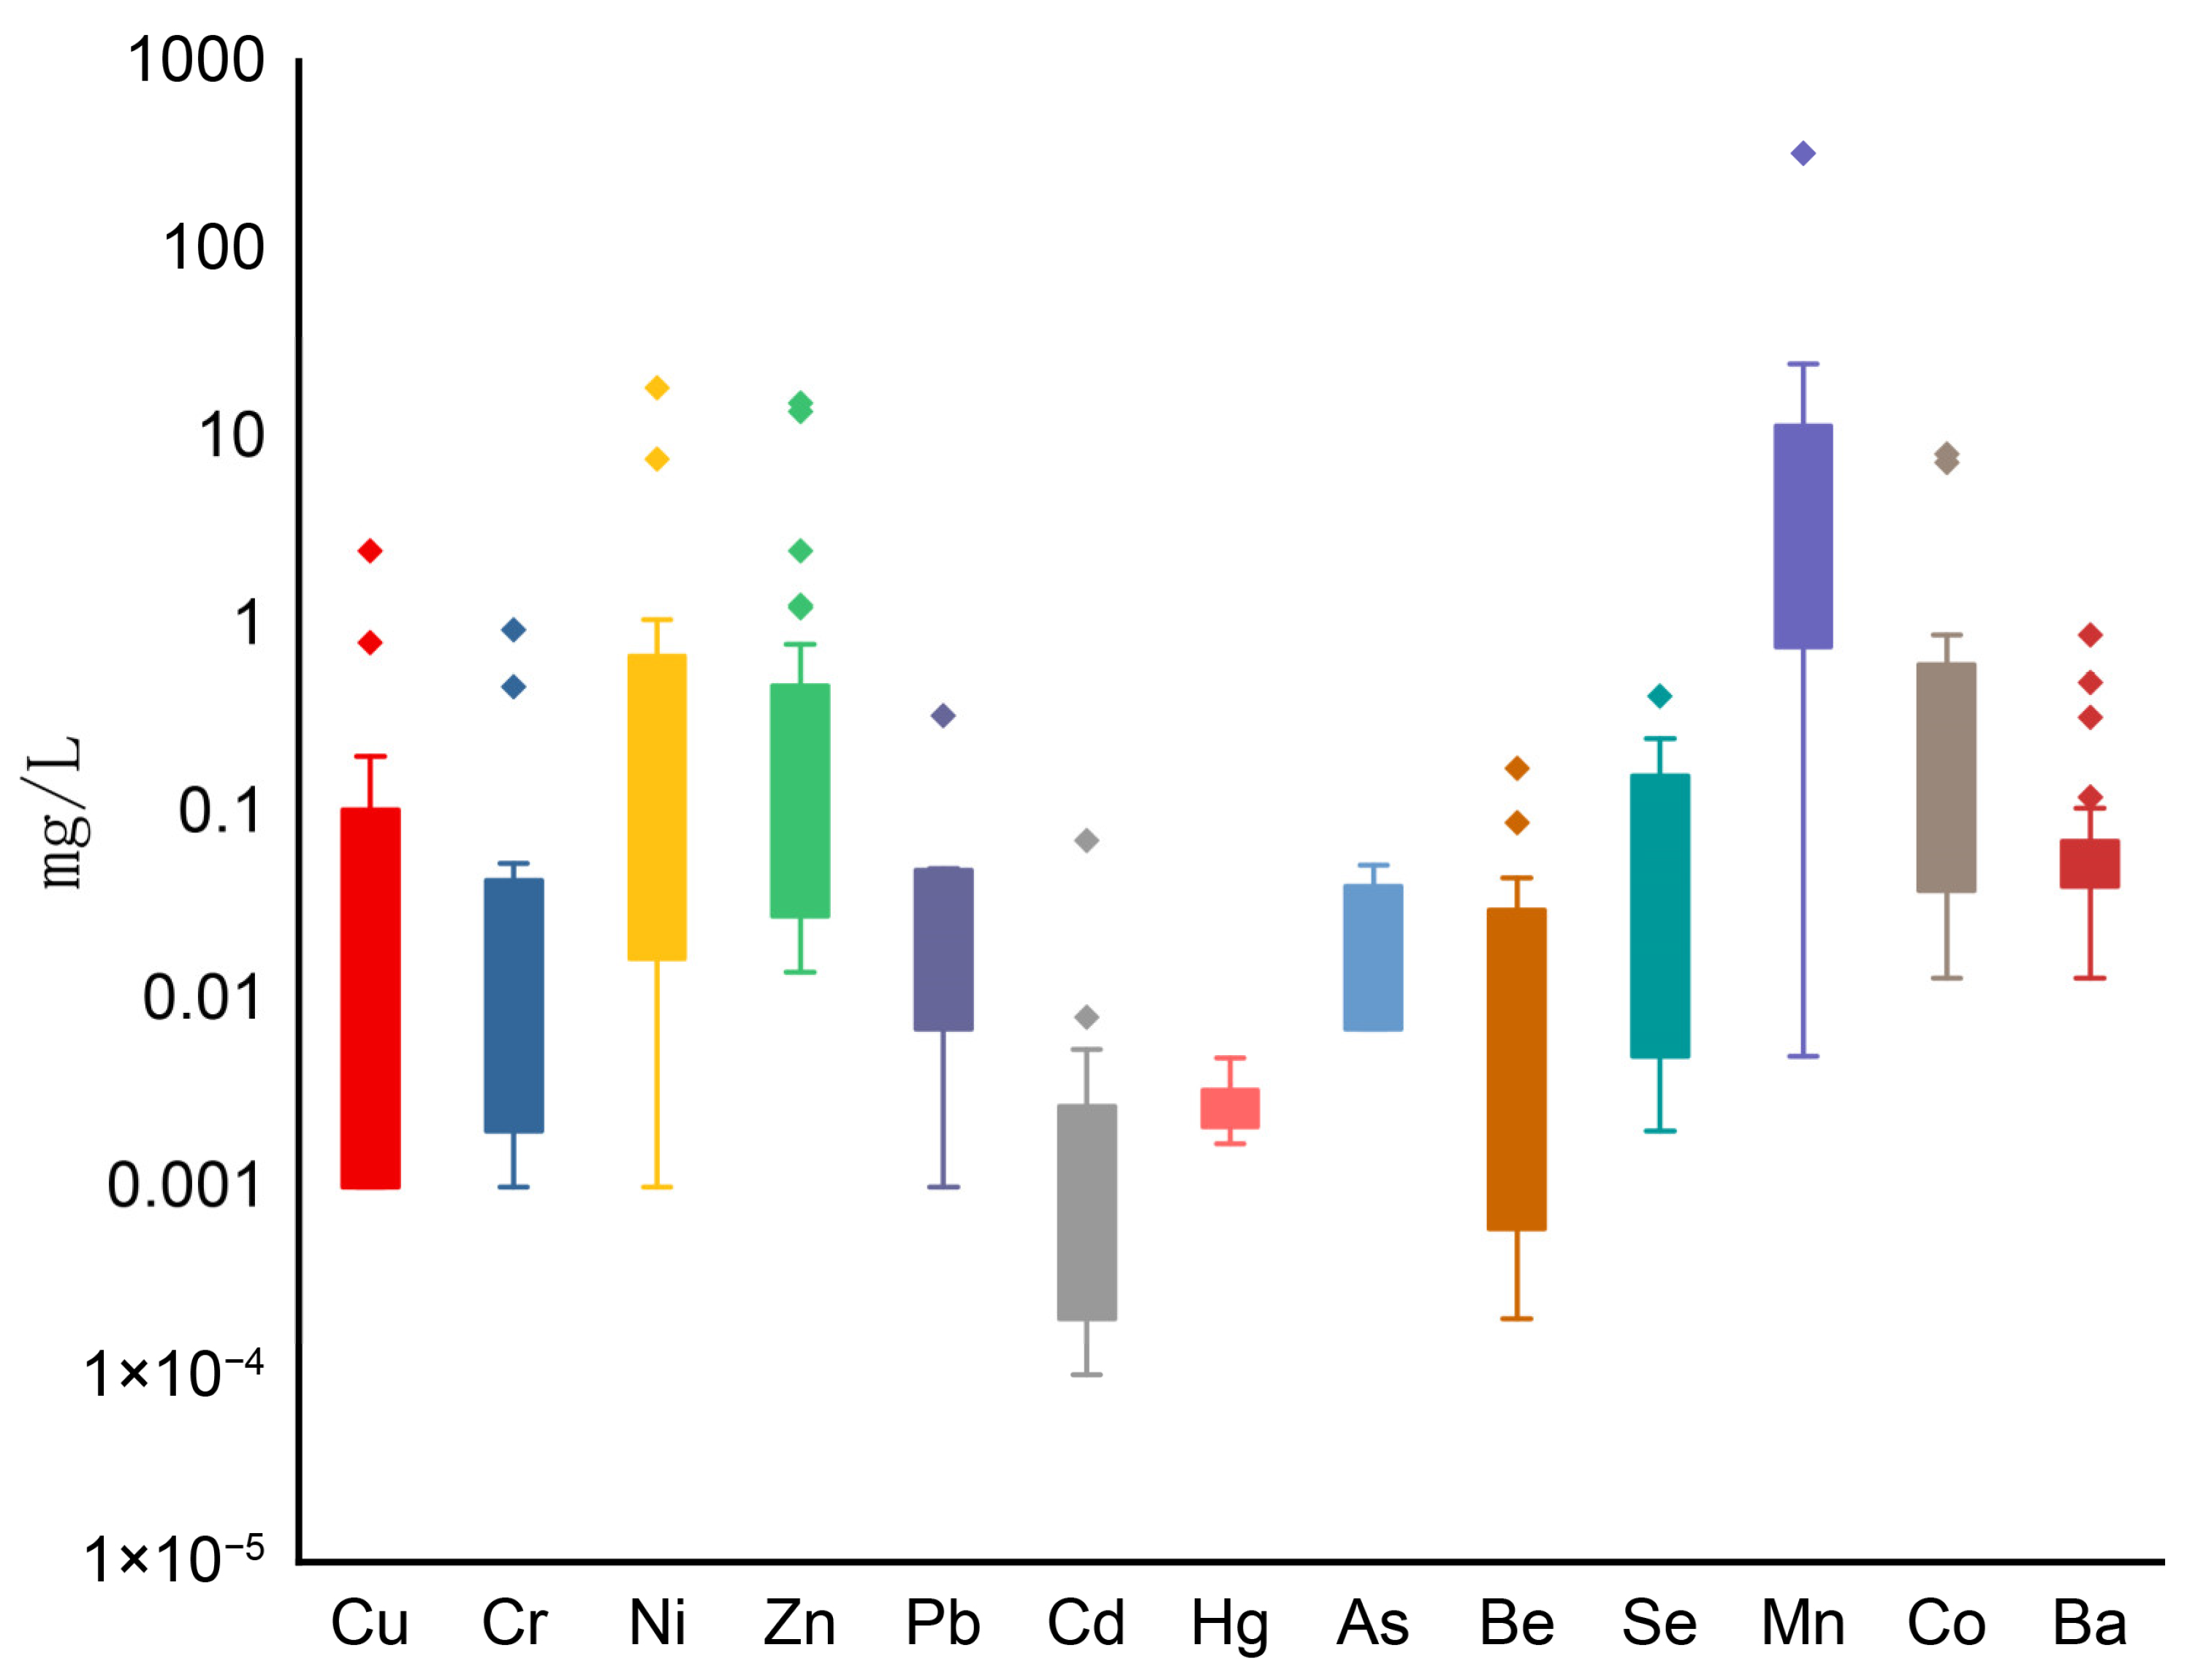
3.1. Characteristics of Pollutant Concentration in Groundwater

The comprehensive index characteristics of groundwater quality in the groundwater samples monitored at the accident site are shown in Table 3. The data show that the pH of the water samples in this area varied from 3.10 to 7.7, with an average of 6.54. The variation ranges of the TDS and TH were 513.00 mg × L−1–34,400.00 mg × L−1 and 342.00 mg × L−1–2930.00 mg × L−1, respectively, with the mean values of 4471.59 mg × L−1 and 1235.19 mg × L−1, respectively. The range of the COD was 0.95 mg × L−1–504.6 mg × L−1, with an average of 70.9 mg × L−1. Upon comparing the four comprehensive indicators with the Class III standard limits in the ‘Groundwater Quality Standard‘, there were different degrees of samples exceeding the standards, of which the most over-the-standard indicator was total hardness with 24 over-the-standard samples. The contents of fluoride, chloride, nitrate, and sulfate in the water samples showed high abnormal values in some samples.
The distribution of the indexed contents of the metal elements is shown in Figure 3. The figure shows that all types of indicators had high abnormal values to different degrees. The contents of Fe and Mn in the 27 water samples were generally high. At some points, the Fe content reached 2000 mg × L−1, and the Mn content reached dozens or even more than 300 mg × L−1. At some points, the Ni and Hg contents were also significantly higher.

3.2. Evaluation of Nemerow Comprehensive Pollution Index in Groundwater

The calculation results of the comprehensive pollution index values of all of the samples from the accident site and the surrounding groundwater are shown in Figure 4. The statistical results of the single-factor pollution index and the comprehensive pollution index of the eight heavy metal(oid)s are shown in Table 4. The evaluation results show that groundwater pollution is more serious in the area. According to the comprehensive pollution index, 16 of the 27 groundwater samples were at a strong pollution level, thereby accounting for 59.3% of the total number of samples. The comprehensive pollution index values of point ZQ01 were the highest, reaching 651.81, followed by point ZQ07 at 271.7. The pollution index values of the remaining 14 samples ranged from 2.1 to 37.8. Upon comparing the water samples of the civil wells in the periphery of the site with the water samples from the drilling well at the site, the pollution level of the civil wells was found to be significantly lower than that of the accident site.
In terms of the single-factor pollution index, all eight heavy metal(oid)s in the water samples were at moderate to severe pollution levels. Among them, Ni was the largest contributor to pollution, with the highest single-factor pollution index of 915 and contributing to severe pollution levels in 14 samples, thereby accounting for 51.8%. The second largest contributor was Pb, with heavy pollution levels in four samples, thereby accounting for 32.6%. All eight heavy metal(oid)s exceeded their standards at point ZQ01. In addition to the single-factor pollution index of Hg, the other seven heavy metal(oid)s reached the level of heavy pollution, and their single-factor pollution index values were at the maximum at this point. The second most-polluted point was J1, with Cr, Ni, and As reaching the heavy pollution level.

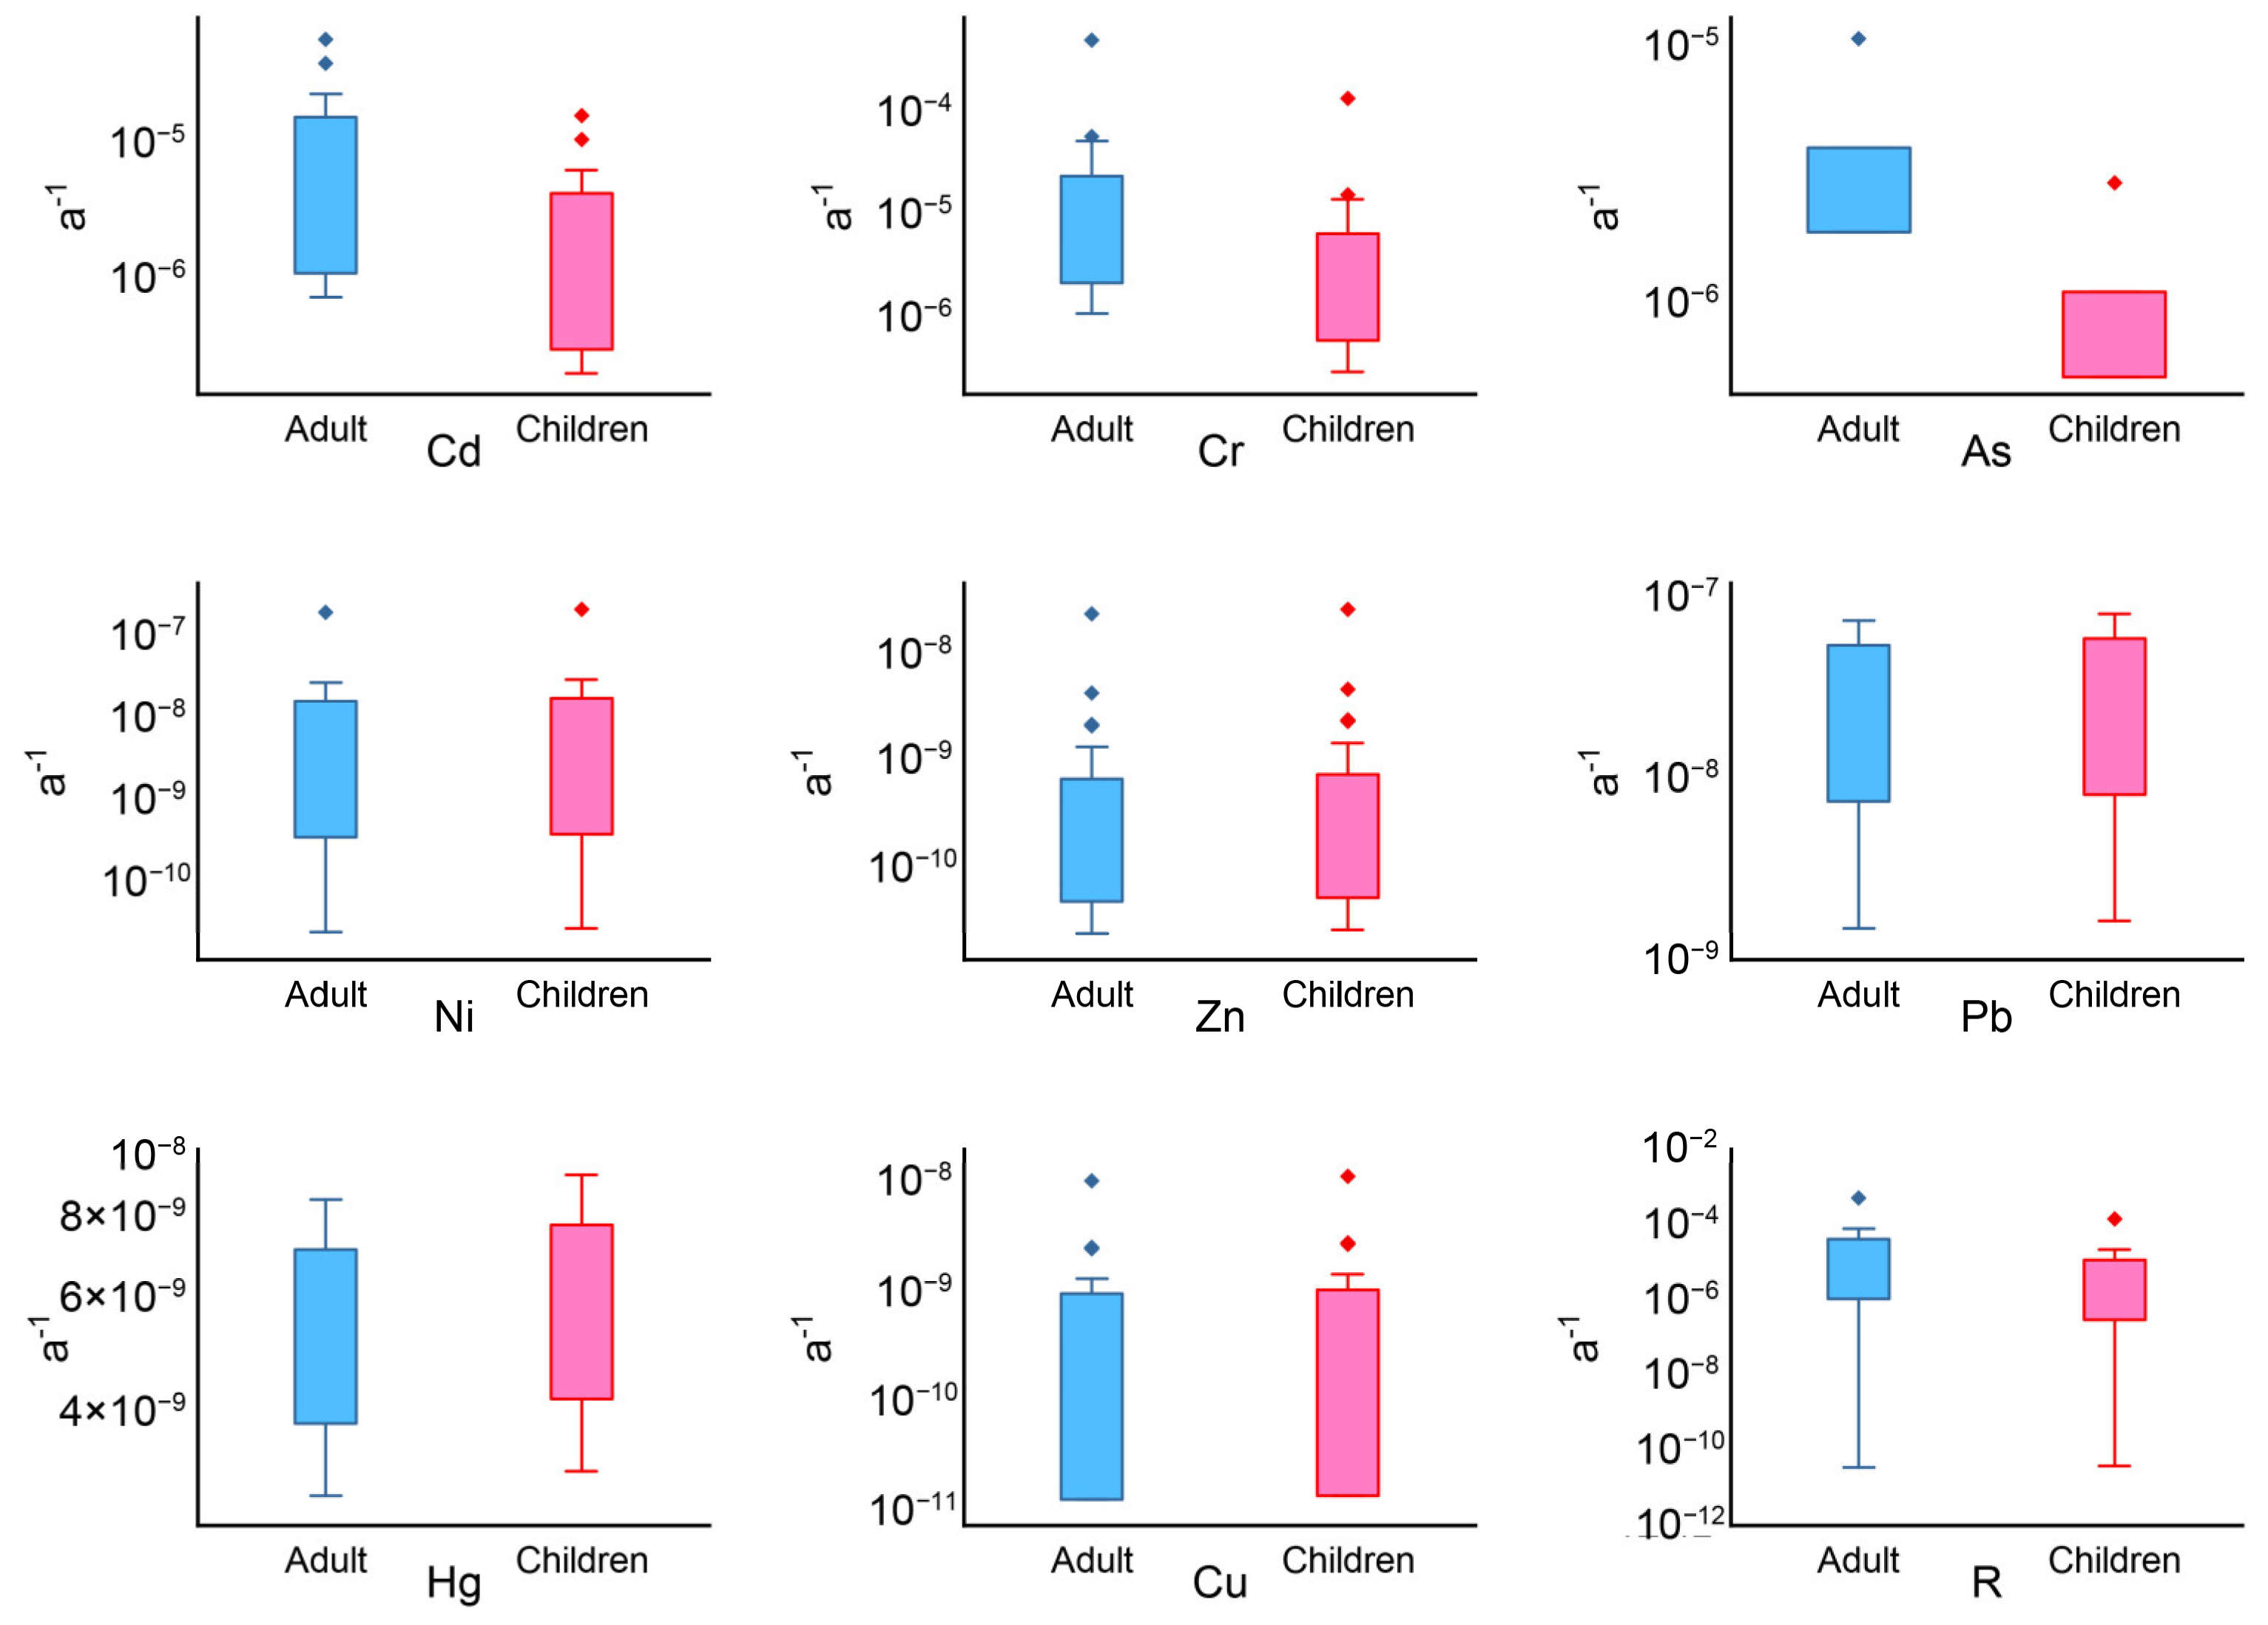
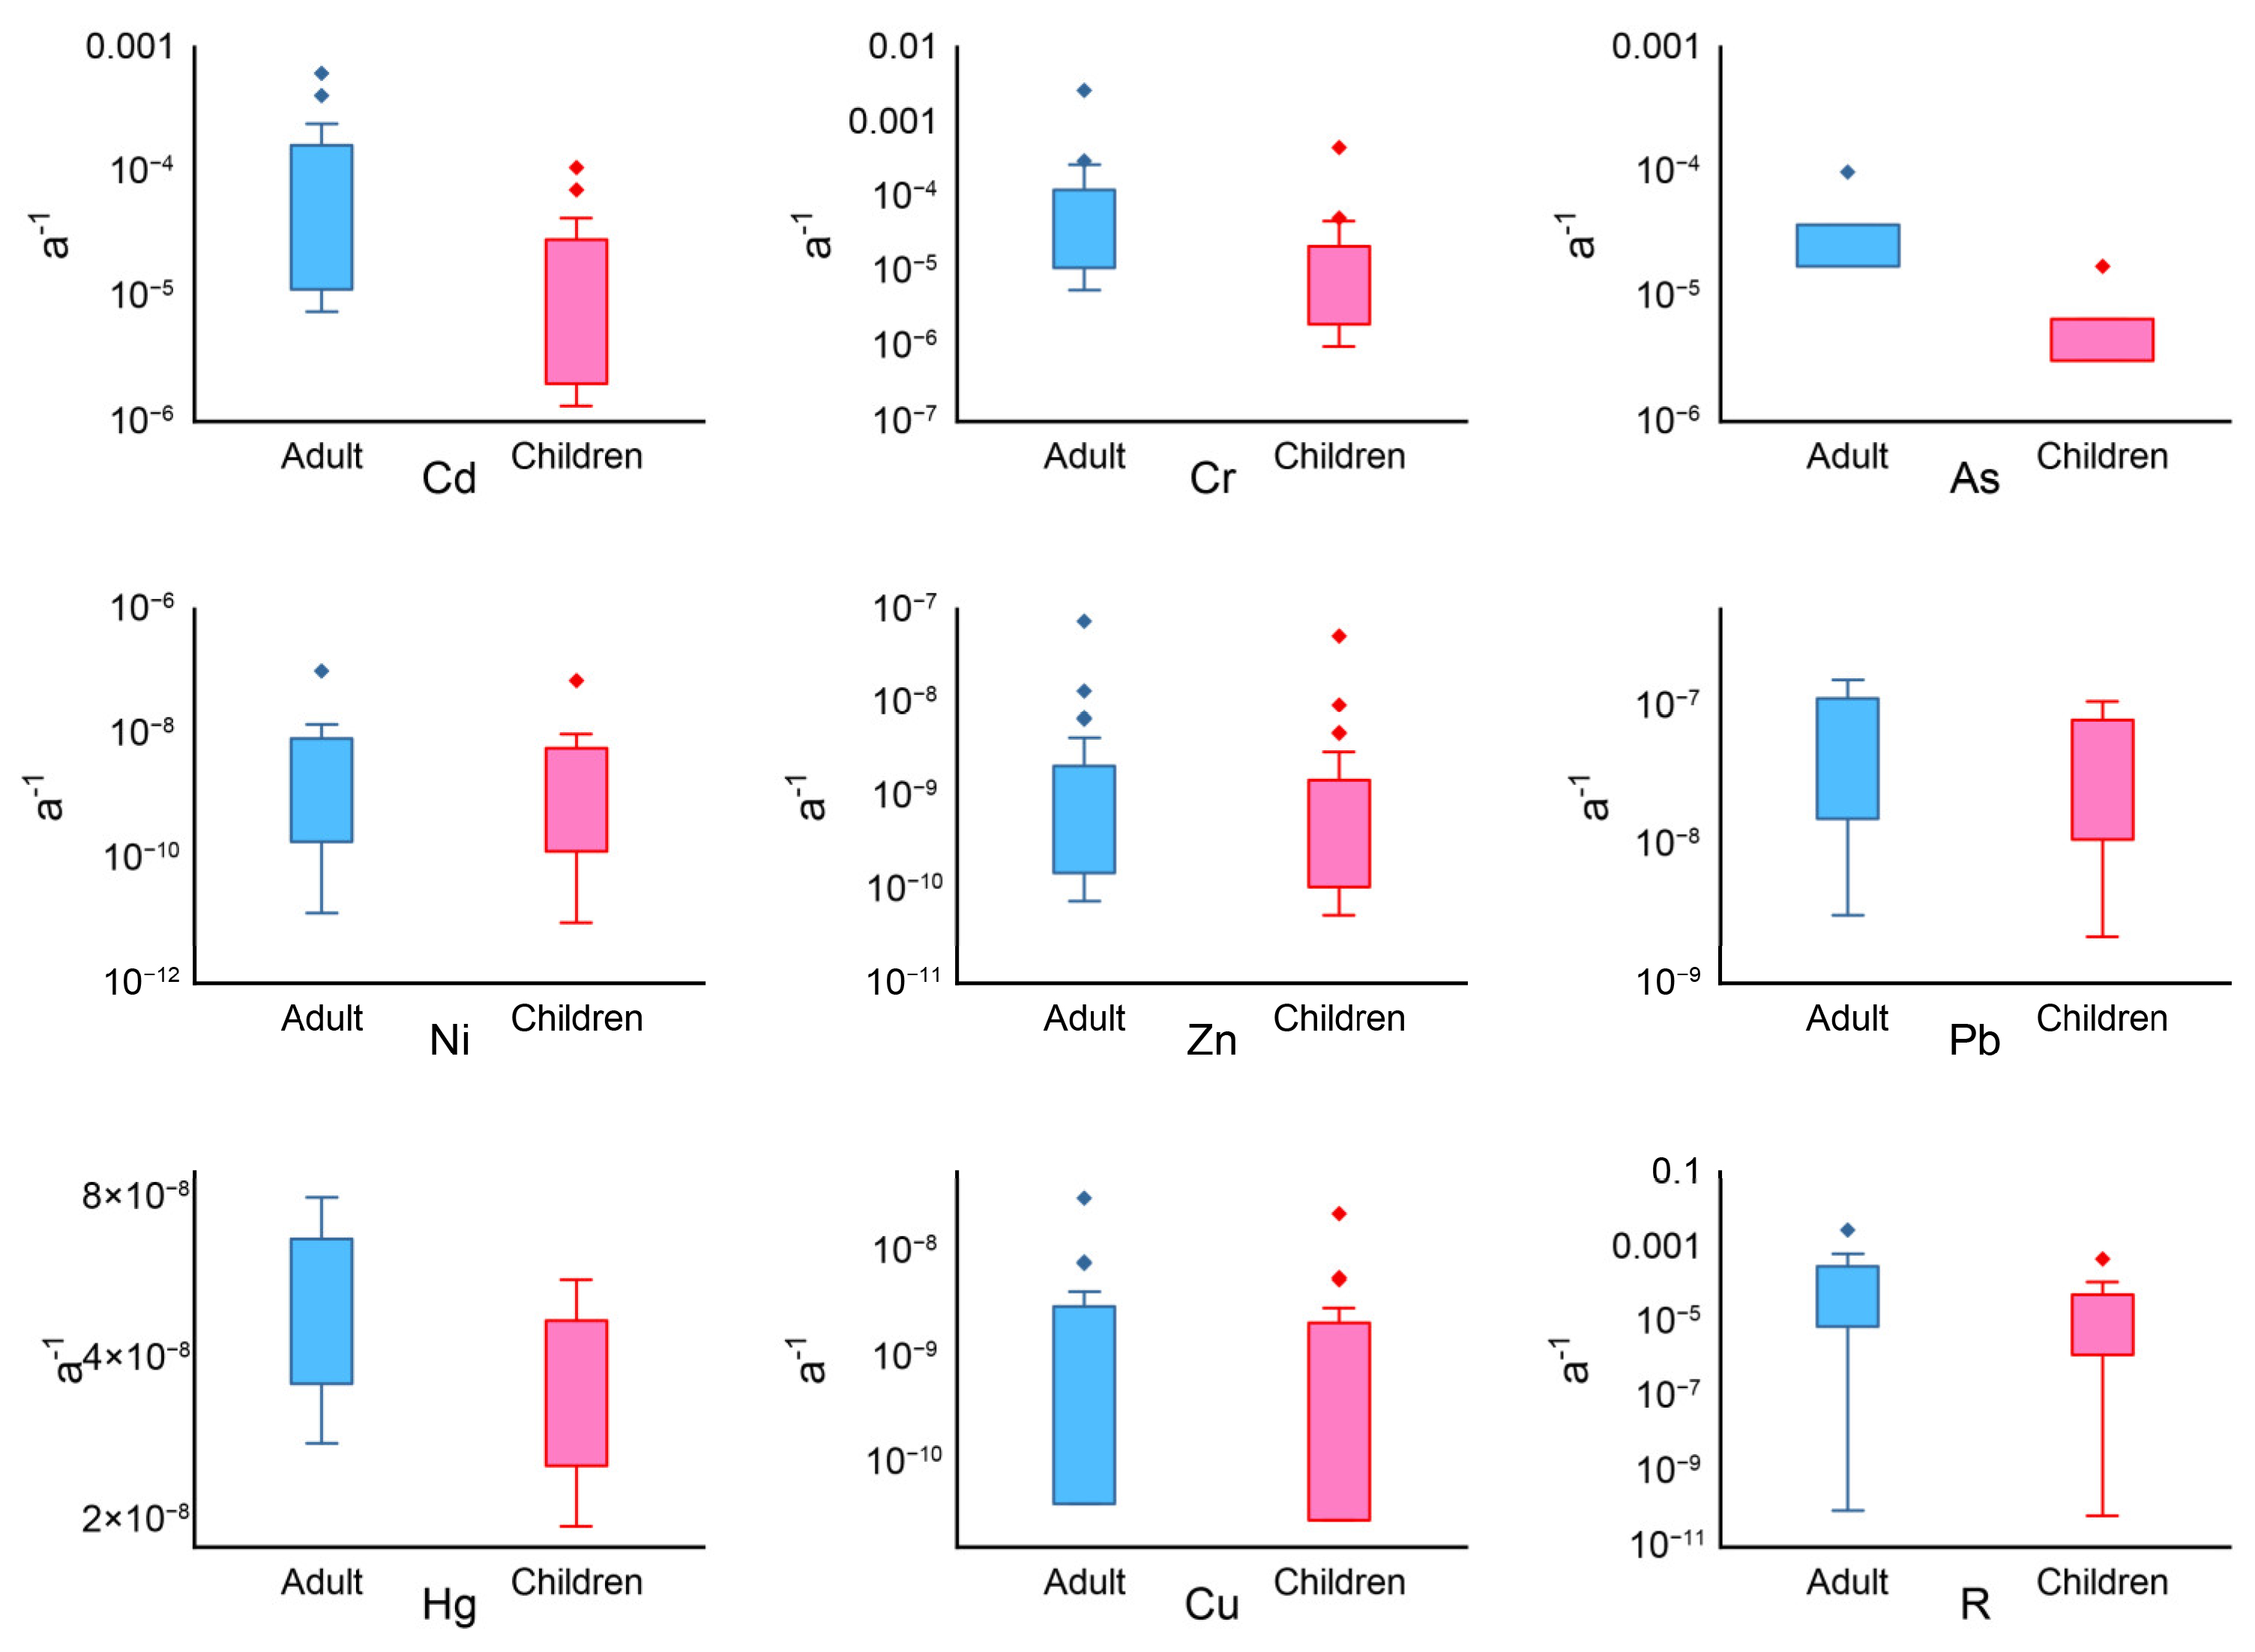
3.3. Health Risk Assessment

According to the concentration data of the heavy metal elements (As, Cd, Cr, Cu, Hg, Ni, Pb, and Zn) in the groundwater and the health risk assessment model, the average annual health risks of adults and children through drinking water and dermal contact exposure were calculated [44,45]. The results are shown in Table 5. The statistical results of the health risk values of the heavy metal(oid)s in the groundwater at the accident site are shown in Figure 5 and Figure 6. The maximum acceptable risk level recommended by the International Commission on Radiological Protection (ICPR) is 5.0 × 10⁻⁵ a−1. The total health risks associated with the eight heavy metal(oid)s in the study area through drinking water and dermal contact exceeded the maximum acceptable level. The total health risks of adults and children through drinking water exposure were found to be 9.51 × 10⁻⁵ a−1 and 2.59 × 10⁻⁵ a−1, respectively. The total health risks of adults and children through dermal contact exposure were found to be 6.34 × 10⁻⁴ a−1 and 1.11 × 10⁻⁴ a−1, respectively. The total health risks of children through drinking water and dermal contact are lower than those of adults.
The average annual health risks of the eight heavy metal(oid)s through drinking water and dermal contact in the study area are in the order of Cr > Cd > As > Pb > Ni > Zn > Cu > Hg and Cr > Cd > As > Pb > Ni > Hg > Zn > Cu, respectively. The average annual health risks of the carcinogenic heavy metal(oid)s (As, Cd, and Cr) and noncarcinogenic heavy metals (Cu, Hg, Ni, Pb, and Zn) through drinking water and dermal contact are between 10−6 and 10−4 and 10−10 and 10−8, respectively. The total health risk of the carcinogenic heavy metal(oid)s was 2–6 orders of magnitude higher than that of the noncarcinogenic heavy metal(oid)s, and the total health risk of the noncarcinogenic heavy metal(oid)s was 3–5 orders of magnitude lower than the maximum acceptable level. The noncarcinogenic health risk was small and would not cause obvious harm to the population. Therefore, the carcinogenic heavy metal(oid)s are the main concern for health risks in this area. The average annual health risks of the carcinogenic heavy metal(oid)s to the population through drinking water and dermal contact are in the order of Cr > Cd > As. The average annual carcinogenic risk posed by Cr is higher than that of Cd and As. Thus, Cr is the main pollutant of concern.
The results showed that the total health risk and carcinogenic health risk of 13 groundwater samples exceeded 5 × 10⁻⁵ a−1. From the perspective of spatial distribution, all of the samples above the acceptable level are located at the accident site, and the total health hazard risk value of the civil wells in the peripheral villages was below the acceptable level. Overall, the health risk is slightly higher for adults than for children. The carcinogenic health risk was higher than the maximum acceptable level and was four orders of magnitude higher than the noncarcinogenic health risk. Therefore, the heavy metal(oid)s in the groundwater of the accident site pose serious threats to human health, but they have not yet affected the normal drinking water of the surrounding areas. The carcinogenic heavy metal(oid)s are the main source of health risks in the region, and the impact of Cr on human health demands strong attention.
The results of the water quality evaluation in the study area show that Cr is a heavy metal element whose quantities in the study area exceed the standard. From the results of the health risk assessment, the health risk due to exposure to Cr through drinking water and dermal contact is the highest, and Cr is the main pollutant posing serious health risks. Therefore, the use of water quality assessment results alone is not enough to determine the safety of local water use. In particular, the risks posed by some nonexceeding heavy metal(oid)s to human health may be underestimated. In the study of water environment pollution, the results of water quality assessments and health risk assessments can be combined to determine the prevention and control of water pollution and to ensure the safety of drinking water for residents.

3.4. Pollution Source Analysis

The groundwater at the accident site and surrounding areas shows distinct heavy metal pollution, which is directly related to the artificial dumping of pollutants to a certain extent. In addition, underground closed pit coal mine water and other human activities may also contribute to the heavy metal pollution of the groundwater. To determine the causes of the heavy metal pollution in the groundwater, the sources of the heavy metal(oid)s in the groundwater were further analyzed through correlation analysis and principal component analysis.

3.4.1. Analysis of Relationship

Correlation analysis refers to the analysis of multiple variable elements with correlations [40,41,42]. In this study, correlation analysis was performed to measure the correlations between the ion contents of the water samples in the study area. The greater the absolute value of the correlation coefficient, the stronger the correlation. The correlation analysis matrix is used to study the correlations of each component in the groundwater. The lower triangle represents the correlation coefficients of each ion in the groundwater. The red number represents a positive correlation, and the blue number represents a negative correlation. The darker the color, the stronger the correlation. The results of correlation analysis (Figure 7) show that, except for Hg, the correlation coefficients between the other seven heavy metal indexes in the groundwater were higher than 0.8, with a significant positive correlation at the 0.01 level. The highest correlation coefficient was observed between Hg and the other indicators at 0.48, but it was not significant. There was a significant positive correlation between the heavy metal(oid)s and the TDS, COD, ammonia nitrogen, Be, Se, Co, Fe, and other indicators in the groundwater at the 0.01 level, and there was a significant negative correlation with chloride. The absolute value of the correlation coefficient between the heavy metal(oid)s and the total hardness, sulfate, nitrate, and nitrite in the groundwater was small, without any significant correlation. * represents the correlation between the various elements when p ≤ 0.05. * and red line represent the correlation of metal elements themselves, and the correlation is very strong.

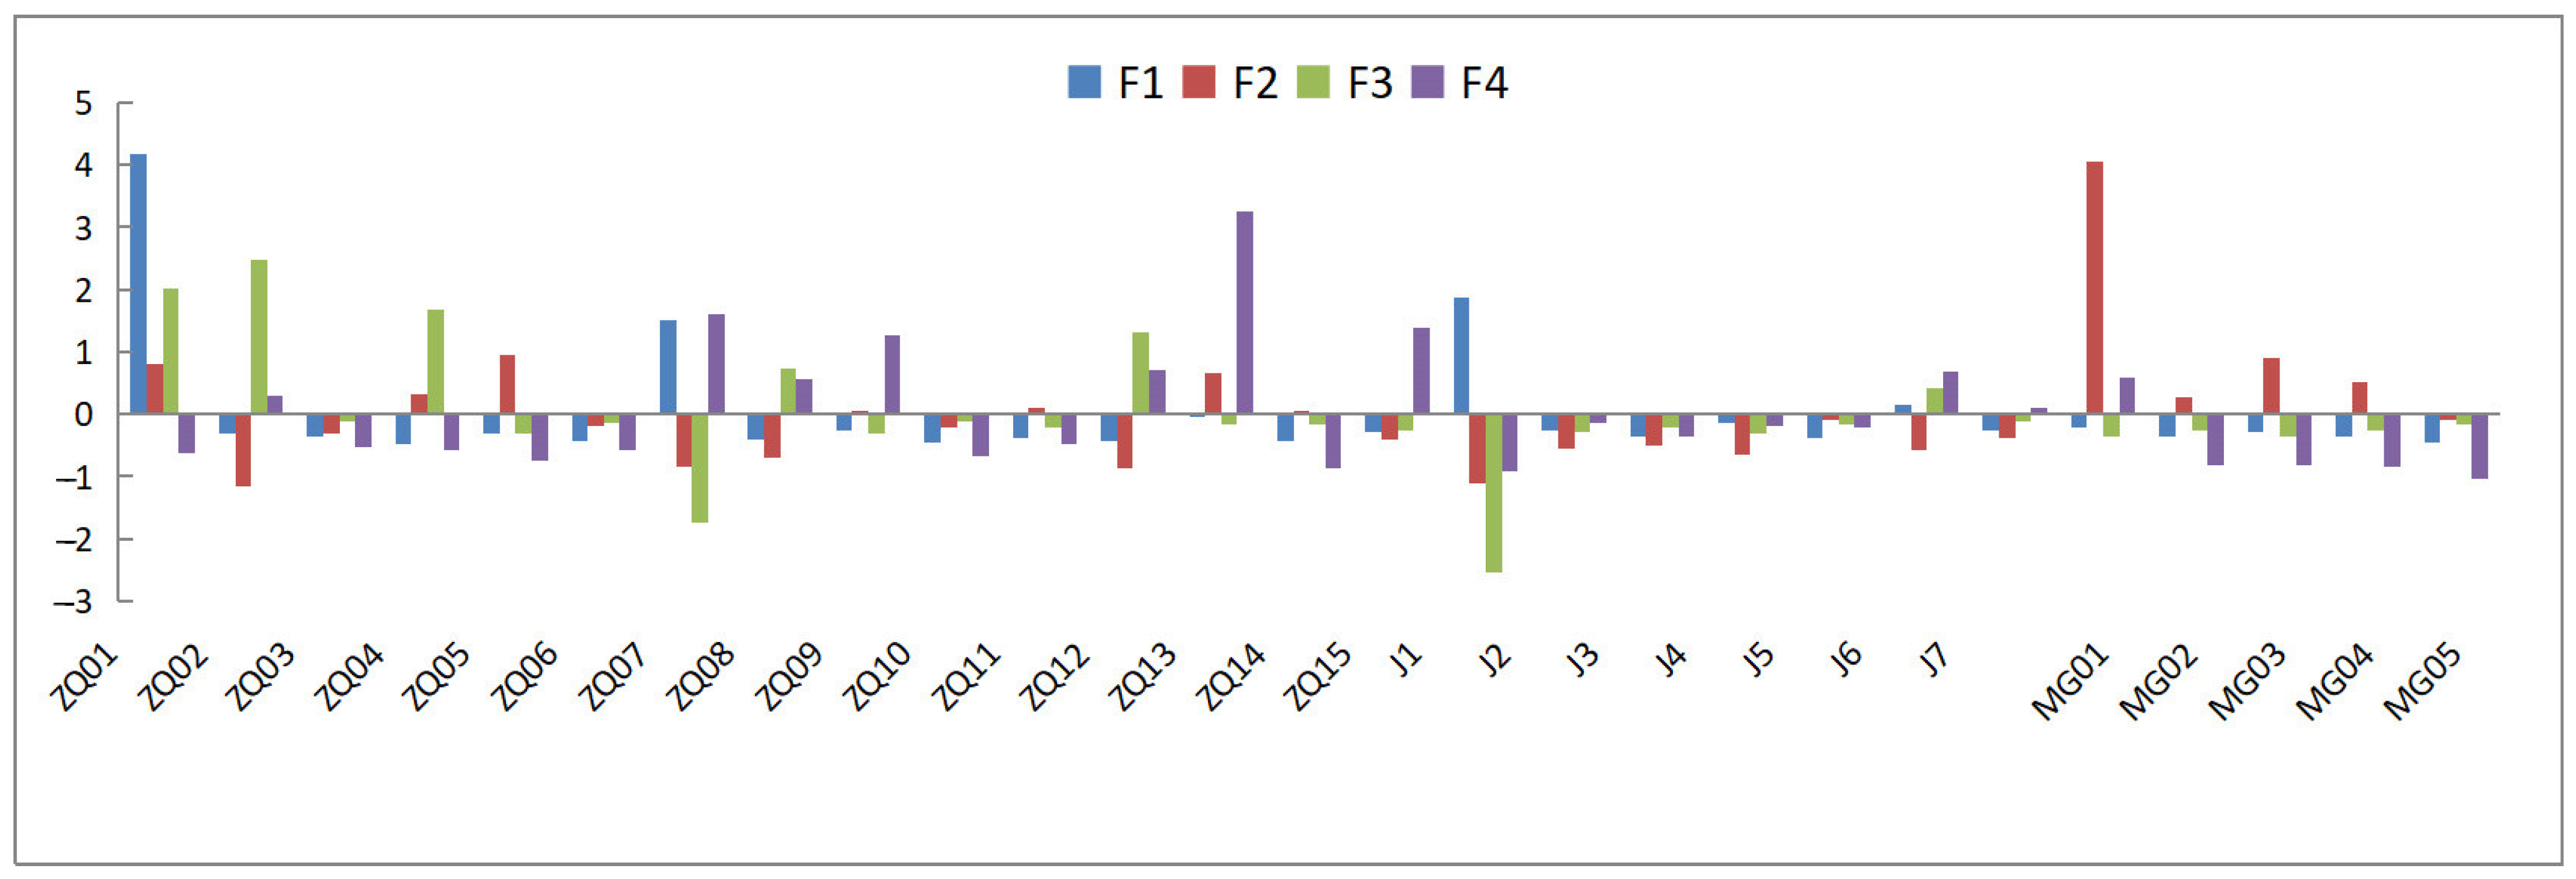
3.4.2. Principal Component Analysis

Before the PCA of the ions in the groundwater, the KMO and Bartlett tests of sphericity were first performed to determine the applicability of PCA. To meet the KMO and Bartlett sphericity tests, 15 indicators were finally selected for the PCA, namely, As, Cd, Cr, Cu, Hg, Ni, Pb, Zn, pH, total hardness (Th), Cl, COD, TDS, sulfate, and nitrate. The KMO was 0.707 and the p was 0.00, thus indicating that the data met the test conditions of PCA [5].
Four principal components (F1–F4) were extracted by PCA, which could explain 83.831% of the total variance. The factor load matrix after the rotation of the four principal components is shown in Table 6. For F1, the As, Cd, Cr, Cu, Hg, Ni, Pb, Zn, pH, COD, and TDS indicators showed larger contributions, and the absolute load factor exceeded 0.85. The principal component contained seven heavy metal elements, as well as the pH, COD, and TDS indicators. As the pollution event exerted a significant change in the groundwater pH and COD; this principal component explains the impact of the pollution event on the groundwater quality. For F2, the chloride and nitrate indicators showed larger contributions, with a load factor greater than 0.8, which can be attributed to the impact of human livelihood and production activities. For F3, the load factor of Hg was greater than 0.8, and the load factor of Pb was 0.5. As the detection rate of the Hg content in the water samples was very low, this component was preliminarily assessed to represent the influence of mining disturbance factors on the groundwater environment before mine closure. For F4, the total hardness and sulfate indicators showed large contributions, with a load factor greater than 0.7. Before the closure of the mine, as mine water was mainly derived from the limestone water of the roof and floor of the coal seam, the total hardness and sulfate content in the groundwater were prominently high. Therefore, the principal component is attributed to the influence of the mine water on the groundwater environment.
The scores of the four principal components of each sampling point can be obtained by calculating the principal component score coefficient (Figure 8). According to the principal component score, ZQ01, ZQ07, and J1 have the highest scores. As these three points are close to the accident well and have direct flow channels, they were most seriously affected by the accident. The highest score of F2 was observed at point MG01, which belongs to the water quality monitoring point of the village well outside of the accident site. The distance of this point from the accident well is more than 2 km, and it is located in the upstream position of the accident well. Therefore, the impact of the pollution accident on this point can be ignored. Nitrate and chloride exceeded the standards at this point, which is primarily attributable to the production and livelihood activities of the residents. At the same time, the scores of F2 were also high at points ZQ01, ZQ05, and ZQ13, thereby indicating that mining activities already affected some areas of the mine before the pollution accident. F3 presented the highest score at point ZQ02, which was about 100 m away from the accident well. Except for the Hg concentration exceeding the standard, other indicators met the Class III water standard. At the same time, the principal component scores of F3 were also high at ZQ01, ZQ04, and ZQ12, thereby indicating that, although the mining pit has been closed, the impact of mining activities persists.
In summary, the groundwater quality at the accident site was significantly affected by the pollution accident, which significantly increased the contents of As, Cd, Cr, Cu, Ni, Pb, and Zn in the groundwater. At the same time, mine production and mine-gushing water had been affecting the groundwater environment even before the accident, thus leading to increased heavy metal content in the groundwater.

4. Conclusions

The comprehensive indexes and heavy metal contents were significantly higher in the groundwater of the study area. The high abnormal values at individual sampling points indicated that the groundwater was seriously polluted, with a wide spatial variation. According to the calculation results of the comprehensive pollution index values, heavy metal(oid)s in 59.3% of the samples were found to be at strong pollution levels. The comprehensive pollution index values exceeded 100 at points ZQ01 and ZQ07. The pollution level in the peripheral civil wells was found to be significantly lower than that of the abandoned mine karst water samples. In addition, the results of the health risk assessment showed that the karst water in the abandoned mine was primarily polluted by Cr and Cd, and the total health risks through drinking water dermal contact were higher for adults than for children.

Author Contributions

Conceptualization, Y.H., Y.L., S.W. and M.W.; Methodology, Y.H., Y.L. and M.W.; Software, G.D., X.S., D.S., S.G. and C.T.; Validation, Y.H., Y.L., M.W. and G.M.; Formal Analysis, M.W., X.S., D.S. and G.M.; Investigation, Y.H., Y.L., S.W., G.D. and G.M.; Resources, Y.L., M.W., X.S., D.S. and S.G.; Data Management, Y.L., S.W., M.W., G.D. and D.S.; Writing—Manuscript Preparation, Y.H., Y.L. and S.W.; Writing—Review and Editing, Y.H., Y.L., S.W. and M.W.; Visualization, Y.H., M.W. and D.S.; Supervision, Y.L., S.W., G.D., X.S. and D.S.; Project Management, C.T.; Funding Acquisition, S.G. All authors have read and agreed to the published version of the manuscript.

Funding

The study involved in this paper was supported by the National Natural Science Foundation of China (No. 42202294).

Data Availability Statement

Not applicable.

Acknowledgments

We thank the editors and anonymous reviewers for their valuable suggestions to the manuscript.

Conflicts of Interest

The authors declare no conflict of interest.

References

  1. Liu, Y.; Ma, R. Human health risk assessment of heavy metals in groundwater in the Luan River Catchment within the North China plain. Geofluids 2020, 2020, 8391793. [Google Scholar] [CrossRef]
  2. Wu, J.H.; Zhang, Y.X.; Zhou, H. Groundwater chemistry and groundwater quality index incorporating health risk weighting in Dingbian County, Ordos Basin of northwest China. Geochemistry 2020, 80, 125607. [Google Scholar] [CrossRef]
  3. Liu, Z.Q.; Qiu, F.G.; Li, H.Y.; Dong, H.; Fang, L.; Qiang, Z. Evaluations of rural drinking water quality and health risk in the North China Plain. Environ. Chem. 2021, 40, 2054–2063. (In Chinese) [Google Scholar]
  4. He, S.; Wu, J.H. Hydrogeochemical characteristics, groundwater quality, and health risks from hexavalent chromium and nitrate in groundwater of huanhe formation in Wuqi County, northwest China. Expo. Health 2019, 11, 125–137. [Google Scholar] [CrossRef]
  5. Shi, H.H.; Pan, Y.J.; Zeng, M.; Huang, C.S.; Hou, Q.Q.; Pi, P.C.; Peng, H.X. Source analysis and health risk assessment of heavy metals in groundwater of Leizhou peninsula. Environ. Sci. 2021, 42, 4246–4256. (In Chinese) [Google Scholar] [CrossRef]
  6. Khany, K.; Toqeer, M.; Shah, M.H. Spatial distribution, pollution characterization and health risk assessment of selected metals in groundwater of Lahore, Pakistan. Geochemistry 2021, 81, 125692. [Google Scholar] [CrossRef]
  7. Wang, L.; Tao, Y.; Su, B.; Wang, L.; Liu, P. Environmental and Health Risks Posed by Heavy Metal Contamination of Groundwater in the Sunan Coal Mine, China. Toxics 2022, 10, 390. [Google Scholar] [CrossRef]
  8. Kefeni, K.K.; Msagati, T.A.M.; Mamba, B.B. Acid mine drainage: Prevention, treatment options, and resource recovery: A review. J. Clean. Prod. 2017, 151, 475–493. [Google Scholar] [CrossRef]
  9. Rezaie, B.; Anderson, A. Sustainable resolutions for environ-mental threat of the acid mine drainage. Sci. Total Environ. 2020, 717, 137211. [Google Scholar] [CrossRef]
  10. Tomiyama, S.; Igarashi, T. The potential threat of mine drainage to groundwater resources. Curr. Opin. Environ. Sci. Health 2022, 27, 100347. [Google Scholar] [CrossRef]
  11. Feng, Q.Y.; Zhou, L. Risk Assessment and Control of Groundwater Pollution in Abandon Mine; China Environmental Science Press: Beijing, China, 2016. [Google Scholar]
  12. Chen, D.; Feng, Q.; Gong, M. Contamination Characteristics and Source Identification of Groundwater in Xishan Coal Mining Area of Taiyuan Based on Hydrochemistry and Sulfur–Oxygen Isotopes. Water 2023, 15, 1169. [Google Scholar] [CrossRef]
  13. Nkpaa, K.W.; Amadi, B.A.; Wegwu, M.O. Hazardous metals levels in groundwater from Gokana, Rivers State, Nigeria: Non-cancer and cancer health risk assessment. Hum. Ecol. Risk Assess. 2018, 24, 214–224. [Google Scholar] [CrossRef]
  14. Mirzabeygi, M.; Abbasnia, A.; Yunesian, M.; Nodehi, R.N.; Yousefi, N.; Hadi, M.; Mahvi, A.H. Heavy metal contamination and health risk assessment in drinking water of Sistan and Baluchistan, Southeastern Iran. Hum. Ecol. Risk Assess. 2017, 23, 1893–1905. [Google Scholar] [CrossRef]
  15. Naz, A.; Chowdhury, A.; Mishra, B.K.; Gupta, S.K. Metal pollution in water environment and the associated human health risk from drinking water: A case study of Sukinda chromite mine, India. Hum. Ecol. Risk Assess. 2016, 22, 1433–1455. [Google Scholar] [CrossRef]
  16. Tong, H.; Gao, Z.J.; Gao, F.S.; Liu, J.; Peng, Y.L.; Li, C. Hydrochemical characteristics and water quality evaluation of groundwater in the west of Yi River Basin. Environ. Chem. 2021, 40, 3443–3454. [Google Scholar]
  17. Xia, L.; You, H.C.; Liu, J.T.; Han, C.; Gao, Z.; Peng, Y.; Li, C. Hydrochemical Characteristics and Water Quality Evaluation of Groundwater in Coastal Area of Jiaodong Peninsula. Environ. Sci. Technol. 2021, 44, 1–10. [Google Scholar] [CrossRef]
  18. Han, C.; Gao, Z.J.; Liu, J.T.; Li, F.; Zhang, Y.; Liu, R.; Feng, C. Chemical Characteristics of Groundwater and Health Risk Assessment of Nitrate in Tancheng Area. Earth Environ. 2021, 49, 436–446. [Google Scholar] [CrossRef]
  19. Qiu, M.; Liu, L.; Zou, X.; Wu, L. Comparison of source water quality standards and evaluation methods between China and some developed countries. J. China Inst. Water Resour. Hydropower Res. 2013, 11, 176–182. [Google Scholar] [CrossRef]
  20. Cheng, J.X.; Cheng, S.G.; Zhang, W. Comparison and Analysis on Common Methods of Groundwater Quality Assessment. Saf. Environ. Eng. 2008, 15, 23–25. [Google Scholar]
  21. Shang, B.X.; Lü, Z.; Li, J.N.; Li, T.Q. Application of Fuzzy Mathematics and Single Factor lndex in Water Quality Evaluation. J. Hebei Univ. Environ. Eng. 2013, 23, 1–4. [Google Scholar]
  22. Li, C.P.; Li, G.X.; Luo, Y.M.; Li, Y.F. Fuzzy Mathematics-Based Groundwater Quality Evaluation of Six MSW Landfills in Beijing. Environ. Sci. 2008, 29, 2729–2735. [Google Scholar] [CrossRef]
  23. Huang, Y.Y.; Zeng, Y.; Liu, S.J.; Ma, Y.H.; Xu, X. Community Structure of Aquatic Community and Evaluation of Water Quality in Laoyingyan Section of Dadu River. Environ. Sci. 2016, 37, 132–140. [Google Scholar] [CrossRef]
  24. Yan, B.; Xiao, C.; Liu, H.; Wei, R.; Liang, X. Effect of urban land use on the spatial distribution of groundwater pollution in the Jilin City. China Environ. Sci. 2015, 35, 934–942. [Google Scholar]
  25. Zhang, X.Y.; Zhang, Y.X.; Ren, Z.Y.; Duan, Z.L. Comparison and practical example of assessment method in different groundwater qualities. J. Water Resour. Water Eng. 2014, 25, 98–101. [Google Scholar]
  26. Yu, C.C.; Zhao, W.T.; Gao, X.F.; Cheng, S.G.; Huang, T.; Yin, Y.M.; Zhao, Z.L. Distribution Characteristics and Health Risk Assessment of Heavy Metals in Surface Water Around Electroplating Factories. Environ. Sci. 2017, 38, 993–1001. [Google Scholar] [CrossRef]
  27. Yu, C.C.; Zhao, W.T.; Gao, X.F.; Cheng, S.G.; Xie, D.; Ma, P.T. Distribution Characteristics and Health Risk Assessment of Metals in Drinking Water Sources from the Luhun Reservoir. Environ. Sci. 2018, 39, 89–98. [Google Scholar] [CrossRef]
  28. Zhang, Y.; Li, F.; Ouyang, Z.; Zhao, G.; Li, J.; Liu, Q. Distribution and Health Risk Assessment of Heavy Metals of Groundwaters in the lrrigation District of the Lower Reaches of Yellow River. Environ. Sci. 2013, 34, 121–128. [Google Scholar] [CrossRef]
  29. Zhang, J.Q.; Tian, Q.; Xu, D.M.; Zhan, C.L.; Liu, T.; Yao, R.Z.; Liu, X.L.; Xiao, W.S. Pollution Characteristics and Risk Assessment of Heavy Metals in Water and Sediment from Daye Lake. Environ. Sci. 2017, 38, 2355–2363. [Google Scholar] [CrossRef]
  30. Zhang, Q.Q.; Pan, S.L.; Liu, W.; Zhang, Y.; An, W. Accumulated Health Risk Assessment of Arsenic in Drinking Water of Major Cities of China. Environ. Sci. 2017, 38, 1835–1841. [Google Scholar] [CrossRef]
  31. Zhou, J.M.; Jiang, Z.C.; Xu, G.L.; Qin, X.Q.; Huang, Q.B.; Zhang, L.K. Water Quality Analysis and Health Risk Assessment for Groundwater at Xiangshui, Chongzuo. Environ. Sci. 2019, 40, 2675–2685. [Google Scholar] [CrossRef]
  32. Li, Y.; Li, C.J. Analysis on the historical observation data from Zhangqiu national ordinary meteorological station. Hubei Agric. Sci. 2021, 60, 126–130. [Google Scholar] [CrossRef]
  33. Zhang, X.L.; Hu, Z.G.; Tian, L.M.; Zhang, Y.; Zhao, X.; Zhao, L. The Research on the Types and Distribution Regularities of lmportant Geoheritage in Jinan City. Sci. Technol. Vis. 2019, 16, 48–50+94. [Google Scholar] [CrossRef]
  34. Sun, M.Y.; Gao, Z.Y.; Wan, S.P.; Shao, Q.; Sun, Y. Analysis of hydrogeological conditions in the sevelopment and utilization of groundwaterground source heat pump system in Zhangqiu District. Environ. Dev. 2019, 31, 164–165. [Google Scholar] [CrossRef]
  35. Alberto, W.D.; del Pilar, D.M.; Valeria, A.M.; Fabiana, P.S.; Cecilia, H.A.; de Los Ángeles, B.M. Pattern Recognition Techniques for the Evaluation of Spatial and Temporal Variations in Water Quality. A Case Study: Suquía River Basin (Córdoba–Argentina). Water Res. 2001, 35, 2881–2894. [Google Scholar] [CrossRef]
  36. Zhou, S.J.; Sun, S.Q.; Wang, J.C.; Ni, X.; Chu, W. Comprehensive Evaluation of River Water Environmental Quality Based on the Principal Component Analysis. Environ. Sci. Manag. 2007, 32, 172–175. [Google Scholar]
  37. Liu, Z.T.; Li, C.M.; Zhang, G.Y. Application of Principal Component Analysis to the Distributions of Heavy Metals inthe Water of Lakes and Reservoirs in Yunnan Province. Res. Environ. Sci. 2010, 23, 459–466. [Google Scholar] [CrossRef]
  38. Feng, L.H. Principal Component Analysis of Environmental Quality. Math. Pract. Theory 2003, 33, 32–35. [Google Scholar]
  39. Fu, R.J.; Xin, C.L.; Yu, S.; Li, X. Analysis of Heavy Metal Sources in Groundwater and Assessment of Health Risks: An Example from the Southwest Sub-basin of the Shiqi River. Environ. Chem. 2023, 44, 796–806. [Google Scholar] [CrossRef]
  40. Zhou, J.M.; Jiang, Z.C.; Xu, G.L.; Qin, X.Q.; Huang, Q.B.; Zhang, L.K. Distribution and health risk assessment of metals in groundwater around iron mine. China Environ. Sci. 2019, 39, 1934–1944. [Google Scholar]
  41. Zhao, X.G.; Duan, X.L. Highlights of the Chinese Exposure Factors Handbook (Adults); China Environmental Science Press: Beijing, China, 2014. [Google Scholar]
  42. Duan, X.L. Highlights of the Chinese Exposure Factors Handbook (Children); China Environmental Science Press: Beijing, China, 2016. [Google Scholar]
  43. Li, J.; Miao, X.; Hao, Y.; Xie, Z.; Zou, S.; Zhou, C. Health risk assessment ofmetals (Cu, Pb, Zn, Cr, Cd, As, Hg, Se) in angling fish withdifferent lengths collected from Liuzhou, China. Int. J. Environ. Res. Public Health 2020, 17, 2192. [Google Scholar]
  44. Giri, S.; Singh, A.K. Risk assessment, statistical source identification and seasonal fluctuation of dissolved metals in the Subarnarekha River, India. J. Hazard. Matarials 2014, 265, 305–314. [Google Scholar] [CrossRef] [PubMed]
  45. Qiao, J.; Zhu, Y.; Jia, X.; Niu, X.; Liu, J. Distributions of arsenic andother heavy metals, and health risk assessments for groundwaterin the Guanzhong Plain region of China. Environ. Res. 2019, 181, 108957. [Google Scholar]
Figure 1. Site stratigraphic profile.
Water 15 03440 g001
Figure 2. Study area map and distribution of groundwater sampling points.
Water 15 03440 g002
Figure 3. Box distribution map of metal element concentrations in groundwater at the study site.
Water 15 03440 g003
Figure 4. Nemerow comprehensive pollution index values of underground water samples at the accident site.
Water 15 03440 g004
Figure 5. Box plots of annual health risks posed by heavy metal(oid)s in groundwater (drinking water pathway).
Water 15 03440 g005
Figure 6. Box plots of annual health risk values caused by heavy metal elements in groundwater (dermal contact).
Water 15 03440 g006
Figure 7. Correlation analysis matrix.
Water 15 03440 g007
Figure 8. Histogram of main component scores at sampling points.
Water 15 03440 g008
Table 1. Values of parameters related to the health risk assessment (carcinogenic and noncarcinogenic).
Health Risk Assessment PC
10−3 cm × h−1
SF/(kg × d) × mg−1RFD/mg × (kg × d)−1AT/d
Drinking Water PathwayDermal Contact PathwayDrinking Water PathwayDermal Contact Pathway
CarcinogenicAs1.81.53.660.00030.00012325,550
Cr241410.0030.003
Cd16.16.10.00050.0005
Non
carcinogenic
Ni0.10.020.0054ED × 365
Zn0.60.30.01
Pb0.40.000350.000053
Hg1.80.00030.0003
Cu0.60.040.012
Table 2. Values of parameters related to health risk assessment (adults and children).
ParameterImplicationReference ValueUnitReference
AdultsChildren
IRWater intake2.21L × d−1[41,42]
EFExposure frequency365365d × a−1[41,42]
BWWeight per capita6025kg[41,42]
SAContact with the surface area of the skin18,0008000cm2[41,42]
ETExposure time0.63330.4167h × d−1[41,42]
LHuman longevity7070a[43]
CFvolume Conversion factor11ml × cm−3[43]
EDExposure duration246a[40,41]
Table 3. Statistical results of groundwater quality indicators.
IndexDetection LimitStandard LimitMinAverageMaxStandard DeviationCoefficient of VariationExcess Rate (%)
pH-6.5–8.53.106.547.71.190.1822.22
THS (mg × L−1)5450342.001235.192930771.300.6288.89
TDS (mg × L−1)51000513.004471.593440081591.8274.07
COD (mg × L−1)0.53.00.9570.9504.6153.042.4859.26
F (mg × L−1)0.0510.11.0214.62.792.7411.11
Cl (mg × L−1)10250538.4831857.741.503.70
NO3(mg × L−1)0.1200.46.0421.75.250.873.70
SO42−(mg × L−1)0.02525043322730599.401.8114.81
Table 4. Single-factor pollution index values and comprehensive pollution index values of samples.
Level of PollutantWiLevel of PollutantWn
CuCrNiZnPbCdHgAs
Cleaning
(Wi ≤ 1)
2624102218242222Pollution-free (Wn ≤ 0.7)10
light pollution
(1 < Wi ≤ 2)
01123213low pollution
(0.7 < Wn ≤ 1)
1
moderate pollution
(2 < Wi ≤ 3)
10212020moderate pollution
(1 < Wn ≤ 2)
0
heavy pollution (Wi > 3)021424122heavy pollution (Wn > 2)16
Table 5. Annual average health risk values of exposure to heavy metal(oid)s in groundwater (a−1).
ItemElementDrinking Water PathwaySkin Infiltration Pathway
AdultsChildrenAdultsChildren
CarcinogenicAs1.46 × 10−63.97 × 10−71.36 × 10−52.38 × 10⁻⁶
Cd2.62 × 10−57.16 × 10−62.72 × 10−44.77 × 10⁻⁵
Cr6.72 × 10−51.83 × 10−53.48 × 10−46.11 × 10⁻⁵
NoncarcinogenicNi3.14 × 10−83.42 × 10−81.63 × 10−81.14 × 10⁻⁸
Zn2.43 × 10−92.65 × 10−97.56 × 10−95.31 × 10⁻⁹
Pb3.21 × 10−83.50 × 10−86.65 × 10−84.67 × 10⁻⁸
Hg9.51 × 10−101.04 × 10−98.87 × 10−96.22 × 10⁻⁹
Cu1.89 × 10−92.06 × 10−95.86 × 10−94.11 × 10⁻⁹
Total Health Risk 9.51 × 10−52.59 × 10−56.34 × 10−41.11 × 10−4
Table 6. Rotating component matrix of major water quality indicator concentrations in groundwater.
IndexF1F2F3F4
As0.899−0.1080.088−0.155
Cd0.8560.1420.401−0.009
Cr0.9300.0250.168−0.186
Cu0.8330.1050.412−0.002
Hg0.115−0.1960.8100.035
Ni0.9180.0540.2480.062
Pb0.8330.0880.500−0.092
Zn0.863−0.0320.0700.182
pH−0.8840.1840.088−0.270
Th0.231−0.3170.1460.793
Cl−0.1670.840−0.0660.104
COD0.907−0.154−0.2230.041
TDS0.934−0.082−0.016−0.052
SO42−−0.1290.109−0.0710.748
NO30.1480.861−0.102−0.218
Disclaimer/Publisher’s Note: The statements, opinions and data contained in all publications are solely those of the individual author(s) and contributor(s) and not of MDPI and/or the editor(s). MDPI and/or the editor(s) disclaim responsibility for any injury to people or property resulting from any ideas, methods, instructions or products referred to in the content.

