Article

Spatial and Temporal Variations in Soil Moisture for a Tamarisk Stand under Groundwater Control in a Hyper-Arid Region

1
Research Center of Agricultural Economy, School of Economics, Sichuan University of Science & Engineering, Zigong 643000, China
2
Hainan Research Academy of Environmental Sciences, Haikou 571126, China
3
Key Laboratory of Ecosystem Network Observation and Modeling, Institute of Geographic Sciences and Natural Resources Research, Chinese Academy of Sciences, Beijing 100101, China
*
Authors to whom correspondence should be addressed.
Water 2023, 15(19), 3403; https://doi.org/10.3390/w15193403
Submission received: 29 June 2023 / Revised: 16 September 2023 / Accepted: 20 September 2023 / Published: 28 September 2023
(This article belongs to the Section Soil and Water)

Abstract

:
In hyper-arid regions, soil moisture’s role in ecohydrological processes can differ significantly from that in arid or semi-arid ecosystems. We investigated the spatial–temporal dynamics of soil moisture and its relationship with groundwater depths in a 200 m × 300 m phreatophytic tamarisk stand in the lower basin of the Tarim River, a hyper-arid zone in China. Soil moisture profiles, from the surface to the water table, were derived using drilling and oven-drying techniques. Over a three-year period, the soil moisture at multiple depths was continuously monitored in a specific plot using nine frequency domain reflectometry (FDR) sensors. Our results indicate a correlation between horizontal variations in soil moisture and groundwater depths (GWDs). Nevertheless, anomalies in this correlation were observed. Variations in horizontal soil moisture were strongly influenced by the clay content in the soil, with finer soils retaining more moisture. Despite varying GWDs, soil moisture profiles remained consistent, with no distinct correlation between them. Soil moisture exhibited stability across layers, with noticeable changes only adjacent to the water table. These results imply that in hyper-arid environments, soil texture primarily governs soil moisture distribution. However, the limited spatial and temporal scopes in our dataset, constrained by the region’s inhospitable conditions, necessitate further investigation. Future work should prioritize amalgamating diverse data sources to devise a region-specific soil moisture model for in-depth analysis of hyper-arid regions.

1. Introduction

Soil moisture is a key determinant of the health of terrestrial ecosystems. It plays a fundamental role in the feedback between the Earth and the atmosphere, as well as in all aspects of vegetation growth and composition [1]. At the same time, soil moisture is a key element in the hydrological process at the land surface. It redistributes precipitation by affecting infiltration to runoff and directly influences the evapotranspiration process [2,3,4]. The space–time characterization of the soil moisture dynamics may provide significant insight into the understanding of the hydrological, meteorological, and ecological processes acting over a variety of scales. Moreover, knowledge of the temporal and spatial variability of soil moisture is critical for understanding and predicting processes such as the partitioning of received energy at the land surface, vegetation water stress in a heterogeneous landscape, soil carbon, and nitrogen cycles, etc. [5].
The temporal dynamics of soil moisture are typically considered as a stochastic process, which is mainly driven by stochastic precipitation events [6,7]. Lots of investigations into temporal variations and the time stability of soil moisture with different ecosystems or under different climate conditions were carried out through ground or remote sensing-based data [8,9,10,11,12,13]. Stochastic soil moisture dynamic models were developed for different conditions of soil, topography, and vegetation [14,15,16]. The spatial dynamics of soil moisture are mainly influenced by soil texture, vegetation, and topographic patterns [17,18,19,20,21]. The impact of spatial heterogeneity of soil properties on the soil moisture budget has been extensively investigated using the scaling theory of soil hydraulic properties [22,23,24,25]. These studies show that the equivalent soil parameters, which were defined to capture the effects of spatial heterogeneity on the soil water budget [26], depend not only on the spatial characteristics of soils but also on the climate, particularly the precipitation processes [6,27,28]. Most of this research shows that rain plays a driving role in the temporal and spatial variability of soil moisture.
In hyper-arid regions, where annual precipitation is usually less than 60 mm [29], the impacts of rain on soil water dynamics can be neglected. Widely spread sandy dunes appear in these regions due to extreme drought, suggesting that soil water is scarce in these regions. However, there are some inland rivers, such as the Tarim River and the Heihe River in arid northwestern China. These inland rivers foster the desert riparian ecosystems along the rivers, indicating that soil water is enough and maintains the growth and development of the desert vegetation in these riparian zones under hyper-arid climates. Obviously, the soil water dynamics in these desert riparian ecosystems are controlled by groundwater or flooding water rather than rain. However, the impacts of groundwater on soil moisture dynamics in these desert riparian ecosystems under hyper-arid climates have been rarely studied.
As another water source to soil water in a vadose zone, where groundwater depth is shallow, groundwater is particularly important for revealing the spatial and temporal dynamics of soil moisture [30,31,32,33]. Some stochastic models have been developed for studying the interactions between rainfall, water table, and vegetation [34,35,36,37,38]. Based on these models, the stationary probability distributions of soil moisture at different depths influenced by capillary flux can be investigated for different soils, climates, and vegetation. However, few field measurements have been carried out to investigate the soil moisture dynamics controlled by groundwater. The field measurement results can improve our understanding of soil moisture dynamics under the control of groundwater, provide valuable information and datasets to validate the different kinds of simulation models of soil moisture and support the ecohydrological study in hyper-arid regions.
In this study, we conducted a field investigation of spatial and temporal variability in soil moisture in a tamarisk (Tamarix spp.) stand in the lower Tarim River basin of China. This area is hyper-arid with a mean annual precipitation of less than 50 mm. The influence of rain on soil moisture can be ignored in this area due to the rare rain. The water source of the studied tamarisk stands is mainly from groundwater rather than flood watering for at least fifty years because this area had been dried out for more than 30 years before artificial water conveyance began in the year 2000 [39]. Moreover, the artificial water conveyance project did not cause any flooding to occur over the riverbanks. Tamarisk is a typical xeric phreatophytic shrub, groundwater-dependent, and not sensitive to precipitation [40]. The groundwater-controlled and phreatophyte-covered stand provides an ideal field investigation site to explore the soil moisture dynamics under the control of the groundwater and analyze their controlling mechanism in hyper-arid regions.
Our objectives are (1) to reveal the temporal and spatial characteristics of soil moisture distribution in hyper-arid desert riparian vegetation, and (2) to explore the effects of environmental factors, such as climate, water table, and soil properties on spatial and temporal variations of soil moisture under the control of groundwater. Our study will obtain an insight into soil moisture dynamics under the specific environment without the influence of rain, which can deepen our understanding of the interactions between soil, vegetation, and atmosphere in hyper-arid regions, and provide data for ecological research in extreme arid regions.

2. Materials and Methods

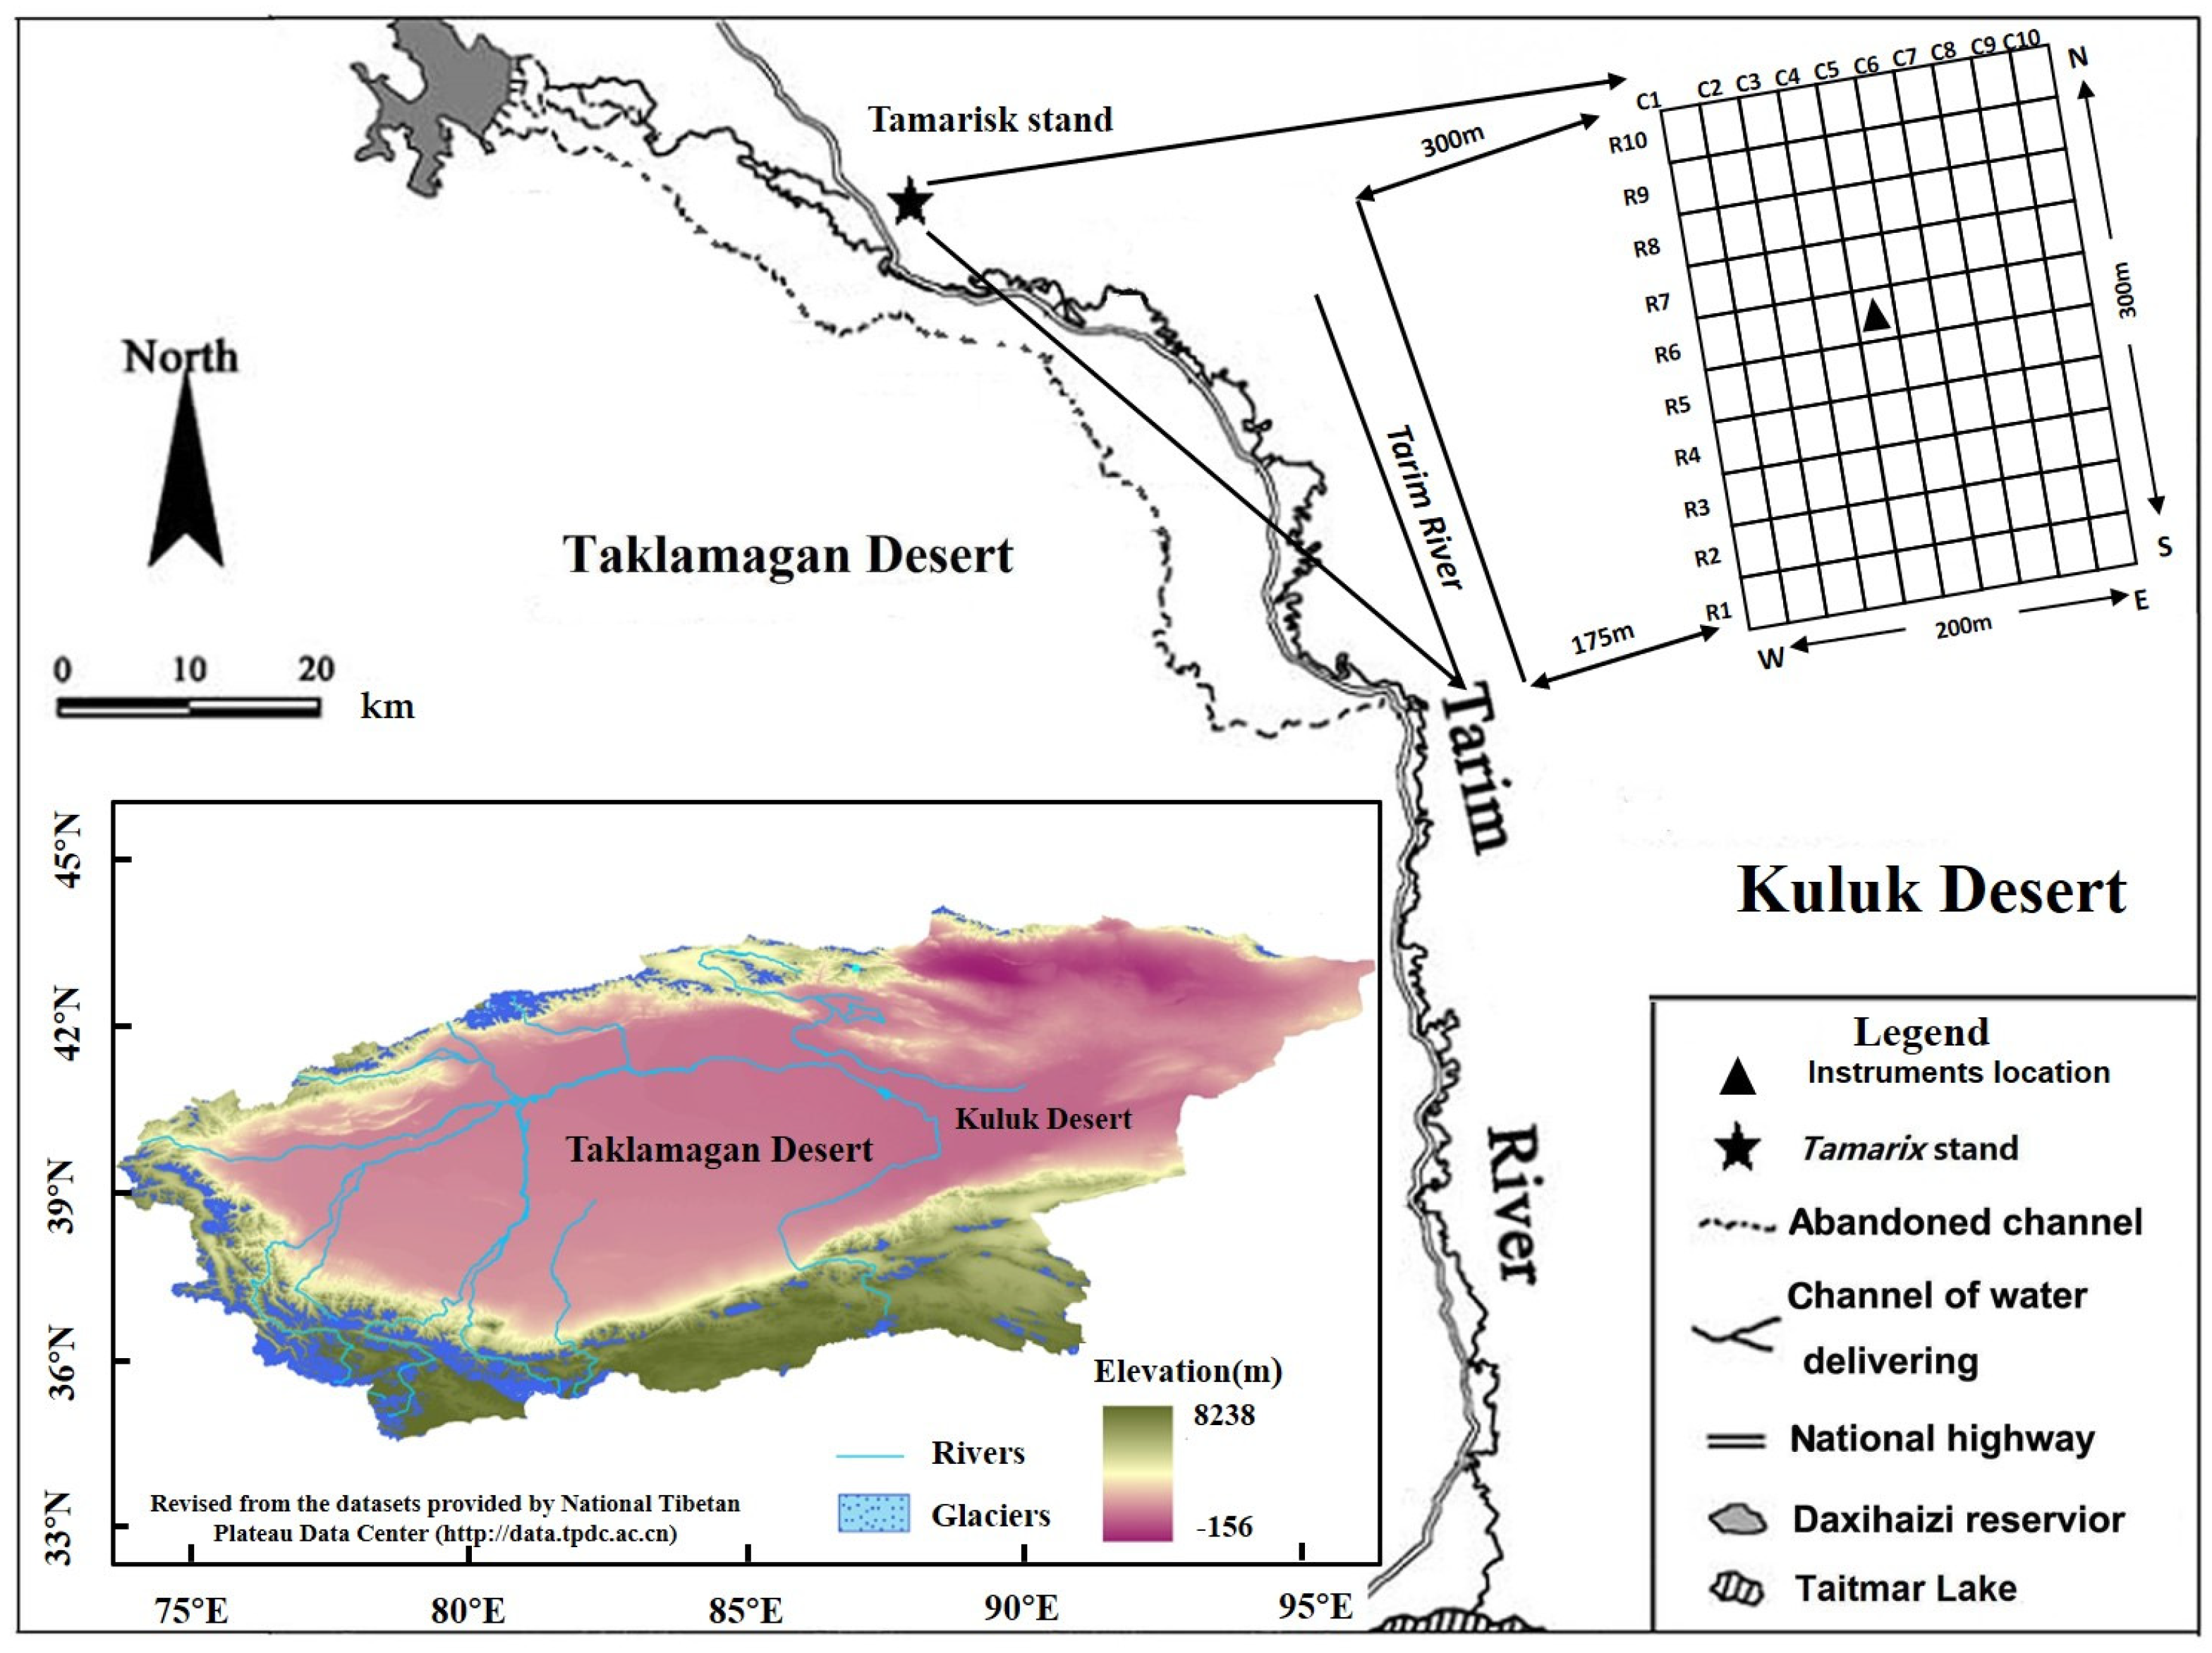
2.1. Site Descriptions and Stand Choice

(1)
Site descriptions
The Tarim River is located in the Tarim Basin and is the longest inland river in China. Its main catchment has a length of 1321 km and covers an area of 17,600 km2. The lower basin of the Tarim River is approximately 250 km long, from the Daxihaizi reservoir to the terminal Taitmar Lake, and lies between the Taklamagan Desert and Kuluk Desert. The terrain is relatively flat. The narrow but long desert riparian forest in the lower basin stretches along the two sides of the Tarim River with a width of about 5 km or less. It is called the “green corridor” and protected the ancient “Silk Road” and the current Nation Road. The vegetation types in the lower basin can mainly be classified into two categories: Populus euphratica woodland and tamarisk shrubland. The Populus euphratica is an arbor species, while the tamarisk is a shrub species. Both are accompanied by small amounts of other shrubs and herbs, such as Lycium ruthenicum, Hal-imodendron halodendron, Phragmites australis, Apocynum venetum, Alhagi sparsifolia, Karelinia caspica, and Glycyrrhiza inflata in the two communities. The coverage of the plant community is low, less than 0.3 in most of this area, and the spatial change is obvious.
One of the distinctive features of the study area is the hyper-arid climate. According to the meteorological records of the Tieganlik Weather Station in the lower Tarim River basin, the multiyear average annual precipitation was approximately 33 mm. However, the annual potential evapotranspiration can reach more than 2000 mm. It belongs to the continental warm temperate hyper-arid climate specifically, one of the driest areas in China and Eurasia. Precipitation generally appears in June, July, and August; in other months, it is scarcely observed.
Due to scarce precipitation, plant growth and soil moisture dynamics are controlled by groundwater in this region. Its basic process of water cycling can be simply summarized as a process of the water movement from the river water to groundwater, and then, to the surface evapotranspiration, in which the water movement in the groundwater–soil–plant–air system is one of the critical processes controlling the water cycling in the lower reaches [41]. However, the proportion and role of soil moisture in the process of water cycling is unclear. Downstream of the Tarim River had been set off for more than 30 years in the last century on account of high strength utilization of water resources in the upper and middle reach of the Tarim River. The water table fell, and vegetation declined completely. The water table increased and vegetation recovered gradually after uninterrupted water transport since 2000. Soil types can be divided into four categories, sand, sandy loam, loam, and silt loam according to the international textural grade in the lower basin, although the texture of the soil layers is heterogeneous in soil profiles.
(2)
Stand choice
A tamarisk stand (87°54′ N, 40°27′ E), which covered a rectangle area of 200 m × 300 m and had high spatial variability of vegetation coverage (Figure 1), was chosen to investigate the temporal and spatial variations in soil moisture. The vertical distance from the Tarim River channel to the southwest corner of the stand was 175 m, and to the northwest corner of the stand was 300 m. The stand was generally flat, with an altitude of 846 m. The tamarisk community was mainly composed of Tamarix ramosissima, Tamarix hispida, and Tamarix elongat, with small amounts of Halimodendron halodendron (Pall.) Voss, Glycyrrh izainfata, A. venetum L., Kareliniacaspia(Pall.)Less, Alhagi sparsifolia, and Lycium ruthenicum Murr. under the tamarisk canopy. The mean vegetation coverage of the stand was 0.45, with a maximum value of 0.57 and a minimum value of 0.03. The main soil type was silt loam but the soil texture was heterogeneous in different soil layers. The average soil bulk density of the top layer is approximately 1.3 g cm−3. The stand was a deep groundwater site, with a mean groundwater depth of approximately 5 m in the stand.

2.2. Sampling, Measurements, and Data Processing

2.2.1. Analysis of Spatial Variations of Soil Moisture

(1)
Sampling and measurements
To reveal the spatial variations in soil moisture within the stand, we divided the stand into 100 sampling plots based on an approximate 20 m × 30 m rectangular plot (Figure 1). Each plot position is represented by rows (Row) and columns (Column), for example, plot (R2, C3) refers to the plot in the 2nd row and 3rd column. In each plot, avoiding plants, we selected one soil sampling point on open ground in the middle or near the middle of the plot. In total, 100 soil moisture samples were obtained. Latitude and longitude information for each sampling point was recorded using a handheld GPS. Samples were taken in a sequence, row by row from south (R1) to north (R10), and within each row, the sequence was column by column from west (C1) to east (C10). The sampling period was from October 6 to October 30.
A manual drilling method was used to obtain the soil samples. For each plot, vertical profile sampling began from the 10 cm surface layer, followed by sampling at 50 cm, and subsequently every 50 cm interval, until the depth reached the groundwater level. The criterion for identifying the groundwater level was when free water overflows at the drill bit, and the drill cannot proceed to sample at deeper levels, thereby leading to soil samples being washed out by the saturated water flow. In this study, the depth of the saturated soil layer was regarded as the groundwater depth (GWD), neglecting the height of the capillary fringe.
Soil samples were packed into aluminum containers. The oven-drying method was used to obtain the gravimetric soil water content (g g−1) of each soil sample. In addition, the soil particle diameters of all soil samples were obtained by using an MS-2000 laser particle analyzer (Malvern, UK). The soil textures of all soil samples were determined based on the information of the soil particle diameters.
(2)
Data processing
To analyze the spatial variations in soil moisture in the horizontal direction within the tamarisk stand, the mean gravimetric soil water content ( θ ¯ , g g−1) for each plot was generated by calculating the arithmetic mean of soil moisture content at various depths on the vertical profile (Equation (1)).
θ ¯ = i = 1 n θ i n
where θ i was the gravimetric soil water content at various depths on the vertical profile and n was the sample number of soil moisture on the vertical profile.
The basic statistics of the mean gravimetric soil water content (g g−1), corresponding groundwater depths, and soil physical clay content of all sampling points were shown in Table 1. The spatial patterns of soil moisture and corresponding groundwater depths in the stand were generated by ordinary kriging interpolation with a spherical model based on 100 θ ¯ data using the software ArcGIS 10.6.
In order to explore the variations in soil moisture in the vertical profile within the tamarisk stand, 100 sampling points were classified into five groups, according to different groundwater depths: 3.4–4 m, 4–4.5 m, 4.5–5 m, 5–5.5 m, and 5.5–6.1 m. For each groundwater depth level, the vertical profile characteristics of soil moisture were expressed through arithmetically averaging the gravimetric soil water contents of different sampling points with identical sampling depths.
The coefficient of variation (CV) was employed to show the horizontal and vertical spatial variabilities (Equation (2)). According to the classical statistical theory, variability was considered weak when CV% ≤ 10%, moderate when 10% < CV% < 100%, and strong when CV% ≥ 100% [42,43].
C V = S D M e a n × 100 %
where SD represented the standard deviation of the gravimetric soil water contents of sampling points, and M e a n was the mean value of the gravimetric soil water contents of sampling points.

2.2.2. Analysis of Temporal Variations of Soil Moisture

To reveal the temporal dynamics of soil moisture within the tamarisk stand, a series of instruments were installed at the plot (R6, C5) in the stand (Figure 1), where the tamarisk grew well, to continuously monitor multiple parameters, such as the soil volumetric water content (SWC, m3 m−3), groundwater levels, precipitation, and evapotranspiration. The soil volumetric water contents were measured by nine sensors (Model: FDS100, Unism, Beijing, China) based on the frequency domain reflectometry (FDR), which were buried at various depths of 0.3, 0.6, 1.0, 1.5, 2.0, 2.5, 3.0, 4.0, and 5.0 m. To ensure the measurement accuracy, all nine FDR sensors were calibrated on-site using the oven-drying method. To continuously monitor variations in the groundwater table, an observation well was drilled at this location with a depth of 20 m. An automatic groundwater level logger (CTD-Diver, Eijkelcamp, Netherlands) was used to record the groundwater depth. An automatic rain gauge (RM Young Inc., Washington, DC, United States) was used to record precipitations. Surface evapotranspiration was obtained from the flux datasets. Detailed data processing was introduced in the study of Yuan et al. [44]. The observation data above had a synchronous sampling frequency of half an hour. The basic statistics of soil moisture and groundwater depth from the continuous monitoring site were shown in Table 2.

3. Results

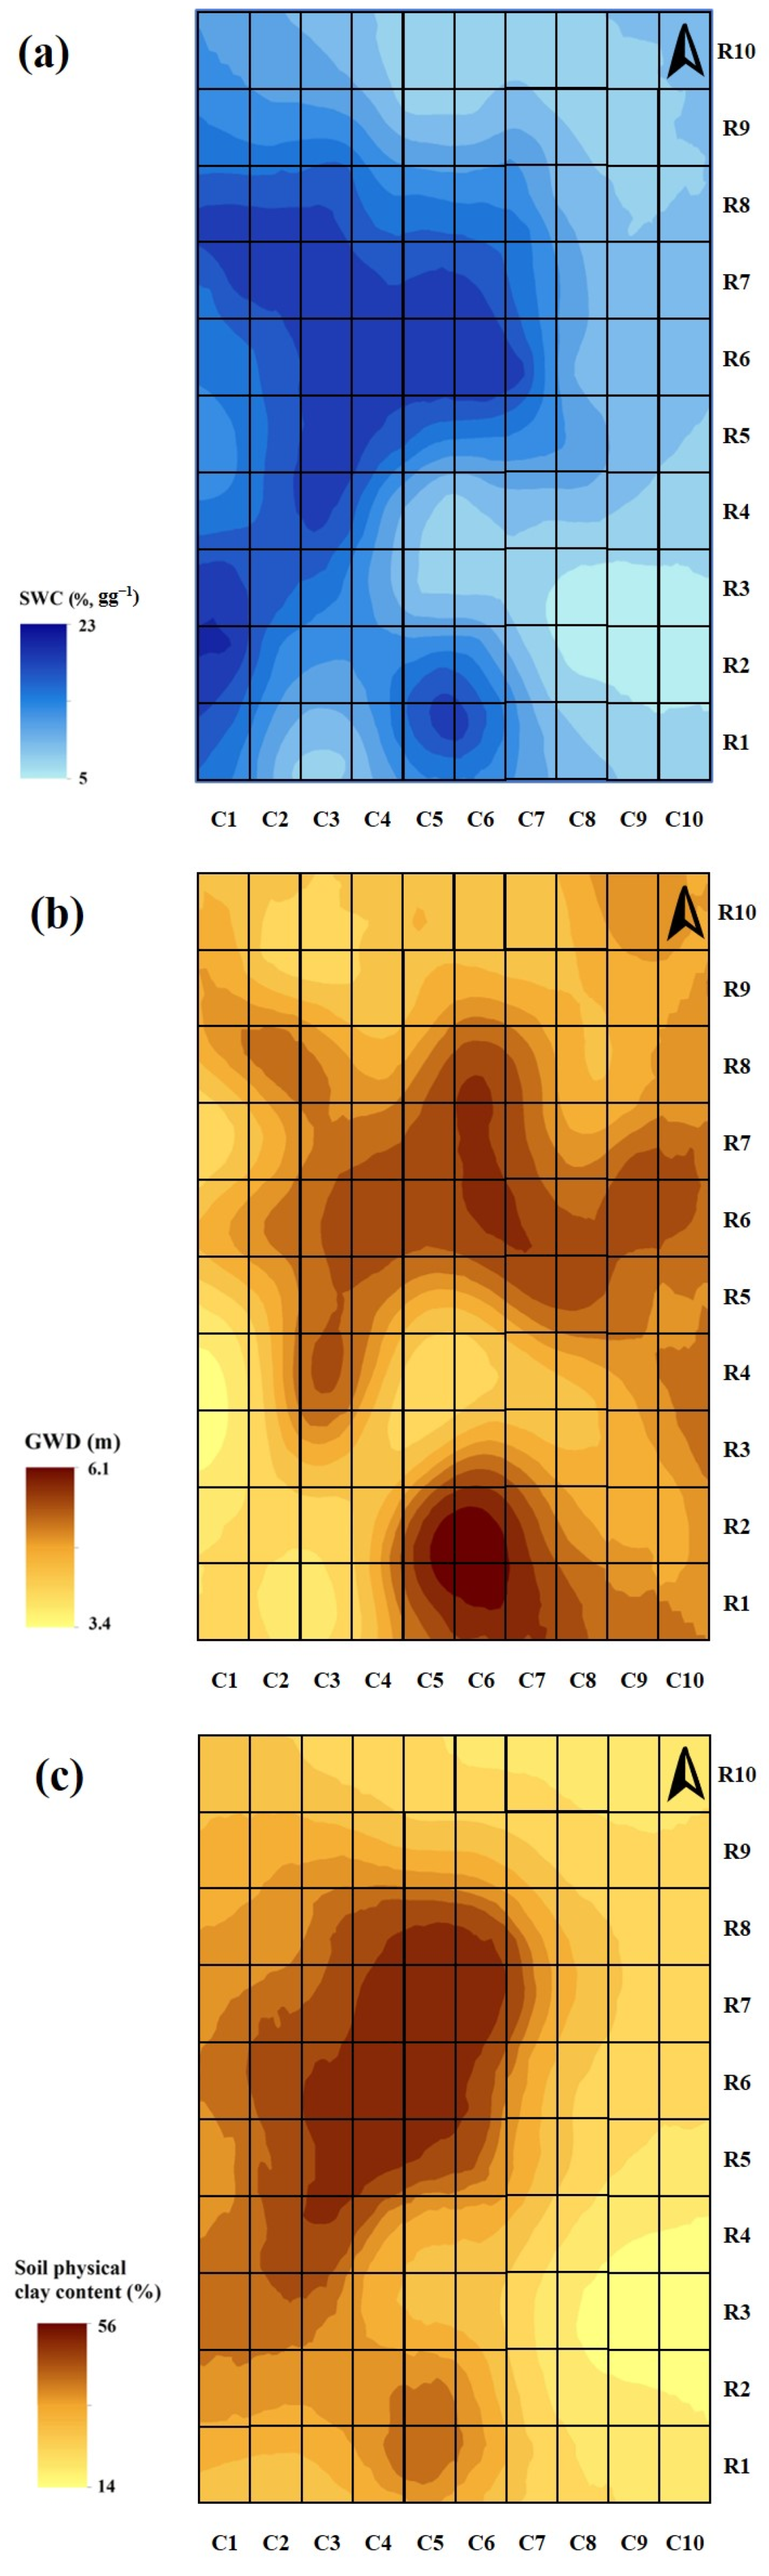
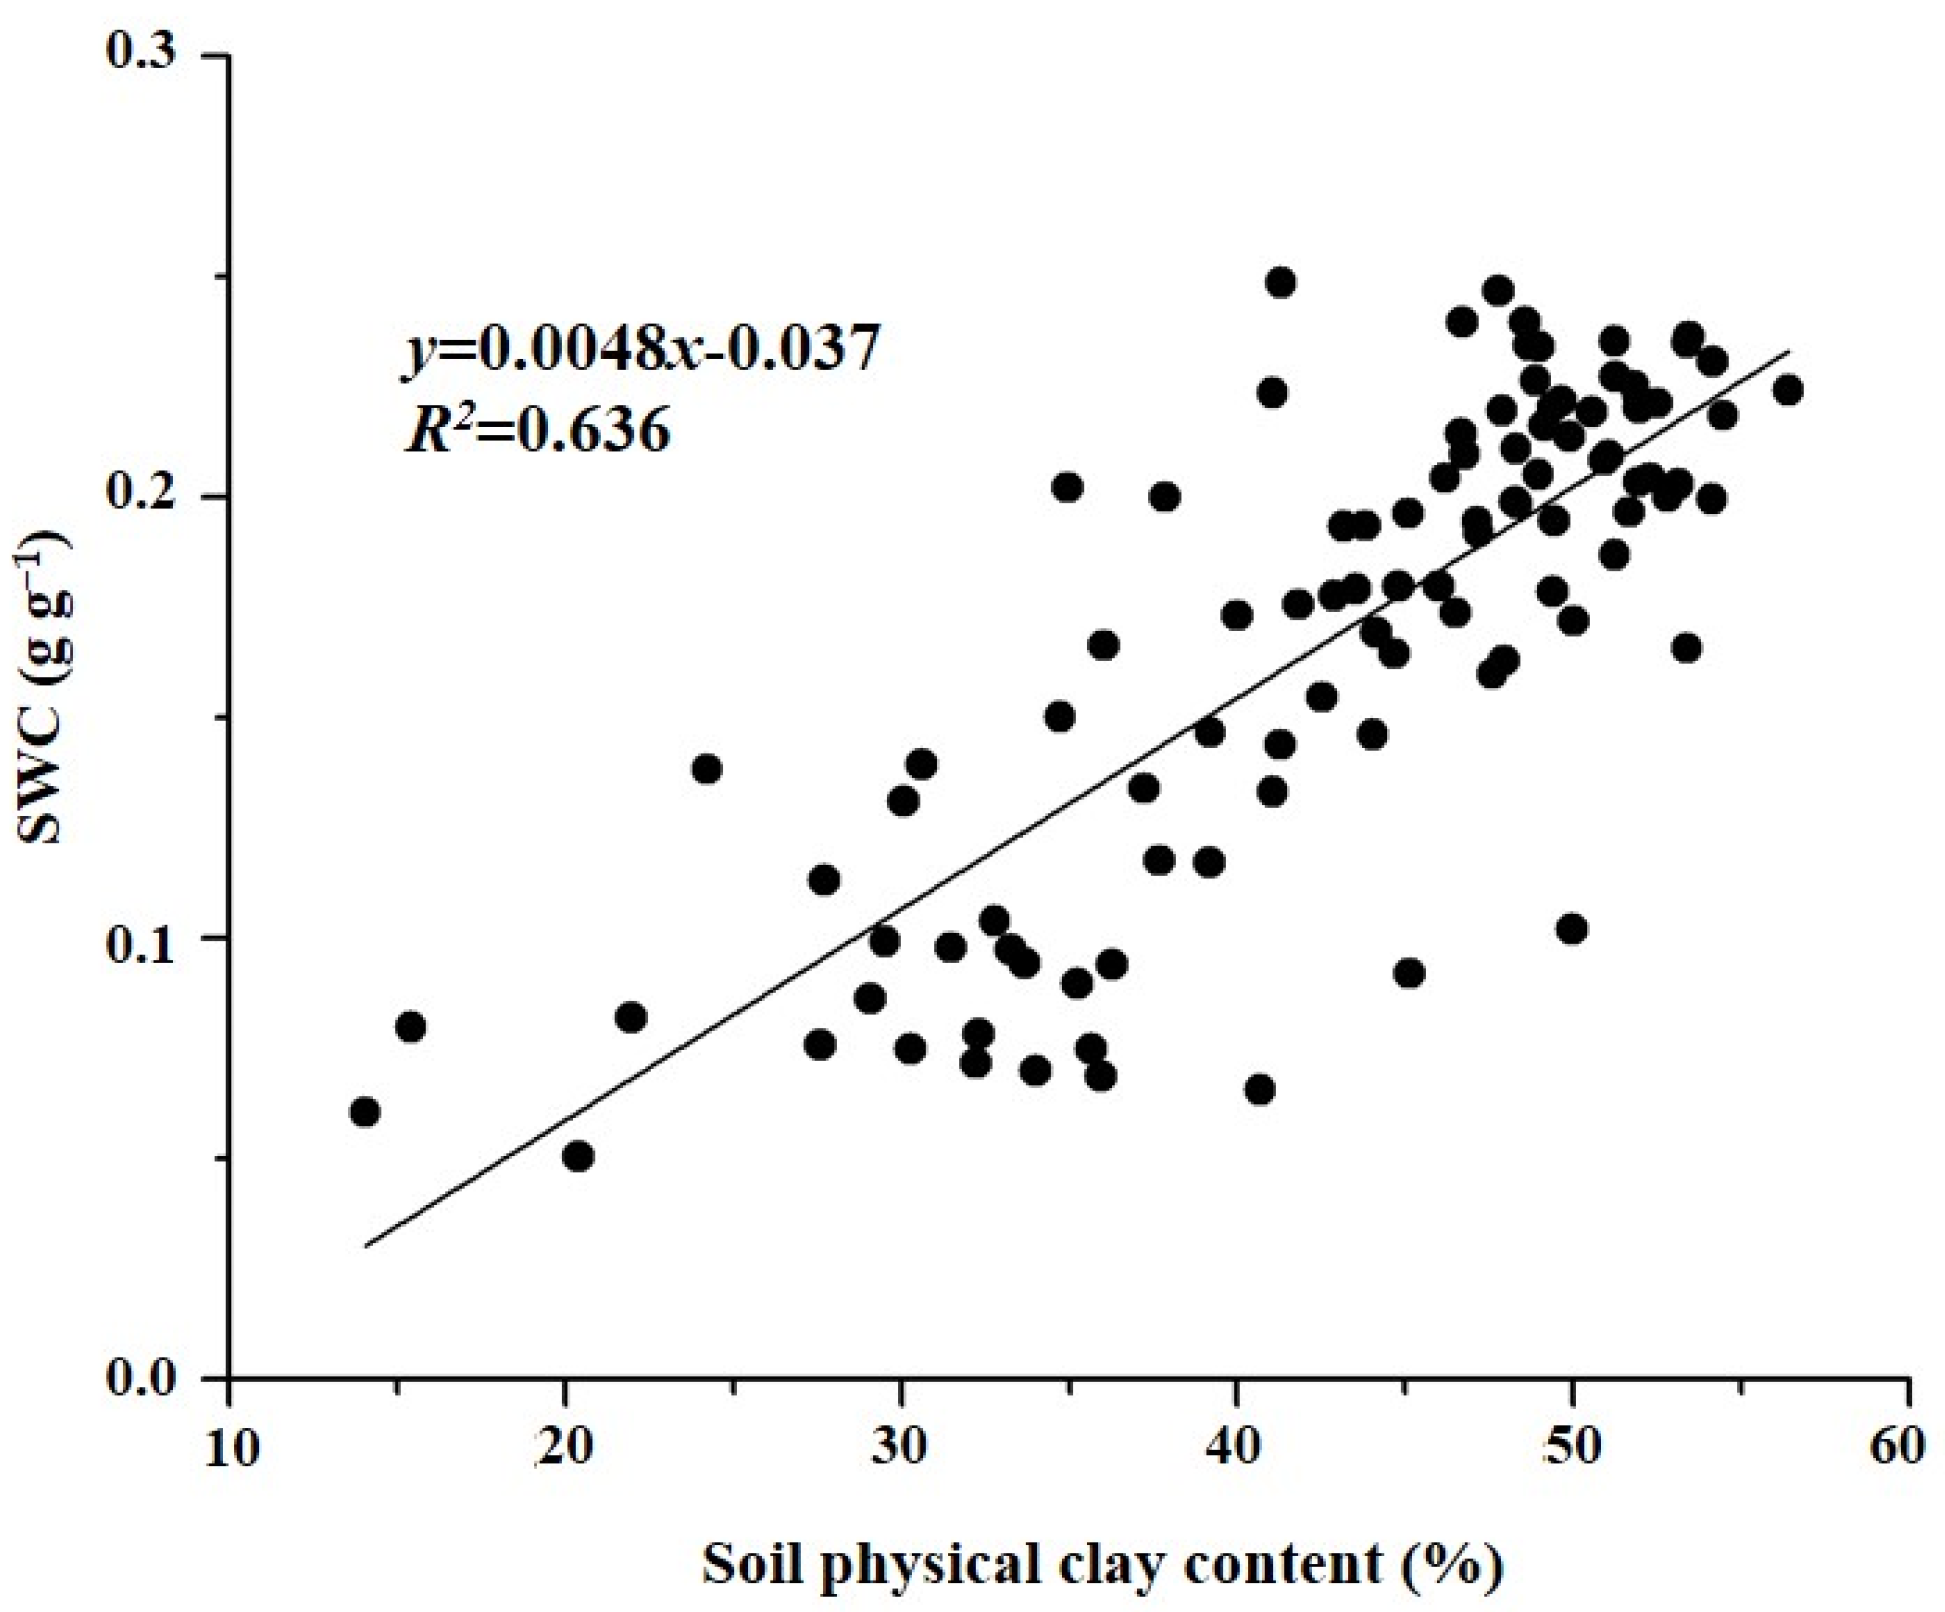
3.1. The Horizontal Spatial Variations in Soil Moisture in the Tamarisk Stand

The horizontal spatial pattern of soil moisture in the stand is shown in Figure 2a. The gravimetric soil water content ( θ ¯ ) varied from 0.05 to 0.25 g g−1, with a coefficient of variation (CV) of 33%, thereby suggesting moderate variability. There was a general decrease in soil moisture as the distance from the river channel increased (Figure 2a). The primary determinant was that the tamarisk stand in our study was under the control of the groundwater. As one moves further from the river channel, there is a concomitant decline in groundwater levels (Figure 2b) and, consequently, a decrease in soil moisture content in the direction perpendicular to the river channels (Figure 2a). However, abnormal relationships between soil moisture and GWD were also detected. In the plots around plot (R4, C1) and plot (R2, C2), which were close to the river channel, the GWD was shallower (Figure 2b) but the gravimetric soil water content ( θ ¯ ) was lower (Figure 2b). Additionally, in the plots around plot (R6, C6) and plot (R1, C6), which were relatively far from the river channel, the GWD was deeper (Figure 2b) but the θ ¯ was higher (Figure 2a). These abnormal relationships indicated that there were other factors influencing horizontal spatial variations of soil moisture, and their impacts might even exceed that of the GWD.
The spatial distribution of the soil moisture was similar to that of the soil physical clay content (Figure 2a,c), suggesting that soil texture could determine the soil water content in this area. We analyzed the relationship between the physical clay content and moisture in the soil. The result showed that there was a significant positive correlation between soil physical clay contents and the θ ¯ values (R2 = 0.636, p < 0.01). The more soil physical clay content it had, the higher the soil moisture was (Figure 3).

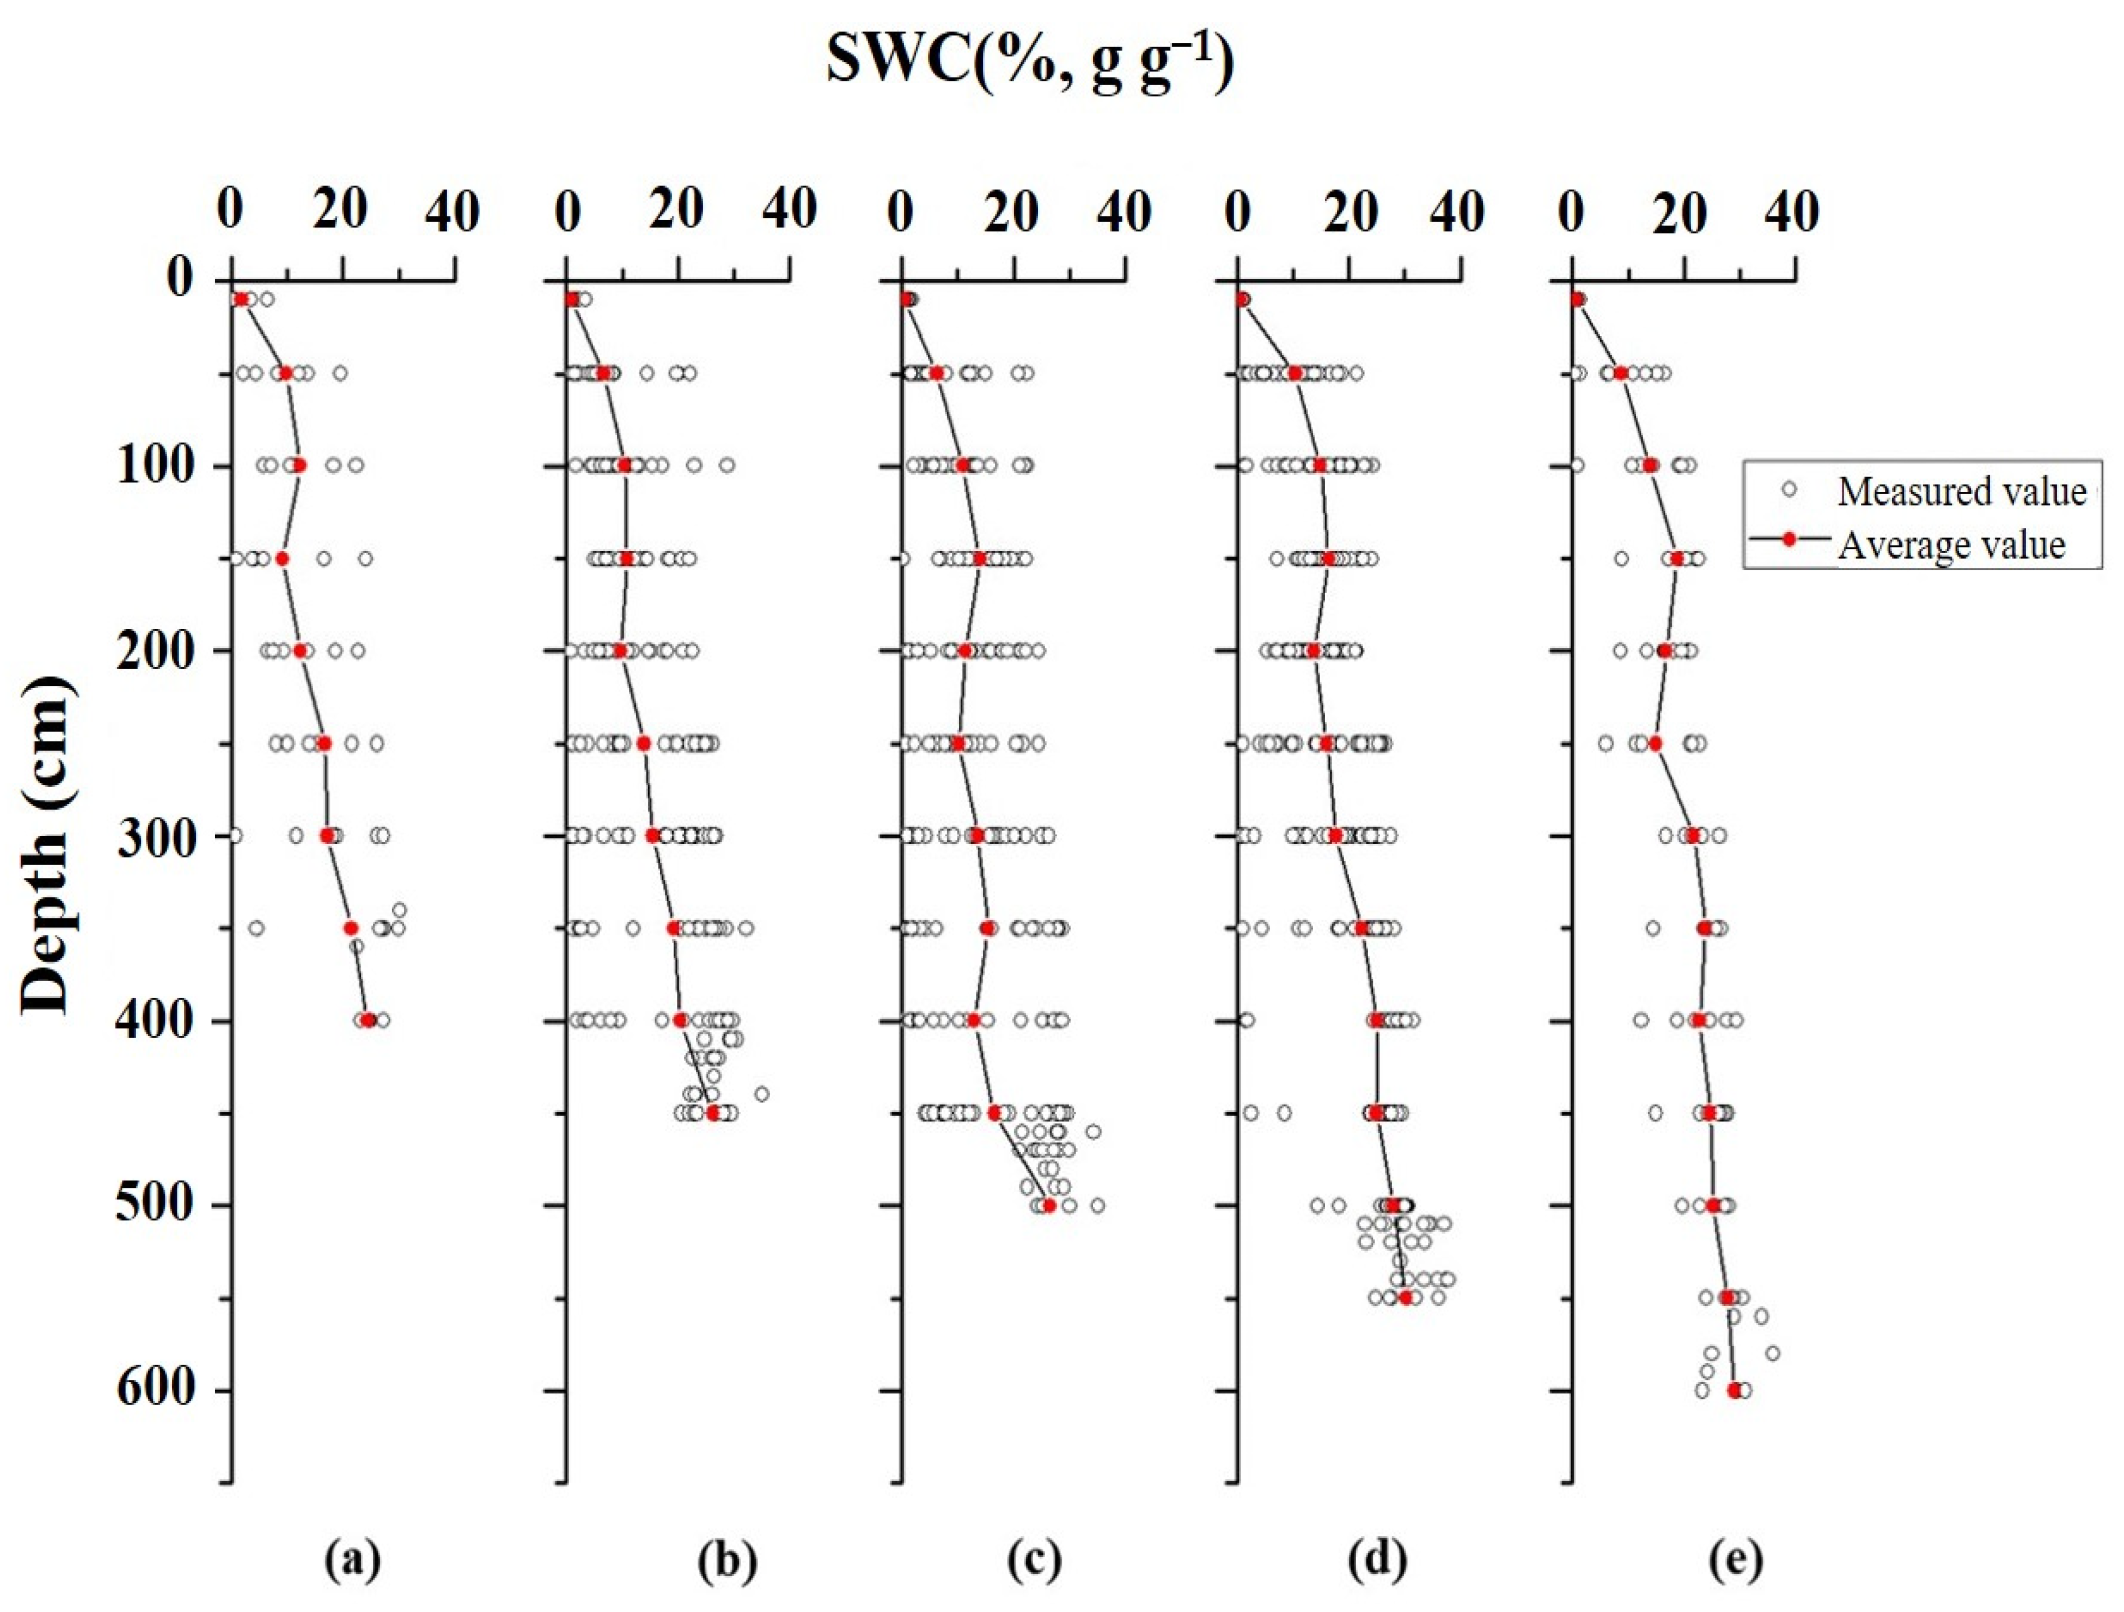
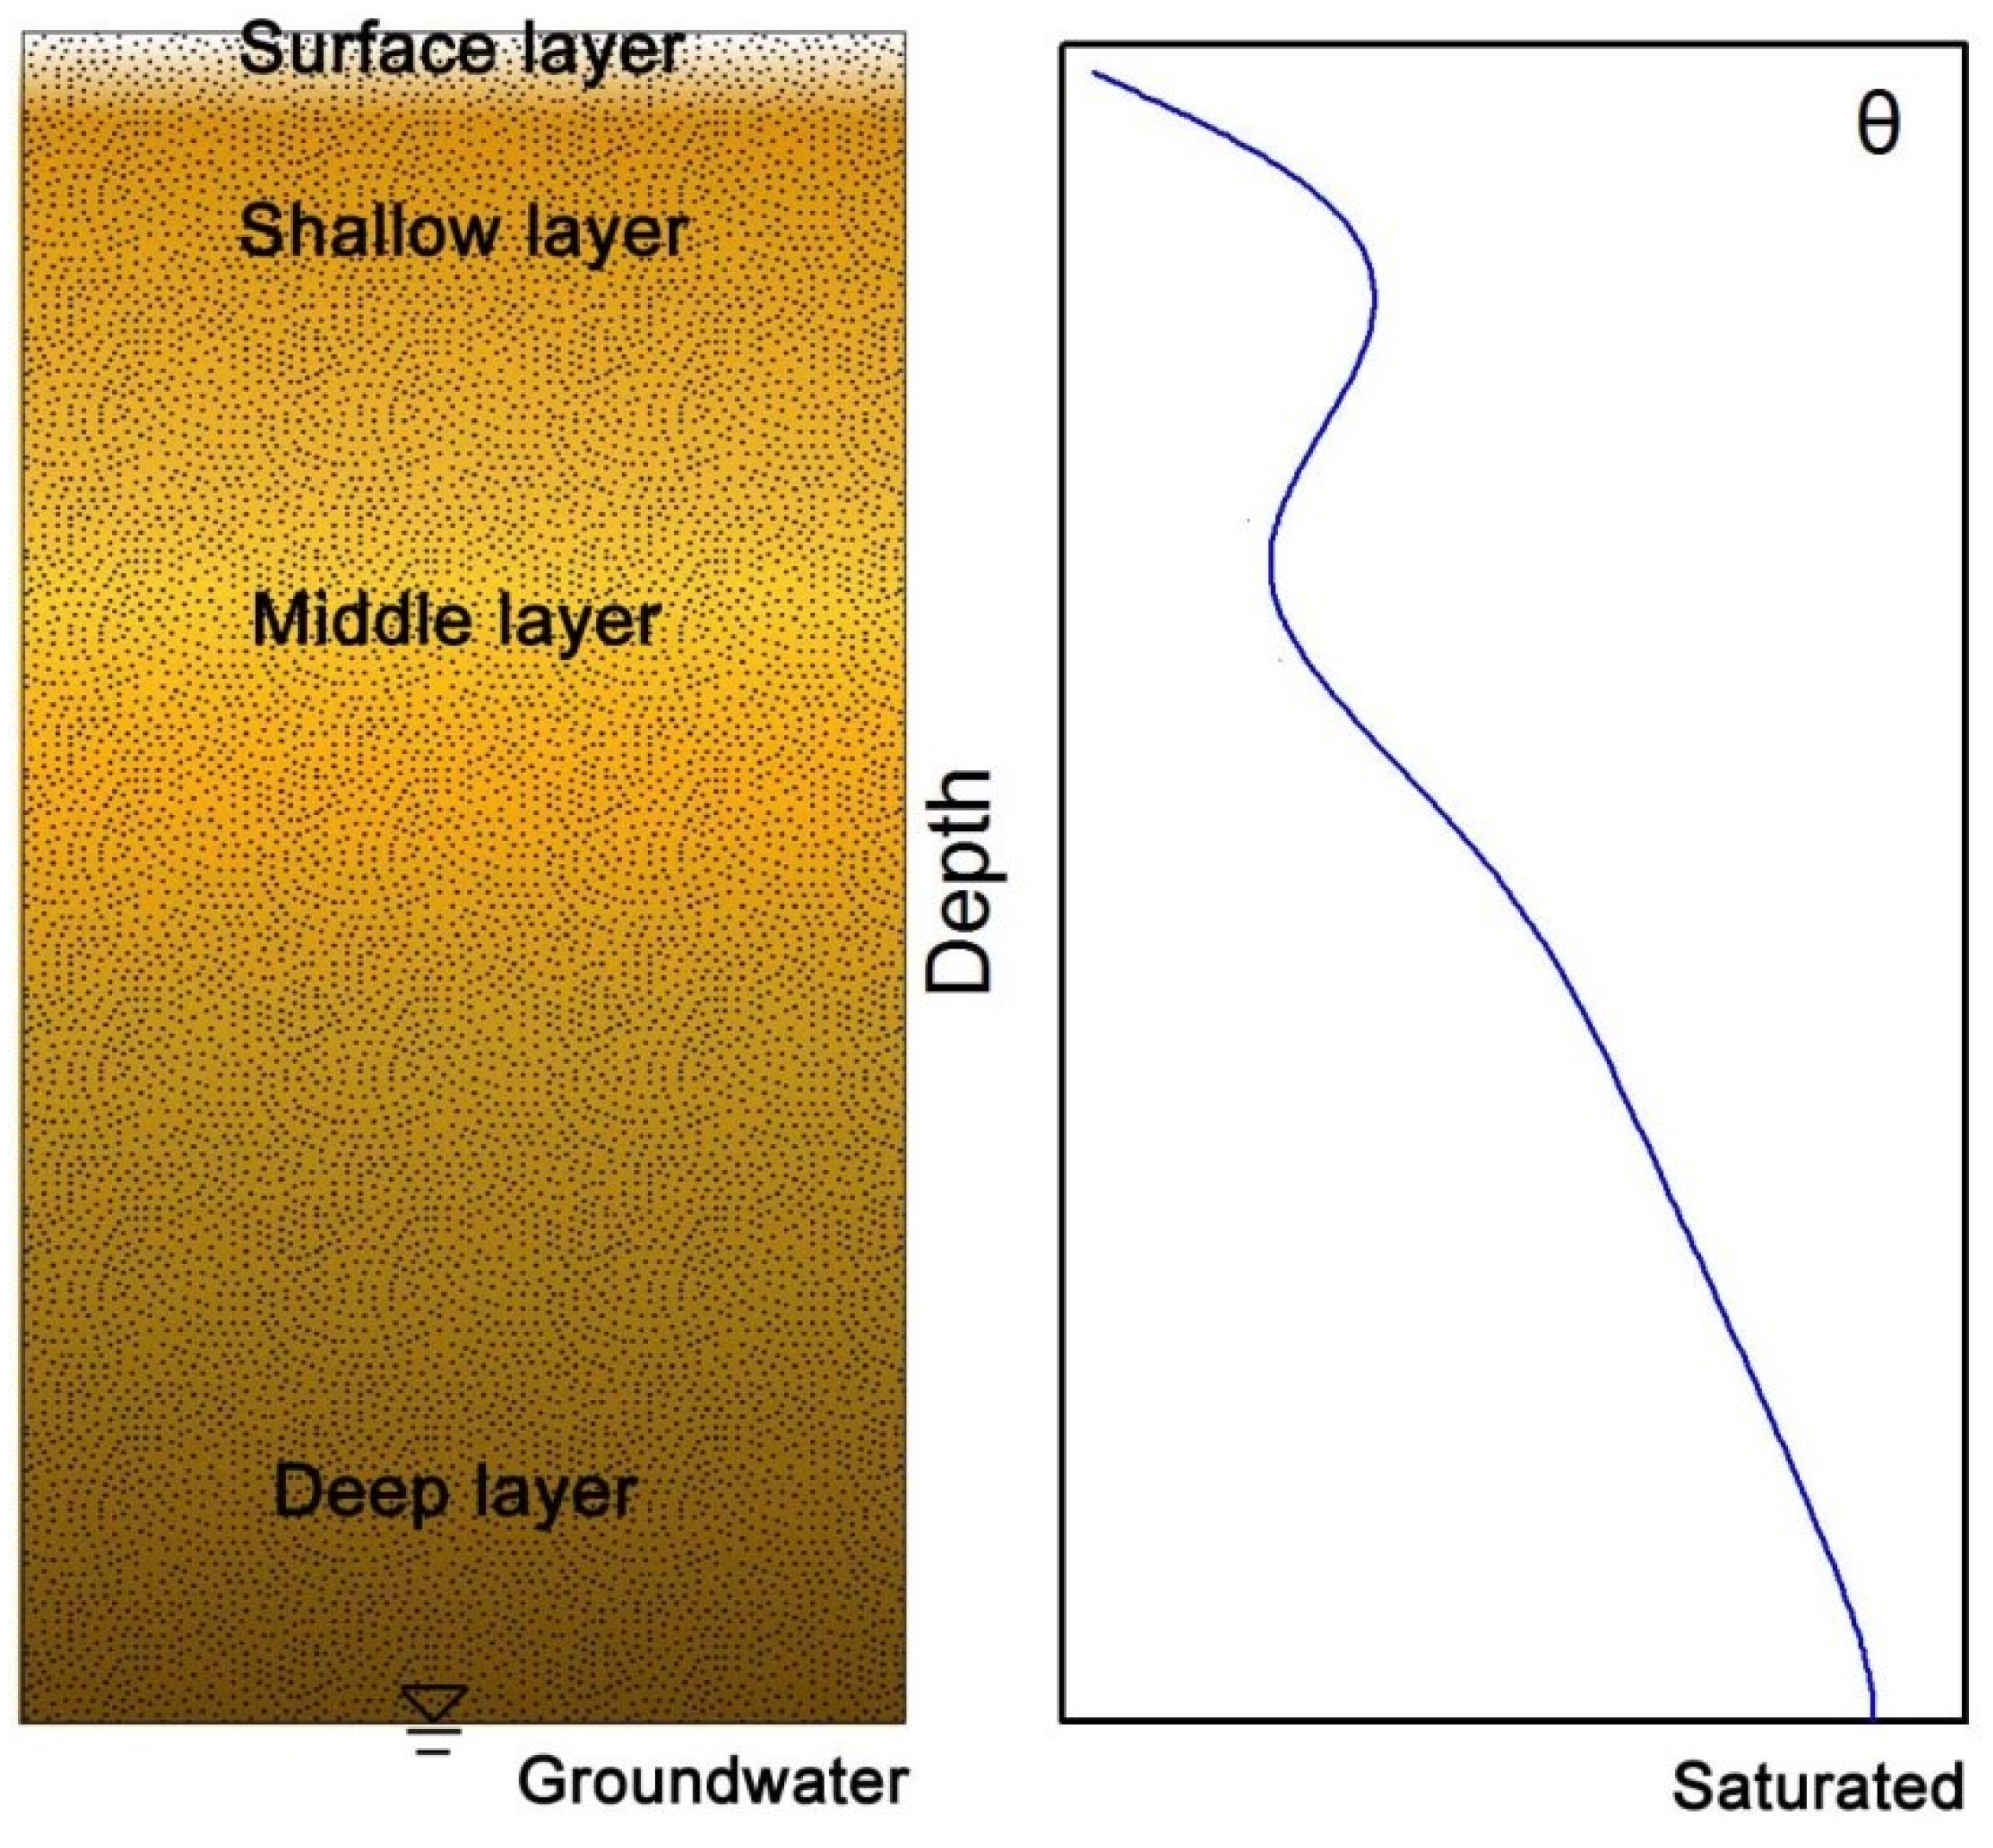
3.2. The Variations of Soil Moisture in Vertical Profiles under Different Groundwater Depths

The GWD ranged from 3.4 m to 6.1 m in the tamarisk stand and generally increased with the increasing distance to the river channel located at the west side of the stand (Figure 2b). Five levels of GWDs were classified according to the range of GWDs in the stands: 3.4–4.0 m, 4.0–4.5 m, 4.5–5.0 m, 5.0–5.5 m, and 5.5–6.1 m. The general soil moisture profile characteristics were similar between different GWD levels (Figure 4). The mean soil water content (SWC) increased from the surface to the water table. However, there was a soil layer at an approximate depth of 1.0–2.0 m, in which the SWC was relatively higher than that in the adjacent deeper layer. Based on the observed soil moisture profiles, four soil layers that expressed the soil moisture profile distribution characteristics could be identified in the stand: the surface layer, the shallow layer, the middle layer, and the deep layer. The surface layer is located at a depth of 0–0.3 m, and the depths of the other three layers depend on the GWD levels. The shallow layer was approximately at a depth of 0.5–2.0 m, the middle layer was approximately at a depth of 1.5–2.5 m, and the deep layer was approximately below 2.0 m.
In the surface layer, the SWC was extremely low, only averaging 0.7% g g−1, and exhibited little spatial variability. In the other three layers, the mean SWC was 13.3%, 11.5%, and 22.5% g g−1 for the shallow layer, the middle layer, and the deep layer, respectively. According to the SWC values, the surface, shallow, middle, and deep layers could be called the extremely dry layer, relatively wet layer, relatively dry layer, and wet layer, respectively. This soil moisture profile distribution was consistent between different GWD levels (Figure 4), suggesting that the groundwater had no effect on the soil moisture profile shapes when the GWD was deeper than 3.0 m. However, the depths of the relative wet layers and relative dry layers were different between different GWD levels (Figure 4), indicating the effect of groundwater on the soil moisture in the profile. On the other hand, apart from the surface layer, the SWC at the same depth in the stand ranged largely with the volatility of 20 ± 5% g g−1 (Figure 4), indicating the high spatial variability of soil moisture in the stand.
The soil moisture profile could be simply divided into three layers, the surface layer (depth of 0–0.2 m), the middle unsaturated layer, and the saturated layer. The variabilities in soil moisture content were various with different layers (Table 3). The soil moisture content exhibited strong variations in the surface layer, which was much greater than those both in the middle unsaturated layer (moderate variations) and in the saturated layer (weak variations). The depth of the soil profile with extreme values of CV did not display special patterns in the middle unsaturated layer. In addition, the depth with the minimal value of CV was much deeper than that with the maximum value of CV in the middle unsaturated layer. The SWC in the profile was affected by the groundwater table overall.

3.3. Temporal Variations in Soil Moisture

3.3.1. Diurnal Variations

The soil volumetric water content (SWC) hourly values of three consecutive days in the three phenological stages (greening period (GP), maturity period (MP), and senescence period (SP) and non-growing season of tamarisk were selected to show the diurnal variations in soil moisture and compared with corresponding water table variations (Figure 5). Because the temporal variations in the soil moisture in most soil layers were similar, we only selected the SWC values at the depths of 0.3, 4.0, and 5.0 m, to exhibit the temporal variations. The SWC values at the depths of 0.3, 4.0, and 5.0 m represented the variations in the surface layer, the middle layer, and the layer near the water table, respectively.
In the non-growing season, the soil moisture in all the soil layers did not exhibit any diurnal variations (Figure 5a,e,i). The soil moisture at the depths of 0.3 m and 4.0 m did not exhibit any diurnal variation in the whole growing season (Figure 5b–d,f–h). However, the soil moisture at the depth of 5.0 m showed obvious diurnal fluctuation in MP, in which the SWC at the depth of 5.0 m decreased in the daytime and got recharged at night (Figure 5k). This diurnal fluctuation occurred in MP but did not in other phenological stages in the growing season (Figure 5j,l). The GWD showed diurnal fluctuation in the whole growing season (Figure 5m–p). The GWD diurnal fluctuations were weak in GP (Figure 5n) and SP (Figure 5p) but obvious in MP (Figure 5o).
In the study stand, surface evapotranspiration (ET) occurred in growing seasons but was very weak in the non-growing seasons [41,44]. The ET processes and the relevant root uptake would determine the daily processes of the soil water and groundwater in the absence of the influence of precipitation under a hyper-arid climate. The diurnal variations in the soil water in different layers and the water table implied that the groundwater was the only water source for plants and that the plant root uptake should mainly occur near the water table.

3.3.2. Seasonal Variations

Three years of data on the soil moisture at different depths (0.3 m, 4.0 m, and 5.0 m), the corresponding GWD, and daily ET data are shown in Figure 6. The soil moisture in most of the soil layers hardly changed in the first two years, except in the layer near the water table, where the SWC in the non-growing season remained at 51%, although after the onset of the growing season, it would fall gradually until approximately 39%, and then remain stable (Figure 6a). In the late growing season, the SWC would rise gradually to 51%. This course was typical in the first year of the observation. However, in the second year, the date of the onset of the SWC decrease occurred later and finished earlier than in the first year (Figure 6a).
In the three years, the water table began to fall with the emergence of ET, when the plant growing season began, yet turned to rise in the middle of August (Figure 6b,c). The ET processes and the sudden increase in the lateral recharge to the groundwater from the Tarim River because of the water conveyance in August controlled the seasonal dynamics of the groundwater table in the stand [44].
The GWD in the second year of observation was shallower than in the first year of observation (Figure 6b). The capillary and water potential gradient in the shallower groundwater in the second year of observation could sustain longer-term saturated soil water at the depth of 5.0 m. Therefore, a shorter period of SWC decrease in the second year of observation could be expected. The seasonal course suggested that the SWC near the water table was controlled by the plant water uptake and the groundwater table.
It should be worth noting that some of the SWC observations in the third year were missing due to the damaged instrument. The seasonal variations in SWC were only analyzed for the first two years.

3.3.3. Impacts of Precipitation and Soil Evaporation

Precipitation is an important process controlling the soil water dynamics. However, precipitation is very scarce in our study area, thus, its impact on soil water dynamics can usually be ignored. We analyzed the variations in the SWC at the depth of 0.3 m during the precipitation periods. On 7 June in the second year of SWC observations, heavy rain of 22.3 mm occurred during the period from 1:30 am to 10:30 am, which was the largest precipitation process in the three years. However, the SWC at the depth of 0.3 m remained stable in the following two days (Figure 7) and did not respond to the heavy precipitation event. This indicated that the rainfall infiltration did not reach the layer of 0.3 m in depth. The strong evaporative demand in the study area could cause the rainwater in surface soil to evaporate quickly before the rainwater could reach the soil layers deeper than 0.3 m. During these heavy precipitation events, the stable SWC in the layer at the depth of 0.3 m indicated that most of the precipitation events could not influence the soil water dynamics in the whole soil profile, except the surface soil.
Soil evaporation is an important factor influencing the dynamics of the soil moisture in the surface and shallow layers. Our water and heat flux observation in the stand indicated that the soil evaporation was weak in the hyper-arid regions [41,44]. The surface ET in the non-growing seasons was less than 0.1 mm d−1, especially in April before the growing seasons (Figure 8). In April, the air temperature and wind speed were close to them in the growing season and the potential evapotranspiration (ET0) was almost the same as that in the growing season, although ET was still less than 0.1 mm d−1. Until the onset of the growing season, the surface ET started to increase (Figure 8). This phenomenon indicated that the surface ET was mainly from plant transpiration, and that the soil evaporation was very weak. The occurrence of the extremely dry surface layer in this area can prevent soil evaporation, thereby reducing the loss of soil moisture.

4. Discussion

4.1. Quasi-Steady-State Upward Flow of Soil Water under Hyper-Arid Climate

Although the climate is extremely arid in the study area, the soil layers below a depth of 0.5 m still maintain abundant soil water (Figure 4). The occurrence of high SWC in the soil layer under the hyper-arid climate was mainly due to the weak soil evaporation, while the water consumption by the tamarisk in this area was mainly from groundwater [44]. The high SWC in the soil layer probably exists widely in hyper-arid regions because, in those areas, scarce precipitation and high evaporation demand can create an extremely dry land surface, which hinders the vapor diffusion from the soil layers below the land surface; therefore, retaining much of the water storage in the soil.
Owing to the little precipitation, the groundwater was the only water source of soil most of the time. Therefore, the water table fluctuation will be the main factor in controlling the soil water dynamics in the study area. However, the slow drop or rise in the water table did not influence the soil water dynamic changes in the soil profile (Figure 6), suggesting that only rapid and large fluctuations in the water table can probably be able to clearly influence the soil water dynamics. Because the groundwater table seldom fluctuated rapidly and largely in the natural environment, our observation results indicated that the soil water temporal variation, only controlled by the groundwater, would be insignificant in most circumstances.
Our observation results showed temporal variations in soil water contents, which were mainly found near the water table, suggesting that the water exchange below ground predominantly occurred between the groundwater and the soil water near the water table. These results indicated that the effects of the tamarisk on the soil water dynamics in the study area were mainly exhibited in the deep soil layer near the water table. Most of the vegetation in the hyper-arid regions is usually the phreatophyte species, which use the soil water in deep layers or groundwater. We believe that the soil water dynamics in the shallow layers will hardly be influenced by vegetation.

4.2. Soil Moisture Profile under Control of Groundwater and Its Ecological Implications

There was no infiltration process in the soil profile in our study area, which is an important process in determining the soil water dynamics in most circumstances [45]. The upward flow is most often the only form of water movement in the soil layer in this area, unless extremely heavy rain events occur, which can occasionally appear at a hundred years in scale. In this upward flow in the groundwater–soil–plant–air (GSPA) system, groundwater was the input water, and surface ET was the output water.
Our three-year observation results of the temporal processes of soil water contents in different soil layers showed that the soil moisture nearly did not change with time, except for in the layer near the water table. Another study on groundwater ET in this stand indicated that the seasonal courses of groundwater ET and surface ET were consistent and their amounts were nearly equal [46]. These results indicated that the upward flow of water in the GSPA system was in either a steady or quasi-steady state. In this steady or quasi-steady state, the groundwater evapotranspiration rate was approximately equal to the surface evapotranspiration rate, and the soil water content remained stable in this system. The soil layer (including the plant) seemed to act as a water channel to the land surface, and in this channel, the water flow rate did not change.
Although the steady or quasi-steady upward flow occurred in the specific stand that we studied, we argue that the steady or quasi-steady upward flow of soil water in the GSPA system is probably universal in hyper-arid regions. Three reasons can support this argument. First, the groundwater table seldom changes rapidly and stochastically in natural environments in these areas. A stable rather than stochastic water table variation process provides a steady background of water environments in hyper-arid regions. Second, vegetation can adapt to the stable water environment in hyper-arid regions, and consequently, evolve and form a steady water use strategy; thus, will not disturb the steady-state flow. Third, soil evaporation is an unsteady-state process because it is mainly controlled by variable weather, but soil evaporation is weak in hyper-arid regions and hardly influences soil water dynamics. We believe that steady-state soil water dynamics is a common process in hyper-arid regions, and quite different from those in most other areas in the world, where soil moisture dynamics are a stochastic process induced by rain events [47], far away from the steady-state.

4.3. Soil Moisture Profile under Hyper-Arid Climate and Its Ecological Implications

The soil moisture profiles under different GWD levels exhibited similar curve shapes in the stand and could be divided into four layers: extremely dry surface layer, relatively wet shallow layer, relatively dry middle layer, and wet deep layer. This curve shape in the soil moisture profile is probably typical for a homogeneous soil profile under a hyper-arid climate when the GWD is deep enough, for example, more than 3.0 m. In this soil moisture profile (Figure 9), the surface layer is extremely dry due to the hyper-arid climate. In the shallow layer, which is located below the surface layer, the soil water content depends on the ability and magnitude of the water supply from the land surface, such as occasional heavy rain or flooding in a riparian zone. The soil moisture in the middle and deep layers is controlled by groundwater and its capillary rise, thereby exhibiting a decreasing trend from the water table to up.
Terrestrial ecosystem in hyper-arid regions is usually a groundwater-dependent ecosystem [48]. Groundwater depth influences the structure and functions of desert ecosystems in those areas [49]. Our observational results also indicated that the groundwater is the only water source of plant water uptake. However, we think the roles of soil moisture in ecosystem development in hyper-arid regions have not gotten enough recognition. We believe that the soil moisture in the shallow layer is a critical factor in influencing the spatial structure of desert ecosystems because it probably determines the conditions for seed germination in hyper-arid regions.
We suppose that the soil moisture in the shallow layer determines the seed sprout and the GWD determines the growth of the desert vegetation. Since the soil moisture exhibits a positive linear relationship with the physical clay content in the soil, it means that the finer the soil texture is, the higher the desert vegetation productivity probably is in hyper-arid regions. A “positive texture effect” of biogeography in hyper-arid regions probably exists, which is quite different from that in arid and semi-arid regions, where an “inverse texture effect” can usually be observed [50]. This hypothesis of the “positive texture effect” needs to be verified through widespread field investigations in hyper-arid regions.

5. Conclusions

The spatial and temporal variations in soil moisture in the studied stand exhibited distinct and unique characteristics. Horizontal spatial variations in soil water contents were highly related to the soil texture, and finer soils had higher soil water contents. The soil moisture vertical profiles were similar at different groundwater depths, and the relationship between the soil water content and groundwater depth was not obvious. Except in the layer nearest the water table, the soil moisture in the other layers varied minimally over time. Nominal soil evaporation and special water use strategies by phreatophytic species in the hyper-arid climate caused unique, temporal soil moisture processes. We suggest that water flows via groundwater–soil–plant–air systems in hyper-arid regions that are in steady or quasi-steady states. As a result, soil moisture generally remains constant over time, and the amount of water in the soil is mainly determined by the soil texture in hyper-arid regions.
In the presented study, several limitations warrant acknowledgment:
(1)
The challenging natural environment in the study area posed difficulties for data collection, leading to a dataset characterized by a brief time series and a confined spatial range. This restricts the generalizability of our conclusions. For more comprehensive research in the future, we advocate for the amalgamation of diverse data sources—including meteorological, topographical, and soil property data—to develop a model elucidating the spatiotemporal distribution of soil moisture in hyper-arid regions.
(2)
This investigation did not account for the groundwater level fluctuations in response to incoming river water—a factor that could influence the study’s findings. The groundwater in the Tarim River’s lower reaches primarily originates from incoming river water replenishments. However, the dynamics and magnitude of these replenishments are not yet well-defined and will be the focus of subsequent research endeavors.

Author Contributions

Conceptualization, X.Y., G.Y. and M.S.; methodology, X.G. and P.W.; investigation, X.Y. and T.D.; data curation, Y.D. and H.W.; writing—original draft preparation, X.Y. and J.L.; writing—review and editing, J.L. and C.J.; supervision, J.L and C.J.; project administration, X.Y. and C.J.; funding acquisition, C.J. All authors have read and agreed to the published version of the manuscript.

Funding

This research was funded by the National Natural Science Foundation of China, grant number 32201440, was funded by the Research Base for Rural Community Governance, the Education Department of Sichuan Province, grant number SQZL2019C03, and was funded by the Early Career Foundation of Sichuan University of Science & Engineering, grant number 2017RCSK20.

Data Availability Statement

Data are available from the authors by request.

Acknowledgments

The authors would like to thank Xuchao Zhu for his help in field investigations. The authors especially thank Yi Luo for his substantial help with our study. The Tarim River Basin boundary is provided by National Tibetan Plateau Data Center (http://data.tpdc.ac.cn).

Conflicts of Interest

The authors declare no conflict of interest.

References

  1. Rodriguez-Iturbe, I.; D’Odorico, P.; Laio, F.; Ridolfi, L.; Tamea, S. Challenges in humid land ecohydrology: Interactions of water table and unsaturated zone with climate, soil, and vegetation. Water Resour. Res. 2007, 43, W09301. [Google Scholar] [CrossRef]
  2. Paolo, D.O.; Amilcare, P. Dryland Ecohydrology; Springer: Cham, The Netherlands, 2006. [Google Scholar]
  3. Bayram, S.; Citakoglu, H. Modeling monthly reference evapotranspiration process in Turkey: Application of machine learning methods. Environ. Monit. Assess. 2023, 195, 67. [Google Scholar] [CrossRef] [PubMed]
  4. Zouzou, Y.; Citakoglu, H. General and regional cross-station assessment of machine learning models for estimating reference evapotranspiration. Acta Geophys. 2023, 71, 927–947. [Google Scholar] [CrossRef]
  5. Rodríguez-Iturbe, I.; Isham, V.; Cox, D.R.; Manfreda, S.; Porporato, A. Space-time modeling of soil moisture: Stochastic rainfall forcing with heterogeneous vegetation. Water Resour. Res. 2006, 42, W06D05. [Google Scholar] [CrossRef]
  6. Singh, N.K.; Emanuel, R.E.; McGlynn, B.L.; Miniat, C.F. Soil Moisture Responses to Rainfall: Implications for Runoff Generation. Water Resour. Res. 2021, 57, e2020WR028827. [Google Scholar] [CrossRef]
  7. Ford, T.W.; Rapp, A.D.; Quiring, S.M.; Blake, J. Soil moisture-precipitation coupling: Observations from the Oklahoma Mesonet and underlying physical mechanisms. Hydrol. Earth Syst. Sci. 2015, 19, 3617–3631. [Google Scholar] [CrossRef]
  8. Almendra-Martin, L.; Martinez-Fernandez, J.; Piles, M.; Gonzalez-Zamora, A.; Benito-Verdugo, P.; Gaona, J. Influence of atmospheric patterns on soil moisture dynamics in Europe. Sci. Total Environ. 2022, 846, 157537. [Google Scholar] [CrossRef]
  9. Chen, Y.; Yuan, H.; Yang, Y.; Sun, R. Sub-daily soil moisture estimate using dynamic Bayesian model averaging. J. Hydrol. 2020, 590, 125445. [Google Scholar] [CrossRef]
  10. Dymond, S.F.; Wagenbrenner, J.W.; Keppeler, E.T.; Bladon, K.D. Dynamic Hillslope Soil Moisture in a Mediterranean Montane Watershed. Water Resour. Res. 2021, 57, e2020WR029170. [Google Scholar] [CrossRef]
  11. He, L.; Zhang, Q.; Shi, L.; Wang, Y.; Wang, L.; Hu, X.; Zha, Y.; Huang, K. Physics-constrained Gaussian process regression for soil moisture dynamics. J. Hydrol. 2023, 616, 128779. [Google Scholar] [CrossRef]
  12. Peterson, A.M.; Helgason, W.H.; Ireson, A.M. How Spatial Patterns of Soil Moisture Dynamics Can Explain Field-Scale Soil Moisture Variability: Observations from a Sodic Landscape. Water Resour. Res. 2019, 55, 4410–4426. [Google Scholar] [CrossRef]
  13. Tyystjarvi, V.; Kemppinen, J.; Luoto, M.; Aalto, T.; Markkanen, T.; Launiainen, S.; Kieloaho, A.-J.; Aalto, J. Modelling spatio-temporal soil moisture dynamics in mountain tundra. Hydrol. Process. 2022, 36, e14450. [Google Scholar] [CrossRef]
  14. Silva, B.P.C.; Tassinari, D.; Silva, M.L.N.; Silva, B.M.; Curi, N.; da Rocha, H.R. Nonlinear models for soil moisture sensor calibration in tropical mountainous soils. Sci. Agric. 2022, 79, e20200253. [Google Scholar] [CrossRef]
  15. Dai, J.Y.; Cheng, S.T. Modeling shallow soil moisture dynamics in mountainous landslide active regions. Front. Environ. Sci. 2022, 10, 913059. [Google Scholar] [CrossRef]
  16. Li, B.; Wang, L.; Kaseke, K.F.; Vogt, R.; Li, L.; Seely, M.K. The impact of fog on soil moisture dynamics in the Namib Desert. Adv. Water Resour. 2018, 113, 23–29. [Google Scholar] [CrossRef]
  17. Ge, F.C.; Xu, M.X.; Gong, C.; Zhang, Z.Y.; Tan, Q.Y.; Pan, X.H. Land cover changes the soil moisture response to rainfall on the Loess Plateau. Hydrol. Process. 2022, 36, e14714. [Google Scholar] [CrossRef]
  18. Dash, S.K.; Sinha, R. Space-time dynamics of soil moisture and groundwater in an agriculture-dominated critical zone observatory (CZO) in the Ganga basin, India. Sci. Total Environ. 2022, 851, 158231. [Google Scholar] [CrossRef]
  19. Meng, F.H.; Luo, M.; Sa, C.L.; Wang, M.L.; Bao, Y.H. Quantitative assessment of the effects of climate, vegetation, soil and groundwater on soil moisture spatiotemporal variability in the Mongolian Plateau. Sci. Total Environ. 2022, 809, 152198. [Google Scholar] [CrossRef]
  20. Mohammed, S.S.; Sayl, K.N.; Kamel, A.H. Ground water recharge mapping in Iraqi Western Desert. Int. J. Des. Nat. Ecodynamics 2022, 17, 913–920. [Google Scholar] [CrossRef]
  21. Vangenuchten, M.T. A closed-form equation for predicting the hydraulic conductivity of unsaturated soils. Soil Sci. Soc. Am. J. 1980, 44, 892–898. [Google Scholar] [CrossRef]
  22. Zarlenga, A.; Fiori, A.; Russo, D. Spatial Variability of Soil Moisture and the Scale Issue: A Geostatistical Approach. Water Resour. Res. 2018, 54, 1765–1780. [Google Scholar] [CrossRef]
  23. Brocca, L.; Melone, F.; Moramarco, T.; Morbidelli, R. Spatial-temporal variability of soil moisture and its estimation across scales. Water Resour. Res. 2010, 46, W02516. [Google Scholar] [CrossRef]
  24. Shehata, M.; Gentine, P.; Nelson, N.; Sayde, C. Characterizing soil water content variability across spatial scales from optimized high-resolution distributed temperature sensing technique. J. Hydrol. 2022, 612, 128195. [Google Scholar] [CrossRef]
  25. Gombos, M.; Tall, A.; Kandra, B.; Balejcikova, L.; Pavelkova, D. Geometric Factor as the Characteristics of the Three-Dimensional Process of Volume Changes of Heavy Soils. Environments 2018, 5, 45. [Google Scholar] [CrossRef]
  26. Baroni, G.; Ortuani, B.; Facchi, A.; Gandolfi, C. The role of vegetation and soil properties on the spatio-temporal variability of the surface soil moisture in a maize-cropped field. J. Hydrol. 2013, 489, 148–159. [Google Scholar] [CrossRef]
  27. Bezak, N.; Auflic, M.J.; Mikos, M. Reanalysis of soil moisture used for rainfall thresholds for rainfall-induced landslides: The Italian Case Study. Water 2021, 13, 1977. [Google Scholar] [CrossRef]
  28. Haiyan, D.A.I.; Haimei, W. Influence of rainfall events on soil moisture in a typical steppe of Xilingol. Phys. Chem. Earth 2021, 121, 102964. [Google Scholar] [CrossRef]
  29. Noy-Meir, I. Desert Ecosystems: Environment and Producers. Annu. Rev. Ecol. Syst. 1973, 4, 25–51. [Google Scholar] [CrossRef]
  30. Zhang, H.; Li, Y.; Meng, Y.L.; Cao, N.; Li, D.S.; Zhou, Z.G.; Chen, B.L.; Dou, F.G. The effects of soil moisture and salinity as functions of groundwater depth on wheat growth and yield in coastal saline soils. J. Integr. Agric. 2019, 18, 2472–2482. [Google Scholar] [CrossRef]
  31. Malik, M.S.; Shukla, J.P.; Mishra, S. Effect of groundwater level on soil moisture, soil temperature and surface temperature. J. Indian Soc. Remote Sens. 2021, 49, 2143–2161. [Google Scholar] [CrossRef]
  32. Krevh, V.; Filipovic, V.; Filipovic, L.; Matekovic, V.; Petosic, D.; Mustac, I.; Ondrasek, G.; Bogunovic, I.; Kovac, Z.; Pereira, P.; et al. Modeling seasonal soil moisture dynamics in gley soils in relation to groundwater table oscillations in eastern Croatia. Catena 2022, 211, 105987. [Google Scholar] [CrossRef]
  33. Citakoglu, H. Comparison of artificial intelligence techniques for prediction of soil temperatures in Turkey. Theor. Appl. Climatol. 2017, 130, 545–556. [Google Scholar] [CrossRef]
  34. Chang, Y.-F.; Bi, H.-X.; Ren, Q.-F.; Xu, H.-S.; Cai, Z.-C.; Wang, D.; Liao, W.-C. Soil moisture stochastic model in Pinus tabuliformis forestland on the Loess Plateau, China. Water 2017, 9, 354. [Google Scholar] [CrossRef]
  35. Jadidoleslam, N.; Mantilla, R.; Krajewski, W.F.; Cosh, M.H. Data-driven stochastic model for basin and sub-grid variability of SMAP satellite soil moisture. J. Hydrol. 2019, 576, 85–97. [Google Scholar] [CrossRef]
  36. Wang, C.; Wang, S.; Fu, B.; Zhang, L.; Lu, N.; Jiao, L. Stochastic soil moisture dynamic modelling: A case study in the Loess Plateau, China. Earth Environ. Sci. Trans. R. Soc. Edinb. 2019, 109, 437–444. [Google Scholar] [CrossRef]
  37. Sayl, K.N.; Sulaiman, S.O.; Kamel, A.H.; Al Ansari, N. Towards the generation of a spatial hydrological soil group map based on the radial basis network model and spectral reflectance band recognition. Int. J. Des. Nat. Ecodynamics 2022, 17, 761–766. [Google Scholar] [CrossRef]
  38. Milan, G.; Branislav, K.; Andrej, T.; Dana, P. Analysis of Non-Rainfall periods and their impacts on the soil water regime. In Hydrology; Muhammad Salik, J., Ed.; IntechOpen: Rijeka, Croatia, 2019. [Google Scholar]
  39. Tao, H.; Gemmer, M.; Song, Y.; Jiang, T. Ecohydrological responses on water diversion in the lower reaches of the Tarim River, China. Water Resour. Res. 2008, 44, W08422. [Google Scholar] [CrossRef]
  40. Xu, H.; Li, Y.; Xu, G.; Zou, T. Ecophysiological response and morphological adjustment of two Central Asian desert shrubs towards variation in summer precipitation. Plant Cell Environ. 2007, 30, 399–409. [Google Scholar] [CrossRef]
  41. Yuan, G.; Luo, Y.; Shao, M.; Zhang, P.; Zhu, X. Evapotranspiration and its main controlling mechanism over the desert riparian forests in the lower Tarim River Basin. Sci. China-Earth Sci. 2015, 58, 1032–1042. [Google Scholar] [CrossRef]
  42. Bell, K.R.; Blanchard, B.J.; Schmugge, T.J.; Witczak, M.W. Analysis of surface moisture variations within large-field sites. Water Resour. Res. 1980, 16, 796–810. [Google Scholar] [CrossRef]
  43. Brocca, L.; Morbidelli, R.; Melone, F.; Moramarco, T. Soil moisture spatial variability in experimental areas of central Italy. J. Hydrol. 2007, 333, 356–373. [Google Scholar] [CrossRef]
  44. Yuan, G.; Zhang, P.; Shao, M.-A.; Luo, Y.; Zhu, X. Energy and water exchanges over a riparian Tamarix spp. stand in the lower Tarim River basin under a hyper-arid climate. Agric. For. Meteorol. 2014, 194, 144–154. [Google Scholar] [CrossRef]
  45. Hillel, D. Introduction to Environmental Soil Physics; Academic Press: San Diego, CA, USA, 2003. [Google Scholar]
  46. Zhang, P.; Yuan, G.; Shao, M.-A.; Yi, X.; Du, T. Performance of the white method for estimating groundwater evapotranspiration under conditions of deep and fluctuating groundwater. Hydrol. Process. 2016, 30, 106–118. [Google Scholar] [CrossRef]
  47. Rodriguez-Iturbe, I.; Porporato, A.; Ridolfi, L.; Isham, V.; Cox, D.R. Probabilistic modelling of water balance at a point: The role of climate, soil and vegetation. Proc. R. Soc. A-Math. Phys. Eng. Sci. 1999, 455, 3789–3805. [Google Scholar] [CrossRef]
  48. Orellana, F.; Verma, P.; Loheide, S.P., II.; Daly, E. Monitoring and modeling water-vegetation interactions in groundwater-dependent ecosystems. Rev. Geophys. 2012, 50, RG3003. [Google Scholar] [CrossRef]
  49. Laio, F.; Tamea, S.; Ridolfi, L.; D’Odorico, P.; Rodriguez-Iturbe, I. Ecohydrology of groundwater-dependent ecosystems: 1. Stochastic water table dynamics. Water Resour. Res. 2009, 45, W05419. [Google Scholar] [CrossRef]
  50. Fensham, R.J.; Butler, D.W.; Foley, J. How does clay constrain woody biomass in drylands? Glob. Ecol. Biogeogr. 2015, 24, 950–958. [Google Scholar] [CrossRef]
Figure 1. The location of the study area.
Water 15 03403 g001
Figure 2. Spatial distributions of mean soil water contents (a), groundwater depth (GWD) (b), and mean soil clay contents (c) in the tamarisk stand.
Water 15 03403 g002
Figure 3. Linear relationship between the gravimetric soil water content (SWC) and soil physical clay content.
Water 15 03403 g003
Figure 4. The vertical profile characteristics of soil moisture under different groundwater depth levels. (a) 3.4–4 m; (b) 4–4.5 m; (c) 4.5–5 m; (d) 5–5.5 m, and (e) 5.5–6.1 m.
Water 15 03403 g004
Figure 5. Diurnal variations of soil moisture (SWC) in different layers. (ad) the depth of 0.3 m; (eh) the depth of 4.0 m; (il) the depth of 5.0 m; (mp) the corresponding water tables in different phenological stages of tamarisk.
Water 15 03403 g005
Figure 6. Seasonal variations in soil moisture (SWC) in different layers and the corresponding water table (GWD) and surface evapotranspiration (ET) values for the three years of observations. The gray regions represent the growing seasons. (a) SWC. (b) GWD. (c) ET.
Water 15 03403 g006
Figure 7. Temporal variation in soil water content (SWC) at a depth of 0.3 m after a heavy precipitation event.
Water 15 03403 g007
Figure 8. Variations in surface evapotranspiration (ET) and reference evapotranspiration (ET0) before and after the beginning of the tamarisk growing season.
Water 15 03403 g008
Figure 9. Schematic drawing of the general soil moisture profile in homogeneous soil from a hyper-arid climate.
Water 15 03403 g009
Table 1. The basic statistics of soil moisture (g g−1), corresponding groundwater depths, and soil physical clay content of all sampling points.
MaximumMinimumMedianMeanStandard Deviation
Gravimetric soil water content (g g−1)0.250.050.180.170.06
Groundwater depth (m)6.103.404.804.840.56
Soil physical clay content (%)56.4114.0347.0042.939.20
Table 2. The basic statistics of soil moisture (m3 m−3) and groundwater depth (m) from the continuous monitoring site.
MaximumMinimumMedianMeanStandard Deviation
Soil volumetric water content from various depths (m3 m−3)0.3 m7.82 4.25 6.66 6.57 0.90
0.6 m24.31 20.60 23.30 23.12 0.98
1 m19.46 14.79 17.92 17.76 1.35
1.5 m24.56 19.80 23.35 22.86 1.44
2.0 m18.62 14.89 17.52 17.43 0.93
2.5 m12.24 10.35 11.29 11.43 0.48
3.0 m32.75 31.98 32.54 32.50 0.18
4.0 m52.81 39.75 40.03 42.79 4.49
5.0 m50.92 40.71 50.46 47.47 4.32
Groundwater depth (m)4.133.384.074.050.10
Table 3. Vertical variabilities in soil moisture content at different groundwater depths. GWD denoted the groundwater depth. N denoted the number of samples.
GWD
(m)
NSurface LayerSaturated LayerMiddle Unsaturated Layer
CV (%)CV (%)Maximum CV
(%)
Depth of Soil Profile with Maximum CV
(m)
Minimal CV
(%)
Depth of Soil Profile with Minimal CV
(m)
3.5–471218891.5392.5
4–4.5268713900.5441.5
4.5–5266313880.5351.5
5–5.5326613502.5125
5.5–6.195616690.575.5
Disclaimer/Publisher’s Note: The statements, opinions and data contained in all publications are solely those of the individual author(s) and contributor(s) and not of MDPI and/or the editor(s). MDPI and/or the editor(s) disclaim responsibility for any injury to people or property resulting from any ideas, methods, instructions or products referred to in the content.

