Article

Distribution of Heavy Metals in Water and Bottom Sediments in the Basin of Lake Gusinoe (Russia): Ecological Risk Assessment

1
Institute of Geographic Sciences and Natural Resources Research, Chinese Academy of Sciences, Beijing 100101, China
2
University of Chinese Academy of Sciences, Beijing 100049, China
3
Baikal Institute of Nature Management, Siberian Branch of the Russian Academy of Sciences, Ulan-Ude 670047, Russia
*
Authors to whom correspondence should be addressed.
Water 2023, 15(19), 3385; https://doi.org/10.3390/w15193385
Submission received: 31 August 2023 / Revised: 21 September 2023 / Accepted: 25 September 2023 / Published: 27 September 2023

Abstract

:
Fresh water scarcity is considered a significant component, and potentially one of the most critical, of global climate change. With the rapid development of industry, there is an increasing risk of freshwater contamination by heavy metals (HMs). The danger of HM pollution is also attributed to their accumulation, which can subsequently become a source of secondary pollution in aquatic environments. In the Lake Gusinoe basin, located in Russia, concentrations of HMs were measured in both water and bottom sediments within the lake area, as well as in inflowing and outflowing watercourses. Ecological risk indices were also calculated for the Gusinoe basin. Our results showed that the average concentrations of Fe, Zn, Cr, Ni, Cd, and Pb in the water did not exceed the maximum allowable concentrations (MACs) set by Russian national standards and WHO standards, while the concentrations of Mn and Cu exceeded the corresponding MACs during winter, spring, and autumn possibly due to decomposition of aquatic vegetation and influx from groundwater sources. The average concentrations of the investigated HMs in the BSs did not exceed the background values. The water hazard index indicated a low risk for all samples in the lake water area. For all BS samples, the geoaccumulation index (Igeo) and the Pollution Load Index (PLI) indicated low pollution levels, while the values of the Enrichment Factor (EF) and the Contamination Factor (CF) indicated moderate pollution in the central part of the lake. The Ecological Risk Factor (Er) for Cu in BSs at points near major settlements and in the Tel River indicated moderate pollution. The Potential Ecological Risk Index (RI) in all investigated BS samples indicated a low risk of contamination.

1. Introduction

The issue of freshwater accessibility and quality is becoming more pressing with each passing year. The world’s population is growing, industrial production is increasing rapidly, and as a result, the demand for fresh water is increasing significantly. One of the global challenges related to fresh water is the contamination of water bodies with HMs, which do not degrade once they enter the aquatic environment and are toxic to many life forms [1,2,3,4].
Heavy metals input to the environment as a result of both natural processes (formation of anomalously enriched marine and volcanic aerosols, weathering of soils and rocks, etc.) and anthropogenic emissions [5,6]. Changes in the physicochemical conditions of the water body, as well as a reduction in the regular input of pollutants from anthropogenic sources, can lead to the re-release of contaminants from bottom sediments (BSs) into the water column, with significant impacts on the aquatic environment [7,8].
The assessment of anthropogenic impacts on water bodies includes not only the determination of concentrations and forms of toxic elements in the water column, but also the content of pollutants in the BSs of water reservoirs [9]. BSs, formed by the sedimentation of suspended inorganic and organic matter, play an important role in shaping the chemical composition of surface waters [10]. These sediments represent a unique depositional medium, and their composition reflects the ecological condition of the entire watershed, including the anthropogenic influences within this area [11,12].
Lake Gusinoe is the largest freshwater body in the Baikal Natural Territory and the basin of Lake Baikal (which is the deepest lake on the planet, the largest natural freshwater reservoir, and the largest freshwater lake on the continent by area) [13,14]. Lake Gusinoe is subject to significant anthropogenic and technological impacts: it serves as a source of domestic drinking water supply for the population of the city of Gusinoozersk and as a cooling pond for the Gusinoozersk GRES (a thermal power plant; GRES stands for ‘state-owned regional electricity-generating station’) [15,16,17]. The northern and northeastern shores of the lake are occupied by the Gusinoozersk industrial energy complex, one of the largest in the Republic of Buryatia. The population of the city of Gusinoozersk is 24,451, making it the second largest city in the republic [18].
Comprehensive studies of surface and bottom waters, BSs, flora, and fauna have been conducted in the Lake Gusinoe basin to monitor and assess the ecological status of the aquatic environment [15,16,19,20,21]. Numerous studies indicate an increase in anthropogenic pressure on the waters of the Gusinoe basin, which indicate changes in water flow, temperature regime, and land use; an increase in major ions in the water; and an increase in heavy metals in the water, bottom sediments, and higher vegetation. This increase is mainly attributed to the operation of the Gusinoozersk GRES and the Gusinoozersk industrial complex, the Kholboldzhinsky coal mine, the Gusinoe Ozero railway station, and the locomotive depot [22,23,24,25,26]. The ecological state of the lake is also monitored by the Buryat Center for Hydrometeorology and Environmental Monitoring, and their results also indicate an escalation of anthropogenic impacts [27]. Additionally, the integration of various environmental parameters and pollutant data through ecological risk indexes can offer a comprehensive evaluation of the lake’s susceptibility to anthropogenic pressures, assisting in developing specific mitigation strategies [28,29,30,31,32,33].
This study presents the distribution of HMs in water and BSs of the Lake Gusinoe basin. An assessment of the ecological risk associated with the accumulation of HMs in BSs was conducted. The most common ecological risk indices used in this research are contamination factor [34,35], geoaccumulation index [36,37], and pollution load index [38]. A number of studies have been made to assess the HM contamination of the water and BSs of lakes, e.g., the Cherkalov Sor bay at Lake Baikal [39], the Sabalan Dam Reservoir, Iran [40,41], Namak Lake [42], the lakes of Wielkopolski National Park [43], and the lowland area of Western Poland [44].
This study can be considered as the first attempt to assess HM pollution in BSs of the Gusinoe basin using ecological risk indices.

2. Materials and Methods

2.1. Study Area and Sampling Locations

Lake Gusinoe (51.1903 N, 106.4050 E) is located in the center of the Gusinoozerskaya depression and is the second largest freshwater body in Buryatia. The environmental characteristics of the lake are primarily determined by natural factors such as precipitation, river runoff, and groundwater input. The lake performs essential functions, such as providing water resources and supporting fisheries. In particular, it serves as the primary source of domestic and drinking water for the town of Gusinoozersk and neighboring settlements, serving approximately 30 thousand inhabitants. In addition, the area surrounding the lake has developed into a significant industrial center, which houses various power generation, processing, and transportation facilities, which contribute to the environmental dynamics of the lake.
The body of water is elongated and extends from the northeast to the southwest. It has the following characteristics: length—24.8 km, average width—8 km, average depth—15 m (maximum depth—26 m), water surface area—163 km2. The largest of the lake’s two basins is located in its northern part and contains about three-quarters of the total water volume. As a low-flow water body, the lake has a conditional water exchange coefficient (ratio of total water inflow to the reservoir to the average volume of the reservoir) of 0.0125.
The catchment area of the lake, with a total area of 924 km2, is fed by 72 watercourses, the largest of which is the Tsagan-gol (one of the main channels of the Temnik River), originating within the Khamar-Daban ridge area. The smaller tributaries—the Zagustai River and its channel the Tel River—flow near the ash dumps of the Gusinoozersk GRES. Practically all other watercourses flowing from the Khambinsky Ridge do not reach the lake, being lost in loose sediments 300–500 m from the shore. The Bayan-gol River, the only river flowing out of the lake, joins the Selenga River (the main tributary of Lake Baikal) after 14 km [13,14].
Sampling of water and BSs in the lake water area was conducted at 18 reference points (Figure 1).

2.2. Sample Collection and Preparation

In 2021, four complex expeditions were conducted during each season (February–subglacial period, May, July, and September) to study the content and distribution of HMs in the water and BSs in Lake Gusinoe. A total of 69 surface water samples and 65 BS samples were collected at the pre-defined reference points, excluding the GRES water intake point due to the artificially created rock embankment. The chemical composition of the surface water and BSs in Lake Gusinoe, its tributaries (the Tsagan-gol, Zagustai, and Tel rivers), the Bayan-gol River flowing out of the lake, as well as the water intake and discharge channels of the GRES were determined. During the winter period, water samples were not taken from the Tsagan-gol, Zagustai and Tel rivers due to their complete freezing.
Water samples were collected in pre-cleaned polypropylene bottles and immediately filtered through sterile Sartorius disposable filters (0.45 µm pore size). The first 50 mL of the filtrate was discarded. Filtered solutions for trace element analyses were acidified (pH 2) with ultrapure double-distilled HNO3 and stored in HDPE bottles prewashed with 1M HCl and rinsed with MilliQ deionized water. Some water parameters were measured directly at the sampling sites. The pH value, temperature, turbidity, dissolved oxygen (DO), in the water were measured during the field studies using a complex field chemical laboratory with additional equipment (pH-tester, Hanna portable instruments, etc.) on the day of sampling according to the GOST requirements. pH was measured by the potentiometric method, DO by the Winkler test with an error of 0.3%. For determination of HMs, the water samples were fixed according to the analysis techniques and transported to the Institute’s laboratory in a refrigerated box.
BS samples were taken from the surface layer with a Petersen dredge (grab area of 0.025 m2) and then placed in polyethylene bags. BS sampling was performed according to the guidelines on methods for determination of HMs in BSs [45]. The collected BS samples were dried at room temperature and sieved using a 2 mm sieve. After proper labeling, the samples were stored in polyethylene bags.

2.3. BSs Quality Measurement

Prior to bulk elemental analysis, BS samples were oven-dried for 48 h at 60 ± 2 °C and ground in an agate mortar. The BSs were digested according to EPA Method 3052 [46]. Briefly, approximately 0.5 g (dry weight) of BSs was placed in a nitric acid-washed XP-1500 Teflon digestion vessel containing a mixture of acids (9 mL of HNO3, 3 mL of HF, and 2 mL of HCl), then the sealed vessels were placed in a MARS 6 microwave system (CEM Corporation, Matthews, NC, USA) equipped with temperature and pressure sensors.
The temperature of each sample was increased to 180 ± 5 °C for 15 min and maintained at 180 ± 5 °C for 10 min. At the end of the microwave program, the vessels were cooled to near room temperature. The samples were then transferred to an acid-cleaned volumetric flask and diluted to 50 mL with ultrapure water. If solids remained in the digested sample, it was filtered.

2.4. Analytical Technique and Accuracy Check

The concentrations of HMs (Fe, Mn, Zn, Ni, Cd, Cr, Cu and Pb) were then determined using an atomic absorption spectrometer (Solaar M6, Thermo Electron Corporation, San Diego, CA, USA) coupled with a graphite furnace and flame atomizer, with an error of 5–10%. The detection limits of mineral elements in BSs by spectrophotometric analysis: Ni (0.5 mg/kg), Pb, Cr (0.2 mg/kg), Fe (4 mg/kg), Cd (0.01 mg/kg), Mn, Cu and Zn (0.1 mg/kg) [47].
Quality assurance and quality control were performed using blank reagents and Certified Reference Materials (Sediment from Lake Baikal BIL-2, GSO 7176-950 [48]) with each sample batch (1 blank and 1 standard sample for every 10 samples). The recovery rates with the addition of standards ranged from 91 to 103% (Table 1). The precision of the method was evaluated by measuring the BIL-2 sample (n = 5). The measured precisions (% RSD) were: Fe (1.2%), Mn (1.5%), Zn (0.9%), Cu (1.4%), Ni (4.7%), Cr (3.4%), and Pb (6.7%). Blanks were prepared using the same protocol (reagents only), and its values were extracted from sample measurement results. The reagents used were analytically pure, and the water was purified to a resistivity of 18.2 MΩ-cm (at 25 °C) using a Direct-Q UV3 Ultrapure Water Systems apparatus (Millipore, Guyancourt, France). During the atomic absorption determinations, a multi-standard STD IV-STOCK-8 solution (in 5% (v/v) HNO3) (Inorganic Ventures, Christiansburg, VA, USA, [49]) was used.

2.5. Ecological Assessment for Water and BSs

2.5.1. Hazard Index

Non-cancerogenic effects are considered to have a threshold dose below which no adverse effects occur. Reference (safe) levels of exposure are doses or concentrations of chemicals that do not cause adverse effects in a population (including sensitive subgroups).
The Hazard Index (HI) [50] is used to estimate the combined effect of individual components of a mixture of chemicals:
H I = H Q 1 + H Q 2 + + H Q n
where HQ1, HQ2, HQn are the hazard quotients for the 1st, 2nd, and nth chemicals. Hazard quotient (HQ) is calculated as follows:
H Q = D / R f D
where D is an oral dose of a substance, mg/kg, RfD is the reference (safe) dose. The oral dose of a chemical substance present in drinking water is calculated taking into account the following dependence:
D = 2 L / 70   kg
where 2L is the average amount of water consumed per day; 70 kg is the average weight of a person.
Risk assessment is performed according to the hazard ratio criteria summarized in Table 2.

2.5.2. Contamination Factor

The contamination factor (CF) for an individual trace element was calculated according to Ferati et al. (2015) [34] and Liu et al. (2020) [35]. In this study CF was used to determine the degree of contamination of BSs. CF was calculated using the formula:
C f = C m e t a l C b a c k g r o u n d
where: Cf—is the contamination factor for the contaminant, Cmetal—is the concentration of the metal in the studied sediments; Cbackground—is the base metal concentration in the Earth’s crust (Table S1). Table 2 shows the seven different classifications into which the contamination factor (Cf) is categorized.

2.5.3. Degree of Contamination

Hakanson (1980) [51] proposed a sedimentological approach to environmental assessment using a diagnostic tool called “degree of contamination” to facilitate contamination control. For each sample, the degree of contamination (Cd) was defined as the sum of the contamination factors (Cf):
C d = i = 1 i = n C f
Table 2 shows the classification according to the degree of contamination in BSs.

2.5.4. Pollution Load Index (PLI)

The Pollution Load Index (PLI) proposed by Tomlinson et al. (1980) [36] was utilized to assess the pollution load of the sediments. This index provides a straightforward and relative method for evaluating the degree of metal pollution and is calculated using the following formula:
P L I = C f 1 × C f 2 × C f 3 × × C f n 2
where n—is number of metals. The load index scale is shown in Table 2.

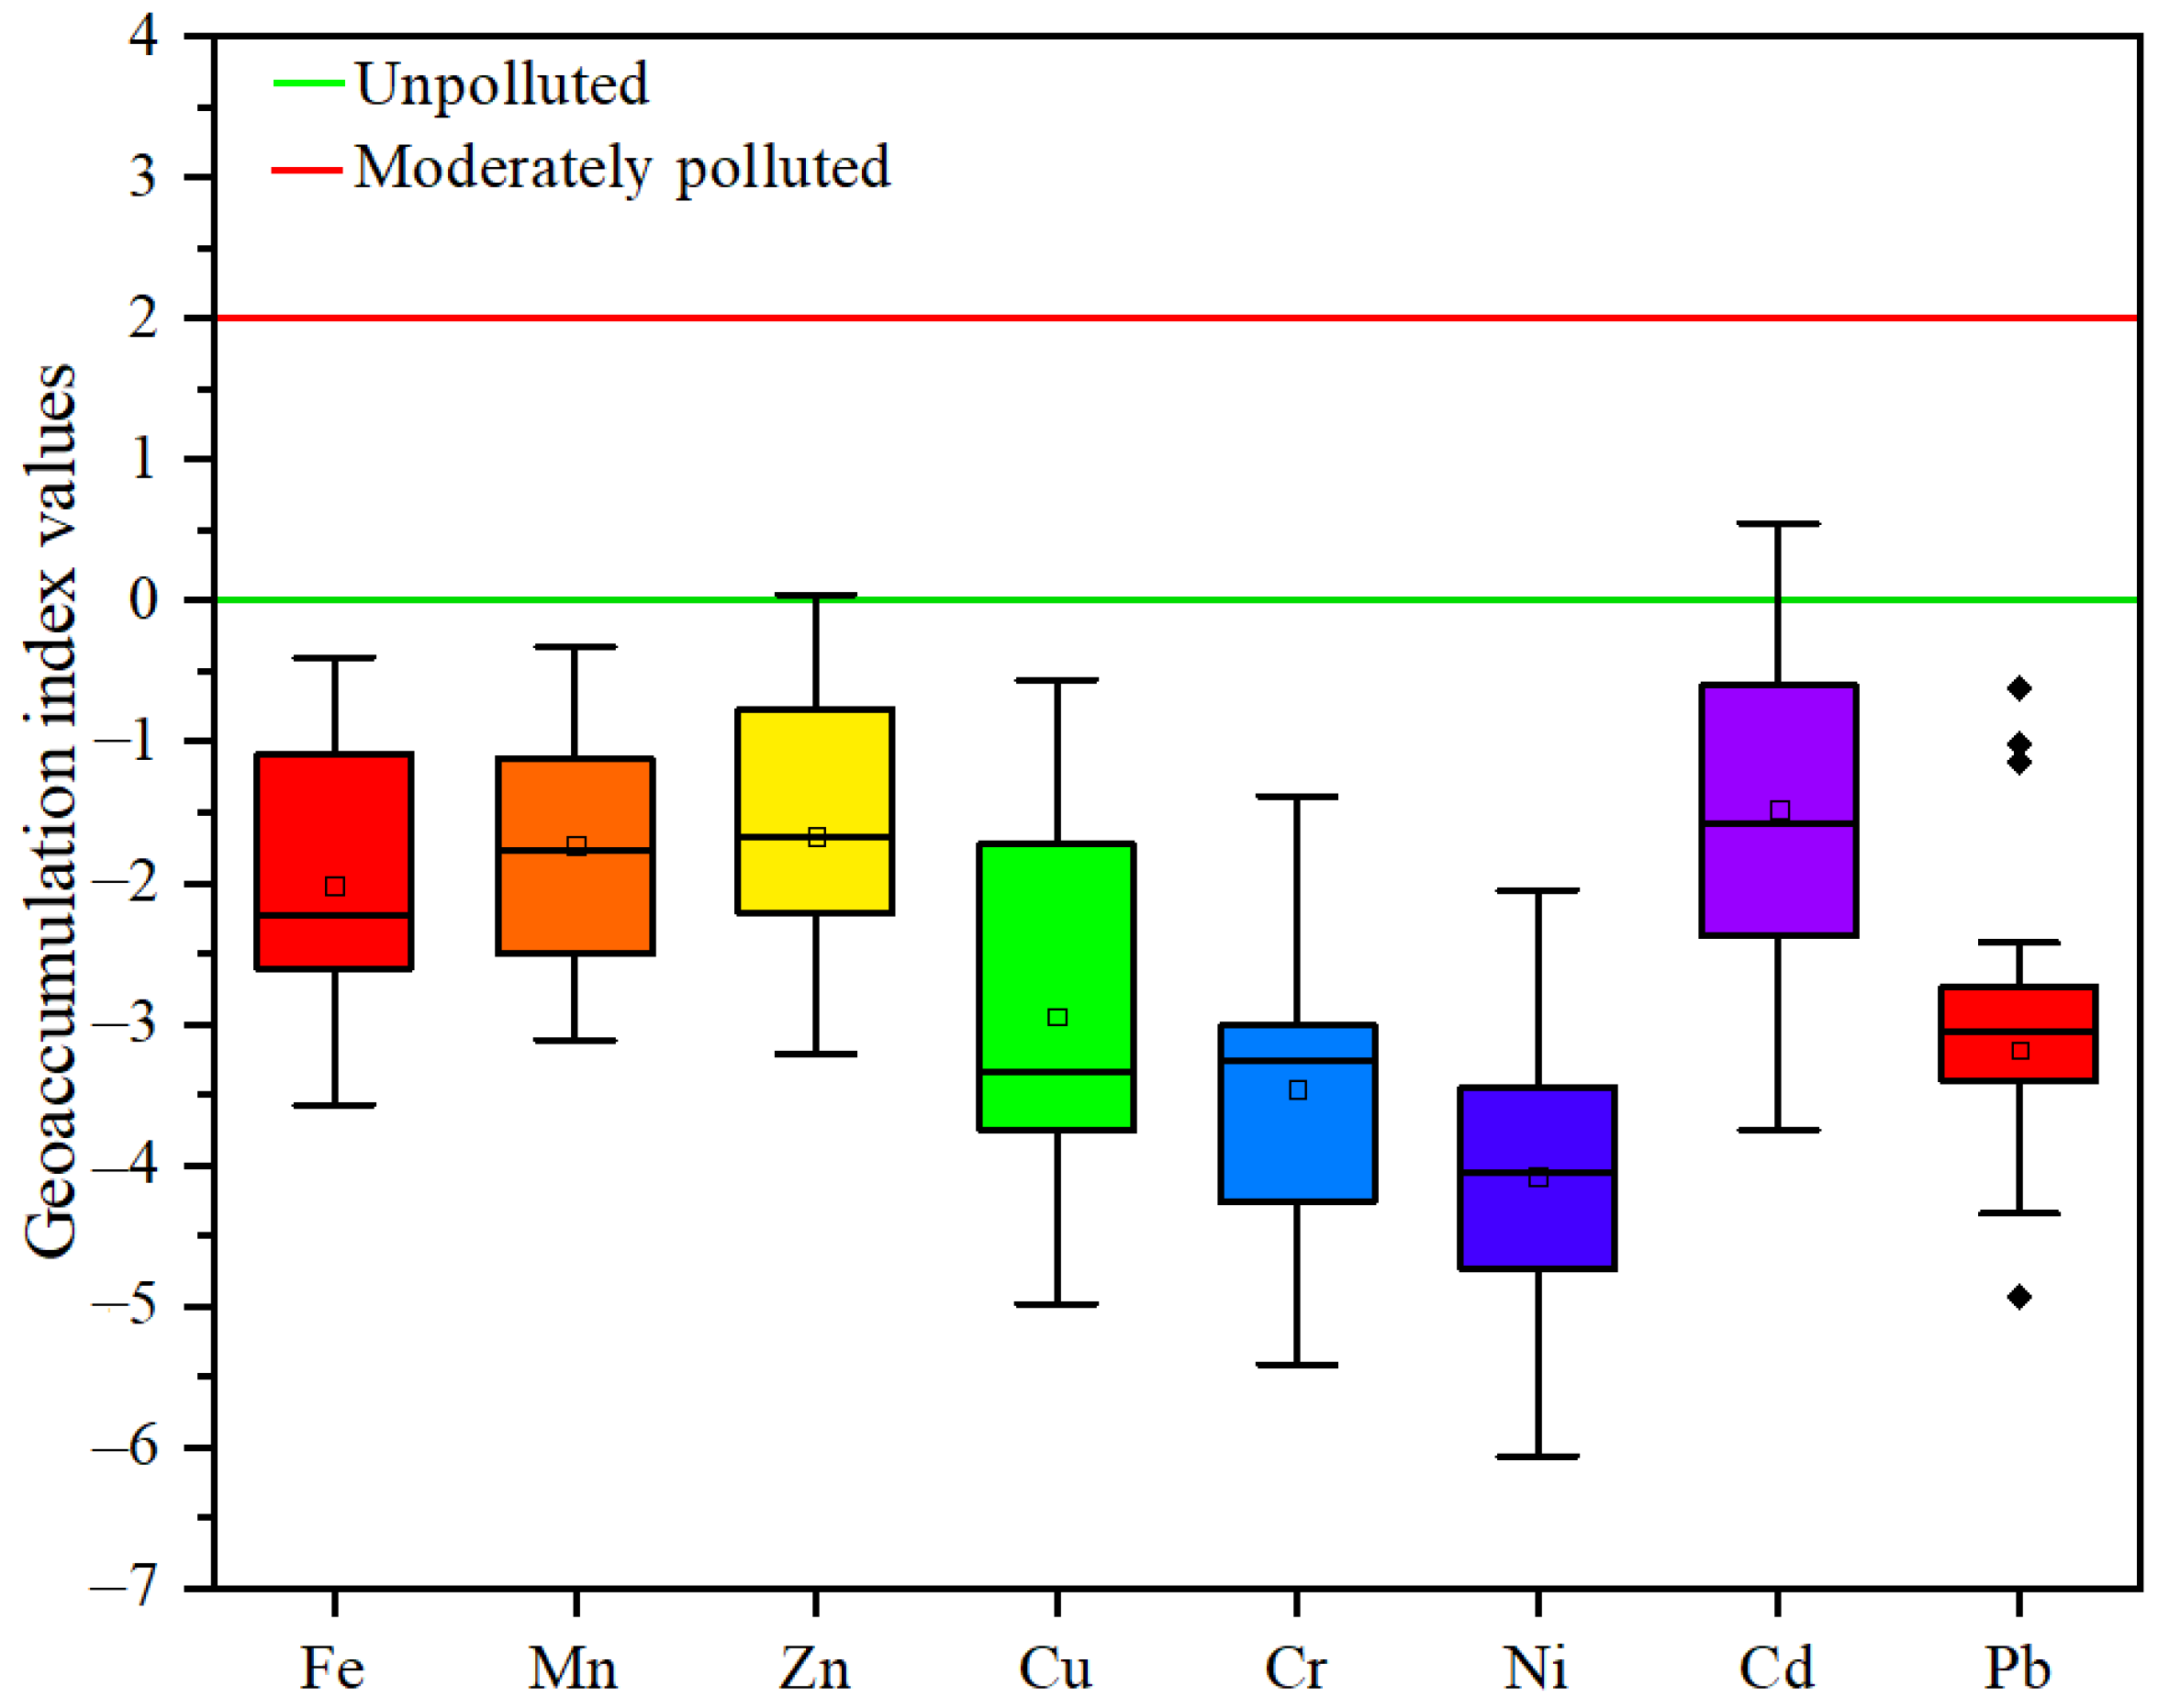
2.5.5. Geoaccumulation Index (Igeo)

The geoaccumulation index (Igeo) was determined by comparing the metal concentration in the studied sediments with its baseline level in the Earth’s crust and calculated using the following formula [36]:
I g e o = l o g 2 ( C n 1.5   B n )
where Cn is the metal concentration in the studied sediments; Bn is the baseline metal concentration in the Earth’s crust, determined from Table 1; 1.5 is a coefficient to minimize changes that may occur in the baseline metal concentration due to geological changes in the sediments [37]. The scale of the geoaccumulation index is shown in Table 2.

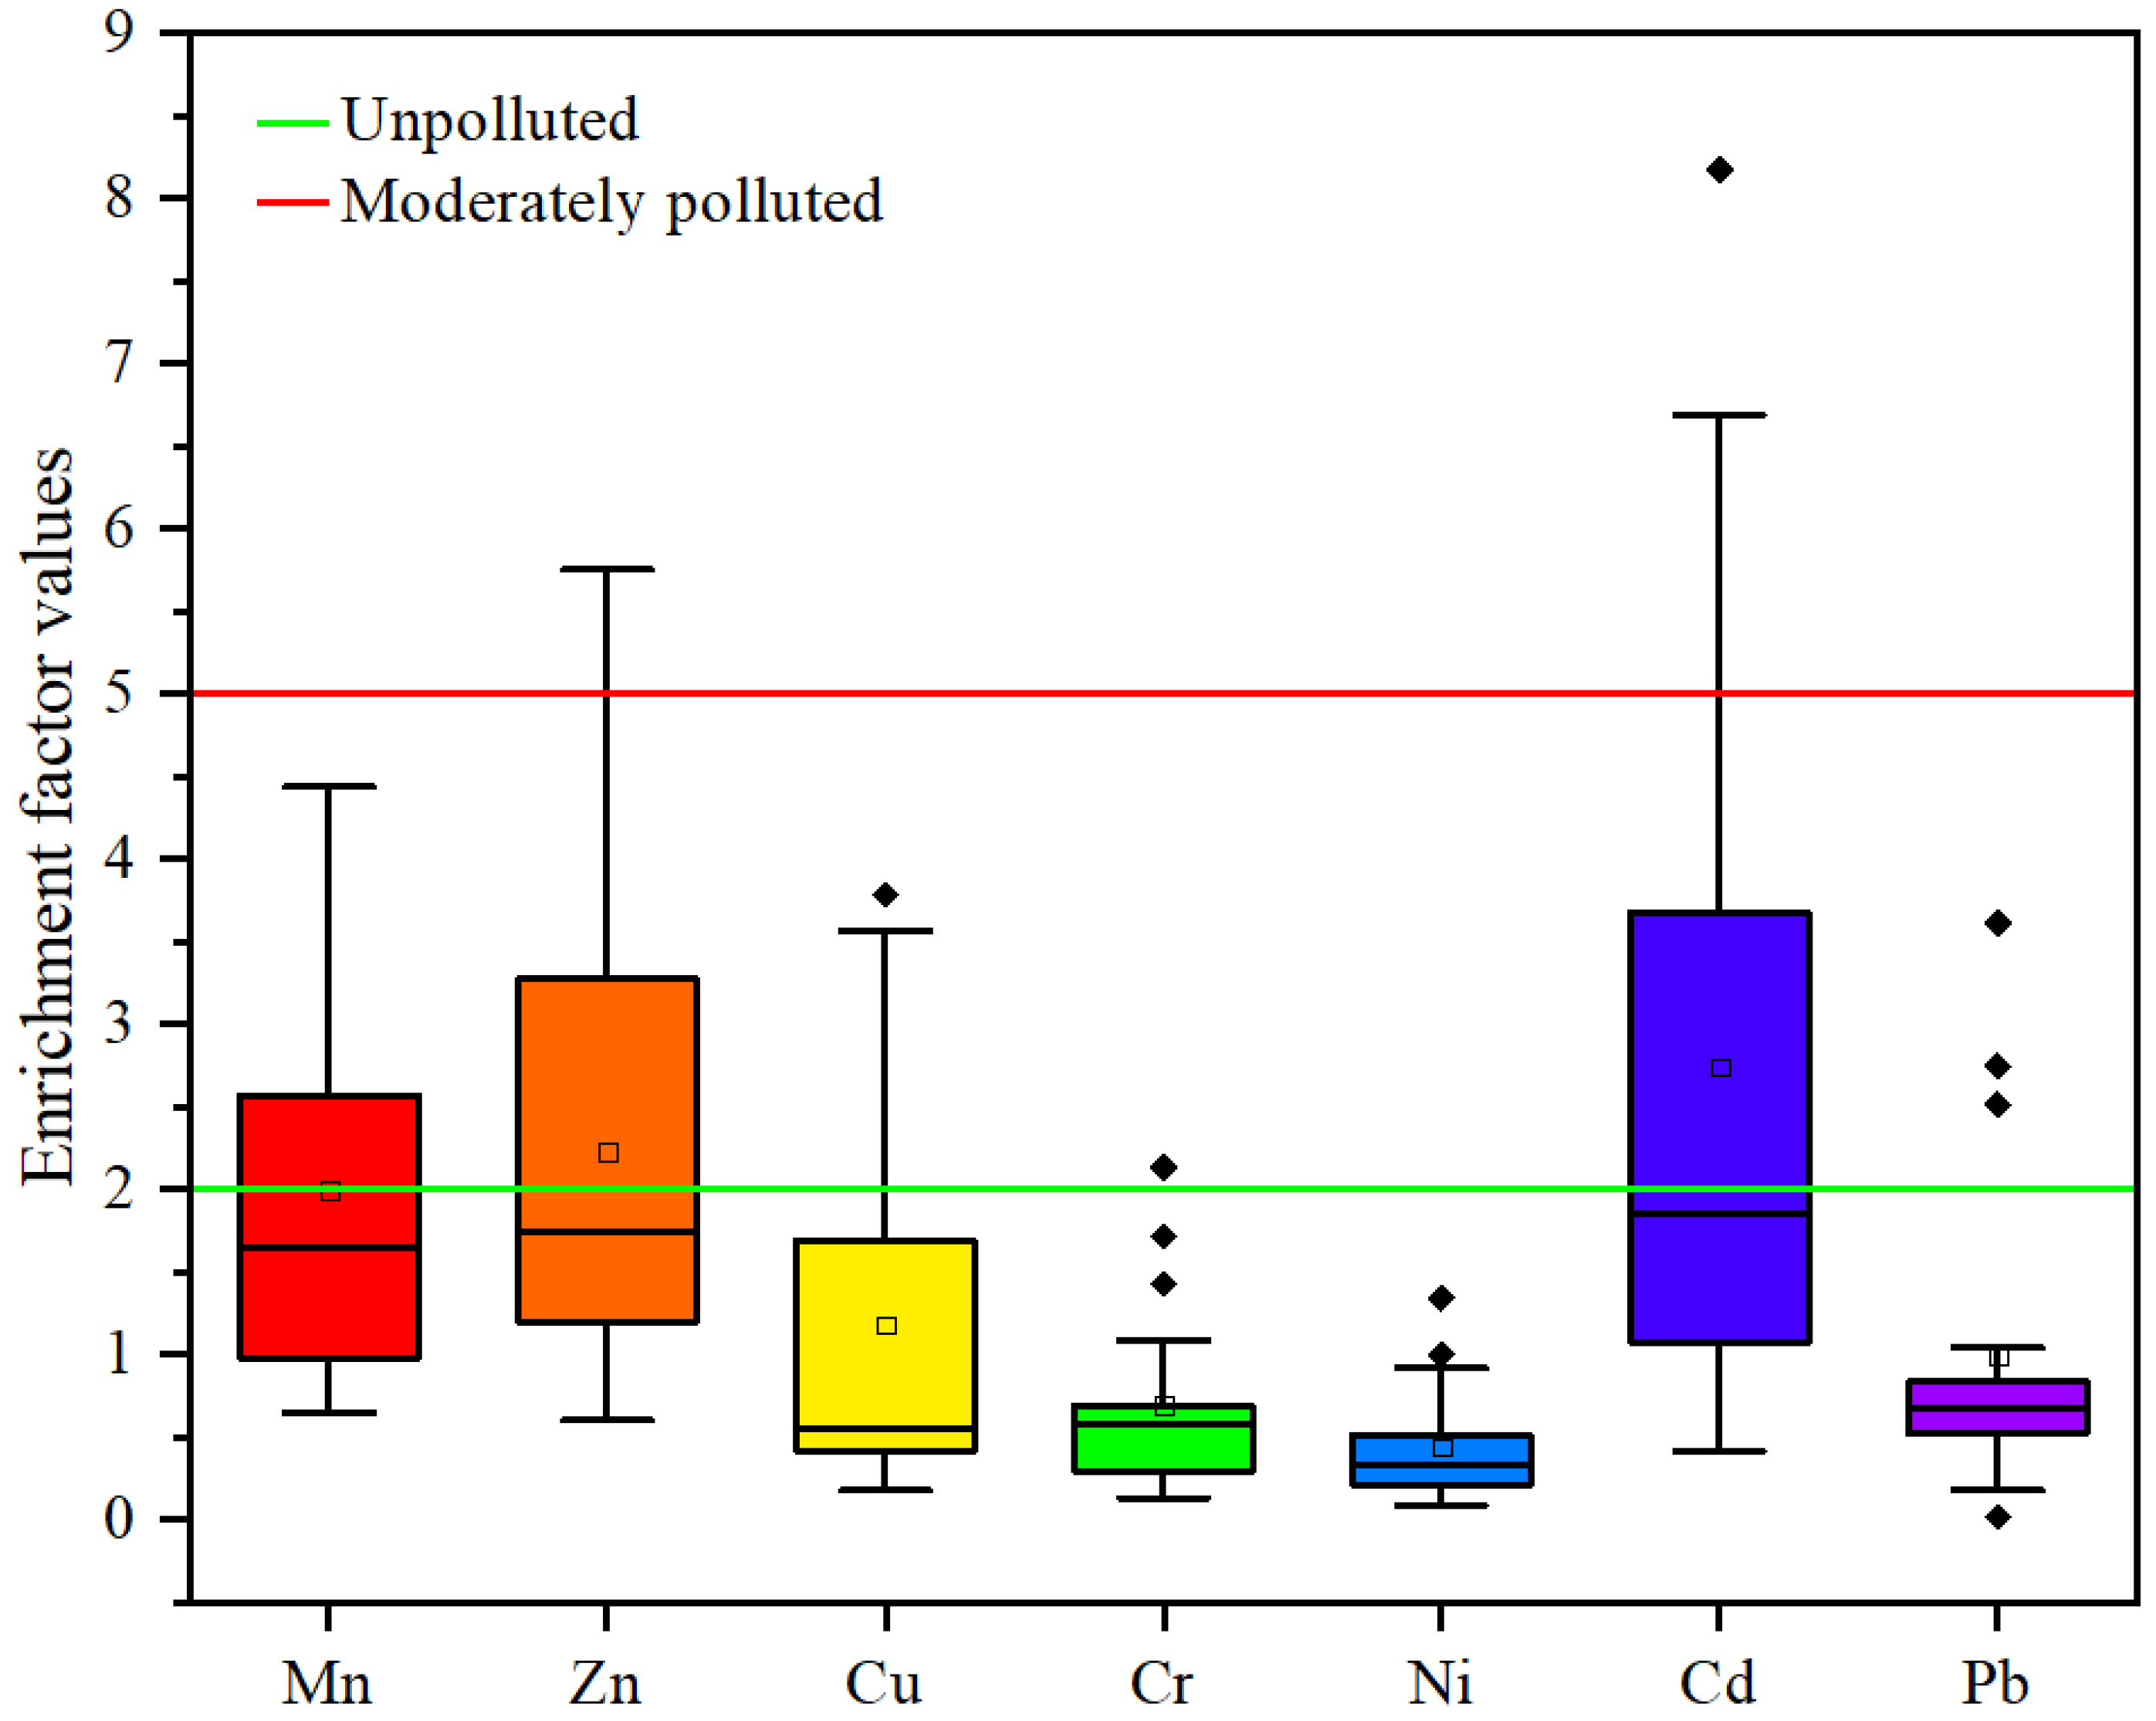
2.5.6. Enrichment Factor (EF)

The Enrichment Factor (EF) reflects the degree of accumulation of a metal in sediments compared to its baseline concentration in the Earth’s crust. It is determined using the concentration of one of the metals (Al, Fe, Mn, Ti, Sc) as a reference for comparison, since the concentration of these metals in the Earth’s crust or sediments remains relatively high and is less susceptible to changes due to environmental pollution. In most cases, Fe is commonly used as a reference standard, and in this study, the concentration of Fe was also used as a reference standard. The EF is calculated using the formula [50]:
E F = C M e / C F e ; r e f C B / C F e ; B
where CMe and CFe;ref represent the concentration of the metal in the studied sediments and the concentration of Fe as a reference standard, respectively; CB and CFe,B represent the baseline concentration of the metal in the Earth’s crust and the baseline concentration of Fe, respectively. The contamination factor scale is shown in Table 2.

2.5.7. Ecological Risk Factor (Er)

The method for assessing the environmental risk for soil is based on the toxicity of the metals and factors related to the environmental response. According to Hakanson’s study [51], Er was calculated using the following equation:
E r = T r × C f
where Tr represents the toxic-response factor values for each individual metal as described in Table S2, and Cf is the contamination factor. The classification of soil contamination based on Er is shown in Table 2.

2.5.8. Potential Ecological Risk Index (RI)

The Potential Ecological Risk Index (RI) is a method for assessing environmental risks associated with soil. It provides a comprehensive assessment of a contaminated site to evaluate the potential ecological risk. According to the research by Hakanson [36,51], the RI was calculated using the following equation:
R I = E r

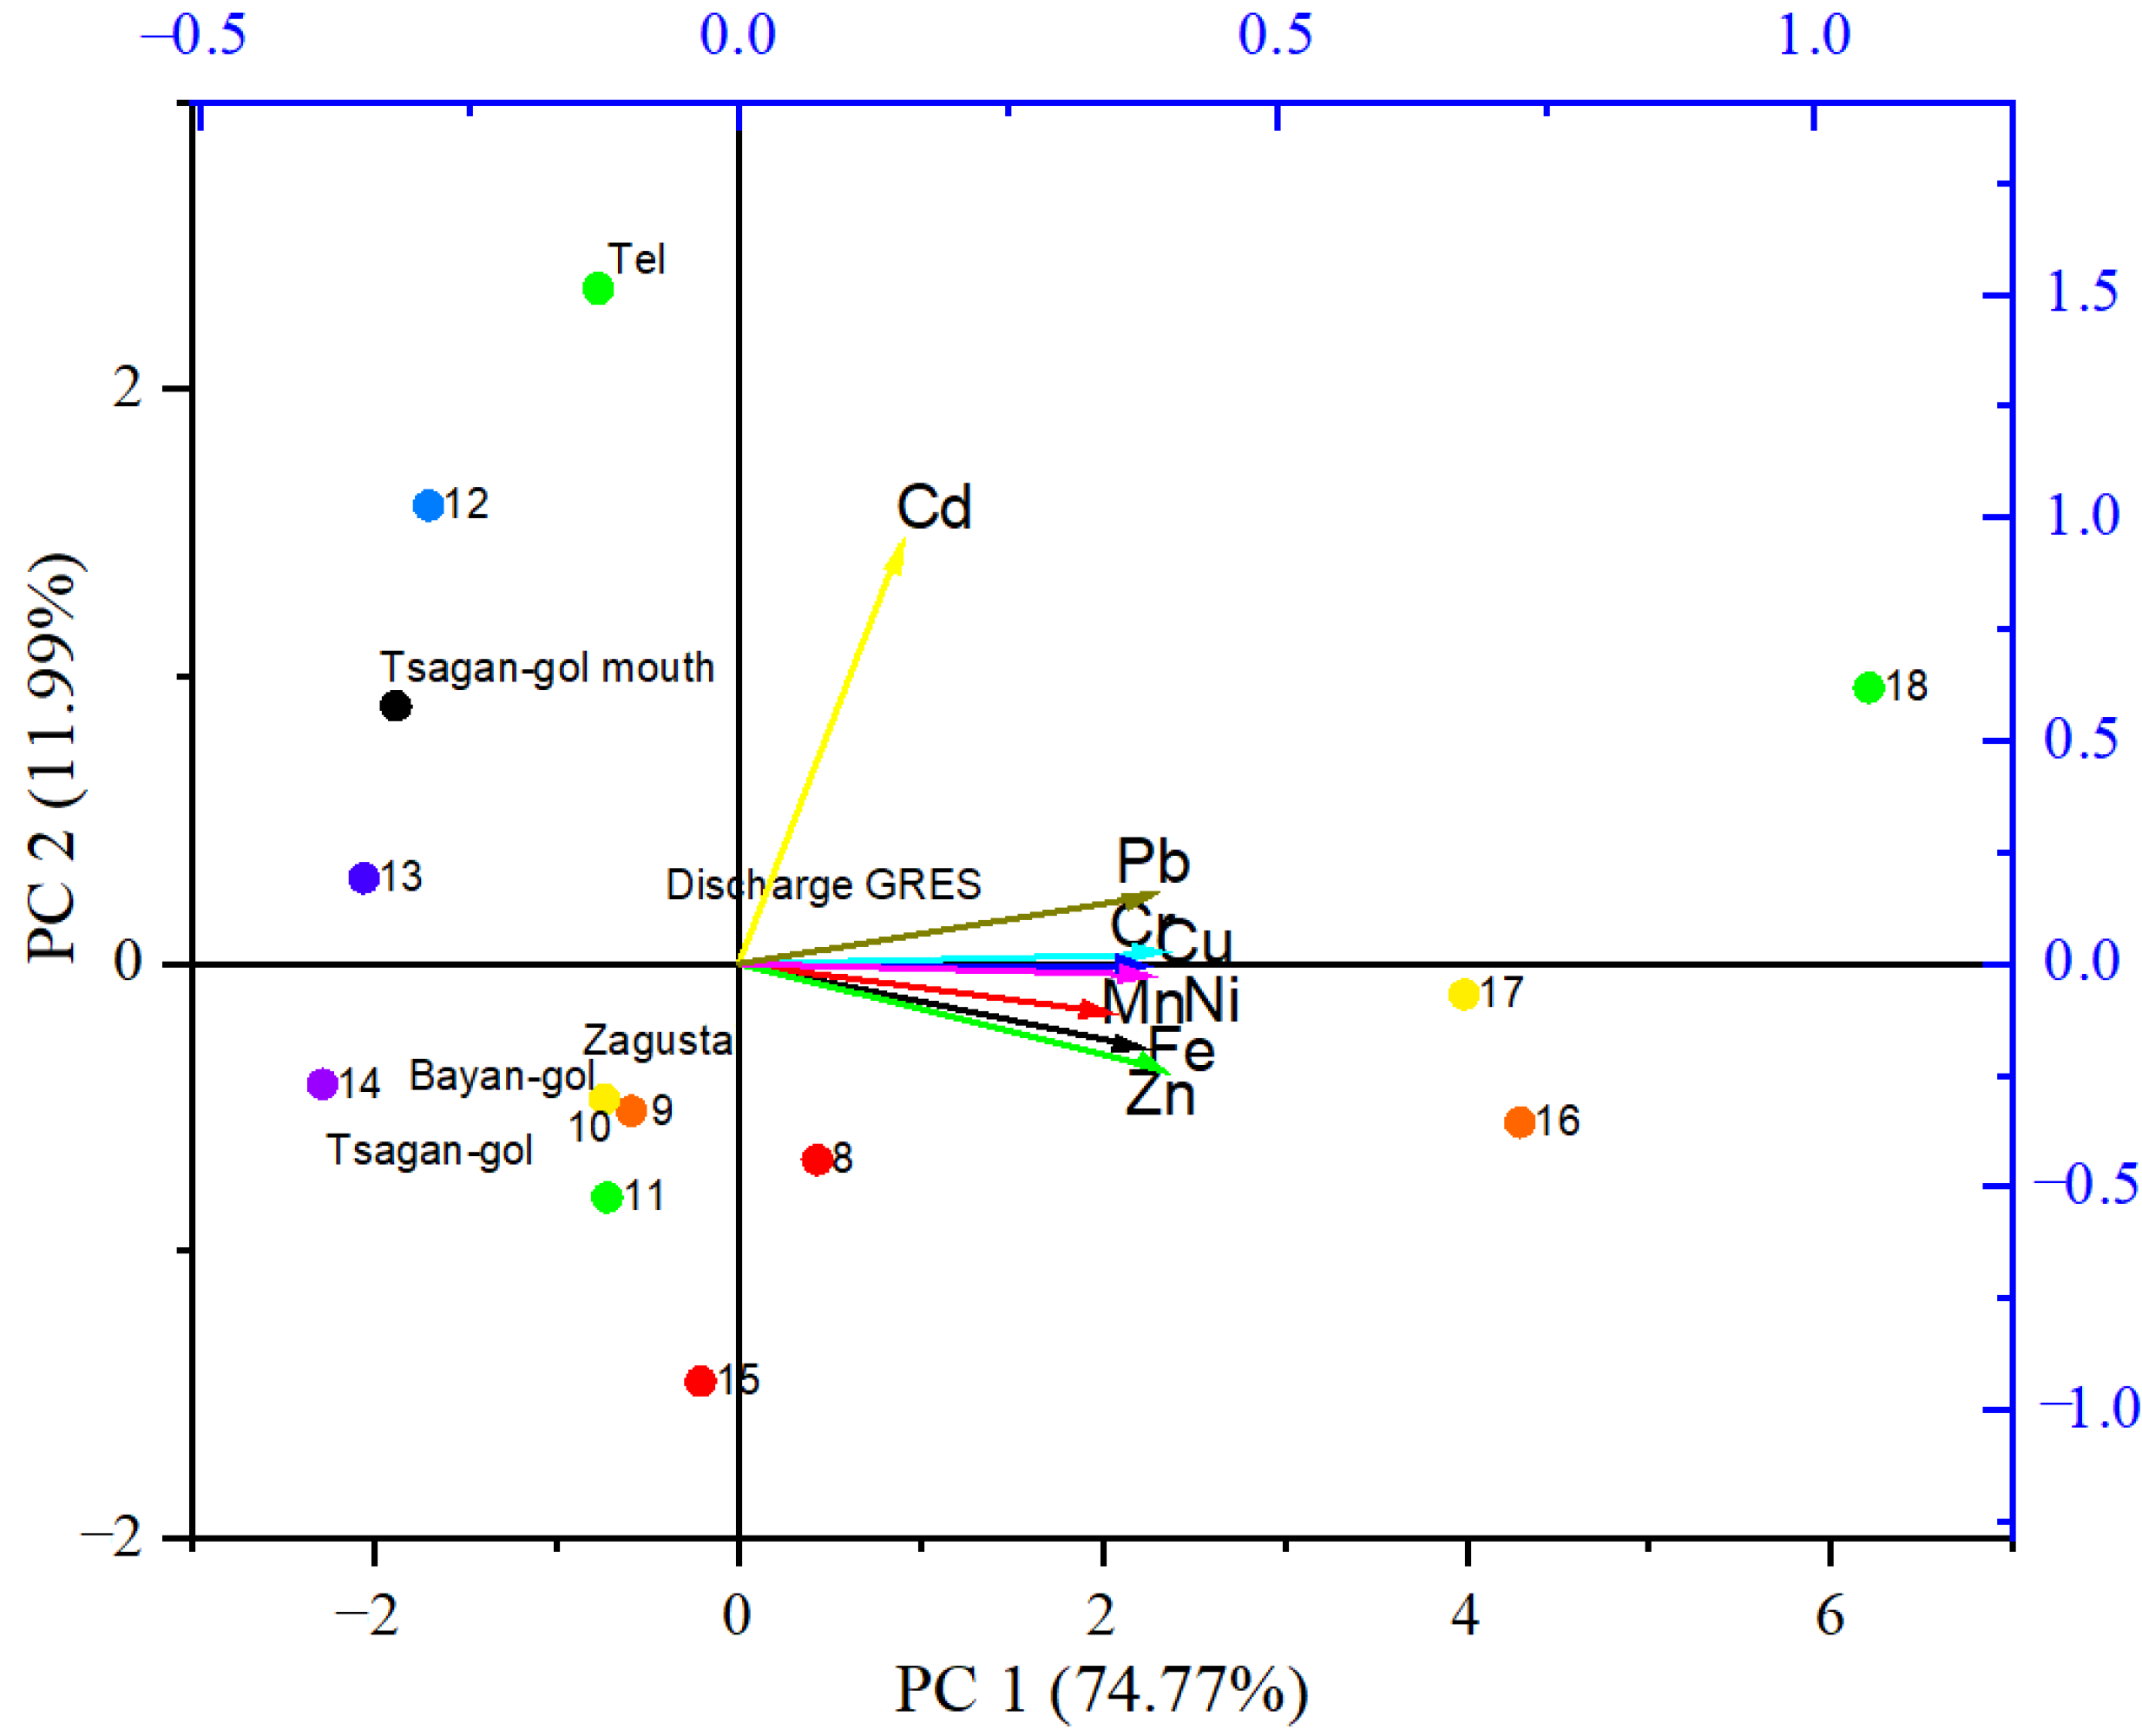
2.6. Statistical Analysis

Data on HM concentrations in water and BSs were analyzed using OriginPro software ver. 9.9 (OriginLab Corporation, Northampton, MA, USA). The analysis included Principal Component Analysis (PCA) and Correlation Matrix (CM) of HM concentrations in BSs, which were performed using OriginPro, ver 9.9. In addition, Surfer, ver. 21.2 (Golden Software, CO, USA) was used for the analysis of distribution of HMs in BSs. Microsoft Excel 2016 was used for all other calculations.

3. Results

3.1. Physicochemical Parameters of Water

Table S3 and Figure 2 show the physicochemical parameters of the water of Lake Gusinoe, such as temperature, pH, turbidity (NTU), DO, and mineralization. The water temperature in Lake Gusinoe varied during different seasons as follows: winter—0.1–12.0 °C, spring—3.4–14.9 °C, summer—12.6–23.0 °C, and autumn—11.8–22.0 °C. During the subglacial period, the water did not freeze in the vicinity of the warm water outflow from the GRES, and the temperature in the discharge channel remained above 10 °C. In winter, the Zagustai, Tel, and Tsagan-gol rivers are nearly frozen to the bottom, making sampling difficult. During the open water period, there was significant temperature variation in the lake basin. The lowest water temperatures were observed at the Tel inlet, and the highest temperatures were recorded at the GRES outfall and in the lake during the summer.
The pH values varied from 7.31 to 8.31 (winter), 7.32 to 8.36 (spring), 7.32 to 8.53 (summer), and 7.61 to 8.86 (autumn), with higher values observed in autumn compared to other seasons. Mineralization serves as an indicator of the salinity of the water. The results of chemical analysis of surface water samples collected from Lake Gusinoe and its main tributaries showed that during the subglacial period, water mineralization varied from 375.3 to 611.5 mg/L, while during the open water period, it varied from 58.6 to 882.7 mg/L, with the lowest and highest values observed in the lake’s tributaries. The distribution of ion concentrations within the lake basins during the open-water period was more uniform (312.1–362.6 mg/L) due to intensive volume mixing of the water. During the subglacial period, mineralization ranged from 370.5 to 396.2 mg/L.
The DO content in Lake Gusinoe remained within favorable limits for the livelihood of aquatic organisms, ranging from 7.35 to 15.21 mg/L. Interestingly, in the warm water discharge channel of the GRES, its content was slightly lower than that in the lake’s aquatic environment, attributed to the decreased oxygen solubility with increasing temperature. The lowest DO values were recorded at the mouth of the Tsagan-gol River, reaching 3.92 and 4.35 mg/L during the winter and summer seasons, respectively. Significant differences in DO values were observed between the subglacial and open water periods.

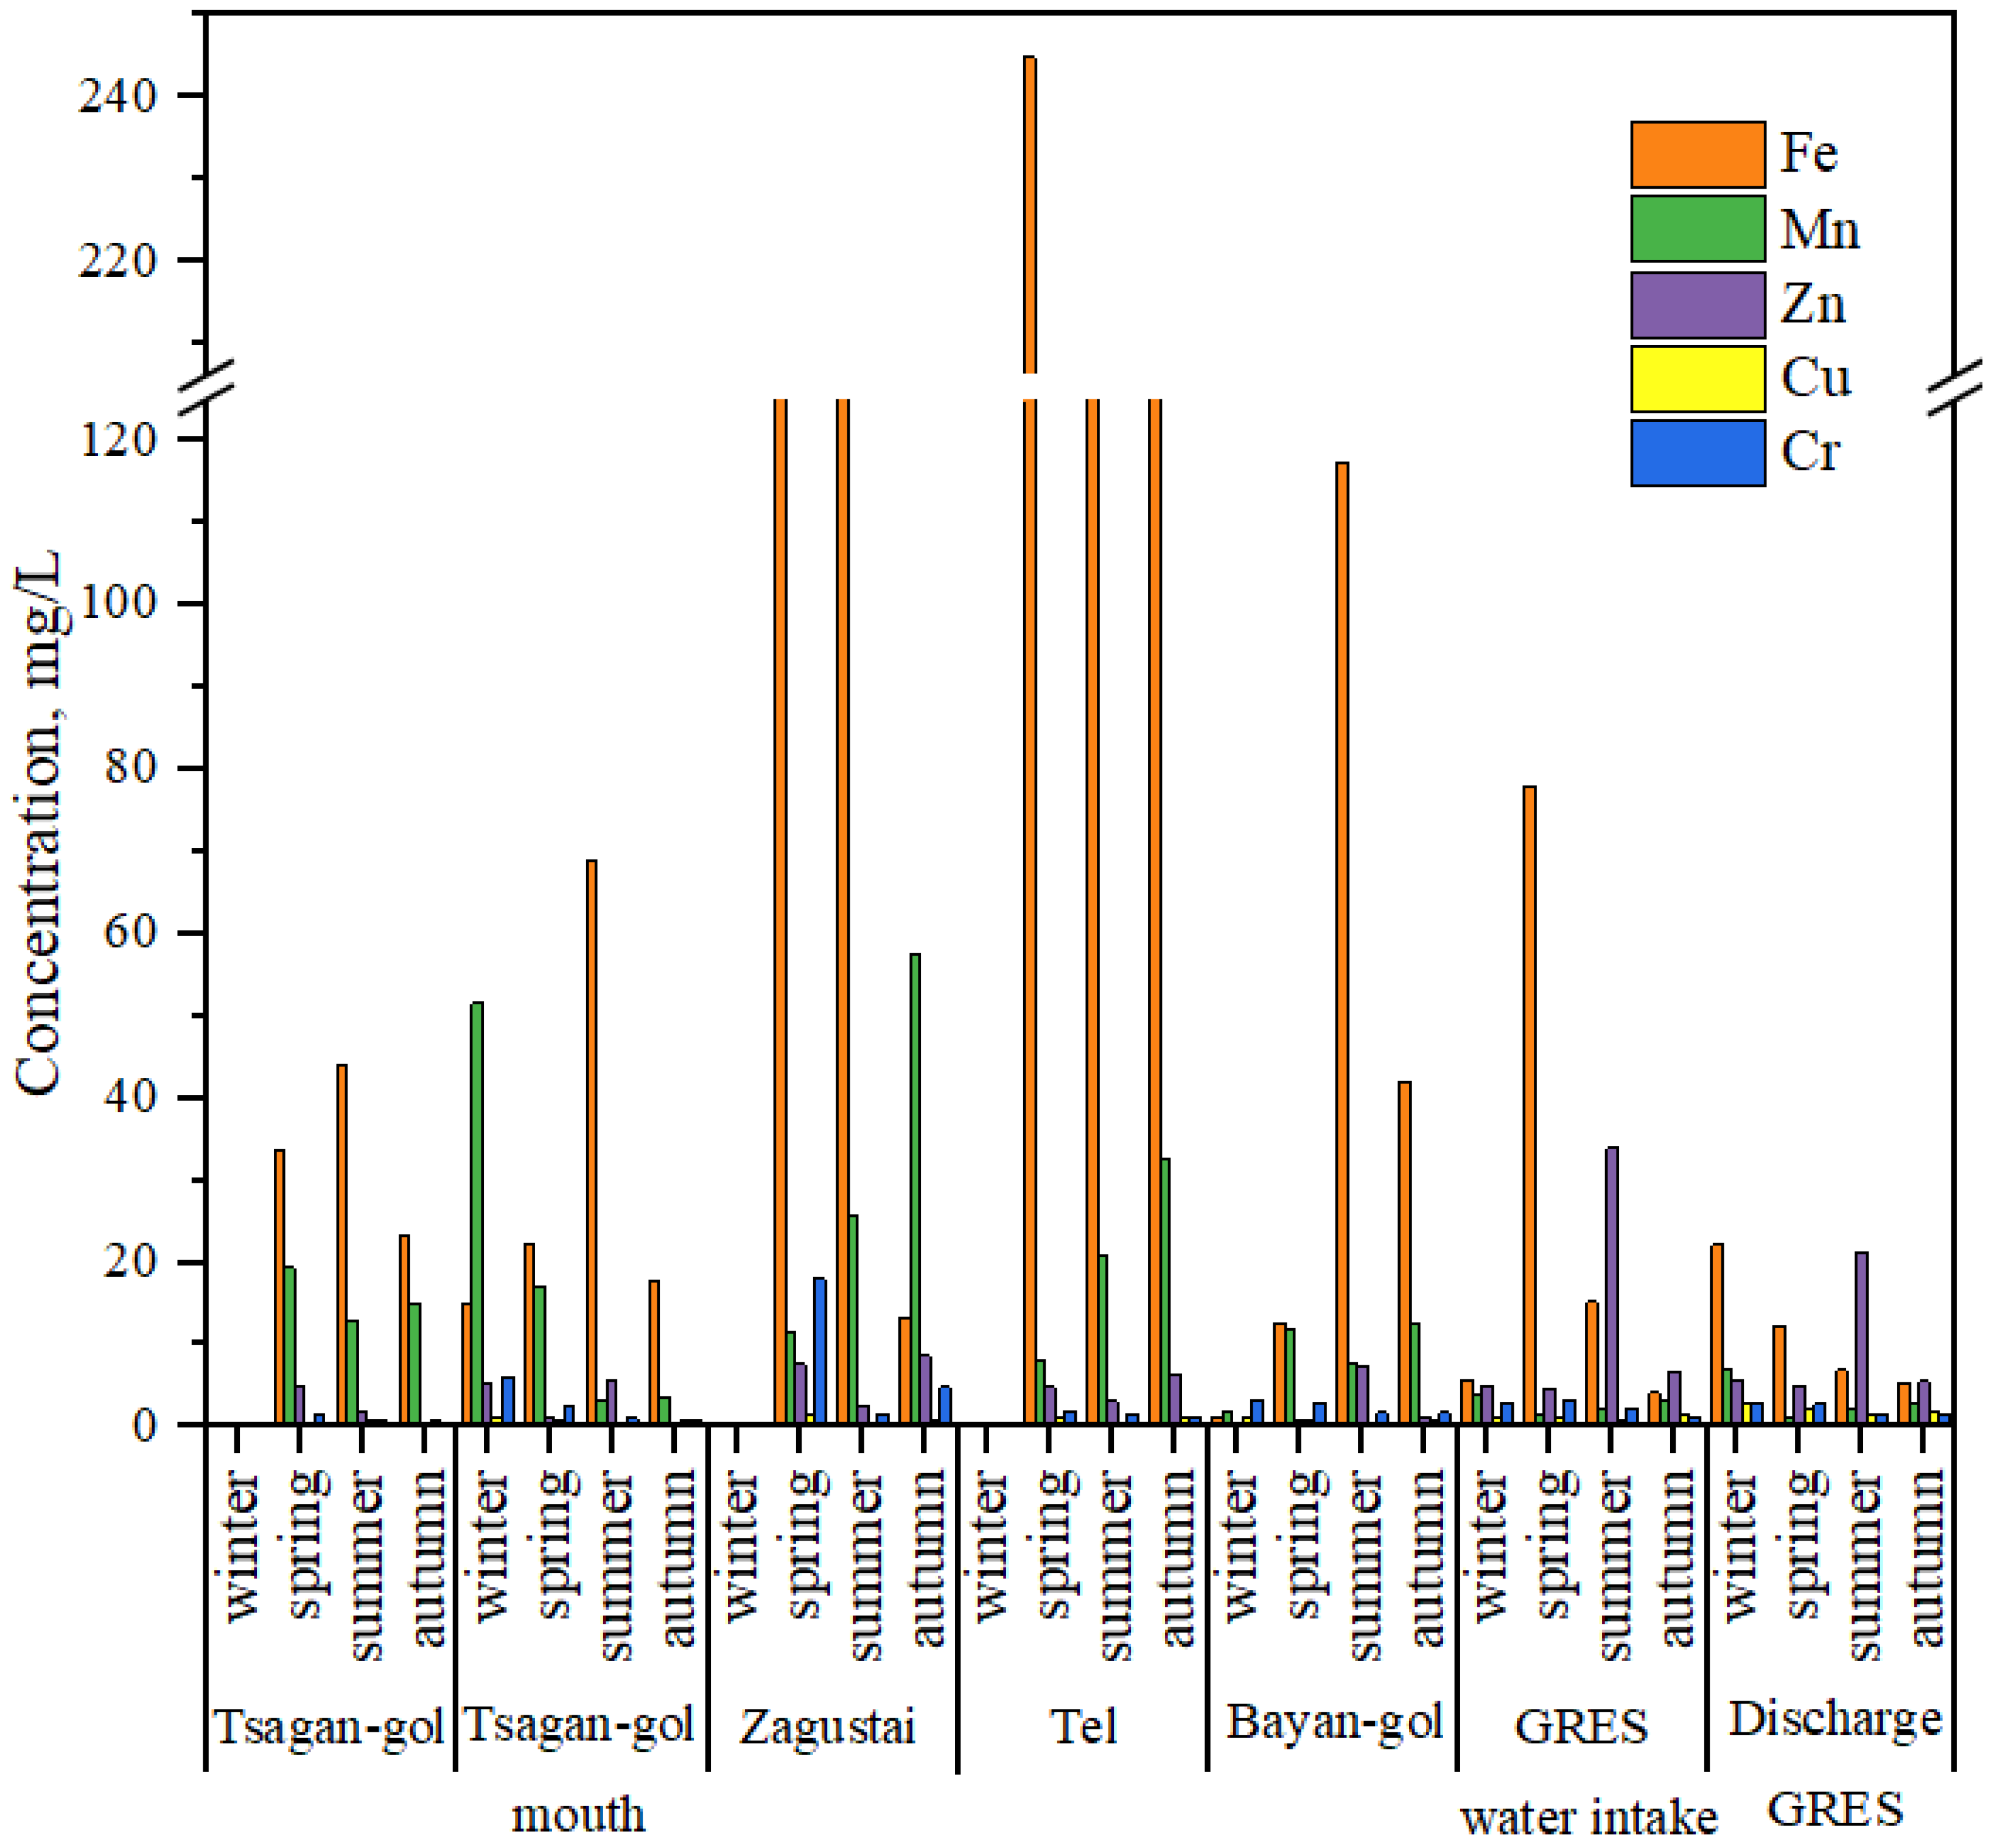
3.2. Concentration of HMs in Water

Table S4 shows the values of HMs concentrations in the surface waters of Lake Gusinoe and its tributaries. The content of iron, manganese, zinc, and copper in the aquatic environment of the lake in 2021 is shown in Figure 3. The average concentrations of the studied metals in the water of Lake Gusinoe in different seasons decreased in the following orders: Fe > Mn > Cr > Zn > Cu > Ni ≥ Cd ≥ Pb (winter); Fe > Mn > Cr > Zn > Cu > Ni > Cd ≥ Pb (spring); Fe > Zn > Mn > Cr > Cu > Ni > Cd > Pb (summer), Fe > Mn > Zn > Cr > Cu > Pb > Ni > Cd (autumn).
The analysis of the trace-element composition of the water showed that the iron content in the aquatic environment of the lake and its tributaries varied widely, ranging from 1.2 to 51.0 μg/L and from 1.2 to 244.8 μg/L, respectively.
The maximum levels of Fe were recorded in the Tel River tributary during the summer season, while in the lake-water area the highest values were observed during the subglacial period. The concentrations of Fe in all samples were lower than both the MACs, set by the WHO standard, 2004 (300 μg/L) and the Russian national standard (100 μg/L). The content of manganese in the lake water was lower, with the maximum values occurring in the northern and southern basins in winter, reaching up to 37.4 μg/L. In other seasons, the manganese content remained significantly below the WHO standard, 2004 (100 μg/L), but exceeded the Russian national standard (10 μg/L) in the northern basin during winter and spring.
The highest zinc concentrations were recorded during the subglacial period in the southern basin (up to 12.4 μg/L). Zinc concentration in all samples was an order of magnitude lower than the WHO standard, 2004 (4000 μg/L), and it exceeded the Russian national standard (10 μg/L) only at one site in the northern basin of the lake. Elevated copper content in the water was observed throughout the lake water area compared to the Russian national standard (1 μg/L), especially in spring when meltwater from the catchment area enters the lake.
Concentrations of nickel, cadmium, lead, and chromium in the water of Lake Gusinoe and its tributaries in 2020 were significantly lower than the permissible levels for fishing reservoirs and often below the detection limits. The highest concentrations of these metals were observed during the spring and rain floods, which could be attributed to the influx of pollutants from adjacent areas. In the past, Rosgidromet also reported copper, zinc, and occasionally iron contamination of the lake water.
The concentrations of HMs in the water of the tributaries of Lake Gusinoe and the Bayan-gol River are shown in Figure 4. The average concentrations of metals in the tributaries of Lake Gusinoe and the Bayan-gol River in different seasons of the year decreased in the following orders: Mn > Fe > Zn > Cr > Cu > Ni ≥ Cd ≥ Pb (winter); Fe > Mn > Cr > Zn > Cu > Ni > Cd ≥ Pb (spring), Fe > Zn > Mn > Cr > Cu > Ni > Cd ≥ Pb (summer), Fe > Mn > Zn > Cr > Cu > Ni > Pb > Cd (autumn).
In the Zagustai, Tel, and Bayan-gol rivers, the average iron content was highest in spring and summer, which is associated with the flushing of pollutants from adjacent surfaces and the influx of contaminated meltwater. The Zagustai and Tel rivers, which flow near the GRES ash dumps, were characterized by consistently high iron and manganese contents.

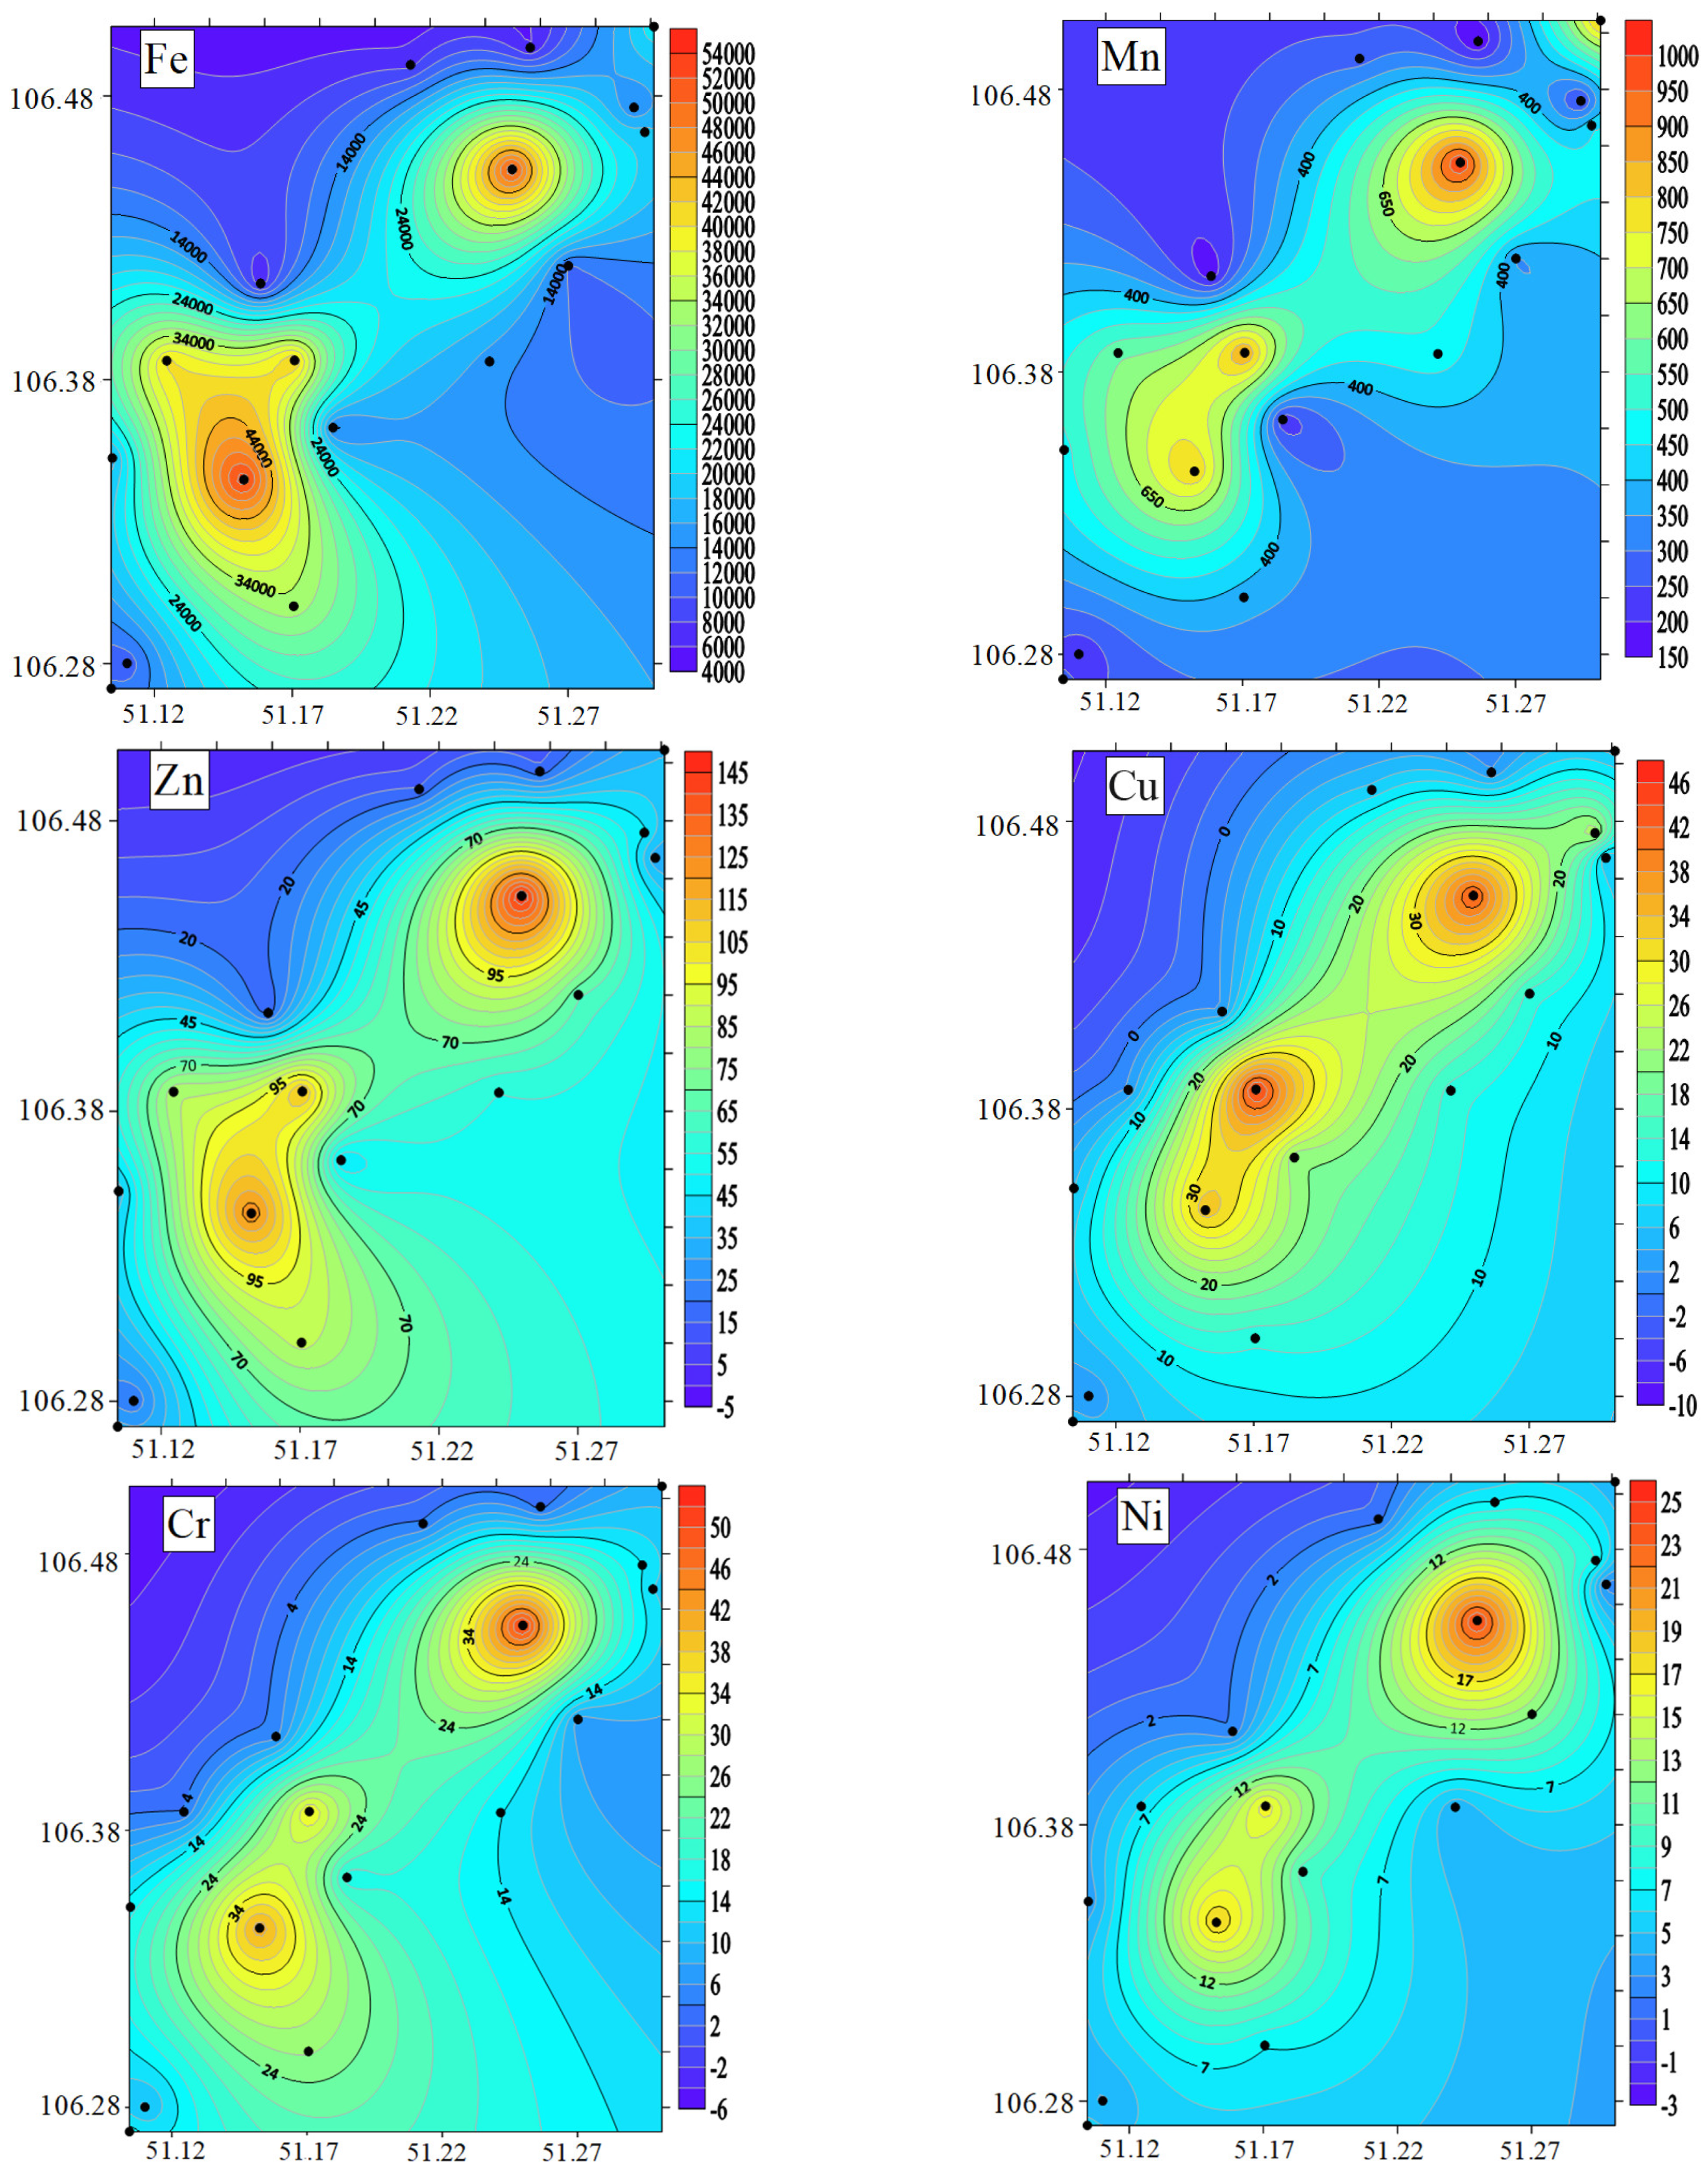
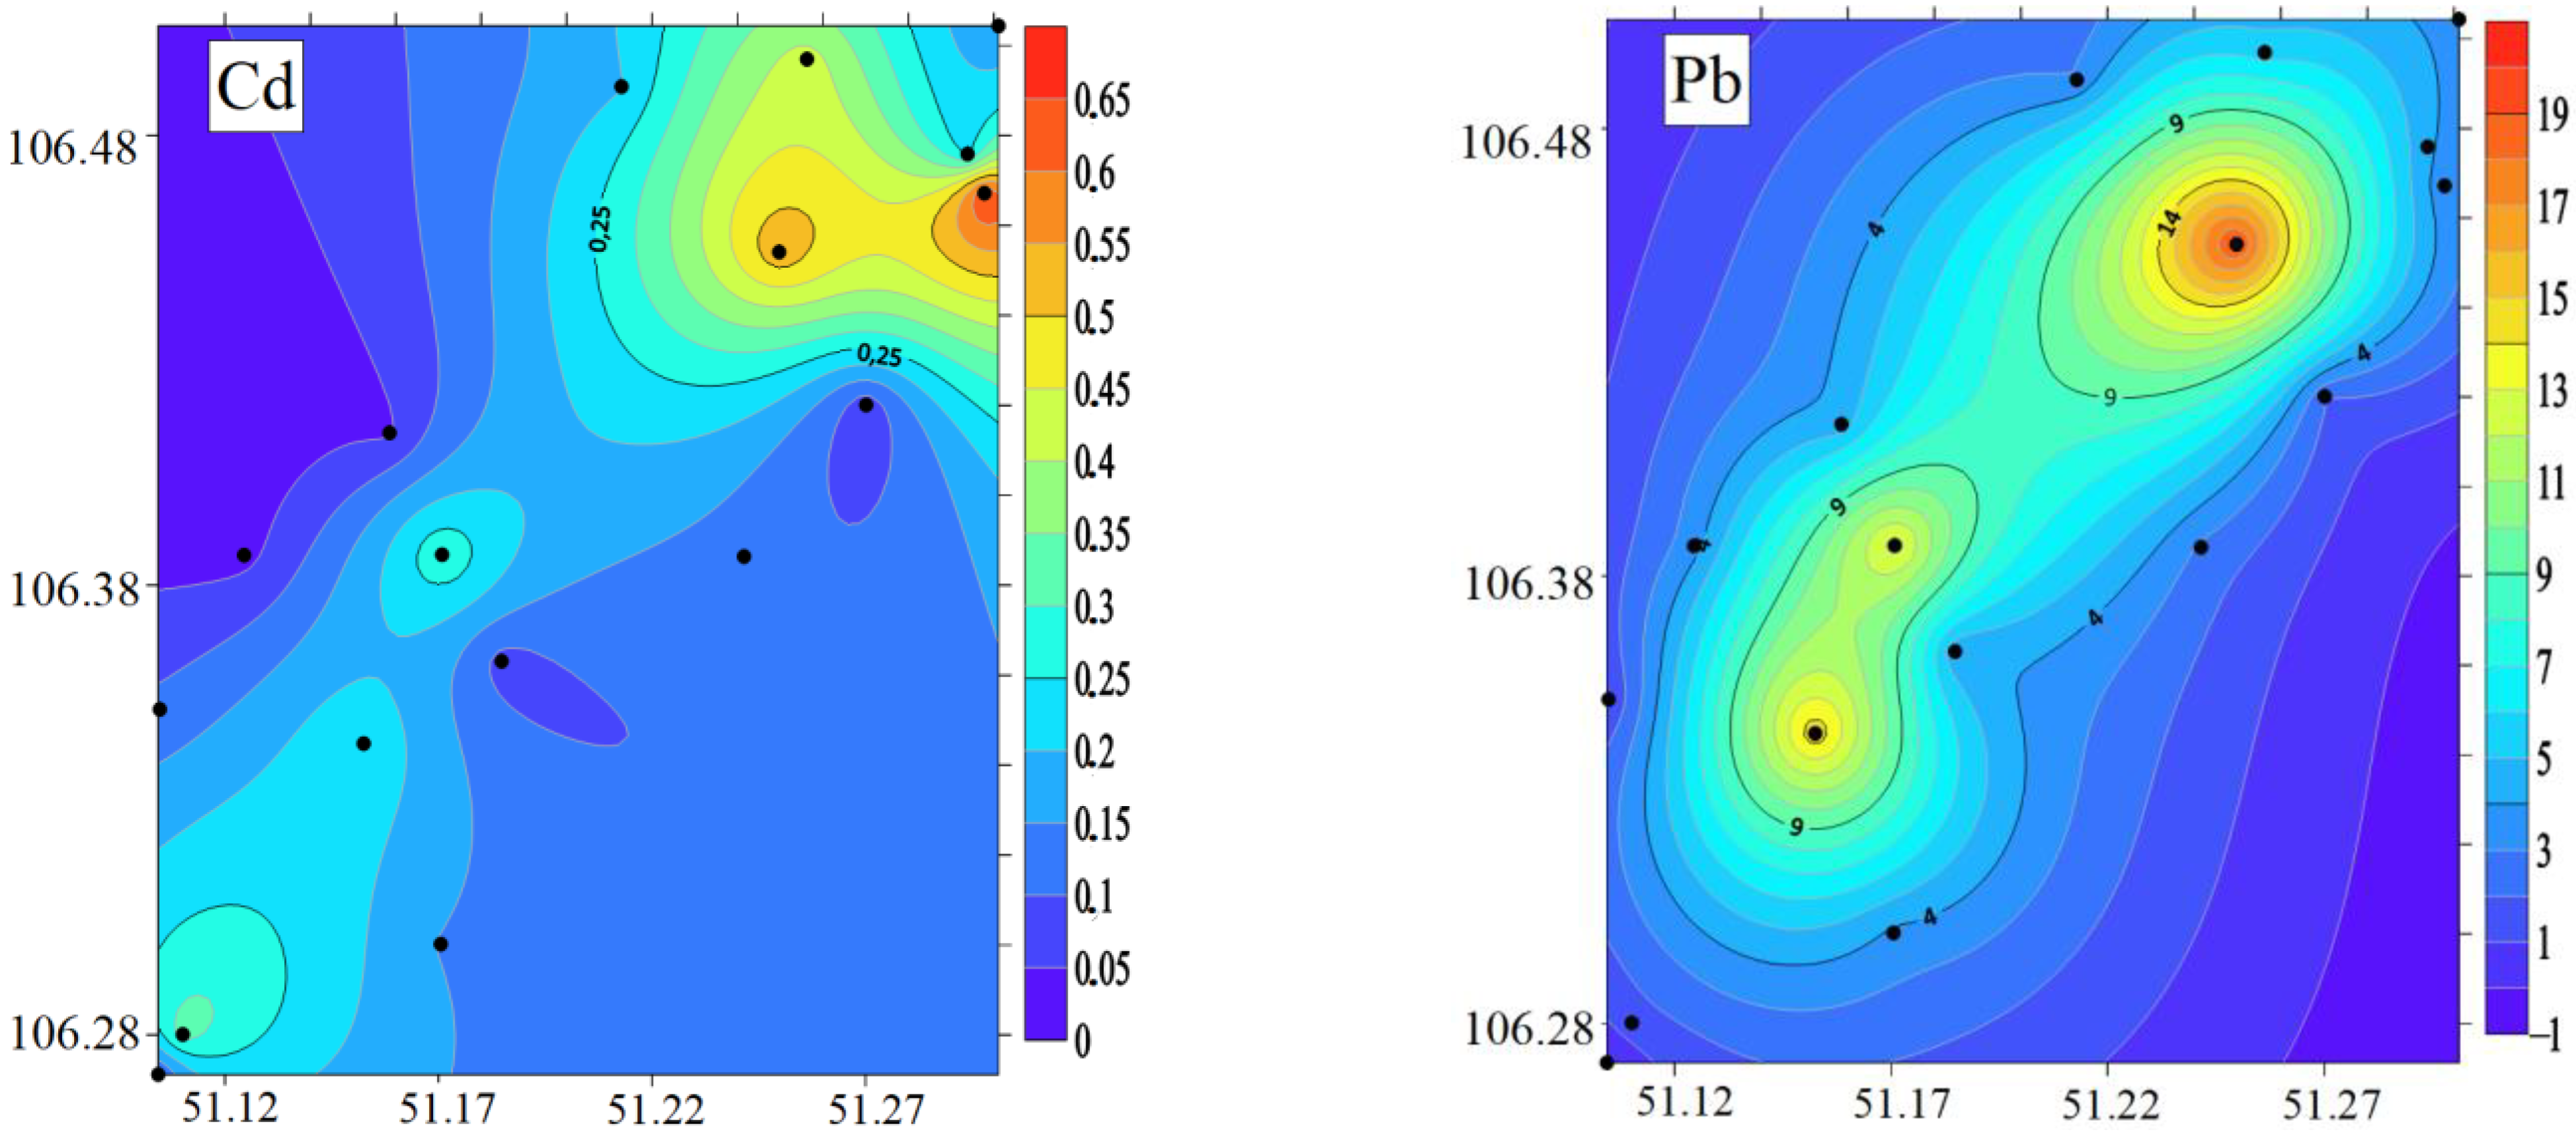
3.3. Concentration of HMs in the BSs

In this study, for the ecological assessment of the BS samples collected at the sampling sites, we compared the laboratory analysis data with the baseline concentration of HMs in the Earth’s crust [36]. In 2021, the HM content of BS samples from the main tributaries of the lake and the water area of the lake was determined. No significant seasonal variations in the concentration of HMs in the BSs were observed, so the average concentrations are presented in Table 3.
The Lake Gusinoe basin showed a wide range of HM concentrations. The average concentration of HMs in the BS samples from the water column of the lake decreased in the following order: Fe > Mn > Zn > Cr > Cu > Ni > Pb > Cd. The content of iron in the BSs of the water area of the lake, both in the southern and northern basins, exceeded the background values of iron (47,200 mg/kg) and reached up to 53,588 mg/kg. The concentration of manganese in the BSs of the water area also exceeded the background values (850 mg/kg) in the northern basin and the central part of the lake, reaching up to 1015.67 mg/kg and 874.67 mg/kg, respectively.
The concentration of manganese that approached the MAC was recorded in the BSs of the Zagustai River (846.33 mg/kg). Zinc content in the BSs of the water area exceeded the MAC values for the northern, central, and southern parts of the lake, reaching up to 147.00, 112.67 and 125.33 mg/kg, respectively. In the inflowing rivers and in the Bayan-gol River, the concentrations in the BSs were significantly lower than the MAC. The concentration of copper in BSs in the northern and central parts of the lake reached the upper limits of the range of background concentrations, while they remained low in the inflowing rivers. Concentrations of chromium and nickel did not exceed background levels at any of the sampling sites. Cadmium concentrations exceeded the MAC (0.3 mg/kg) in the northern basin (0.54 mg/kg) and in the Tel River (0.66 mg/kg). Lead in sediments approached background levels (20 mg/kg) in the water area of the lake (ranging from 2.83 to 19.45 mg/kg), but was significantly lower in the tributaries and in the Bayan-gol River.

3.4. Pollution Assessment

The calculations of the non-carcinogenic risk of water consumption by the local population for Lake Gusinoe in 2021 are shown in Table 4. The obtained values of hazard quotients, as well as the hazard index for all investigated HMs in the lake water area, were significantly lower than 0.1, which corresponds to the minimal, negligible risk in water consumption by the population.
To assess the degree of contamination in the BSs, the enrichment factor (EF) was calculated. Table S5 shows the EFs for metals in the BSs relative to iron, which was chosen as the standard. The EFs for the investigated metals decreased in the following order: Cd > Zn > Mn > Cu > Pb > Cr > Ni. The average EFs for the Lake Gusinoe basin ranged from 0.47 to 3.93. The maximum EF value for Cd in the Tel River was 8.17, while the lowest EF was 0.12 (at sampling points 1–9). In all investigated BS samples, the EF did not exceed the ‘moderate enrichment’ degree (Figure 5).
Contamination factor (CF) values for Cr, Ni, and Pb were low (CF < 1) at all sampling sites investigated. Fe, Mn, and Zn showed moderate levels of contamination at three sampling sites (Table S6), while Cu showed moderate levels of contamination at only one sampling site. The highest CF value was observed for Cd in the Tel River. Overall, the average contamination levels decreased in the following order: Cd > Zn > Mn > Fe > Cu > Pb > Cr > Ni.
The values of the pollution load index (PLI) in the BSs are presented in Figure 6. The average PLI values were below 1, indicating the uncontaminated condition of the BSs in the Lake Gusinoe basin. The highest PLI value was recorded in the northern basin of the lake at sampling point 4–9.
The geoaccumulation index (Igeo) is a universal indicator used to assess the contamination of BSs with HMs. The calculated mean values of Igeo indicated that the BSs in the Lake Gusinoe basin were uncontaminated (Igeo < 0) for all studied HMs (Table S7). The values of Igeo for the investigated HMs are shown in Figure 7. The average Igeo values for the HMs decreased in the following order: Cd > Zn > Mn > Fe > Cu > Pb > Cr > Ni.
Table S8 shows the results of the determination of the potential ecological risk factor (Er) and the potential ecological risk index (RI). The Er values for Fe, Mn, Zn, Cu, Cr, Ni and Pb were less than 40 in all investigated samples, indicating a low level of ecological risk. Only for Cd does the ER value in the Tel River and the northern basin indicate a moderate risk (40 < ER < 80). Considering the Ecological Risk Index (Er), all sampling sites in the Lake Gusinoe basin were associated with a low risk (Table S8).

4. Discussion

This section discusses the findings of our study on the distribution of HMs in the water and BSs of Lake Gusinoe. It highlights the importance of monitoring the physicochemical parameters of water, the impact of the contamination on environmental health, and the potential effects on aquatic ecosystems. It also includes a thorough risk assessment of priority water and BS contaminants—heavy metals—allowing for informed management decisions to safeguard the health of the water ecosystem.

4.1. Physicochemical Parameters of Water

The use of Lake Gusinoe as a cooling pond for the GRES has led to significant variations in several physicochemical water parameters, primarily water temperature. These variations have notable implications for the aquatic ecology. During the winter, at the discharge point where the water is released after cooling the power plant (GRES) turbines, the water temperature rises to 12 °C, preventing freezing and forming an open water patch [16].
For these reasons, disturbances of the gas regime are frequently observed in the lake water, although the oxygen concentration in the water remains relatively high even during the subglacial period (13.19–14.25 mg/L) due to the presence of submerged aquatic vegetation. Elevated oxygen levels during the subglacial period are also noted in [54].
In contrast, during summer, there is an influx of water caused by abundant rainfall, which can increase DO levels in the water. The rise in DO hinders the discharge of nutrients from the riverbed and results in a swift reduction in algal biomass within the river ecosystem [55,56,57]. However, elevated summer temperatures are a counteracting factor, leading to a decrease in DO levels due to increased oxygen consumption by aquatic organisms and accelerated decay of organic material.
The lowest levels of mineralization throughout the water area of Lake Gusinoe were observed near the village of Gusinoe Ozero, which can be attributed to the influence of low-mineralized water from the Tsagan-gol River. The seasonal dynamics of mineralization showed a winter peak and approximately constant values during the open-water period. The same specifics for the point near the influence of the Tsagan-gol River and similar seasonal dynamics were reported previously in [23].
The water parameters such as temperature, pH, and redox conditions of the environment exhibited the most significant variations among the sampling points throughout the water area of the lake, as revealed by Principal Component Analysis (PCA). We identified the following patterns, as described below and shown in Figure 8. Sampling points located in the upper right part of the plot were characterized by higher annual average DO levels and higher annual pH values. Elevated pH values could be attributed to the activity of cyanobacterial blooms, which are known to flourish during the summer period [58]. In contrast, the samples from the inflows and outflows of the lake were positioned in the lower left part, indicating higher variability in physicochemical parameters. The marker of the outflowing Bayan-gol River was relatively closer to the samples from the lake’s water area due to its similarity in parameter values, while the least mineralized inflow of the lake—the Tsagan-gol River—was positioned further away from the lake’s water area samples due to significant parameter differences (especially in annual mean turbidity and temperature values). The sampling point near the GRES discharge was closely associated with the temperature axis, as this parameter significantly distinguished this point from other samples. The sampling point in the Tel River (upper left part of the plot) was isolated in proximity to the turbidity axis, indicating high turbidity values in the water samples from this location.

4.2. HMs in Water

The content of HMs in natural waters is an important indicator of environmental pollution. Metal compounds play an essential role in the chemical composition of surface waters due to their specific properties in the aquatic environment, such as multivalency, high reactivity and biological activity. These characteristics make metals integral participants in almost all physical, chemical, and biological processes in aquatic systems.
The analysis of the HM levels in the water carried out in 2021 revealed an increase in the iron content during spring floods and rain events due to leaching from adjacent areas, occasionally exceeding the MAC (100 μg/L). Manganese content increased during the subglacial period, possibly due to decomposition of aquatic vegetation and influx from groundwater sources [59]. The increase in the water level of Lake Gusinoe, as well as the increase in the groundwater level in 2019–2020 and rain-induced flooding, contributed to the increase in manganese and iron contents in the water during this period. For other elements, maximum concentrations were observed during the subglacial period, possibly due to their influx from underground horizons [60]. Elevated copper concentrations exceeding regulatory standards were detected throughout the water area of the lake.
The distribution of HMs throughout the water area was relatively uniform during the open-water period due to wind-induced mixing. During the subglacial period, higher concentrations of HMs were observed in the areas influenced by the GRES, the municipal sewage of the city of Gusinoozersk, and the village of Gusinoe Ozero. The same dynamics were reported previously [15]. In addition, higher HM levels in deep water layers seem to be typical [61].
During the whole observation period, copper pollution was frequently recorded (low and moderate pollution levels: 2–3-fold exceedances of the MAC, observed in 50% of samples). Zinc pollution was unstable (exceeding the MAC in 10–30% of samples), but at low levels (1–2-fold exceedances of the MAC). Water pollution by copper, zinc and, periodically, iron was also noted in previous observations by Rosgidromet [27]. For manganese, nickel, and chromium, no exceedance of the MAC was observed.
The distribution patterns of the studied HMs in the waters of the Lake Gusinoe basin (Figure 9) were revealed using PCA [62]. The highest fluctuations in HM concentrations were observed in water samples from the tributaries of Zagustai, Tel, and Tsagan-gol, which was attributed to a significant anthropogenic load and leaching of pollutants from nearby industrial areas [16,23]. According to the PCA plot, the points corresponding to the Zagustai and Tel rivers showed the greatest variations in the concentrations of Cr, Fe, Ni, and Mn during the open-water period.
At point 12 and the Tsagan-gol, slight increases in lead concentrations were observed during the open-water period (the Pb axis on the PCA plot is located near these points). Both points are located near large settlements, namely the city of Gusinoozersk and the village of Gusinoe Ozero, respectively. The elevated concentrations of HMs during the subglacial period near Gusinoozersk and the village of Gusinoe Ozero are attributed to the inflow of wastewater.
On the other hand, water samples from the lake’s water area showed lower concentrations and variability of HMs (points located in the lower left part of the plot). The elevated manganese content in the northern basin could also be related to its release from decaying aquatic vegetation, which is abundant in the influence zone of the warm water discharge from the GRES. The pollutants from the coal ash dumps located on the southeastern shore of the lake (as well as from the ash dumps and industrial sites of the GRES) are washed away and infiltrate the groundwater and reach the lake during heavy rains and snowmelt periods.

4.3. Heavy Metals in BSs

Accumulation of HMs in BSs poses a threat to water quality due to potential secondary pollution, when HMs are released from the sediments into the water. The BSs of Lake Gusinoe consist of clayey silt (gray and black silt), shell debris, and less frequently sand with gravel and mixed soils [13]. The distribution of BSs in the lake is as follows: near the shore, sandy-aleuritic sediments are formed, transitioning to finer-grained aleuropelitic sediments further from the shore. Thus, the lake shows a vertical zonation in the distribution of the BSs. Analysis of the obtained data on the content of HMs in the BS of Lake Gusinoe showed that the greatest accumulation of HMs occurs in the deep parts of the lake, where a higher content of organic matter (6.01–9.58%) is characteristic [15]. Organic matter has the ability to bind HMs. Conversely, the coastal areas of the lake are dominated by sandy BSs (over 90%) and contain low organic matter content (0.07–0.84%), leading to lower concentrations of HMs in the BSs. A similar pattern with reduced organic matter content in sandy BSs in Lake Gusinoe was reported in [63].
In the deep BSs, concentrations of iron, manganese, zinc, copper, cadmium, and lead reached or sometimes exceeded background levels. This effect agrees well with another study that found that greater water depth corresponded to greater HM content in BSs [41]. The sandy BSs in the coastal zones of the lake showed significantly lower concentrations of HMs. On the other hand, muddy BSs are known to have higher HM adsorption rates [42]. Principal component analysis of the BS samples revealed that the greatest variations in HM concentrations in Lake Gusinoe were observed at sites 16, 17, and 18, located in the central basins of the lake, which are characterized by muddy bottoms and significant accumulation (Figure 10).
The spatial distribution of HMs in the BSs of the Lake Gusinoe basin was determined on the basis of their concentrations using Surfer, ver. 21.2 (Golden Software, CO, USA) (Figure 11). The spatial distribution of each HM showed that the main hotspots of the studied metals (except cadmium) are concentrated in the centers of the basins (points 16, 17, and 18), which can be explained by the structure of the BSs. This is observed to a greater extent in the center of the northern basin, except for iron, which is more concentrated in the southern basin.
The sources of Zn, Cu, and Ni are probably the Gusinoe Ozero railway station, the Gusinoozersk mine (now closed), and artillery shell fragments scattered over the area as a result of the explosion of ammunition depots at the Gusinoe Ozero station in the early 2000s [62]. Artillery shells are made of brass, an alloy of copper (68%) and zinc (32%). The remnants of the shells that reached the lake bottom are likely to undergo corrosion processes, leading to the accumulation of HMs in the lake BSs at this site.

4.4. Pollution Assessment

The risk assessment of various environmental factors allows the identification of priority contaminants and the making of informed management decisions for the benefit of public health. Studies conducted in various regions of Russia [64,65] and other countries [50,66] indicate the existence of health risks associated with drinking-water quality.
Lake Gusinoe serves as the main source of domestic drinking-water supply for more than 31 thousand inhabitants of the city of Gusinoozersk, as well as the village of Gusinoe Ozero, Baraty, Murtoi station, and several coastal bases and stations. At the same time, the lake receives treated domestic wastewater from the biological treatment plant of Gusinoozersk, as well as untreated wastewater from the village of Gusinoe Ozero. The treatment plants use mechanical and biological purification processes, followed by chlorination before the water is discharged back into the lake.
BSs are one of the most informative components of aquatic ecosystems when conducting environmental assessments, as they can serve as a source of secondary water pollution. The analysis of HMs in BSs of water bodies is indispensable for the prevention of environmental hazards [67,68].
For a clear comparison of the values of the ecological risk index in the Gusinoe basin, Table 5 shows both the mean values and the values indicating the risk at each investigated point. The level of contamination of all studied metals in all points of the Gusinoe basin was below 6, except for the central points 16, 17, 18 and the Tel River (in terms of Cd levels).
The moderate level of contamination observed in the central basin of the lake is connected with the peculiar distribution of the BSs and their vertical zonation. The greatest accumulation of metals occurs in the deep parts of the lake, where the sediments are characterized by a higher content of organic matter compared to the sandy-aleuritic deposits in the coastal zone. The Pollution Load Index values in the Gusinoe basin were significantly lower than 1 at most points, indicating low pollution. However, the PLI values in the central basin of the lake (points 16, 17 and 18) were close to 1, indicating a pollution of the BSs in these areas.
A similar pattern was observed for the enrichment factor (EF), where the central points corresponded to “moderate enrichment” for all HMs. Specifically, the EF for Cd was “above moderate” at points 18, 12, and the Tel River. The EF was used to assess the degree of contamination of BSs. The EF can be a valuable tool in identifying the sources of metals because both anthropogenic and natural sources are included in the EF [69,70].
The geoaccumulation index (Igeo) was calculated to assess metal contamination in the BSs of the Lake Gusinoe basin. The calculated mean values of the Igeo showed that the BSs of the Lake Gusinoe basin were classified as “uncontaminated” (Igeo < 0) for the studied metals in most samples, with the exception of Cd accumulation in the Tel River (Igeo = 0.55) and points 4–9 (Igeo = 0.26), corresponding to the “uncontaminated”—“moderately contaminated” interval.
The research showed that the potential ecological risk index (Er) for the majority of metals was low, indicating a low risk. Only cadmium had a higher Er index value, indicating a “moderate risk”. The potential ecological risk index was “low risk” for all samples.
The elevated level of Cd in the BSs of the Tel River is primarily associated with anthropogenic pollution, originating from the discharge of ash dumps and industrial areas of the Gusinoozersk GRES. Cadmium enters surface waters and subsequently accumulates in BSs [71]. It is important to emphasize that Cd (in excessive concentrations) is highly toxic, especially for human health [72].
There are various methods to remediate contaminated and degraded soil near ash dumps and industrial areas, which include phytoremediation, as well as the use of mulch, lime, biosolids, and fly ash as soil conditioners. Other technologies, such as adsorption, biodegradation, and in situ chemical oxidation, are available for soil remediation and pollutant removal [28,29,30].
A combination of biochar and phosphate solubilizing bacteria are among the new promising methods that can be used to remove some heavy metals (such as cadmium and lead) from the GRES industrial wastewater, ash dumps, and for soil remediation [40,41,42].

5. Conclusions

The peculiarities of HM input, distribution, and accumulation in the water of Lake Gusinoe have been determined. It was shown that the input of HMs into the water is attributed to leaching from adjacent territories, including urban areas, abandoned coal mine dumps, and ash dumps of the Gusinoozersk GRES (a thermal power plant). Exceedances of the MACs for iron were observed in the Zagustai and Tel inflows, and in the Bayan-gol outflow; for manganese they were observed in all inflows, in the Bayan-gol outflow, and in the water area of the lake (points 8 and 9). Exceedances of the MACs were observed for zinc in the vicinity of the GRES, and for copper at all sampling sites. However, there were no exceedances of the MACs for chromium, nickel, cadmium, and lead throughout the basin. In the present study, concentrations of copper, chromium, nickel, and lead in BSs were low. Concentrations of iron, manganese, and zinc exceeded background levels at points 16, 17, and 18. In addition, cadmium levels in the Tel River and at point 18 exceeded background levels by a factor of 2.
The distribution of HMs in the water and BSs of the lake was analyzed using PCA. It was shown that the distribution of HMs in the water is influenced by the anthropogenic load on the lake and its basin, while in the BSs their distribution is determined by the sediment structure. The use of several ecological risk indices gives more comprehensive and comparable results. Consequently, the water hazard index indicated a low risk for all samples. The Enrichment Factor and Contamination Factor indicated low contamination of the BSs, except for the central points in the water area of Lake Gusinoe.
The values of the pollution load index (PLI), geoaccumulation index, and ecological risk factor indicated a low ecological risk for all investigated metals in the Lake Gusinoe basin. However, since Lake Gusinoe serves as the sole source of water supply for Gusinoozersk, it may become unsuitable for domestic water use in a few years. Therefore, the preservation of Lake Gusinoe is of vital importance for the city and the settlements located along its shores.

Supplementary Materials

The following supporting information can be downloaded at: https://www.mdpi.com/article/10.3390/w15193385/s1, Table S1. Basic concentration of metals in the Earth’s crust. Table S2. Toxic-response factor values of toxic metals by Hakanson. Table S3. Physicochemical parameters of the water of Lake Gusinoe basin. Table S4. HMs concentrations in the surface waters of Lake Gusinoe and its tributaries. Table S5. Enrichment factor for HMs in BSs collected in the Lake Gusinoe basin, Russia. Table S6. Contamination factor (Cf) and contamination degree (Cd) for HMs in BSs collected in the Lake Gusinoe basin, Russia. Table S7. Geoaccumulation index (Igeo) of HMs in sediments collected from the Gusinoe Lake basin, Russia. Table S8. Ecological risk factors (Er) and potential ecological risk indices (RI) for HMs in BSs collected in the Lake Gusinoe basin, Russia. References [73,74] are cited in the supplementary materials.

Author Contributions

Conceptualization, T.Z.B. and V.G.S.; methodology, T.Z.B. and V.G.S.; software, T.Z.B.; formal analysis, E.P.N., S.V.B., G.S.S. and P.W.; investigation, T.Z.B. and V.G.S.; resources, E.P.N. and S.L.; data curation, T.Z.B. and V.G.S.; writing—original draft preparation, T.Z.B., V.G.S. and Z.L.; writing—review and editing, L.D.R., P.W., Z.L. and S.D.; visualization, T.Z.B., V.G.S. and S.D.; supervision, L.D.R. and S.D. All authors have read and agreed to the published version of the manuscript.

Funding

This research was supported by the Key Collaborative Research Program of the Alliance of International Science Organizations (Grant No. ANSO-CR-KP-2020-02) and within the framework of the state assignment to Baikal Institute of Nature Management SB RAS.

Data Availability Statement

Not applicable.

Acknowledgments

Research was conducted using equipment of the Research Equipment Sharing Center of BINM SB RAS (Ulan-Ude, Russia).

Conflicts of Interest

The authors declare no conflict of interest. The funders had no role in the design of the study; in the collection, analyses, or interpretation of data; in the writing of the manuscript; or in the decision to publish the results.

References

  1. Zamora-Ledezma, C.; Negrete-Bolagay, D.; Figueroa, F.; Zamora-Ledezma, E.; Ni, M.; Alexis, F.; Guerrero, V.H. Heavy metal water pollution: A fresh look about hazards, novel and conventional remediation methods. Environ. Technol. Innov. 2021, 22, 101504. [Google Scholar] [CrossRef]
  2. Sibagariang, Y.P.; Napitupulu, F.H.; Kawai, H.; Ambarita, H. Study on the effect of oil palm shells on fresh water productivity of double slope solar still. J. Energy Storage 2023, 70, 108000. [Google Scholar] [CrossRef]
  3. Tang, W.; Pei, Y.; Zheng, H.; Zhao, Y.; Shu, L.; Zhang, H. Twenty years of China’s water pollution control: Experiences and challenges. Chemosphere 2022, 295, 133875. [Google Scholar] [CrossRef] [PubMed]
  4. Kaplan, A.; Ronen-Eliraz, G.; Ratner, S.; Aviv, Y.; Wolanov, Y.; Avisar, D. Impact of industrial air pollution on the quality of atmospheric water production. Environ. Pollut. 2023, 325, 121447. [Google Scholar] [CrossRef]
  5. Aung, P.P.; Mao, Y.; Hu, T.; Qi, S.; Tian, Q.; Chen, Z.; Xing, X. Metal concentrations and pollution assessment in bottom sediments from Inle Lake, Myanmar. J. Geochem. Explor. 2019, 207, 106357. [Google Scholar] [CrossRef]
  6. Ali, M.M.; Rahman, S.; Islam, M.S.; Rakib, M.R.J.; Hossen, S.; Rahman, M.Z.; Kormoker, T.; Idris, A.M.; Phoungthong, K. Distribution of heavy metals in water and sediment of an urban river in a developing country: A probabilistic risk assessment. Int. J. Sediment Res. 2022, 37, 173–187. [Google Scholar] [CrossRef]
  7. Raudonytė-Svirbutavičienė, E.; Jokšas, K.; Stakėnienė, R. On the effectiveness of tributyltin ban part II: Temporal and spatial trends of organotin pollution in intense sediment accumulation areas and dumping sites of the Baltic Sea. J. Hazard. Mater. Adv. 2023, 10, 100294. [Google Scholar] [CrossRef]
  8. Saleem, M.; Jeelani, G.; Pall, I.A.; Ganai, J.; Kumar, S. Water and sediment geochemistry of an urban lake: Implications to weathering and anthropogenic activity. Int. J. Sediment Res. 2022, 37, 809–822. [Google Scholar] [CrossRef]
  9. Elmorsi, R.R.; Abou-El-Sherbini, K.S.; Abdel-Hafiz Mostafa, G.; Hamed, M.A. Distribution of essential heavy metals in the aquatic ecosystem of Lake Manzala, Egypt. Heliyon 2019, 5, e02276. [Google Scholar] [CrossRef]
  10. Li, X.; Bing, J.; Zhang, J.; Guo, L.; Deng, Z.; Wang, D.; Liu, L. Ecological risk assessment and sources identification of heavy metals in surface sediments of a river-reservoir system. Sci. Total Environ. 2022, 842, 156683. [Google Scholar] [CrossRef]
  11. Chen, Y.; Shi, X.; Jin, X.; Jin, P. Characteristics of overflow pollution from combined sewer sediment: Formation, contribution and regulation. Chemosphere 2022, 298, 134254. [Google Scholar] [CrossRef] [PubMed]
  12. Jiang, R.; Lin, C.; Zhou, K.; Liu, Y.; Chen, J.; Wang, S.; Pan, Z.; Sun, X.; Wang, W.; Lin, H. Pollution, ecological risk, and source identification of potentially toxic elements in sediments of a landscape urban lagoon, China. Mar. Pollut. Bull. 2022, 174, 113192. [Google Scholar] [CrossRef] [PubMed]
  13. Adushinov, A.; Borisenko, I.; Zonkhoeva, E.; Rezanov, I.; Parfenov, I.; Shaibonov, B.; Abasheeva, N.; Ayushina, T.; Boikov, T.; Litvinov, A.; et al. Ecology of Lake Gusinoye; Buryat Academic Press: Ulan-Ude, Russia, 1994; p. 199. [Google Scholar]
  14. Galazy, G. Lake Baikal. Atlas; Roskartografiya: Moscow, Russia, 1993; p. 160. [Google Scholar]
  15. Radnaeva, L.D.; Bazarzhapov, T.Z.; Shiretorova, V.G.; Zhigzhitzhapova, S.V.; Nikitina, E.P.; Dylenova, E.P.; Shirapova, G.S.; Budaeva, O.D.; Beshentsev, A.N.; Garmaev, E.Z.; et al. Ecological State of Lake Gusinoe—A Cooling Pond of the Gusinoozersk GRES. Water 2021, 14, 4. [Google Scholar] [CrossRef]
  16. Tsydypov, B.Z.; Andreev, S.G.; Ayurzhanaev, A.A.; Sodnomov, B.V.; Gurzhapov, B.O.; Batotsyrenov, E.A.; Pavlov, I.A.; Shiretorova, V.G.; Ulzetueva, I.D.; Gabeeva, D.A.; et al. Impact of Discharges of Gusinoozerskaya Power Plant on Thermal and Hydrochemical Regime of Lake Gusinoe. ISU Bull. 2017, 22, 135–150. [Google Scholar]
  17. Naganawa, H. Lake Gusinoe to Baikal via Selenga Delta: Protection-destruction spiral. Lakes Reserv. Ponds 2012, 6, 9–12. [Google Scholar]
  18. Russian Statistical Yearbook; Federal State Statistics Service: Moscow, Russia, 2022; p. 459.
  19. Khazheeva, Z.I.; Plyusnin, A.M.; Smirnova, O.K.; Peryazeva, E.G.; Sanzhanova, S.S.; Zhambalova, D.I.; Doroshkevich, S.G.; Dabaeva, V.V. Nutrients, Organic Matter, and Trace Elements in Lake Gusinoe (Transbaikalia). Water 2021, 13, 2958. [Google Scholar] [CrossRef]
  20. Abidueva, E.Y.; Dagurova, O.P.; Garankina, V.P.; Sambueva, G.B. Seasonal changes of the physico-chemical and microbiological parameters of Lake Gusinoe (Western Transbaikalia). BSU Bull. 2014, 3, 74–76. [Google Scholar]
  21. Bazarova, B.B.; Kuklin, A.P. On the current state and long-term dynamics of the flora and vegetation of Lake Gusinoe (Republic of Buryatia). Ekosistemy 2021, 25, 72–81. [Google Scholar]
  22. Domysheva, V.M.; Sinyukovich, V.N.; Hodger, T.V. Water regime and hydrochemistry of Lake Gusinoe in the modern period. Geogr. Nat. Resour. 1995, 2, 73–80. [Google Scholar]
  23. Khazheeva, Z.I.; Plyusnin, A.M. Current state of water resources of Gusinoe Lake (Western Transbaikalia). Water Res. 2018, 45, 104–110. [Google Scholar] [CrossRef]
  24. Lukyanova, A.; Lukyanova, O.; Yefimova, L.; Yefimov, V. The Anthropogenic and Natural Factors’ Impact on Water Quality in Cooling Pools (the Lake Gusinoye as a Study Case). Water Sect. Russ. Probl. Technol. Manag. 2020, 2, 146–160. [Google Scholar]
  25. Chebunina, N.S.; Pakhakhinova, Z.Z.; Beshentcev, A.N.; Batoev, V.B. Assessment of impact of warm water dischange of the Gusinoozersk GRES on the ice regime of Gusinoe Lake (in The Western Transbaikalia). Polythematic Netw. Electron. Sci. J. Kuban State Agrar. Univ. 2016, 116, 301–308. [Google Scholar]
  26. Dampilova, B.V.; Khazheeva, Z.I.; Plyusnin, A.M. Heavy Metal Species in the Bottom Sediments of the Aquatic System of Lake Gusinoe (Buryatia). Geochem. Int. 2022, 60, 279–285. [Google Scholar] [CrossRef]
  27. Buryat Center for Hydrometeorology and Environmental Monitoring. Available online: http://www.burpogoda.ru (accessed on 30 September 2021).
  28. Qu, J.; Tian, X.; Zhang, X.; Yao, J.; Xue, J.; Li, K.; Zhang, B.; Wang, L.; Zhang, Y. Free radicals-triggered reductive and oxidative degradation of highly chlorinated compounds via regulation of heat-activated persulfate by low-molecular-weight organic acids. Appl. Catal. B Environ. 2022, 310, 121359. [Google Scholar] [CrossRef]
  29. Bech, J.; Duran, P.; Roca, N.; Poma, W.; Sánchez, I.; Roca-Pérez, L.; Boluda, R.; Barceló, J.; Poschenrieder, C. Accumulation of Pb and Zn in Bidens triplinervia and Senecio sp. spontaneous species from mine spoils in Peru and their potential use in phytoremediation. J. Geochem. Explor. 2012, 123, 109–113. [Google Scholar] [CrossRef]
  30. Chandra, S.; Medha, I.; Tiwari, A.K. The Role of Modified Biochar for the Remediation of Coal Mining-Impacted Contaminated Soil: A Review. Sustainability 2023, 15, 3973. [Google Scholar] [CrossRef]
  31. Chen, H.; Zhang, J.; Tang, L.; Su, M.; Tian, D.; Zhang, L.; Li, Z.; Hu, S. Enhanced Pb immobilization via the combination of biochar and phosphate solubilizing bacteria. Environ. Int. 2019, 127, 395–401. [Google Scholar] [CrossRef]
  32. Chen, H.; Min, F.; Hu, X.; Ma, D.; Huo, Z. Biochar assists phosphate solubilizing bacteria to resist combined Pb and Cd stress by promoting acid secretion and extracellular electron transfer. J. Hazard. Mater. 2023, 452, 131176. [Google Scholar] [CrossRef]
  33. Lai, W.; Wu, Y.; Zhang, C.; Dilinuer, Y.; Pasang, L.; Lu, Y.; Wang, Y.; Chen, H.; Li, Z. Combination of Biochar and Phosphorus Solubilizing Bacteria to Improve the Stable Form of Toxic Metal Minerals and Microbial Abundance in Lead/Cadmium-Contaminated Soil. Agronomy 2022, 12, 1003. [Google Scholar] [CrossRef]
  34. Ferati, F.; Kerolli-Mustafa, M.; Kraja-Ylli, A. Assessment of heavy metal contamination in water and sediments of Trepca and Sitnica rivers, Kosovo, using pollution indicators and multivariate cluster analysis. Environ. Monit. Assess. 2015, 187, 338. [Google Scholar] [CrossRef]
  35. Liu, P.; Hu, W.; Tian, K.; Huang, B.; Zhao, Y.; Wang, X.; Zhou, Y.; Shi, B.; Kwon, B.O.; Choi, K.; et al. Accumulation and ecological risk of heavy metals in soils along the coastal areas of the Bohai Sea and t Tomlinson he Yellow Sea: A comparative study of China and South Korea. Environ. Int. 2020, 137, 105519. [Google Scholar] [CrossRef] [PubMed]
  36. Turekian, K.K.; Wedepohl, K.H. Distribution of the Elements in Some Major Units of the Earth’s Crust. Geol. Soc. Am. Bull. 1961, 72, 175–192. [Google Scholar] [CrossRef]
  37. Solgi, E.; Esmaili-Sari, A.; Riyahi-Bakhtiari, A.; Hadipour, M. Soil contamination of metals in the three industrial estates, Arak, Iran. Bull. Environ. Contam. Toxicol. 2012, 88, 634–638. [Google Scholar] [CrossRef] [PubMed]
  38. Tomlinson, D.L.; Wilson, J.G.; Harris, C.R.; Jeffrey, D.W. Problems in the assessment of heavy-metal levels in estuaries and the formation of a pollution index. Helgoländer Meeresunters. 1980, 33, 566–575. [Google Scholar] [CrossRef]
  39. Khazheeva, Z.I.; Pronin, N.M.; Radnaeva, L.D.; Dugarov, Z.N.; Urbazaeva, S.D. The features of heavy metal accumulation in water, bottom sediments and biota of the Cherkalov Sor Bay at Lake Baikal. Chem. Sustain. Dev. 2005, 13, 95–102. [Google Scholar]
  40. Aradpour, S.; Noori, R.; Tang, Q.; Bhattarai, R.; Hooshyaripor, F.; Hosseinzadeh, M.; Haghighi, A.T.; Klöve, B. Metal contamination assessment in water column and surface sediments of a warm monomictic man-made lake: Sabalan Dam Reservoir, Iran. Hydrol. Res. 2020, 51, 799–814. [Google Scholar] [CrossRef]
  41. Aradpour, S.; Noori, R.; Vesali Naseh, M.R.; Hosseinzadeh, M.; Safavi, S.; Ghahraman-Rozegar, F.; Maghrebi, M. Alarming carcinogenic and non-carcinogenic risk of heavy metals in Sabalan dam reservoir, Northwest of Iran. Environ. Pollut. Bioavailab. 2021, 33, 278–291. [Google Scholar] [CrossRef]
  42. Nodefarahani, M.; Aradpour, S.; Noori, R.; Tang, Q.; Partani, S.; Klöve, B. Metal pollution assessment in surface sediments of Namak Lake, Iran. Environ. Sci. Pollut. Res. 2020, 27, 45639–45649. [Google Scholar] [CrossRef]
  43. Sobczyński, T.; Siepak, J. Speciation of heavy metals in bottom sediments of lakes in the area of Wielkopolski National Park. Pol. J. Environ. Stud. 2001, 10, 463–474. [Google Scholar]
  44. Sojka, M.; Jaskuła, J.; Siepak, M. Heavy Metals in Bottom Sediments of Reservoirs in the Lowland Area of Western Poland: Concentrations, Distribution, Sources and Ecological Risk. Water 2019, 11, 56. [Google Scholar] [CrossRef]
  45. Lett, R.; Jackaman, W. Stream Geochemical Survey Guide; British Columbia Ministry of Energy and Mines, Energy and Minerals Division: Vancouver, BC, Canada, 2004.
  46. Microwave Assisted Acid Digestion of Siliceous and Organically Based Matrices. Available online: https://www.epa.gov/sites/default/files/2015-12/documents/3052.pdf (accessed on 30 September 2021).
  47. Alekin, O.; Semenov, A.; Skopintsev, B. Guidelines for the Chemical Analysis of Land Waters; Hydrometeorological Publishing: Leningrad, Russia, 1973; p. 269. [Google Scholar]
  48. Sediment from Lake Baikal (Certified Reference Material), BIL-2, GSO 7176-950. A.P. Vinogradov Institute of Geochemistry SB RAS, Irkutsk, Russia. Available online: https://web.archive.org/web/20230926163616/https://nevareaktiv.ru/system/static_attachments/item/pdf/igcir/GRSI-7176-IGC.pdf (accessed on 30 August 2023).
  49. 24 Element ICP Calibration/Quality Control Standard, STD IV-STOCK-8. Inorganic Ventures, Christiansburg, VA, USA. Available online: https://www.inorganicventures.com/icp-calibration-std-8-125ml (accessed on 30 August 2023).
  50. Wu, B.; Zhang, Y.; Zhang, X.; Cheng, S. Health risk from exposure of organic pollutants through drinking water consumption in Nanjing, China. Bull. Environ. Contam. Toxicol. 2010, 84, 46–50. [Google Scholar] [CrossRef] [PubMed]
  51. Hakanson, L. An ecological risk index for aquatic pollution control. A sedimentological approach. Water Res. 1980, 14, 975–1001. [Google Scholar] [CrossRef]
  52. Islam, M.S.; Proshad, R.; Ahmed, S. Ecological risk of heavy metals in sediment of an urban river in Bangladesh. Hum. Ecol. Risk Assess. Int. J. 2017, 24, 699–720. [Google Scholar] [CrossRef]
  53. US EPA. Regional Screening Level (RSL) Summary Table. 2017. Available online: https://www.epa.gov/risk/regional-screening-levels-rsls-generic-tables (accessed on 30 August 2023).
  54. Dagurova, O.P.; Zaitseva, S.V.; Tsydenova, B.V.; Dambaev, V.B.; Matafonov, D.V. Monitoring of physicochemical parameters of Lake Gusinoe. Buryat State Univ. Bull. 2019, 4, 3–8. [Google Scholar]
  55. Adesakin, T.A.; Oyewale, A.T.; Bayero, U.; Mohammed, A.N.; Aduwo, I.A.; Ahmed, P.Z.; Abubakar, N.D.; Barje, I.B. Assessment of bacteriological quality and physico-chemical parameters of domestic water sources in Samaru community, Zaria, Northwest Nigeria. Heliyon 2020, 6, e04773. [Google Scholar] [CrossRef]
  56. Jain, N.; Yevatikar, R.; Raxamwar, T.S. Comparative study of physico-chemical parameters and water quality index of river. Mater. Today Proc. 2022, 60, 859–867. [Google Scholar] [CrossRef]
  57. Li, X.; Huang, T.; Ma, W.; Sun, X.; Zhang, H. Effects of rainfall patterns on water quality in a stratified reservoir subject to eutrophication: Implications for management. Sci. Total Environ. 2015, 521–522, 27–36. [Google Scholar] [CrossRef]
  58. Tsydenova, B.V.; Dagurova, O.P.; Garankina, V.P.; Dambaev, V.P.; Matafonov, D.V.; Baturina, O.A. Abundance and Taxonomic Composition of Bacterioplankton in Freshwater Lake Gusinoye (Buryatia) in the Warm Water Zone of the Gusinoozerskaya Thermal Power Plant. J. Sib. Fed. Univ. Biol. 2018, 11, 356–366. [Google Scholar]
  59. Ivanova, E.; Anishenko, O.; Gribovskaya, I.; Zinenko, G.; Nazarenko, N.; Nemchinov, V.; Zuev, I.; Avramov, A. Metal content in higher aquatic plants in a small Siberian water reservoir. Sib. Ecol. J. 2012, 4, 485–495. [Google Scholar] [CrossRef]
  60. Tsybekmitova, G.T.; Kuklin, A.P.; Tashlykova, N.A.; Afonina, E.Y.; Bazarova, B.B.; Itigilova, M.T.; Gorlacheva, E.P.; Matafonov, P.V.; Afonin, A.V. Ecological state of Lake Kenon as a cooling pond of the Thermal Power Plant-1 (TPP-1) (Zabaykalsky Krai). Novosib. State Pedagog. Univ. Bull. 2017, 7, 194–209. [Google Scholar]
  61. Franco-Uria, A.; Lopez-Mateo, C.; Roca, E.; Fernandez-Marcos, M.L. Source identification of heavy metals in pastureland by multivariate analysis in NW Spain. J. Hazard. Mater. 2009, 165, 1008–1015. [Google Scholar] [CrossRef] [PubMed]
  62. Tulokhonov, A.K.; Garmaev, E.A.; Andreev, S.G. Experience of Socio-Ecological Rehabilitation of the Consequences of Ammunition Explosions (on the Example of the Disaster at the Goose Lake Station, Republic of Buryatia). Problems of Protection of the Population and Territories from Emergency Situations; Federal Center of Science and High Technologies: Moscow, Russia, 2012. [Google Scholar]
  63. Zhigzhitzhapova, S.V.; Pavlov, I.A.; Shiretorova, V.G.; Dylenova, E.P.; Radnaeva, L.D.; Tulokhonov, A.K. Metal content in aquatic plants of Lake Gusinoye. Water Chem. Ecol. 2019, 1, 34–40. [Google Scholar]
  64. Mehantiev, I. Health Risks for the Population of the Voronezh Region Related to Drinking Water Quality. Public Health Life Environ. 2020, 4, 37–42. [Google Scholar] [CrossRef]
  65. Kiku, P.F.; Kislitsyna, L.V.; Bogdanova, V.D.; Sabirova, K.M. Hygienic evaluation of the quality of drinking water and risks for the health of the population of the Primorye territory. Hyg. Sanit. 2019, 1, 94–101. [Google Scholar] [CrossRef]
  66. Elumalai, V.; Brindha, K.; Lakshmanan, E. Human Exposure Risk Assessment Due to Heavy Metals in Groundwater by Pollution Index and Multivariate Statistical Methods: A Case Study from South Africa. Water 2017, 9, 234. [Google Scholar] [CrossRef]
  67. Cymes, I.; Glińska-Lewczuk, K.; Szymczyk, S.; Sidoruk, M.; Potasznik, A. Distribution and potential risk assessment of heavy metals and arsenic in sediments of a dam reservoir: A case study of the Łoje retention reservoir, NE Poland. J. Elementol. 2017, 22, 843–856. [Google Scholar] [CrossRef]
  68. Skwierawski, A. Carbon Sequestration Potential in the Restoration of Highly Eutrophic Shallow Lakes. Int. J. Environ. Res. Public Health 2022, 19, 6308. [Google Scholar] [CrossRef]
  69. Morillo, J.; Usero, J.; Gracia, I. Heavy metal distribution in marine sediments from the southwest coast of Spain. Chemosphere 2004, 55, 431–442. [Google Scholar] [CrossRef]
  70. Lee, P.K.; Kang, M.J.; Yu, S.; Ko, K.S.; Ha, K.; Shin, S.C.; Park, J.H. Enrichment and geochemical mobility of heavy metals in bottom sediment of the Hoedong reservoir, Korea and their source apportionment. Chemosphere 2017, 184, 74–85. [Google Scholar] [CrossRef]
  71. Leblebici, Z.; Aksoy, A.; Duman, F. Influence of salinity on the growth and heavy metal accumulation capacity of Spirodela polyrhiza (Lemnaceae). Turk. J. Biol. 2011, 35, 215–220. [Google Scholar] [CrossRef]
  72. Liu, L.; Luo, D.; Lu, Y.; Huang, X.; Liu, Y.; Wei, L.; Xiao, T.; Wu, Q.; Liu, G. Risk assessment of groundwater pollution during GLDA-assisted phytoremediation of Cd- and Pb-contaminated soil. Ecol. Indic. 2022, 139, 108913. [Google Scholar] [CrossRef]
  73. World Health Organization (WHO). Guidelines for Drinking Water Quality Recommendations; 1 (2004) 515; WHO: Geneva, Switzerland, 2004. [Google Scholar]
  74. MAC. Nature Protection. Hydrosphere. Indices of State and Requlation for Valuation Survey of Tisnery Waters. Available online: https://gost.ruscable.ru/Index/33/33538.htm (accessed on 7 November 2011).
Figure 1. Study area and the sampling points: Lake Gusinoe basin, Russia. Sampling points: 1—Tsagan-gol River; 2—Tsagan-gol River mouth; 3—Zagustai River; 4—Tel River; 5—Bayan-gol River; 6—GRES water intake channel; 7—discharge channel of GRES; 8, 9, 10, 11, 12, 13, 14 and 15—bank zone (8, 10 and 12—settlement influence zones: the village of Gusinoe Ozero, Baraty and Gusinoozersk city, respectively; 13, 14, 15—zone of influence of Kholboldzhinsky coal mine dumps); 16, 17, 18—the central profile of the lake.
Water 15 03385 g001
Figure 2. The ranges of temperature, pH, NTU, DO and TDS for watercourses, shore zones and central zones.
Water 15 03385 g002
Figure 3. Seasonal dynamics of iron, manganese, zinc, copper, chromium concentrations in Lake Gusinoe ((a)—winter, (b)—spring, (c)—summer, (d)—autumn).
Water 15 03385 g003
Figure 4. Seasonal dynamics of iron, manganese, zinc, copper, and chromium concentrations in watercourses of Lake Gusinoe.
Water 15 03385 g004
Figure 5. Enrichment factors for HMs in Lake Gusinoe basin, Russia.
Water 15 03385 g005
Figure 6. Pollution load index (PLI) for HMs in BSs of the Lake Gusinoe basin, Russia.
Water 15 03385 g006
Figure 7. Geoaccumulation index (Igeo) for HMs in the BSs in the Lake Gusinoe basin, Russia.
Water 15 03385 g007
Figure 8. Principal component analysis (PCA) of physicochemical parameters of water in the Lake Gusinoe basin, Russia.
Water 15 03385 g008
Figure 9. Principal component analysis (PCA) of HM levels in water samples collected in the Lake Gusinoe basin, Russia.
Water 15 03385 g009
Figure 10. Principal component analysis (PCA) of HM levels in BSs collected from Gusinoe Lake basin, Russia.
Water 15 03385 g010
Figure 11. Distribution of HMs in the BSs in the Gusinoe Lake basin.
Water 15 03385 g011aWater 15 03385 g011b
Table 1. Results of analysis of certified reference materials, mg/kg.
ElementDetermining
Threshold
BIL-2
CertifiedMeasuredRecovery
Fe437,00033,80092
Mn0.192989296
Zn0.16466103
Cu0.1181794
Cr0.2158160101
Ni0.53124.397
Pb0.2141393
Table 2. Contamination indices classification for water and BSs.
IndexCategoryDescription
Hazard index (HI)HI < 0.1Low risk[50]
0.1 ≤ HI < 1Low to moderate risk
1 ≤ HI < 5Moderate risk
5 ≤ HI < 10High risk
HI > 10Very high risk
Contamination factor (Cf)Cf < 1Low contamination
1 ≤ Cf < 2Low to moderate contamination[34,35]
2 ≤ Cf < 3Moderate contamination
3 ≤ Cf < 4Moderate to high contamination
4 ≤ Cf < 5High contamination
5 ≤ Cf < 6High to very high contamination
Cf ≥ 6Extreme contamination
Degree of contamination (Cd)Cd < 6Low degree of contamination[51]
6 ≤ Cd < 12Moderate degree of contamination
12 ≤ Cd < 24Significant degree of contamination
Cd > 24High degree of contamination
Pollution load index (PLI)PLI < 1Unpolluted[38]
1 ≤ PLI < 2Moderately polluted
2 ≤ PLI < 3Significant degree of pollution
PLI > 3Highly polluted
Geoaccumulation index (Igeo)Igeo ≤ 0Unpolluted[36,37]
0 ≤ Igeo < 1Unpolluted to moderately polluted
1 ≤ Igeo < 2Moderately polluted
2 ≤ Igeo < 3Moderately to highly polluted
3 ≤ Igeo < 4Highly polluted
4 ≤ Igeo < 5Highly to very highly polluted
Igeo > 5Extremely polluted
EF < 2No enrichment[52]
Enrichment factor (EF)2 ≤ EF < 5Moderate enrichment
5 ≤ EF < 10Moderate to high enrichment
10 ≤ EF < 25High enrichment
25 ≤ EF < 50Very high enrichment
EF > 50Extreme enrichment
Ecological risk factor (Er)Er < 40Low risk[51]
40 ≤ Er < 80Moderate risk
80 ≤ Er < 160Considerable risk
160 ≤ Er < 320High risk
Er > 80Very high risk
Potential Ecological Risk Index (RI)RI < 95Low risk[36,51]
95 ≤ RI < 190Moderate risk
190 ≤ RI < 380Considerable risk
RI > 380High risk
Table 3. Average concentrations of HMs (mg/kg) in BSs in Lake Gusinoe, Russia (2019–2021).
SiteFeMnZnCuCrNiCdPb
Clarke (mg/kg), [38]47,200850954590680.320
Tsagan-gol12,704.6726732.335.015.15.470.090.09
Tsagan-gol mouth10,424.0208.020.02.29.33.820.331.48
Zagustai21,684.33846.3334.675.179.154.090.153.52
Tel18,806.33443.3330.676.0312.002.490.663.26
Bayan-gol16,931.00481.0036.675.9315.203.190.110.98
GRES discharge14,038.67224.6746.0023.6014.058.060.234.26
Mean ± SD15,765 ±
4160
412 ±
242
33 ± 88 ± 812 ± 35 ± 20.26 ±
0.21
2 ± 2
833,251.00375.0087.0012.5726.277.080.153.79
913,432.00209.0044.6720.4316.749.350.084.16
1015,101.67483.0055.0013.1014.154.170.132.83
1111,646.00344.3365.6713.137.0312.090.072.04
125942.33147.3316.332.133.167.020.425.59
137396.33277.6715.336.704.361.520.203.11
146646.33166.3316.672.275.242.110.044.48
1540,516.67587.6783.672.334.076.130.033.60
1653,588.00807.33125.3333.6741.6018.250.2414.79
1742,249.00874.67112.6745.8034.5916.800.3013.52
1852,433.001015.67147.0043.1751.6424.550.5419.45
Mean ± SD25,654.76 ±
18,951.43
480.73 ±
302.38
69.94 ±
45.70
17.75 ±
16.14
18.99 ±
17.09
9.92 ±
7.29
0.20 ±
0.16
7.03 ±
5.95
Table 4. Hazard index for water consumption by local population at Lake Gusinoe.
ElementFeMnZnCuCrNiCdPbHI
RfD7 × 10−11.4 × 10−13 × 10−14 × 10−23 × 10−32 × 10−21 × 10−32 × 10−30.0157
HQ0.00040.00040.00040.00040.00860.00040.00300.0021
Note: Reference doses (RfD) of HMs are given according to USEPA [53].
Table 5. Environmental risk indices.
IndexPointIndex ValueCategoryDescription
Hazard IndexAll samples0.0157HI < 0.1Low risk
Contamination factor (Cf)Avr0.12–0.74Cf < 1Low contamination
Tel Cd-2.21 ≤ Cf < 2Low to moderate contamination
16Fe-1.14, Zn-1.32
18Fe-1.11, Mn-1.19, Zn-1.55
17Zn-1.19
Degree of contaminationAvr3.23Cd < 6Low degree of contamination
176.416 ≤ Cd < 12Moderate degree of contamination
166.42
188.52
Pollution load index (PLI)All samples0.10–0.96PLI < 1Unpolluted
Geoaccumulation index (Igeo)Avr−4.08-(−1.73)Igeo ≤ 0Unpolluted
TelCd-0.550 ≤ Igeo < 1Unpolluted to moderately polluted
18Cd-0.26
Enrichment factor (EF)Avr0.44–2.23EF < 2No enrichment
GRES discharge Cd-2.892 ≤ EF < 5Moderate enrichment
17Avg—2.93, Zn-4.41
16Avg—2.8, Zn-4.9
18Avg-3.93
15Mn-2.57, Zn-3.27
TelCd-8.175 ≤ EF < 10Moderate to high enrichment
18Cd-6.69
12Cd-5.24
Ecological risk factor (Er)Avr Er < 40Low risk
TelCd-6640 ≤ Er < 80Moderate risk
18Cd-54
Potential ecological risk index (RI)All samples6.49–70.46RI < 95Low risk
Disclaimer/Publisher’s Note: The statements, opinions and data contained in all publications are solely those of the individual author(s) and contributor(s) and not of MDPI and/or the editor(s). MDPI and/or the editor(s) disclaim responsibility for any injury to people or property resulting from any ideas, methods, instructions or products referred to in the content.

