


Analysis of the Role of Precipitation and Land Use on the Size of the Source Area of Shallow Landslides


Abstract
:1. Introduction
2. Materials and Methods
2.1. Study Areas
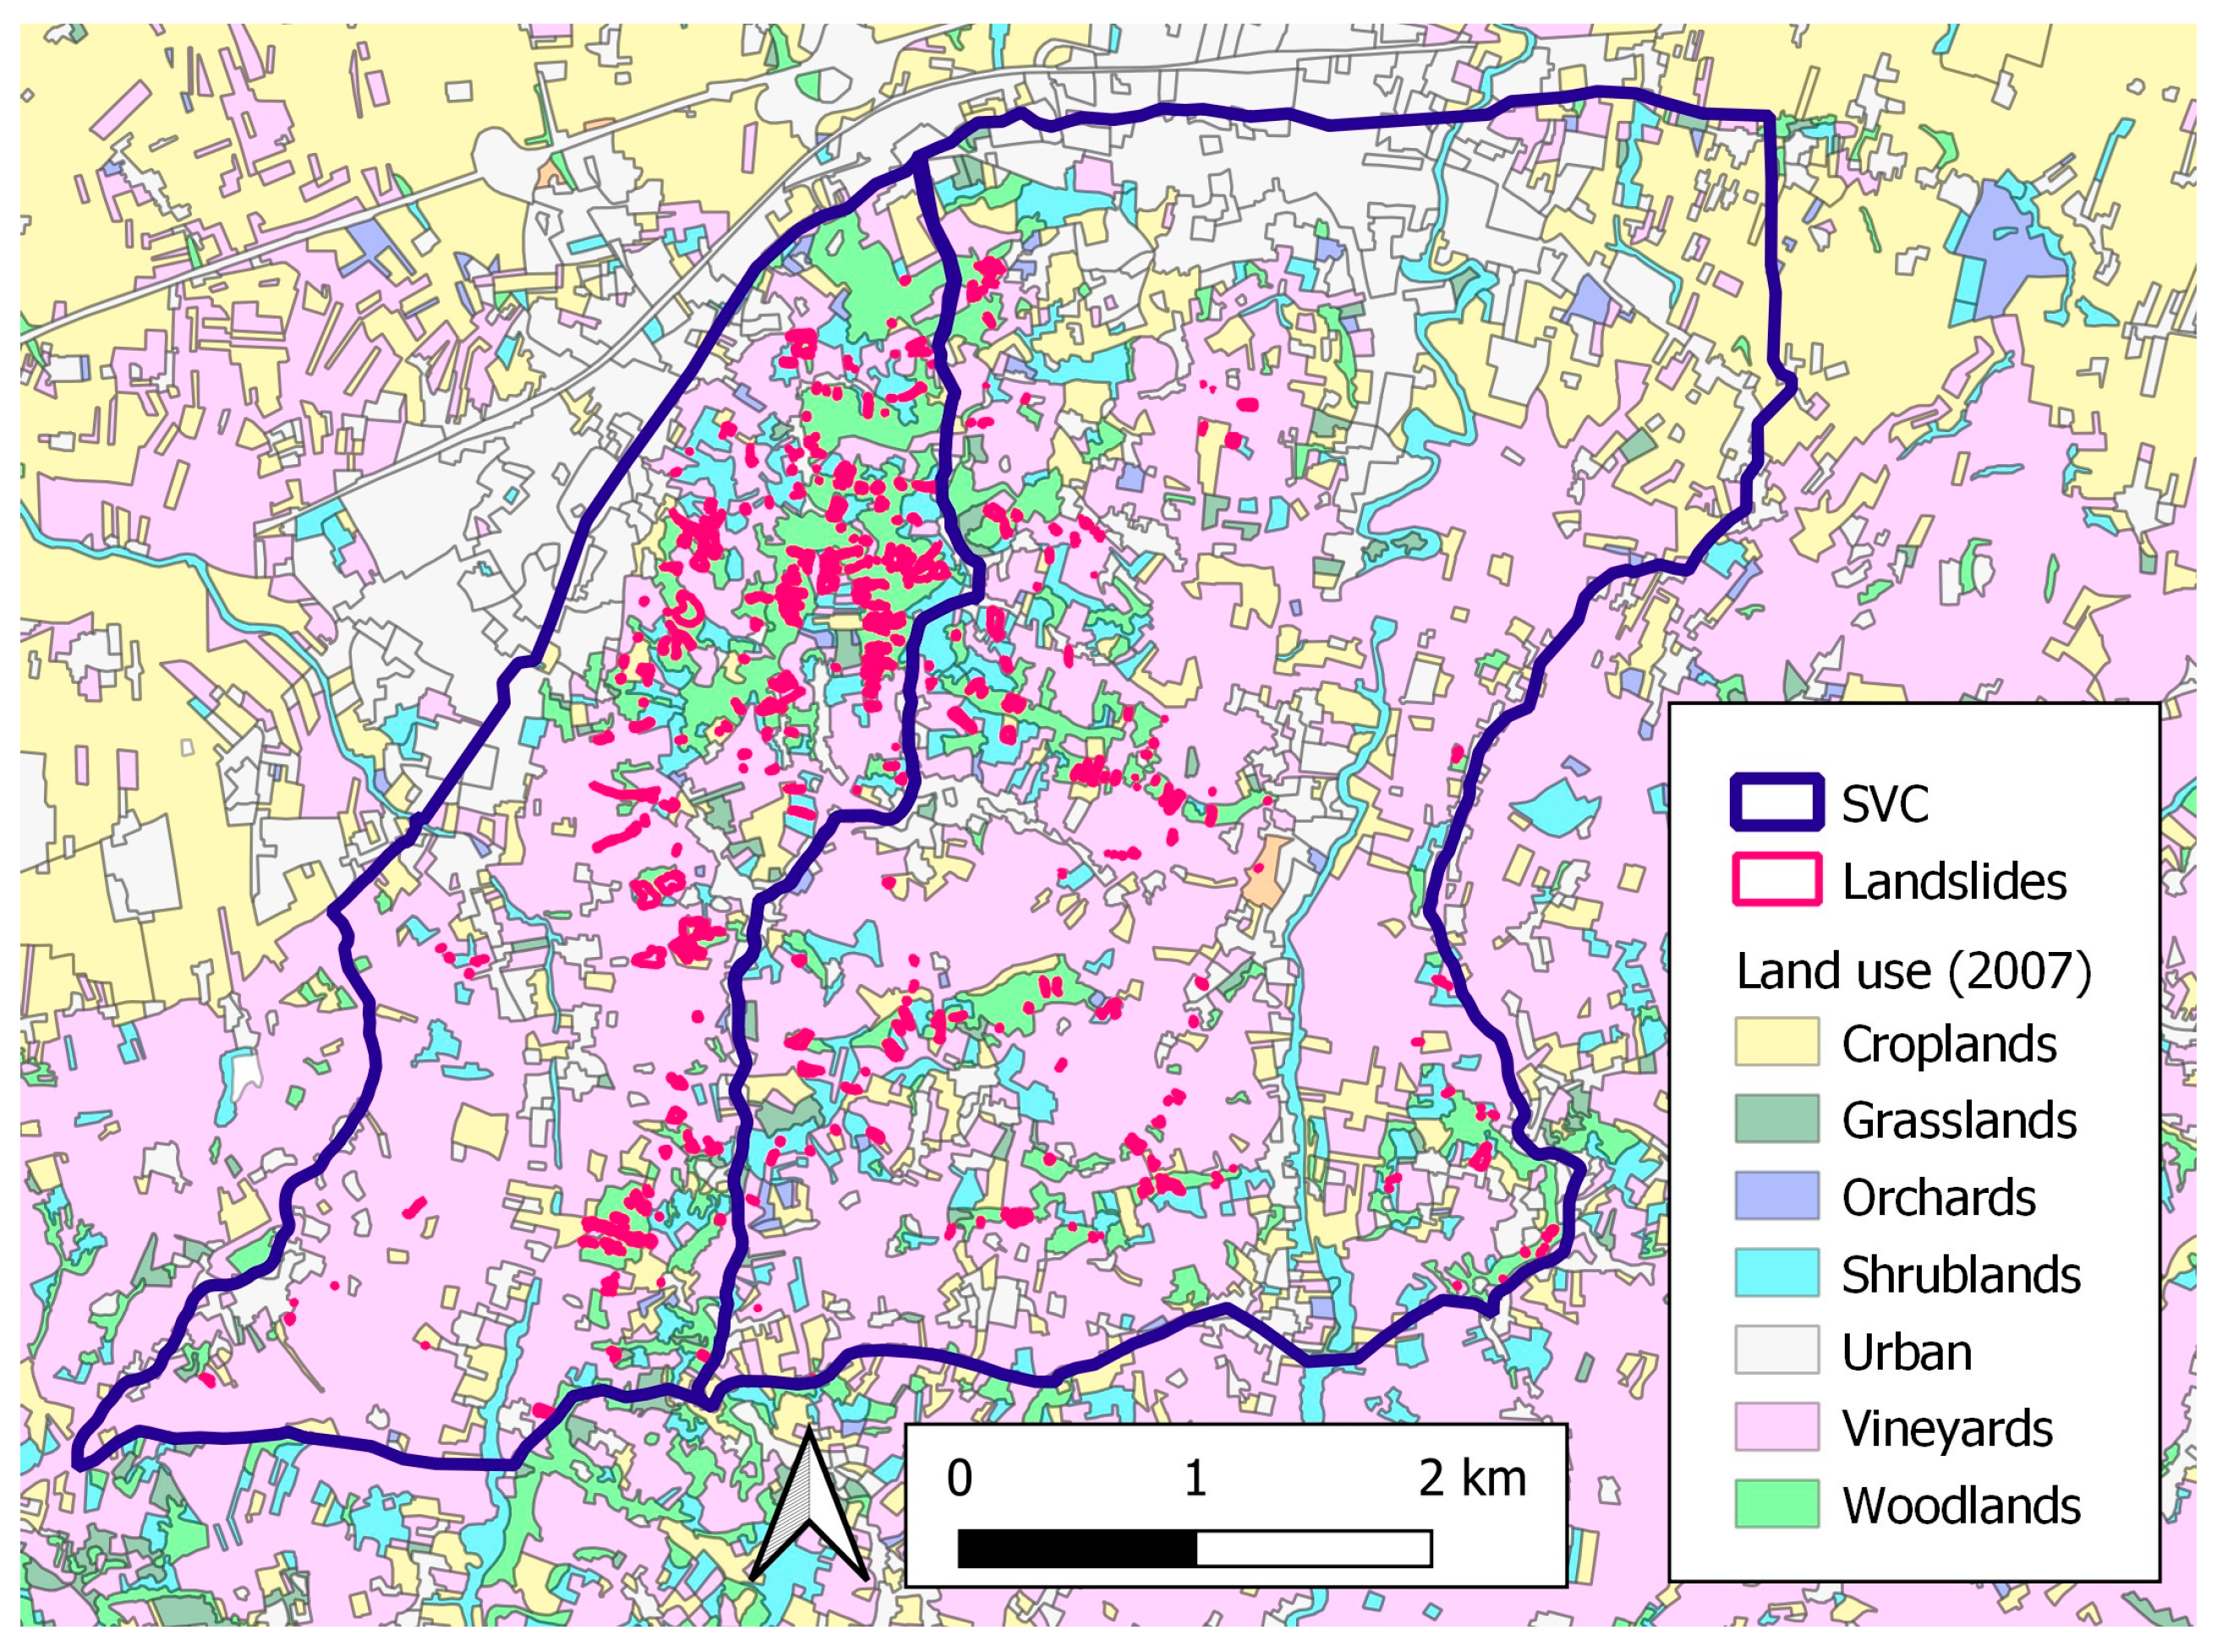
2.1.1. The Lower Portion of Scuropasso-Versa Catchments (SVC)
2.1.2. Study Areas: ArdivestraCatchment (AVC)
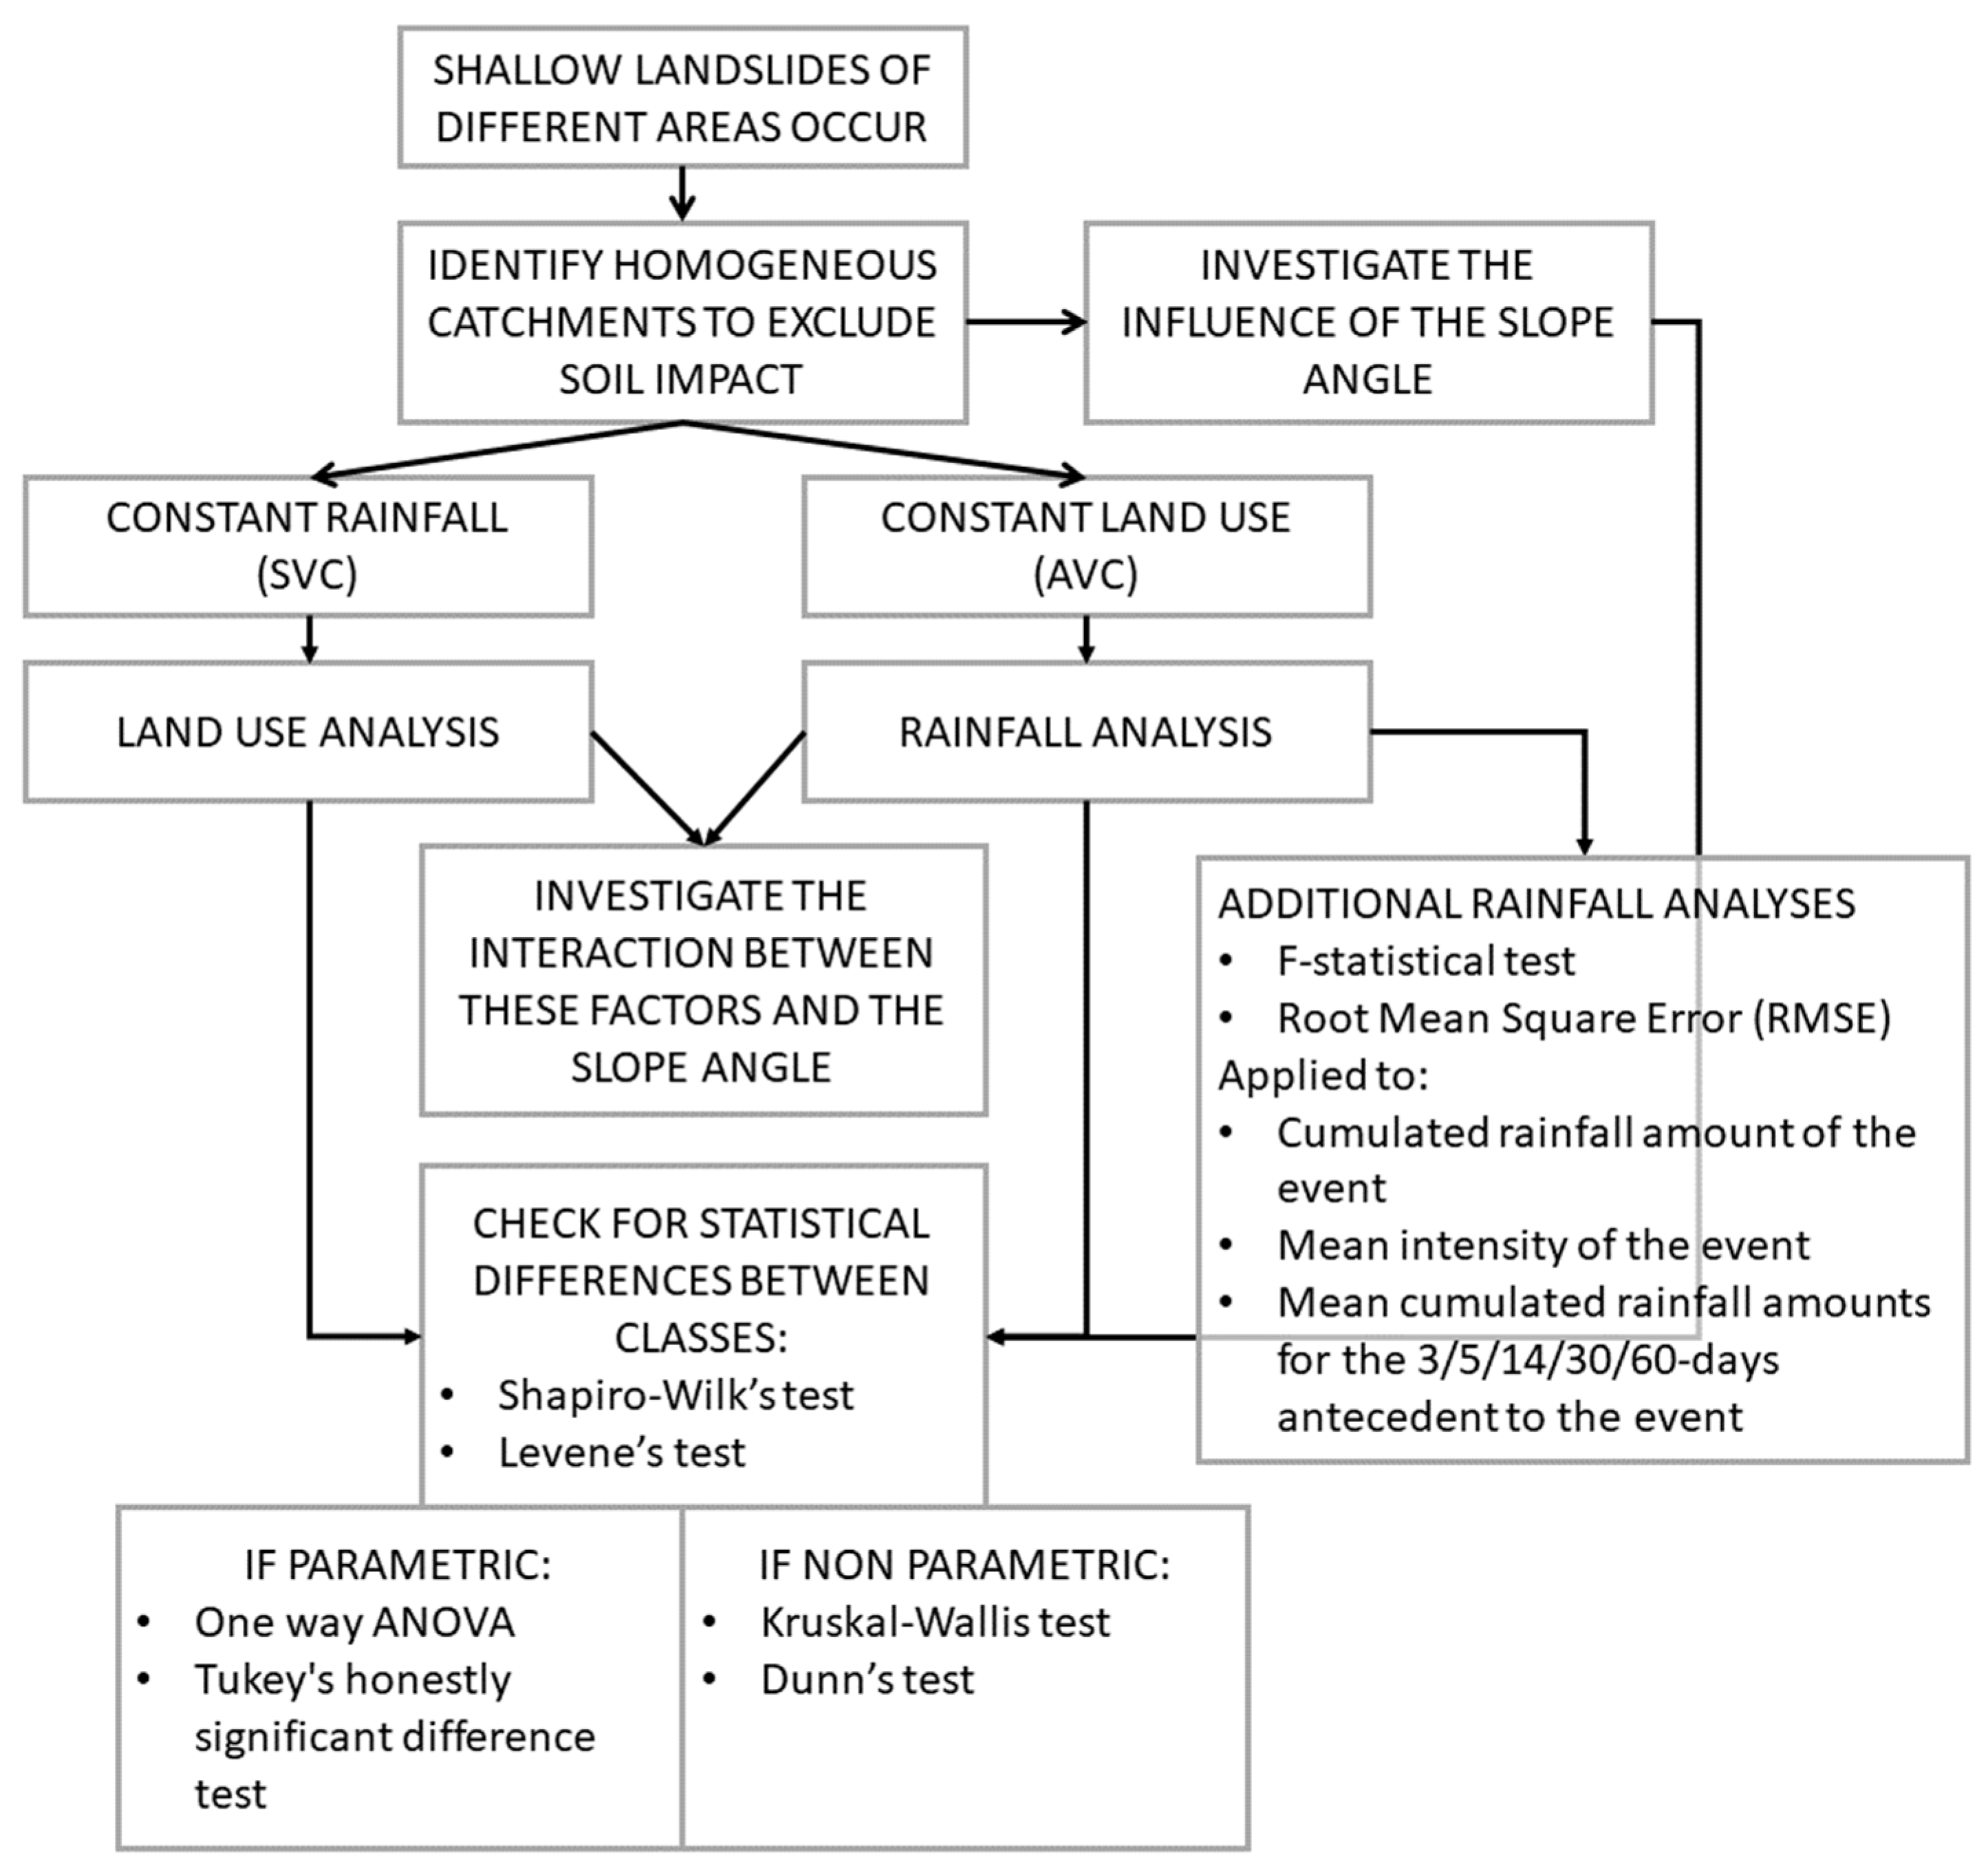
2.2. Statistical Techniques
3. Results
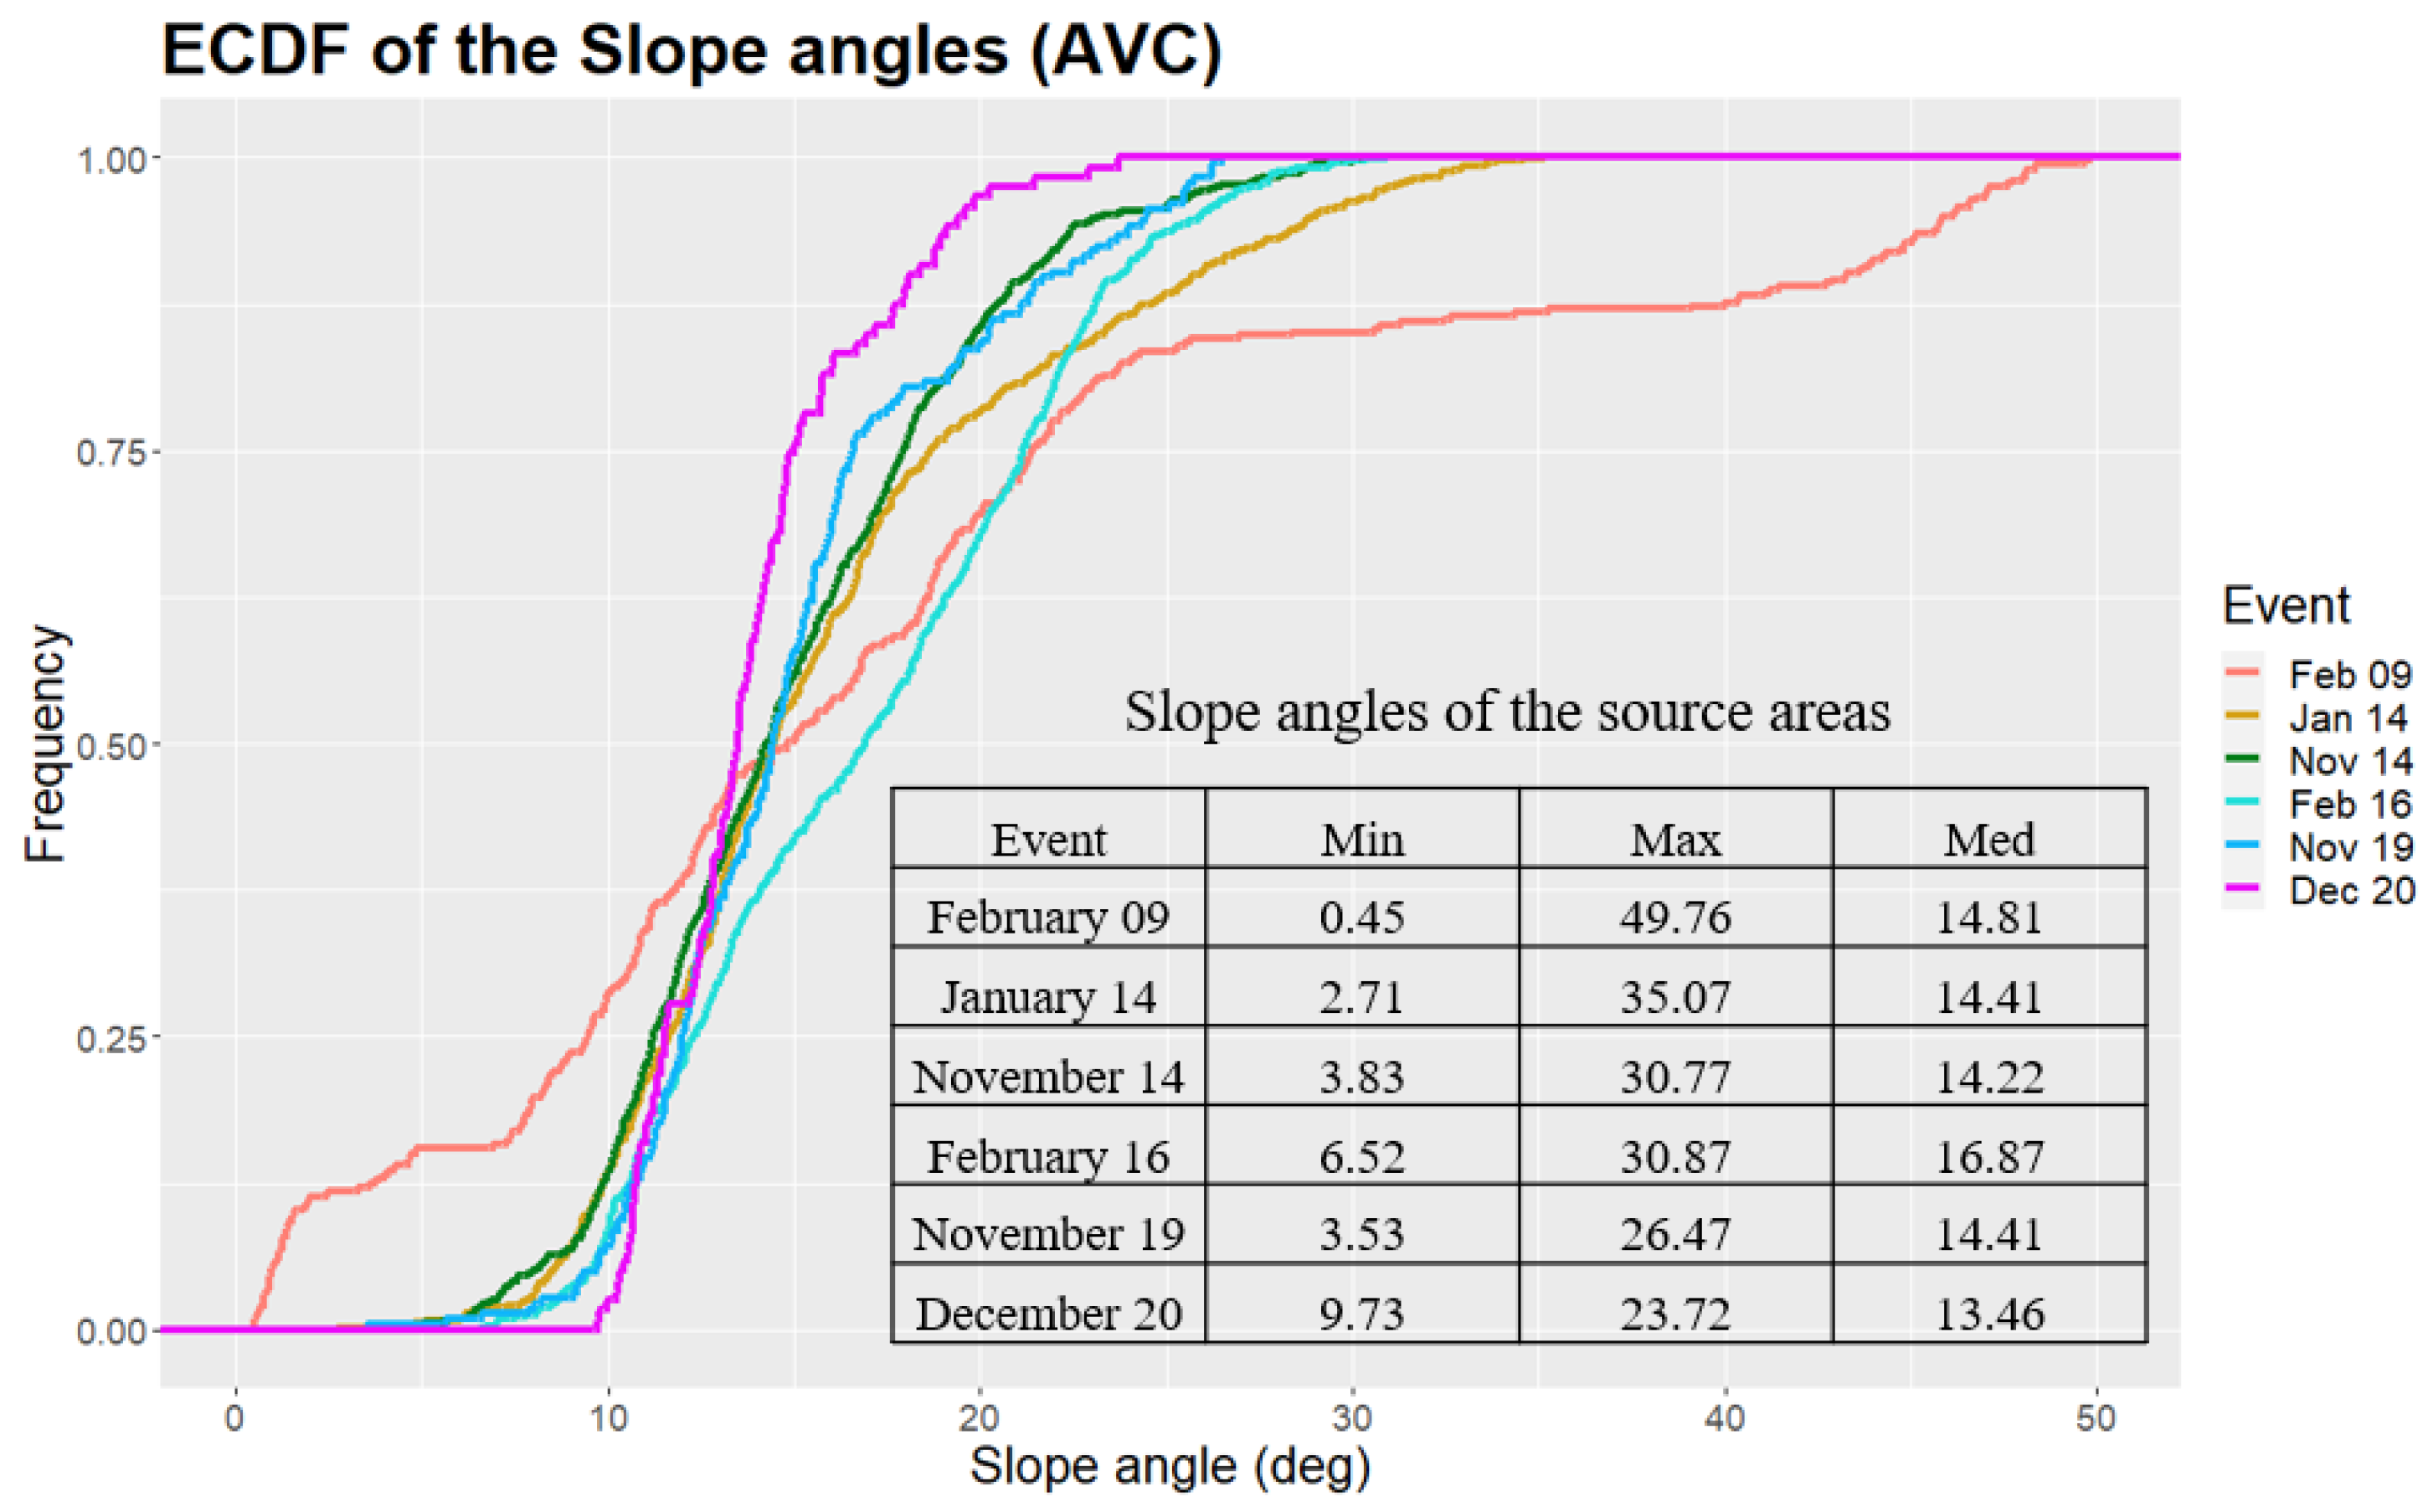
3.1. Impact of Slope Angle on Shallow Landslide Source Areas
3.2. Impact of the Lithology on Source Area Size
3.3. Impact of Land Use on Source Area Size
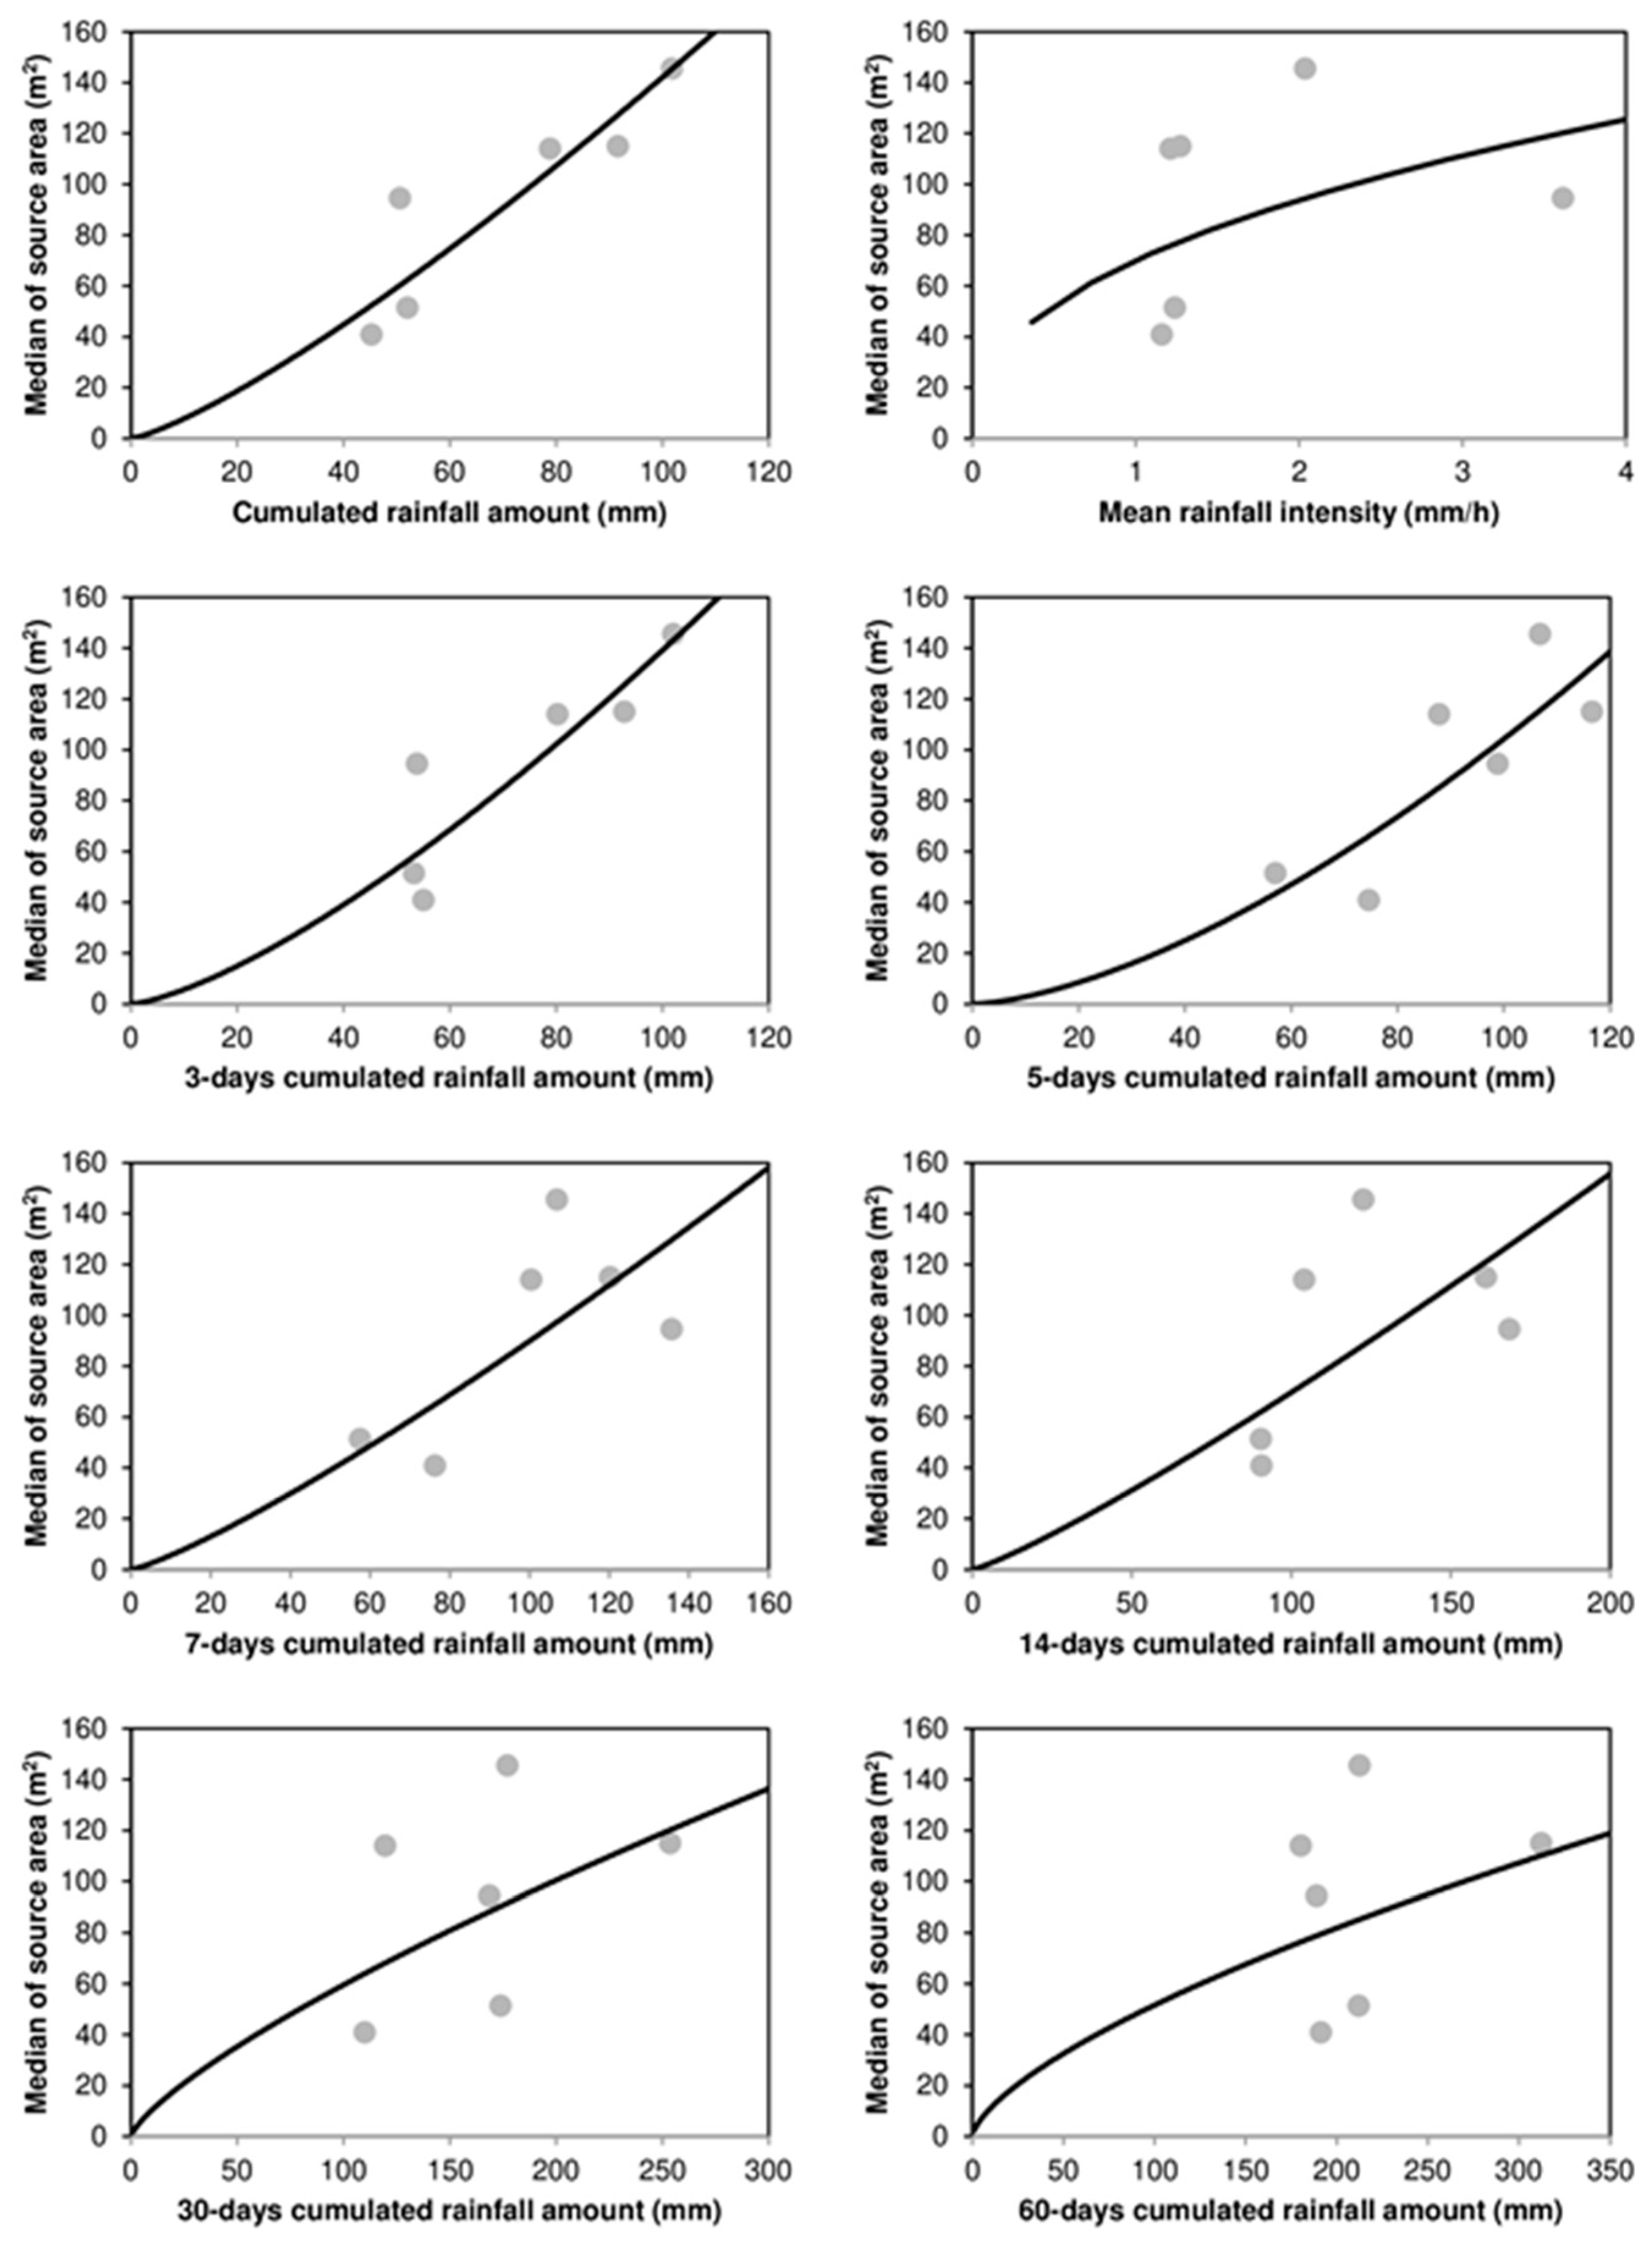
3.4. Impact of Rainfall Attributes on Shallow Landslides Source Areas
3.5. Effect of Interactions between Factors on Shallow Landslides Source Areas
4. Discussion
5. Conclusions
Author Contributions
Funding
Data Availability Statement
Acknowledgments
Conflicts of Interest
References
- Cevasco, A.; Pepe, G.; Brandolini, P. The influences of geological and land use settings on shallow landslides triggered by an intense rainfall event in a coastal terraced environment. Bull. Eng. Geol. Environ. 2014, 73, 859–875. [Google Scholar] [CrossRef]
- Di Napoli, M.; Di Martire, D.; Bausilio, G.; Calcaterra, D.; Confuorto, P.; Firpo, M.; Cevasco, A. Rainfall-induced shallow landslide detachment; transit and runout susceptibility mapping by integrating machine learning techniques and GIS-based approaches. Water 2021, 13, 488. [Google Scholar] [CrossRef]
- Bordoni, M.; Meisina, C.; Valentino, R.; Lu, N.; Bittelli, M.; Chersich, S. Hydrological factors affecting rainfall-induced shallow landslides: From the field monitoring to a simplified slope stability analysis. Eng. Geol. 2015, 193, 19–37. [Google Scholar] [CrossRef]
- Milledge, D.G.; Bellugi, D.; McKean, J.A.; Densmore, A.L.; Dietrich, W.E. A multidimensional stability model for predicting shallow landslide size and shape across landscapes. JGREarth Surf. 2014, 119, 2481–2504. [Google Scholar] [CrossRef] [PubMed]
- Lan, H.X.; Zhou, C.H.; Lee, C.F.; Wang, S.J.; Wu, F.Q. Rainfall-induced landslide stability analysis in response to transient pore pressure-A case study of natural terrain landslide in Hong Kong. Ser. Technol. Sci. 2003, 46, 52–68. [Google Scholar] [CrossRef]
- Saito, H.; Nakayama, D.; Matsuyama, H. Relationship between the initiation of a shallow landslide and rainfall intensity—Duration thresholds in Japan. Geomorphology 2010, 118, 167–175. [Google Scholar] [CrossRef]
- Posner, A.J.; Georgakakos, K.P. Soil moisture and precipitation thresholds for real-time landslide prediction in El Salvador. Landslides 2015, 12, 1179–1196. [Google Scholar] [CrossRef]
- Tebbens, S.F. Landslide scaling: A review. Earth Space Sci. 2020, 7, e2019EA000662. [Google Scholar] [CrossRef]
- Phillips, C.; Hales, T.; Smith, H.; Basher, L. Shallow landslides and vegetation at the catchment scale: A perspective. Ecol. Eng. 2021, 173, 106436. [Google Scholar] [CrossRef]
- Hungr, O.; McDougall, S.; Wise, M.; Cullen, M. Magnitude–frequency relationships of debris flows and debris avalanches in relation to slope relief. Geomorphology 2008, 96, 355–365. [Google Scholar] [CrossRef]
- Cardinali, M.; Reichenbach, P.; Guzzetti, F.; Ardizzone, F.; Antonini, G.; Galli, M.; Salvati, P. A geomorphological approach to the estimation of landslide hazards and risks in Umbria; Central Italy. Nat. Hazards Earth Syst. Sci. 2002, 2, 57–72. [Google Scholar] [CrossRef]
- Lombardo, L.; Tanyas, H.; Huser, R.; Guzzetti, F.; Castro-Camilo, D. Landslide size matters: A new data-driven; spatial prototype. Eng. Geol. 2021, 293, 106288. [Google Scholar] [CrossRef]
- Turner, A.K. Social and environmental impacts of landslides. Innov. Infrastruct. Solut. 2018, 3, 70. [Google Scholar] [CrossRef]
- Imaizumi, F.; Sidle, R.C. Linkage of sediment supply and transport processes in Miyagawa Dam catchment, Japan. J. Geophys. Res. Earth Surf. 2007, 112. [Google Scholar] [CrossRef]
- Scheevel, C.R. Predicting Landslide Stability; Runout; and Failure Velocity at Cook Lake Landslide, Wyoming; Colorado School of Mines ProQuest Dissertations Publishing: Golden, CO, USA, 2017. [Google Scholar]
- Cha, D.; Hwang, J.; Choi, B. Landslides detection and volume estimation in Jinbu area of Korea. For. Sci. Technol. 2018, 14, 61–65. [Google Scholar] [CrossRef]
- Domej, G.; Bourdeau, C.; Lenti, L.; Martino, S.; Pluta, K. Shape and Dimension Estimations of Landslide Rupture Zones via Correlations of Characteristic Parameters. Geosciences 2020, 10, 198. [Google Scholar] [CrossRef]
- Corominas, J. The angle of reach as a mobility index for small and large landslides. Can. Geotech. J. 1996, 33, 260–271. [Google Scholar] [CrossRef]
- Okura, Y.; Kitahara, H.; Sammori, T.; Kawanami, A. The effects of rockfall volume on runout distance. Eng. Geol. 2000, 58, 109–124. [Google Scholar] [CrossRef]
- Pelletier, J.D.; Malamud, B.D.; Blodgett, T.; Turcotte, D.L. Scale-invariance of soil moisture variability and its implications for the frequency-size distribution of landslides. Eng. Geol. 1997, 48, 255–268. [Google Scholar] [CrossRef]
- Massey, C.; Townsend, D.; Rathje, E.; Allstadt, K.E.; Lukovic, B.; Kaneko, Y.; Villeneuve, M. Landslides triggered by the 14 November 2016 M w 7.8 Kaikōura earthquake; New Zealand. Bull. Seismol. Soc. Am. 2018, 108, 1630–1648. [Google Scholar] [CrossRef]
- Zhang, J.; van Westen, C.J.; Tanyas, H.; Mavrouli, O.; Ge, Y.; Bajrachary, S.; Khanal, N.R. How size and trigger matter: Analyzing rainfall-and earthquake-triggered landslide inventories and their causal relation in the Koshi River basin; central Himalaya. Nat. Hazards Earth Syst. Sci. 2019, 19, 1789–1805. [Google Scholar] [CrossRef]
- Bellugi, D.; Milledge, D.G.; Dietrich, W.E.; Perron, J.T.; McKean, J. Predicting shallow landslide size and location across a natural landscape: Application of a spectral clustering search algorithm. JGR Earth Surf. 2015, 120, 2552–2585. [Google Scholar] [CrossRef]
- Frattini, P.; Crosta, G.B. The role of material properties and landscape morphology on landslide size distributions. Earth Planet. Sci. Lett. 2013, 361, 310–319. [Google Scholar] [CrossRef]
- Roda-Boluda, D.C.; D’Arcy, M.; McDonald, J.; Whittaker, A.C. Lithological controls on hillslope sediment supply: Insights from landslide activity and grain size distributions. Earth Planet. Sci. Lett. 2018, 43, 956–977. [Google Scholar] [CrossRef]
- Jeandet, L.; Steer, P.; Lague, D.; Davy, P. Coulomb mechanics and relief constraints explain landslide size distribution. Geophys. Res. Lett. 2019, 46, 4258–4266. [Google Scholar] [CrossRef]
- Medwedeff, W.G.; Clark, M.K.; Zekkos, D.; West, A.J. Characteristic landslide distributions: An investigation of landscape controls on landslide size. Earth Planet. Sci. Lett. 2020, 539, 116203. [Google Scholar] [CrossRef]
- Stark, C.P.; Guzzetti, F. Landslide rupture and the probability distribution of mobilized debris volumes. JGR Earth Surf. 2009, 114. [Google Scholar] [CrossRef]
- Bellugi, D.G.; Milledge, D.G.; Cuffey, K.M.; Dietrich, W.E.; Larsen, L.G. Controls on the size distributions of shallow landslides. Proc. Natl. Acad. Sci. USA 2021, 118, e2021855118. [Google Scholar] [CrossRef]
- Rickli, C.; Graf, F. Effects of forests on shallow landslides–case studies in Switzerland. For. Snow Landsc. Res. 2009, 82, 33–44. [Google Scholar]
- Tanyaş, H.; van Westen, C.J.; Allstadt, K.E.; Jibson, R.W. Factors controlling landslide frequency–area distributions. Earth Planet. Sci. Lett. 2019, 44, 900–917. [Google Scholar] [CrossRef]
- Larsen, I.J.; Montgomery, D.R.; Korup, O. Landslide erosion controlled by hillslope material. Nat. Geosci. 2010, 3, 247–251. [Google Scholar] [CrossRef]
- Zieher, T.; Perzl, F.; Rössel, M.; Rutzinger, M.; Meißl, G.; Markart, G.; Geitner, C. A multi-annual landslide inventory for the assessment of shallow landslide susceptibility–Two test cases in Vorarlberg, Austria. Geomorphology 2016, 259, 40–54. [Google Scholar] [CrossRef]
- Zizioli, D.; Meisina, C.; Valentino, R.; Montrasio, L. Comparison between different approaches to modeling shallow landslide susceptibility: A case history in Oltrepo Pavese; Northern Italy. Nat. Hazards Earth Syst. Sci. 2013, 13, 559–573. [Google Scholar] [CrossRef]
- Rau, J.Y.; Chang, K.T.; Shao, Y.C.; Lau, C.C. Semi-automatic shallow landslide detection by the integration of airborne imagery and laser scanning data. Nat. Hazards 2012, 61, 469–480. [Google Scholar] [CrossRef]
- Mondini, A.C.; Guzzetti, F.; Reichenbach, P.; Rossi, M.; Cardinali, M.; Ardizzone, F. Semi-automatic recognition and mapping of rainfall induced shallow landslides using optical satellite images. Remote Sens. Environ. 2011, 115, 1743–1757. [Google Scholar] [CrossRef]
- Notti, D.; Cignetti, M.; Godone, D.; Giordan, D. Semi-automatic mapping of shallow landslides using free Sentinel-2 images and Google Earth Engine. Nat. Hazards Earth Syst. Sci. 2023, 23, 2625–2648. [Google Scholar] [CrossRef]
- Meisina, C.; Zucca, F.; Fossati, D.; Ceriani, M.; Allievi, J. Ground deformation monitoring by using the permanent scatterers technique: The example of the Oltrepo Pavese (Lombardia, Italy). Eng. Geol. 2006, 88, 240–259. [Google Scholar] [CrossRef]
- Cruden, D.M. Cruden, DM, Varnes, DJ, 1996, Landslide Types and Processes, Transportation Research Board, US National Academy of Sciences, Special Report, 247: 36–75. Landslides Eng. Pract. 1996, 24, 20–47. [Google Scholar]
- Bordoni, M.; Bittelli, M.; Valentino, R.; Vivaldi, V.; Meisina, C. Observations on soil-atmosphere interactions after long-term monitoring at two sample sites subjected to shallow landslides. Bull. Eng. Geol. Environ. 2021, 80, 7467–7491. [Google Scholar] [CrossRef]
- Bordoni, M.; Vivaldi, V.; Lucchelli, L.; Ciabatta, L.; Brocca, L.; Galve, J.P.; Meisina, C. Development of a data-driven model for spatial and temporal shallow landslide probability of occurrence at catchment scale. Landslides 2021, 18, 1209–1229. [Google Scholar] [CrossRef]
- Persichillo, M.G.; Bordoni, M.; Meisina, C.; Bartelletti, C.; Barsanti, M.; Giannecchini, R.; D’Amato Avanzi, G.; Galanti, Y.; Cevasco, A.; Brandolini, P.; et al. Shallow landslides susceptibility assessment in different environments. Geomat. Nat. Hazards Risk 2016, 8, 748–771. [Google Scholar] [CrossRef]
- Bordoni, M.; Galanti, Y.; Bartelletti, C.; Persichillo, M.G.; Barsanti, M.; Giannecchini, R.; Meisina, C. The influence of the inventory on the determination of the rainfall-induced shallow landslides susceptibility using generalized additive models. Catena 2020, 193, 104630. [Google Scholar] [CrossRef]
- Galve, J.P.; Cevasco, A.; Brandolini, P.; Soldati, M. Assessment of shallow landslide risk mitigation measures based on land use planning through probabilistic modelling. Landslides 2015, 12, 101–114. [Google Scholar] [CrossRef]
- Galve, J.P.; Cevasco, A.; Brandolini, P.; Piacentini, D.; Azañón, J.M.; Notti, D.; Soldati, M. Cost-based analysis of mitigation measures for shallow-landslide risk reduction strategies. Eng. Geol. 2016, 213, 142–157. [Google Scholar] [CrossRef]
- Persichillo, M.G.; Bordoni, M.; Meisina, C. The role of land use changes in the distribution of shallow landslides. Sci. Total Environ. 2017, 574, 924–937. [Google Scholar] [CrossRef]
- Catani, F.; Lagomarsino, D.; Segoni, S.; Tofani, V. Exploring model sensitivity issues across different scales in landslide susceptibility. Nat. Hazards Earth Syst. Sci. 2013, 13, 2815–2831. [Google Scholar] [CrossRef]
- Luino, F.; De Graff, J.; Biddoccu, M.; Faccini, F.; Freppaz, M.; Roccati, A.; Ungaro, F.; D’Amico, M.; Turconi, L. The Role of Soil Type in Triggering Shallow Landslides in the Alps (Lombardy, Northern Italy). Land 2022, 11, 1125. [Google Scholar] [CrossRef]
- Bordoni, M.; Corradini, B.; Lucchelli, L.; Valentino, R.; Bittelli, M.; Vivaldi, V.; Meisina, C. Empirical and Physically Based Thresholds for the Occurrence of Shallow Landslides in a Prone Area of Northern Italian Apennines. Water 2019, 11, 2653. [Google Scholar] [CrossRef]
- Ramos-Scharron, C.E.; Arima, E.Y.; Chen, Y.; Ohlson, B.; Vest, B. Sediment mobilization by rain-driven landslides in a subtropical moist, mix-use, and predominantly metamorphic setting. Geomorphology 2022, 413, 108380. [Google Scholar] [CrossRef]
- Gabet, E.J.; Dunne, T. Landslides on coastal sage-scrub and grassland hillslopes in a severe El Nino winter: The effects of vegetation conversion on sediment delivery. Geol. Soc. Am. Bull. 2002, 114, 983–990. [Google Scholar] [CrossRef]
- Moser, M. Der Einfluss der PflanzendeckebeiElementarereignissen auf Grösse und Anzahl der AnbruchsflächenimBereich des mittlerenLesachtales. Kärnten Cent. Für Das Gesamte Forstwes. 1971, 88, 164–176. [Google Scholar]
- Vítková, M.; Müllerová, J.; Sádlo, J.; Pergl, J.; Pyšek, P. Black locust (Robiniapseudoacacia) beloved and despised: A story of an invasive tree in Central Europe. For. Ecol. Manag. 2017, 384, 287–302. [Google Scholar] [CrossRef] [PubMed]
- Li, Y.X.; Tullberg, J.N.; Freebairn, D.M. Wheel traffic and tillage effects on runoff and crop yield. Soil Tillage Res. 2007, 97, 282–292. [Google Scholar] [CrossRef]
- Materechera, S.A. Tillage and tractor traffic effects on soil compaction in horticultural fields used for peri-urban agriculture in a semi-arid environment of the North West Province, South Africa. Soil Tillage Res. 2009, 103, 11–15. [Google Scholar] [CrossRef]
- Comino, J.R.; Iserloh, T.; Lassu, T.; Cerdà, A.; Keestra, S.D.; Prosdocimi, M.; Ries, J.B. Quantitative comparison of initial soil erosion processes and runoff generation in Spanish and German vineyards. Sci. Total Environ. 2016, 565, 1165–1174. [Google Scholar] [CrossRef] [PubMed]
- Capello, G.; Biddoccu, M.; Ferraris, S.; Cavallo, E. Effects of tractor passes on hydrological and soil erosion processes in tilled and grassed vineyards. Water 2019, 11, 2118. [Google Scholar] [CrossRef]
- Xie, C.; Cai, S.; Yu, B.; Yan, L.; Liang, A.; Che, S. The effects of tree root density on water infiltration in urban soil based on a Ground Penetrating Radar in Shanghai, China. Urban For. Urban Green. 2020, 50, 126648. [Google Scholar] [CrossRef]
- Van Asch, T.W.; Sukmantalya, I.N. The modelling of soil slip erosion in the upper Komering area, South Sumatra Province, Indonesia. Geogr. Fis. Din. Quat. 1993, 16, 81–86. [Google Scholar]
- Reid, M.E. A pore-pressure diffusion model for estimating landslide-inducing rainfall. J. Geol. 1994, 102, 709–717. [Google Scholar] [CrossRef]
- Lu, N.; Godt, J.W. Infinite slope stability under unsaturated seepage conditions. Water Resour. Res. 2008, 44, W11404. [Google Scholar] [CrossRef]
- Lu, N.; Godt, J.W. Hillslope Hydrology and Stability; Cambridge University Press: Cambridge, UK, 2013. [Google Scholar]
- Bogaard, T.A.; Greco, R. Landslide hydrology: From hydrology to pore pressure. Wiley Interdiscip. Rev. Water 2016, 3, 439–459. [Google Scholar] [CrossRef]
- Meisina, C.; Bordoni, M.; Vercesi, A.; Maerker, M.; Ganimede, C.; Reguzzi, M.C.; Gagnarli, E. Effects of Vineyard Inter-Row Management on Soils; Roots and Shallow Landslides Probability in the Apennines, Lombardy, Italy. Proceedings 2019, 30, 41. [Google Scholar]


| Catchment | Nr | Min (m2) | 1st Qu. (m2) | Median (m2) | Mean (m2) | 3rd Qu. (m2) | Max (m2) |
|---|---|---|---|---|---|---|---|
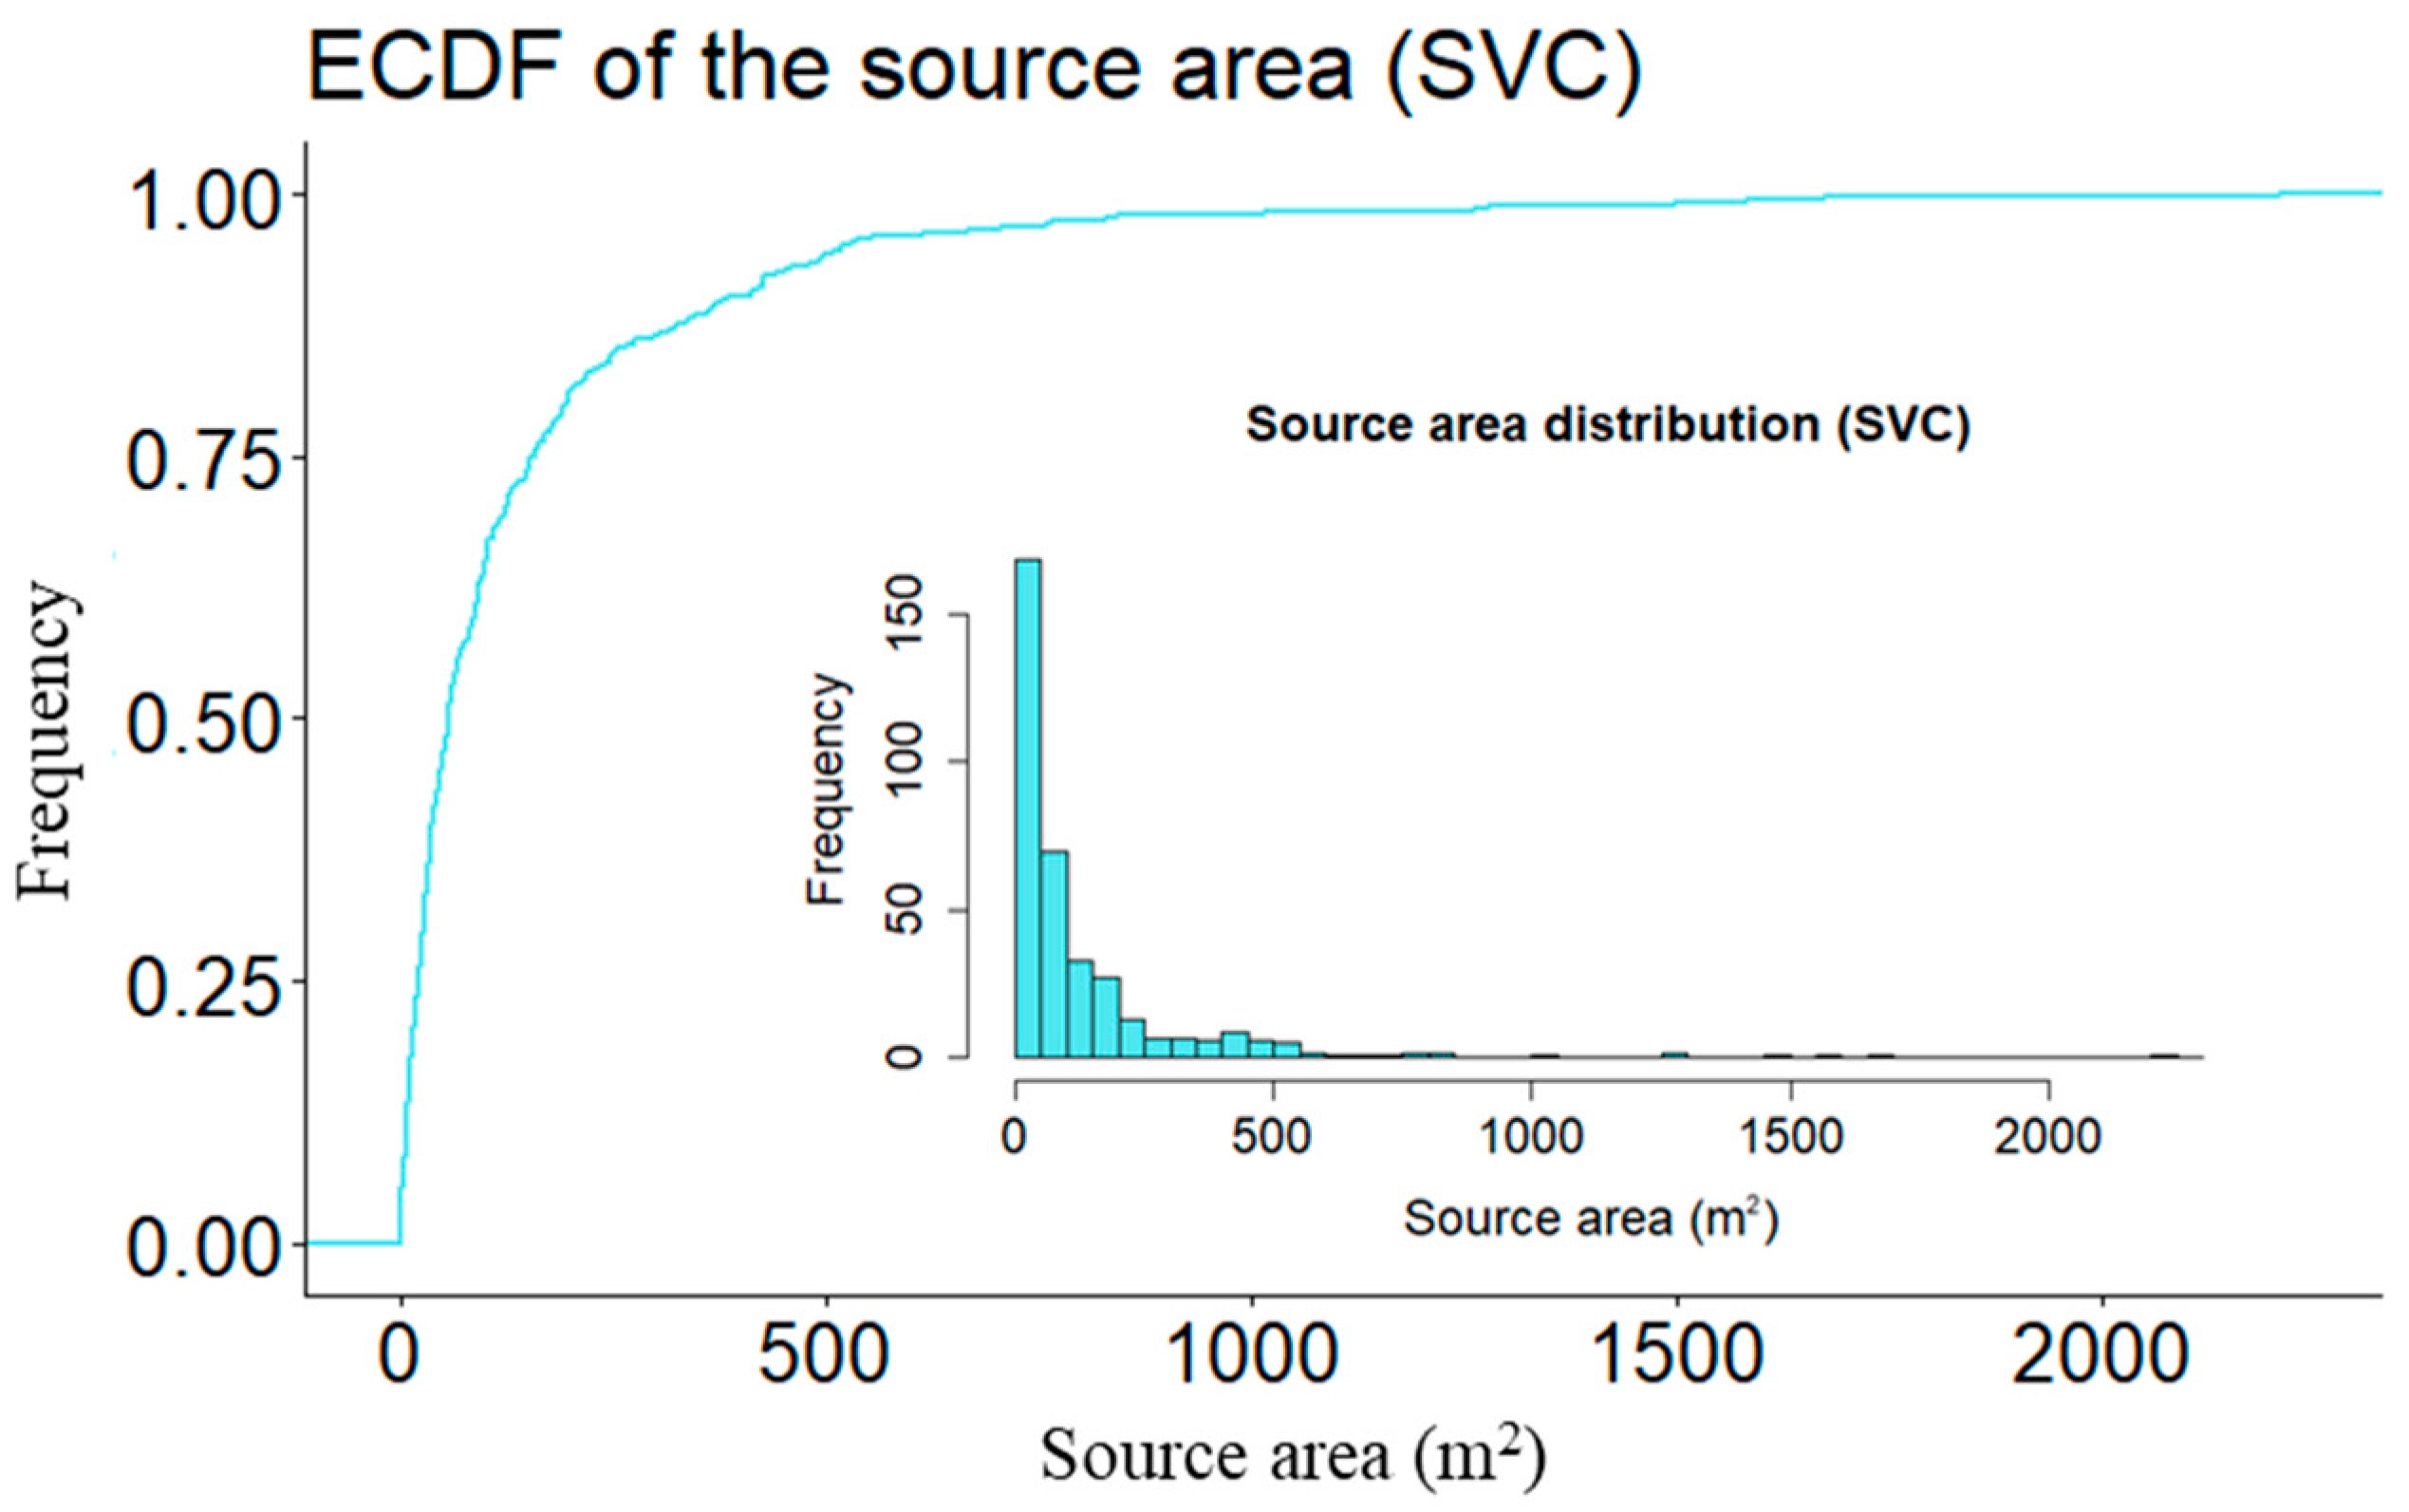
| SVC | 367 | 1 | 23 | 56 | 143 | 157 | 2210 |
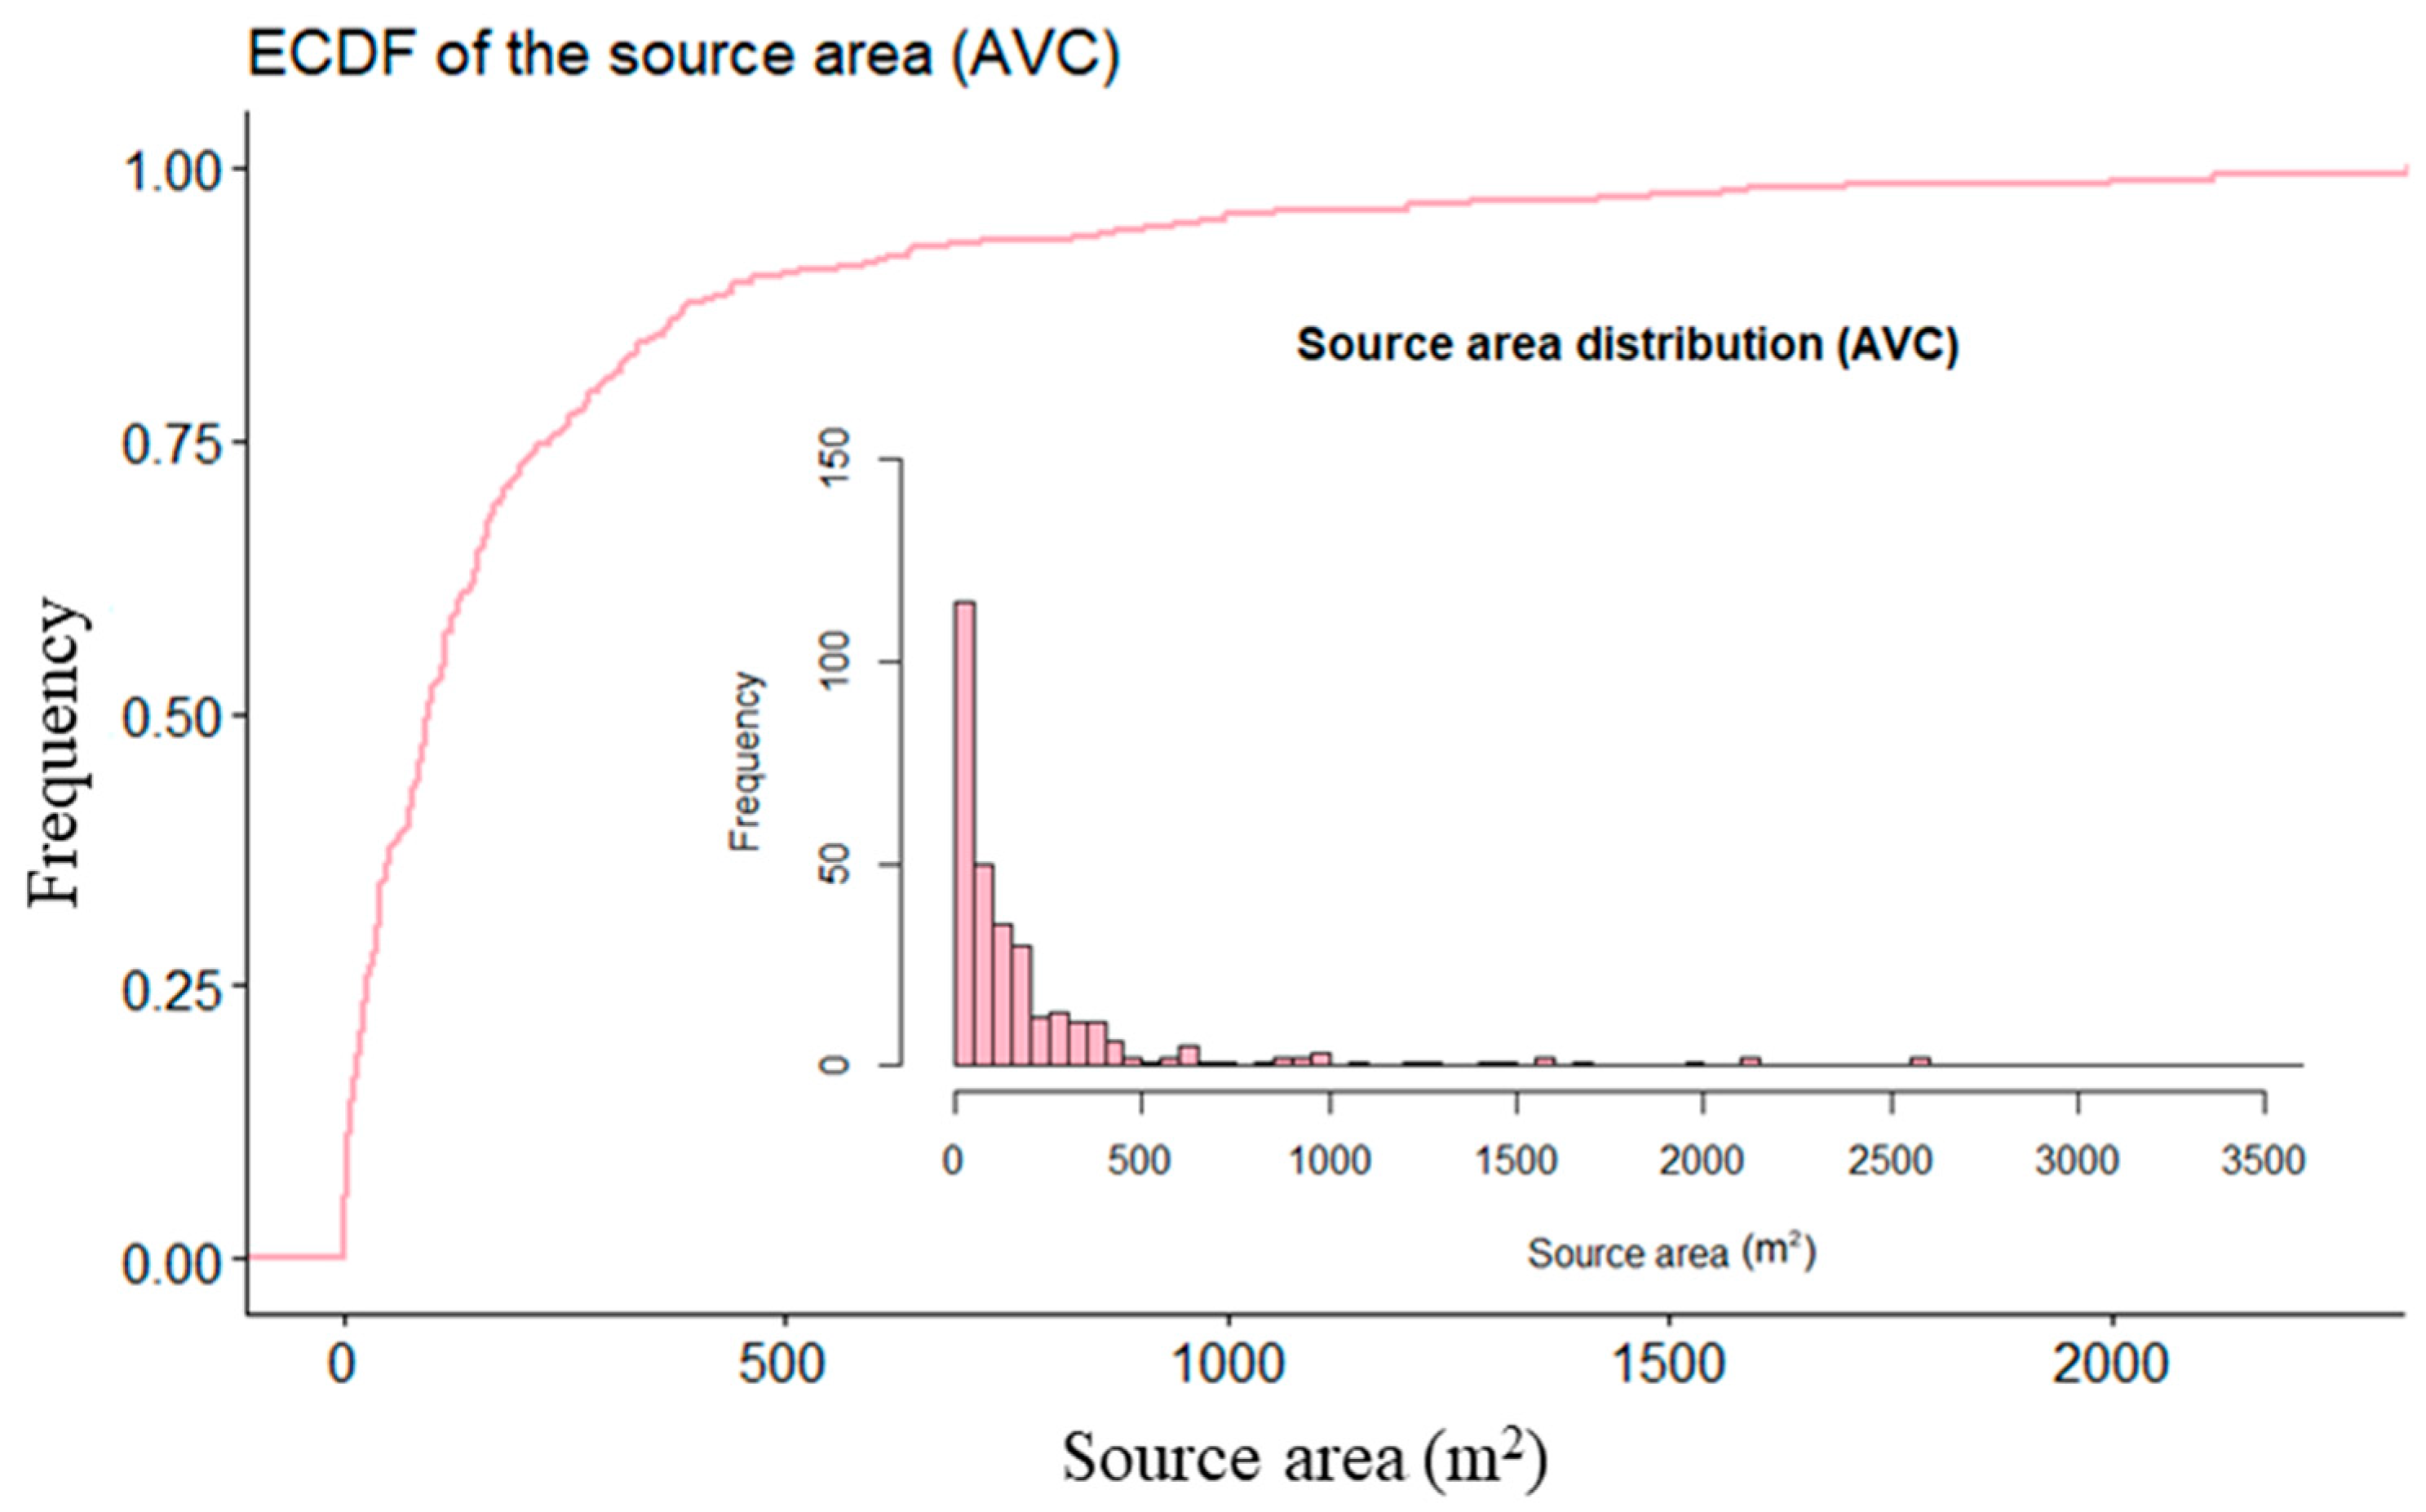
| AVC | 316 | 1 | 27 | 95 | 219 | 233 | 2557 |
| Catchment | Gravel Content (%) | Sand Content (%) | Silt Content (%) | Clay Content (%) | Liquid Limit (%) | Plasticity Index (%) | Unit Weight (kN/m3) | Saturated Hydraulic Conductivity (m/s) |
|---|---|---|---|---|---|---|---|---|
| SVC | 0.2–12.3 | 7.5–13.2 | 51.1–65.6 | 21.3–29.0 | 38.5–41.8 | 14.3–17.2 | 16–19 | 10−5–10−7 |
| AVC | 0.1–2.5 | 0.7–3.2 | 39.7–46.8 | 47.5–57.5 | 65.5–73.9 | 45.6–53.6 | 18–20 | 10−5–10−8 |
| Catchment | Nr | Duration (h) | Cumulated Rainfall (mm) | Nr of Landslides |
|---|---|---|---|---|
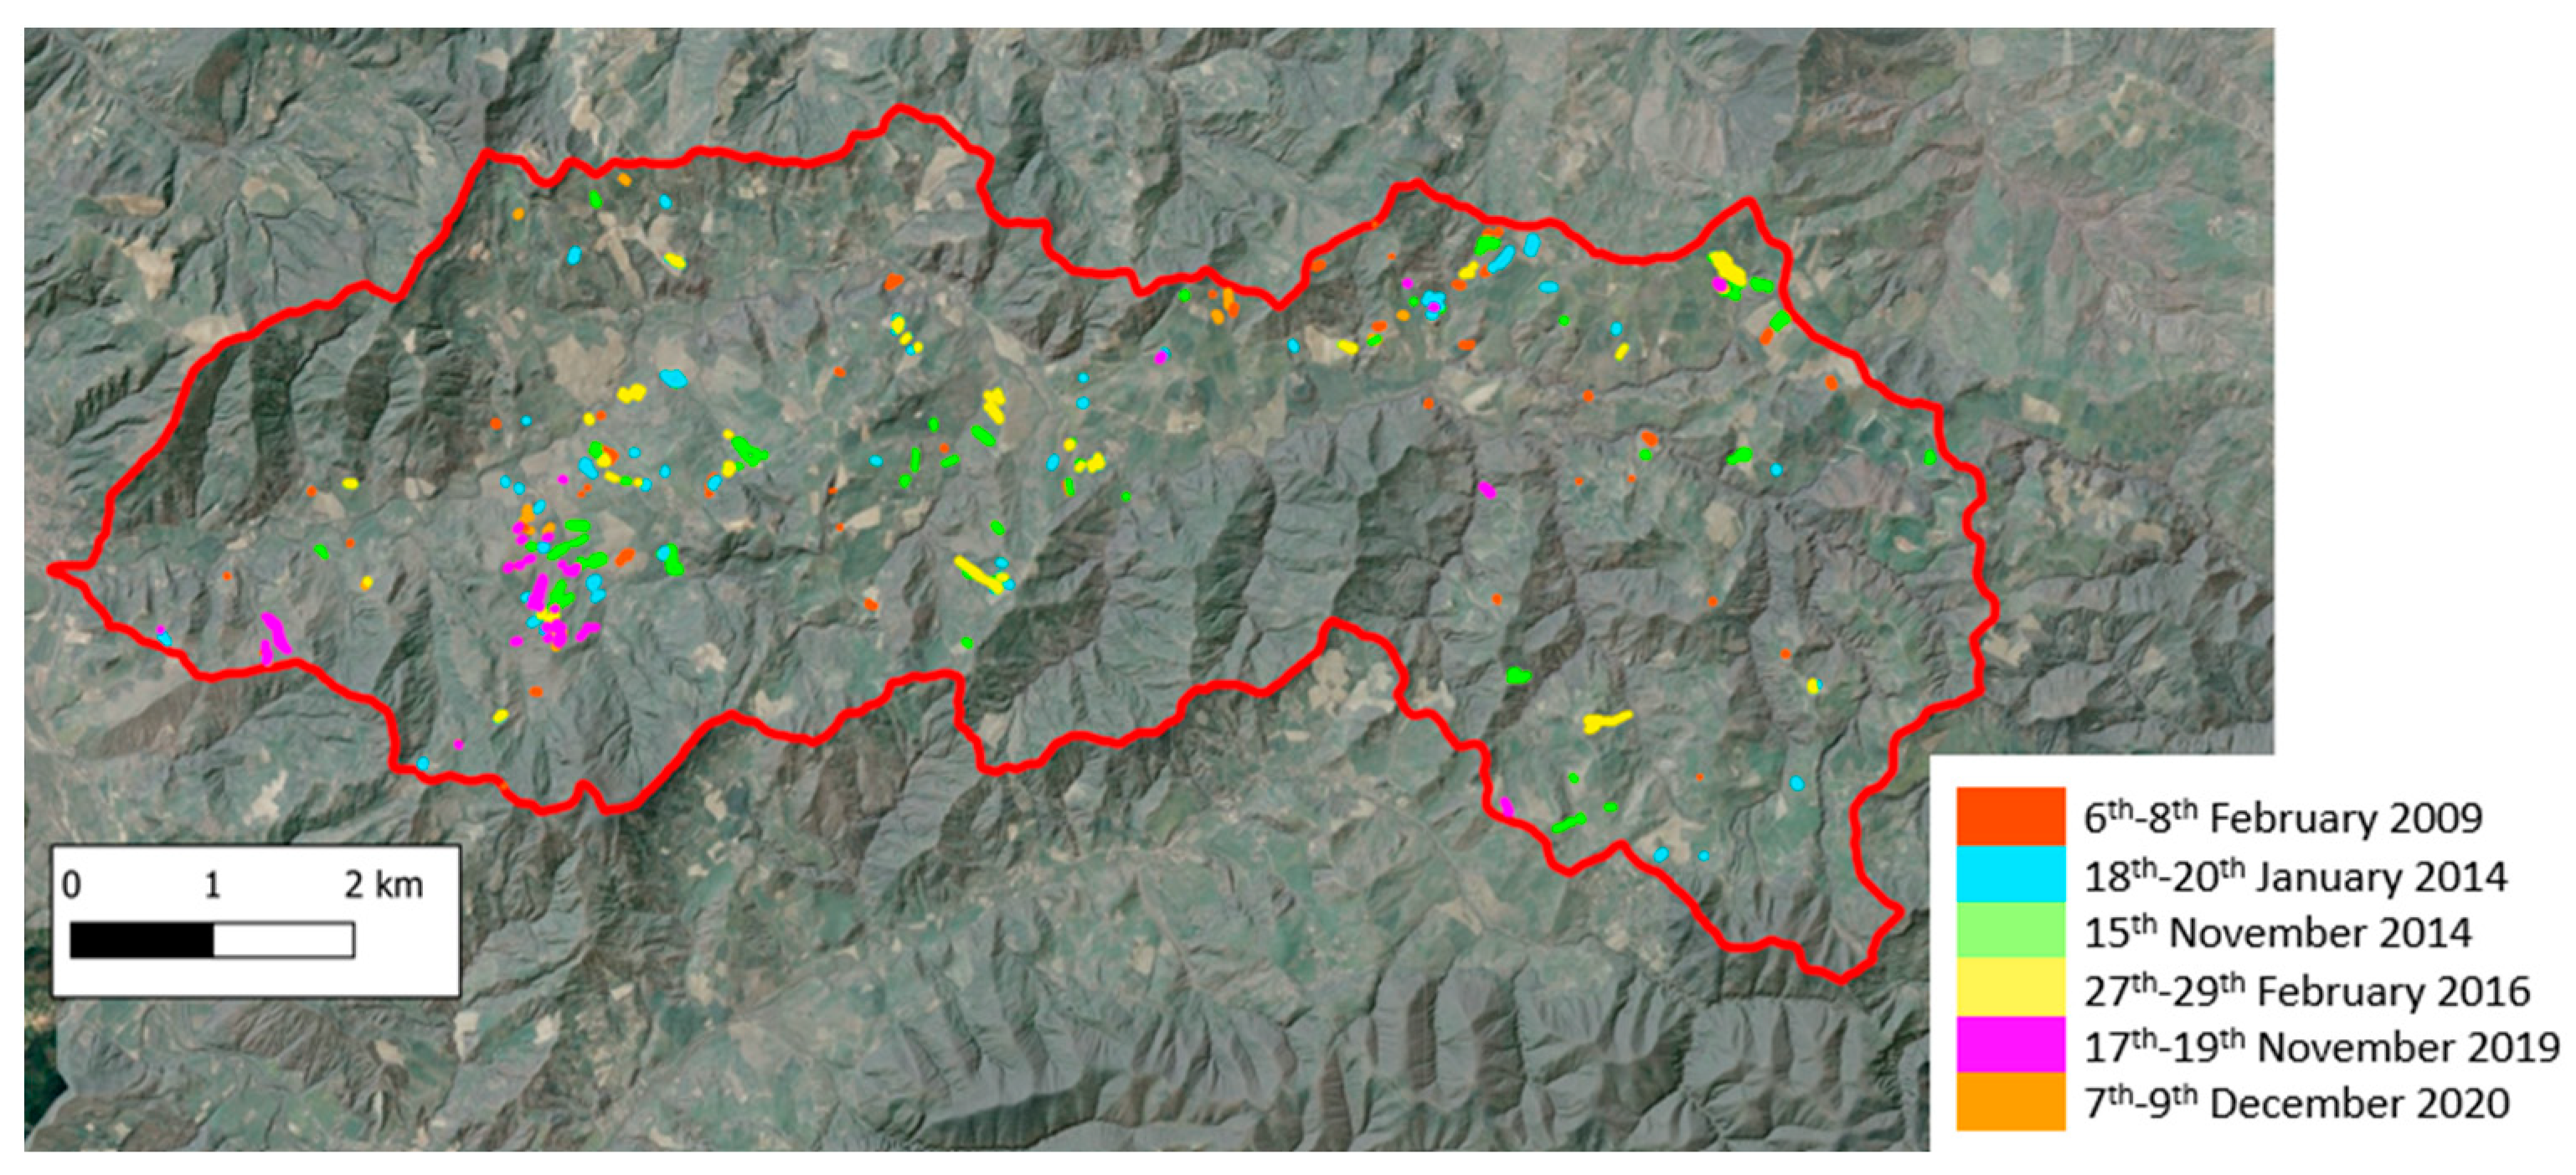
| 6–8 February 2009 | 60 | 39 | 45.2 | 60 |
| 18–20 January 2014 | 70 | 42 | 52.0 | 70 |
| 15 November 2014 | 89 | 14 | 50.6 | 89 |
| 27–29 February 2016 | 55 | 50 | 101.8 | 55 |
| 17–19 November 2019 | 23 | 72 | 91.6 | 23 |
| 7–9 December 2020 | 19 | 65 | 78.8 | 19 |
| Land Use | Nr of Landslides per km2 | Source Area Size Classes | Nr of Landslides | Min. Median Slope Angle Value | Max. Median Slope Angle Value |
|---|---|---|---|---|---|
| Croplands | 0.816 | <50 m2 | 12 | 14.24 | 31.25 |
| 50–100 m2 | 9 | 9.12 | 32.92 | ||
| >100 m2 | 7 | 18.65 | 31.21 | ||
| Shrublands | 0.292 | <50 m2 | 35 | 3.33 | 48.00 |
| 50–100 m2 | 8 | 16.94 | 30.64 | ||
| >100 m2 | 23 | 14.35 | 49.26 | ||
| Vineyards | 0.229 | <50 m2 | 59 | 4.70 | 36.39 |
| 50–100 m2 | 17 | 8.05 | 44.01 | ||
| >100 m2 | 27 | 10.84 | 35.58 | ||
| Woodlands | 0.753 | <50 m2 | 62 | 6.92 | 48.09 |
| 50–100 m2 | 36 | 23.81 | 46.33 | ||
| >100 m2 | 72 | 15.32 | 54.72 |
| Land Use | Source Area Size Classes | Nr of Landslides | Min. Median Slope Angle Value | Max. Median Slope Angle Value |
|---|---|---|---|---|
| February 2009 | <50 m2 | 31 | 1.75 | 23.74 |
| 50–100 m2 | 7 | 7.97 | 19.44 | |
| >100 m2 | 22 | 1.08 | 22.68 | |
| January 2014 | <50 m2 | 31 | 6.64 | 22.14 |
| 50–100 m2 | 11 | 11.52 | 19.64 | |
| >100 m2 | 28 | 7.92 | 19.86 | |
| November 2014 | <50 m2 | 38 | 8.21 | 20.53 |
| 50–100 m2 | 13 | 4.88 | 21.75 | |
| >100 m2 | 38 | 6.75 | 22.86 | |
| February 2016 | <50 m2 | 11 | 9.65 | 17.49 |
| 50–100 m2 | 10 | 9.52 | 17.63 | |
| >100 m2 | 34 | 9.22 | 24.40 | |
| November 2019 | <50 m2 | 1 | 16.82 | 16.82 |
| 50–100 m2 | 7 | 11.82 | 23.30 | |
| >100 m2 | 15 | 4.66 | 21.59 | |
| December 2020 | <50 m2 | 3 | 10.38 | 20.23 |
| 50–100 m2 | 2 | 12.63 | 18.44 | |
| >100 m2 | 14 | 10.61 | 19.32 |
| Land Use | Nr | Minimum (m2) | Maximum (m2) | Mean (m2) | Median (m2) |
|---|---|---|---|---|---|
| Croplands | 28 | 1 | 527 | 115 | 63 |
| Shrublands | 66 | 1 | 1015 | 27 | 27 |
| Vineyards | 103 | 1 | 1280 | 92 | 37 |
| Woodlands | 170 | 1 | 2210 | 187 | 73 |
| Comparison | Z (-) | p-Value (-) | |
|---|---|---|---|
| Woodlands | Shrublands | 1.99 | 0.24 |
| Woodlands | Croplands | 0.98 | 0.98 |
| Shrublands | Croplands | −0.48 | 0.63 |
| Woodlands | Vineyards | 3.49 | 0.00 |
| Shrublands | Vineyards | 0.71 | 0.96 |
| Croplands | Vineyards | 1.07 | 1.00 |
| Event | Nr | Minimum (m2) | Maximum (m2) | Mean (m2) | Median (m2) |
|---|---|---|---|---|---|
| 6–8 February 2009 | 60 | 1 | 998 | 129 | 45 |
| 18–20 January 2014 | 70 | 1 | 1556 | 163 | 75 |
| 15 November 2014 | 89 | 1 | 2557 | 273 | 95 |
| 27–29 February 2016 | 55 | 1 | 1997 | 320 | 159 |
| 17–19 November 2019 | 23 | 33 | 1275 | 218 | 115 |
| 7–9 December 2020 | 19 | 36 | 387 | 164 | 143 |
| Comparison | Z (-) | p-Value (-) | |
|---|---|---|---|
| 7–9 December 2020 | 6–8February 2009 | 2.44 | 0.16 |
| 7–9 December 2020 | 27–29 February 2016 | −0.13 | 1.00 |
| 6–8 February 2009 | 27–29 February 2016 | −3.63 | 0.00 |
| 7–9 December 2020 | 18–20 January 2014 | 2.15 | 0.28 |
| 6–8 February 2009 | 18–20 January 2014 | −0.49 | 1.00 |
| 27–29 February 2016 | 18–20 January 2014 | 3.28 | 0.01 |
| 7–9 December 2020 | 15 November 2014 | 1.79 | 0.52 |
| 6–8February 2009 | 15 November 2014 | −1.14 | 1.00 |
| 27–29 February 2016 | 15 November 2014 | 2.84 | 0.06 |
| 18–20 January 2014 | 15 November 2014 | −0.66 | 1.00 |
| 7–9 December 2020 | 17–19 November 2019 | −0.05 | 0.96 |
| 6–8February 2009 | 17–19November 2019 | −2.68 | 0.09 |
| 27–29 February 2016 | 17–19November 2019 | 0.08 | 1.00 |
| 18–20 January 2014 | 17–19November 2019 | −2.38 | 0.17 |
| 15 November 2014 | 17–19November 2019 | −2.00 | 0.37 |
| Predictor | Function | RMSE (m2) | F (-) | p-Value (-) |
|---|---|---|---|---|
| Event cumulated rainfall amount | 0.43x1.26 | 16.5 | 12.00 | 0.02 |
| Event mean intensity | 70.05x0.42 | 51.5 | 0.68 | 0.46 |
| 3-day antecedent cumulated rainfall amount | 0.24x1.39 | 18.2 | 8.25 | 0.04 |
| 5-day antecedent cumulated rainfall amount | 0.08x1.56 | 21.5 | 8.05 | 0.04 |
| 7-day antecedent cumulated rainfall amount | 0.36x1.20 | 28.0 | 5.36 | 0.08 |
| 14-day antecedent cumulated rainfall amount | 0.33x1.16 | 33.4 | 2.73 | 0.17 |
| 30-day antecedent cumulated rainfall amount | 1.85x0.75 | 34.8 | 1.04 | 0.36 |
| 60-day antecedent cumulated rainfall amount | 2.40x0.67 | 36.1 | 0.30 | 0.61 |
Disclaimer/Publisher’s Note: The statements, opinions and data contained in all publications are solely those of the individual author(s) and contributor(s) and not of MDPI and/or the editor(s). MDPI and/or the editor(s) disclaim responsibility for any injury to people or property resulting from any ideas, methods, instructions or products referred to in the content. |
© 2023 by the authors. Licensee MDPI, Basel, Switzerland. This article is an open access article distributed under the terms and conditions of the Creative Commons Attribution (CC BY) license (https://creativecommons.org/licenses/by/4.0/).
Share and Cite
Giarola, A.; Bordoni, M.; Zucca, F.; Meisina, C. Analysis of the Role of Precipitation and Land Use on the Size of the Source Area of Shallow Landslides. Water 2023, 15, 3340. https://doi.org/10.3390/w15193340
Giarola A, Bordoni M, Zucca F, Meisina C. Analysis of the Role of Precipitation and Land Use on the Size of the Source Area of Shallow Landslides. Water. 2023; 15(19):3340. https://doi.org/10.3390/w15193340
Chicago/Turabian StyleGiarola, Alessia, Massimiliano Bordoni, Francesco Zucca, and Claudia Meisina. 2023. "Analysis of the Role of Precipitation and Land Use on the Size of the Source Area of Shallow Landslides" Water 15, no. 19: 3340. https://doi.org/10.3390/w15193340
APA StyleGiarola, A., Bordoni, M., Zucca, F., & Meisina, C. (2023). Analysis of the Role of Precipitation and Land Use on the Size of the Source Area of Shallow Landslides. Water, 15(19), 3340. https://doi.org/10.3390/w15193340