Article

Assessing 30-Year Land Use and Land Cover Change and the Driving Forces in Qianjiang, China, Using Multitemporal Remote Sensing Images

1
Yangtze River Basin Ecological Environment Monitoring and Scientific Research Center, Yangtze River Basin Ecological Environment Supervision and Administration Bureau, Ministry of Ecology and Environment, Wuhan 430010, China
2
School of Urban and Regional Planning, Yancheng Teachers University, Yancheng 224000, China
*
Authors to whom correspondence should be addressed.
Water 2023, 15(18), 3322; https://doi.org/10.3390/w15183322
Submission received: 16 August 2023 / Revised: 11 September 2023 / Accepted: 19 September 2023 / Published: 21 September 2023

Abstract

:
Assessing Land Use and Land Cover Change (LULCC) related with aquaculture areas is vital for evaluating the impacts of aquaculture ponds on the environment and developing a sustainable aquaculture production system. Most studies analyze changes in aquaculture land in coastal areas, and little research focuses on the inland area, where the conversions between agriculture and aquaculture land is primarily driven by socioeconomic factors. This study assessed LULCC related to aquaculture areas in Qianjiang City, China, from 1990 to 2022, using multitemporal Landsat images and a combination of decision tree classifier and visual interpretation. The LULCC was analyzed by the transition matrix. Results showed that the main LULC type was farmland, which accounted for more than 70% of the study area from 1990 to 2022. The built-up and aquaculture land showed an increasing trend year by year. In contrast, there was a gradual decline in forest/grass land from 1990 to 2016, and then its area increased slightly from 2016 to 2022 due to the policy of returning farmland to forest. Water areas were mainly composed of rivers and ponds, with subtle changes during the study period. The main driving forces of LULCC in Qianjiang City were economic and policy factors, with rapid GDP growth and government policies being the dominant factors.

1. Introduction

Land Use and Land Cover Change (LULCC) refers to the transformation of the earth’s terrestrial surface, primarily driven by human activities. These changes may occur in the form of deforestation, urbanization, urban heat islands, water resources imbalance, agriculture expansion, or other alterations in land use and land cover (LULC) [1,2,3]. Aquaculture in developing countries is a global phenomenon associated with controversies, because aquaculture brings positive economic impacts on low-income rural communities while it is also related to the environmental degradation and the loss of cropland [4,5]. Assessment of LULCC, particularly the evolution of aquaculture, helps detect the impact of human activities on natural environment [6].
The remote sensing technique provides an effective tool to evaluate LULCC at different scales [7,8]. A number of remote sensing studies have mapped aquacultural land and assessed LULCC related to aquaculture using satellite and airborne images [9,10]. To identify aquaculture ponds is challenging due to nonlinearities resulting from variations in bottom reflectance, complexities of sediment and biota in the water, and the mixture of water and surrounding objects [11]. Virdis mapped aquaculture ponds in Vietnam with an object-based classification method and very-high-spatial-resolution satellite images Virdis [12]. J. Al Sayah et al. mapped aquaculture pond in France with the Normalized Difference Water Index (NDWI) extracted from multitemporal Landsat images [13]. The comparison between the aquaculture pond map and land surface temperature map showed that ponds buffered local microclimates even within the same landscape. In addition to multispectral remote sensing data, aquaculture areas have also been mapped by SAR data. Ottinger et al. mapped aquaculture ponds in major river deltas in China and Vietnam using Sentinel-1 time series images [14]. The aquaculture pond map reached an accuracy of 83%. Meng et al. monitored LULCC in Nansi Lake using Landsat 5/8 images and found that the aquaculture area showed an increasing trend from 1987 to 2017, where the overall accuracy of each type was mostly above 80% [15].
Aquaculture ponds, with their high yields and easy management, have occupied several natural coastal wetlands and river deltas. Assessment of the LULCC change related with aquaculture areas is vital for evaluating the impacts of aquaculture ponds on the environment and developing a sustainable aquaculture production system. Meena monitored Kolleru Lake’s ecosystem through mapping the distribution of illegal fishponds around the lake area over the past five decades. The results indicated that the area of illegal fishponds has decreased slightly through policy intervention [16]. Duan et al. tracked changes in aquaculture ponds on the China coast using 30 years of Landsat images [10]. They found that the aquaculture areas experienced a rapidly increasing period from 1990 to 2011, a stable period from 2011 to 2017, and a sharply shrinking period after 2017. Sousa and Small analyzed land cover dynamics on the lower Ganges–Brahmaputra Delta from 1972 to 2017 using a combination of MODIS composites and Landsat images [17]. Results showed that standing water area within Bangladesh has expanded from less than 300 km2 in 1990 to over 1400 km2 in 2015, mainly caused by the increased interconnected networks of flooded areas associated with aquaculture.
Most studies of assessing LULCC related with aquaculture areas are conducted in coastal areas, and little research focuses on the inland area, where the conversions between agriculture and aquaculture land is primarily driven by socioeconomic factors. For example, a new rice–crawfish farming model has been promoted in the lower-middle reaches of the Yangtze River basin [18]. Qianjiang, a city situated in central China, is the origin of the rice–crawfish farming model. After a decade of rapid expansion in aquaculture area, Qianjiang city has become an important area for crawfish production. Therefore, the objective of this study is to evaluate the spatiotemporal LULCC related with aquaculture areas in Qianjiang city, Hubei province, China, from 1990 to 2022. LULC are classified based on Landsat time series images using the combination of the decision tree algorithm and visual interpretation.

2. Data and Methods

2.1. Study Area

The study area is Qianjiang city (112°29′39″~113°01′27″ E, 30°04′53″~30°38′53″ N), a sub-prefecture-level city of south-central Hubei province, China. The city spans an area of 2030 km2. Qianjiang has a humid subtropical climate, with an annual (1988–2017) temperature of 16.6 ℃, precipitation of 1162 mm, and average annual sunlight hours of 1949–1988 h. Qianjiang is located in the Jianghan Plain, with a complex network of rivers and numerous lakes and ponds. It serves as a production base for crops such as grains, cotton, oil, and fisheries. The main LULC types in the region include arable and aquaculture land. Therefore, monitoring LULCC in Qianjiang is of great significance for understanding the relationship between human activities and the natural environment in the study area.

2.2. Data

Landsat images of Qianjiang City for the years 1990, 2006, 2015, and 2020 were obtained from the Geospatial Data Cloud (https://www.gscloud.cn/, accessed on 1 August 2022). Images on two different dates with cloud cover of less than 20% were acquired for each year (Table 1). In the image of the earlier date, both farmland and vegetation appeared as green, while in the image of the later date, vegetation remained green but farmland appeared yellow due to harvesting. The radiometric calibration and atmospheric corrections were conducted on all images in the ENVI5.3.
A global land cover map with a 30 m spatial resolution (GlobeLand30) was used to validate the classification result. GlobeLand30 data (version 2020) of Qianjiang County were downloaded from http://www.globallandcover.com (accessed on 1 August 2022). The database was developed by the National Geomatics Center of China and comprises ten land cover types, including water bodies, wetlands, artificial surfaces, cultivated lands, forests, shrublands, grasslands, and barren lands [19]. GlobeLand30 data have been evaluated and used by numerous studies [20,21].

2.3. Methods

2.3.1. LULC Classification and Validation

LULC types in the study area were classified using the decision tree classifier and artificial visual interpretation. The decision tree algorithm is a non-parametric machine learning algorithm that has been widely used for remote sensing applications [22]. It builds a flowchart-like tree structure by recursively partitioning the data based on the values of input features. Each internal node represents a decision based on a specific feature, and each leaf node represents the predicted class or regression output. This classification method can handle large datasets with noisy or missing data and capture complex non-linear relationships between features and classes [22,23]. Artificial visual interpretation combines remote sensing images with human knowledge and experience, and then carries out the process of reasoning and judgment, which is an effective auxiliary means of artificial intelligence. Artificial visual interpretation can correct the misclassified pixel types through position, shape and logical relationship. The visual interpretation process is completed in ArcGIS10.8.
For each year, multispectral images captured in July or August were used as inputs of the decision tree algorithm to classify LULC types into green vegetation, water bodies, and built-up area. The normalized difference vegetation index (NDVI) was calculated for each Landsat image, and the temporal difference of NDVI within a year was computed to classify the green vegetation into crop land and forest/grass. Cropland had a higher temporal difference of NDVI than forest/grass because of the pronounced leaf expansion within the growing season of crops. Since aquaculture ponds generally had regular shapes, natural water bodies and aquaculture areas were manually differentiated based on the shapes of water bodies. Figure 1 summarizes the flow chart of LULC classification. Classification was conducted in ENVI 5.3.
Every pixel from the LULC map in the year 2022 was cross-verified using GlobeLand30 data. Given that the GlobeLand30 data do not include aquaculture area, the combination of aquaculture and farmland from the LULC map in this study was compared against the farmland extracted from GlobeLand30 data. The overall accuracy, producer’s accuracy, and user’s accuracy were calculated to evaluate the accuracy of classification results.

2.3.2. LULCC Analysis

The characteristics of land use/cover change in Qianjiang was comprehensively analyzed using the land use/cover type transition matrix (Formula (1)). The transition matrix not only reflects the initial and final land use type but also captures the transitional changes of different land use/cover types during a certain study period. This facilitates an understanding of the land loss at the beginning of the study period, as well as the sources and compositions of land use/cover types at the end of the study period [24]. The LULC transition matrices were established for 1990–2006, 2006–2017, and 2017–2022. In each transition matrix, the area of LULCC from one type to another was computed by multiplying the area of a pixel (30 m × 30 m) by the quantity of pixels where the LULCC transitioned from type i to type j [25]. The data in the transfer matrix represent the transfer intensity of LULC type. Transfer matrix analysis can identify the key transfer points and discover the main trend of LULC. These changes may be due to policy adjustments, natural disasters, economic development and other factors, from which we can find out the main driving forces affecting land use change.
S ij = S 11 S 12 S 1 n S 21 S 22 S 2 n S n 1 S n 2 S nn
In the equation, S represents the area, n represents the number of land use types before and after the transition, i and j (where i, j = 1, 2, …, n) represent the land use types before and after the transition, and Sij represents the area of land type i converted to land type j. Each element in the matrix represents the flow of land type i before the transition to various land types after the transition, and each column element represents the area of land type j after the transition from various land types before the transition.

3. Results

3.1. Spatial Distribution of LULC

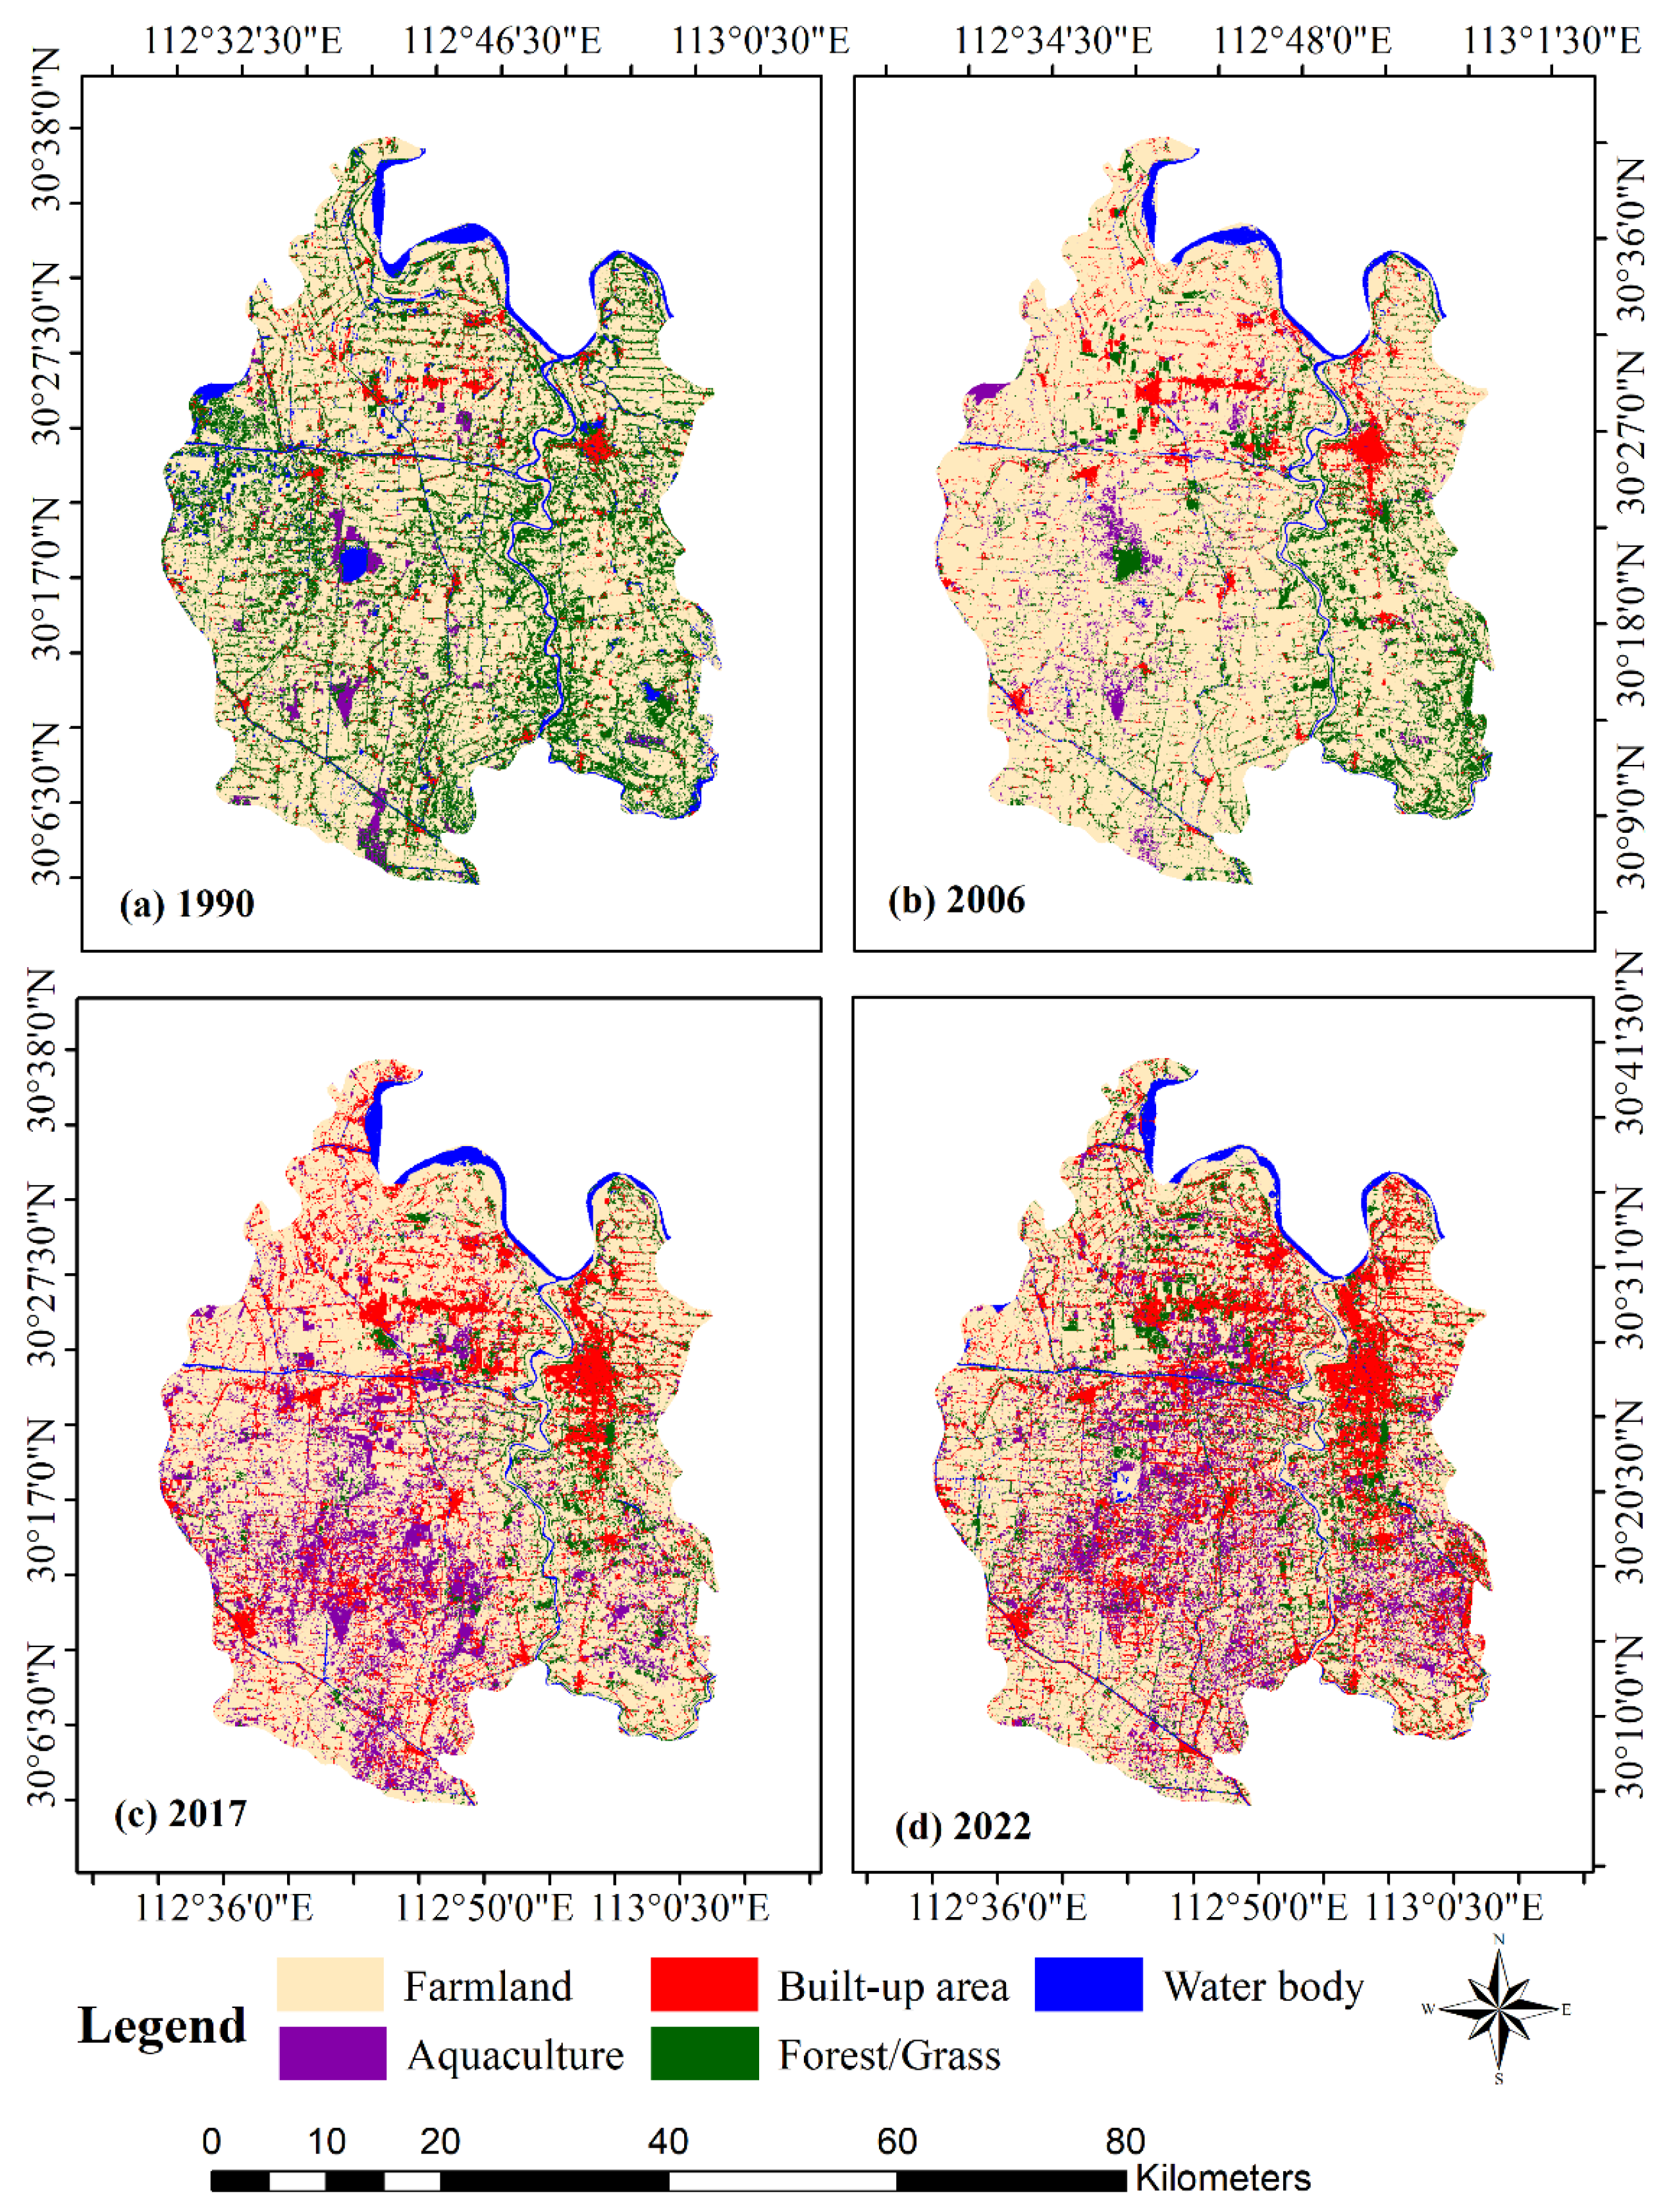
The spatial distribution of LULC in Qianjiang city over four periods is shown in Figure 2. In 1990, farmland was the main LULC type in Qianjiang city, but forest and grassland were widely distributed, mainly around rivers and villages, with only a small amount of built-up and aquaculture area. Since 2006, although farmland was still the primary LULC type, the built-up and aquaculture areas increased significantly, and the area of forest and grassland decreased. The forest and grassland, which were previously patchy and blocky, had largely transformed into other LULC types. The LULC in 2022 had little difference from 2017, and the landscape became more fragmented.

3.2. Spatial Distribution of Aquaculture Areas

The spatial distribution map of aquaculture areas in Qianjiang City (Figure 3) demonstrates that in 1990, there were only a few large freshwater aquaculture areas distributed in Qianjiang City, but by 2006, in addition to the existing aquaculture areas, numerous small ponds were scattered across the land of Qianjiang City. At this time, the aquaculture areas were still concentrated in the west-central region of Qianjiang City, with very few in the eastern region. With the development of aquaculture, by 2017, countless aquaculture ponds were densely distributed in the western part of Qianjiang City, and large aquaculture areas also appeared in the eastern part of Qianjiang. In 2022, the area of aquaculture in Qianjiang City had slightly declined.

3.3. Accuracy of Land Use/Cover Classification

Figure 4 illustrates that the LULC map derived from this study agreed with GlobeLand30 data. The overall accuracy of the LULC map was 73.06%. Farmland was the dominant LULC type in the study area. The producer’s accuracy of farmland was 92.9% and the user’s accuracy was 76.22%.
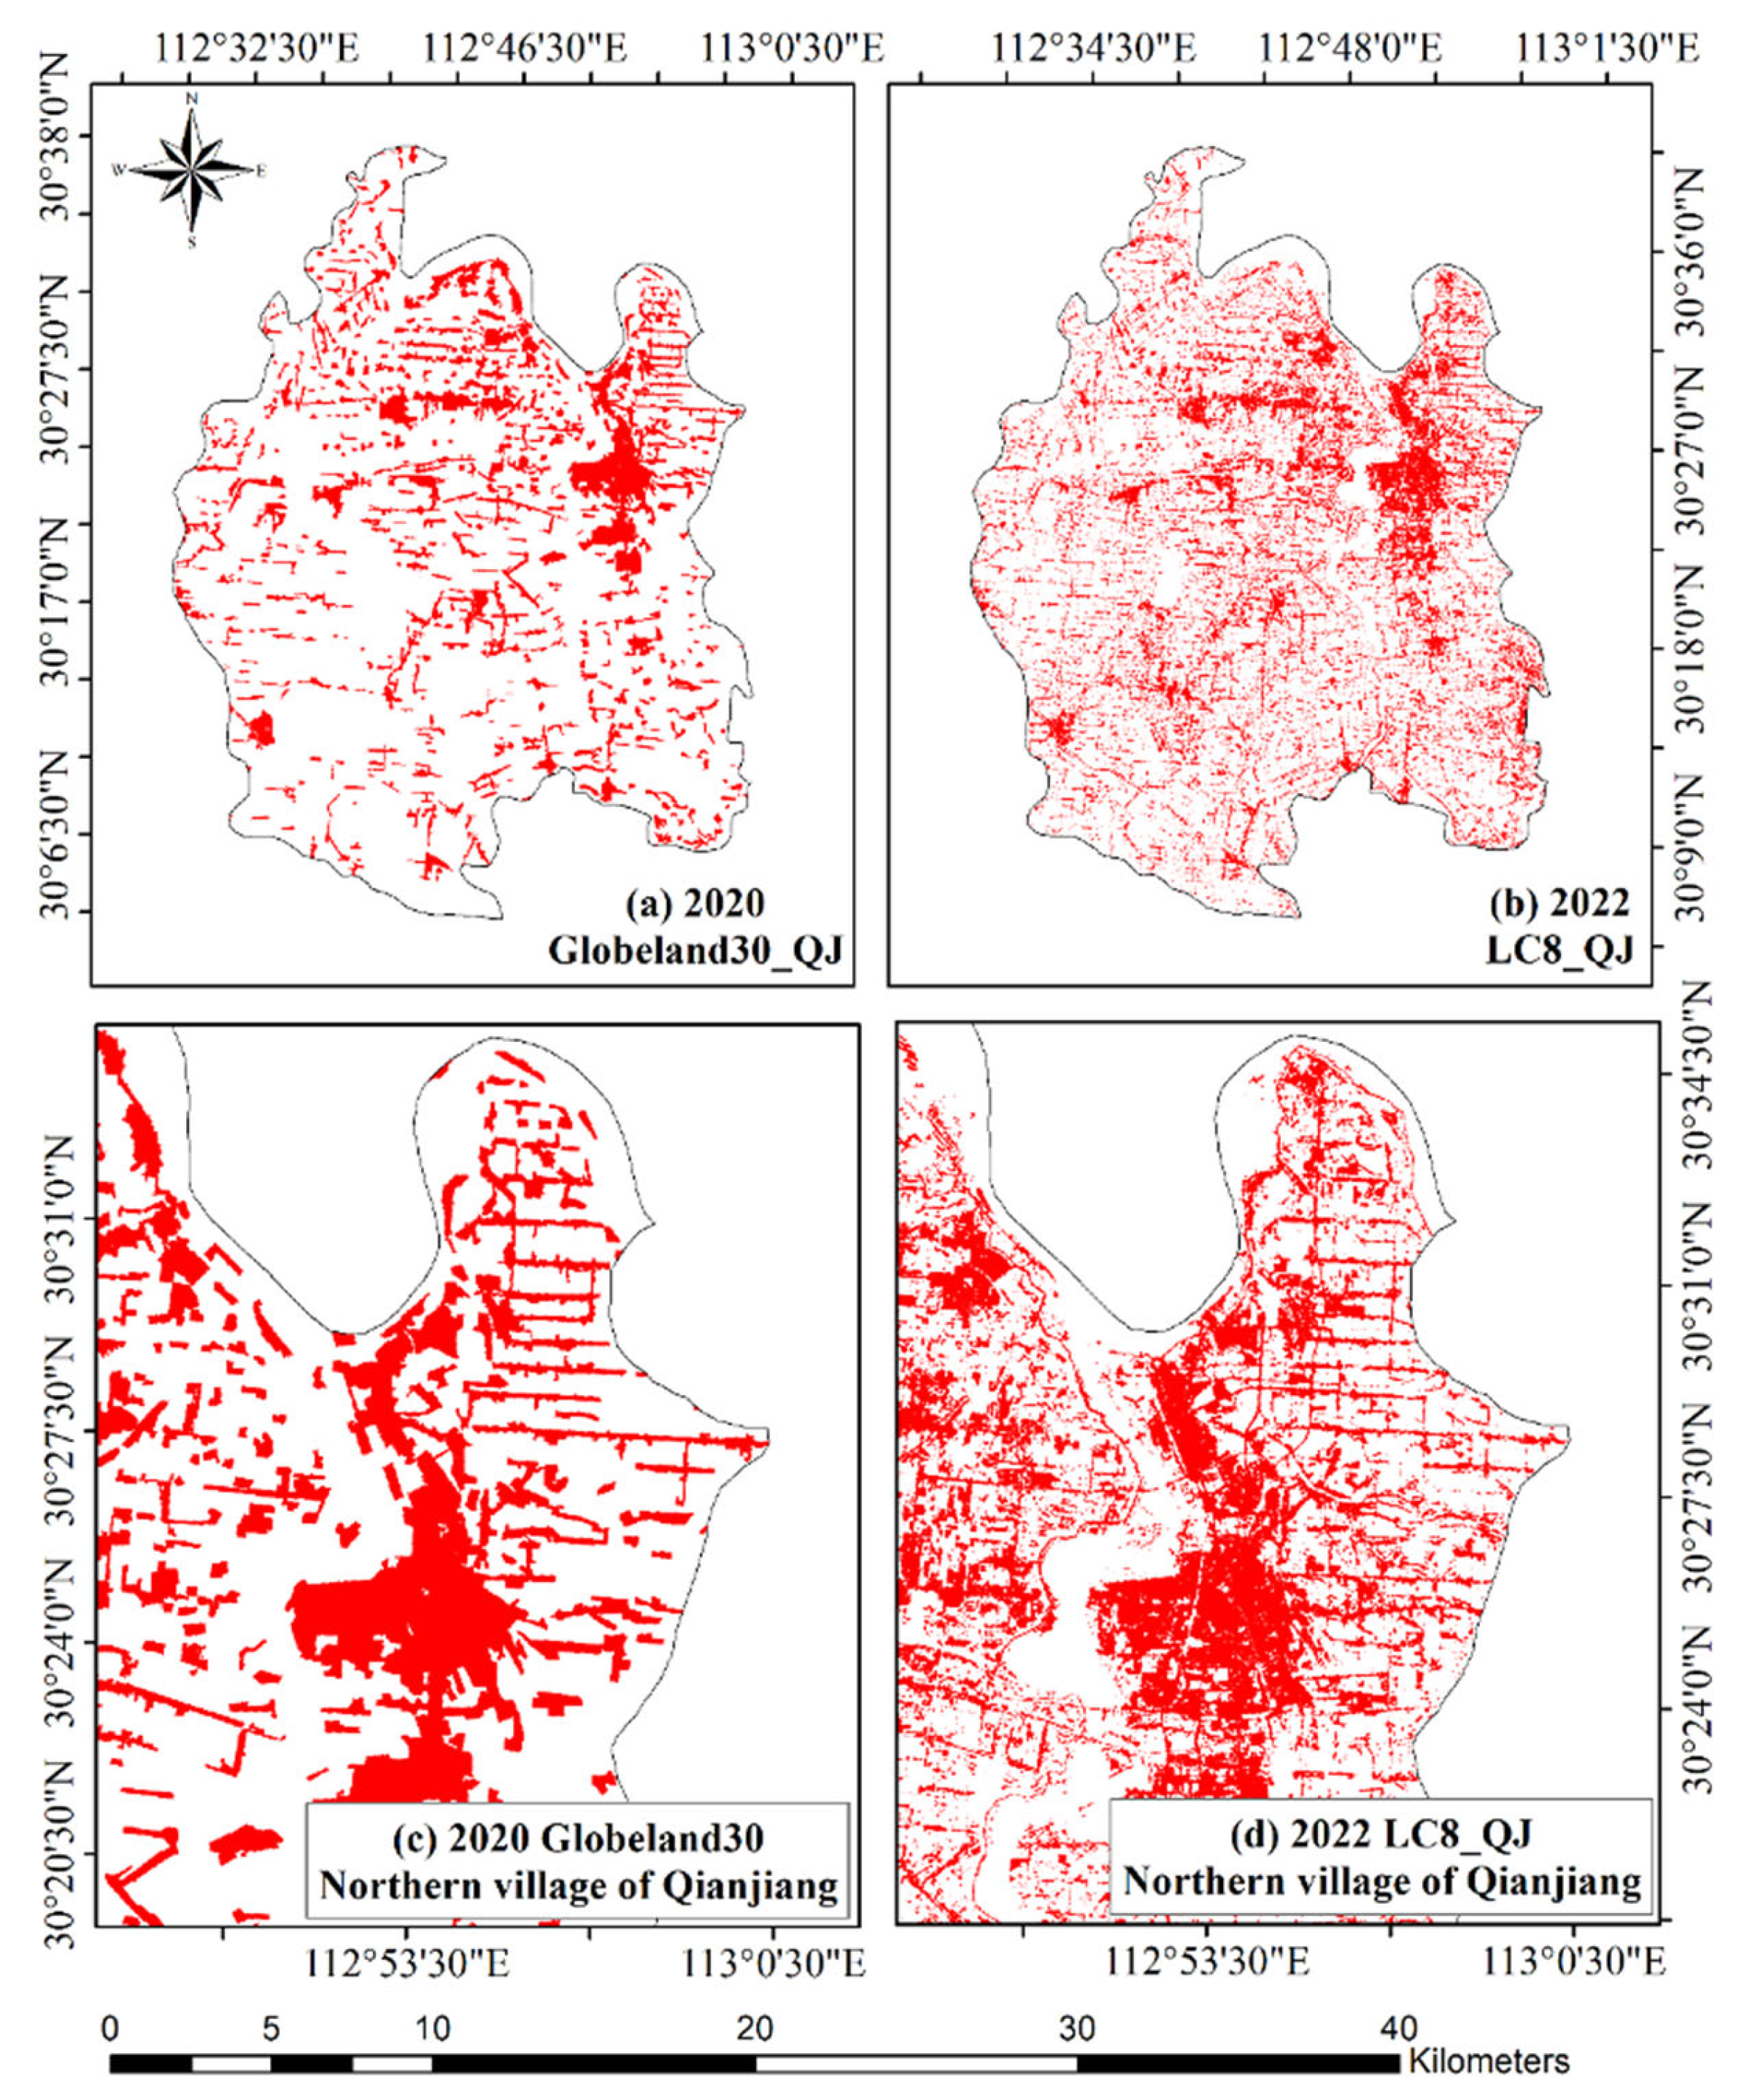
Figure 5 shows the comparison of the spatial distribution of the built-up areas extracted from GlobelLand30 data and those derived from the LULC map in this study. The LULC map in this study provided a more detailed representation of the built-up area, with specific emphasis on roadway infrastructure. The discrepancies observed between these two maps can be partially attributed to the emergence of new built-up areas over the two-year interval, given that the GlobeLand30 data correspond to the year 2020, while the LULC map generated in this study pertains to the year 2022. The producer’s accuracy of built-up area was 92.9% and the user’s accuracy was 76.22%.

4. Discussion

4.1. Land Use/Cover Change

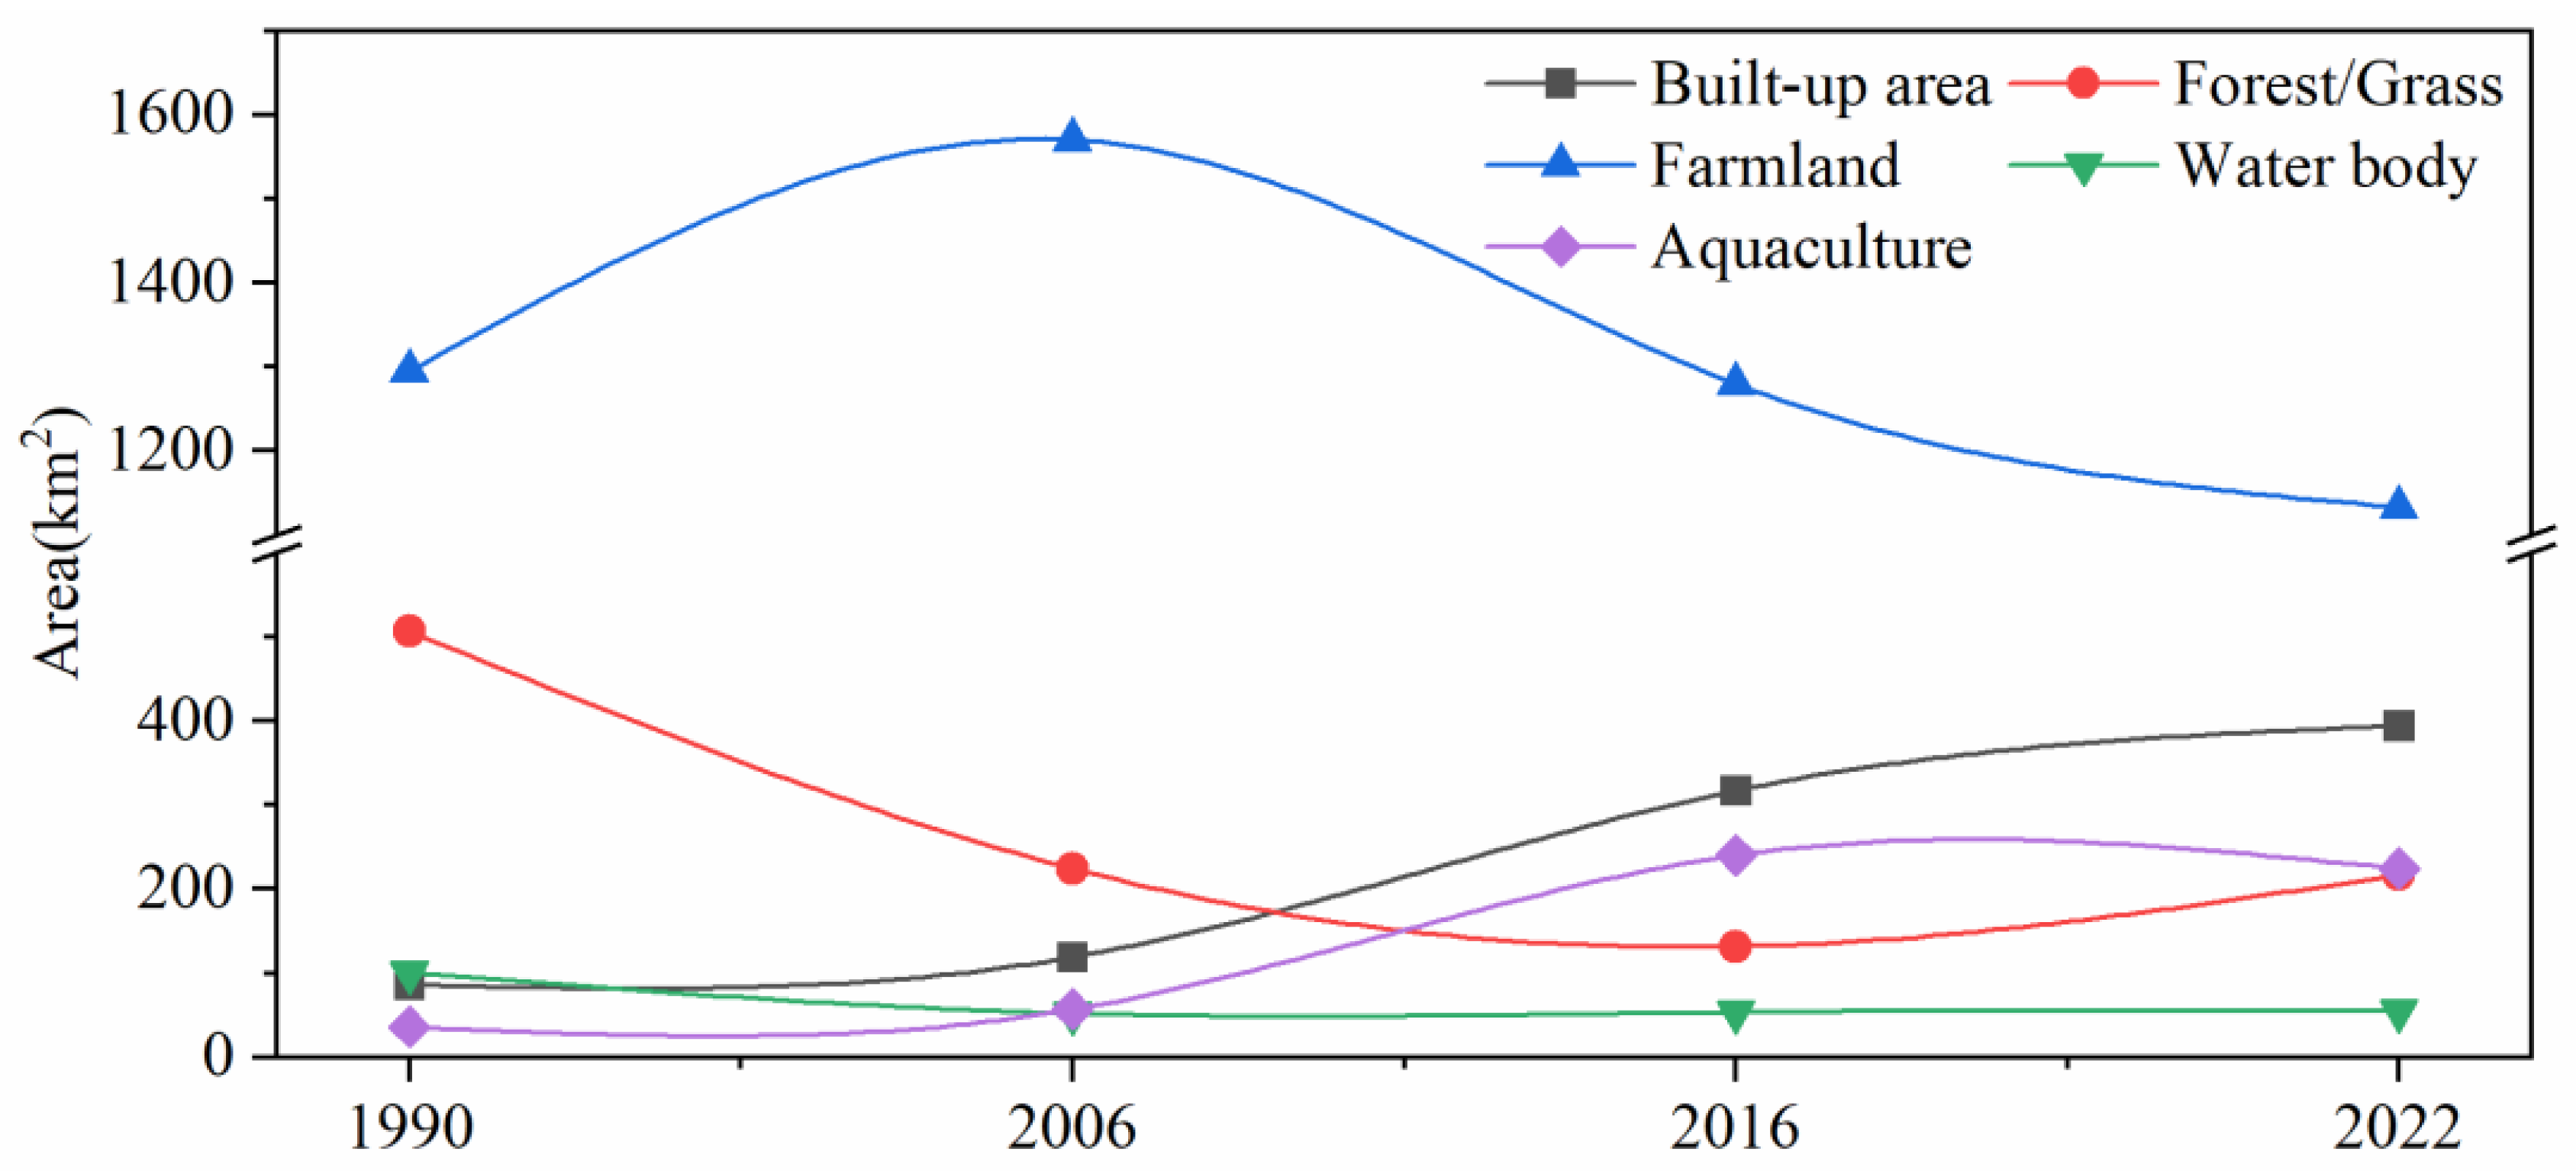
Land use trend analysis can reveal the relationship between land use change and economic development, providing guidance for formulating economic development plans and decisions, optimizing resource allocation, and enhancing efficiency [26]. Over the past thirty years, the areas of LULCC in Qianjiang City are shown in Figure 6. The area of farmland exhibited a trend of initial increase followed by a slight decrease, but overall, the area’s farmland was stable. In contrast, there was a gradual rise in both built-up and aquaculture land year by year. In particular, built-up area consistently increased since 1990. In 1990, the built-up area was 85.64 km2, while in 2022, it reached 394.33 km2, showing an increase of 308.69 km2 over the thirty-year period, with an average annual growth rate of 9.35 km2. The area of forest and grassland decreased from 506.48 km2 in 1990 to 132.01 km2 in 2017.
LULCC within the study area was the result of a combination of factors such as natural conditions, economic factors, and government policies [27]. Research conducted by Liu et al. in the Huai River Basin used multitemporal Landsat imagery and transition matrix analysis to examine the LULCC patterns and driving forces in the region. Findings from this study revealed that urbanization and population growth were the main drivers of LULCC in the Huai River Basin [28]. Furthermore, a study by Chen et al. in the Pearl River Delta region used a similar methodology to investigate the LULCC dynamics and driving mechanism [29]. Results showed that rapid economic development, population growth, and government policies were the main drivers of LULCC in the Pearl River Delta region. These studies have provided valuable inspiration for this article.
Qianjiang City is located in the heart of the Jianghan Plain, dominated by flat terrain. Thus, Qianjiang is a major agricultural city in Hubei province and a production base for grains, cotton, and oil crop. Although the proportion of built-up and aquaculture areas has grown dramatically in recent years, farmland remains the primary type of land use, with an average share of 65.22%.
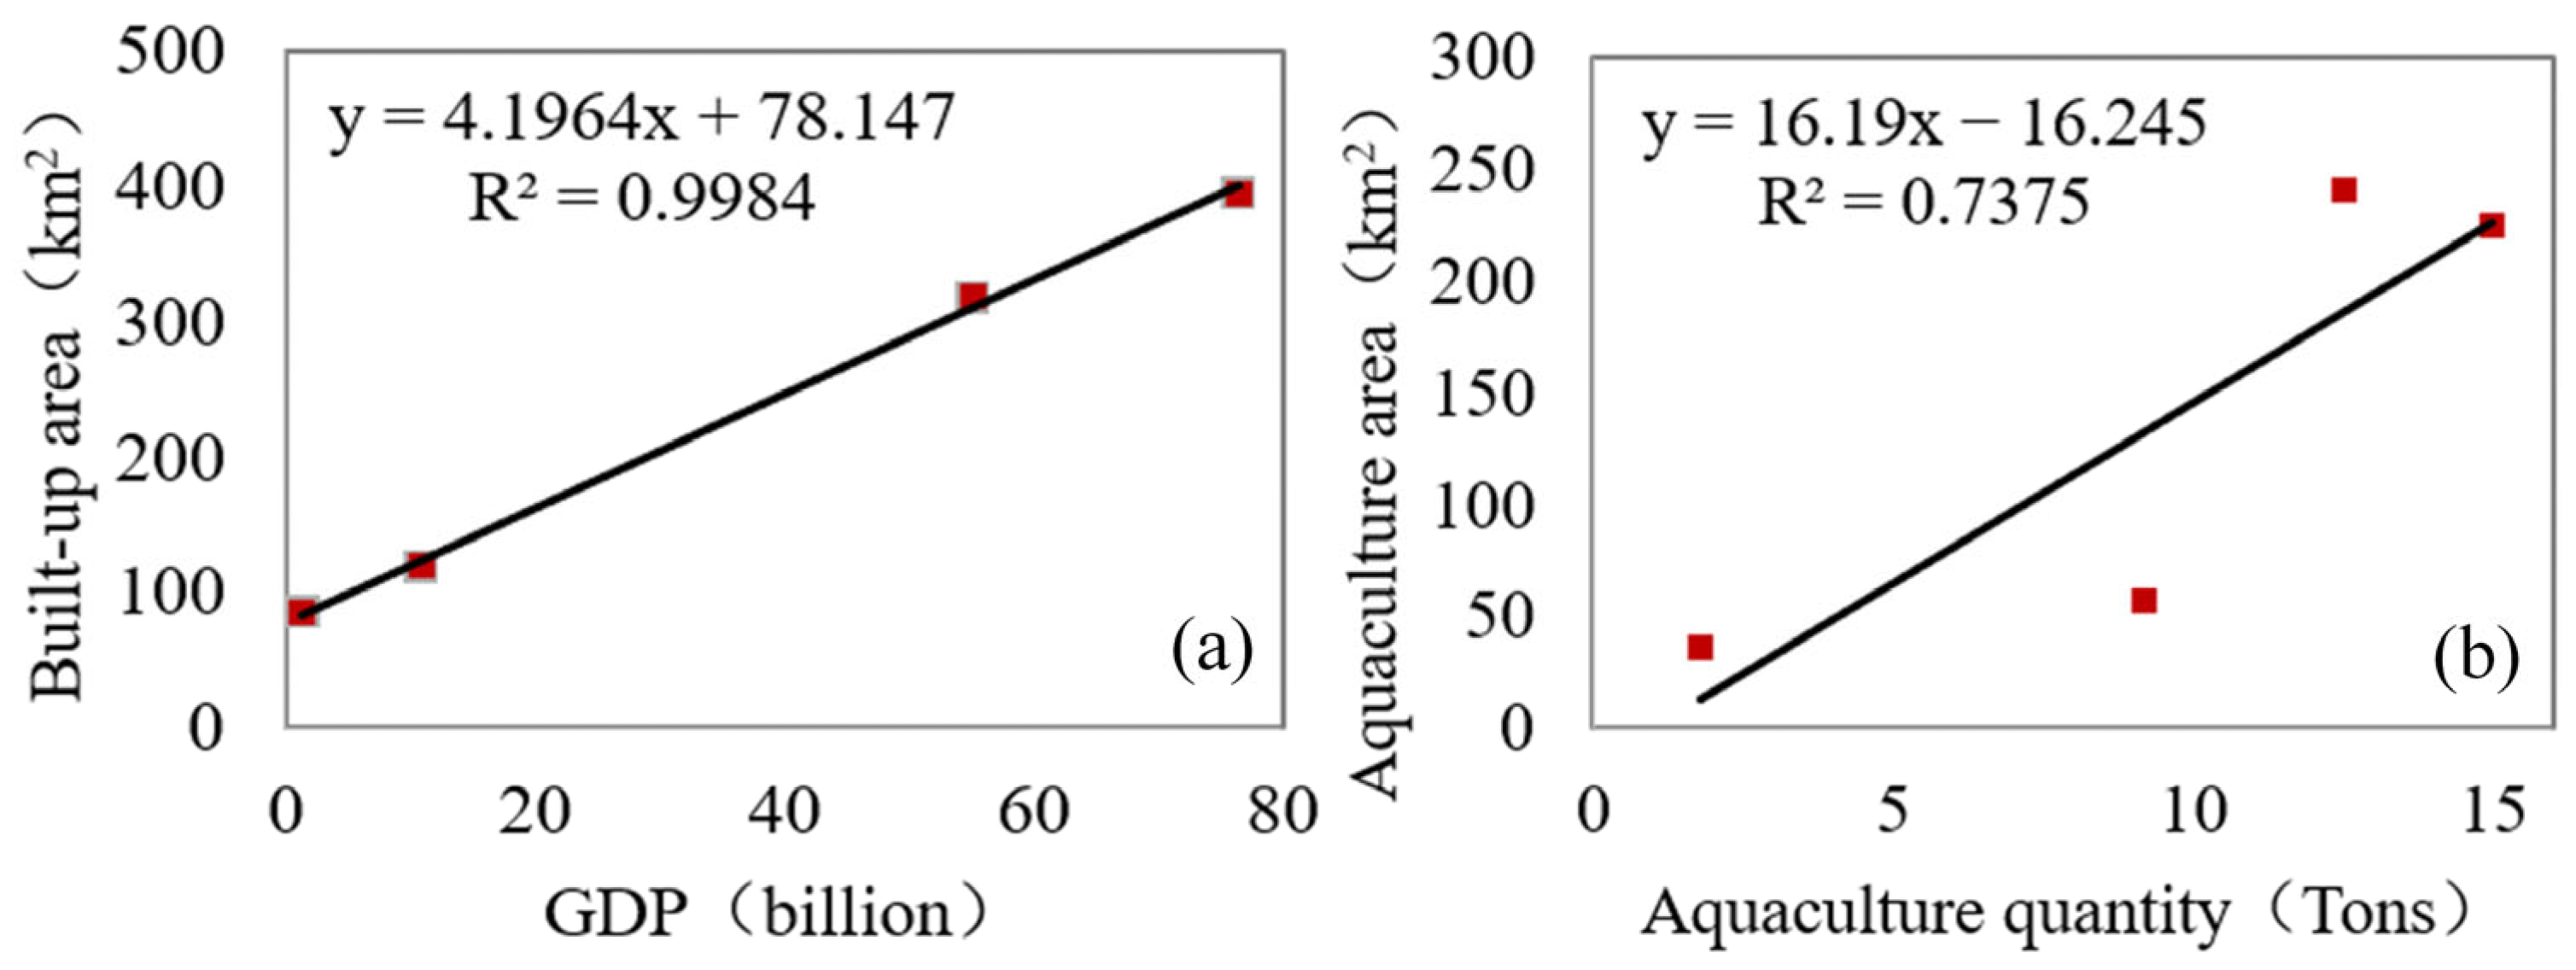
The increase in the built-up area is mainly influenced by the urbanization trend in China and is driven by both the economic development and population growth in Qianjiang City. Firstly, the urbanization trend in China is a widespread phenomenon nationwide. Since the 1980s, China has been dedicated to promoting urbanization to stimulate economic development and improve people’s living standards [30]. This process has led to a significant rural-to-urban migration and gradual urbanization in some rural areas. Qianjiang, as a city in Hubei Province, is also impacted by this trend. Over time, more rural land has been replaced by urban land, resulting in an increase in the built-up area. Secondly, the rapid economic development in Qianjiang City is also a significant factor contributing to the increase in the built-up area. There was a good logarithmic correlation between the Gross Domestic Product (GDP) of Qianjiang City and the area of built-up land (Figure 7a). Over the past 30 years, Qianjiang City has actively promoted industrialization and urbanization, attracting substantial investments and businesses. These investments and businesses have brought more job opportunities and economic income, attracting more population to migrate to Qianjiang. This has created a greater demand for land use, promoting the expansion of the built-up area. Additionally, the rapid population growth also plays a role in increasing the built-up area. With the development of the economy and the progress of urbanization, the population of Qianjiang City has been consistently increasing. More population requires space for housing, work, and daily living, driving the continuous expansion of the city and the corresponding increase in the built-up area.
Water areas in Qianjiang City were mainly composed of rivers and ponds, with subtle changes during the study period. It rose from 35.98 km2 in 1990 to 240.83 km2 in 2017. This is primarily influenced by crayfish farming and climate conditions. Firstly, the development of crayfish farming has had a significant impact on the change in water area in Qianjiang city (Figure 7b). From 1990 to 2017, crayfish farming has rapidly developed and become an important industry in Qianjiang city [18]. Crayfish farming requires a large amount of water resources, and its pond farming model has higher requirements for water area. Therefore, in order to meet the needs of crayfish farming, a large amount of water area has been opened up for farming in Qianjiang city, resulting in a significant increase in the water area. Secondly, changes in climate conditions have also had a certain impact on the water area of Qianjiang city. Studies have shown that with global climate warming, the rainfall in Qianjiang city has been increasing year by year. The increase in rainfall can lead to an increase in the water storage capacity of water bodies, thus expanding the water area.

4.2. Impact of Government Decisions on Land Use

Land use is highly influenced by regional policies. Prior to 2000, China advocated for expanding arable land to feed a growing population. However, around 2000, large-scale land reclamation and afforestation measures were implemented across China. By reducing the area of farmland, some agricultural land was restored to forestland, aiming to increase forest coverage and improve the sustainability and stability of the ecosystem [31].
Table 2 shows the major land use conversions in Qianjiang city from 1990 to 2006, 2006 to 2017, and 2017 to 2022. From 1990 to 2006, the area of built-up land, farmland, and aquaculture zones increased by 33.82 km2, 275.02 km2, and 21.13 km2, respectively, while the areas of forest and grassland and water decreased by 281.58 km2 and 48.38 km2, respectively. From 1990 to 2006, large areas of forest and grassland were converted to farmland, which may be related to the national policy at that time that encouraged the cultivation of previously uncultivated land to increase crop production. During the period from 1990 to 2006, China experienced rapid economic growth and a significant increase in population, particularly in rural areas. This led to a greater demand for arable land resources to meet the growing needs for agricultural products, such as food. In order to increase the amount of arable land, the government implemented a series of policy measures to encourage farmers to reclaim and transform land. These policies may have resulted in extensive deforestation and conversion of grasslands into cultivated land.
The major LULCC from 2006 to 2017 was that the areas of built-up land and aquaculture increased by 197.80 km2 and 183.72 km2, respectively (Table 2). Meanwhile, the areas of forest and grassland and farmland decreased by 92.89 km2 and 290.378 km2, respectively. In 2017, farmland was still mainly transformed from forest and grassland. Built-up areas primarily originated from farmland, followed by forest and grassland. The area of aquaculture showed an explosive increase, with the area mainly being converted from farmland. The data indicate that the expansion of construction land and agricultural land is the main trend in land use and land cover changes in the research area. This is influenced by the policies of returning farmland to forests and urbanization. In the case of constant total land area, the conversion of forest and grassland into farmland and built-up areas is more prevalent. At the same time, encouraged by economic policies, a significant amount of agricultural land has been converted into aquaculture to boost agricultural income [32].
From 2017 to 2022, the areas of built-up land and forest/grassland increased by 77.08 km2 and 84.94 km2, respectively (Table 2). The increased built-up land primarily transformed from the farmland surrounding urban areas. The areas of farmland and aquaculture decreased by 146.90 km2 and 16.12 km2, respectively. The forest/grassland primarily originated from farmland, as a result of the nation’s ‘Grain for Green’ policy [33].

4.3. Advantages and Limitations

The research utilized classification and analytical methods to yield valuable insights into different geographical environments. By incorporating these findings into future studies, our comprehension of the driving mechanisms behind land use and land cover change can be further deepened, thereby facilitating decision making and policy formulation for governments in various regions.
The findings of this study underscore the significant land use and land cover change (LULCC) that has transpired in Qianjiang City over the past three decades, particularly in relation to aquaculture area alterations. The decrease in farmland area and the concurrent increase in aquaculture land indicate a shift in land use practices in response to various factors. Rapid GDP growth emerges as a primary driver of LULCC in Qianjiang City, propelling elevated economic development and necessitating alternative land uses. Additionally, government policies pertaining to farmland preservation have influenced LULCC in the study area, as evidenced by the slight decline in aquaculture land after 2017. Nevertheless, it is important to note that this study only examines a 4-year period within a 30-year timeframe due to data limitations. To gain a comprehensive understanding of the driving mechanisms of LULCC in Qianjiang City, a more extensive analysis of various natural, social, and economic factors is imperative. Future research should strive to gather data for an extended time period and explore the influence of other factors such as population growth, infrastructure development, and technological advancements.

5. Conclusions

This study used multitemporal Landsat imagery to detect LULCC in Qianjiang City from 1990 to 2022, particularly the change in aquaculture areas. LULC classification was conducted using a combination of decision tree classifier and visual interpretation, and LULCC were analyzed via transition matrices. The results showed that the main type LULC type in the study area was farmland, which accounted for more than 70% of Qianjiang City. This was followed by built-up land, aquaculture land, and water bodies, etc. From 1990 to 2022, there were drastic LULCC in Qianjiang City, with a rapid decrease in farmland area and an increase in aquaculture zone. The area of aquaculture land rose from 35.98 km2 in 1990 to 240.83 km2 in 2017. However, after 2017, due to the new policy regarding protecting farmland, the area of aquaculture land slightly declined. To clarify the driving mechanism of LULCC, comprehensive analysis of various natural, social and economic factors is necessary. However, this study only discusses 4 years of LUCC in the past 30 years due to data limitations, and draws a rough conclusion: the rapid GDP growth and government policies were the main driving forces of LULCC in Qianjiang City, which provides data support for the government in making decisions and policies.

Author Contributions

Conceptualization, J.X.; methodology, J.X. and M.M.; software, J.X. and Z.Z.; validation, H.Z., Y.L. and G.Q.; formal analysis, J.X., J.C. and M.L., investigation, H.Z.; resources, M.M.; data curation, M.M. and J.X.; writing—original draft preparation, J.X.; writing—review and editing, M.M. and J.X.; visualization, M.M. and J.X.; supervision, X.H. and Y.Z.; project administration, Z.R.; funding acquisition, Z.Z. All authors have read and agreed to the published version of the manuscript.

Funding

This research was funded by the Key R&D Program of Yunnan Province, China (Grant number 202203AC100001) and Natural Science Research General Program of Higher Education Institutions of Jiangsu Province (Grant number 21KJB170017).

Institutional Review Board Statement

Not applicable.

Informed Consent Statement

Not applicable.

Data Availability Statement

Not applicable.

Conflicts of Interest

The authors declare no conflict of interest.

References

  1. Kasniza Jumari, N.A.S.; Ahmed, A.N.; Huang, Y.F.; Ng, J.L.; Koo, C.H.; Chong, K.L.; Sherif, M.; Elshafie, A. Analysis of urban heat islands with landsat satellite images and GIS in Kuala Lumpur Metropolitan City. Heliyon 2023, 9, e18424. [Google Scholar] [CrossRef] [PubMed]
  2. Hoque, M.Z.; Ahmed, M.; Islam, I.; Cui, S.; Xu, L.; Prodhan, F.A.; Ahmed, S.; Rahman, M.A.; Hasan, J. Monitoring Changes in Land Use Land Cover and Ecosystem Service Values of Dynamic Saltwater and Freshwater Systems in Coastal Bangladesh by Geospatial Techniques. Water 2022, 14, 2293. [Google Scholar] [CrossRef]
  3. Wang, L.; Nie, Z.; Yuan, Q.; Liu, M.; Cao, L.; Zhu, P.; Lu, H.; Feng, B. Spatiotemporal Oasis Land Use/Cover Changes and Impacts on Groundwater Resources in the Central Plain of the Shiyang River Basin. Water 2023, 15, 457. [Google Scholar] [CrossRef]
  4. Paez-Osuna, F. The Environmental Impact of Shrimp Aquaculture: A Global Perspective. Environ. Pollut. Prot. 2001, 112, 31–229. [Google Scholar] [CrossRef]
  5. Froehlich, H.E.; Gentry, R.R.; Rust, M.B.; Grimm, D.; Halpern, B.S. Public Perceptions of Aquaculture: Evaluating Spatiotemporal Patterns of Sentiment around the World. PLoS ONE 2017, 12, 4–6. [Google Scholar] [CrossRef]
  6. Cao, Z.; Wang, S.; Luo, P.; Xie, D.; Zhu, W. Watershed Ecohydrological Processes in a Changing Environment: Opportunities and Challenges. Water 2022, 14, 1502. [Google Scholar] [CrossRef]
  7. Pouliot, D.; Latifovic, R.; Zabcic, N.; Guindon, L.; Olthof, I. Development and assessment of a 250 m spatial resolution MODIS annual land cover time series (2000–2011) for the forest region of Canada derived from change-based updating. Remote Sens. Environ. 2014, 140, 731–743. [Google Scholar] [CrossRef]
  8. Li, X.; Gong, P.; Liang, L. A 30-year (1984–2013) record of annual urban dynamics of Beijing City derived from Landsat data. Remote Sens. Environ. 2015, 166, 78–90. [Google Scholar] [CrossRef]
  9. Liu, G.; Li, J. Tracking dike-pond landscape dynamics in a core region of the Guangdong-Hong Kong-Macao Greater Bay Area based on topographic maps and remote sensing data during 1949–2020. Aquaculture 2021, 549, 737741. [Google Scholar] [CrossRef]
  10. Duan, Y.; Tian, B.; Li, X.; Liu, D.; Sengupta, D.; Wang, Y.; Peng, Y. Tracking changes in aquaculture ponds on the China coast using 30 years of Landsat images. Int. J. Appl. Earth Obs. Geoinf. 2021, 102, 102383. [Google Scholar]
  11. Kutser, T.; Hedley, J.; Giardino, C.; Roelfsema, C.; Brando, V.E. Remote sensing of shallow waters—A 50 year retrospective and future directions. Remote Sens. Environ. 2020, 240, 111619. [Google Scholar] [CrossRef]
  12. Virdis, S.G.P. An object-based image analysis approach for aquaculture ponds precise mapping and monitoring: A case study of Tam Giang-Cau Hai Lagoon, Vietnam. Environ. Monit. Assess. 2014, 186, 117–133. [Google Scholar] [CrossRef] [PubMed]
  13. Al Sayah, M.J.; Nedjai, R.; Abdallah, C.; Khouri, M. On the use of remote sensing to map the proliferation of aquaculture ponds and to investigate their effect on local climate, perspectives from the Claise watershed, France. Environ. Monit. Assess. 2020, 192, 301. [Google Scholar] [CrossRef]
  14. Ottinger, M.; Clauss, K.; Kuenzer, C. Large-Scale Assessment of Coastal Aquaculture Ponds with Sentinel-1 Time Series Data. Remote Sens. 2017, 9, 440. [Google Scholar] [CrossRef]
  15. Meng, L.; Dong, J. LUCC and Ecosystem Service Value Assessment for Wetlands: A Case Study in Nansi Lake, China. Water 2019, 11, 1597. [Google Scholar] [CrossRef]
  16. Kolli, M.K.; Opp, C.; Karthe, D.; Groll, M. Mapping of Major Land-Use Changes in the Kolleru Lake Freshwater Ecosystem by Using Landsat Satellite Images in Google Earth Engine. Water 2020, 12, 2493. [Google Scholar] [CrossRef]
  17. Sousa, D.; Small, C. Land Cover Dynamics on the Lower Ganges–Brahmaputra Delta: Agriculture–Aquaculture Transitions, 1972–2017. Remote Sens. 2021, 13, 4799. [Google Scholar] [CrossRef]
  18. Yuan, P.; Wang, J.; Guo, C.; Guo, Z.; Guo, Y.; Guo, C. Sustainability of the rice-crayfish farming model in waterlogged land: A case study in Qianjiang County, Hubei Province, China. J. Integr. Agric. 2022, 21, 1203–1214. [Google Scholar] [CrossRef]
  19. Chen, J.; Cao, X.; Peng, S.; Ren, H. Analysis and Applications of GlobeLand30: A Review. ISPRS Int. J. Geo-Inf. 2017, 6, 230. [Google Scholar] [CrossRef]
  20. Jokar Arsanjani, J.; Tayyebi, A.; Vaz, E. GlobeLand30 as an alternative fine-scale global land cover map: Challenges, possibilities, and implications for developing countries. Habitat Int. 2016, 55, 25–31. [Google Scholar] [CrossRef]
  21. Costa Fonte, C.; Minghini, M.; Patriarca, J.; Antoniou, V.; See, L.; Skopeliti, A. Generating Up-to-Date and Detailed Land Use and Land Cover Maps Using OpenStreetMap and GlobeLand30. ISPRS Int. J. Geo-Inf. 2017, 6, 125. [Google Scholar] [CrossRef]
  22. Pal, M.; Mather, P.M. An assessment of the effectiveness of decision tree methods for land cover classification. Remote Sens. Environ. 2003, 86, 554–565. [Google Scholar] [CrossRef]
  23. Roberts, D.A.N.; Holmes, K.I.; Batista, G.; Krug, T. Large area mapping of land-cover change in Rondônia using multitemporal spectral mixture analysis and decision tree classifiers. J. Geophys. Res. 2002, 107, LBA-40-1–LBA-40-18. [Google Scholar] [CrossRef]
  24. Liu, S.; Su, H.; Cao, G.; Wang, S.; Guan, Q. Learning from data: A post classification method for annual land cover analysis in urban areas. ISPRS J. Photogramm. Remote Sens. 2019, 154, 202–215. [Google Scholar] [CrossRef]
  25. Hu, Y.; Batunacun; Zhen, L.; Zhuang, D. Assessment of Land-Use and Land-Cover Change in Guangxi, China. Sci. Rep. 2019, 9, 2189. [Google Scholar] [CrossRef]
  26. Ke, N.; Lu, X.; Zhang, X.; Kuang, B.; Zhang, Y. Urban land use carbon emission intensity in China under the “double carbon” targets: Spatiotemporal patterns and evolution trend. Environ. Sci. Pollut. Res. 2022, 30, 18213–18226. [Google Scholar] [CrossRef]
  27. Zong, S.; Hu, Y.; Bai, Y.; Guo, Z.; Wang, J. Analysis of the distribution characteristics and driving factors of land use conflict potentials in the Bohai Rim coastal zone. Ocean. Coast. Manag. 2022, 226, 106260. [Google Scholar] [CrossRef]
  28. Liu, F.; Qin, T.; Girma, A.; Wang, H.; Weng, B.; Yu, Z.; Wang, Z. Dynamics of Land-Use and Vegetation Change Using NDVI and Transfer Matrix: A Case Study of the Huaihe River Basin. Pol. J. Environ. Stud. 2018, 28, 213–223. [Google Scholar] [CrossRef]
  29. Chen, C.; Liu, Y. Spatiotemporal changes of ecosystem services value by incorporating planning policies: A case of the Pearl River Delta, China. Ecol. Model. 2021, 461, 109777. [Google Scholar] [CrossRef]
  30. Liang, L.; Chen, M.; Lu, D. Revisiting the Relationship Between Urbanization and Economic Development in China Since the Reform and Opening-Up. Chin. Geogr. Sci. 2022, 32, 1–15. [Google Scholar] [CrossRef]
  31. Zhao, D. Study on the evolution of rural land use function in developed areas of China. In Proceedings of the Post-Oil City Planning for Urban Green Deals Virtual Congress, Doha, Qatar, 8 November 2020–4 February 2021. [Google Scholar]
  32. Wang, D. Study on the Influence, Problems and Countermeasures of the Development of Crawfish Industry in Qianjiang, Hubei Province. In Proceedings of the 2018 5th International Conference on Social Science and Humanity, Hangzhou, China, 27–29 May 2018. [Google Scholar]
  33. Tang, Q. Study on the Effect of “Crayfish-Rice Continuous Cropping” on Grain Production: A Case Study of Hubei Province. Asian Agric. Res. 2019, 11, 4. [Google Scholar]
Figure 1. Flow chart of LULC classification.
Water 15 03322 g001
Figure 2. Spatial distribution of land use/cover type in (a) 1990, (b) 2006, (c) 2017, and (d) 2022.
Water 15 03322 g002
Figure 3. Spatial distribution of aquaculture areas in Qianjiang city 1990 (a), 2006 (b), 2017 (c), and 2022 (d).
Water 15 03322 g003
Figure 4. Comparison of the spatial distribution of farmland, built-up area, water body, aquaculture, and forest/grass extracted from GlobelLand30 data (a) and LULC map derived from this study (b) in Qianjiang county.
Water 15 03322 g004
Figure 5. Comparison of the spatial distribution of built-up area extracted from GlobelLand30 data (a) and that derived from this study (b) in Qianjiang county, with enlarged map segments in (c,d).
Water 15 03322 g005
Figure 6. Temporal change in the total area of land use/cover type in Qianjiang city.
Water 15 03322 g006
Figure 7. Relationship between GDP and built-up area (a) and aquaculture quantity and area (b).
Water 15 03322 g007
Table 1. Dates and products of Landsat images used in this study.
Year1990200620152020
ProductLandsat TMLandsat TMLandsat OLILandsat OLI
Dates23 July 199020 August 202017 July 20178 August 2022
5 June 19908 April 202023 May 20179 March 2022
Table 2. LULC transition matrix from 1990 to 2006, 2006 to 2017, and 2017 to 2022 in Qianjiang city. (“45.09” means there are 45.09 km2 of the LULC type of “built up” in 1990 converted to type “built up” in 2006; “28.28” means there are 28.28 km2 of the LULC type of “built up” in 1990 converted to type “farmland” in 2006; “−281.58” means that the area of the LULC type of “Forest/grass” in 1990 was 281.58 km2 less than that in 2006).
Area
(km2)
Built-UpForest/GrassFarmlandWater BodyAquaculture
1990–2006Built-up45.0937.8533.652.680.18
Forest/grass8.18122.5778.9311.973.25
Farmland28.28330.321154.5038.1419.17
Water body1.535.545.7838.450.47
Aquaculture2.5510.2022.538.9212.91
Change33.82−281.58275.02−48.3821.13
2006–2017Built-up93.8533.96174.365.329.77
Forest/grass2.9466.7059.890.871.61
farmland18.66108.261128.615.7818.73
Water body0.901.6312.7137.660.62
Aquaculture3.1014.35194.842.1526.39
Change197.80−92.89−290.371.74183.72
2017–2022Built-up207.0723.99132.623.3627.29
Forest/grass21.3056.31121.891.4715.98
farmland60.9041.87907.618.89113.87
Water body4.471.437.1238.752.76
Aquaculture23.518.41110.801.0680.93
Change77.0884.94−146.901.01−16.12
Disclaimer/Publisher’s Note: The statements, opinions and data contained in all publications are solely those of the individual author(s) and contributor(s) and not of MDPI and/or the editor(s). MDPI and/or the editor(s) disclaim responsibility for any injury to people or property resulting from any ideas, methods, instructions or products referred to in the content.