Article

Basin-Scale Hydraulic Evaluation of Groundwater Flow Controlled Biogenic Gas Migration and Accumulation in the Central Pannonian Basin

1
József and Erzsébet Tóth Endowed Hydrogeology Chair, Department of Geology, Institute of Geography and Earth Sciences, Eötvös Loránd University (ELTE), 1117 Budapest, Hungary
2
Vermilion Energy Hungary, 1117 Budapest, Hungary
*
Author to whom correspondence should be addressed.
Water 2023, 15(18), 3272; https://doi.org/10.3390/w15183272
Submission received: 10 August 2023 / Revised: 7 September 2023 / Accepted: 12 September 2023 / Published: 15 September 2023

Abstract

:
Biogenic or microbial methane has an increasing share in the global gas resource base, though its exploration still faces challenges and welcomes innovations. Critical elements of its migration and accumulation models are the groundwater flows which gather and transport the gas in aqueous solution, and the seal rocks or aquifers which lead groundwater flows horizontally over great distances. This paper intends to introduce the hydraulic trap concept into these models, which is able to drive fluids horizontally without an overlying seal rock. Since hydraulic traps can evolve as a result of the interplay of regional groundwater flow systems, the basin-scale hydraulic evaluation methodology which was developed for the analysis of these systems was further improved by this study to focus on their interplay. The improved methodology was applied on measured hydraulic data in a study area in the Central Pannonian Basin (Hungary) around the Hajdúszoboszló gas field where as a result, the first groundwater flow controlled dissolved biogenic gas migration and accumulation model could be set up. In addition, the proposed methodology can be used in any terrestrial sedimentary basin, and in particular, where topography-driven flow systems are underlaid by an abnormal pressure regime.

1. Introduction

There has been a growing interest in biogenic methane gas accumulations in the last decade, which is enhanced by the increasing demand for energy resources and the actual energy crisis. Natural gas is a “cleaner” fuel than coal or oil, and even based on conservative estimations, more than 20% of the global gas resource base has a microbial origin [1] including, for instance, the giant gas fields of Agostino-Porto Garibaldi (Italy, 3.5 trillion cubic feet (Tcf)) and Sebei-1 (China, 95 Tcf), and part of the supergiant Urengoy gas field (Russia, 220 Tcf).
Microbial or biogenic gas generation or methanogenesis is accomplished by more than 80 species of Archea [2], producing methane in 99% of them, generally by CO2 reduction or acetate fermentation under anaerobic conditions. These processes require less special conditions than the generation of thermogenic gases. Namely, though sedimentation rate [3], sulphate deficiency, and sufficient pore size [1] are also significant factors, sediments can generate biogenic gas from as little as 0.2% total organic carbon (TOC) content [4]. In addition, the peak microbial activity occurs between 35 and 45 °C [5], and also the maximum of the optimal temperature range is only around 65 °C. Based on the geothermal gradient (the world average is 25 °C/km), it usually means a relatively shallow depth (500–2000 m) and more easily accessible resources compared to thermogenic gases.
As a result, biogenic methane generation is quite often in sedimentary basins, but in situ generation is usually insufficient to explain commercial accumulations [4,6]. Brown [7] suggests that besides sufficient gas generation in the charge area, focused migration is necessary to gather sufficient gas for an accumulation to become commercial (i.e., which can be developed and produced at a profit). This gathering and focusing mechanism can be provided by regional groundwater flows. Though several studies handle groundwater flow as a risk of reservoir flushing [8,9] and dissolved methane in groundwater as a retained hydrocarbon loss [10,11], advantages of groundwater flow have also already been recognized. On the one hand, flowing groundwater can also facilitate hydrodynamic entrapment of the free gas phase [12,13] such as in the Upper Cretaceous rocks of the Northern Grate Plains of Canada and the US [14]. On the other hand, after some transport, groundwater can also exsolve the dissolved gas content to form gas accumulations such as in the Urengoy gas field (West Siberian Basin, Russia) [15] and the giant biogenic gas accumulations of the Qaidam Basin (China) [16]. The critical element in the charge of these fields beside the sufficient gas generation, efficient groundwater flow, and pressure drop in the accumulation zone which causes a decrease in methane solubility is the existence of a regionally extensive seal rock (or aquitard) which leads groundwater flows horizontally over great distances.
This paper intends to further develop this biogenic gas migration and accumulation model by integrating the hydraulic trap concept as a potential sealing mechanism which is directly independent from lithology or hydrostratigraphy (i.e., does not require a seal rock or aquitard). The hydraulic trap was defined as the convergence zone of regional groundwater flows, which represents a regional potential minimum zone [13,17], and was also characterized by numerical studies [18,19]. Hydraulic traps can be vertically extended zones in case of juxtaposed flow systems such as in offshore regions where continental topography-driven flow systems oppose landward-oriented compactional flows [17,20]. On the other hand, hydraulic trap zones can be extended horizontally in case of superimposed flow systems. For instance, Czauner and Mádl-Szőnyi [21] and Czauner et al. [22,23] identified horizontally extended regional potential minimum zones in study areas of the Central Pannonian Basin (Hungary) where topography-driven downward flows meet with overpressure originated upward flows. Czauner and Mádl-Szőnyi [21] determined these zones as the upper boundary of upward hydrocarbon migration and as potential hydraulic traps, but they did not deal with the lateral flows and their consequences within the hydraulic trap zones.
Characterization and understanding of regional scale groundwater flow systems and their interplay, which can form hydraulic trap zones, is primarily possible by the basin-scale hydraulic evaluation of measured data. This methodology is based on the hydraulic continuity of the rock framework [24,25] from the land surface down to the basement of the sedimentary basin (or even deeper). In this way, the full hydrostratigraphic build-up is studied in combination with the hydraulic data instead of focusing only on aquifers. The methodology was developed by several authors [21,26,27,28,29,30] and contains the analysis of measured hydraulic (water level and pore pressure) data by using pressure–elevation profiles, tomographic fluid potential maps, and hydraulic cross sections. The application of pressure–elevation (p(z)) profiles was further developed by Czauner et al. [22,23] in order to separate normal and abnormal pressure regimes, thus identifying regional scale groundwater flow systems with different driving forces. It requires the analysis of a bulk p(z) profile which contains all the data of a study area. As a final step of the refinement of the methodology, this paper presents an improved analysis of vertical pressure gradients which refer to the direction of the vertical flow component in local p(z) profiles of smaller areas. In this way, the displayed workflow for the analysis of the measured pressure data intends to demonstrate the necessity of the separated interpretation of pressure regimes in bulk p(z) profiles and vertical pressure gradients in local p(z) profiles, which simply derives from the original p(z) profile definition. Conversely, the mixtures of these techniques are also known from the literature, for instance, vertical pressure gradients are used for the separation of pressure regimes [31,32,33,34]. Furthermore, in most cases pressure versus depth (p(d)) profiles are used instead of p(z) profiles which can cause potential misinterpretations if data of more than one well are evaluated from a study area characterized by elevational differences in the topography (i.e., in the water table).
The presented improved basin-scale hydraulic evaluation methodology can be used in any terrestrial sedimentary basin for any geofluid-related (i.e., groundwater, geothermal fluids, hydrocarbon) research including biogenic gas exploration. Actually, also those studies which considered the function of groundwater flows in the formation of biogenic gas accumulations [15,16,35] or just in the natural enrichment of biogenic gas in groundwaters [36,37] lack a systematic evaluation of hydraulic data. The application of this methodology could also provide further developments in these areas.
The present paper demonstrates the application of the methodology in a study area in the Central Pannonian Basin (Hungary) around the Hajdúszoboszló gas field, which is by far the largest gas field in Hungary (1.3 Tcf original gas in place (OGIP)) where about 300 Bcf (Billion cubic feet) gas has biogenic origin [38]. Then, based on the revealed present-day groundwater flow system configuration, those areas were delineated which hydrodynamically favor the transport or entrapment of dissolved gases. The known biogenic gas distribution confirmed these results, thus the first groundwater flow controlled migration and accumulation model of dissolved biogenic gases could be finally set up for the study area, which can be adapted to any terrestrial sedimentary basin.

2. Study Area

The 8000 km2 study area is located in the Eastern part of the Great Hungarian Plain (Central Pannonian Basin, Hungary) and contains the Hajdúszoboszló gas field and its regional environment (Figure 1). Topographically, the elevated Nyírség area (~160 m asl (above sea level)) in the east–northeast lowers towards the southwest to about 80 m asl.

2.1. Geological and Hydrostratigraphic Background

The Pannonian Basin is a Neogene continental back-arc basin surrounded by the Alpine–Dinaride–Carpathian orogenic belts in Central Europe (Figure 1). Its extensional formation started in the Early Miocene, whereas its inversion has been taking place since Late Miocene to recent times [39]. The Pre-Neogene basement of the sedimentary basin is divided by elevated highs such as around Hajdúszoboszló and in the northeastern part of the study area, into a number of deep local basins and troughs such as the Derecske Trough in the southeast. The basement comprises brittle flysch, carbonate, and metamorphic rocks [40]. In the Great Hungarian Plain, the 100–7000 m thick semi- to unconsolidated Neogene clastic basin fill consists of Middle to early Late Miocene, mostly marine syn-rift sediments, and unconformably overlying Late Miocene to Quaternary lacustrine to terrestrial post-rift sediments. The latter, upward-shoaling sedimentary succession represents the time-transgressive depositional environments of the fluvial-deltaic systems, which are progressively filled in Lake Pannon (11.6–2.6 Ma) [41,42,43].
Regarding the regional or basin-scale hydrostratigraphy of the study area [21,26], the uppermost zone of the Pre-Neogene basement usually shows aquifer characteristics (Pre-Neogene Aquifer). The subsequent Pre-Pannonian Neogene strata were classified into one regional aquifer unit (Pre-Pannonian Aquifer, permeability k = 10−13–10−12 m2, hydraulic conductivity K = 10−6 m/s) which shows similar hydrostratigraphic characteristics to the Pre-Neogene basement. The subsequent deposits of Late Miocene Lake Pannon compose the main mass of the Neogene basin fill. The deep water marls of the Endrőd Formation usually represent effective aquitard characteristics (Endrőd Aquitard, k = 10−16 m2, K = 10−9–10−8 m/s). Their thickness varies between less than 100 m over sub-lacustrine basement highs and 1500 m in the deepest parts of the lake basin. Deep water turbidite systems of the Szolnok Formation are dominated by sandstones which usually represent aquifer quality (Szolnok Aquifer, k = 10−14–10−13 m2, K = 10−7–10−6 m/s) and 300–1000 m thickness depending on the paleo-topography. Above the elevated basement highs, it usually pinches out completely. The Algyő Formation is mostly built-up by claymarls and siltstones of the shelf slope, and are generally thought to be the single regionally extensive and effective low-permeability aquitard unit in the basin (Algyő Aquitard, k = 10−15–10−14 m2, K = 10−8–10−7 m/s). Its thickness can reach 1500 m. Finally, all of the younger sediments were classified into the Great Plain Aquifer (k = 10−13–10−12 m2, K = 10−5 m/s), also including deposits of prograding delta systems (Újfalu Formation) and alluvial plains (Zagyva Formation).

2.2. Groundwater Flow Systems

In the Great Hungarian Plain, two superimposed groundwater flow domains were identified by a basin-scale study [26], then further investigated in regional scale study areas [21,44,45,46]. The upper domain consists of topography-driven groundwater flow systems which in fact are driven by the elevational differences of the water table. Namely, since the water table more or less follows the topography [27,47], elevated areas represent the higher energy regions whilst lowlands represent the lower energy regions, the so-called recharge and discharge areas, respectively. Groundwater flows from areas of higher fluid potentials towards areas of lower fluid potentials (or energy or hydraulic head) [48], thus water which infiltrates in a recharge area flows towards the related discharge area where it can return to the land surface in the form of springs, lakes, and rivers, etc. These topography-driven flow systems contain meteoric originated fresh waters (total dissolved solids content, TDS = 420–2500 mg/L) [26].
On the other hand, in the underlying domain, a regional scale overpressured regime exists in the deeper sub-basins. It contains slightly saline to saline waters (TDS = 10,000–38,000 mg/L) [26]. According to the latest basin modeling results [10,49], non-equilibrium compaction could be the dominant driving force in the generation of the overpressure which can exceed 200% compared to the hydrostatic value. In addition, regionally extensive low-permeability formations are also necessary to develop and maintain the abnormal pressure conditions. In the Great Hungarian Plain, the Algyő Aquitard is the uppermost hydraulic barrier which controls the generation and dissipation of the underlying overpressure.

2.3. Biogenic Gas Fields

The Hajdúszoboszló natural gas field (Figure 1) is by far the largest gas field in Hungary. Its original gas in place (OGIP) was around 1.3 Tcf. Pools were accumulated between about z = 100–(−1100) m asl in and above a Pre-Neogene basement high in Mesozoic and Paleogene flysch, sandstone and limestone, and in Miocene and Pliocene sandstone reservoirs. Going upward, the proportion of methane increases from 84% to 99% and becomes isotopically lighter from δ13C = −43‰ to −70‰ representing the mixing of thermogenic wet gas and biogenic methane [50]. About 300 Bcf OGIP is estimated to have biogenic origin. The younger pools (Upper Miocene–Pliocene) above z = (−700) m asl which contains most of the biogenic gas have tectonic closure provided by a fault zone [38]. This northwest–southeast oriented fault zone is only about 5 km long [51].
In a distance of about 8–10 km to the east–southeast of the Hajdúszoboszló gas field, smaller gas fields of Ebes and Ebes-North can be found (26 Bcf OGIP) (Figure 1). Pools are located between about z = (−250)–(−1100) m asl in Mesozoic and Eocene limestone and sandstone, and Miocene sandstone reservoirs. The younger pools (Upper Miocene–Pliocene) above z = (−750) m asl contain biogenic gas [38].

3. Materials and Basin-Scale Hydraulic Evaluation Methodology

3.1. Hydrostratigraphic Interpretation

According to the study’s objectives, a regional scale hydrostratigraphic classification was carried out by following Tóth and Almási [26], Almási [52], and Czauner and Mádl-Szőnyi [21] based on the lithostratigraphic units of wells and a seismically interpreted cross section. Then the interpreted hydrostratigraphic units were represented on the p(z) profiles and hydraulic cross sections in order to support the hydrogeological evaluation. Finally, faults were also seismically interpreted along cross section B, which runs across the Hajdúszoboszló gas field, since their hydraulic function can also affect the flow field and hydrocarbon migration and entrapment [45,53,54,55].

3.2. Hydraulic Data Preparation

Archival well data were available from hydrocarbon and water wells from the z = 135–(−3878) m asl elevation interval. Pore or formation pressure data of hydrocarbon wells were provided by the Vermilion Energy Hungary, whilst stabilized water level data of water wells were collected from the original (paper-based) well records of the Supervisory Authority for Regulated Activities of Hungary (former Mining and Geological Institute of Hungary). Since one of the main objectives of this study was to reveal the potential migration and entrapment areas of dissolved biogenic gases, the natural flow conditions should be revealed. Thus, during data evaluation, only pre-production water level and stabilized formation pressure data which were recorded during or right after well completion were used to avoid artificially reduced pressures. In addition, only that water well data were analyzed which were measured before 1980, because a significant water level decline can be observed in the Great Hungarian Plain from the 1980s due to the intensive groundwater production. Eventually, a few pressure data which were measured in oil or gas columns were also culled since these can cause apparent overpressure compared to the values measured in groundwater at the same depth due to the significantly lower density and thus hydrostatic vertical pressure gradient of hydrocarbons [23]. The finally compiled database contains data of about 1700 wells.
Water levels were converted to hydraulic heads (h) [L] (asl):
h = z 0 d w
where z0 elevation of the land surface [L] (asl), dw depth of the water level [L].
By definition, the hydraulic head is equal to the height of a vertical fluid column relative to an arbitrary datum plane (z = 0) commonly chosen at sea level. It is directly proportional to, thus a measure of, the fluid potential (Φ) in a given point of rock framework, which represents the amount of mechanical energy contained by a unit mass of incompressible fluid [48]:
Φ = g · z + p ρ = g · h
and
h = z + p ρ · g
where Φ is fluid potential [L2/T2], g is gravitational acceleration [L/T2], z is elevation above datum plane [L] (asl), p is gauge pressure (= absolute pressure − atmospheric pressure) [M/LT2], and ρ is density of water [M/L3]. Additionally, the ρ g term in Equation (3) expresses the specific weight of the fluid, which is numerically equal to the hydrostatic vertical pressure gradient (γhyd) in a water column of density ρ. Since g can be handled as a constant value (9.81 m/s2), the hydrostatic vertical pressure gradient of a fluid (liquid or gas) depends on its density. For instance, in case of water density of 1000 kg/m3, γhyd = 9.81 MPa/km. Otherwise, the vertical pressure gradient can be defined as
γ = d p d d = d p d z
where d depth [L] and z elevation [L] (asl).
Since flow between two points is generated by the difference in their mechanical energy (ΔΦ), considering Equation (2) and the constant value of g, the hydraulic gradient (gradh) [-]:
g r a d h = d h d l
where l is length of the flow path [L]. Hydraulic gradient represents the fluid flow driving force. In an isotropic flow medium (where hydraulic conductivity (K) is independent from direction), fluid flows from places of higher potential energy towards those of lower potential energy, i.e., from higher towards lower h values, and consequently in opposite direction to the hydraulic gradient. In an anisotropic medium, fluid flow deviates from the hydraulic gradient towards the direction of higher hydraulic conductivity.
Conversion of pore pressure (p) and hydraulic head (h) data into one another is possible by using Equation (3) where z is equal to the elevation of the middle of the screened or perforated interval in the water or hydrocarbon well, whilst h or p is the measured value. Since g can be handled as constant, only the determination of a constant fluid density (ρ) requires some further consideration. Namely, although density depends on the salinity, temperature, pressure, and gas content of water, thus varying in space and time, comparison of fluid potentials at different points is valid only for fluids of identical densities [48]. In other words, in this regional scale study, a single, average groundwater density value had to be determined for the whole study area. In the topography-driven flow systems, water density is usually around the freshwater density (1000 kg/m3), which is generally and effectively used in hydraulic analyses. Nevertheless, an average water density value could be determined for any study area. However, potential errors of the calculations and averaging usually exceed the potential effect of the revised density in the Pannonian Basin [21,23,28]. Thus, the 1000 kg/m3 water density was used in the present study.

3.3. Elevation Profiles

3.3.1. Bulk p(z) Profile

In order to separate the regional scale normal and abnormal pressure regime, a bulk p(z) profile was made up and interpreted by using the methodology of Czauner et al. [22,23]. This separation is based on the concept that abnormal pressures are disequilibrium phenomena on geological time scale, which represent significant deviations from the ideal hydrostatic conditions [56,57]. On the other hand, normal is interpreted as the “close to hydrostatic” pressure regime, which is usually presented by the topography-driven flow systems in terrestrial sedimentary basins [27,57]. “Close to hydrostatic” actually means that smaller deviations from the ideal hydrostatic conditions also occur in this flow regime and generate vertical flow components.
The concept of the separation is based on the determination of the normally pressured topography-driven flow systems where groundwater is driven by the elevational differences (i.e., relief) of the water table [27,58,59]. The elevation of the water table (zwt) is equal to the hydraulic head along the water table (hwt), hwt = zwt. Consequently, the maximum (hmax) and minimum (hmin) hydraulic head values which can occur within the topography-driven flow systems are equal to the maximum and minimum elevation of the water table, zwt(max) and zwt(min), respectively. Accordingly, hydraulic head values, which are higher than the maximum (hmax) or lower than the minimum (hmin) of the topography-driven system, can be supposed to represent abnormal pressure conditions. Since p and h data can be converted to each other, the terms of “normal, over-, and underpressured regimes” are also used in this paper when hydraulic head data are interpreted. If the values of zwt(max) and zwt(min) in a basin-scale topography-driven flow system cannot be determined accurately in absence of a water table map, the boundary values of the normally pressured zone can be approximated by the maximum and minimum topographical elevations (z0(max), z0(min)) of the basin. This approach is applicable in the case of a topography-controlled water table [47], which is typical of siliciclastic aquifers such as in the study area.
The values of hmax and hmin can be signed by vertical lines on hydraulic head versus elevation (h(z)) profiles. However, since most data which represent the deep abnormal pressure regimes are measured as pressure data, the application of p(z) profiles is recommended. The reason for this is to avoid the potential errors increasing with depth (i.e., with changing density) caused by the conversion of pressures to hydraulic heads (by Equation (3)) due to the necessary but questionable constant density value (discussed in Section 3.2). (In the shallower zones and topography-driven flow systems, the water density is usually around 1000 kg/m3, thus the conversion from h to p is burdened with less error.)
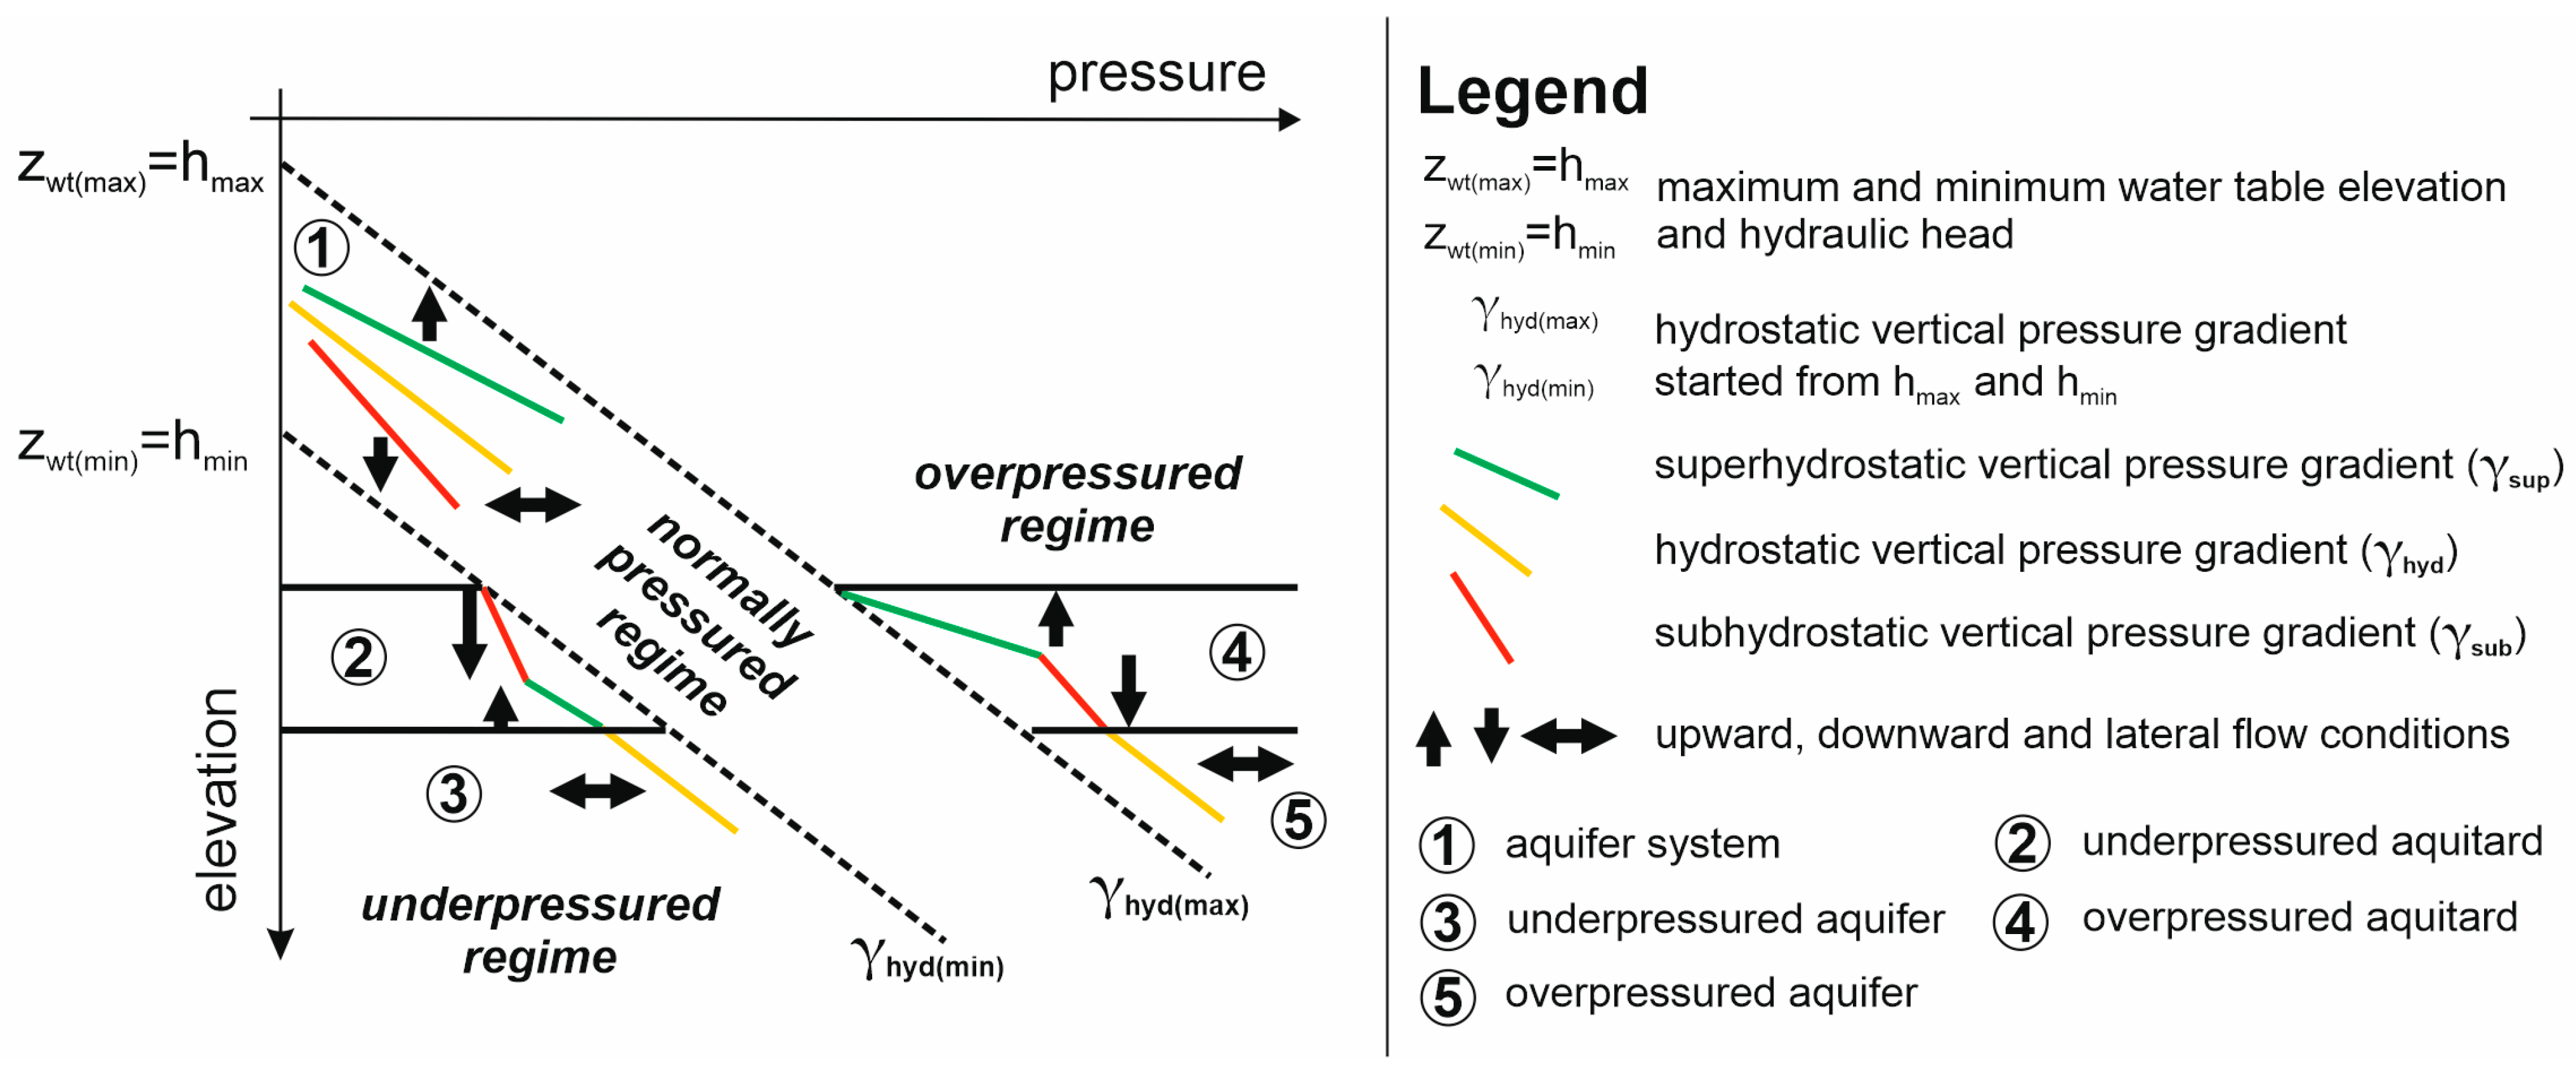
In a bulk p(z) profile which contains all data from a given study area, two hydrostatic vertical pressure gradient lines (γhyd(max) and γhyd(min)) with the same gradient started along the vertical axis z from zwt(max) and zwt(min), respectively, can represent the boundaries of normal and abnormal pressure regimes (Figure 2). The hydrostatic vertical pressure gradient means that downward increasing pressure values equilibrated by the downward decreasing measuring point elevations (z) provide the same hydraulic head (h) values for each measuring point along the gradient line (see Equation (3)). These hydrostatically increasing pressure values and a constant hydraulic head along a vertical pressure gradient line mean the lack of vertical fluid flow (though horizontal flow cannot be excluded), which defines hydrostatic conditions. As a result, a hydrostatic vertical pressure gradient (γhyd) line starting from a given water table elevation (zwt) represents a constant hydraulic head (h) with increasing depth, which is equal to zwt, and zwt is equal to hwt. Accordingly, the γhyd(max) line starting from zwt(max) presents the hwt(max) (or simply h(max)) value of the basin, whilst γhyd(min) line starting from zwt(min) presents the hwt(min) (or simply h(min)) value of the basin. Pressures above the γhyd(max) line are overpressured, whilst pressures below the γhyd(min) line are underpressured.
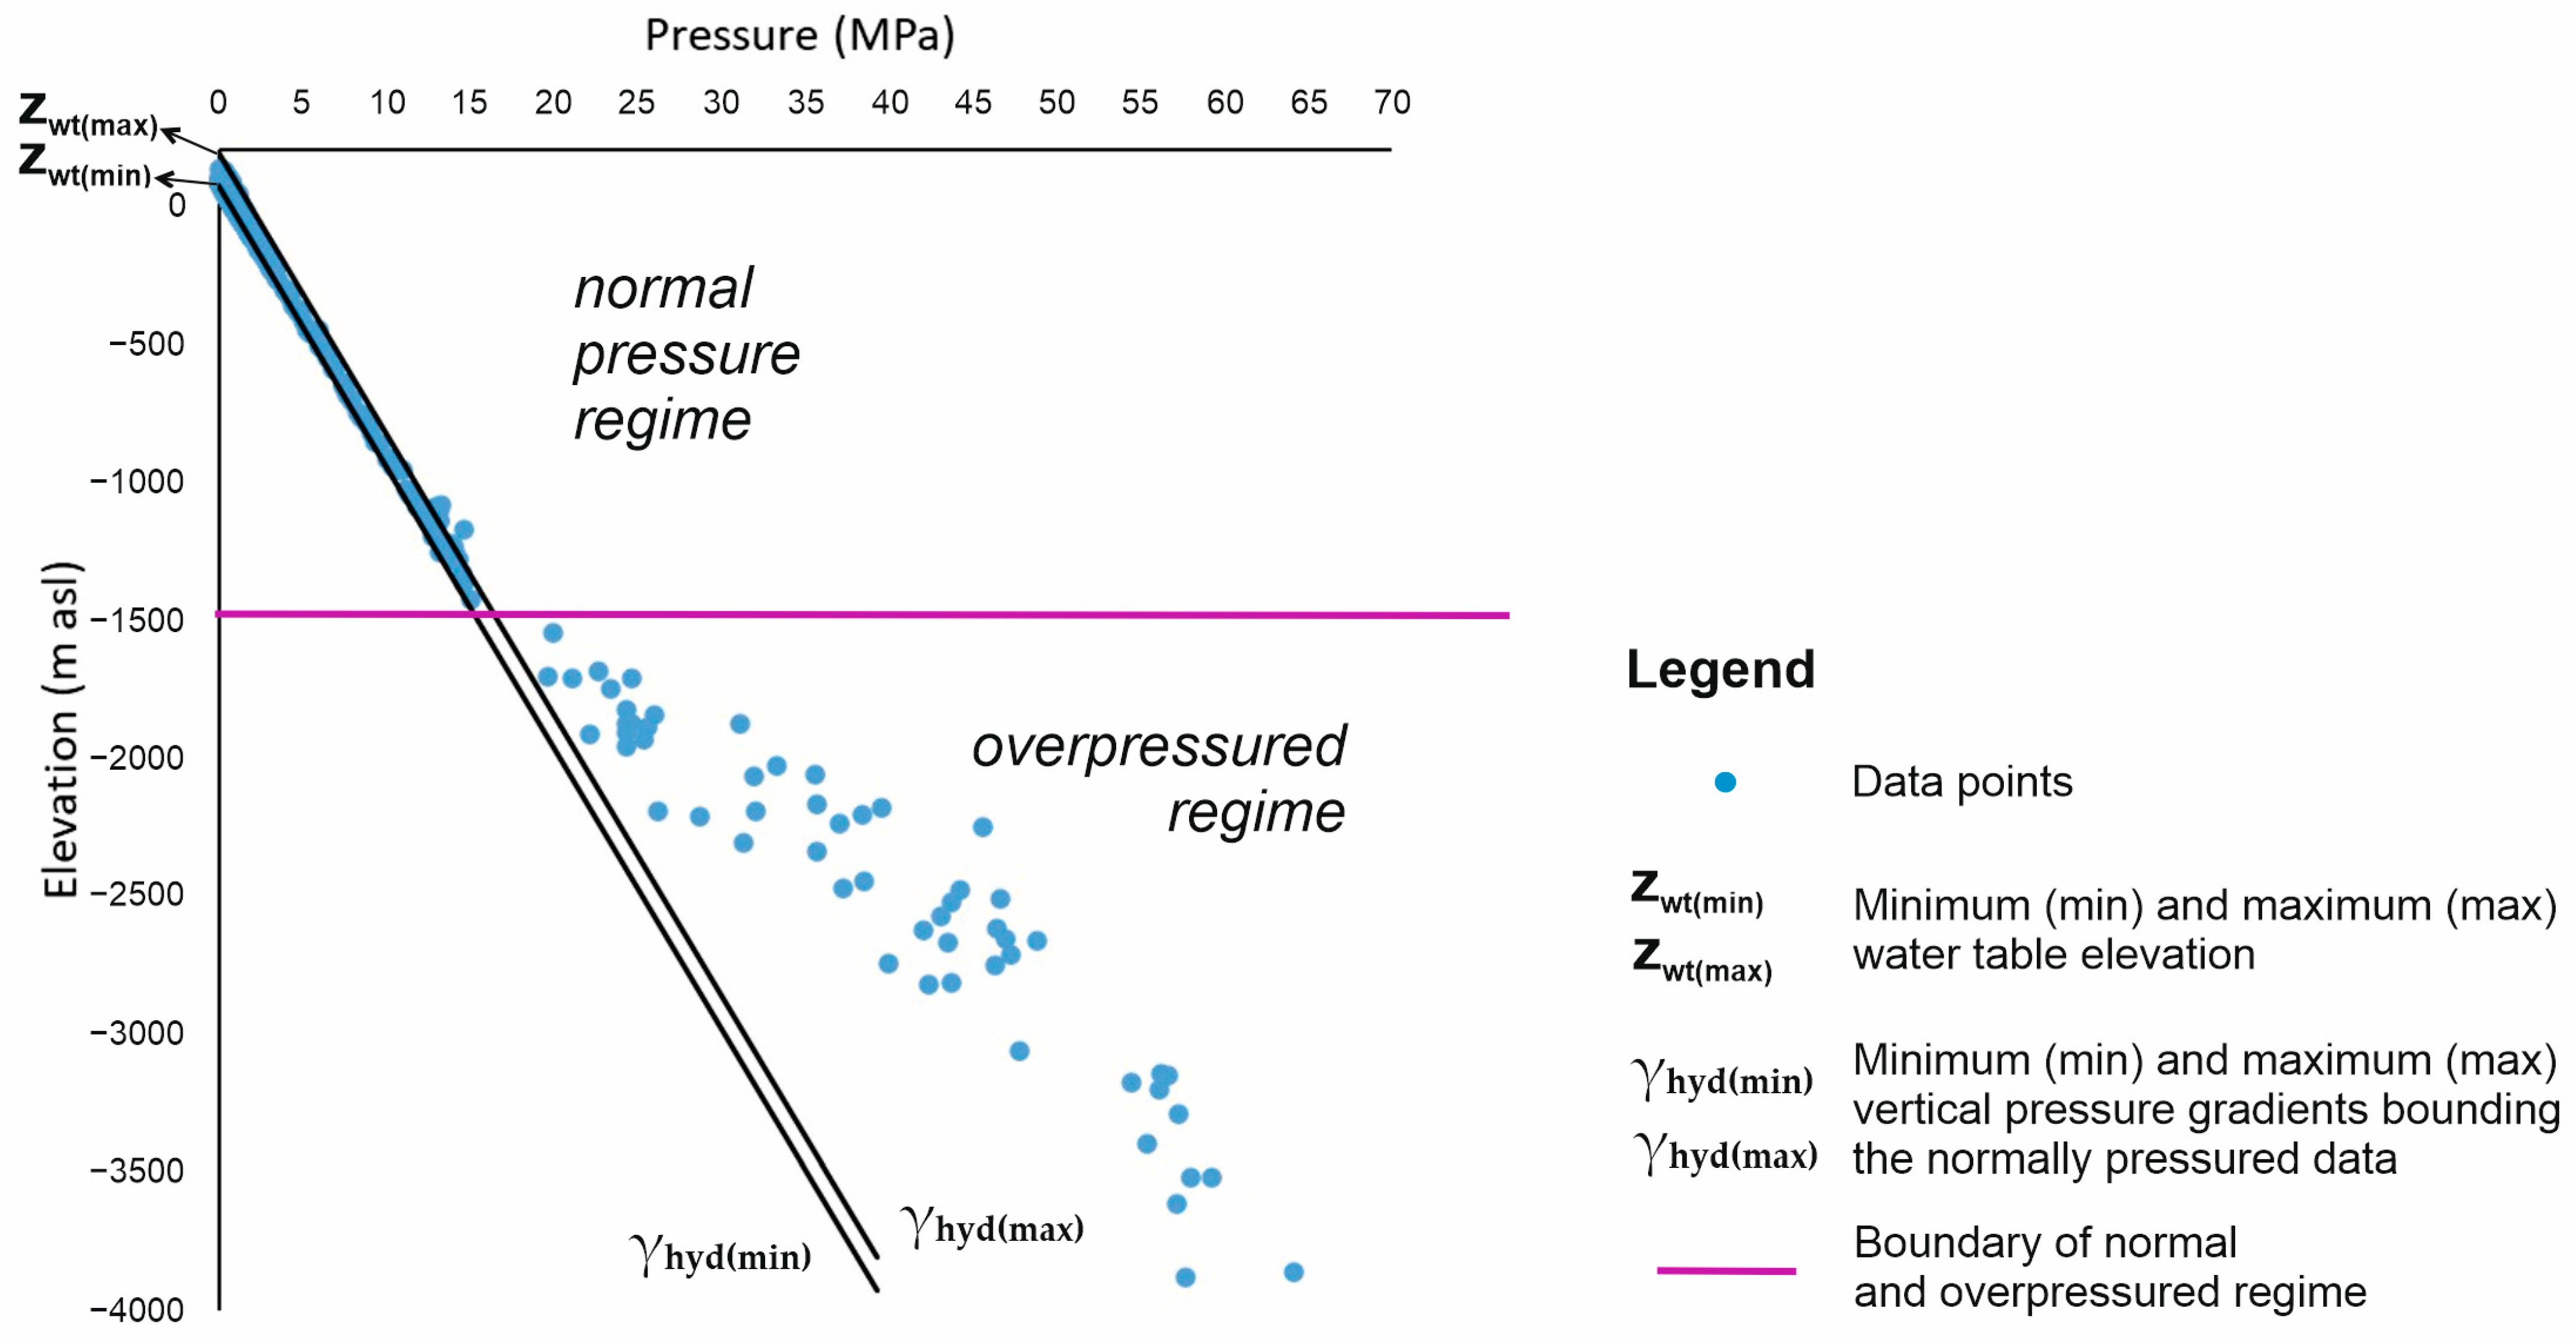
Accordingly, all pressure data were displayed on one p(z) profile. The zwt(max) or hmax value was approximated by the maximum land surface elevation as hmax = 190 m asl, whilst the zwt(min) or hmin by the minimum land surface elevation as hmin = 70 m asl. The values of γhyd(max) and γhyd(min) are equal to 9.81 MPa/km (with a water density of 1000 kg/m3 explained in Section 3.2) and start from the hmax = zwt(max) = 190 m asl and hmin = zwt(min) = 70 m asl values, respectively.

3.3.2. Local p(z) Profiles

Thirty-nine local p(z) profiles were also constructed for about 5 × 5 km areas (Figure 1) to analyze the vertical flow components. Within these small areas, the geological build-up and water table (or topographical) elevation is less variable, and thus allows for the interpretation of vertical pressure gradients (γ), which is otherwise theoretically possible only based on data of one well (i.e., data along a vertical line) [21,62]. The vertical pressure gradient allows for the examination of the vertical component of fluid flow directions by comparing the observed or dynamic (γob) to the ideal hydrostatic (γhyd) vertical pressure gradient. Superhydrostatic vertical pressure gradient (γhyd < γob = γsup) refers to upward flow, subhydrostatic (γhyd > γob = γsub) refers to downward flow, whilst hydrostatic (γhyd = γob) refers to lateral flow (i.e., lack of vertical flow component) conditions. These three types of vertical pressure gradients can occur in any kind of pressure regimes (i.e., in normal, over-, and underpressured regimes) (Figure 2). Thus, smaller deviations from the ideal hydrostatic conditions also occur in the normal or “close to hydrostatic” pressure regime and generate vertical flow components. Namely, in topography-driven flow systems, the recharge areas are characterized by subhydrostatic vertical pressure gradients, thus downward flows; the discharge areas are characterized by superhydrostatic vertical pressure gradients, thus upward flows; and only the midline areas can represent hydrostatic vertical pressure gradients thus lateral flow conditions.
In the common practice of hydrodynamic analysis, a hydrostatic vertical pressure gradient line is displayed in p(z) profiles in order to help to define the observable (or dynamic) vertical pressure gradient(s). However, its starting point along the elevation (z) axis is questionable. Nevertheless, it generally starts from the average water table or topographical elevation of the given p(z) profile’s bounding area (e.g., [21,28,62,63]), which can cause misinterpretations due to the deviation from the original p(z) profile interpretation of data along a vertical line by its extension to an area (i.e., to a 3D block). However, in fact, based on the considerations and methodology of Section 3.3.1, it is basically unnecessary to graphically represent the hydrostatic vertical pressure gradient line starting from any point. Indeed, on the one hand, the γhyd(max) and γhyd(min) lines determined for the whole study area and starting from zwt(max) and zwt(min) of the basin, respectively, separate the normal and abnormal pressures also in these p(z) profiles. On the other hand, values of the observed vertical pressure gradients (γob) can be compared to the value of the hydrostatic gradient (γhyd) in order to determine the vertical fluid flow components in any kind of pressure regime. Accordingly, in the created local p(z) profiles, the observed vertical pressure gradients (γob), and the γhyd(max) and γhyd(min) lines were displayed with a value of 9.81 MPa/km starting from the zwt(max) = hmax = 190 m asl and zwt(min) = hmin = 70 m asl values, respectively.
In addition, a further question arises around the comparison of the values of the ideal hydrostatic (γhyd) and the observed (γob) vertical pressure gradients. Namely, partly due to the density and averaging related uncertainties described in Section 3.2, a “close to hydrostatic” vertical pressure gradient range should also be defined which represents the lateral flow conditions. However, boundaries of this “close to hydrostatic” vertical pressure gradient range cannot be defined as accurate as that of the normal or “close to hydrostatic” pressure regime. It is rather an iterative process where, on the one hand, widening of the range results in more lateral flow (midline) areas or basin parts, whilst narrowing results in more recharge and discharge areas or basin parts within the given basin. On the other hand, interpretations could also be changed or refined based on the analysis of tomographic fluid potential maps, hydraulic cross sections, and numerical simulations [21,27,28,29,63]. As a result, for instance in the dominantly siliciclastic sub-basins of the Pannonian Basin (Hungary), an empirical interval of γhyd ± 5% (about ±0.5 MPa/km) was applied effectively in regional scale studies [21,28,29,63]. However, in the present study, a narrower γhyd ± 1% (about ±0.1 MPa/km) interval proved to be effective probably due to the lower relief of the water table. This γhyd ± 1% interval means that γob represents hydrostatic (i.e., lateral flow) conditions between 9.71 and 9.91 MPa/km, superhydrostatic (upward flow) conditions above 9.91 MPa/km, and subhydrostatic (downward flow) conditions below 9.71 MPa/km.

3.4. Tomographic Fluid Potential Maps and Hydraulic Cross Sections

Based on the results of p(z) profile interpretation, tomographic fluid potential maps [h(x,y)] were compiled for 7 consecutive elevation intervals from z = 135 m asl down to z = (−3878) m asl elevation. Hydraulic head data were contoured for each interval by inverse distance to power interpolation. Based on the derived contour lines, i.e., equipotential lines, direction of the lateral flow driving force component can be determined perpendicularly to the equipotentials as fluids migrate from the areas of higher hydraulic heads to those of the lower hydraulic heads. Even considering a heterogeneous and anisotropic flow medium (i.e., rock framework), the flow lines are also more or less perpendicular to the equipotentials particularly regarding the regional scale flow directions. Consequently, the flow directions are presented by arrows in the maps.
Subsequently, 5 hydraulic cross sections [h(s,z)] were made up (trace lines can be seen in Figure 1) in order to study the vertical and lateral flow directions in the sections’ plane based on the same principles as in the fluid potential maps. Hydrostratigraphic build-up, the major fault zones, and hydrocarbon accumulations were also displayed in the cross sections to enable joint interpretation.

4. Results and Interpretations

4.1. Regional Pressure Regimes and Vertical Flow Components

On the bulk p(z) profile (Figure 3), an overpressured regime could be identified below z = (−1500) m asl. The downward continuously increasing excess pressure compared to γhyd(max) is about 25 MPa (~170%) around z = (−3500) m asl. The overlying normal or “close to hydrostatic” pressure regime lies between the γhyd(max) and γhyd(min) lines.
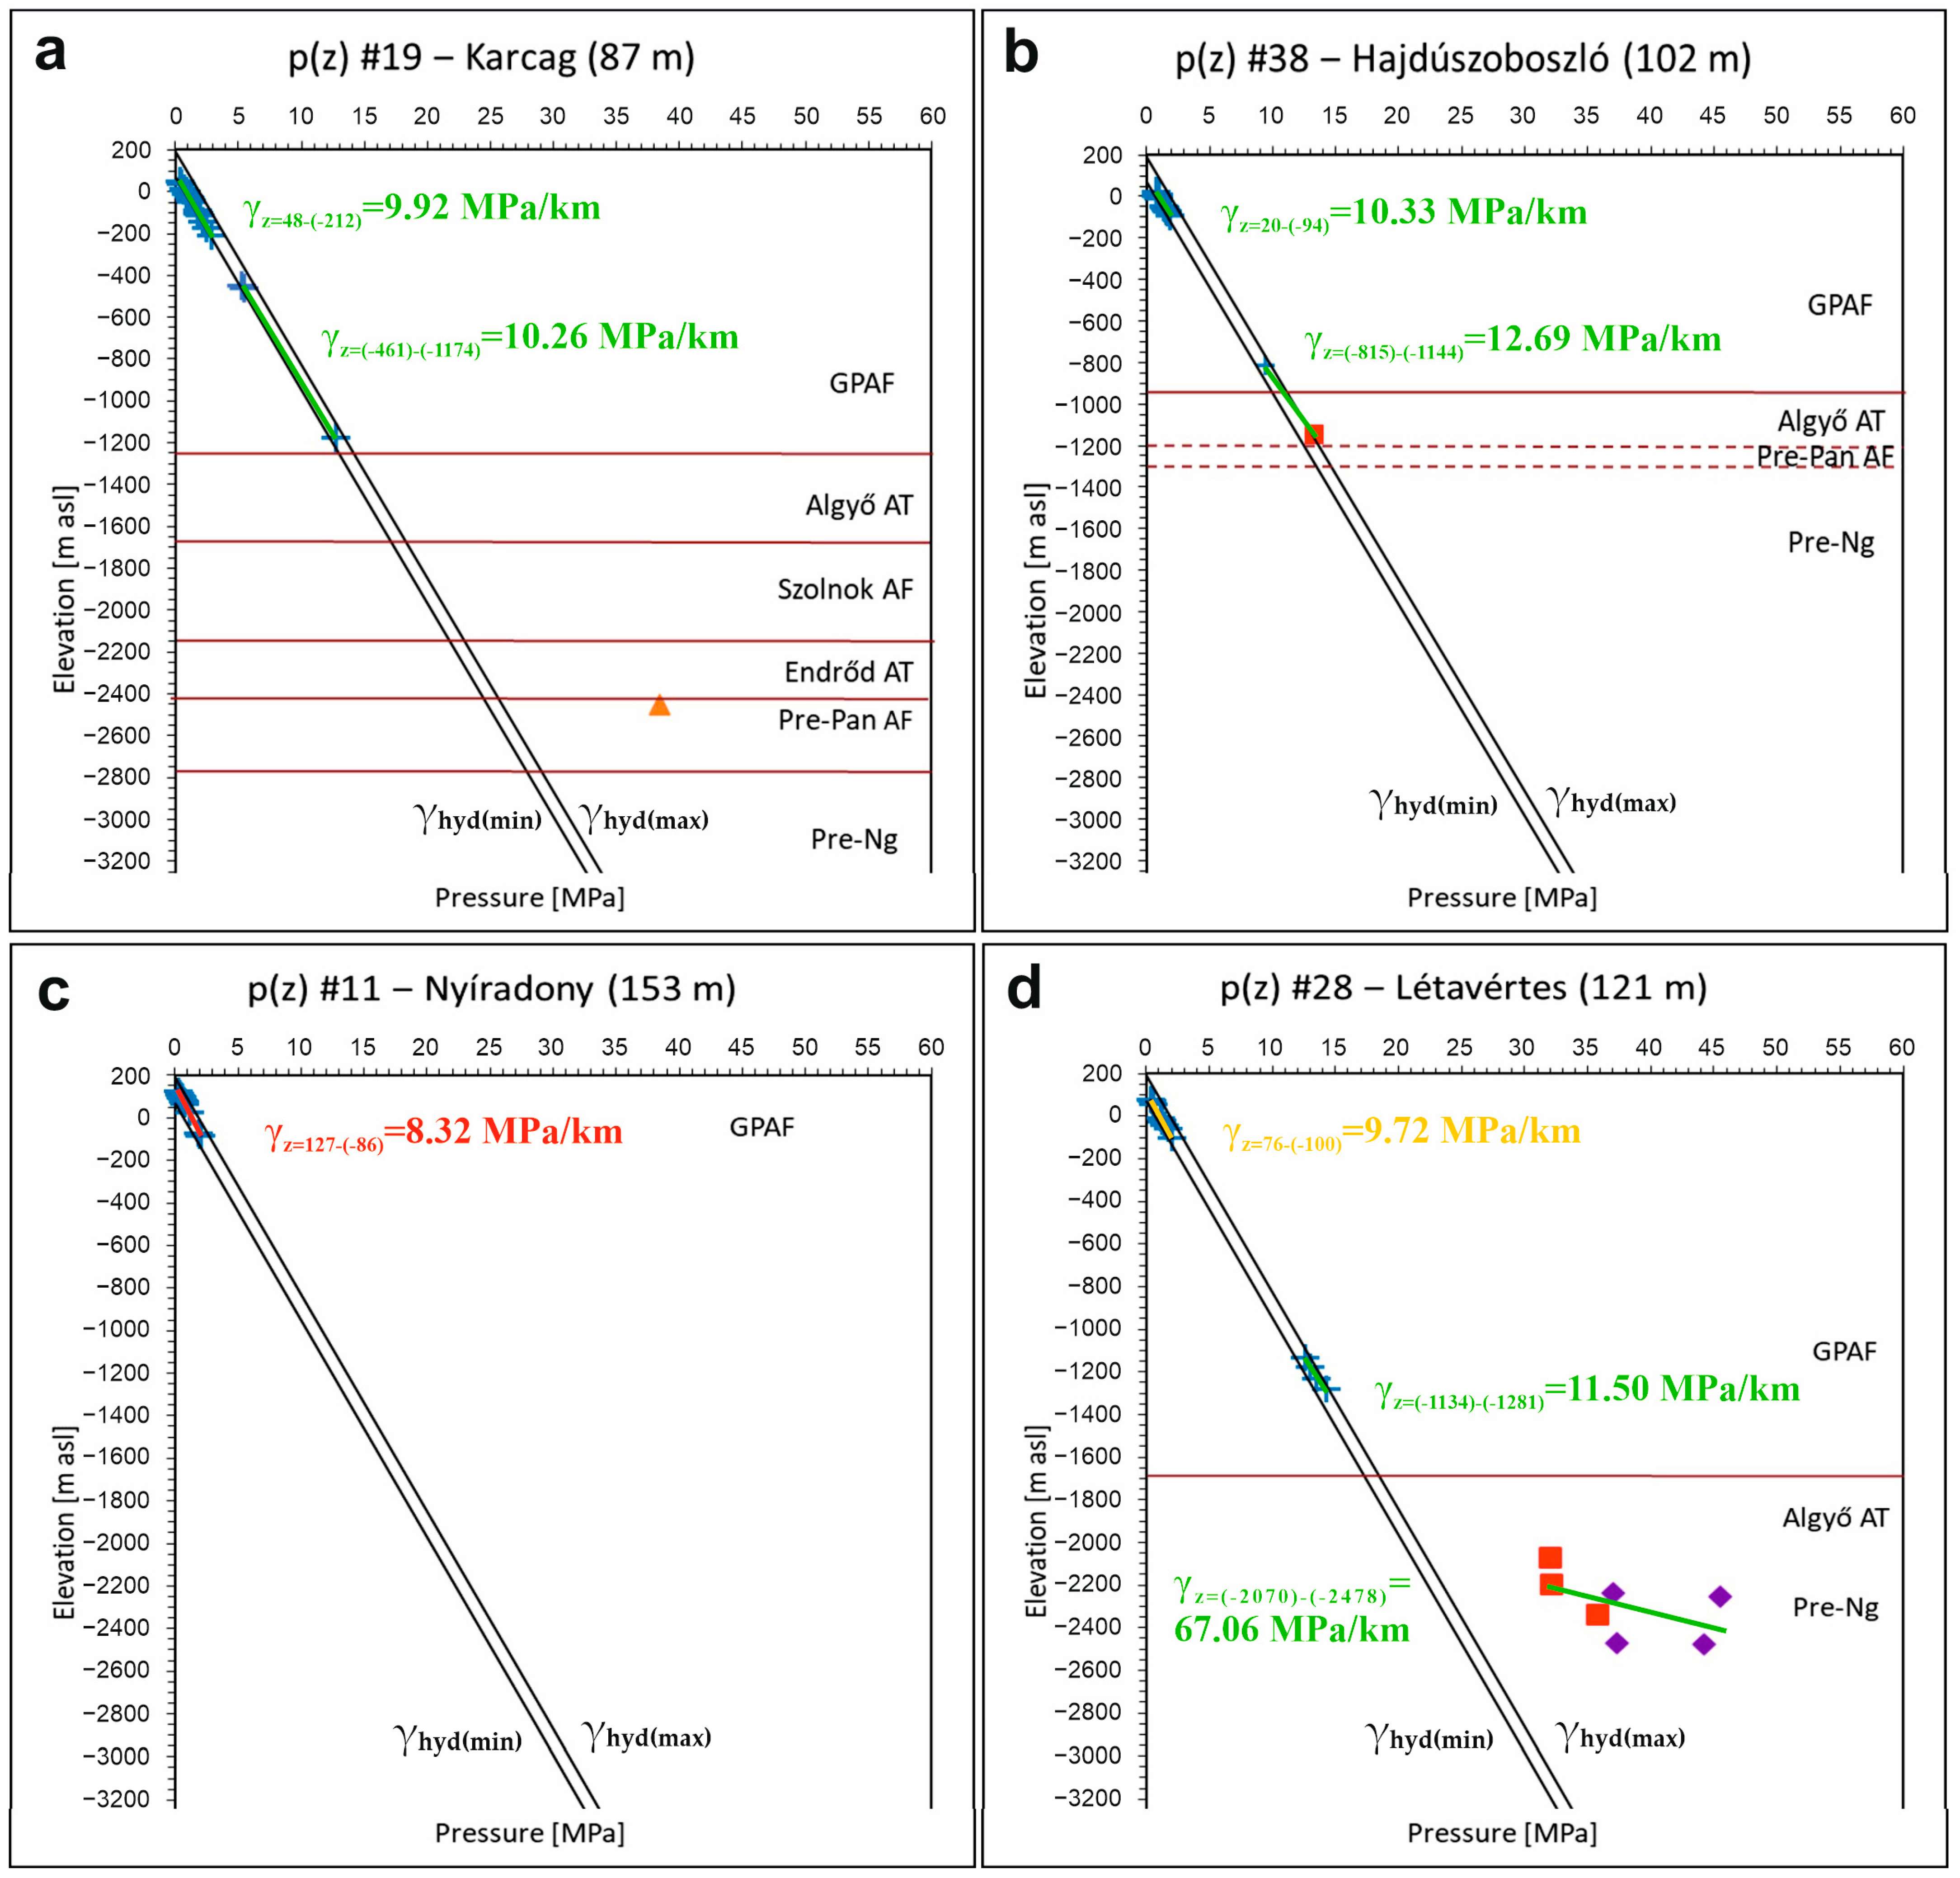
Based on the local p(z) profiles the vertical flow conditions could also be analyzed (Table 1). As a result, from the land surface down to about z = (−500) m asl downward, lateral, and upward flow conditions (i.e., recharge, midline, discharge areas, respectively) could be identified. For instance, p(z) profiles along cross section B (Figure 1) represent recharge conditions in the northeast and discharge conditions in the southwest. Namely, profiles #11 (Figure 4c), 12, and 23 reveal downward vertical flow components, whilst profiles #38 (Figure 4b), 21, and 19 (Figure 4a) show upward vertical flow components. It represents the concordance of vertical flow directions with the water table relief (i.e., with the topographic conditions), thus belonging to topography-driven flow systems above z = (−500) m asl. It is worth emphasizing that in the study area, the largest vertical pressure gradient (10.33 MPa/km), i.e., the most intensive upward flow component, could be observed around the Hajdúszoboszló gas field (p(z) profile #38 (Figure 4b)).
Between about z = (−500) and (−1500) m asl, where data are available (Table 1, Figure 4a,b,d), vertical pressure gradients generally represent increased values and upward flow conditions also below the recharge areas of the upper 600 m (i.e., down to z = (−500) m asl). Finally, the upper boundary of the overpressured system around z = (−1500) m asl (Figure 3) cannot be caught in the local p(z) profiles due to the lack of data, but vertical pressure gradients of the deeper overpressured data always represent superhydrostatic values (Table 1, Figure 4d).

4.2. Regional Horizontal Groundwater Flow Conditions

The two shallowest maps of the elevation intervals z1 = 135–0 m asl (Figure 5a) and z2 = 0–(−500) m asl (Figure 5b) represent a southwestward regional flow direction from the northeastern elevated areas (Nyírség area) towards the southwestern topographical depressions. Thus, these are topography-driven flow systems down to about z = (−500) m asl in concordance with the p(z) profile interpretations (Figure 5a). Namely, classifications of the local p(z) profile bounding areas as recharge, midline, or discharge areas down to z = (−500) m asl m were also displayed on the shallowest tomographic fluid potential map (Figure 5a). It represents the concordance of vertical flow directions with the water table relief (i.e., with the topographic conditions). As a result, the regional recharge and discharge areas could be delineated in the NE and SW parts, respectively. Horizontal hydraulic gradient in the east of the h = 100 m asl equipotential line is relatively high in the regional recharge area (~50 m/50 km = 10−3 m/m in Figure 5a, ~20 m/60 km = 3.3 × 10⁻⁴ m/m in Figure 5b) and lower in the west of the h = 100 m asl equipotential line in the regional discharge area (~10 m/40 km = 2.5 × 10⁻⁴ m/m in Figure 5a, ~15 m/70 km = 2.1 × 10⁻⁴ m/m in Figure 5b). The shallowest pools of the Hajdúszoboszló, Ebes, and Ebes-North gas fields are located in the z1 and z2 elevation intervals (Figure 5) between the h = 100 and 90 m asl equipotential lines where the hydraulic gradient strongly decreases.
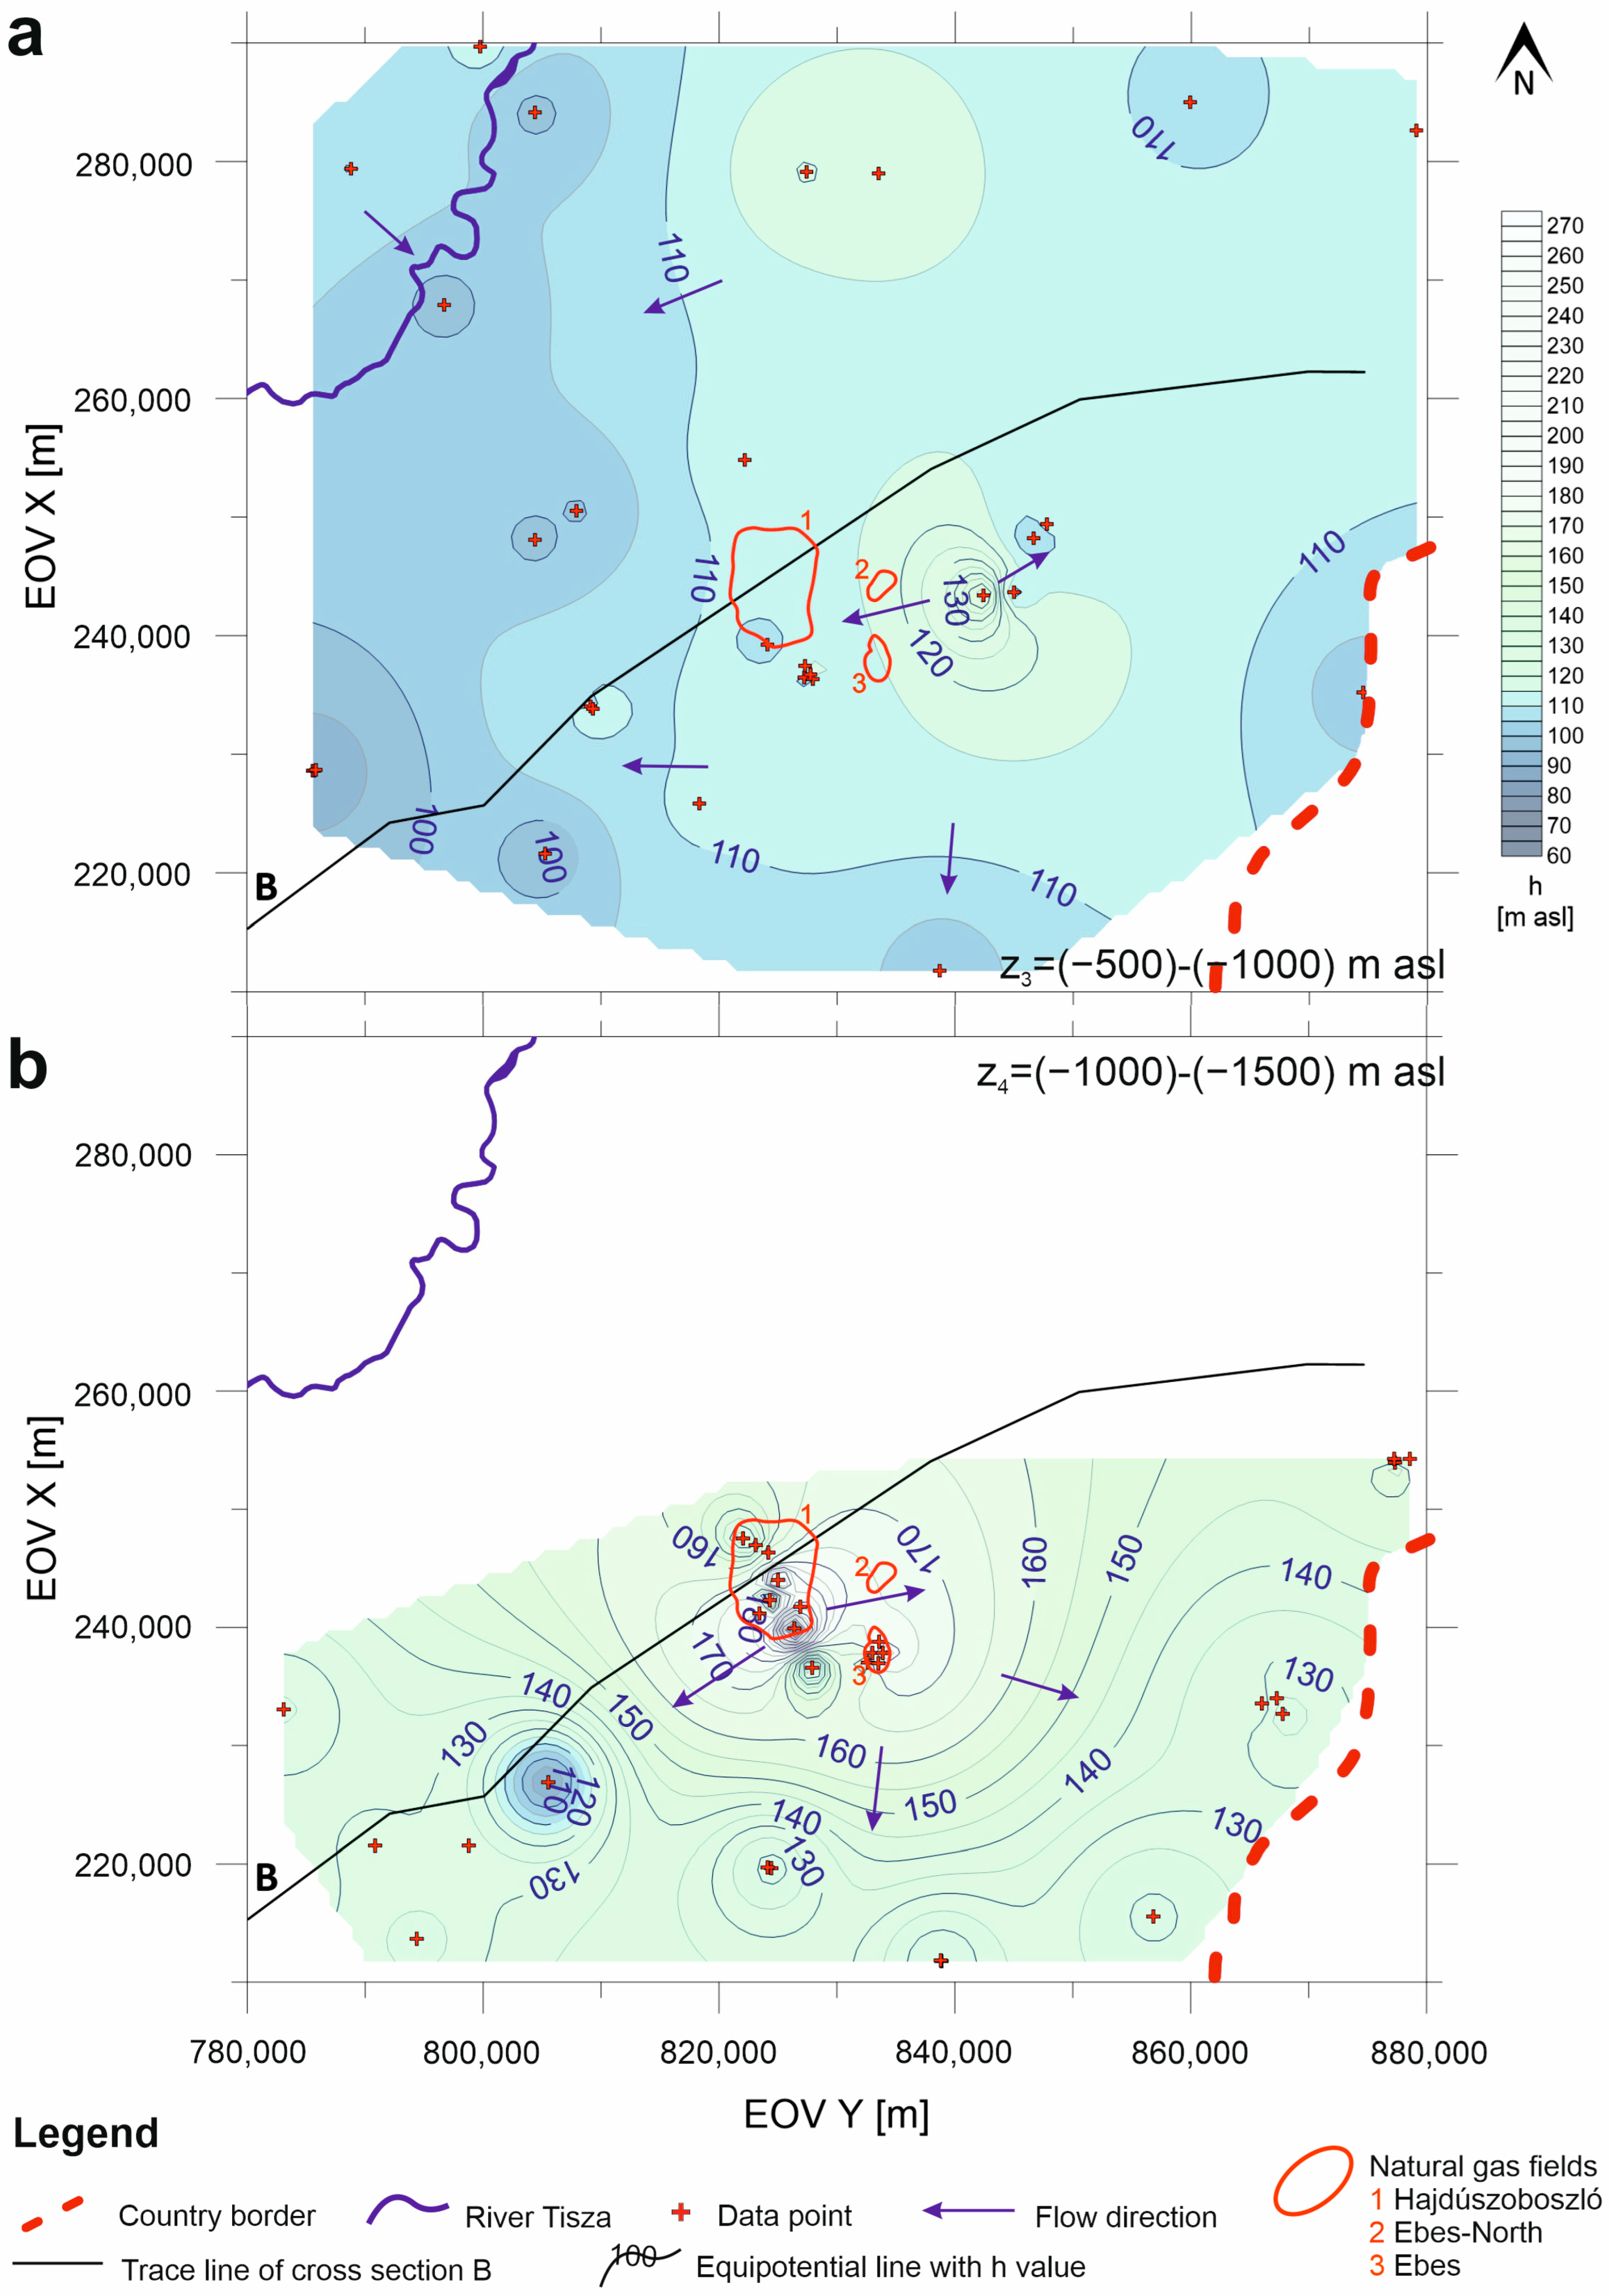
In the deeper maps below z = (−500) m asl (Figure 6 and Figure 7), data distribution becomes sporadic and thus limits conclusions. What can still be determined is the downward increase in hydraulic head values (Figure 6), and moreover, a leap of magnitude below about z = (−1500) m asl (Figure 7) in the southern part of the area where data were available. These results are also in concordance with the p(z) profile interpretations (Section 4.1). Namely, data between z = (−500) and (−1500) m asl (Figure 6) represent a transition zone where still normal pressure regime but independence from the topographical conditions (i.e., from water table relief) can be observed. On the other hand, data below z = (−1500) m asl (Figure 7) already represent the overpressured regime. Finally, it is worth emphasizing that a positive anomaly can be observed around the Hajdúszoboszló gas field in the z4 = (−1000)–(−1500) m asl elevation interval (Figure 6b).

4.3. Regional Groundwater Flow Pattern

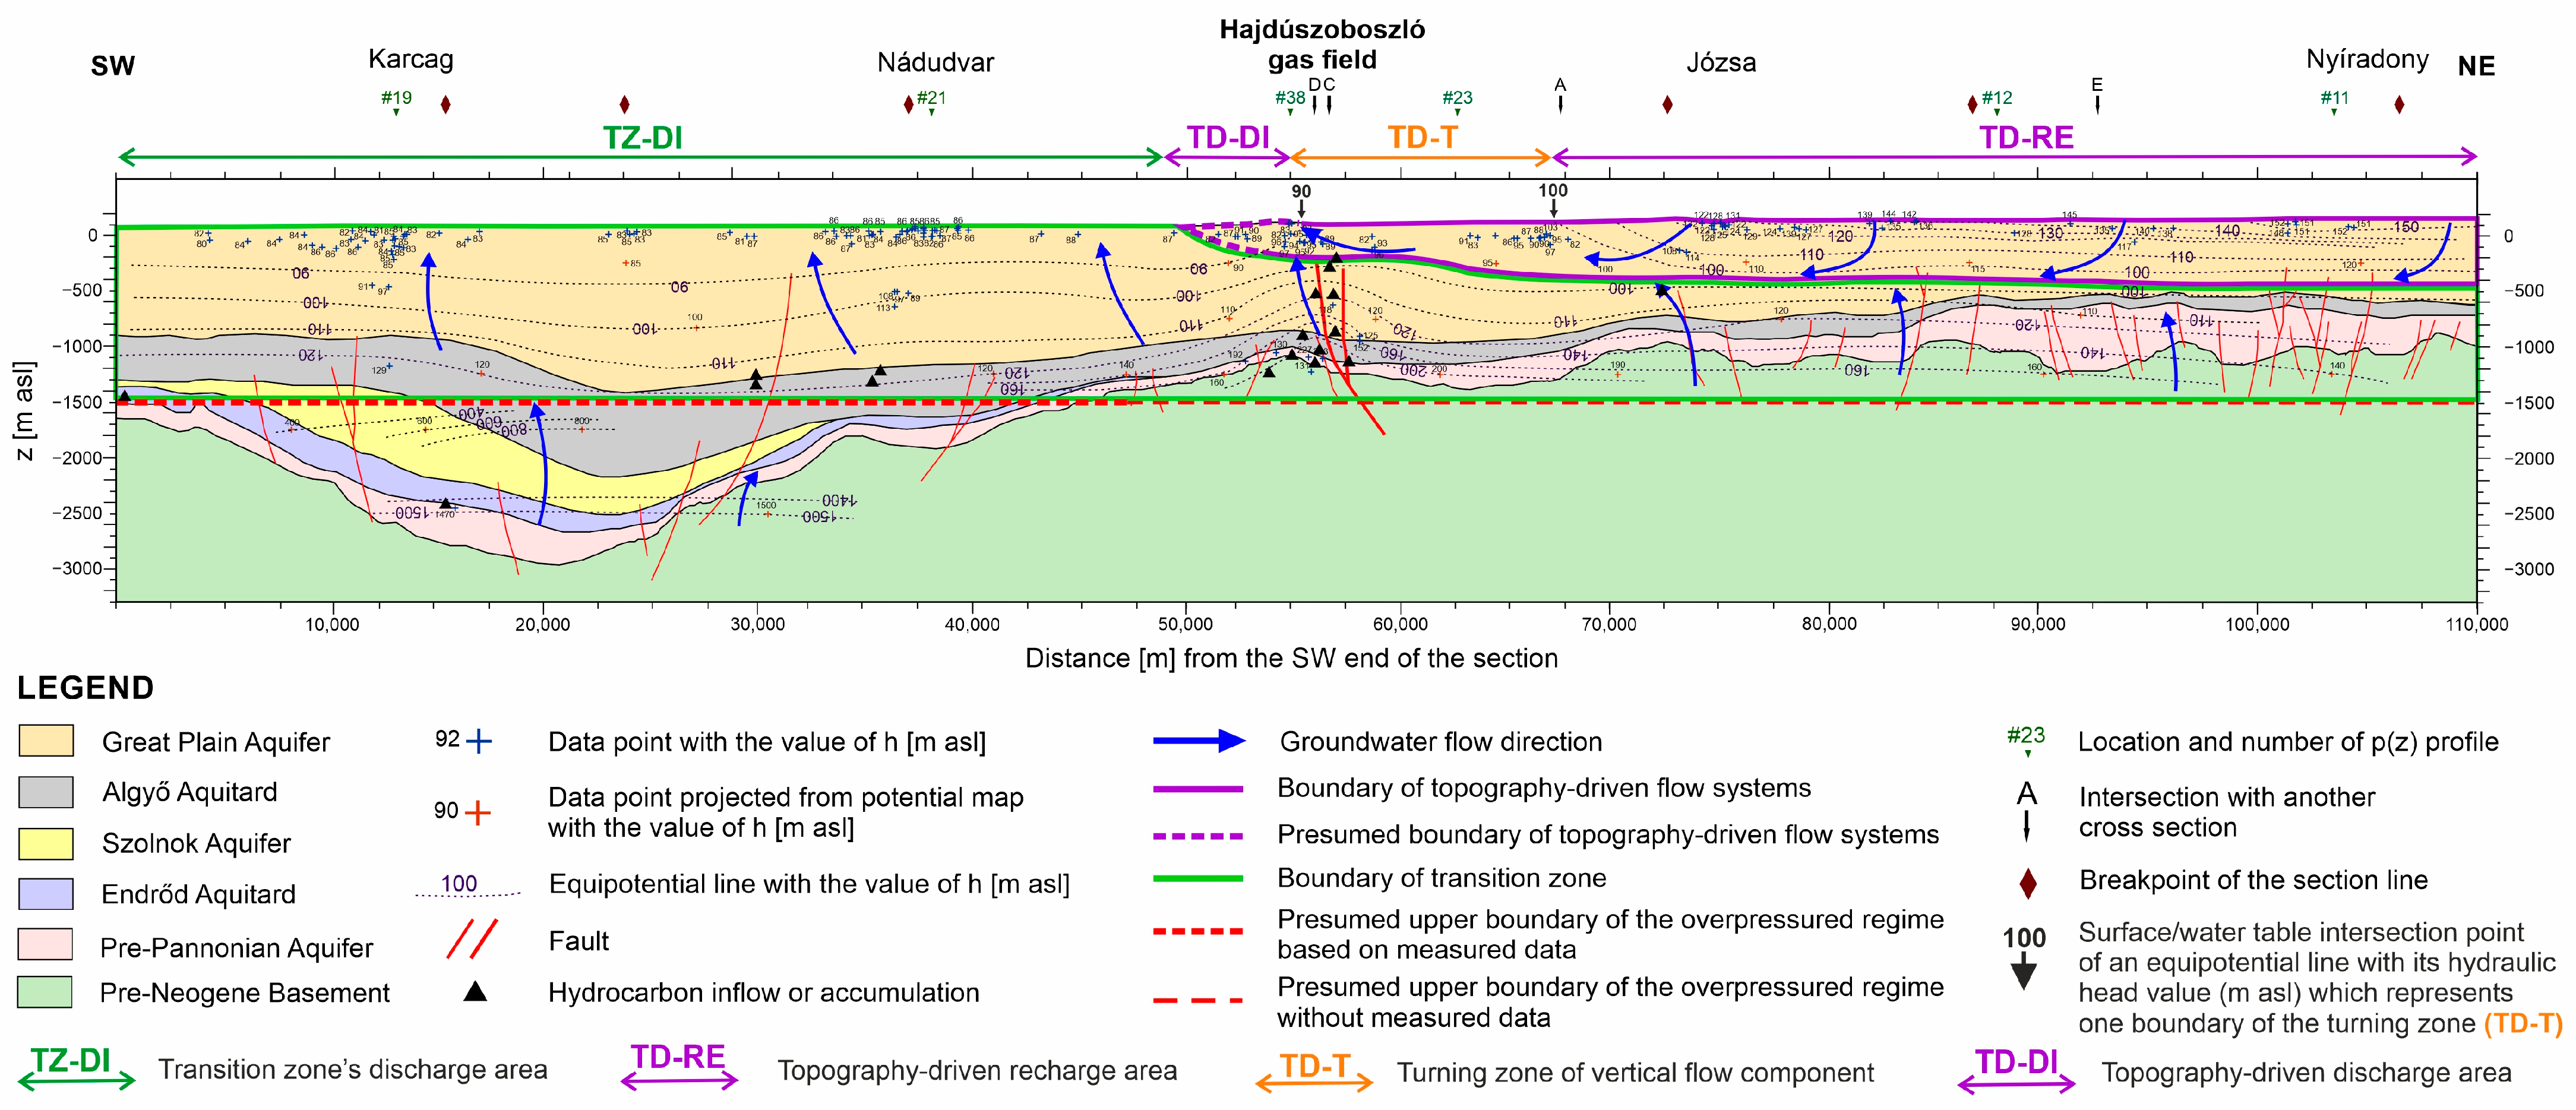
Among the hydraulic cross sections, “B” is presented (Figure 8) which runs along the regional hydraulic gradient of the topography-driven flow system (based on Figure 5) and across the Hajdúszoboszló gas field. Based on its interpretation in combination with the p(z) profile and tomographic fluid potential map analyses, three flow domains can be separated in the northeastern half of the section (and the study area), whilst in the southwestern half, only two flow domains can be clearly separated.

4.3.1. NE Part of the Study Area

In the northeastern half of the study area, topography-driven groundwater flow systems dominate the upper approximately 600 m depth (i.e., above z = (−500) m asl). Within this flow domain, horizontal flow components tend towards the southwest following the regional topographical slope (Figure 5). In the northeast of the 67.5 km section, two adjacent equipotential lines can be observed around z = (−500) m asl elevation with the same hydraulic head value (h = 100 m asl), which indicate opposite and converging flow directions, and eventually the lower boundary of the topography-driven flow system. Inside the northeastern part of this system, vertical flow components point downward from the land surface down to the upper h = 100 m asl equipotential line, and represent the topography-driven recharge zone (TD-RE in Figure 8). It is also represented by the local p(z) profiles with downward flow conditions above z = (−500) m asl (Table 1) (e.g., Figure 4c). Then, vertical flow components turn upward from the h = 90 m asl equipotential line (around 55 section km) and topography-driven groundwater starts to discharge (TD-DI in Figure 8). It is also presented by the local p(z) profiles with upward flow conditions above z = (−500) m asl (Table 1) (e.g., Figure 4a,b). Finally, the narrow region between TD-RE and TD-DI was named as a turning zone (TD-T) to highlight the change in the vertical flow component of the topography-driven flows from downward to upward.
Below about z = (−1500) m asl, an overpressured regime could be identified particularly in the deeper subbasins from around the top of the Algyő Aquitard, in concordance with the bulk p(z) profile (Figure 3) and the tomographic fluid potential maps (Figure 7). The dominant flow direction within this overpressured regime is upward.
Finally, below the topography-driven flow domain, down from the lower h = 100 m asl equipotential line, upward flows can be observed which are deflected southwestward by the overlying topography-driven flows. This flow domain between the topography-driven flows and the overpressured regime, thus between about z = (−500) and (−1500) m asl, was named as a transition zone. It could also be identified in the bulk p(z) profile as a normally pressured zone (Figure 3), in the local p(z) profiles as a uniform upward flow zone (Table 1) (e.g., Figure 4d), and in the tomographic fluid potential maps (Figure 6) as a flow domain which is independent from the topographical conditions. Based on these findings, it can be concluded that the transition zone also gains its energy from the dissipation of overpressure which is still enough to generate upward flows but only within the normal pressure regime.

4.3.2. SW Part of the Study Area

In the southwestern half of the section (and the study area), basically uniform upward flow conditions can be observed everywhere and only the two regional pressure regimes, i.e., the normally pressured and the overpressured regime, can be clearly separated around z = (−1500) m asl. However, separation of the topography-driven discharge zone (TD-DI in Figure 8) and the transition zone (TZ-DI in Figure 8) is not possible based on the hydraulic data interpretation and flow pattern. Czauner et al. [22,23] defined it in other study areas of the Great Hungarian Plain based on the surface salinization phenomena which can appear where saline water of the transition zone can approach the land surface. In their study areas the topography-driven discharge areas (TD-DI) consist of a narrow belt between the topography-driven recharge areas (TD-RE) and discharge zones of the transition zone (TZ-DI). Accordingly, extension of the TD-DI was estimated similarly in Figure 8.

4.3.3. Biogenic Gas Fields

The Hajdúszoboszló gas field can be found around the southwestern boundary of the turning zone of the topography-driven flow system (TD-T in Figure 8) where the upward flow component starts to dominate, and groundwater of the transition zone can also approach the land surface. The turning zone (TD-T) between the h = 100 and 90 m asl equipotentials and the position of the Hajdúszoboszló, and the minor Ebes and Ebes-North gas fields can also be observed in the shallowest fluid potential maps (Figure 5) which represent the topography-driven flow system. In addition, cross section B also reveals the largest fault zone along the section around the Hajdúszoboszló gas field. Its strike direction is perpendicular to the section’s trace line, while its length is only about 5 km [51]. Since most pools of the gas field are located in this fault zone, it could be a decisive pathway for water and hydrocarbons. It is also supported by the positive fluid potential anomaly around the fault zone above z = (−1500) m asl which could also be identified in the z4 potential map (Figure 6b).

5. Discussion

5.1. Developed Methodology of Basin-Scale Hydraulic Evaluation

The generally used basin-scale hydraulic evaluation methodology was significantly improved by the development of p(z) profile interpretation. The assessment of regional pressure regimes on a bulk p(z) profile enables the separation of normally, over-, and underpressured regimes, whilst evaluation of vertical pressure gradients on local p(z) profiles allows the interpretation of vertical flow directions. Then, the combined interpretation of pressure regimes and vertical flow directions with the tomographic fluid potential maps and hydraulic cross sections enables the separation of regional flow domains and the characterization of their interplay.

5.2. Regional Groundwater Flow System Model of the Great Hungarian Plain, Central Pannonian Basin

The basin-scale hydraulic evaluation of measured data revealed three flow system domains in the study area (Figure 8), namely, a topography-driven flow domain and an underlying transition zone within the normal pressure regime, as well as a bottommost overpressured regime. In the topography-driven flow system, groundwater flows from the northeastern recharge towards the southwestern discharge area with a penetration depth of a maximum of 500–600 m. On the other hand, water flows basically upward in the transition zone and in the overpressured regime. Upward flows of the transition zone are deflected by topography-driven flows towards the regional discharge areas in the southwest where water of the transition zone can also approach the land surface. However, the boundary of the topography-driven flows and the transition zone cannot be clearly separated in the regional discharge area (in the southwestern part of the study area) where both systems represent normal pressure conditions and upward flows. The top of the overpressured regime is around z = (−1500) m asl.
The same flow system configuration was identified by Czauner et al. [22,23] in other parts of the Great Hungarian Plain (GHP) (Duna–Tisza Interfluve, Battonya High, Békés Basin, Derecske Trough) based on measured hydraulic data.
These results are of significant concern for the groundwater resources of Hungary. About 40% of the produced groundwater (without water from river bank filtration) in Hungary comes from the GHP [64]. However, only the topography-driven flow systems have natural water replenishment from precipitation, basically in the recharge areas. On the contrary, resources of the transition zone, which has seemingly larger spatial extension, are non-renewable as those of the parent overpressured regime, and raise questions in water management and in the mitigation of the effects of climate change.

5.3. Groundwater Flow Controlled Migration and Accumulation Model of Dissolved Biogenic Gases

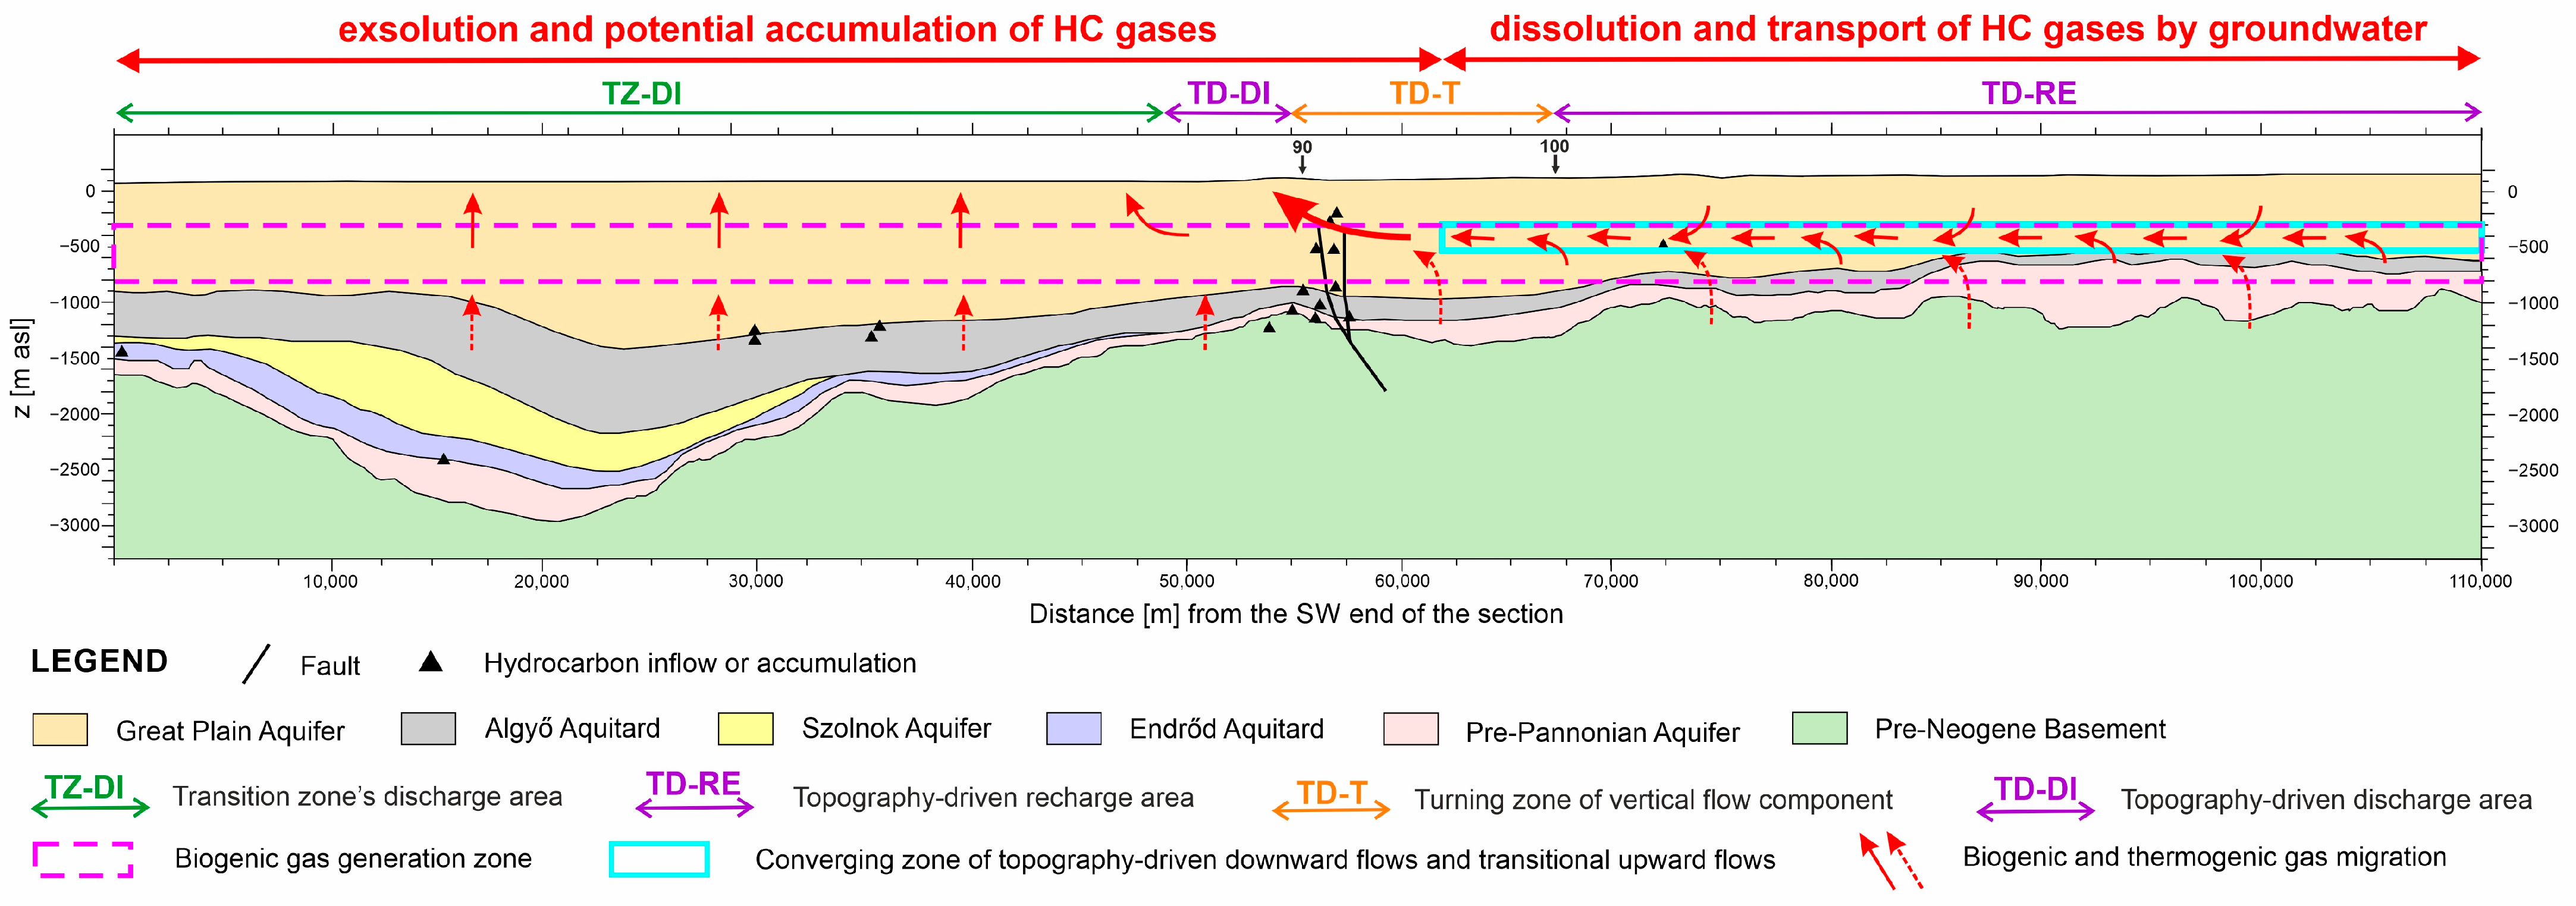
The basin-scale hydraulic evaluation of measured data revealed the most favorable hydrodynamic conditions for hydrocarbon entrapment in the study area around the Hajdúszoboszló gas field (Figure 8 and Figure 9). Namely, groundwater is transported towards southwest also within the topography-driven flow systems and in the transition zone where upward flows are deflected southwestward in the converging (i.e., hydraulic trap) zone of the two flow domains. The vertical flow component of the topography-driven system changes from downward to upward in the turning zone (TD-T) where the horizontal hydraulic gradient also sharply decreases. These hydrodynamic conditions especially favor hydrocarbon entrapment. Namely, if there is available gas (whether biogenic or thermogenic) in the recharge basin part which can be dissolved by groundwater, then it will be transported in aqueous solution by flowing groundwater and gathered in the converging (i.e., hydraulic trap) zone which further conveys it southwestward (Figure 9). This gathering and focused horizontal migration of dissolved gases is taking place southwestward until a remarkable decrease in pressure and temperature takes place. As a result, decreasing pressure decreases, whilst decreasing temperature increases methane solubility in the temperature range below about 90 °C where biogenic gas systems operate. However, due to the usually dominating influence of pressure, methane solubility generally decreases. That is the case in the study area as well [65] where drop of pressure and temperature starts in the turning zone where groundwater flow direction turns upward (Figure 9). These conditions coupled with the drop of horizontal hydraulic gradient (i.e., flow driving force) create ideal hydrodynamic conditions for the exsolution of hydrocarbon gases from water. Then the free gas phase could be trapped in tectonic or stratigraphic traps, or escape to the atmosphere. Consequently, the turning zone between the h = 100 and 90 m asl equipotential lines and its southwestern (below h = 90 m asl) vicinity (Figure 5) provides the first zone or basin part in the study area where hydrodynamic conditions start to favor gas exsolution and entrapment instead of dissolution and transport.
In addition, the major fault zone around the Hajdúszoboszló gas field can also function as a vertical conduit for fluid flows and provide trap structures. In conclusion, coincidence of the favorable regional flow conditions and the local geological conditions (faults) could lead to the formation of the largest biogenic gas field of Hungary at Hajdúszoboszló. Since this is also the largest natural gas field of Hungary, it is also worth mentioning that all of these hydrodynamic and geologic conditions also favor the entrapment of thermogenic gases (Figure 9) which migrate upward from deeper sources.
The much smaller biogenic gas pools of the Ebes and Ebes-North fields in the vicinity of Hajdúszoboszló are also located in the turning zone above z = (−1500) m asl (Figure 5), thus the regional hydrodynamic conditions are similarly favorable here. However, since the major but short fault zone around the Hajdúszoboszló gas field does not extend to here, the lack of a major fault zone and further local conditions might explain the formation of smaller accumulations.
Finally, in the southwest of the turning zone where upward flow conditions dominate the whole basin (Figure 8 and Figure 9), groundwater flows favor vertical migration and loss of hydrocarbons, thus do not facilitate the formation of commercial biogenic gas accumulations.
Regarding the availability of biogenic gas in the study area, in the northeastern charge area, potential rocks are known which could generate biogenic gases. Namely, delta sequences of the Újfalu Formation, which consist of the lowest part of the Great Plain Aquifer, contain 1–6 m thick lignite layers [66]. Based on the geothermal gradient of the study area (50 °C/km) [67] and the expected peak microbial activity between 35 and 45 °C [5], biogenic gas generation could be assumed around z = (−500)–(800) m asl as a rough estimate. In another nearby study area in the Central Pannonian Basin, basin modeling of Bartha et al. [10] determined the present-day depth of the biogenic gas generation zone around the same depth. This biogenic gas generation zone overlaps with the flow converging zone (Figure 9), further enhancing the efficiency of the biogenic gas system.
In conclusion, biogenic gas generation and favorable hydrodynamic conditions for its migration and entrapment are also given in the study area. Additionally, the potential amount of the generated, dissolved, and exsolved biogenic methane were also estimated based on the flow system parameters of this study by Adonya et al. [65]. They found that the model is appropriate to charge the known biogenic gas accumulations in the study area. As a further consequence, it is recommended to search for further biogenic gas accumulations in the study area around the turning zone and in the west of it, and basically above z = (−1500) m asl.

6. Conclusions

This paper intends to apply the regional groundwater flow concept in biogenic gas exploration focusing on the migration and accumulation processes. The presented basin-scale hydraulic evaluation methodology which was improved for this purpose can actually be used in any terrestrial sedimentary basin for any geofluid-related research. In addition, the revealed groundwater flow system configuration can provide the base for numerical simulations, hydrogeochemical analyses, or local scale studies which can be misleading by themselves.
In the present case of a topography-driven system underlain by an overpressured regime, the derived flow pattern assigned the most favorable hydrodynamic conditions for the formation of commercial biogenic gas accumulations, namely, a horizontally extended hydraulic trap (i.e., flow converging) zone which can gather and transport dissolved gases in a large amount, coupled with a turning zone of a topography-driven system (i.e., where the vertical flow component turns from downward to upward) which favors the exsolution and accumulation of hydrocarbon gases. This flow system model could be applied to any terrestrial sedimentary basin where an overpressured regime underlies topography-driven flow systems. In other words, hydraulic traps (i.e., flow converging zones between the topography-driven and overpressured flows) and turning zones of the topography-driven systems are generic elements of these joint systems. Regarding the occurrence of these systems, topography-driven flow systems dominate the upper portion of all terrestrial basins [27,57,68], whilst an overpressured regime is known from more than 150 locations worldwide [69]. In addition, the model can also be adapted to basins where an underpressured regime underlies the topography-driven flow system. Underpressured regimes were identified in about 30 basins and regions worldwide [60].
In addition, the effect of the transition zone (between the topography-driven flows and overpressured regime) is not significant in this biogenic gas migration and accumulation model, but in water management and climate change-related issues. Thus, it is worth mentioning that the formation, and particularly the extension of the transition zone, may largely depend on the hydrostratigraphic build-up of the given basin. Regarding the deficiency of the methodology and the model that it cannot separate the topography-driven flow system and the transition zone in the normally pressured discharge basin part, numerical flow simulations could solve the problem and help to better understand the operation of the whole system. We have another paper in preparation about the numerical flow simulations of the present system to study this boundary and also the effects of the hydrostratigraphic build-up.
In conclusion, the first groundwater flow controlled biogenic gas migration and accumulation model of Hungary provides a new hydrogeological approach for biogenic gas exploration whilst the methodology can be adapted to any terrestrial basin.

Author Contributions

Conceptualization, B.C., B.M. and J.M.-S.; data curation, B.C. and Z.S.; funding acquisition, J.M.-S.; investigation, B.C., Z.S. and J.M.-S.; methodology, B.C.; resources, B.M.; visualization, B.C. and Z.S.; writing—original draft, B.C. and J.M.-S.; writing—review and editing, B.C. All authors have read and agreed to the published version of the manuscript.

Funding

This research was funded by a Research and Development Project of the Eötvös Loránd University (ELTE) and Vermilion Energy Hungary Plc. The research was also supported by the ENeRAG project which received funding from the European Union’s Horizon 2020 research and innovation programme under Grant Agreement No. 810980; and by the National Multidisciplinary Laboratory for Climate Change, RRF-2.3.1-21-2022-00014 project.

Data Availability Statement

Data were obtained from Vermilion Energy Hungary Plc. and from the Supervisory Authority for Regulated Activities of Hungary, and are available with their permission.

Acknowledgments

We thank for the thorough reviews and constructive comments of three anonymous Reviewers improving the quality of the original manuscript.

Conflicts of Interest

The authors declare no conflict of interest.

References

  1. Katz, B.J. Microbial Processes and Natural Gas Accumulations. Open Geol. J. 2011, 5, 75–83. [Google Scholar] [CrossRef]
  2. Liu, Y.; Whitman, W.B. Metabolic, phylogenetic, and ecological diversity of the methanogenic Archaea. Ann. N. Y. Acad. Sci. 2008, 1125, 171–189. [Google Scholar] [CrossRef]
  3. Schneider, F.; Dubille, M.; Montadert, L. Modeling of microbial gas generation: Application to the eastern Mediterranean “Biogenic Play”. Geol. Acta 2016, 14, 403–417. [Google Scholar] [CrossRef]
  4. Clayton, C. Source volumetrics of biogenic gas generation. In Bacterial Gas; Vially, R., Ed.; Editions Technip: Paris, France, 1992; pp. 191–204. [Google Scholar]
  5. Belyaev, S.S.; Wolkin, R.; Kenealy, W.R.; Deniro, M.J.; Epstein, S.; Zeikus, J.G. Methanogenic Bacteria from the Bondyuzhskoe Oil Field: General Characterization and Analysis of Stable-Carbon Isotopic Fractionation. Appl. Environ. Microbiol. 1983, 45, 691–697. [Google Scholar] [CrossRef] [PubMed]
  6. Rice, D. Controls, habitat and resource potential of ancient bacterial gas. In Bacterial Gas; Vially, R., Ed.; Editions Technip: Paris, France, 1992; pp. 91–118. [Google Scholar]
  7. Brown, A.A. Migration controls on the occurrence of economic bacterial gas accumulations. In Applications of Emerging Technologies: Unconventional Methods in Exploration for Petroleum and Natural Gas V; Institute for the Study of Earth and Man, Southern Methodist University: Dallas, TX, USA, 1997; pp. 84–106. [Google Scholar]
  8. Perez-Drago, G.; Dubille, M.; Montadert, L.; Brivio, L.; Hosni, M.; Di Biase, D.; Zaky, A. Biogenic and Thermogenic Hydrocarbon Potential of the South Levant Basin and Eastern Nile Delta, Offshore Egypt. In Proceedings of the 81st EAGE Conference and Exhibition 2019, London, UK, 3–6 June 2019; pp. 1–5. [Google Scholar] [CrossRef]
  9. Pérez-Drago, G.; Mouchot, N.; Dubille, M.; Montadert, L.; Di Biase, D.; Lacone, P.; Mazzarelli, M.; Hosni, M.; Thebault, A. The Importance of Multi-Scale Petroleum System Assessment for Plays and Prospects De-Risking in the Eastern Mediterranean Basin; Search and Discovery Article #11332; American Association of Petroleum Geologists: Tulsa, OK, USA, 2020; p. 19. [Google Scholar] [CrossRef]
  10. Bartha, A.; Balázs, A.; Szalay, Á. On the tectono-stratigraphic evolution and hydrocarbon systems of extensional back-arc basins: Inferences from 2D basin modelling from the Pannonian basin. Acta Geod. Geophys. 2018, 53, 369–394. [Google Scholar] [CrossRef]
  11. Schout, G.; Hartog, N.; Hassanizadeh, S.M.; Helmig, R.; Griffioen, J. Impact of groundwater flow on methane gas migration and retention in unconsolidated aquifers. J. Contam. Hydrol. 2020, 230, 103619. [Google Scholar] [CrossRef] [PubMed]
  12. Hubbert, M.K. Entrapment of Petroleum Under Hydrodynamic Conditions. Am. Assoc. Pet. Geol. Bull. 1956, 37, 1954–2026. [Google Scholar] [CrossRef]
  13. Tóth, J. Ground water and hydrocarbon migration. In The Geology of North America Vol. O-2, Hydrogeology; Geological Society of America: Boulder, CO, USA, 1988; pp. 485–502. [Google Scholar] [CrossRef]
  14. Anna, L.O. Effects of Groundwater Flow on the Distribution of Biogenic Gas in Parts of the Northern Great Plains of Canada and United States; Scientific Investigations Report 2010-5251; U.S. Geological Survey: Reston, VA, USA, 2011; 31p. [Google Scholar] [CrossRef]
  15. Cramer, B.; Poelchau, H.S.; Gerling, P.; Lopatin, N.V.; Littke, R. Methane released from groundwater: The source of natural gas accumulations in northern West Siberia. Mar. Pet. Geol. 1999, 16, 225–244. [Google Scholar] [CrossRef]
  16. Dang, Y.; Zhao, W.; Su, A.; Zhang, S.; Li, M.; Guan, Z.; Ma, D.; Chen, X.; Shuai, Y.; Wang, H.; et al. Biogenic gas systems in eastern Qaidam Basin. Mar. Pet. Geol. 2008, 25, 344–356. [Google Scholar] [CrossRef]
  17. Tóth, J. Cross-Formational Gravity-Flow of Groundwater: A Mechanism of the Transport and Accumulation of Petroleum (The Generalized Hydraulic Theory of Petroleum Migration). In Problems of Petroleum Migration, Studies in Geology No 10; Roberts, W.H.I., Cordell, R.J., Eds.; American Association of Petroleum Geologists: Tulsa, OK, USA, 1980; pp. 121–167. [Google Scholar]
  18. Jiang, X.-W.; Wang, X.-S.; Wan, L.; Ge, S. An analytical study on stagnation points in nested flow systems in basins with depth-decaying hydraulic conductivity. Water Resour. Res. 2011, 47, 1–16. [Google Scholar] [CrossRef]
  19. Jiang, X.-W.; Wan, L.; Ge, S.; Cao, G.-L.; Hou, G.-C.; Hu, F.-S.; Wang, X.-S.; Li, H.; Liang, S.-H. A quantitative study on accumulation of age mass around stagnation points in nested flow systems. Water Resour. Res. 2012, 48, 1–14. [Google Scholar] [CrossRef]
  20. Wells, P.R.A. Hydrodynamic Trapping in the Cretaceous Nahr Umr Lower Sand of the North Area, Offshore Qatar. J. Pet. Technol. 1988, 40, 357–361. [Google Scholar] [CrossRef]
  21. Czauner, B.; Mádl-Szőnyi, J. Regional hydraulic behavior of structural zones and sedimentological heterogeneities in an overpressured sedimentary basin. Mar. Pet. Geol. 2013, 48, 260–274. [Google Scholar] [CrossRef]
  22. Czauner, B.; Szkolnikovics-Simon, S.; Mádl-Szőnyi, J. The influence of deep groundwater flow systems on the Earth’s critical zone. In Proceedings of the EGU General Assembly, Vienna, Austria, 23–28 April 2023. EGU23-12709. [Google Scholar] [CrossRef]
  23. Czauner, B.; Szkolnikovics-Simon, S.; Mádl-Szőnyi, J. How to Extend in Depth the Earth’s Critical Zone Considering Groundwater Flow Systems? Eötvös Loránd University: Budapest, Hungary, 2023; submitted. [Google Scholar]
  24. Tóth, J. Hydraulic Continuity In Large Sedimentary Basins. Hydrogeol. J. 1995, 3, 4–16. [Google Scholar] [CrossRef]
  25. Mádl-Szőnyi, J.; Batelaan, O.; Molson, J.; Verweij, H.; Jiang, X.W.; Carrillo-Rivera, J.J.; Tóth, Á. Regional groundwater flow and the future of hydrogeology: Evolving concepts and communication. Hydrogeol. J. 2023, 31, 23–26. [Google Scholar] [CrossRef]
  26. Tóth, J.; Almási, I. Interpretation of observed fluid potential patterns in a deep sedimentary basin under tectonic compression: Hungarian Great Plain, Pannonian Basin. Geofluids 2001, 1, 11–36. [Google Scholar] [CrossRef]
  27. Tóth, J. Gravitational Systems of Groundwater Flow—Theory, Evaluation, Utilization; University Press: Cambridge, UK, 2009; 310p. [Google Scholar]
  28. Erhardt, I.; Ötvös, V.; Erőss, A.; Czauner, B.; Simon, S.; Mádl-Szőnyi, J. Hydraulic evaluation of the hypogenic karst area in Budapest (Hungary). Hydrogeol. J. 2017, 25, 1871–1891. [Google Scholar] [CrossRef]
  29. Mádl-Szőnyi, J.; Czauner, B.; Iván, V.; Tóth, Á.; Simon, S.; Erőss, A.; Bodor, P.; Havril, T.; Boncz, L.; Sőreg, V. Confined carbonates—Regional scale hydraulic interaction or isolation? Mar. Pet. Geol. 2019, 107, 591–612. [Google Scholar] [CrossRef]
  30. Czauner, B.; Molnár, F.; Masetti, M.; Arola, T.; Mádl-Szőnyi, J. Groundwater Flow System-Based Dynamic System Approach for Geofluids and Their Resources. Water 2022, 14, 1015. [Google Scholar] [CrossRef]
  31. Swarbrick, R.E.; Osborne, M.J. Mechanisms that Generate Abnormal Pressures: An Overview. In Abnormal Pressures in Hydrocarbon Environments, AAPG Memoir 70; Law, B.E., Ulmishek, G.F., Eds.; AAPG: Tulsa, OK, USA, 1998. [Google Scholar] [CrossRef]
  32. Burke, L.; Kinney, S.; Dubiel, R.; Pitman, J. Distribution of Regional Pressure in the Onshore and Offshore Gulf of Mexico Basin, USA; U.S. Geological Survey (USGS): Reston, VA, USA, 2012; 5p. [Google Scholar]
  33. Latimer, A.; Hill, M.; Hendrick, J. Pore Pressure Anomalies in the Horn River Basin, Northeastern BC. In Proceedings of the Geoconvention, Geoconvention 2017, Calgary, AB, Canada, 15–19 May 2017; p. 5. [Google Scholar]
  34. Li, C.; Luo, X.; Zhang, L.; Wang, B.; Guan, X.; Luo, H.; Lei, Y. Overpressure generation mechanisms and its distribution in the Paleocene Shahejie Formation in the Linnan Sag, Huimin Depression, Eastern China. Energies 2019, 12, 3183. [Google Scholar] [CrossRef]
  35. Wang, M.; Li, B.; Wei, G.; Li, J. Quaternary hydrogeology condition and reservoiring of biogenic gas in Eastern Qaidam Basin. Oil Gas Geol. 2003, 24, 341–345. [Google Scholar] [CrossRef]
  36. Molofsky, L.J.; Connor, J.A.; McHugh, T.E.; Richardson, S.D.; Woroszylo, C.; Alvarez, P.J. Environmental Factors Associated With Natural Methane Occurrence in the Appalachian Basin. Ground Water 2016, 54, 656–668. [Google Scholar] [CrossRef]
  37. Wen, T.; Niu, X.; Gonzales, M.; Zheng, G.; Li, Z.; Brantley, S.L. Big Groundwater Data Sets Reveal Possible Rare Contamination Amid Otherwise Improved Water Quality for Some Analytes in a Region of Marcellus Shale Development. Environ. Sci. Technol. 2018, 52, 7149–7159. [Google Scholar] [CrossRef] [PubMed]
  38. Kovács, Z. A hazai szénhidrogénvagyon (Hydrocarbon resources of Hungary). In Szénhidrogének Magyarországon (Hydrocarbons in Hungary); Kovács, Z., Ed.; Magyar Energetikai és Közmű-Szabályozási Hivatal: Budapest, Hungary, 2018; pp. 223–236. [Google Scholar]
  39. Bada, G.; Horváth, F.; Dövényi, P.; Szafián, P.; Windhoffer, G.; Cloetingh, S. Present-day stress field and tectonic inversion in the Pannonian basin. Glob. Planet. Chang. 2007, 58, 165–180. [Google Scholar] [CrossRef]
  40. Haas, J.; Budai, T.; Csontos, L.; Fodor, L.; Konrád, G. Pre-Cenozoic Geological Map of Hungary 1:500,000; Geological Institute of Hungary: Budapest, Hungary, 2010. [Google Scholar]
  41. Juhász, G.; Pogácsás, G.; Magyar, I.; Vakarcs, G. Tectonic versus climatic control on the evolution of fluvio-deltaic systems in a lake basin, Eastern Pannonian Basin. Sediment. Geol. 2007, 202, 72–95. [Google Scholar] [CrossRef]
  42. Sztanó, O.; Szafián, P.; Magyar, I.; Horányi, A.; Bada, G.; Hughes, D.W.; Hoyer, D.L.; Wallis, R.J. Aggradation and progradation controlled clinothems and deep-water sand delivery model in the Neogene Lake Pannon, Makó Trough, Pannonian Basin, SE Hungary. Glob. Planet. Chang. 2013, 103, 149–167. [Google Scholar] [CrossRef]
  43. Balázs, A.; Matenco, L.; Magyar, I.; Horváth, F.; Cloetingh, S. The link between tectonics and sedimentation in back-arc basins: New genetic constraints from the analysis of the Pannonian Basin. Tectonics 2016, 35, 1526–1559. [Google Scholar] [CrossRef]
  44. Mádl-Szőnyi, J.; Tóth, J. A hydrogeological type section for the Duna-Tisza Interfluve, Hungary. Hydrogeol. J. 2009, 17, 961–980. [Google Scholar] [CrossRef]
  45. Czauner, B.; Mádl-Szőnyi, J. The function of faults in hydraulic hydrocarbon entrapment: Theoretical considerations and a field study from the Trans-Tisza region, Hungary. Am. Assoc. Pet. Geol. Bull. 2011, 95, 795–811. [Google Scholar] [CrossRef]
  46. Mádl-Szőnyi, J.; Simon, S. Involvement of preliminary regional fluid pressure evaluation into the reconnaissance geothermal exploration-Example of an overpressured and gravity-driven basin. Geothermics 2016, 60, 156–174. [Google Scholar] [CrossRef]
  47. Haitjema, H.M.; Mitchell-Bruker, S. Are Water Tables a Subdued Replica of the Topography? Ground Water 2005, 43, 781–786. [Google Scholar] [CrossRef]
  48. Hubbert, M.K. The Theory of Ground-Water Motion. J. Geol. 1940, 48, 785–944. [Google Scholar] [CrossRef]
  49. Nagy, Z.; Baracza, M.K.; Szabó, N.P. Magnitude estimation of overpressure generation mechanisms using quantitative stochastic 2d basin models: A case study from the Danube-Tisza Interfluve area in Hungary. Appl. Sci. 2021, 11, 2841. [Google Scholar] [CrossRef]
  50. Vető, I. The Mixed Gas Belt, eastern Hungary—A geochemical puzzle. In Proceedings of the AAPG European Regional Conference, Budapest, Hungary, 3–4 May 2022; p. 38. [Google Scholar]
  51. Koroknai, B.; Wórum, G.; Tóth, T.; Koroknai, Z.; Fekete-Németh, V.; Kovács, G. Geological deformations in the Pannonian Basin during the neotectonic phase: New insights from the latest regional mapping in Hungary. Earth-Sci. Rev. 2020, 211, 103411. [Google Scholar] [CrossRef]
  52. Almási, I. Petroleum Hydrogeology of the Great Hungarian Plain, Eastern Pannonian Basin, Hungary. Ph.D. Thesis, University of Alberta, Edmonton, AB, Canada, 2001. [Google Scholar] [CrossRef]
  53. Underschultz, J.R.; Otto, C.J.; Bartlett, R. Formation fluids in faulted aquifers: Examples from the foothills of western Canada and the North West Shelf of Australia. In Evaluating Fault and Cap Rock Seals: AAPG Hedberg Series 2; Boult, P., Kaldi, J., Eds.; AAPG: Tulsa, OK, USA, 2005; pp. 247–260. [Google Scholar]
  54. Matthai, S.K.; Roberts, S.G. The Influence of Fault Permeability on Single-Phase Fluid Flow Near Fault-Sand Intersections: Results from Steady-State High-Resolution Models of Pressure-Driven Fluid Flow. Am. Assoc. Pet. Geol. Bull. 1996, 80, 1763–1779. [Google Scholar] [CrossRef]
  55. Aydin, A. Fractures, faults, and hydrocarbon entrapment, migration and flow. Mar. Pet. Geol. 2000, 17, 797–814. [Google Scholar] [CrossRef]
  56. Bredehoeft, J.D.; Hanshaw, B.B. On the maintenance of anomalous fluid pressures: I. Thick sedimentary sequences. GSA Bull. 1968, 79, 1097–1106. [Google Scholar] [CrossRef]
  57. Ingebritsen, S.E.; Sanford, W.E.; Neuzil, C.E. Groundwater in Geologic Processes; Cambridge University Press: Cambridge, UK, 2006. [Google Scholar]
  58. Tóth, J. A theory of groundwater motion in small drainage basins in central Alberta, Canada. J. Geophys. Res. 1962, 67, 4375–4388. [Google Scholar] [CrossRef]
  59. Tóth, J. A theoretical analysis of groundwater flow in small drainage basins. J. Geophys. Res. 1963, 68, 4795–4812. [Google Scholar] [CrossRef]
  60. Birchall, T.; Senger, K.; Swarbrick, R. Naturally occurring underpressure—A global review. Pet. Geosci. 2022, 28, petgeo2021-051. [Google Scholar] [CrossRef]
  61. Zhao, J.; Li, J.; Xu, Z. Advances in the origin of overpressures in sedimentary basins. Pet. Res. 2018, 3, 973. [Google Scholar] [CrossRef]
  62. Dahlberg, E.C. Applied Hydrodynamics in Petroleum Exploration; Springer: New York, NY, USA, 1995. [Google Scholar] [CrossRef]
  63. Csondor, K.; Czauner, B.; Csobaji, L.; Győri, O.; Erőss, A. Characterization of the regional groundwater flow systems in south Transdanubia (Hungary) to understand karst evolution and development of hydrocarbon and geothermal resources. Hydrogeol. J. 2020, 28, 2803–2820. [Google Scholar] [CrossRef]
  64. Hungarian Central Statistical Office. Public Water Abstraction. Available online: https://statinfo.ksh.hu/Statinfo/haViewer.jsp?lang=en (accessed on 15 July 2023).
  65. Adonya, R.A.; Czauner, B.; Márton, B. Biogenic Gas Generation and Migration in the Pannonian Basin. In Proceedings of the AAPG European Regional Conference, Budapest, Hungary, 3–4 May 2022; p. 36. [Google Scholar]
  66. Vető, I. Az alföldi lignitek/barnaszenek biogén metán potenciálja—Rock-Eval adatokon alapuló becslés (Biogenic methane potential of lignites/sub-bituminous coals of the Hungarian Great Plain—An assessment based on Rock-Eval data). Földtani Közlöny 2021, 151, 211–220. [Google Scholar] [CrossRef]
  67. Lenkey, L.; Mihályka, J.; Paróczi, P. Review of geothermal conditions of Hungary. Földtani Közlöny 2021, 151, 65–78. [Google Scholar] [CrossRef]
  68. Garven, G. Continental-Scale Groundwater Flow and Geologic Processes. Annu. Rev. Earth Planet. Sci. 1995, 23, 89–117. [Google Scholar] [CrossRef]
  69. Law, B.E.; Ulmishek, G.F.; Slavin, V.I. Abnormal Pressures in Hydrocarbon Environments; AAPG Memoir 70; American Association of Petroleum Geologists: Tulsa, OK, USA, 1998. [Google Scholar] [CrossRef]
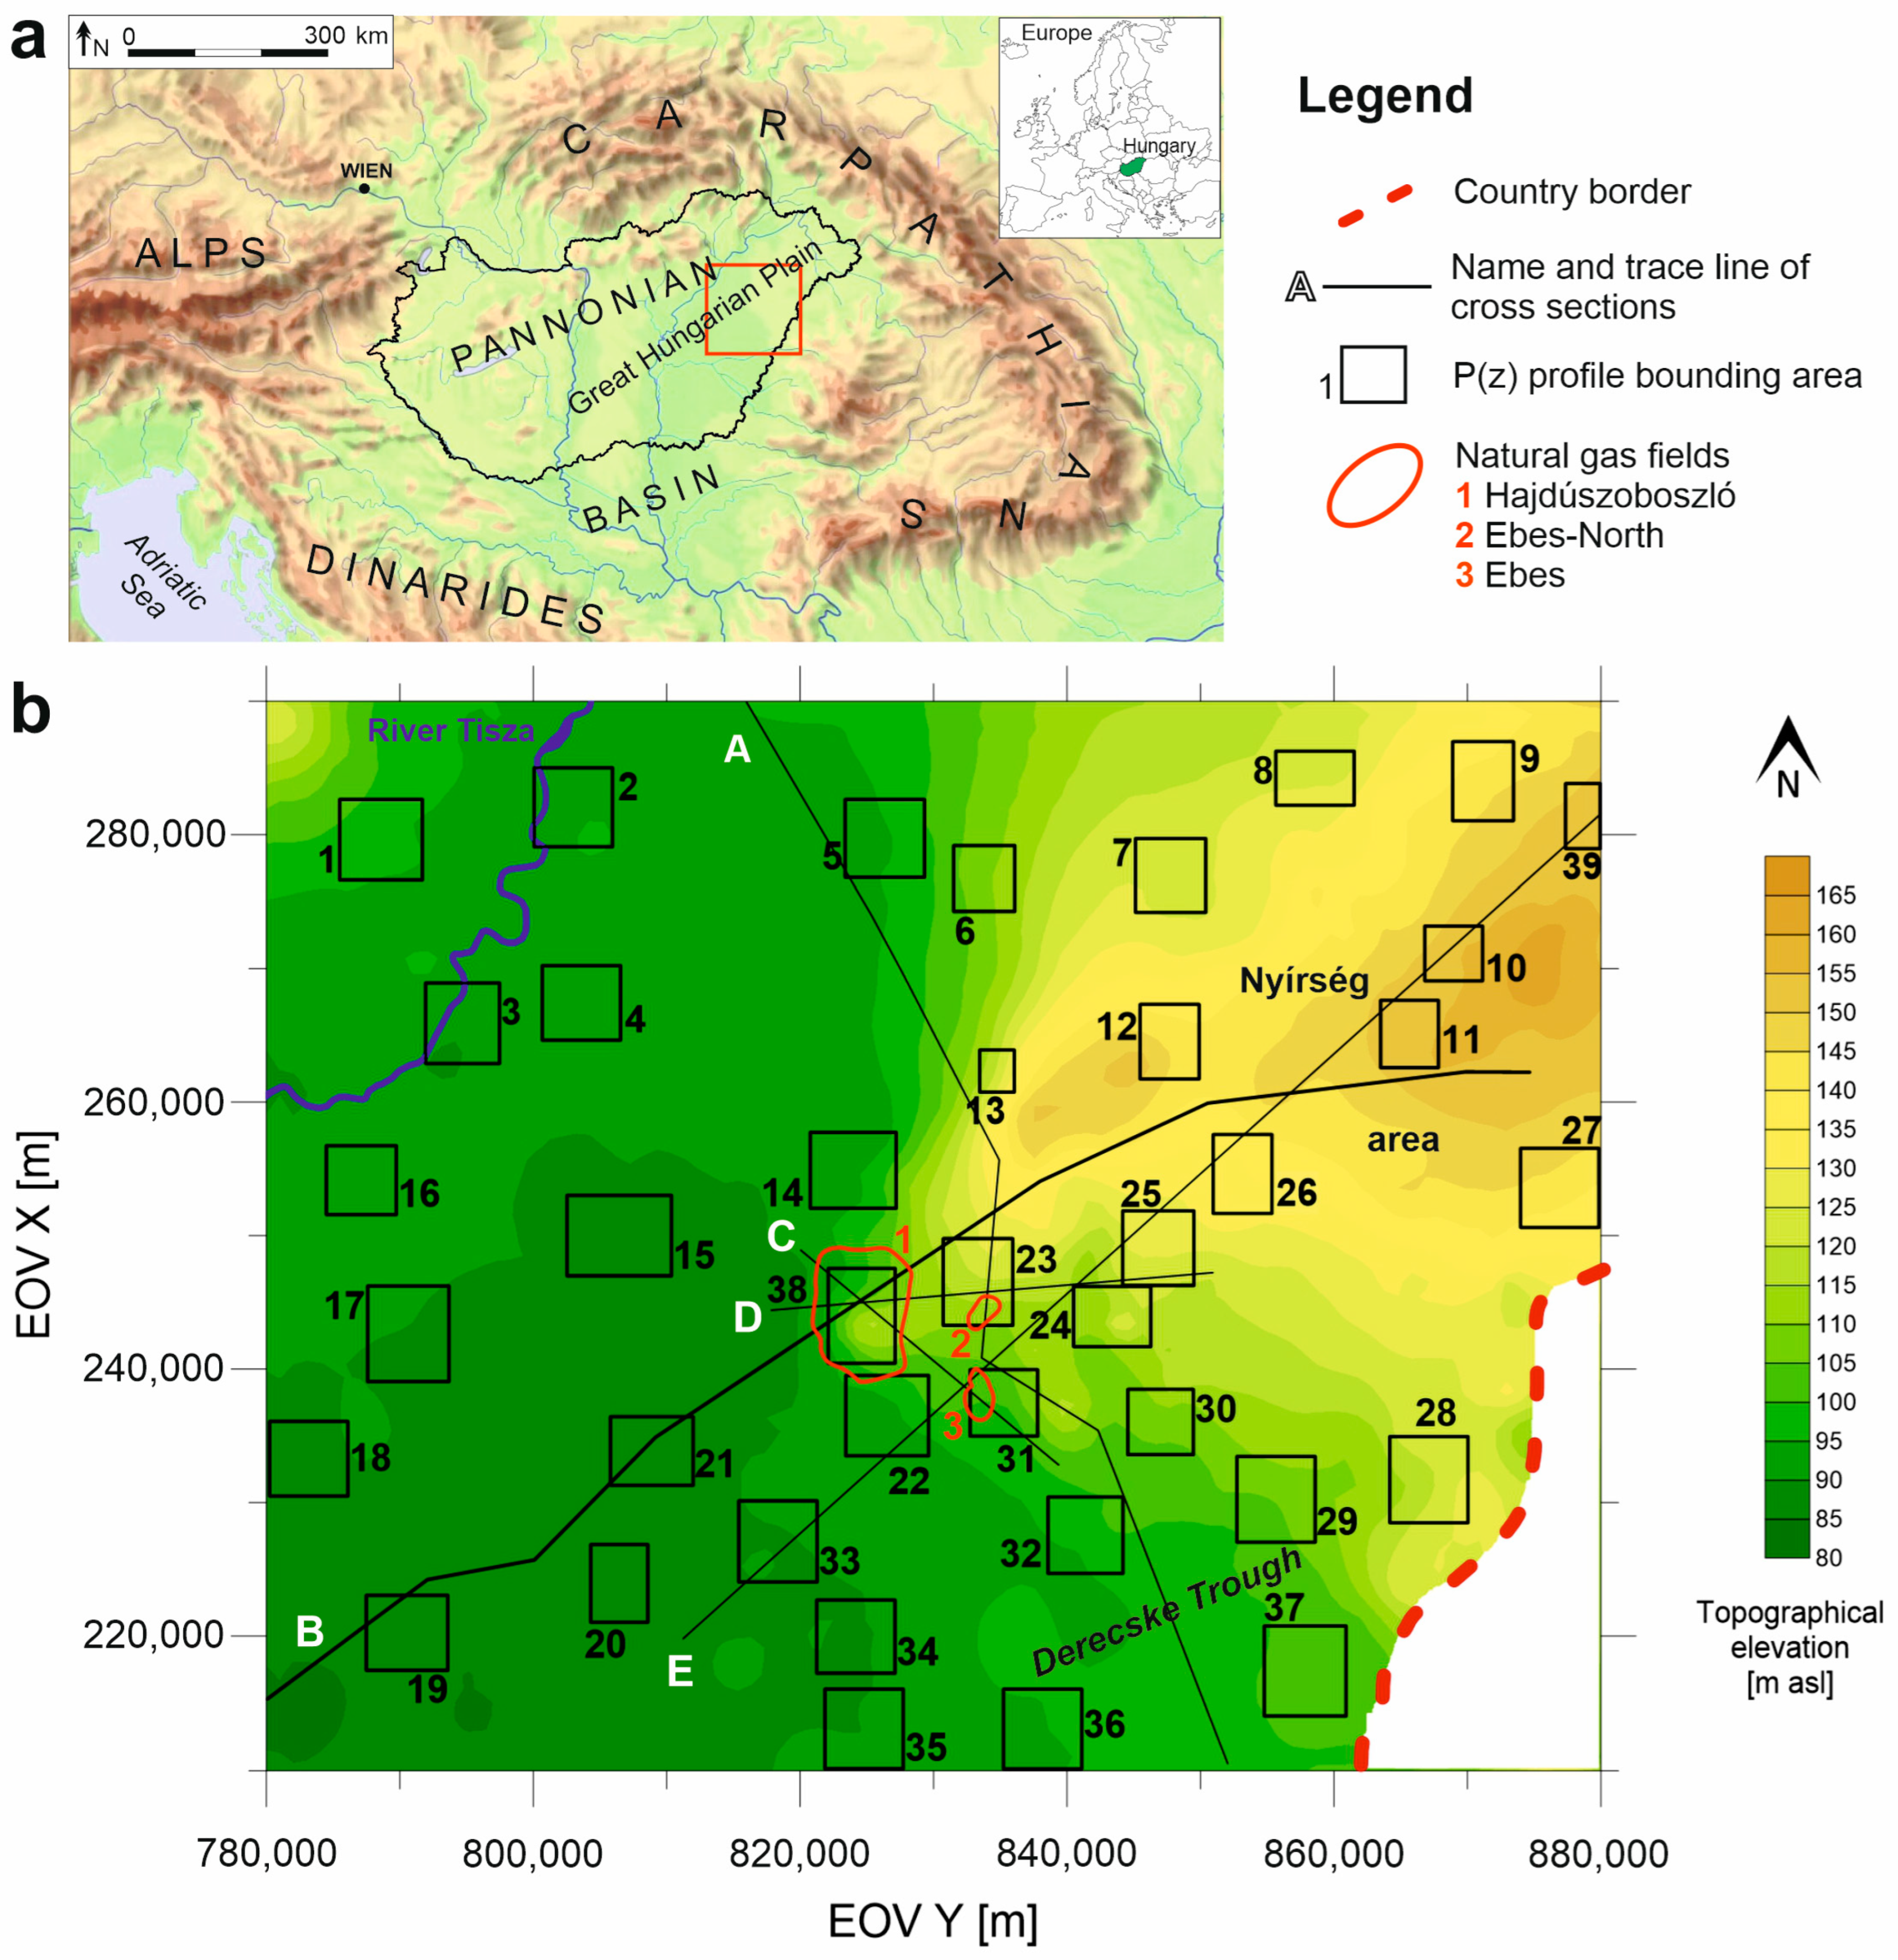
Figure 1. (a) Regional setting of the Pannonian Basin and Hungary. (b) Location of the study area, p(z) profile bounding areas (1–39), and hydraulic cross sections (A–E). Derecske Trough is a buried geological sub-basin.
Water 15 03272 g001
Figure 2. Theoretical pressure vs. elevation profile represents the boundaries of normally (“close to hydrostatic”), over- and underpressured regimes by γhyd(max) and γhyd(min) lines; as well as the potential occurrence of hydrostatic (γhyd), superhydrostatic (γsup), and subhydrostatic (γsub) vertical pressure gradients within all types of pressure regimes. An aquitard could be underpressured due to, for instance, erosional unloading [60], and overpressured due to, for instance, the maturation of kerogen (i.e., being a source rock) [61].
Water 15 03272 g002
Figure 3. Bulk pressure vs. elevation (p(z)) profile representing the boundary of the normal and overpressured regimes.
Water 15 03272 g003
Figure 4. Local pressure vs. elevation [p(z)] profiles (a) #19, (b) #38, (c) #11, (d) #28. Hydrostratigraphic units: Great Plain Aquifer (GPAF), Algyő Aquitard (AT), Szolnok Aquifer (AF), Endrőd Aquitard (AT), Pre-Pannonian Aquifer (Pre-Pan AF), Pre-Neogene Aquifer (Pre-Ng).
Water 15 03272 g004
Figure 5. Tomographic fluid potential maps for the elevation intervals of (a) z1 = 135–0 m asl, and (b) z2 = 0–(−500) m asl. Classifications of the local p(z) profile bounding areas as recharge, midline, or discharge areas above z = (−500) m asl are also displayed in (a).
Water 15 03272 g005
Figure 6. Tomographic fluid potential maps for the elevation intervals of (a) z3 = (−500)–(−1000) m asl, and (b) z4 = (−1000)–(−1500) m asl.
Water 15 03272 g006
Figure 7. Tomographic fluid potential maps for the elevation intervals of (a) z5 = (−1500)–(−2000) m asl, (b) z6 = (−2000)–(−3000) m asl, and (c) z7 = (−3000)–(−4000) m asl. (Locations of the gas fields are given only for information, in fact these are in shallower depths.)
Water 15 03272 g007
Figure 8. Hydraulic cross section B with the interpreted groundwater flow system configuration.
Water 15 03272 g008
Figure 9. Groundwater flow controlled migration and accumulation model of dissolved biogenic (and thermogenic) gases in the study area based on the interpretation of the hydraulic cross section (Figure 8).
Water 15 03272 g009
Table 1. Observed or dynamic vertical pressure gradient (γ) values (MPa/km) of measured hydraulic data interpreted in the local p(z) profiles for the elevation intervals of z > (−500) m asl, z = (−500)–(−1500) m asl, z < (−1500) m asl. ↓: downward flow conditions (γ < 9.71 Mpa/km); ↔: lateral flow conditions (9.71 < γ < 9.91 Mpa/km), ↑: upward flow conditions (γ > 9.91 Mpa/km).
p(z) #Elevation Interval
z > (−500) m Aslz = (−500)–(−1500) m Aslz < (−1500) m Asl
19.94 ↑10.01 ↑
29.91 ↑9.99 ↑
39.90 ↑9.98 ↑
49.77 ↔
59.74 ↔10.10 ↑
610.20 ↑
79.82 ↔
810.06 ↑
98.98 ↓9.47 ↓
108.66 ↓
118.32 ↓
129.07 ↓
139.33 ↓
1410.25 ↑
159.93 ↑10.00 ↑
169.81 ↔
179.94 ↑
189.96 ↑12.04 ↑
199.92 ↑10.26 ↑
209.95 ↑
219.80 ↔10.18 ↑
2210.12 ↑
239.62 ↓
248.98 ↓11.46 ↑
258.87 ↓9.21 ↓
268.44 ↓
279.48 ↓
289.72 ↔11.50 ↑67.06 ↑
299.55 ↓ 14.84–32.32 ↑
308.89 ↓
319.88 ↔
329.65 ↓
339.99 ↑
3410.07 ↑
3510.03 ↑ 17.99 ↑
369.91 ↑10.16 ↑
3710.15 ↑10.32 ↑19.73 ↑
3810.33 ↑12.69 ↑
398.54 ↓9.67 ↓
Disclaimer/Publisher’s Note: The statements, opinions and data contained in all publications are solely those of the individual author(s) and contributor(s) and not of MDPI and/or the editor(s). MDPI and/or the editor(s) disclaim responsibility for any injury to people or property resulting from any ideas, methods, instructions or products referred to in the content.