Article

Tillage Practices Affected Yield and Water Use Efficiency of Maize (Zea mays L., Longdan No.8) by Regulating Soil Moisture and Temperature in Semi-Arid Environment

1
College of Agriculture and Forestry, Longdong University, Qingyang 745000, China
2
Collaborative Innovation Center for Longdong Dryland Crop Germplasm Improvement and Industrialization, Longdong University, Qingyang 745000, China
3
Gansu Dryland Research Center of Winter Wheat Germplasm Innovation and Application Engineering, Longdong University, Qingyang 745000, China
4
Gansu Collaborative Innovation of Academicians and Experts on Dryland Agriculture in the Loess Plateau, Longdong University, Qingyang 745000, China
5
Qingyang Agricultural Technology Extension Center, Qingyang 745000, China
6
College of Agriculture and Biology, Zhongkai University of Agriculture and Engineering, Guangzhou 510225, China
*
Author to whom correspondence should be addressed.
Water 2023, 15(18), 3243; https://doi.org/10.3390/w15183243
Submission received: 15 August 2023 / Revised: 5 September 2023 / Accepted: 10 September 2023 / Published: 12 September 2023

Abstract

:
Tillage practices can regulate soil environmental factors and, thus, affect crop yield. Farmers’ acceptance of this is not high because of a lack of awareness, and, in the dryland farming region of the Longdong Loess Plateau in China, the lack of acceptance is due to the established use of the no-till operation. It is urgent to explore suitable tillage practices for maize (Zea mays L., Longdan No.8) planting in this area. The impact of tillage practices on the soil water content, soil temperature, field water consumption structure, yield, and water use efficiency (WUE) of maize was determined. Six tillage practices were implemented in 2021 and their effects were determined in 2021 and 2022, including conventional tillage with no straw (T), conventional tillage with straw incorporated (TS), subsoiling tillage with no straw (SST), subsoiling tillage with straw incorporated (SSTS), no-tillage with no straw (NT) and no-tillage with straw mulching (NTS). Over two years, compared to T, the soil volumetric water content (SWv) with SSTS was significantly increased in the 5–10 cm soil layer at the V12 (big flare stage of maize) stage in 2022. SSTS significantly reduced soil temperature (ST) in the 20 and 25 cm soil depths at the V12 stage, and in every soil layer of the R2 (grain-filling stage of maize) stage. SSTS significantly reduced soil evaporation during the growing season (Ec), and significantly increased crop transpiration (Tc) when compared to T. Compared with T, SST and SSTS significantly increased biomass yield (BY), by 29.7–32.1 and 41.2–53.5%, respectively, increased grain number per ear by 6.3–16.5 and 10.4–38.8%, respectively, improved grain yield (GY) by 4.9–6.9 and 6.2–13.7%, respectively; SSTS significantly increased WUE by 5.5–15.4%. The correlation between soil volumetric water content at the V12 stage and grain yield was highly significant; the ST at the R2 stage had a significant positive correlation with grain number per ear, GY, and BY. Therefore, subsoiling tillage with straw incorporated increased the soil moisture content and reduced the soil temperature, optimized the water consumption structure, and improved the effective utilization of soil water, resulting in the accumulation of a higher biomass yield, and increased the number of ears, obtaining a higher yield, and improved water use efficiency. Therefore, subsoiling tillage with straw incorporated is a suitable tillage practice in the dry farming area of Longdong Loess Plateau, China.

1. Introduction

Maize (Zea mays L.) is one of the three major food crops in the world [1]. Total maize production ranks first among all food crops in China [2]. The maize planting area accounts for 53.90% of the total grain planting area in the dry farming area of the Longdong Loess Plateau, China [3]. The distribution of precipitation is uneven; the frequency of drought in summer is the highest, followed by spring [4], and the frequency of extremely high temperatures is increasing in the Longdong Loess Plateau of China [5]. In addition, the maize yield increases with the increase in precipitation, and that increases with the increase in temperature, but yield decreases when the temperature rises beyond a certain range [6,7,8,9]. Therefore, water and temperature have become the main factors limiting the sustainable and stable yield of maize in the area. Suitable environmental conditions are the prerequisite for a high yield of crops, and soil temperature and soil moisture are two key factors [10]. Higher soil temperatures in the early stage of crop growth can promote seedling emergence. In the middle and late stages of crop growth, a too-high soil temperature will affect root activity and lead to premature senescence of leaves [11]. Appropriate soil water content can promote the absorption and utilization of nutrients by crops and increase crop yield [12].
Tillage practice is an important way to regulate soil hydrothermal characteristics [13,14,15,16,17,18,19,20]. The soil temperature of spring maize grown with furrow sowing with straw mulching showed a double effect of “cooling–warming”; that is, the average temperature was 2.90~4.01 °C lower than that of open field sowing, and the minimum temperature was 1.34~4.12 °C higher than that of open field sowing, thus increasing yield and water use efficiency in the semi-humid area of the Loess Plateau, China [14]. Soil water storage in the range of 0∼300 cm with straw mulching increased by 11.8% compared with non-mulching, and a straw-mulching treatment significantly increased the aboveground biomass and grain yield of spring maize in the rain-fed agriculture in the south of the Loess Plateau, China [16]. Although no tillage with straw cover decreased soil evaporation—thus improving soil water content, especially in the root zone soil—and lowered the soil frozen depths, it reduced the soil temperatures, which could influence crop growth in semi-arid northeast China [17]. The no-tillage treatment has a higher soil moisture content than conventional tillage, and can also increase soil temperature at different depths, which can significantly increase maize yield in the northeast black soil region [18]. Similar results were found in the middle of the Haihe Plain [19] and the experimental station of Northwest A&F University [20]. In summary, no tillage with straw mulching has certain advantages in regulating soil water and temperature and increasing yield. Meanwhile, compared to conventional tillage, no tillage followed by straw mulching provides the greatest economic benefits in the Longdong Loess Plateau of China [21]. But the acceptance of farmers is not high because of lack of awareness and the established use of the no-till operation in this area [22]. Therefore, we are anxious to find a relatively easy tillage practice for crop production.
Subsoiling tillage with no straw and subsoiling tillage with straw incorporated can improve crop yields in the Sanjiang Plain, the Huanghuaihai Plain, and the Longxi Loess Plateau of China [23,24,25]. Subsoiling tillage with plastic mulching can also increase crop yields in the Longdong Loess Plateau of China [26]. This is most likely because subsoiling can increase soil organic carbon [27] and improve soil structure [28] and precipitation infiltration [26], thereby increasing crop yields. However, research on subsoiling tillage with no straw and subsoiling tillage with straw incorporated in the Longdong Loess Plateau of China has not been reported. There are different types of climates and soil in different regions, and crop yields respond differently to various tillage practices [29]. Thus, subsoiling tillage with no straw and subsoiling tillage with straw incorporated treatments have been added to this experiment. Therefore, in order to explore an easy and suitable tillage practice for sustainable and stable maize yields, the objectives of the present study were to investigate: (1) How do tillage practices affect the soil water content and soil temperature; (2) How do tillage practices affect the field water consumption structure, water use efficiency, yield, yield components; and (3) How the mechanisms of tillage practices affect yield and water use efficiency.

2. Materials and Methods

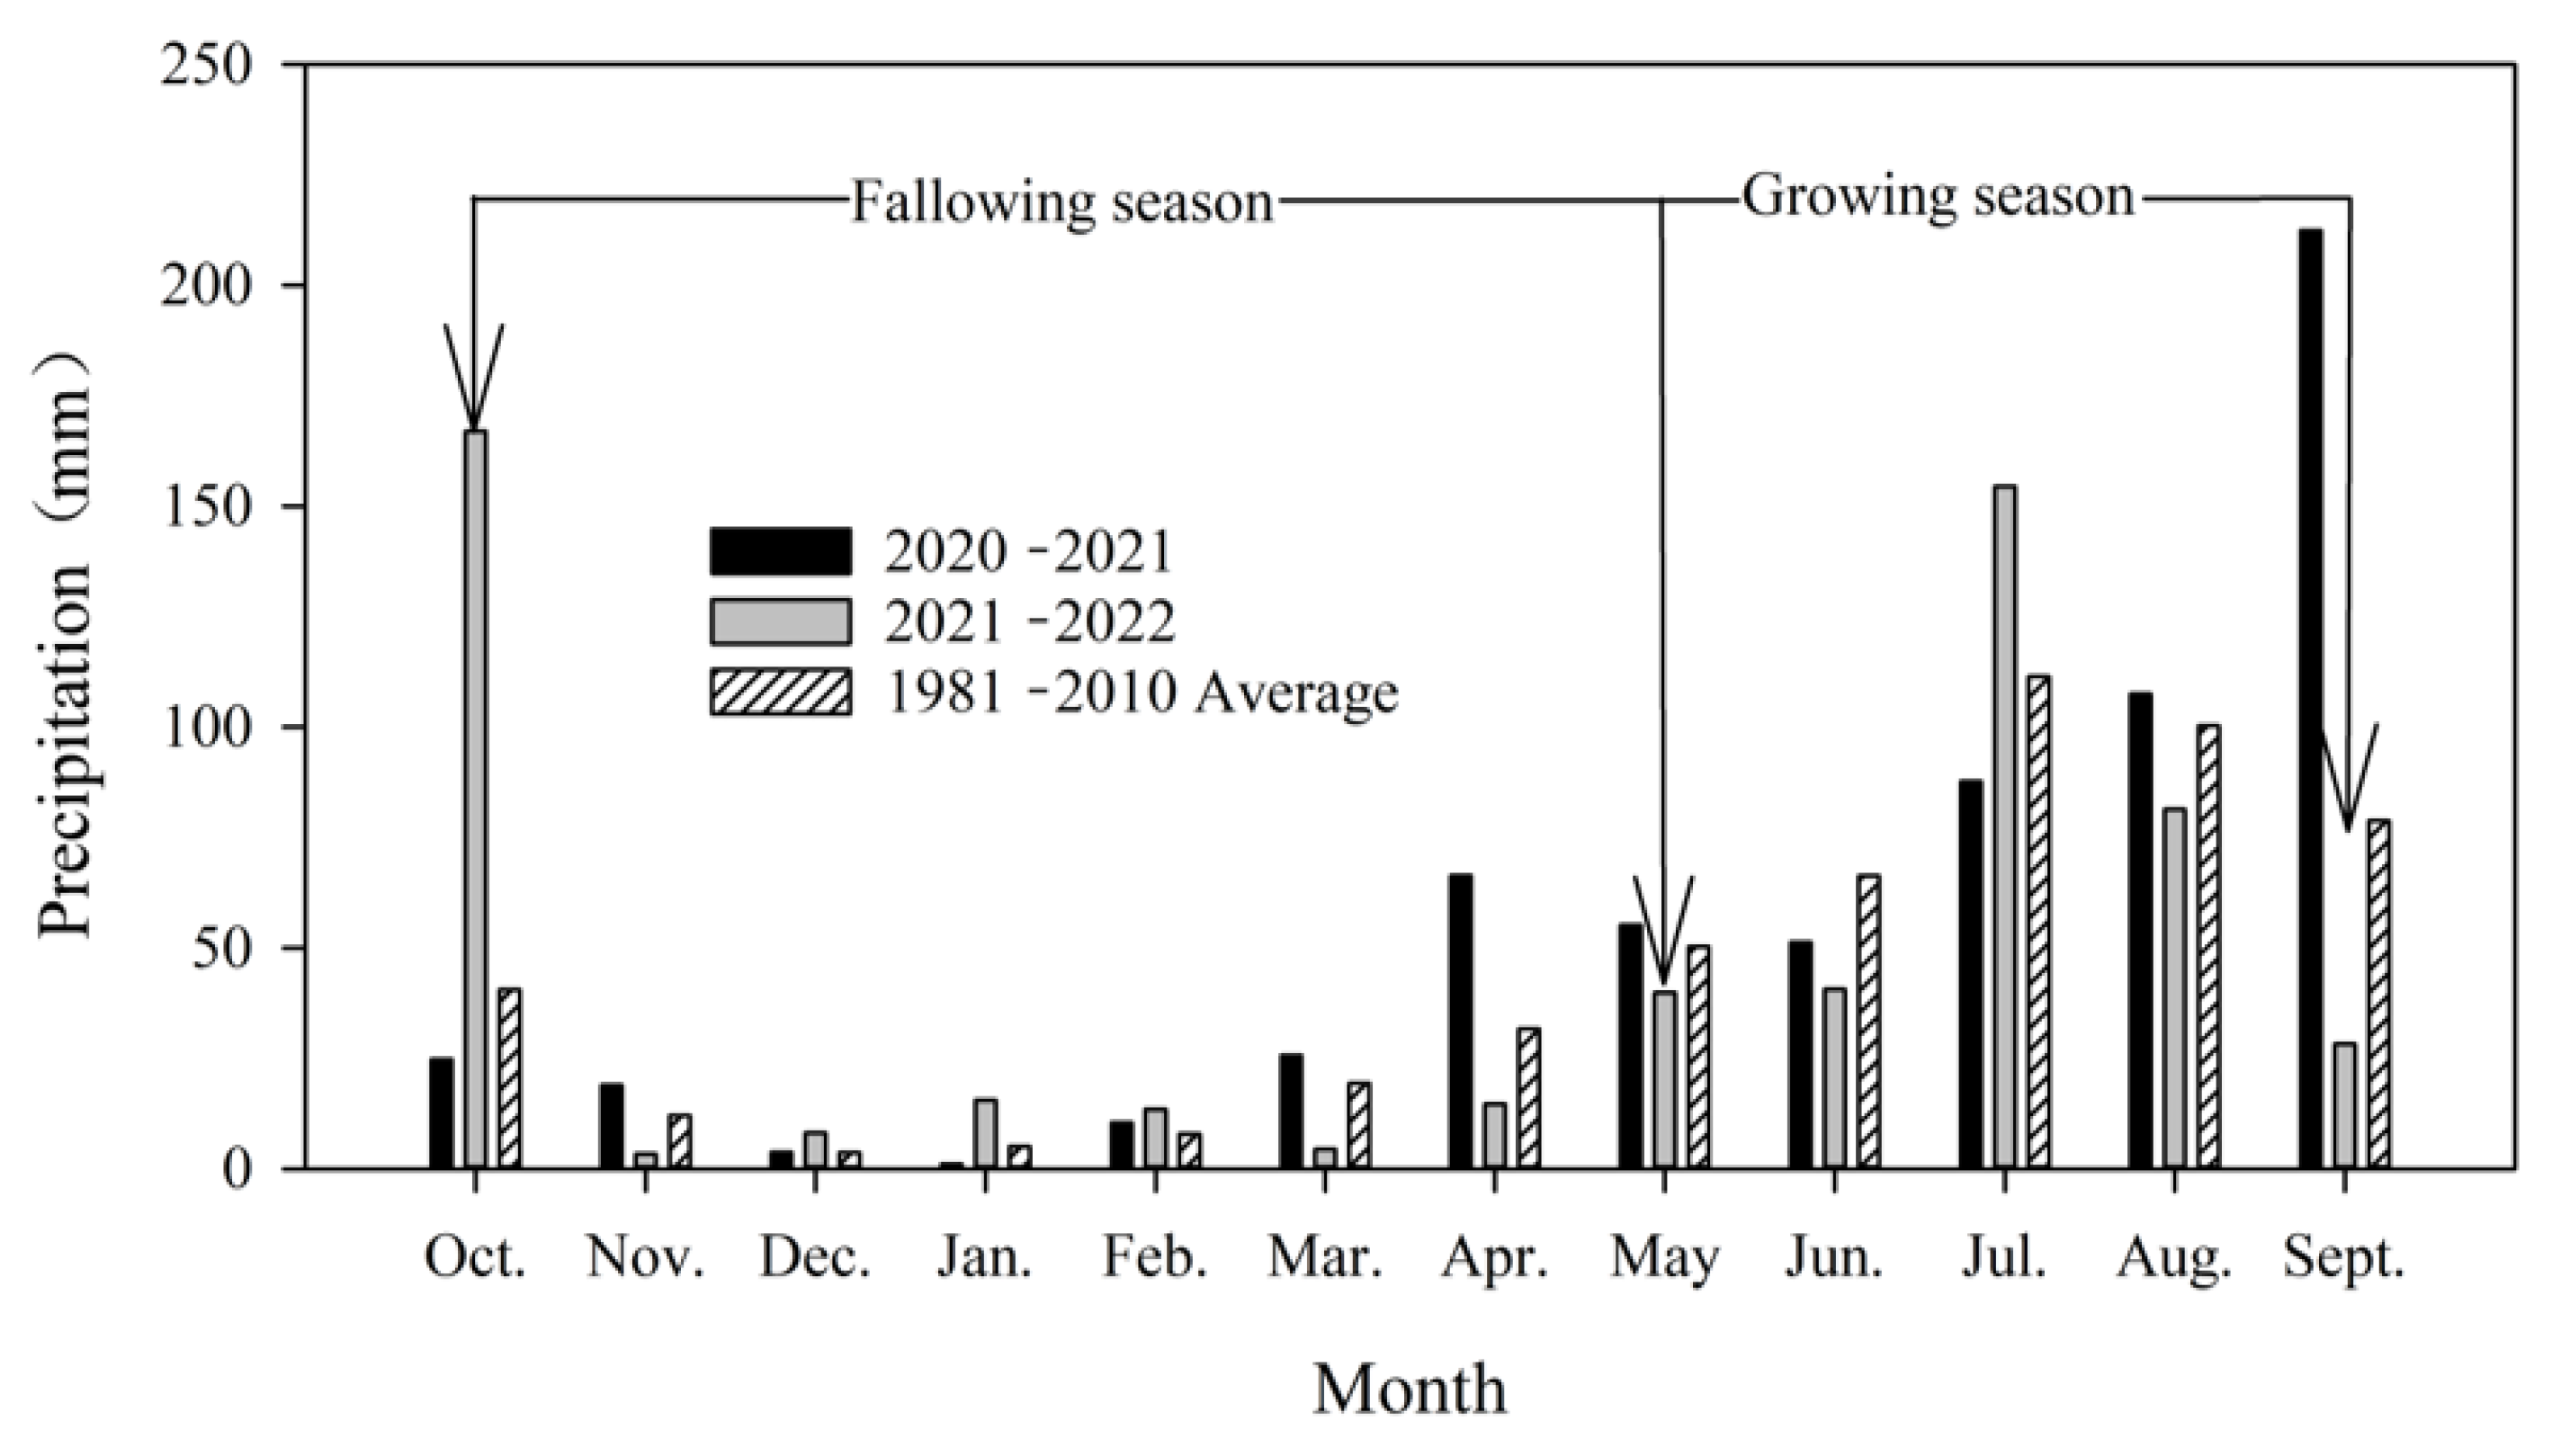
2.1. Experimental Site

The experimental site is located in the Dryland Farming Experimental Station of Longdong University (35°43′ N, 107°41′ E, altitude 1421 m) (Figure 1), Xifeng District, Qingyang City, Gansu Province, China, which belongs to the gully area of the Longdong Loess Plateau. It belongs to a temperate continental semi-arid climate, with annual average temperatures of 8~10 °C [21], and annual average precipitation of 527.6 mm (precipitation data from Qingyang Meteorological Bureau) (Figure 2). The precipitation is concentrated in July~September, the interannual change rate is large [3]. The average annual pan evaporation is 1504 mm [21]. The total annual sunshine is 2400~2600 h, and the effective active accumulated temperature of ≥5 °C is 3445 °C. The annual frost-free period is 150~190 days [30], and the precipitation amounts in 2021 and 2022 were 796.4 and 449.6 mm, respectively (precipitation data from Qingyang Meteorological Bureau) (Figure 2). The soil is classified as Heilu (a very deep loess sandy loam of the Los Orthic Entisols) based on the FAO soil classification. The average soil bulk density was 1.23 g/cm3, the soil organic matter content of 0–30 cm in the test site was 12.08 g/kg, the alkaline hydrolyzable nitrogen was 75.5 mg/kg, the available phosphorus was 19.21 mg/kg, and the available potassium was 140.85 mg/kg in 2021. It was maize monoculture in 2020, 2021, and 2022.

2.2. Experimental Design and Agronomic Management

This experiment was designed as a positioning trial, with maize grown in the test field using conventional tillage before 2021. Six tillage practices were implemented in 2021 and their effects were determined in 2021 and 2022. The experimental design was a two-factor split plot with three replications, the tillage pattern was mainplot, straw was a subplot, with a total of 6 treatments, 18 plots, a width of 4 m and a length of 10 m per plot. The specific experiment treatment and operation description are shown in Table 1.
In 2020, the crop was maize (Longdan No. 8, seeds were purchased from stores that supply agricultural production), and at the beginning of the experiment, the amount of maize stover returned to the field in each community was 2.5 kg per plot (because a large part of the maize straw was taken away by farmers after harvest in 2020, the remaining straw could only support the return amount of 2.5 kg per plot). The maize sowing amount was 65,000 plants/hm2, the row spacing was 40 cm, the plant spacing was 38 cm, and the on-demand sowing was carried out with an on-demand planter. Pure nitrogen was applied at 300 kg/hm2 (fertilizer urea 46%), pure phosphorus at 150 kg/hm2 (superphosphate, 16% P2O5). Fertilizer urea and superphosphate were purchased from stores that supply agricultural production. Phosphate fertilizer was used as a base fertilizer for a one-time application in early April. One-third of the urea fertilizer was applied as a base fertilizer in early April, and two-thirds of the urea fertilizer was applied at jointing in early July. Soil closure treatment was performed with alachlor (corn field herbicide) 3 days after sowing, before weed germination.

2.3. Measurements and Calculation

2.3.1. Soil Water Content and Evapotranspiration

The soil weight water content was determined by the oven-drying method [31]. Soil samples were taken from one point in each plot, using a soil drill to take 0–5, 5–10, 10–30, 30–50, 50–80, 80–110, 110–140, 140–170, 170–200 cm soil layer soil from each plot. The soil volumetric water content for every soil layer was calculated by multiplying soil weight water content by the corresponding soil bulk density [32]. The sampling period was before the maize sowing (6 May 2021 and 8 April 2022), V12 (big flare stage of maize) (19 July 2021 and 20 July 2022), R2 (grain filling stage of maize) (10 August 2021 and 6 August 2022), harvest (14 September 2021 and 28 September 2022). Evapotranspiration was calculated using the following equation [33]:
E T c = I + P c + S W S b S W S h R + C R D
where ETc is evapotranspiration during the crop growth period (mm), I is irrigation, Pc is precipitation (mm) in the crop growth period, and SWSb and SWSh are soil water storage (mm) in the 0–200 cm soil layer before sowing and after harvest of crop, respectively. Soil water storage was calculated by multiplying soil volumetric water content by the corresponding soil thickness. R is runoff, CR is capillary rise to the root zone, and D is drainage from the root zone. Because the experiment was arranged in dryland conditions, no irrigation was applied to maize. Surface runoff was considered negligible because water flow was prevented by border dikes around each plot. Since the annual pan evaporation of 1504 mm at the experimental site is much greater than annual precipitation (527.6 mm), capillary rise to the root zone and drainage from the root zone were also considered negligible [34].
Soil evaporation was measured with a micro-evaporator made from polyvinylchloride tubing with a length of 150 mm, internal diameter of 110 mm, and external diameter of 115 mm [32,35]; the specific determination method and Ec calculation is detailed in the literature [32]. The amount of transpiration during a growing season was calculated using the following equation [32]:
T c = E T c E c
where Tc is transpiration during a growing season (mm), ETc is evapotranspiration during a growth season (mm), Ec is soil evaporation during a growth season (mm).

2.3.2. Soil Temperature

Soil temperature was measured by a curved tube thermometer; the measurement times were 8:00 a.m., 14:00 p.m. and 18:00 p.m. in the V12 and R2 stages. A measurement point was set per plot. The measurement depths were 5 cm, 10 cm, 15 cm, 20 cm, 25 cm. Soil temperature was measured continuously for 3 days at V12 and R2. The average daily soil temperature was calculated from the average of 9 soil temperature measurements taken during the same growth period.

2.3.3. Biomass Yield, Grain Yield, and Yield Components

At the maturity stage of maize, 20 representative plants were taken from each plot, and ear number per area, grain number per ear, hundred-grain weight, and biomass yield (BY) were determined. The remaining part of each plot was harvested, threshed, and dried, grain moisture content after threshing was determined for each plot based on the mean of five measurements taken with a PM-8188 grain moisture meter (Japan), and the grain yield of maize (GY) was calculated based on the moisture content of 13%.

2.3.4. Water Use Efficiency (WUE) and Harvest Index (HI)

WUE and HI were calculated using the following equations [36,37]:
W U E = G Y E T c
H I = G Y B Y
where WUE is water use efficiency of grain yield (kg·hm−2·mm−1); it refers to the grain yield produced by unit weight of water consumed by farmland evapotranspiration, GY is grain yield (kg), BY is biomass yield (kg), and ETc is evapotranspiration during the growing season (mm).

2.4. Statistical Analysis

The data for all dependent variables were analyzed by analysis of variance using SPSS 19.0 (IBM Corp., Chicago, IL, USA). All treatments were compared in tables using Duncan’s multiple range test (p ≤ 0.05). Figures were plotted in Sigmaplot 12.5 (Systat Software, Inc., Chicago, IL, USA), treatment means were compared by computing the least significant difference (LSD) to identify significant differences at the 0.05 probability level. The linear relationships of soil water and temperature indexes, yield, yield components, and harvest index were assessed using Pearson’s correlation coefficient (two-sided test).

3. Results

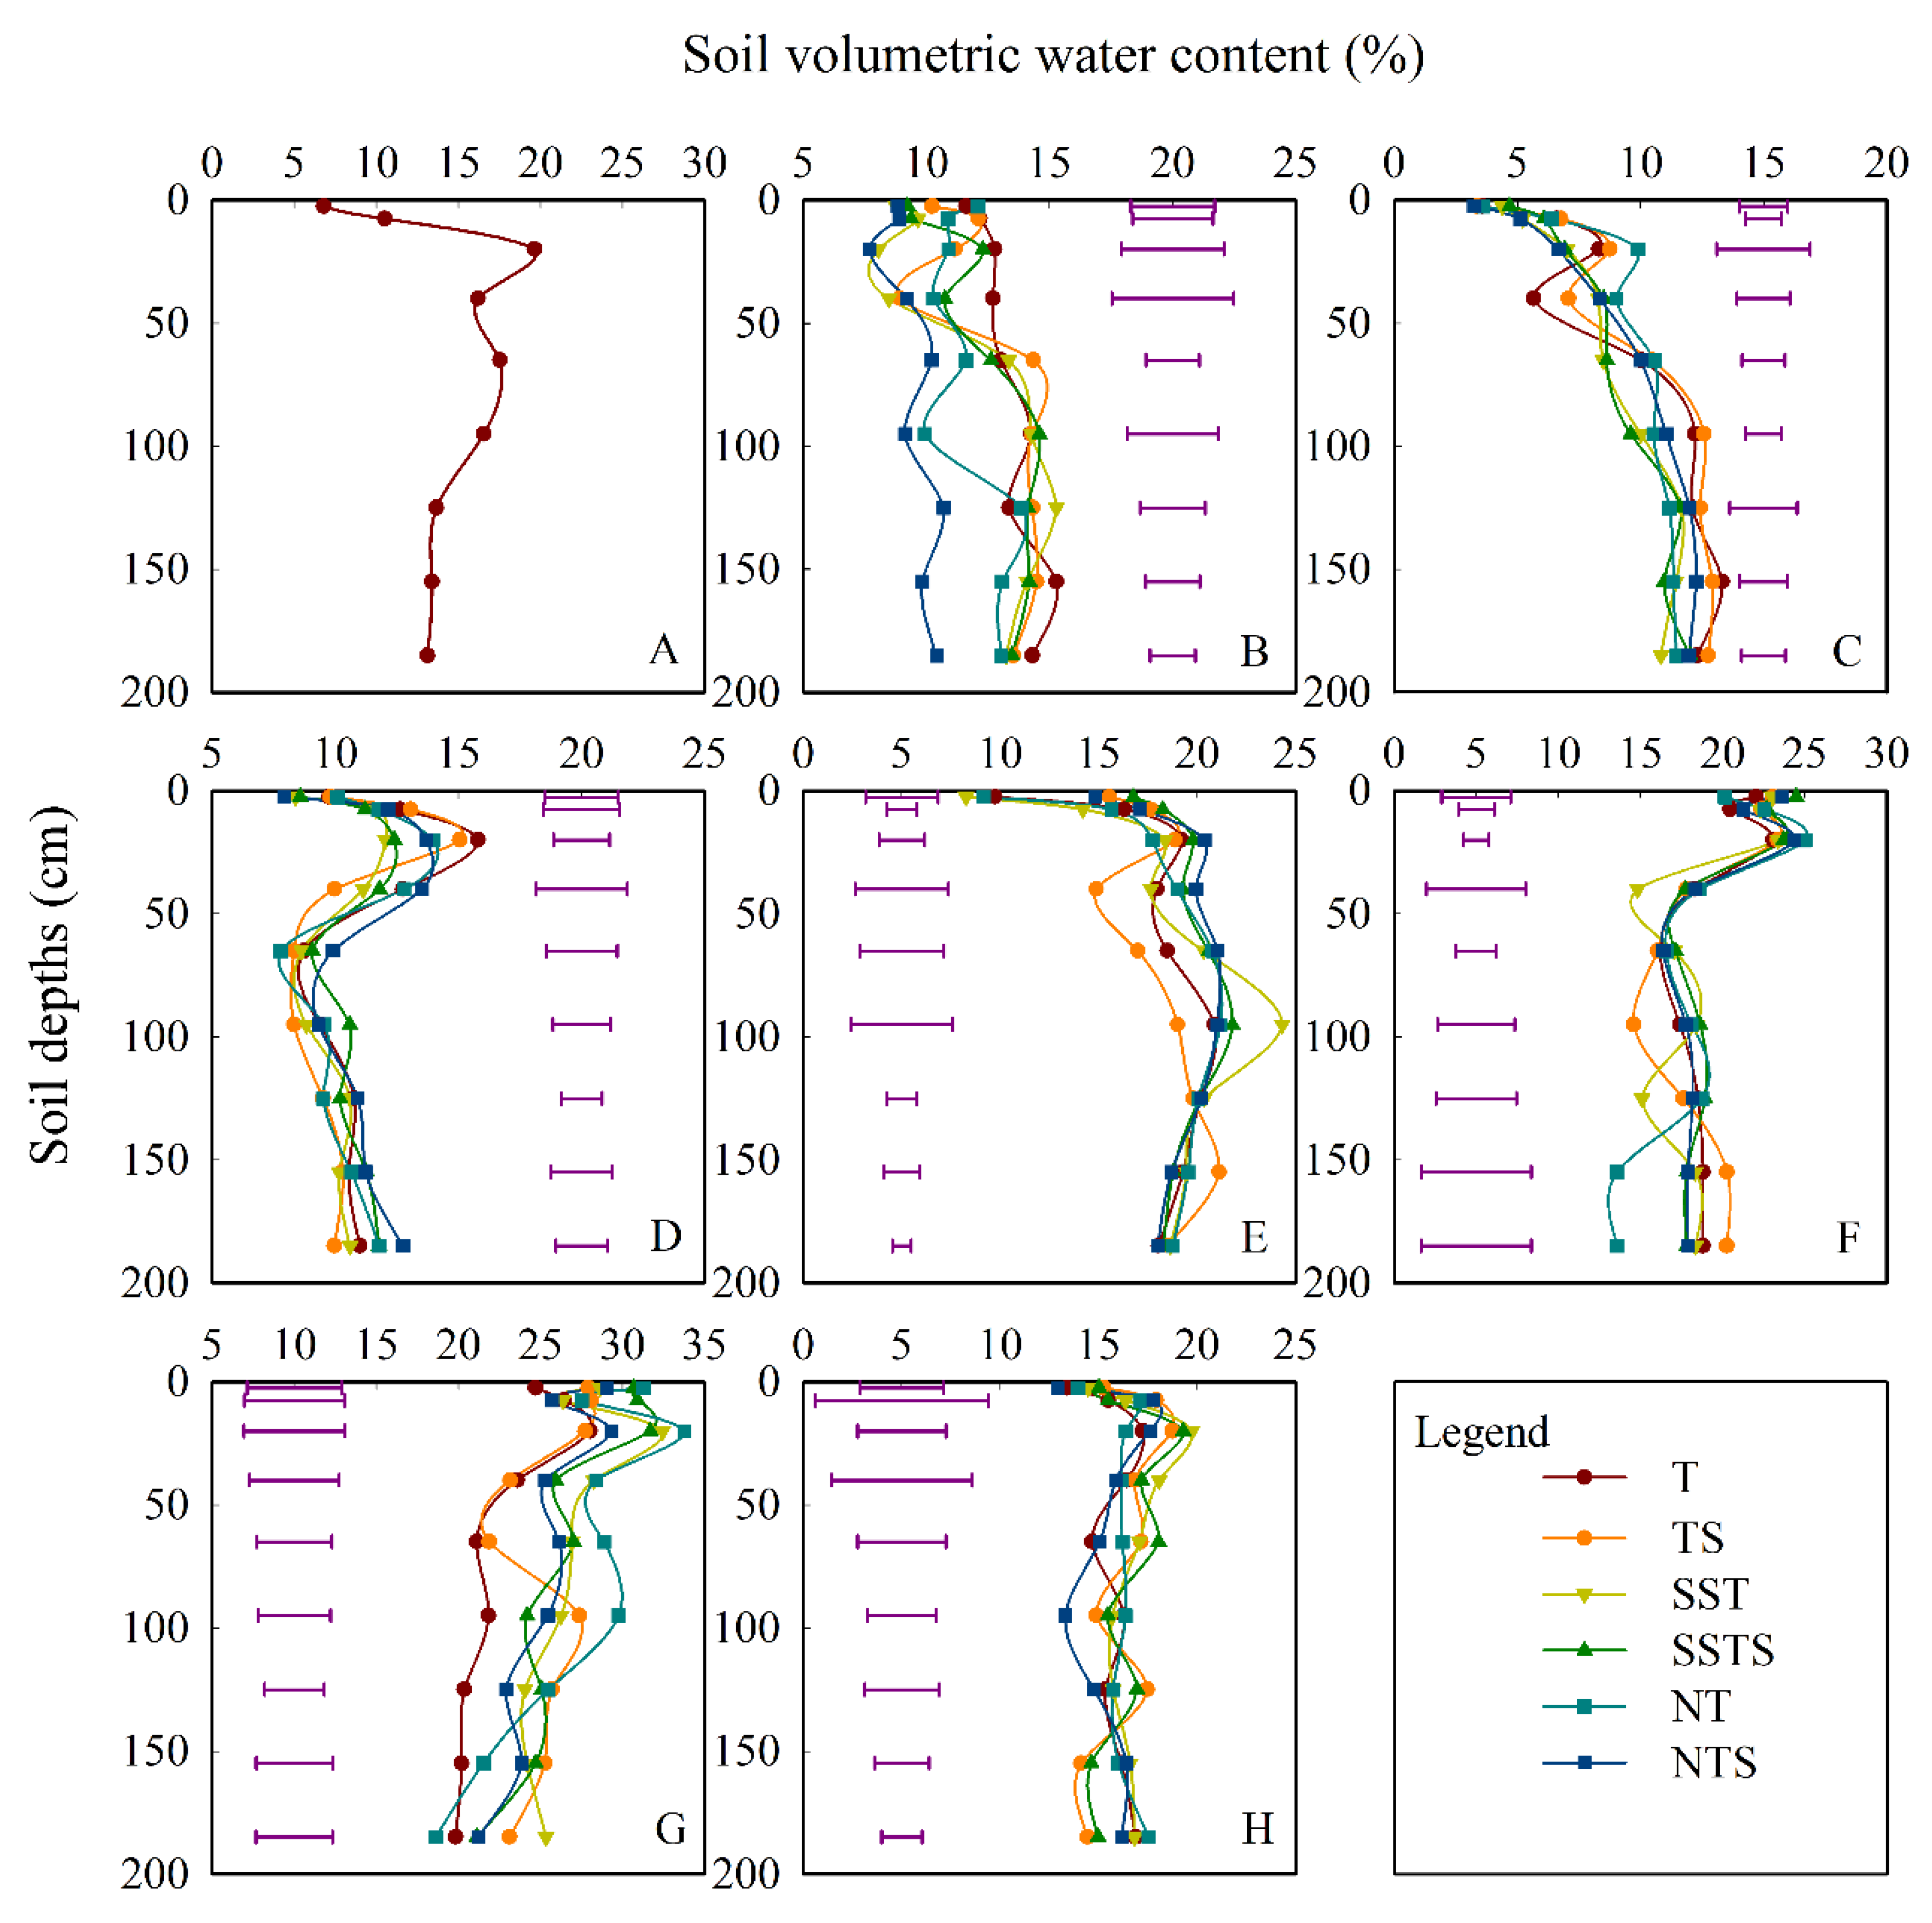
3.1. Effects of Different Tillage Practices on Soil Volumetric Water Content during Maize Growth Period

Soil volumetric water content (SWv) varied with year, tillage practice, soil depth, and growth stage of maize (Figure 3). Compared to T, SWv with TS was not affected significantly in 2021 (Figure 3A–D), but with TS it was significantly increased in the 0–5 cm depth before the sowing of maize (Figure 3E), and in the 110–140, 140–170 cm soil layers at the R2 stage, but with TS it was significantly decreased in the 80–110 cm soil layer at the R2 stage (Figure 3G) and at 170–200 cm at after harvest (Figure 3H) in 2022. Compared to T, SWv with SST was significantly increased in the 30–50 cm soil layer at the R2 stage (Figure 3C), but with SST it was significantly reduced in the 10–30 cm soil layer at the V12 stage (Figure 3B) and after harvest (Figure 3D). In 2021, SWv with SST was significantly increased in the 50–80, 110–140, and 170–200 cm soil layers at the R2 stage (Figure 3G), but with SST it was significantly reduced in the 5–10 cm soil layer before sowing (Figure 3E) in 2022. Compared to T, the SWv with SSTS was significantly increased in the 30–50 cm soil layer, but with SSTS it was significantly reduced at 80–110 and 140–170 cm at the R2 stage (Figure 3C); the SWv with SSTS was significantly reduced in the 10–30 cm soil layer after harvest (Figure 3D), in 2021. Compared to T, the SWv with SSTS was significantly increased in the 0–5 and 5–10 cm soil layer before sowing (Figure 3E), the SWv with SSTS was significantly increased in 5–10 cm soil layer at the V2 stage (Figure 3F), and the SWv with SSTS was significantly increased in the 0–5, 50–80, and 110–140 cm soil layers at the R2 stage (Figure 3G), in 2022. Compared to T, the SWv with NT was significantly reduced at the 140–170 cm soil layer at the V12 stage (Figure 3B), the SWv with NT was significantly increased in the 30–50 cm soil layer, but significantly reduced at 80–110 and 140–170 cm at the R2 stage (Figure 3C), in 2021. Compared to T, the SWv with NT was significantly increased, and there was no significant difference in other treatments in the 10–30 cm soil layer at the V12 stage (Figure 3F). The SWv with NT was significantly increased in the 0–5, 50–80, and 110–140 cm soil layers, but with NT it was significantly decreased in the 80–110 cm soil layer at the R2 stage (Figure 3G), in 2022. Compared to T, the SWv with NTS was significantly reduced in the 5–10, 10–30, 50–80, 110–140, and 170–200 cm soil layers at the V12 stage (Figure 3B). The SWv with NTS was significantly increased in the 30–50 cm soil layer, but significantly reduced at 5–10 cm at the R2 stage (Figure 3C), in 2021. Compared to T, the SWv with NTS was significantly increased in the 0–5 cm soil layer before the sowing of maize (Figure 3E), and the SWv with NTS was significantly increased in the 50–80 cm soil layer at the R2 stage (Figure 3G), in 2022.

3.2. Effects of Different Tillage Practices on Soil Temperature during Maize Growth Period

Soil temperature (ST) varied with tillage practices, soil layer, growth stage, measuring time of day, and year (Figure 4). In 2021, at the V12 stage, the ST of SST, SSTS, and NT was significantly lower than that of T soil in the 20 cm soil depth, at 8:00 a.m. (Figure 4A). The ST with SSTS was significantly lower than that of T in 25 cm soil depth, at 14:00 p.m. (Figure 4B). The ST with SSTS was significantly lower than that of T in the 20 cm soil depth, at 18:00 p.m. (Figure 4C). Compared to T, the average daily soil temperature (STa) with SST and SSTS was significantly decreased in the 20 cm soil depth, and the average daily soil temperature with SSTS was significantly decreased in the 25 cm soil depth (Figure 4D). At the R2 stage, compared to T, the ST of NTS was significantly decreased in the 15 cm soil depth, and the ST of SSTS was significantly lower than that of T in the 20 cm soil depth, at 8:00 a.m. (Figure 4E). The ST of NTS was significantly higher than that of T in the 15 cm soil depth, at 14:00 p.m. (Figure 4F). The soil temperature of NTS was significantly higher than that of T in the 10 and 15 cm soil depths, and the soil temperature of SSTS was significantly lower than that of T in the 20 cm soil depth at 18:00 p.m. (Figure 4G). The STa with NTS was significantly higher than that of T in the 10 and 15 cm soil depths, and the STa with SSTS was significantly lower than that of T in 20 and 25 cm soil depths (Figure 4H).
In 2022, at the V12 stage, the ST of NTS was significantly higher than that of T in the 10 cm soil depth, at 8:00 a.m. (Figure 4I). The ST of NT was significantly higher than that of T in the 25 cm soil depth, at 18:00 p.m. (Figure 4K). At the R2 stage, compared to T, the ST of SSTS was significantly decreased in the 15 cm soil depth, and the ST of NT was significantly increased in the 25 cm soil depth at 8:00 a.m. (Figure 4M). Compared to T, the ST of SST and SSTS was significantly decreased in the 15 and 20 cm soil depths, and the soil temperature of NT was significantly increased in the 25 cm soil depth, at 14:00 p.m. (Figure 4N). The ST of TS was significantly lower than that of T in the 15 cm soil depth, and the soil temperature of SST was significantly lower than that of T in the 5, 15 and 20 cm soil depths, at 18:00 p.m. (Figure 4O). Compared to T, the STa with SST and SSTS was significantly decreased in the 15 and 20 cm soil depths, and the STa with NT was significantly increased in the 25 cm soil depth (Figure 4P).
In summary, over two years, compared to T, SST significantly reduced ST in the 20 cm soil layer at the V12 and R2 stages, and SSTS significantly reduced soil temperature in the 20 and 25 cm soil layers at V12 and R2. The soil temperature with TS, NT, and NTS revealed no uniform rules in two years.

3.3. Effects of Different Tillage Practices on Water Consumption Structure of Maize during the Growth Period

Different tillage practices had significant effects on soil water storage before sowing (SWSb) and soil water storage after harvest (SWSh), evapotranspiration during the growth period (ETc), evaporation during the growth period (Ec), and transpiration during the growth period (Tc) (Table 2). Ec was less in 2021 than in 2022. In 2021, compared to T, SWSh with TS, SST, SSTS, NT, NTS were not significantly different. ETc with TS, SST, SSTS, NT, NTS were not significantly different when compared to T, but ETc with SST and SSTS was higher than that of T. Compared to T, Ec with TS, SSTS, and NTS was significantly reduced, but with SST and NT, it was not significantly affected; there were no significant differences among TS, SSTS, and NTS, and also no significant differences between SST and NT. Tc with TS, SST, and SSTS was significantly increased, but with NT and NTS, there were no significant differences when compared to T. In 2022, compared to T, SWSb with TS, SST, SSTS, NT, and NTS was not significantly different. Compared to T, SWSh was significantly increased with TS, SST, and SSTS, but with NT, it was not significantly different, and it was significantly reduced with NTS. Compared to T, ETc was significantly reduced with TS, but was not significantly different with SST, SSTS, and NT, and was significantly increased with NTS. ETc with NTS was significantly higher than that of other treatments. Compared to T, Ec was significantly reduced with TS, SST, SSTS, NT, and NTS, and Ec with NTS was significantly lower than with SSTS. The Ec of SSTS was significantly lower than that of TS, SST, and NT, and there were no significant differences among TS, SST, and NT. Compared to T, Tc was significantly increased with SSTS and NTS, and there were no significant differences among T, TS, SST, and NT.
Effects of the year on SWSb, SWSh, Ec, and Tc were highly significant, but the effect on ETc was not significant. Effects of tillage on SWSb, Ec, and Tc were highly significant, and the effect on ETc was significant, but on SWSh it was not significant. Effects of straw on Ec and Tc were highly significant, but on SWSb, SWSh, and ETc, they were not significant. Effects of the interaction between year and tillage on SWSb, SWSh, ETc, Ec, and Tc were highly significant. Effects of the interaction between year and straw on Ec and Tc were highly significant, but effects on SWSb, SWSh, and ETc were not significant. Effects of the interaction between tillage and straw on SWSb, SWSh, ETc, Ec, and Tc were not significant. Effects of the interaction among year, tillage, and straw on SWSh, ETc, and Tc were highly significant, and the effect on Ec was significant, but on SWSb it was not significant.

3.4. Effects of Different Tillage Practices on Yield and Water Use Efficiency of Maize

Over two years, ear number per area, grain number per ear, hundred-grain weight (HGW), grain yield (GY), water use efficiency of grain yield (WUE), biomass yield (BY), and harvest index (HI) were significantly affected by different tillage practices (Table 3). There was no significant difference in ear number per area between T and other treatments. Compared with T, the grain number per ear of SST and SSTS increased significantly, and the grain number per ear of NT and NTS decreased significantly. The change in HGW between TS, SST, SSTS, NT, and T was not significant. Compared with T, the GY of SST and SSTS increased significantly, with an increase of 4.9–6.9 and 6.2–13.7%, respectively, and the GY of NT and NTS decreased significantly, by 19.6–42.8 and 25.3–38.1%, respectively, and the difference between TS and T was not significant. Compared to T, the WUE with SSTS was significantly increased, by 5.5–15.4%, but there was no significant difference in WUE with TS, that with NT and NTS was significantly decreased, by 21.7–42.4, and 24.0–42.0%, respectively, and that with SST was higher than T. Compared with T, the BY of SST and SSTS increased significantly, with an increase of 29.7–32.1 and 41.2–53.5%, respectively, and the BY of NT and NTS decreased significantly, by 17.7–39.4 and 18.2–39.8%, respectively, and the difference between TS and T was not significant. Compared with T, the HIs of SST and SSTS are significantly reduced, and the HI of TS, NT, and NTS are not significantly different.
Effects of the year on ear number per area, HGW, GY, WUE, BY, and HI were highly significant, but the effect on grain number per ear was not significant. The effects of tillage on all analyzed parameters were highly significant. The effects of straw on grain number per ear (p ≤ 0.01) and BY (p ≤ 0.05) were significant, but on other parameters, they were not significant. The effects of the interactions between year and tillage on grain number per ear, HGW, GY, WUE (p ≤ 0.01), and BY (p ≤ 0.05) were significant, but on ear number per area and HI, they were not significant. Effects of the interactions between year and straw on ear number per area (p ≤ 0.05), grain number per ear, and GY (p ≤ 0.01) were significant, but on other parameters, they were not significant. Effects of the interaction between tillage and straw on ear number per area (p ≤ 0.01) and BY (p ≤ 0.05) were significant, but those on other parameters were not significant. Effects of the interaction among year, tillage, and straw on ear number per area were highly significant, but on grain number per ear, HGW, GY, WUE, BY, and HI, they were not significant.

3.5. Correlation Analysis of Soil Water Content, Temperature and Yield, Yield Components and Harvest Index

Significant correlations among soil volumetric water content before sowing (SW1), soil volumetric water content at the V12 stage (SW2), soil volumetric water content at the R2 stage (SW3), soil volumetric water content after harvest (SW4), daily soil temperature at the V12 stage (ST1), daily soil temperature at the R2 stage (ST2), ear number per area, grain number per ear, hundred-grain weight (HGW), grain yield (GY), biomass yield (BY), and harvest index (HI) of maize were observed (Table 4). SW1, SW3, and SW4 did not have a significant correlation with any of the analyzed parameters. SW2 had a highly significant positive correlation with HGW and GY. ST1 had a significant negative correlation with HGW, but did not have a significant correlation with other parameters. ST2 had a significant negative correlation with grain number per ear, GY, BY (p ≤ 0.01), and HGW (p ≤ 0.05), but did not have a significant correlation with ear number per area and HI.

3.6. Effects of Different Tillage Practices on Economic Benefits of Maize Planting

The grain benefit, net benefit and ratio of output to input of maize were significantly affected by tillage practices (Table 5). In the same year, seeds, fertilizers, pesticides, and labor costs were the same with T, TS, SST, SSTS, NT, and NTS. The mechanical input of T, TS, SST, and SSTS was equal; NT and NTS have no mechanical input. The total input with T, TS, SST, and SSTS was equal, that of NT and NTS was equal, and that of NT and NTS was lower than other treatments. Seeds and fertilizer costs in 2022 were higher than in 2021.
Over two years, compared with T, SST and SSTS significantly increased the grain benefit, and the grain benefit of NT and NTS significantly decreased, and the difference between TS and T was not significant. Compared to T, the net benefit of SST and SSTS significantly increased, by 12.2–24.7 and 15.5–49.3%, respectively, and the net benefit of NT and NTS significantly decreased, and the difference between TS and T was not significant. Compared with T, SST and SSTS significantly increased the ratio of output to input, and NT and NTS significantly decreased the ratio of output to input, and the difference between TS and T was not significant.

4. Discussion

4.1. Effects of Different Tillage Measures on Soil Volumetric Moisture Content and Soil Temperature

Soil is the basis of plant growth and development, and can provide water, oxygen, nutrients and so on for plant growth and development. An appropriate soil environment can increase crop yield. Tillage practices are a common agronomic measure to improve soil water and heat status and regulate crop growth and development. Soil volumetric water content varied with tillage practices, growth period, soil layer, and year [38]. Because the correlation between soil volumetric water content and grain yield was highly significant at the V12 stage, the soil volumetric water content at the V12 stage was discussed in this study. Conventional tillage with straw incorporation significantly improved the soil moisture content compared with conventional tillage [39]; similar conclusions appeared in the study of He et al. [24], most likely because subsoiling tillage decreased soil bulk density, which caused the increase of soil total porosity, and so more precipitation infiltration [24]. In this study, the soil volumetric water content with SSTS was significantly increased in the 5–10 cm soil layer at the V12 stage in 2022, which may be due to the improvement of the soil’s physical structure by the subsoiling treatment, which increased the infiltration of precipitation [26], and straw mulching reduced soil water evaporation [40], which was basically consistent with the results of the previous studies [23,24,26]. However, compared to T, the soil volumetric water content with NT was significantly reduced in the 140–170 cm soil layer at the V12 stage in 2021, and the soil volumetric water content with NT was significantly increased in the 10–30 cm soil layer at the V12 stage in 2022. Compared to T, the soil volumetric water content with NTS was significantly reduced in the 5–10, 10–30, 50–80, 110–140, and 170–200 cm soil layers at V12 in 2021, which was contrary to the previous results [41,42], which may be due to the increase in soil bulk density by short-term no-tillage [43]. In this study, the soil temperature at R2 had a significant negative correlation with grain number per ear, GY, BY (p ≤ 0.01), and HGW (p ≤ 0.05), but did not have a significant correlation with ear number per area and HI. Over two years, compared to T, SST significantly reduced soil temperature in the 20 cm soil layer at V12 and R2, and SSTS significantly reduced soil temperature in the 20 and 25 cm soil layers at V12 and R2. Similar results were found in the studies [44,45,46,47], most likely because subsoiling tillage reduced soil bulk density, increased soil total porosity, promoted root growth, and resulted in deep roots [48] and luxuriant leaves [49], thereby increasing shading [48], and ultimately reducing soil temperature.
In summary, subsoiling tillage with straw incorporated significantly increased the grain yield of maize by increasing soil volumetric water content in the 5–10 cm soil layer at the V12 stage, and decreased soil temperature at the R2 stage.

4.2. Effects of Different Tillage Practices on Water Consumption Structure and Water Use Efficiency of Maize

The water consumption of farmland is mainly composed of crop transpiration and soil evaporation, so reducing soil evaporation can effectively improve water use efficiency [32]. In this study, the effects of the interaction among year, tillage, and straw on evapotranspiration, soil evaporation, and crop transpiration during the growing season were significantly different, likely because of the difference in annual precipitation (Figure 2). Over two years, evapotranspiration with SST, SSTS (depth 30 cm), and NT was not significantly different compared to T, but evapotranspiration with SST and SSTS was higher than that with T in 2021. The evapotranspiration with SST (depth 35–40 cm) was significantly increased in the North China Plain [50], likely because that was caused by the difference in subsoiling tillage depth. NT was also significantly affected by evapotranspiration in the study of Peng et al. [32]. ETc with NTS was significantly higher than that of other treatments in 2022. This may be due to the heavy soil bulk density of no-tillage in the short term, straw mulching, and scarce precipitation at the seedling stage (Figure 2), resulting in a poor seedling emergence rate under no-tillage straw mulching [43,51]. Meanwhile, in the late growth of maize, more precipitation (Figure 2) increased the damage of weeds, and weeds absorbed a large amount of soil water, resulting in higher evapotranspiration under NTS.
In this study, soil evaporation was less in 2021 than in 2022, likely because there was little precipitation in May (Figure 2), a low emergence rate, low crop shade, and excessive precipitation in July 2022 (Figure 2). Over two years, compared to T, conventional tillage with straw incorporated, SSTS, and NTS significantly reduced soil evaporation during the growing season, but the change with SST was not significant, and was about equal with T in 2021; similar results appeared in the previous study [32]. This is perhaps because TS increased soil organic carbon [52], which in turn increased soil water retention [53]. No-tillage with straw cover reduced soil evaporation, probably because the straw inhibited soil evaporation [42], and subsoiling tillage with straw reduced soil evaporation due to straw inhibition [54] and soil organic carbon increasing [55]. Over two years, in this study, compared to T, SSTS significantly increased crop transpiration; this was because the evapotranspiration with SSTS was not significantly affected, and SSTS significantly reduced soil evaporation. But the TS treatment significantly increased crop transpiration in 2021; this was because evapotranspiration with TS was not significantly affected, and TS significantly reduced soil evaporation in 2021. No-tillage with straw mulching increased crop transpiration in 2022, which was because NTS significantly increased evapotranspiration, and significantly reduced soil evaporation in 2021. Judging from the two-year results, SSTS significantly increased water use efficiency, by 5.5–15.4%, compared to T, mainly because SSTS reduced soil evaporation [48] and increased transpiration; similar studies have appeared in the study of Tao et al. [56] and Liu et al. [54]. SST increased water use efficiency, but not significantly compared to T in 2021. Probably because there was no straw to inhibit soil evaporation, soil evaporation with SST was not affected significantly, and was about equal with T in 2021, so there was a decrease in available soil water. NTS significantly decreased water use efficiency, by 24.0–42.0%, compared to T, but its transpiration was significantly increased in 2022, likely because precipitation is less in May (Figure 1), when the emergence rate is relatively low [41]. However, NTS can significantly increase the water use efficiency of maize in the black soil region of China [57]. Conventional tillage with straw mulching significantly increased water use efficiency in the Longdong Loess Plateau in China [58]; however, the WUE with TS was not significantly affected in this study, likely because the on-demand seeder was used to sow seeds in this study, whereas digging holes was used to sow seeds in the study of Liu et al. [57]. The amount of returning straw in this study is 100%, and the amount of returning straw in Li et al.’s study is 50% [58].

4.3. Effects of Different Tillage Practices on Maize Yield, Yield Composition, and Economic Benefits

Yield and economic benefit are important parameters to evaluate the suitability of tillage practices. Subsoiling tillage is beneficial to the increase in maize yield [23,24,25,26]. This is likely because subsoiling can effectively promote the accumulation of organic carbon in topsoil [27], improve soil structure [28] and water retention performance [26], and increase the biomass yield, grain number per ear, and 1000-grain weight of crops [23], thereby increasing grain yield. Over two years, in this study, the grain yield of SST and SSTS was significantly higher than that of T, with an increase of 4.9–6.9 and 6.2–13.7%, respectively, due to the significant increase in biological yield and grain number per ear of SST and SSTS, which was consistent with the results of Feng et al. [23]. No-tillage straw mulching significantly increased maize yield in a long-term conservation agroecosystem research study [41,59]. But grain yield with NT and NTS significantly decreased, by 19.6–42.8% and 25.3–38.1%, respectively, in this study, likely because short-term no-tillage increased soil bulk density [43], reduced the emergence rate [60], and inhibited root growth [61], and so reduced maize yield [61]. There were similar patterns between biomass yield and grain yield in this study. In 2021 and 2022, SST and SSTS significantly increased grain number per ear; a similar result was found in the study of Shao et al. [62]. Studies have shown that subsoiling tillage can increase the economic benefits of corn production, mainly due to the high ratio of output to input; subsoiling tillage increases grain yield and reduces mechanical cost [63], which is basically consistent with the results of this study. The net benefit of SST and SSTS significantly increased, by 12.2–24.7 and 15.5–49.3%, respectively. Therefore, subsoiling tillage with straw incorporated is the best tillage practice in this study.
In summary, though ETc with SST and SSTS was higher than that of T in 2021, the water use efficiency and grain yield with SST and SSTS were higher than that of T. Mainly because soil evaporation with SSTS was lower, that of SST was about equal compared to T, so more soil water was used by maize, forming a higher grain yield. Finally, the water use efficiency of SST and SSTS were higher than that of T. However, over two years, grain yield, water use efficiency, and economic benefit with SSTS were the best among all treatments. Compared with T, SSTS increased soil volumetric moisture content and reduced soil temperature within a certain range, optimized the water consumption structure, improved the effective utilization of soil water, resulting in the accumulation of higher biomass yield, increased the grain number per ear, and obtained higher yield and water use efficiency, ultimately producing higher net economic benefits. NTS significantly decreased the grain yield compared to conventional tillage without straw, likely because of the shorter tillage year; this warrants further study.

5. Conclusions

In the rainfed area of the Longdong Loess Plateau, China, although evapotranspiration with two subsoiling tillage treatments was higher than that of conventional tillage with no straw, the water use efficiency and grain yield with two subsoiling tillage treatments were higher than those with conventional tillage with no straw in 2021. Mainly because soil evaporation with subsoiling tillage with straw incorporated was lower, that of subsoiling tillage with no straw was about equal compared to conventional tillage with no straw, so more soil water was used by maize, forming a higher grain yield. Finally, the water use efficiency with two subsoiling tillage treatments was higher than that of T. However, over two years, compared with conventional tillage treatment, the maize yield, water use efficiency, and economic benefit of subsoiling tillage with straw incorporated were the best; the subsoiling tillage with straw incorporated treatment significantly improved maize yield, water use efficiency, and economic benefits, with an increase of 6.2–13.7, 5.5–15.4, and 15.5–49.3%, respectively. This is mainly because, when compared with conventional tillage, subsoiling tillage with straw incorporated significantly increased soil volumetric water content in the 5–10 cm soil layer at the V12 stage, decreased soil temperature at R2, reduced soil evaporation, increased crop transpiration, and so increased biomass yield, increased the grain number per ear, obtained a higher yield, improved water use efficiency, and produced higher net economic benefits. No-tillage with straw cover significantly decreased the grain yield compared to conventional tillage without straw, likely because of a shorter tillage year; that warrants further study. Thus, research so far indicates that subsoiling tillage with straw incorporated is a suitable tillage practice in the rainfed area of the Longdong Loess Plateau, China.

Author Contributions

Conceptualization, Z.P.; Data curation, Z.P.; Formal analysis, Z.P., H.Y. and Q.L.; Funding acquisition, Z.P. and H.Y.; Investigation, H.C. and J.J.; Methodology, Q.L. and J.M.; Project administration, Y.Q.; Supervision, H.C. and S.M.; Validation, Z.S.; Writing—original draft, Z.P.; Writing—review and editing, H.Y., H.C., Y.Q., P.R. and P.L. All authors have read and agreed to the published version of the manuscript.

Funding

This work was supported by the Science and Technology Plan of Gansu Province (22JR11RM163), the Doctoral Foundation Project of Longdong University (XYBY202010), and the University Teachers Innovation Foundation Project of Gansu Province (2023B-199).

Data Availability Statement

The data have been explained in the paper.

Conflicts of Interest

The authors declare no conflict of interest.

References

  1. Erenstein, O.; Jaleta, M.; Sonder, K.; Mottaleb, K.; Prasanna, B.M. Global maize production, consumption and trade: Trends and R&D implications. Food Secur. 2022, 14, 1295–1319. [Google Scholar]
  2. Wang, Y.; Wang, Z.; He, K.; Guo, J. Transgenic Maize and Its Potential Commercialization in China; CSIRO Publishing: Clayton, Australia, 2021. [Google Scholar]
  3. Wei, Y.Q. Analysis on the Production Efficiency of Typical Cereal-Cash-Forage Crops in Longdong Region. Master’s Thesis, Lanzhou University, Lanzhou, China, 2021. [Google Scholar]
  4. Zhou, J.J.; Feng, W.; Xiang, J.; Huang, M.H. Analysis of drought characteristics in Gansu Province in recent 58 years based on SPEI index. J. Meteorol. Sci. 2022, 42, 99–107. [Google Scholar]
  5. Kant, S.; Bi, Y.M.; Rothstein, S.J. Understanding plant response to nitrogen limitation for the improvement of crop nitrogen use efficiency. J. Exp. Bot. 2011, 62, 1499–1509. [Google Scholar] [CrossRef] [PubMed]
  6. Yang, X.; Wang, Z.K.; Cao, Q.; Zhang, X.M.; Shen, Y.Y. Effects of precipitation and air temperature changes on yield of several crops in Eastern Gansu of China. Trans. CSAE 2016, 32, 106–114. [Google Scholar]
  7. Maitah, M.; Malec, K.; Maitah, K. Influence of precipitation and temperature on maize production in the Czech Republic from 2002 to 2019. Sci. Rep. 2021, 11, 10467. [Google Scholar] [CrossRef] [PubMed]
  8. Cudjoe, G.P.; Antwi-Agyei, P.; Gyampoh, B.A. The effect of climate variability on maize production in the Ejura-Sekyedumase Municipality, Ghana. Climate 2021, 9, 145. [Google Scholar] [CrossRef]
  9. Mumo, L.; Yu, J.H.; Fang, K. Assessing impacts of seasonal climate variability on maize yield in Kenya. Int. J. Plant Prod. 2018, 12, 297–307. [Google Scholar] [CrossRef]
  10. Hood, R.C. The effect of soil temperature and moisture on organic matter decomposition and plant growth. Isot. Environ. Health Stud. 2001, 37, 25–41. [Google Scholar] [CrossRef]
  11. Wang, P.F.; Yu, A.Z.; Wang, Y.L.; Su, X.X.; Chai, J.; Li, Y.; Lv, H.Q.; Shang, Y.P.; Yang, X.H. Effects of multiple cropping green manure after wheat harvest combined with reduced nitrogen application on soil hydrothermal characteristics and maize yield. Acta Agron. Sin. 2023, 49, 2793–2805. [Google Scholar]
  12. Cao, H.J.; Han, Y.G.; Peng, J.; Peng, X.R. Improving soil moisture content to increase strawberry growth indicators using the hydroponic method. Water Supply 2023, 158, 2927–2939. [Google Scholar] [CrossRef]
  13. Yin, W.; Fan, Z.L.; Hu, F.L.; Fan, H.; He, W.; Zhao, C.; Yu, A.Z.; Chai, Q. No-tillage with straw mulching promotes wheat production via regulating soil drying-wetting status and reducing soil-air temperature variation at arid regions. Eur. J. Agron. 2023, 145, 126778. [Google Scholar] [CrossRef]
  14. Deng, H.L.; Zhang, H.J.; Li, F.Q.; Xiao, R.; Zhou, H.; Zhang, Y.L.; Wang, Y.C.; Li, X.; Wu, K.Q.; Yu, H.Y. Effects of mulching methods on soil water and temperature characteristics and yield of spring maize in semi-humid region of the Loess Plateau. Acta Agric. Boreali-Sin. 2020, 35, 195–205. [Google Scholar]
  15. Li, S.Z.; Fan, T.L.; Zhao, G.; Dang, Y.; Wang, L.; Zhang, J.J.; Tang, X.M.; Cheng, W.L. Effects of different cultivation patterns on soil moisture, temperature, yield and quality of dryland maize. Acta Prataculturae Sin. 2018, 27, 34–44. [Google Scholar]
  16. Dong, Q.; Dang, T.H.; Guo, S.L.; Hao, M.D. Effect of different mulching measures on nitrate nitrogen leaching in spring maize planting system in south of Loess Plateau. Agric. Water Manag. 2019, 213, 654–658. [Google Scholar] [CrossRef]
  17. Liu, S.; Li, J.Y.; Zhang, X.Y. Simulations of soil water and heat processes for no tillage and conventional tillage systems in mollisols of China. Land 2022, 11, 417. [Google Scholar] [CrossRef]
  18. Liu, L. Effects of Straw Mulching and Tillage Measures on Soil Water and Temperature and Maize Yield Formation in Black Soil Region. Master’s Thesis, Northeast Agricultural University, Harbin, China, 2019. [Google Scholar]
  19. Yu, H.L.; Wu, X.; Wu, Y.L.; Sun, X.J.; Du, W.N.; Yu, L.N. Effects of deep tillage on the characteristics of soil and grain yield in summer maize field. J. Maize Sci. 2019, 27, 99–105. [Google Scholar]
  20. Zhang, J.L.; Sikander, K.T.; Xue, J.; Zou, H.; Dong, X.M.; Li, K.; Bai, Y.S. Effects of different tillage systems on soil temperature and moisture in dryland field and summer maize yield. Acta Agric. Boreali-Occident. Sin. 2017, 26, 1446–1452. [Google Scholar]
  21. Li, Z.; Lai, X.F.; Yang, Q.; Yang, X.; Cui, S.; Shen, Y.Y. In search of long-term sustainable tillage and straw mulching practices for a maize-winter wheat-soybean rotation system in the Loess Plateau of China. Field Crops Res. 2018, 217, 199–210. [Google Scholar] [CrossRef]
  22. Han, Q.F.; Siddique, K.H.M.; Li, F.M. Adoption of conservation tillage on the semi-arid Loess Plateau of northwest China. Sustainability 2018, 10, 2621. [Google Scholar] [CrossRef]
  23. Feng, Q.Q.; Han, H.F.; Zhang, Y.Y.; Xu, J.; Cao, Y.Q.; Wang, S.B.; Ning, T.Y.; Li, Z.J. Effects of tillage methods on soil carbon sequestration and water holding capacity and yield in wheat–maize rotation. J. Plant Nutr. Fertil. 2018, 24, 869–879. [Google Scholar]
  24. He, J.H.; Wang, P.; Chen, J.; Wang, G.Y. Effects of different rotational tillage patterns on bulk density and moisture of soil and yield of spring maize (Zea Mays L.) in Arid Areas. Chin. J. Soil Sci. 2018, 49, 415–422. [Google Scholar]
  25. Wang, Y.F.; Li, Q.; Zhang, Y.F.; Fu, J.; Xue, Y.W.; Guo, W.; Yang, K.J. Effects of tillage on growth and water use of maize in Sanjiang Plain. J. Maize Sci. 2022, 30, 116–125. [Google Scholar]
  26. Wang, X.J.; Wang, G.Y.; Zhang, Y.W.; Cheng, J.F. Effects of agricultural machinery subsoiling on soil water storage and soil moisture conservation and maize yield in dryland area of Longdong. Farm Mach. 2016, 822, 103–105. [Google Scholar]
  27. Chen, S.Y. Effects of Subsoiling Depth on Soil Carbon and Nitrogen Dynamic Changes and Yield in Summer Maize Field. Master’s Thesis, Shandong Agricultural University, Tai’an, China, 2021. [Google Scholar]
  28. Yang, J.J.; Gai, H.; Zhang, M.X.; Cai, Y.R.; Wang, L.Y.; Wang, L.G. Effect of Subsoiling Combined with Straw Returning Measure on Pore Structure of Black Soil. Sci. Agric. Sin. 2023, 56, 892–906. [Google Scholar]
  29. Pittelkow, C.M.; Liang, X.Q.; Linquist, B.A.; van Groenigen, K.J.; Lee, J.; Lundy, M.E.; van Gestel, N.; Six, J.; Venterea, R.T.; van Kessel, C. Productivity limits and potentials of the principles of conservation agriculture. Nature 2015, 517, 365–368. [Google Scholar] [CrossRef]
  30. Zhao, Y.X.; Lu, J.Y.; Yang, H.M. Effect of conservation tillage on weeds in a rotation system on the Loess Plateau of eastern Gansu, Northwest China. Chin. J. Appl. Ecol. 2015, 26, 1223–1230. [Google Scholar]
  31. O’Kelly, B.C. Accurate determination of moisture content of organic soils using the oven drying method. Dry. Technol. 2004, 22, 1767–1776. [Google Scholar] [CrossRef]
  32. Peng, Z.K.; Wang, L.L.; Xie, J.H.; Li, L.L.; Coulter, J.A.; Zhang, R.Z.; Luo, Z.Z.; Cai, L.Q.; Carberry, P.; Whitbread, A. Conservation tillage increases yield and precipitation use efficiency of wheat on the semi-arid Loess Plateau of China. Agric. Water Manag. 2020, 231, 106024. [Google Scholar] [CrossRef]
  33. Zhang, G.S.; Chan, K.Y.; Li, G.D.; Huang, G.B. Effect of straw and plastic film management under contrasting tillage practices on the physical properties of an erodible loess soil. Soil Tillage Res. 2008, 98, 113–119. [Google Scholar] [CrossRef]
  34. Liu, Z.J.; Meng, Y.; Cai, M.; Zhou, J.B. Coupled effects of mulching and nitrogen fertilization on crop yield, residual soil nitrate, and water use efficiency of summer maize in the Chinese Loess Plateau. Environ. Sci. Pollut. Res. 2017, 24, 25849–25860. [Google Scholar] [CrossRef]
  35. Daamen, C.C.; Simmonds, L.P.; Wallace, J.S.; Laryea, K.B.; Sivakumar, M.V.K. Use of microlysimeters to measure evaporation from sandy soils. Agric. For. Meteorol. 1993, 65, 159–173. [Google Scholar] [CrossRef]
  36. Peng, Z.K.; Wang, L.L.; Xie, J.H.; Li, L.L.; Coulter, J.A.; Zhang, R.Z.; Luo, Z.Z.; Kholova, J.; Choudhary, S. Conservation tillage increases water use efficiency of spring wheat by optimizing water transfer in a semi-arid environment. Agronomy 2019, 9, 583. [Google Scholar] [CrossRef]
  37. Wang, L.L.; Palta, J.A.; Chen, W.; Chen, Y.L.; Deng, X.P. Nitrogen fertilization improved water-use efficiency of winter wheat through increasing water use during vegetative rather than grain filling. Agric. Water Manag. 2018, 197, 41–53. [Google Scholar] [CrossRef]
  38. Wang, S.L.; Wang, H.; Hafeez, M.B.; Zhang, Q.; Yu, Q.; Wang, X.L.; Li, J. No-tillage and subsoiling increased maize yields and soil water storage under varied rainfall distribution: A 9-year site-specific study in a semi-arid environment. Field Crops Res. 2020, 255, 107867. [Google Scholar] [CrossRef]
  39. Zhang, P.; Wei, T.; Jia, Z.K.; Han, Q.F.; Ren, X.L. Soil aggregate and crop yield changes with different rates of straw incorporation in semiarid areas of northwest China. Geoderma 2014, 230, 41–49. [Google Scholar] [CrossRef]
  40. Peng, Z.K.; Li, L.L.; Xie, J.H.; Deng, C.C.; Essel, E.; Wang, J.B.; Xie, J.H.; Shen, J.C.; Kang, C.R. Effects of different tillage practices on water consumption structure and water use efficiency during crop growth period in Arid farmland. J. Soil Water Conserv. 2018, 32, 214–221. [Google Scholar]
  41. Dai, Z.J.; Hu, J.S.; Fan, J.; Fu, W.; Wang, H.; Hao, M.D. No-tillage with mulching improves maize yield in dryland farming through regulating soil temperature, water and nitrate-N. Agric. Ecosyst. Environ. 2021, 309, 107288. [Google Scholar] [CrossRef]
  42. Li, H.Y.; Zhang, Y.H.; Sun, Y.G.; Zhang, Q.; Liu, P.Z.; Wang, X.L.; Li, J.; Wang, R. No-tillage with straw mulching improved grain yield by reducing soil water evaporation in the fallow period: A 12-year study on the Loess Plateau. Soil Tillage Res. 2022, 224, 105504. [Google Scholar] [CrossRef]
  43. Liu, E.K.; Teclemariam, S.G.; Yan, C.R.; Yu, J.M.; Gu, R.S.; Liu, S.; He, W.Q.; Liu, Q. Long-term effects of no-tillage management practice on soil organic carbon and its fractions in the northern China. Geoderma 2014, 213, 379–384. [Google Scholar] [CrossRef]
  44. Cui, W.Q.; Zhao, J.; Yang, X.G. Effects of four conservation tillage on soil hydrothermal environment during maize growing season in Northeast China: A meta-analysis. J. China Agric. Univ. 2022, 27, 24–34. [Google Scholar]
  45. Wang, L.X.; Gao, Y.Y.; Qu, M.Y.; Wang, X.Y. Effects of maize straw and stubble mulch on soil moisture and temperature in soybean field. J. Irrig. Drain. 2015, 34, 66–69. [Google Scholar]
  46. Zheng, H.B. Effects of Tillage Methods on the Soil Properties and Maize Growth. Ph.D. Thesis, Shenyang Agricultural University, Shenyang, China, 2018. [Google Scholar]
  47. Zhang, H.B.; Hu, J.; Liu, C.X. Study on the effect of different maize straw returning methods on soil temperature before sowing. China South. Agric. Mach. 2020, 51, 1–2. [Google Scholar]
  48. Yin, B.Z.; Hu, Z.H.; Wang, Y.D.; Zhao, J.; Pan, Z.H.; Zhen, W.C. Effects of optimized subsoiling tillage on field water conservation and summer maize (Zea mays L.) yield in the North China Plain. Agric. Water Manag. 2021, 247, 106732. [Google Scholar] [CrossRef]
  49. Getahun, G.T.; Kätterer, T.; Munkholm, L.J.; Rychel, K.; Kirchmann, H. Effects of loosening combined with straw incorporation into the upper subsoil on soil properties and crop yield in a three-year field experiment. Soil Tillage Res. 2022, 223, 105466. [Google Scholar] [CrossRef]
  50. Kuang, N.K.; Ma, Y.Z.; Hong, S.Z.; Jiao, F.L.; Liu, C.Y.; Li, Q.Q.; Han, H.F. Simulation of soil moisture dynamics, evapotranspiration, and water drainage of summer maize in response to different depths of subsoiling with RZWQM2. Agric. Water Manag. 2021, 249, 106794. [Google Scholar] [CrossRef]
  51. Dai, X.Q.; Li, Y.S.; Ouyang, Z.; Wang, H.M.; Wilson, G.V. Organic manure as an alternative to crop residues for no-tillage wheat–maize systems in North China Plain. Field Crops Res. 2013, 149, 141–148. [Google Scholar] [CrossRef]
  52. Liu, J.; Li, L.L.; Xie, J.H.; Deng, C.C.; Peng, Z.K.; Stephen, Y.; Shirley, L. Soil total organic carbon and its light fractions in response to 14 years of conservation tillage. Agric. Res. Arid. Areas 2017, 35, 8–13. [Google Scholar]
  53. Rawls, W.J.; Pachepsky, Y.A.; Ritchie, J.C.; Sobecki, T.M.; Bloodworth, H. Effect of soil organic carbon on soil water retention. Geoderma 2003, 116, 61–76. [Google Scholar] [CrossRef]
  54. Liu, Z.; Ma, F.Y.; Hu, T.X.; Zhao, K.G.; Gao, T.P.; Zhao, H.X.; Ning, T.Y. Using stable isotopes to quantify water uptake from different soil layers and water use efficiency of wheat under long-term tillage and straw return practices. Agric. Water Manag. 2020, 229, 105933. [Google Scholar] [CrossRef]
  55. Liu, X.; Peng, C.; Zhang, W.J.; Li, S.Y.; An, T.T.; Xu, Y.D.; Ge, Z.; Xie, N.H.; Wang, J.K. Subsoiling tillage with straw incorporation improves soil microbial community characteristics in the whole cultivated layers: A one-year study. Soil Tillage Res. 2022, 215, 105188. [Google Scholar] [CrossRef]
  56. Tao, Z.Q.; Li, C.F.; Li, J.J.; Ding, Z.S.; Xu, J.; Sun, X.F.; Zhou, P.L.; Zhao, M. Tillage and straw mulching impacts on grain yield and water use efficiency of spring maize in Northern Huang–Huai–Hai Valley. Crop J. 2015, 3, 445–450. [Google Scholar] [CrossRef]
  57. Liu, L.; Zhang, L.; Liu, J.; Fu, Q.; Xu, Q.; Idimesheva, O. Soil water and temperature characteristics under different straw mulching and tillage measures in the black soil region of China. J. Soil Water Conserv. 2021, 76, 256–262. [Google Scholar] [CrossRef]
  58. Li, Z.; Yang, X.; Cui, S.; Yang, Q.; Yang, X.L.; Li, J.C.; Shen, Y.Y. Developing sustainable cropping systems by integrating crop rotation with conservation tillage practices on the Loess Plateau, a long-term imperative. Field Crops Res. 2018, 222, 164–179. [Google Scholar] [CrossRef]
  59. Pramanick, B.; Kumar, M.; Naik, B.M.; Kumar, M.; Singh, S.K.; Maitra, S.; Naik, B.S.S.S.; Rajput, V.D.; Minkina, T. Long-term conservation tillage and precision nutrient management in maize–wheat cropping system: Effect on soil properties, crop production, and economics. Agronomy 2022, 12, 2766. [Google Scholar] [CrossRef]
  60. Memon, S.Q.; Mirjat, M.S.; Mughal, A.Q.; Amjad, N. Effect of conventional and non-conventional tillage practices on maize production. Pak. J. Agri. Agril. Engg. Vet. Sci. 2013, 29, 155–163. [Google Scholar]
  61. Ren, B.Z.; Li, X.; Dong, S.T.; Liu, P.; Zhao, B.; Zhang, J.W. Soil physical properties and maize root growth under different tillage systems in the North China Plain. Crop J. 2018, 6, 669–676. [Google Scholar] [CrossRef]
  62. Shao, Y.H.; Xie, Y.X.; Wang, C.Y.; Yue, J.Q.; Yao, Y.Q.; Li, X.D.; Liu, W.X.; Zhu, Y.J.; Guo, T.C. Effects of different soil conservation tillage approaches on soil nutrients, water use and wheat-maize yield in rainfed dry-land regions of North China. Eur. J. Agron. 2016, 81, 37–45. [Google Scholar] [CrossRef]
  63. Wang, C.B.; Wen, M.J.; Yang, S.C.; Huo, L.; Jiang, W.L. Effects of different tillage practices on physical characteristics of irrigated sierozem soil and maize yield. Agric. Res. Arid. Areas 2022, 40, 170–177. [Google Scholar]
Figure 1. Location of experimental site.
Water 15 03243 g001
Figure 2. Monthly total precipitation for October through September in 2020–2021, 2021–2022, and the 1981–2010 average at the study area.
Water 15 03243 g002
Figure 3. Effects of tillage practices on soil volumetric water content in the 0–200 cm soil layer before sowing of maize in 2021 (A) and 2022 (E), V12 in 2021 (B) and 2022 (F), R2 in 2021 (C) and 2022 (G), after maize harvest in 2021 (D) and 2022 (H). T, conventional tillage with no straw; TS, conventional tillage with straw incorporated; SST, subsoiling tillage with no straw; SSTS, subsoiling tillage with straw incorporated; NT, no-till with no straw; NTS, no-till with straw cover. The short line in the figure is LSD bar (p ≤ 0.05).
Water 15 03243 g003
Figure 4. Effect of tillage practices on soil temperature in the 5, 10, 15, 20, 25 cm soil layers at 8:00 a.m. of V12 in 2021 (A) and 2022 (I), at 14:00 p.m. of V12 in 2021 (B) and 2022 (J), at 18:00 p.m. of V12 in 2021 (C) and 2022 (K), daily average of V12 in 2021 (D) and 2022 (L), at 8:00 a.m. of R2 in 2021 (E) and 2022 (M), at 14:00 p.m. of R2 in 2021 (F) and 2022 (N), at 18:00 p.m. of R2 in 2021 (G) and 2022 (O), daily average of R2 in 2021 (H) and 2022 (P). T, conventional tillage with no straw; TS, conventional tillage with straw incorporated; SST, subsoiling tillage with no straw; SSTS, subsoiling tillage with straw incorporated; NT, no-till with no straw; NTS, no-till with straw cover. The short line in the figure is LSD bar (p ≤ 0.05).
Water 15 03243 g004
Table 1. Experiment design and description.
Tillage PracticesAbbreviationsDescription
Conventional tillage with no strawTThe straw was being moved out of the plot in early October, and the tillage was harrowed once before the maize was sown in early April of the next year, with a depth of about 30 cm; the maize sown date is mid to late April.
Conventional tillage with straw incorporatedTSThe treatment was the same as T, except the straw was chopped into about 5 cm and returned to plots after the previous crop (maize) was harvested in early October.
Subsoiling tillage with no strawSSTThe treatment included that the straw was moved out of the plot after harvest in early October, and deep ploughing and shallow rotary harrowing were performed once before the maize was sown in early April; the tillage depth was about 30 cm.
Subsoiling tillage with straw incorporatedSSTSThe treatment was the same as SST, except all straws were retained in plots, chopped into about 5 cm after harvest in early October.
No-till with no strawNTThe treatment had all aboveground crop residues removed after harvest in early October, and no tillage operations throughout the trial period.
No-till with straw coverNTSThe treatment was the same as NT, except that all residues from the previous crop (maize) were retained, chopped into about 5 cm, after harvest in early October.
Table 2. Effects of different tillage practices on the water consumption structure of maize during the growth period in 2021 and 2022 a.
YearTillage
Practice b
SWSb
(mm)
SWSh
(mm)
Pc
(mm)
ETc
(mm)
Ec
(mm)
Tc
(mm)
2021T302.95219.34 ab c330.7414.31 ab70.40 a343.90 b
TS302.95213.33 ab330.7420.32 ab57.41 b362.91 a
SST302.95202.72 b330.7430.93 a70.41 a360.51 a
SSTS302.95216.77 ab330.7416.88 ab53.72 b363.16 a
NT302.95208.82 b330.7424.83 a70.38 a354.45 ab
NTS302.95226.65 a330.7407.00 b59.15 b347.85 ab
2022T377.73 ab309.85 bc359.5427.38 b265.04 a162.34 c
TS370.19 b332.46 a359.5397.22 c236.79 b160.43 c
SST392.43 a334.59 a359.5417.34 bc230.70 b186.65 bc
SSTS394.26 a333.41 a359.5420.35 bc210.76 c209.59 b
NT386.66 ab321.21 ab359.5424.95 b239.10 b185.86 bc
NTS393.33 a297.12 c359.5455.71 a197.98 d257.73 a
Source of variance
Year (Y) **** NS****
Tillage (T) **NS *****
Straw (S) NSNS NS****
Y × T **** ******
Y × S NSNS NS****
T × S NSNS NSNSNS
Y × T × S NS** *****
a SWSb, soil water storage before sowing; SWSh, soil water storage after harvest; Pc, precipitation during the maize growing season; ETc, evapotranspiration during the maize growing season; Ec, evaporation during the maize growing season; Tc, transpiration during the maize growing season. b T, conventional tillage with no straw; TS, conventional tillage with straw incorporated; SST, subsoiling tillage with no straw; SSTS, subsoiling tillage with straw incorporated; NT, no-till with no straw; NTS, no-till with straw cover. c Within a column for a given year, means followed by different letters are significantly different (p ≤ 0.05). * and ** are significant at p ≤ 0.05 and 0.01, respectively; NS, no significant difference.
Table 3. Effects of different tillage practices on yield and yield components of maize in 2021 and 2022 a.
YearTillage
Practice b
Ear No.
per Area
Grain No. per EarHGW
(g)
GY
(kg ha−1)
WUE
(kg ha−1 mm−1)
BY
(kg ha−1)
HI
(%)
2021T4697 ab c511 c45.06 ab6751.78 b16.30 b18,280.87 b0.37 a
TS4914 a532 bc45.45 a6730.06 b16.01 b18,522.24 b0.36 a
SST4914 a543 ab43.20 b7078.93 a16.44 b24,148.36 a0.29 bc
SSTS4480 b564 a44.78 ab7169.64 a17.20 a25,804.02 a0.28 c
NT4698 ab459 d45.46 a5425.47 c12.77 c15,040.40 c0.36 a
NTS4480 b470 d39.58 c5042.37 d12.39 c14,960.90 c0.34 ab
2022T4311 ab475 c27.84 abc5764.16 c13.51 b14,551.12 c0.40 ab
TS4353 ab526 b28.70 ab5820.82 c14.67 ab15,419.73 c0.38 b
SST4442 a554 b31.36 a6160.66 b14.78 a18,870.80 b0.33 c
SSTS4435 a660 a31.38 a6556.28 a15.59 a22,340.72 a0.29 d
NT4179 b383 d22.23 c3297.59 d7.78 c8820.93 d0.37 b
NTS4273 ab473 c23.78 bc3569.27 d7.83 c8754.10 d0.41 a
Source of variance
Year (Y) **NS**********
Tillage (T) **************
Straw (S) NS**NSNSNS*NS
Y × T NS*********NS
Y × S ***NS**NSNSNS
T × S **NSNSNSNS*NS
Y × T × S **NSNSNSNSNSNS
a HGW, hundred-grain weight; GY, grain yield; WUE, water use efficiency of grain yield; BY, biomass yield; HI, harvest index. b T, conventional tillage with no straw; TS, conventional tillage with straw incorporated; SST, subsoiling tillage with no straw; SSTS, subsoiling tillage with straw incorporated; NT, no-till with no straw; NTS, no-till with straw cover. c Within a column for a given year, means followed by different letters are significantly different (p ≤ 0.05). * and ** are significant at p ≤ 0.05 and 0.01, respectively; NS, no significant difference.
Table 4. Correlation analysis of soil water content, temperature and yield, yield components and harvest index a.
Index bEar No. per AreaGrain No. per EarHGWGYBYHI
SW1−0.2620.2490.133−0.0420.133−0.241
SW20.3100.3100.706 **0.633 **0.434−0.064
SW3−0.013−0.0570.037−0.194−0.095−0.068
SW4−0.162−0.026−0.290−0.141−0.2120.310
ST1−0.188−0.379−0.533 *−0.458−0.3940.233
ST2−0.310−0.734 **−0.492 *−0.644 **−0.634 **0.448
a HGW, hundred-grain weight; GY, grain yield; BY, biomass yield; HI, harvest index. b SW1, soil volumetric water content before sowing; SW2, soil volumetric water content at V12; SW3, soil volumetric water content at R2; SW4, soil volumetric water content after harvest; ST1, daily average soil temperature at V12; ST2, daily average soil temperature at R2. Correlation coefficients followed by * and ** are significant at p ≤ 0.05 and 0.01, respectively.
Table 5. Effects of different tillage practices on economic benefits of maize planting in 2021 and 2022.
Tillage Practices aType of Input (CNY/hm2)Total InputType of Earnings (CNY/hm2)Ratio of Output to Input
YearSeedsFertilizerPesticideLaborMachineryGrain BenefitNet Benefit
2021T17402971150480090010,56117,555 b b6994 b1.66 b
TS17402971150480090010,56117,498 b6937 b1.66 b
SST17402971150480090010,56118,405 a7844 a1.74 a
SSTS17402971150480090010,56118,641 a8080 a1.77 a
NT1740297115048000966114,106 c4445 c1.46 c
NTS1740297115048000966113,110 d3449 d1.36 d
2022T18853075150480090010,81014,987 c4176 c1.39 c
TS18853075150480090010,81015,134 c4324 c1.40 c
SST18853075150480090010,81016,018 b5208 b1.48 b
SSTS18853075150480090010,81017,046 a6236 a1.58 a
NT188530751504800099108574 d−1336 d0.87 d
NTS188530751504800099109280 d−630 d0.94 d
In 2021, seeds 60 CNY/bag, urea 120 CNY/bag, superphosphate 60 CNY/bag, herbicide, 10 CNY/bottle. Labor, 80 CNY/person/day; the whole planting, management, and harvesting process requires 6 person-times/667 m2. In 2022, seeds 65 CNY/bag, urea 110 CNY/bag, superphosphate 70 CNY/bag, herbicide, 10 CNY/bottle. Labor, 80 CNY/person/day; the whole planting, management, and harvesting process requires 6 person-times/667 m2. a T, conventional tillage with no straw; TS, conventional tillage with straw incorporated; SST, subsoiling tillage with no straw; SSTS, subsoiling tillage with straw incorporated; NT, no-till with no straw; NTS, no-till with straw cover. b Within a column for a given year, means followed by different letters are significantly different (p ≤ 0.05).
Disclaimer/Publisher’s Note: The statements, opinions and data contained in all publications are solely those of the individual author(s) and contributor(s) and not of MDPI and/or the editor(s). MDPI and/or the editor(s) disclaim responsibility for any injury to people or property resulting from any ideas, methods, instructions or products referred to in the content.

