Subgrid Model of Fluid Force Acting on Buildings for Three-Dimensional Flood Inundation Simulations
Abstract
:1. Introduction
2. Materials and Methods
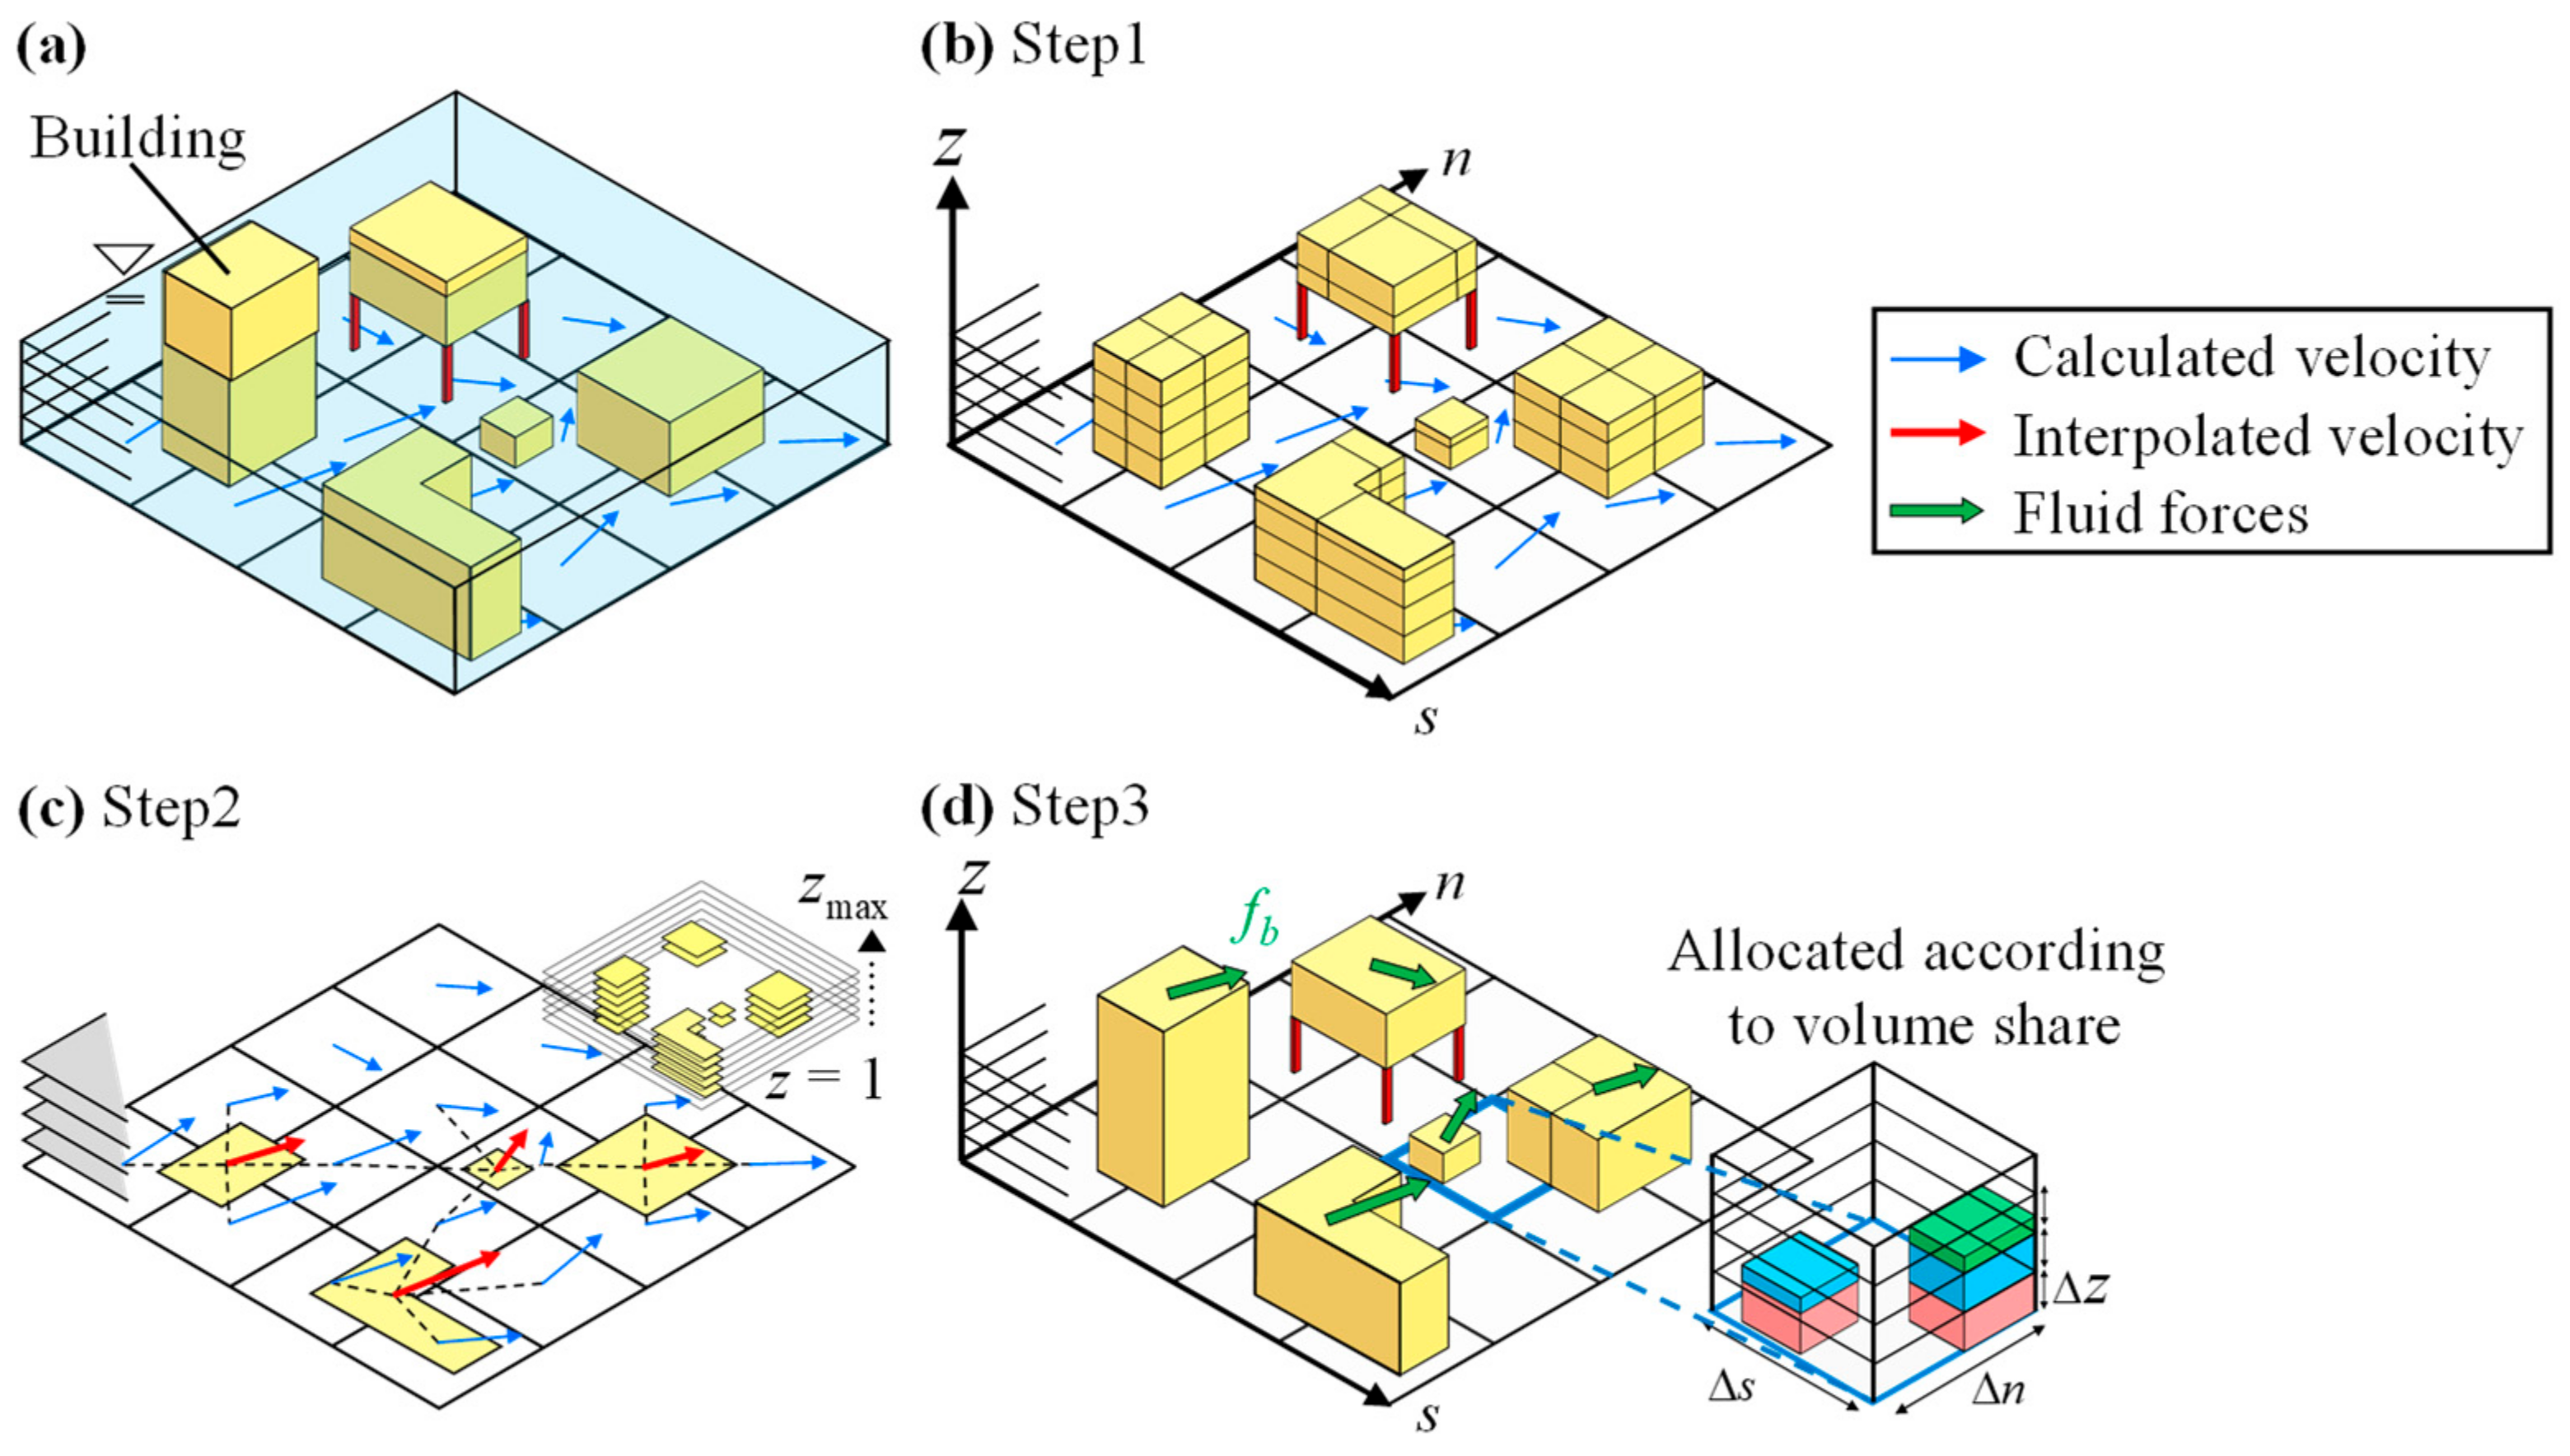
2.1. Fundamental Concept of SG Model for Building Fluid Force
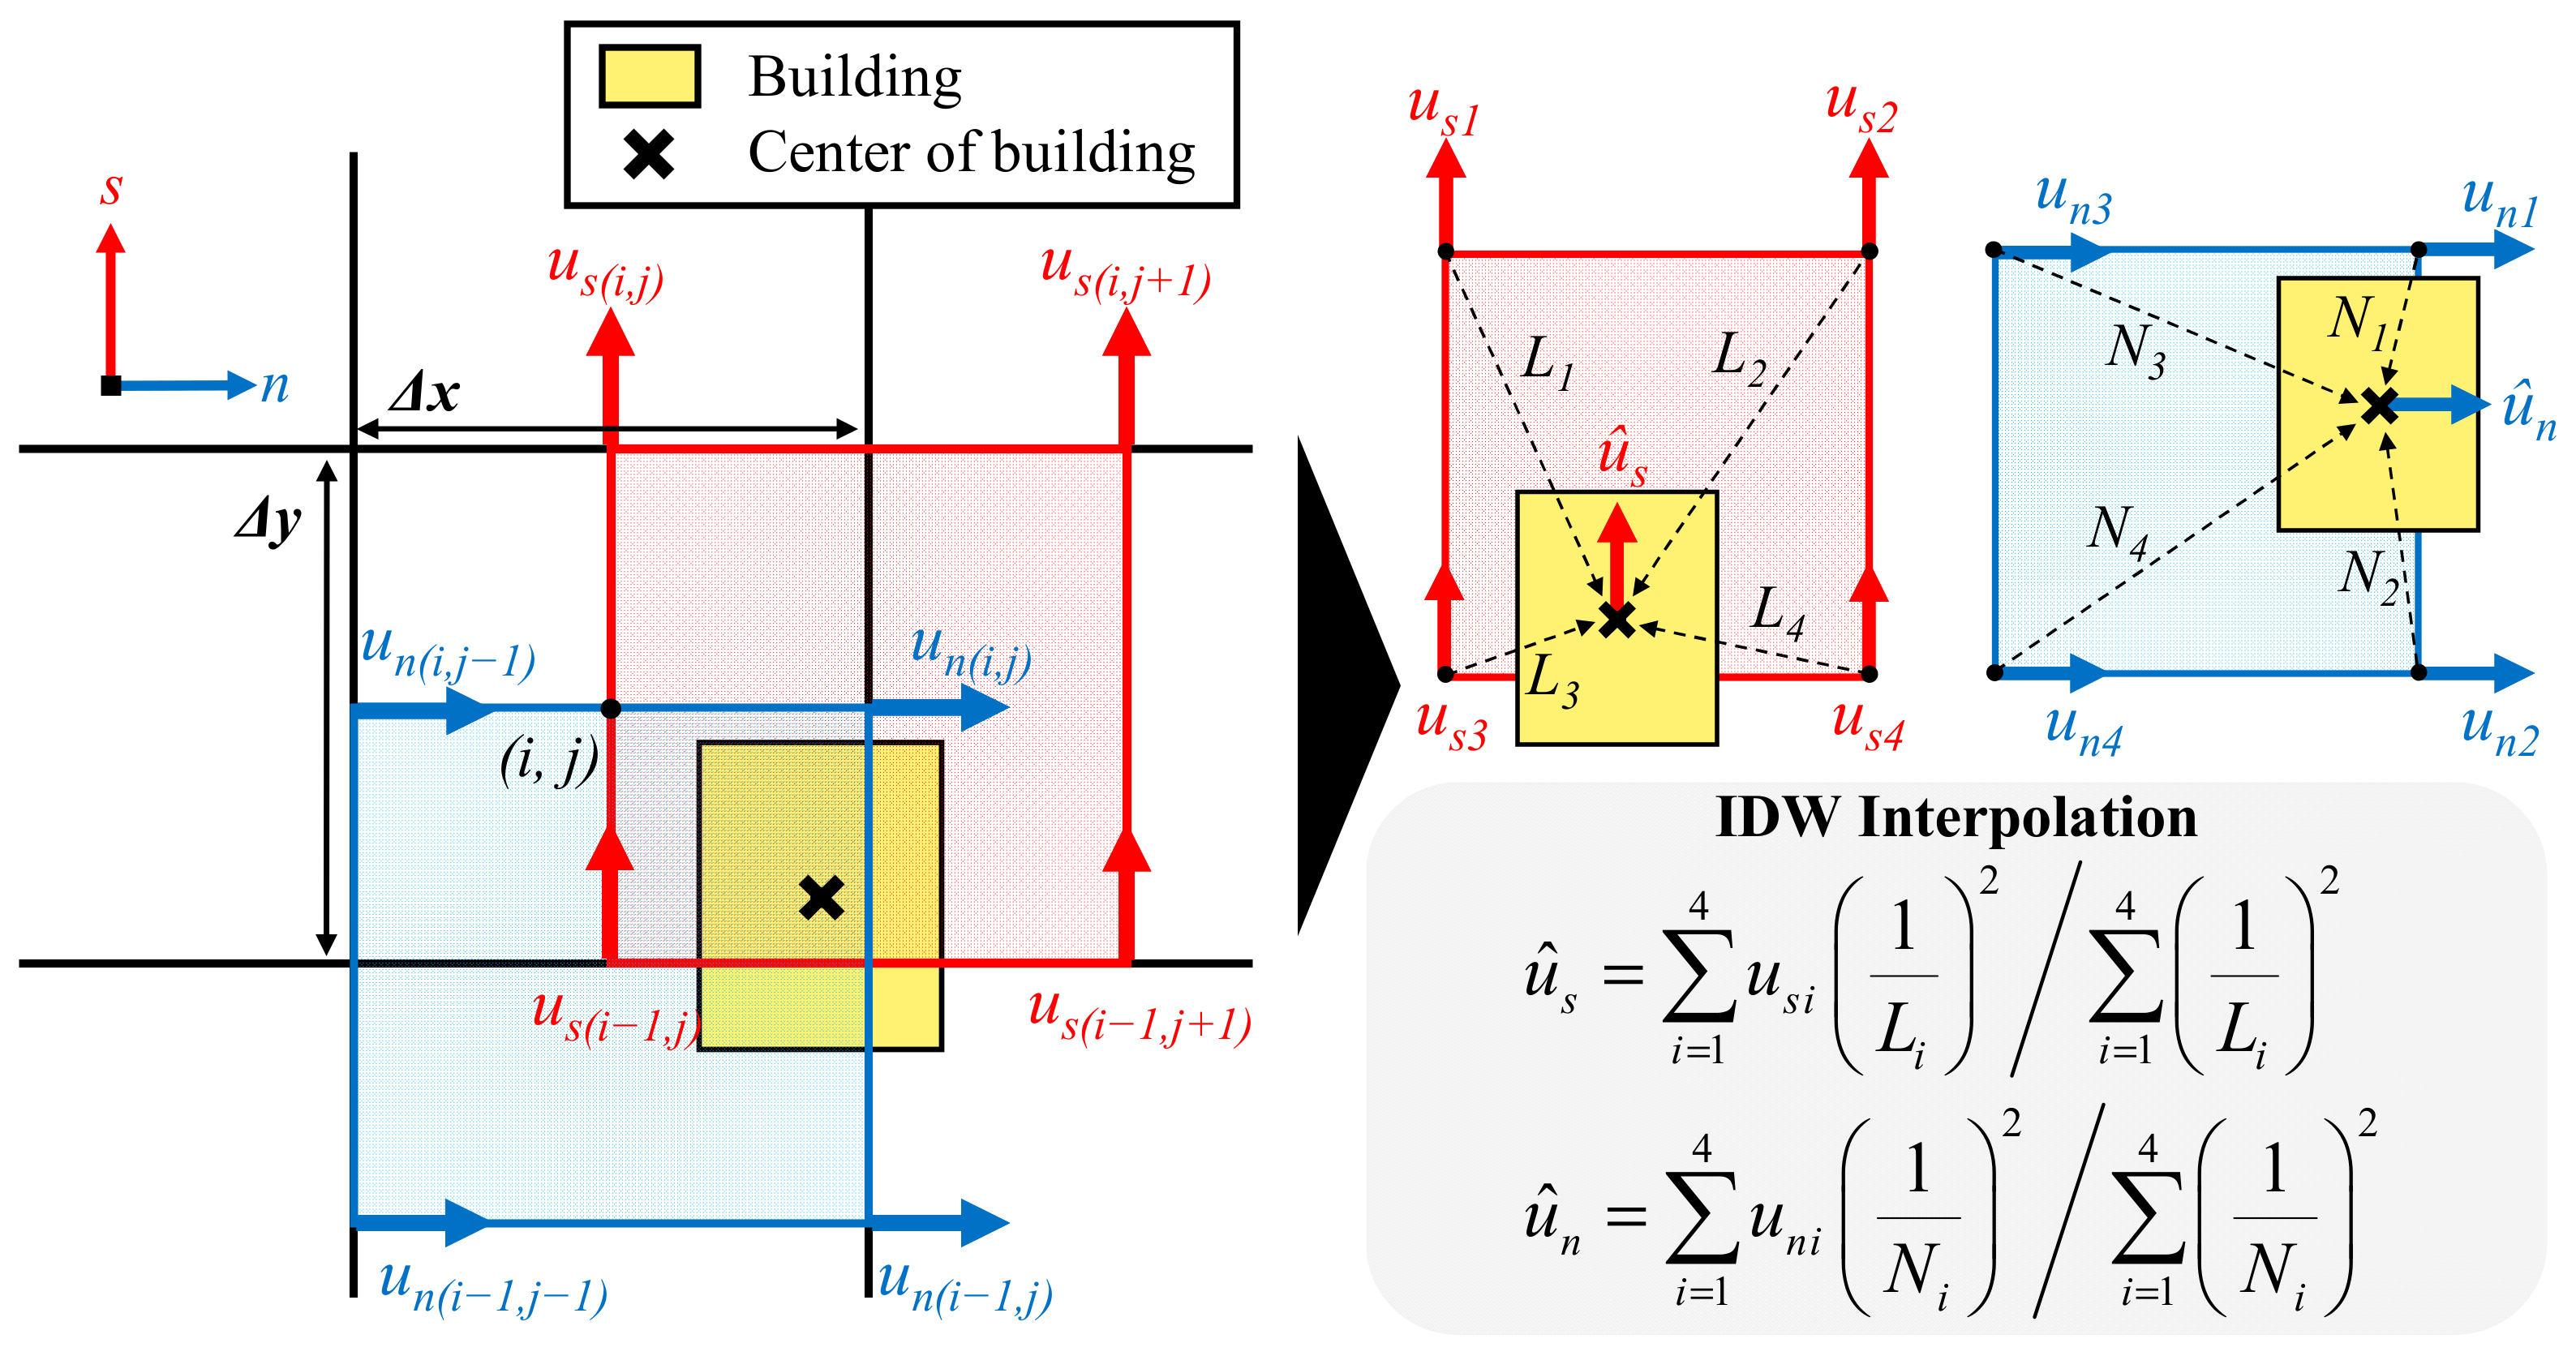
2.2. Fundamental Equations of SG Model
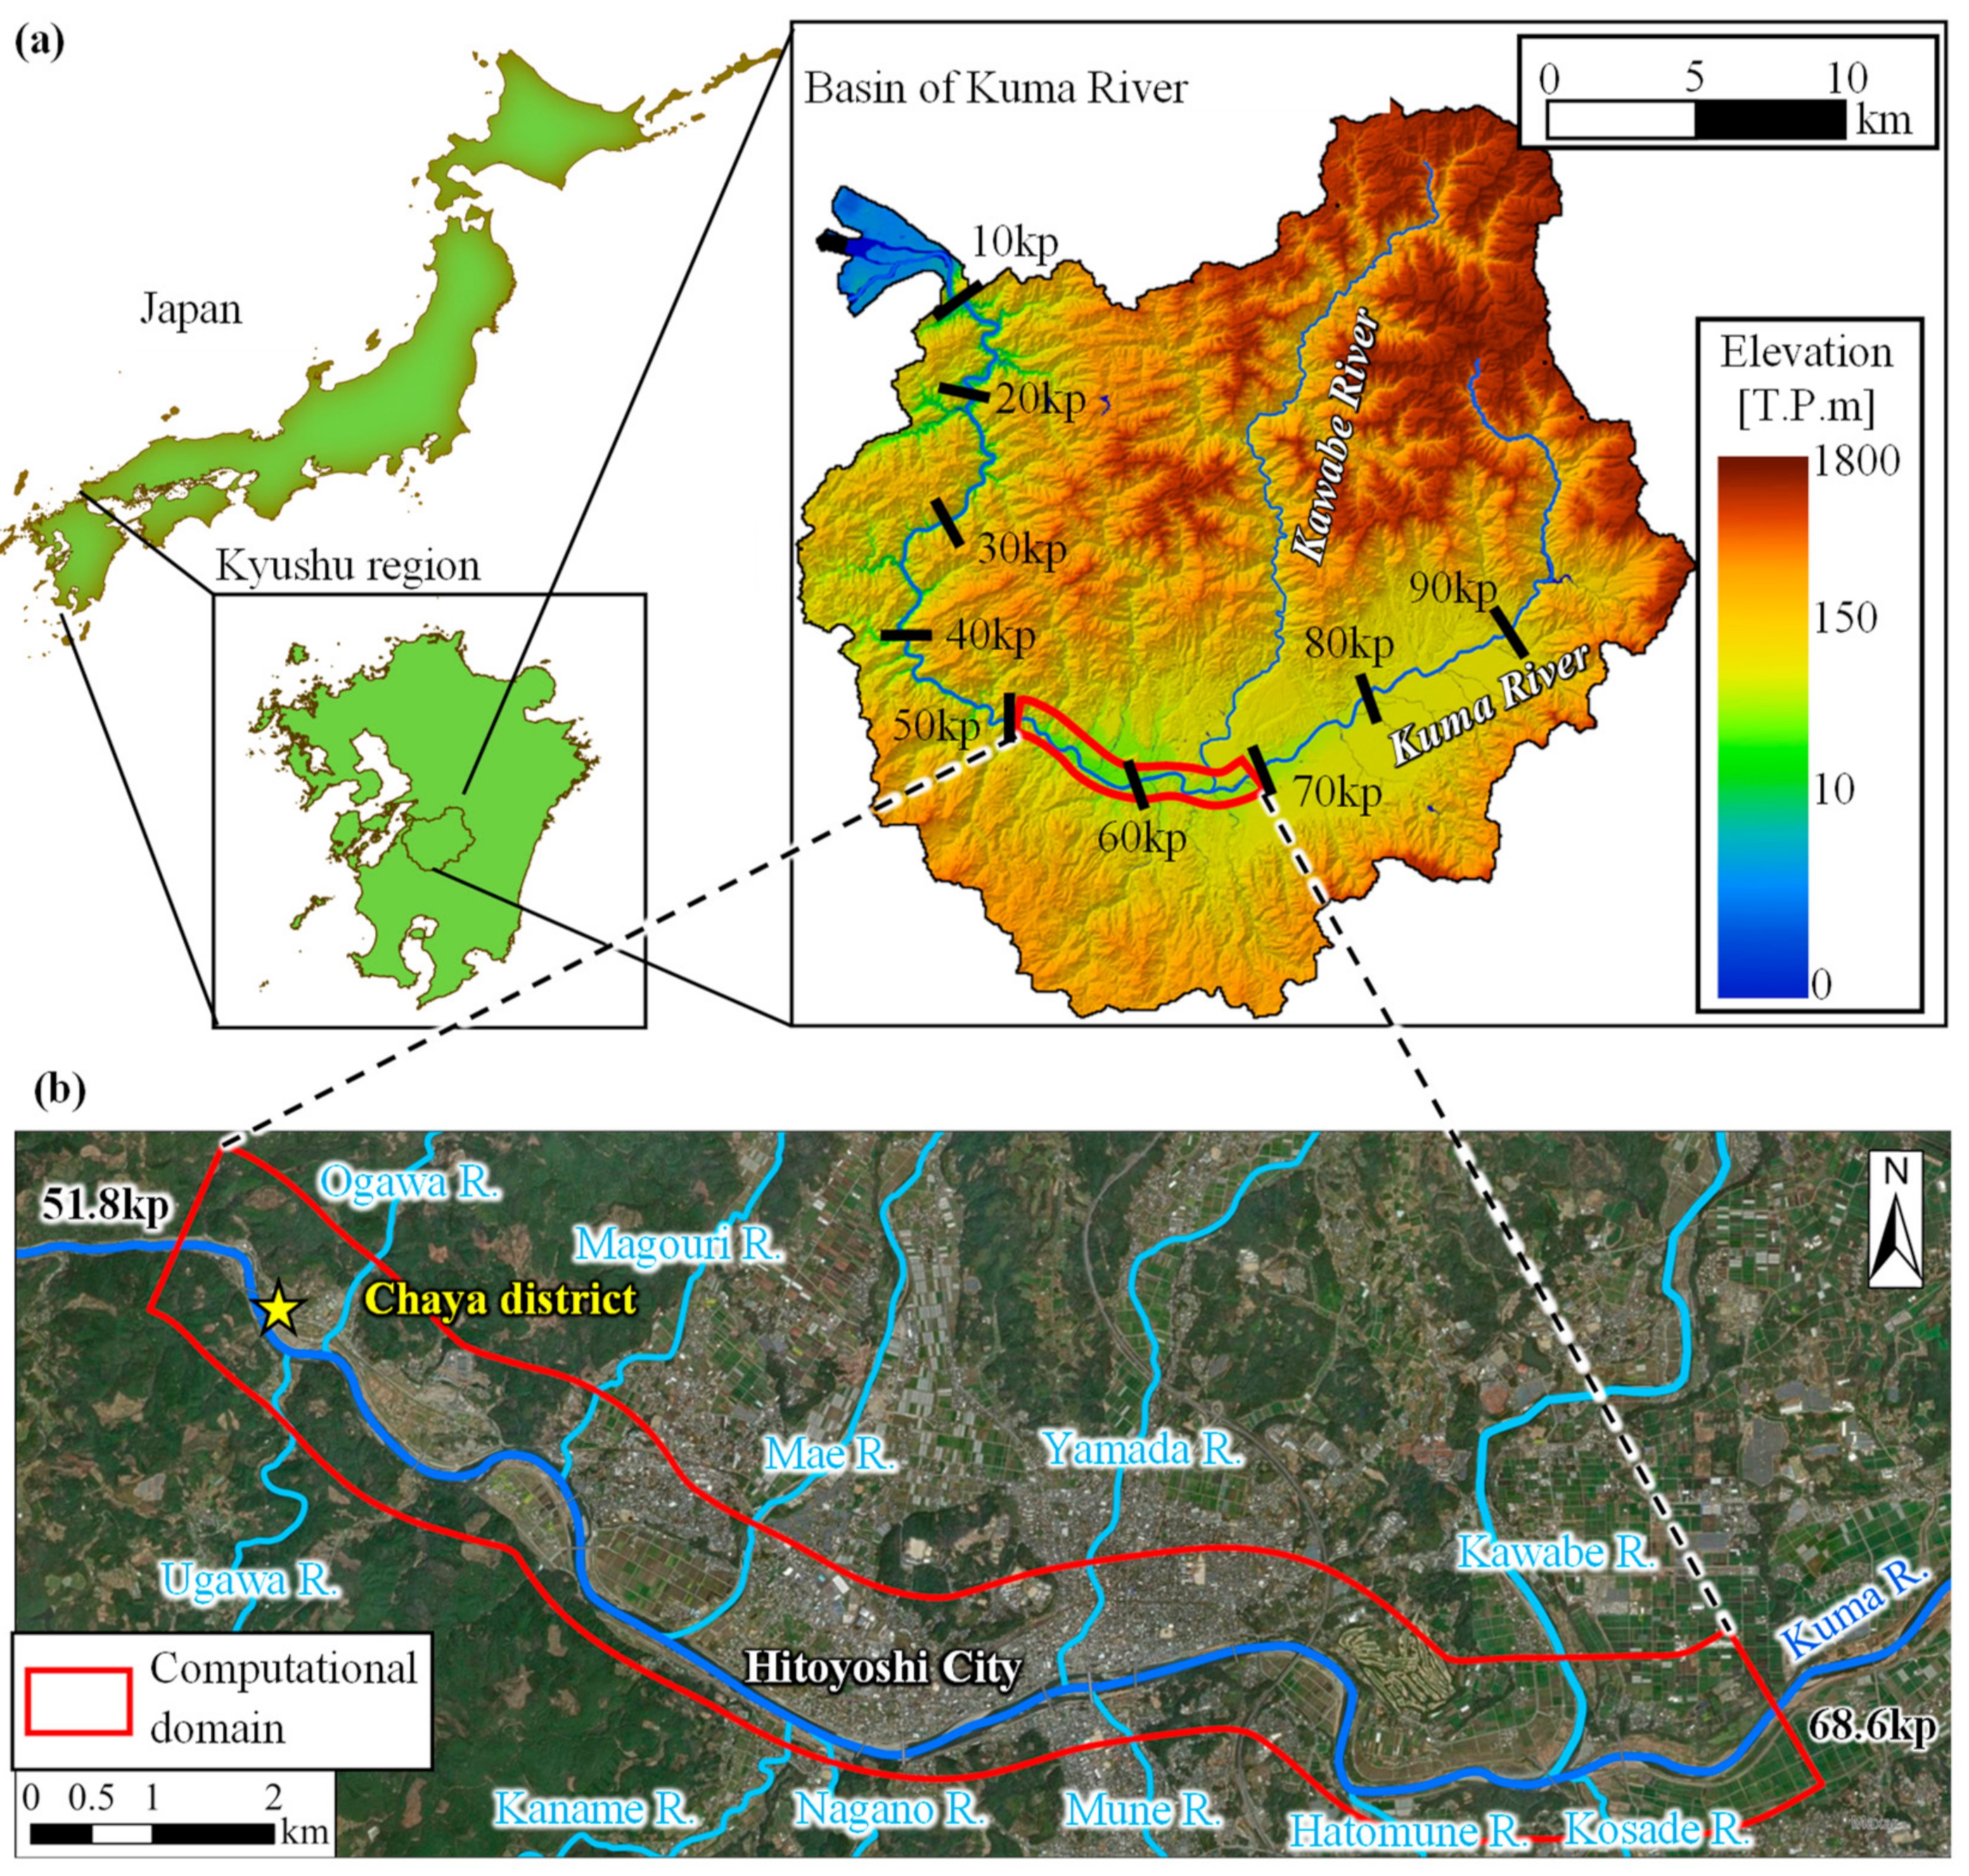
2.3. Study Site
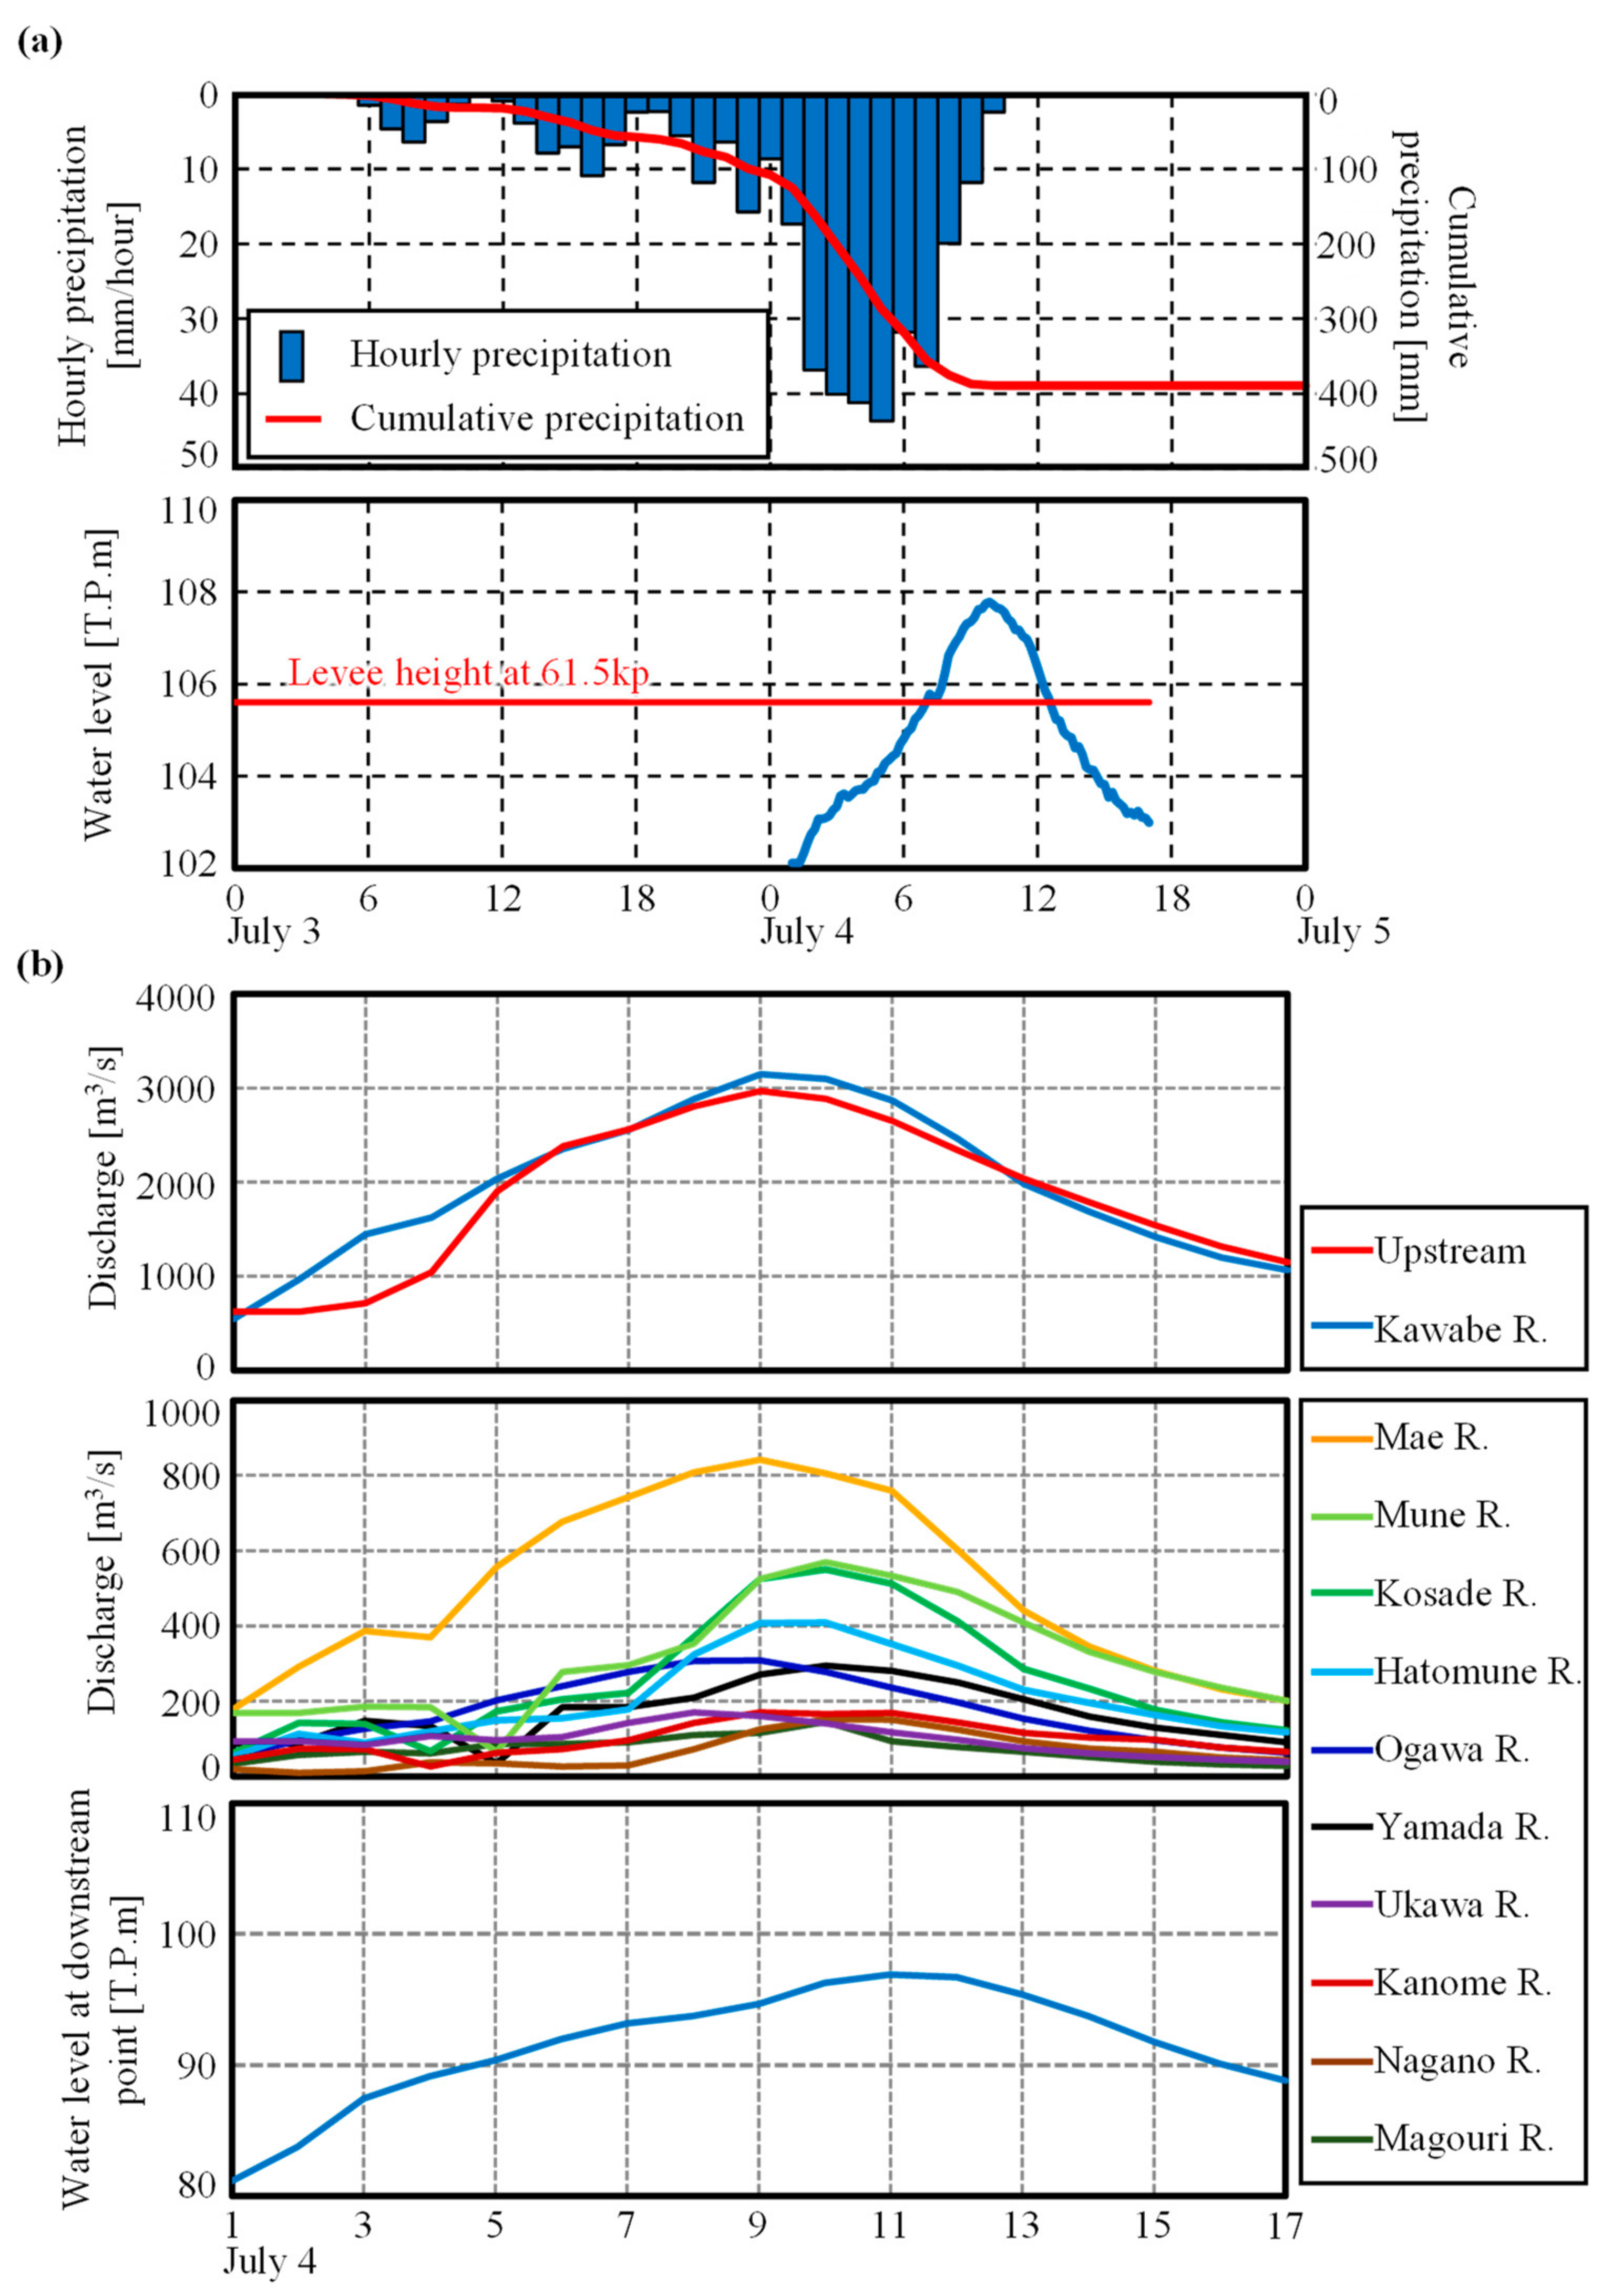
2.4. Computational Conditions
3. Results and Discussion
3.1. Validation of Hy2-3D Model
3.2. Horizontal Map of Velocity Distribution
3.3. Vertical Distribution of Streamwise Velocity
3.4. Hydraulic Factors of Building Damage
4. Conclusions
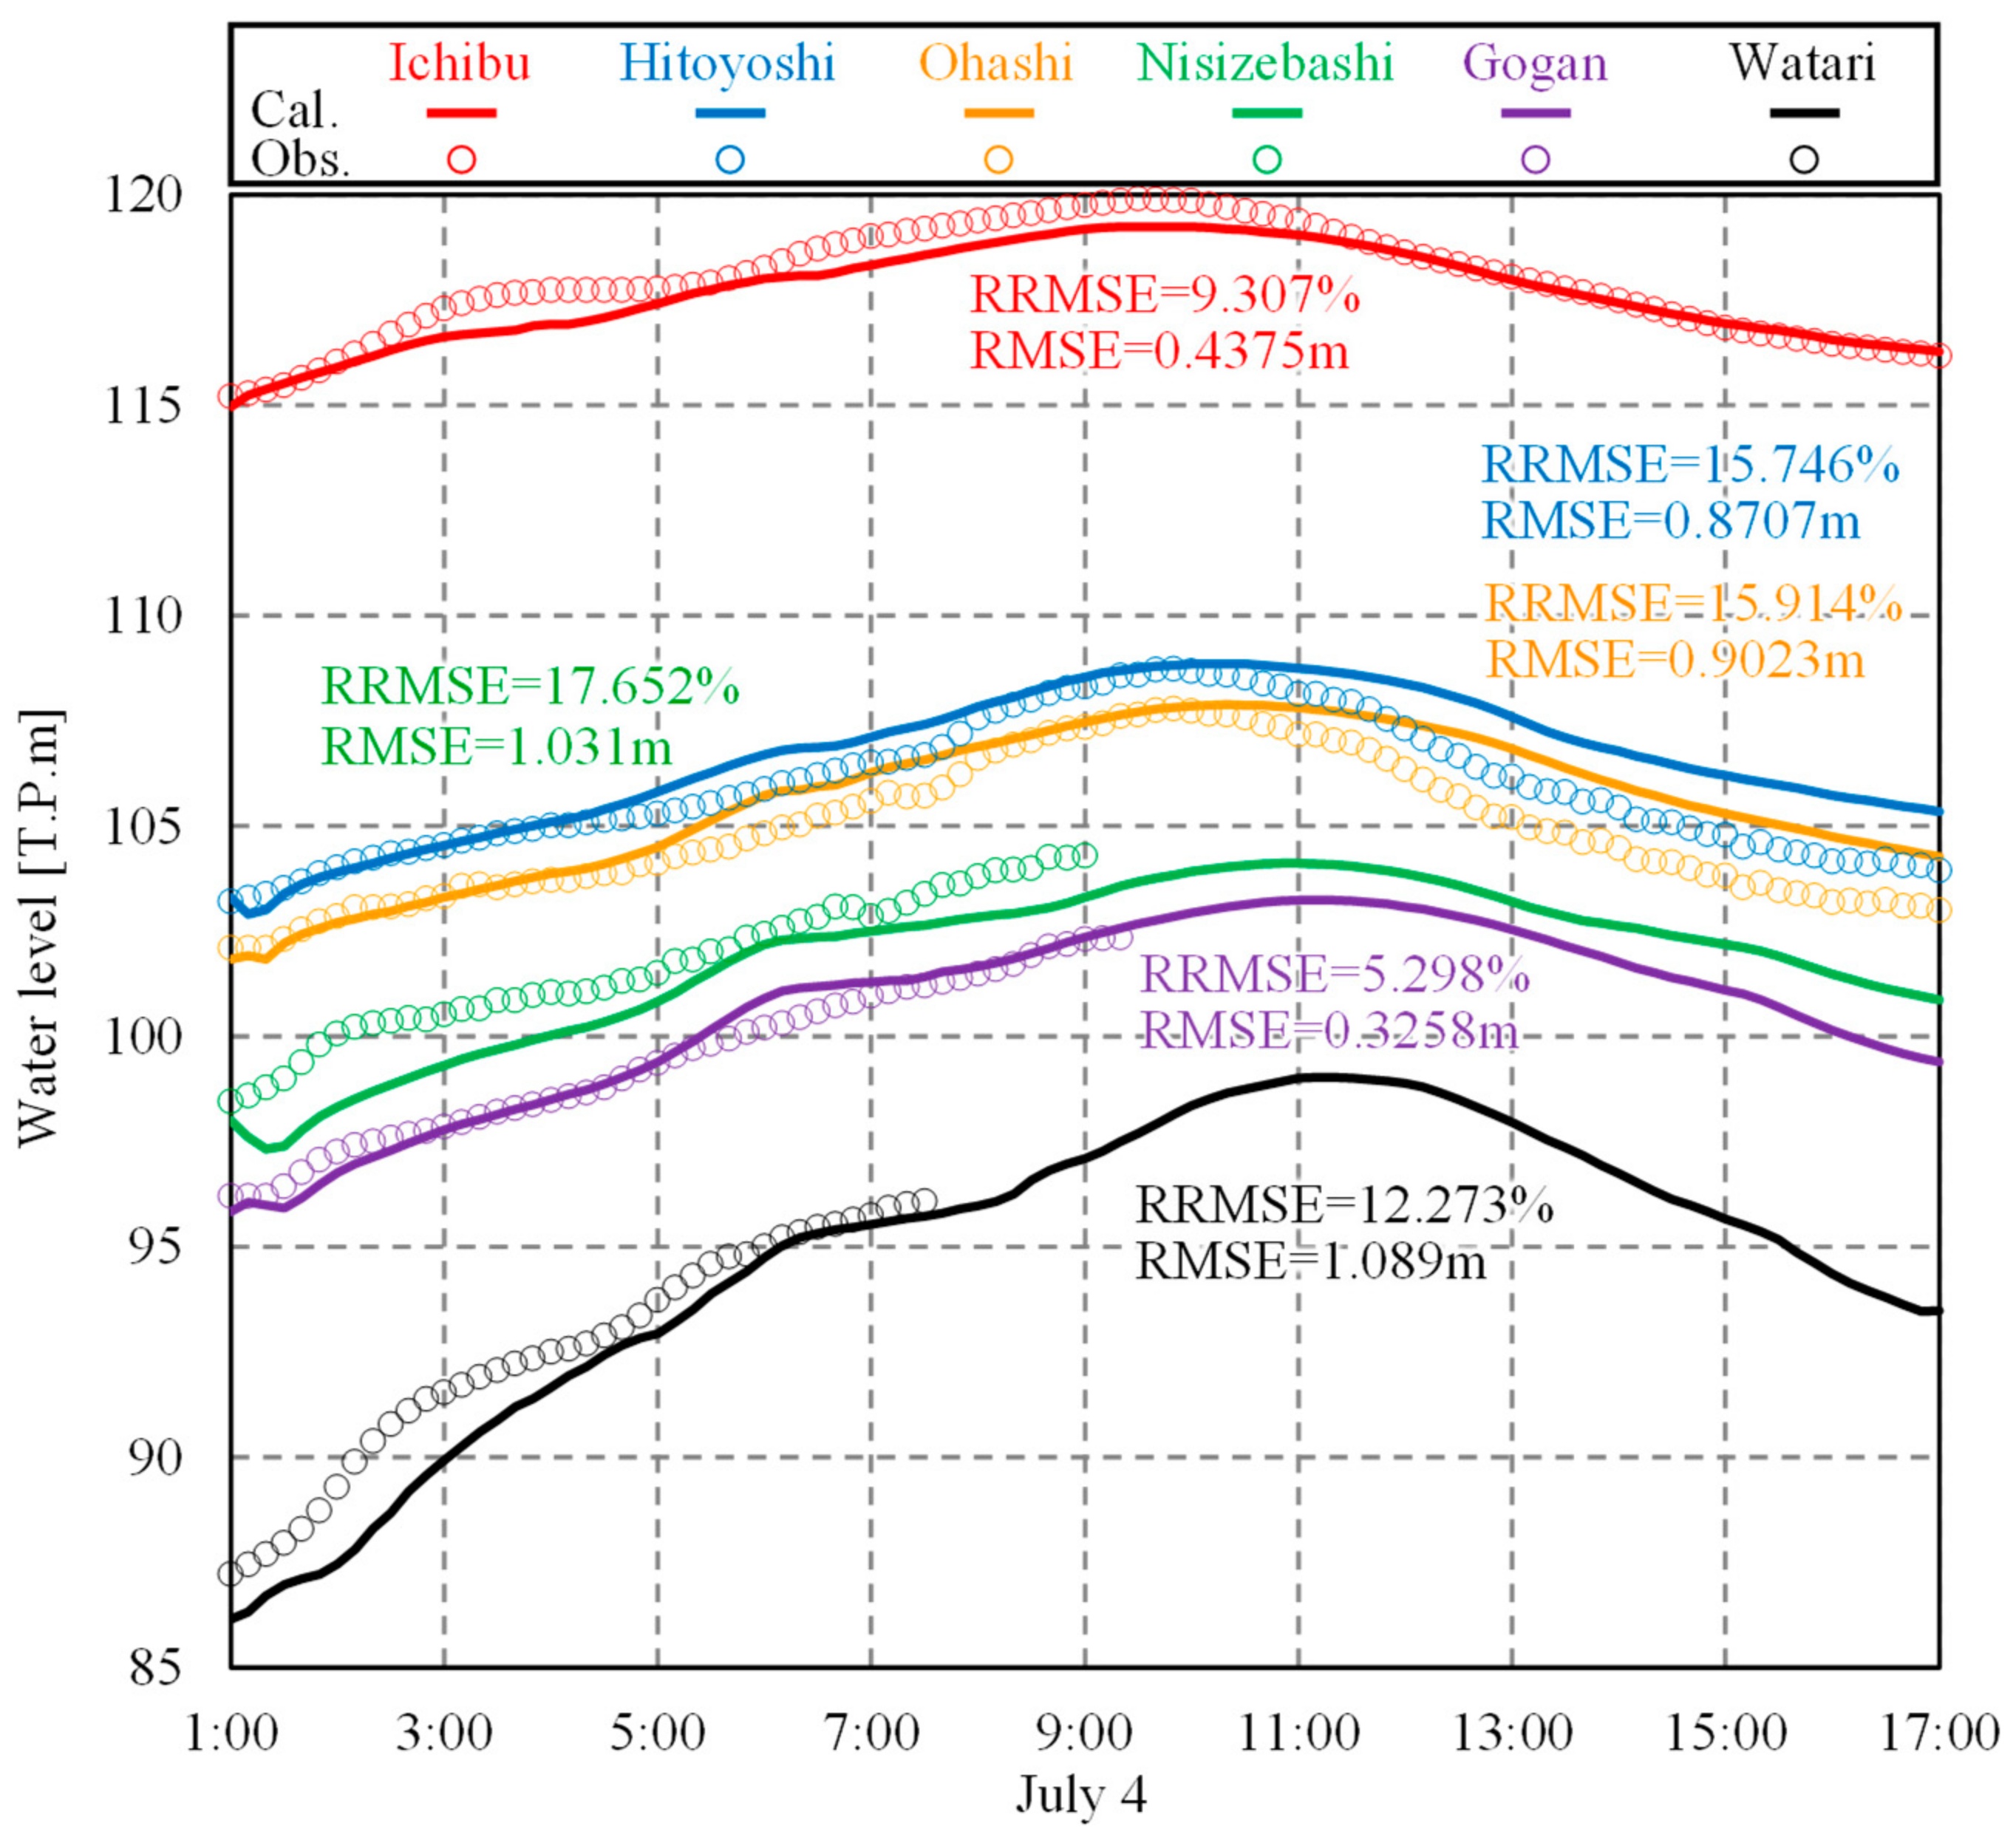
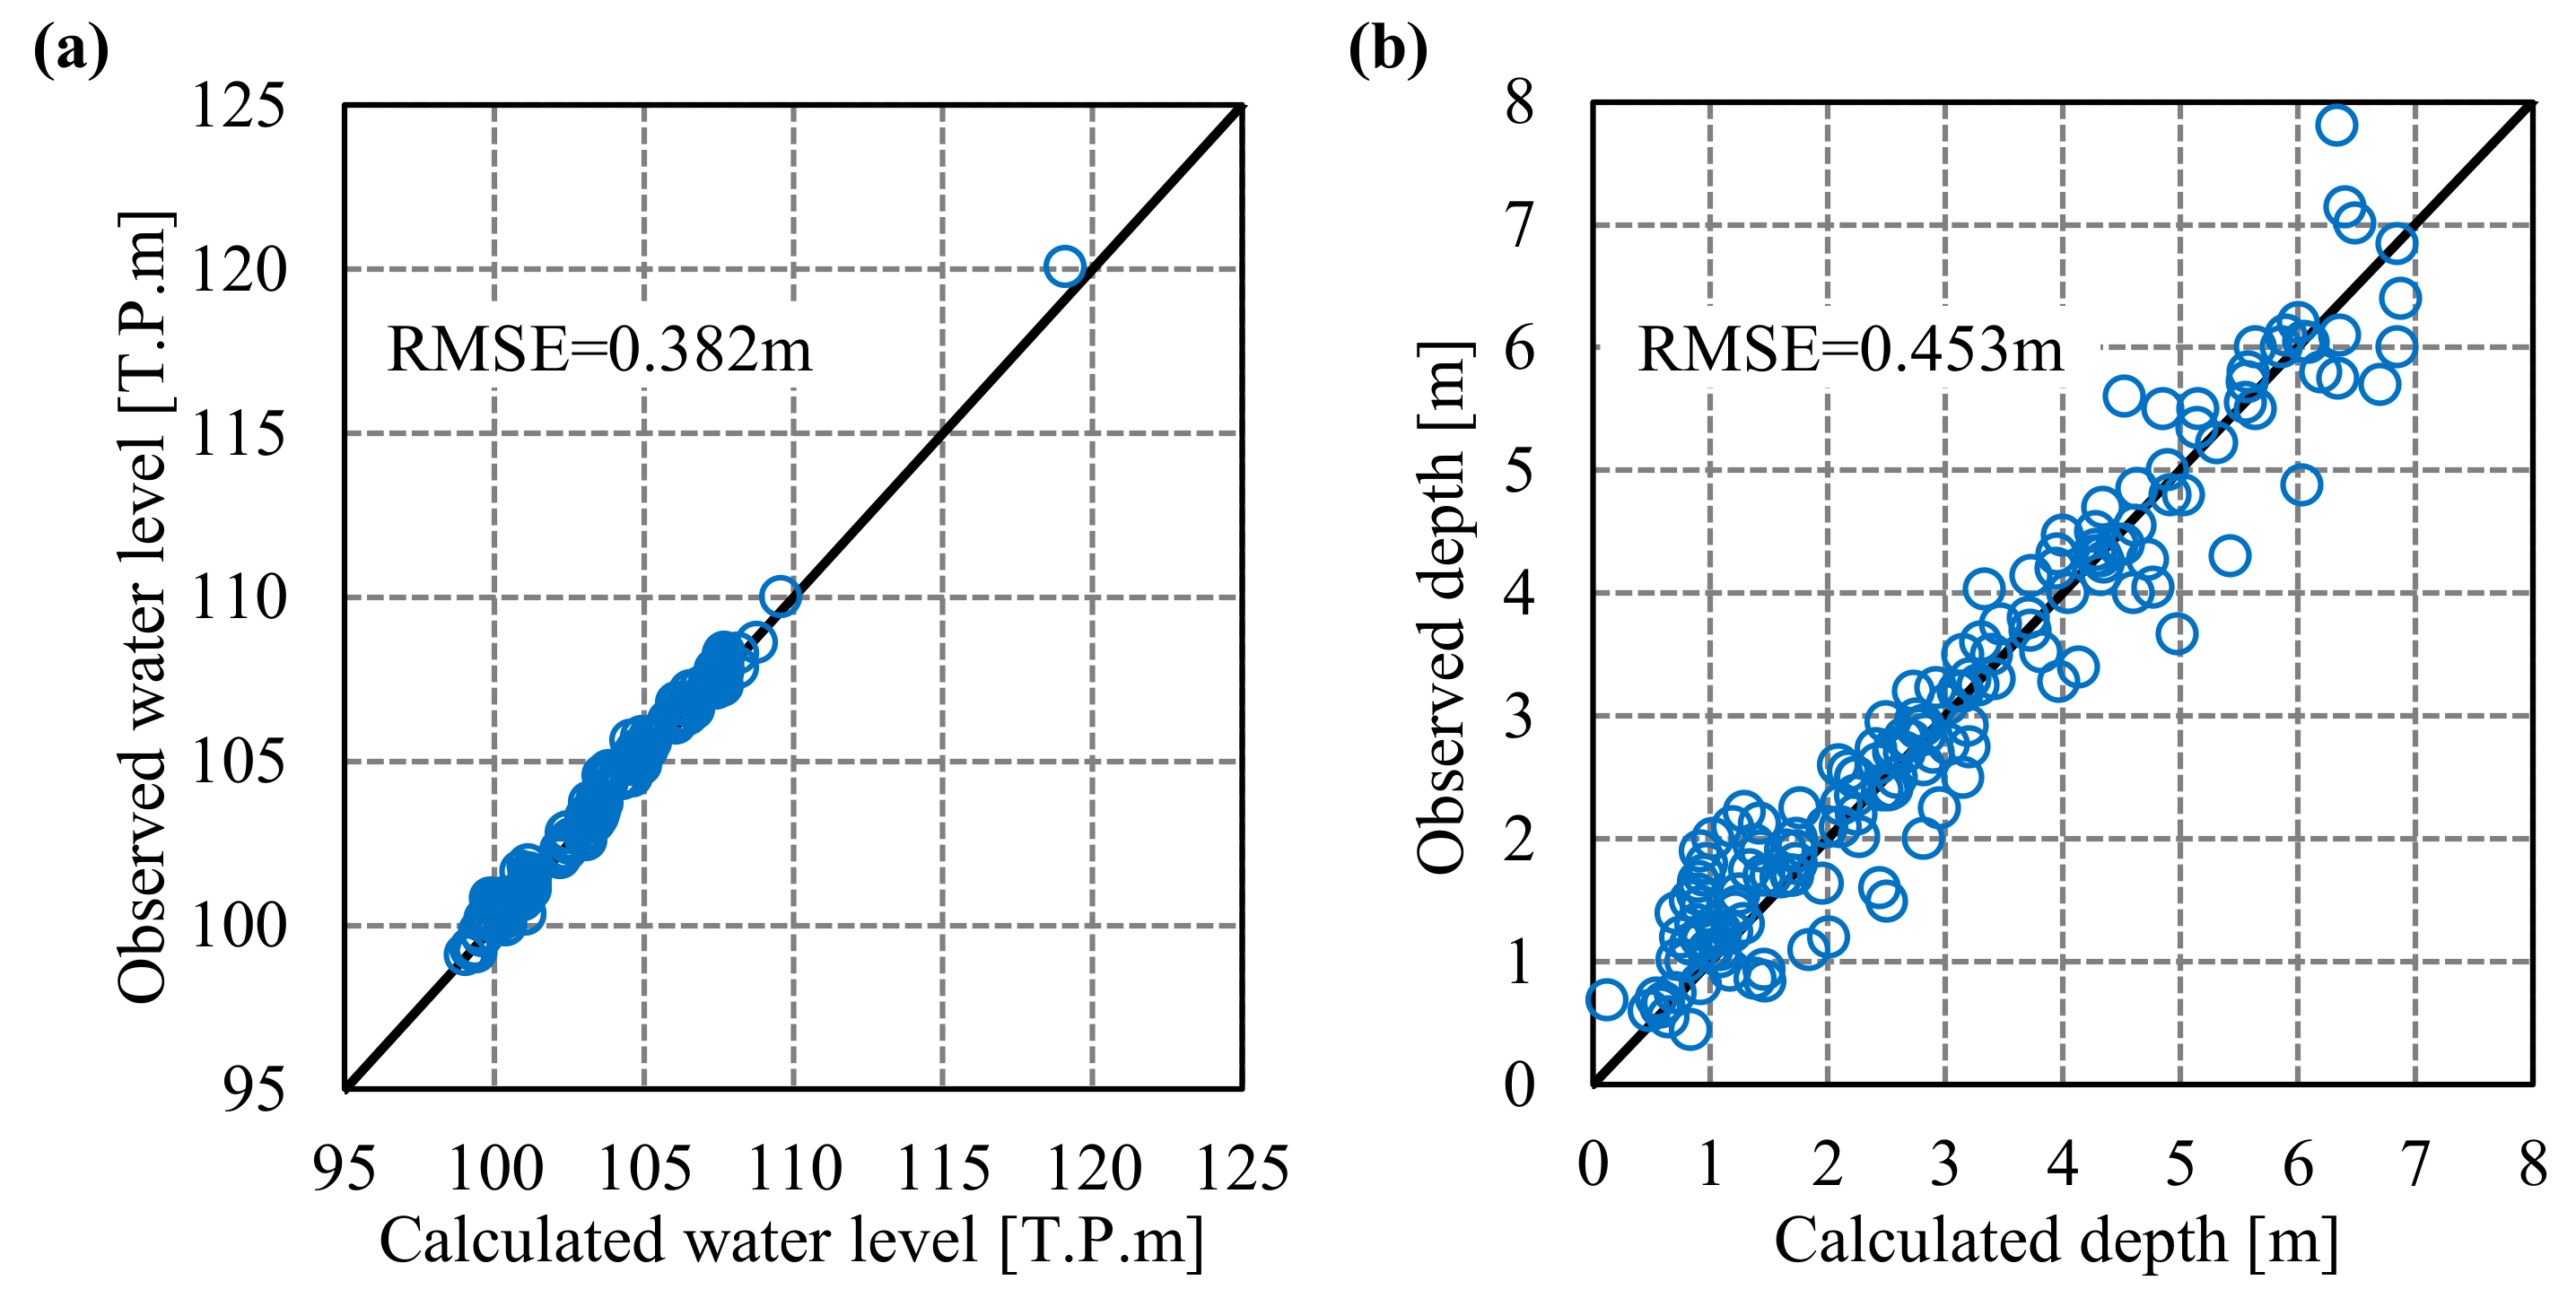
- In terms of the reproducibility of water levels and depths in river and inundation flow analyses, it was confirmed that the calculation accuracy of the Hy2-3D model was generally good. It was also quantitatively illustrated that there were no statistically significant differences in the water levels and depths among the cases for building resistance.
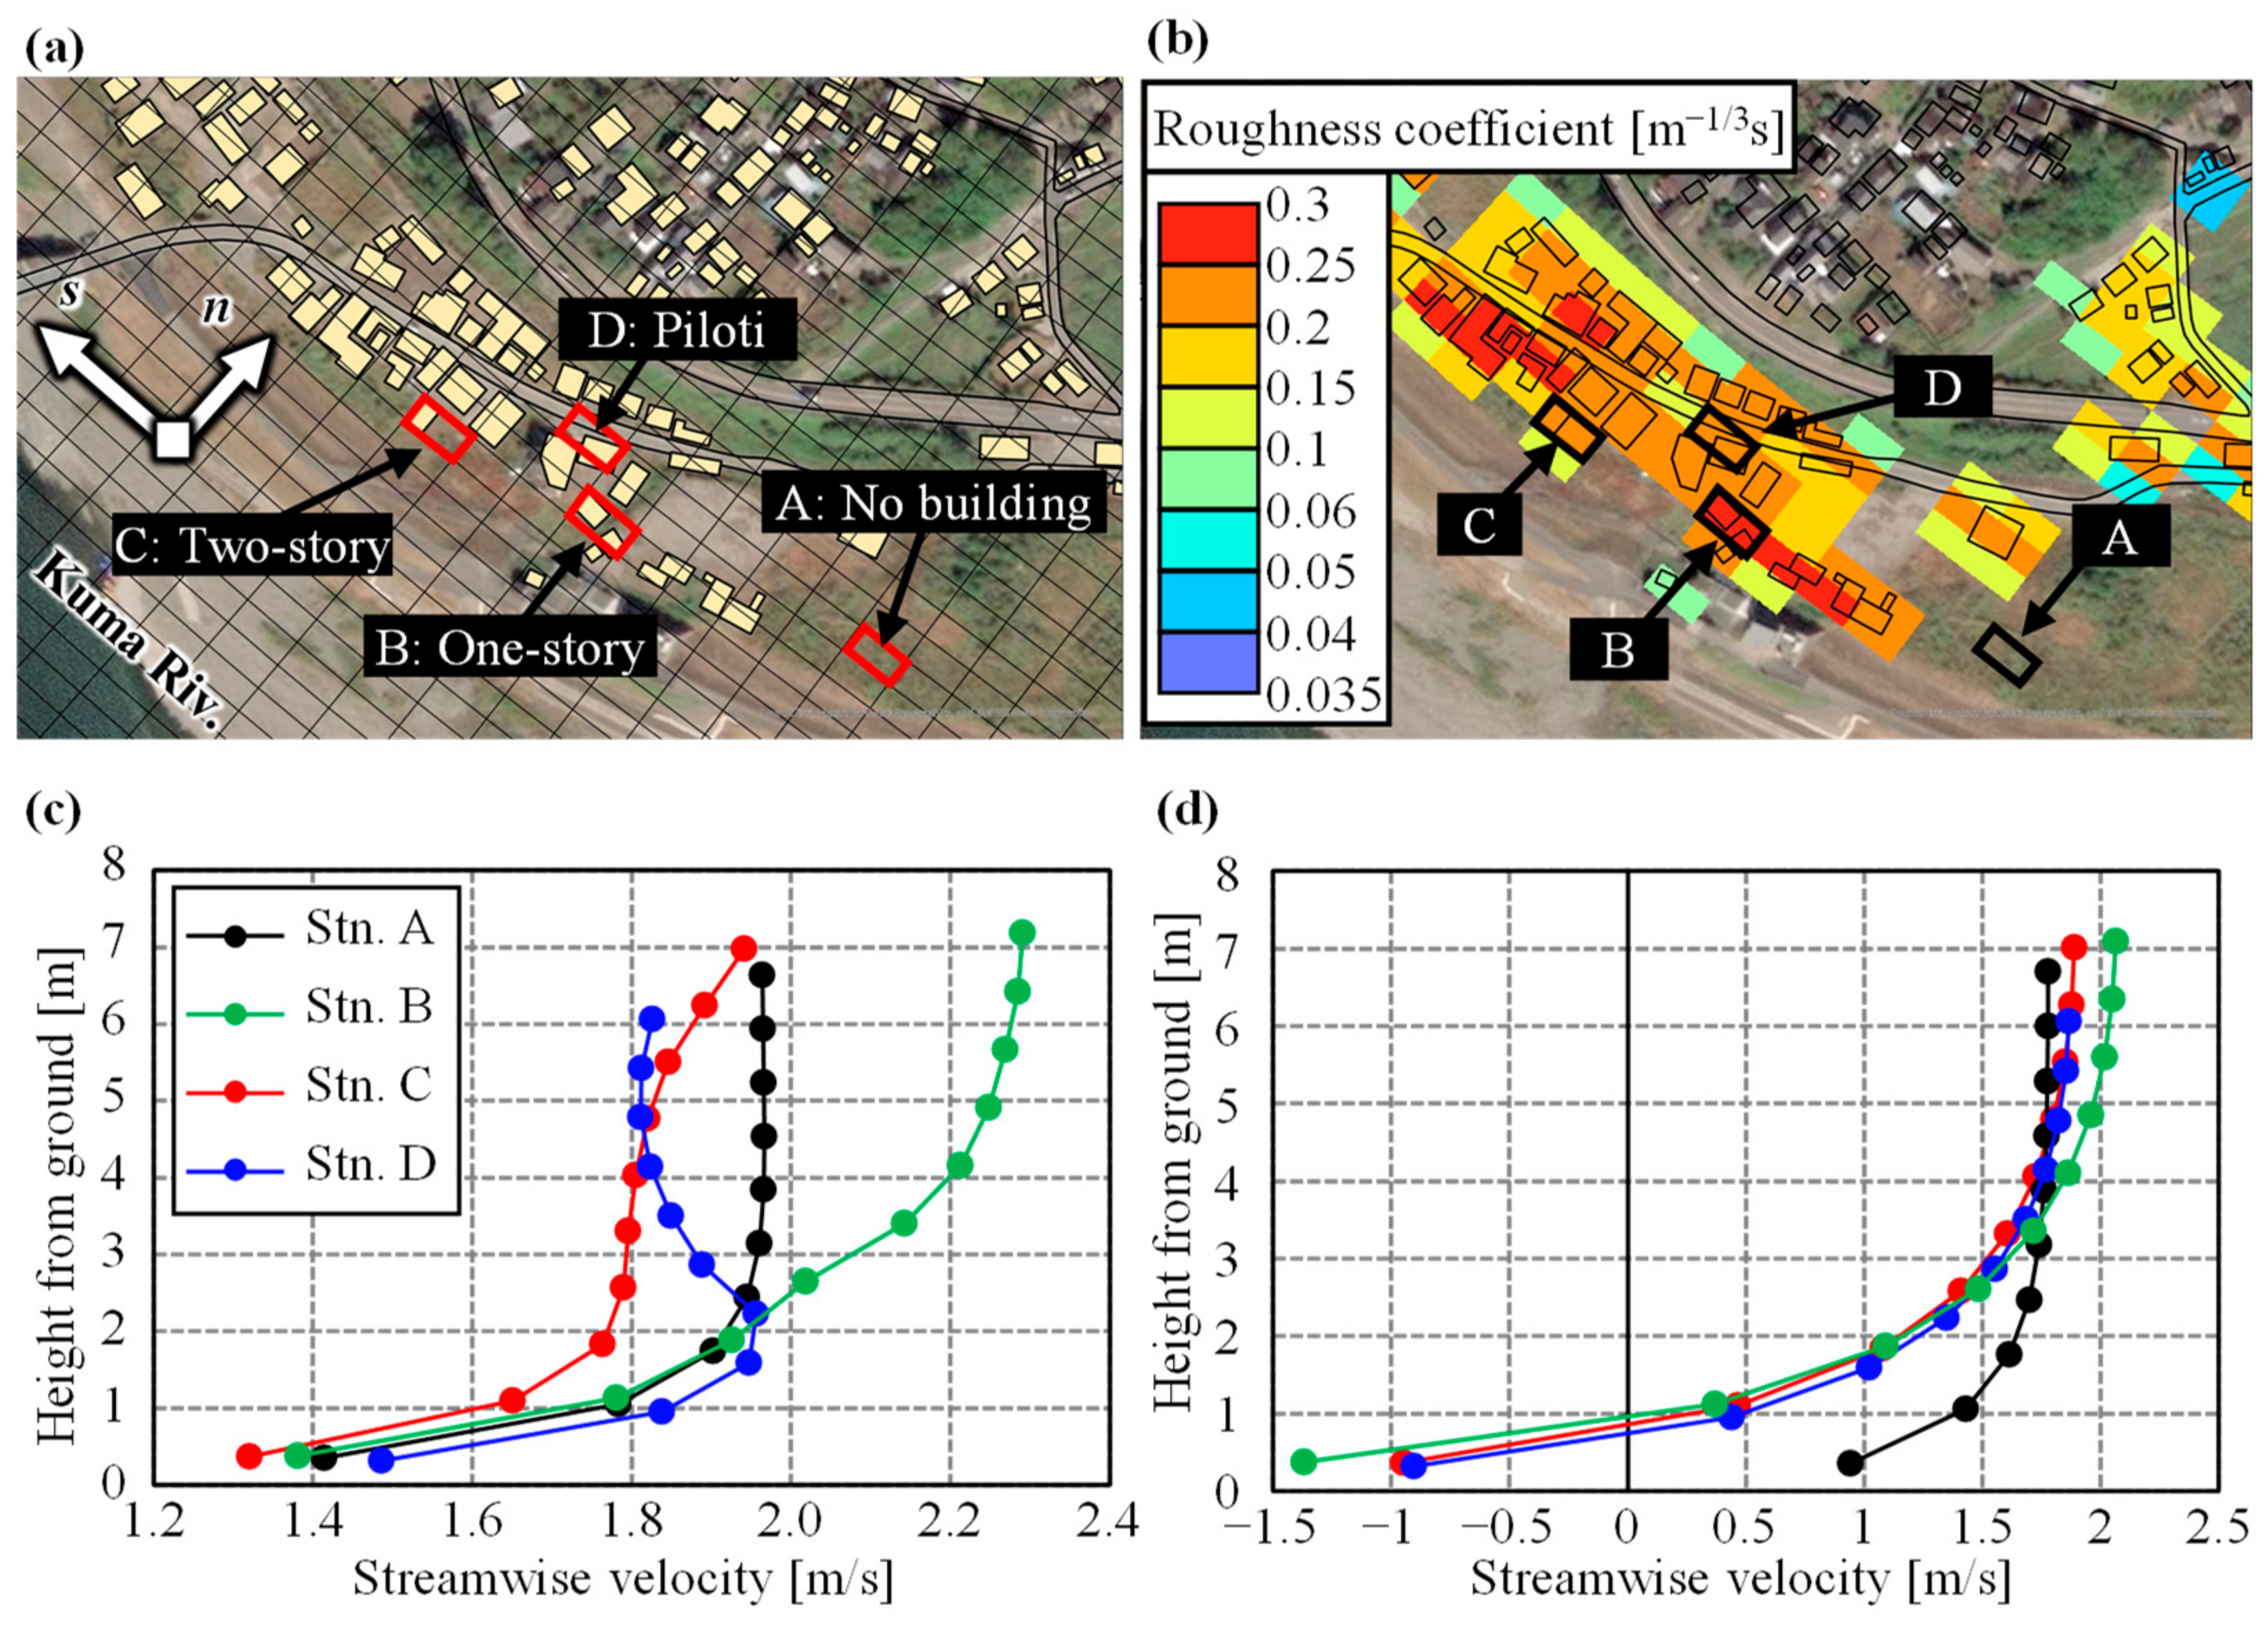
- In terms of the horizontal distribution of the velocity field, which is significant for building damage assessment, the contrast in the velocity difference between the building grid and the surrounding road grid was larger in the SG model (Case 1) than in the equivalent roughness model (Case 2). This is because, in the equivalent roughness model (Case 2), the roughness coefficient is larger even when a small number of buildings are included in the computational grid, and the roughness coefficient is reflected in the horizontal eddy viscosity coefficient; thus, the building effect is spread over a wider area.
- The SG model could reproduce the change in the vertical velocity distribution with the vertical structure of the building. However, the equivalent roughness model could not reproduce the flow velocity distribution with inflection points around the building. It also exhibited a limitation in reproducing the 3D flow velocity distribution around the building precisely because of the backflow near the bottom owing to the large roughness coefficient. Thus, it is clear that the SG model can accurately reproduce the horizontal and vertical structures of the flow velocity.
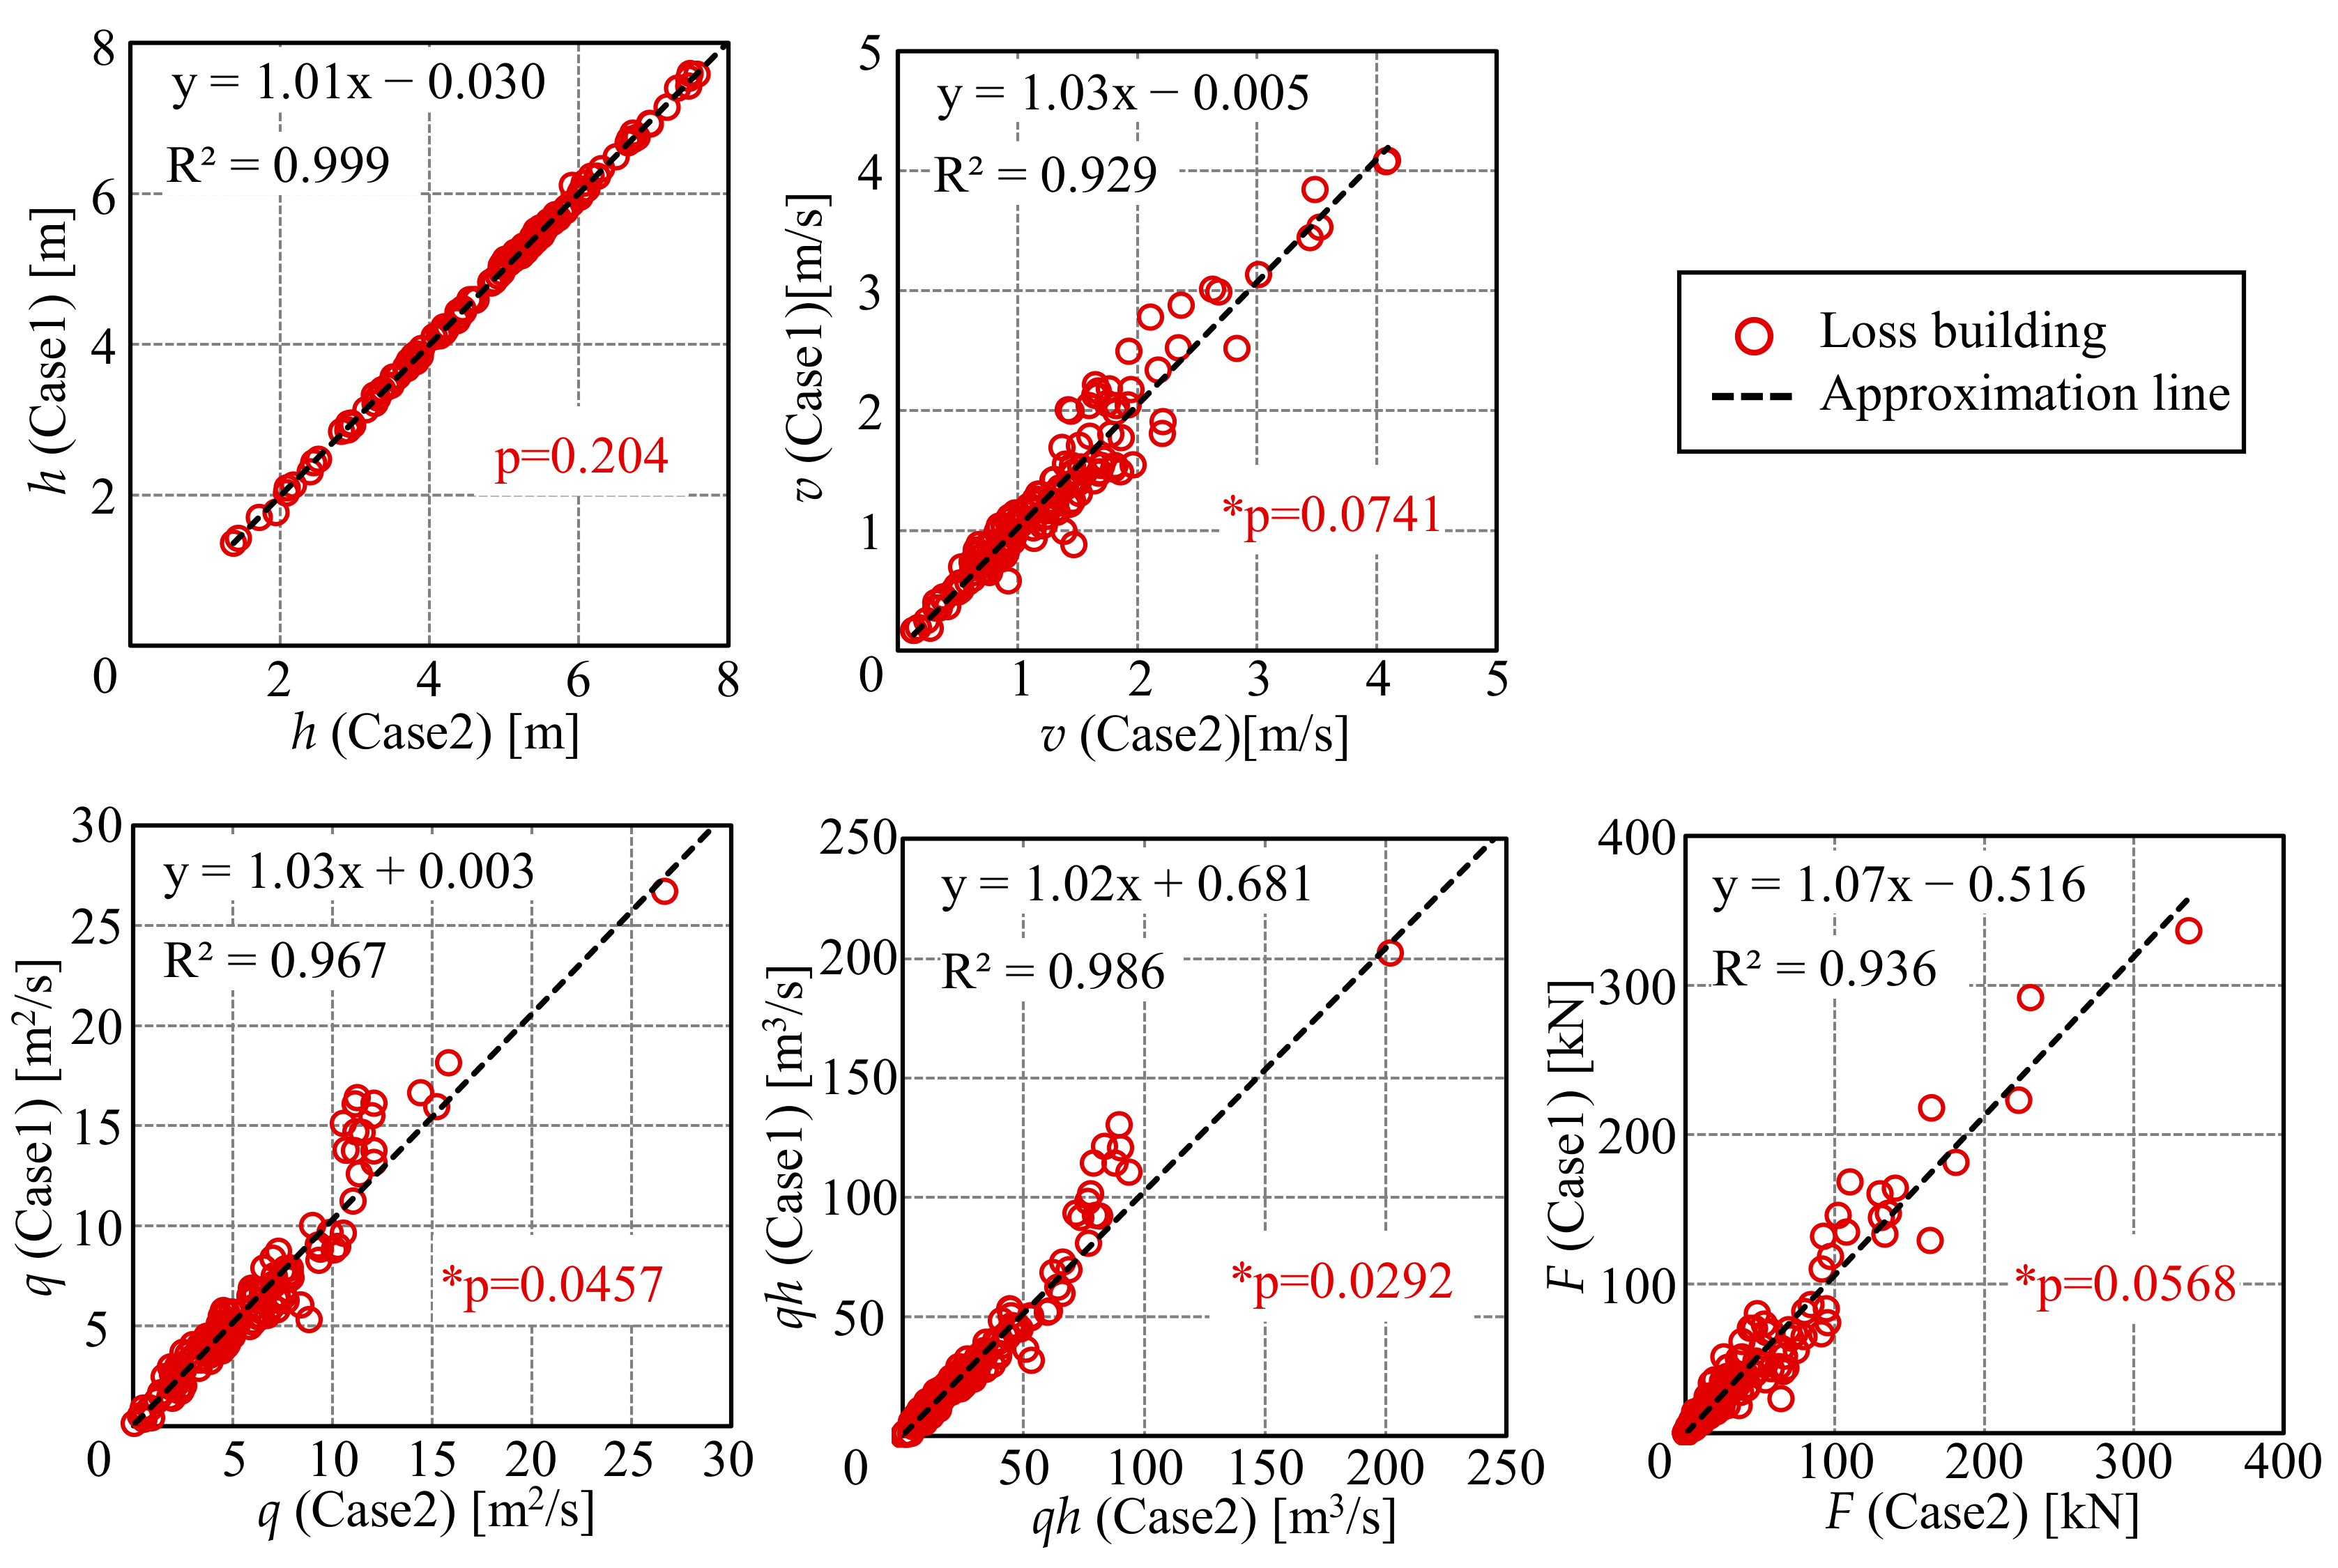
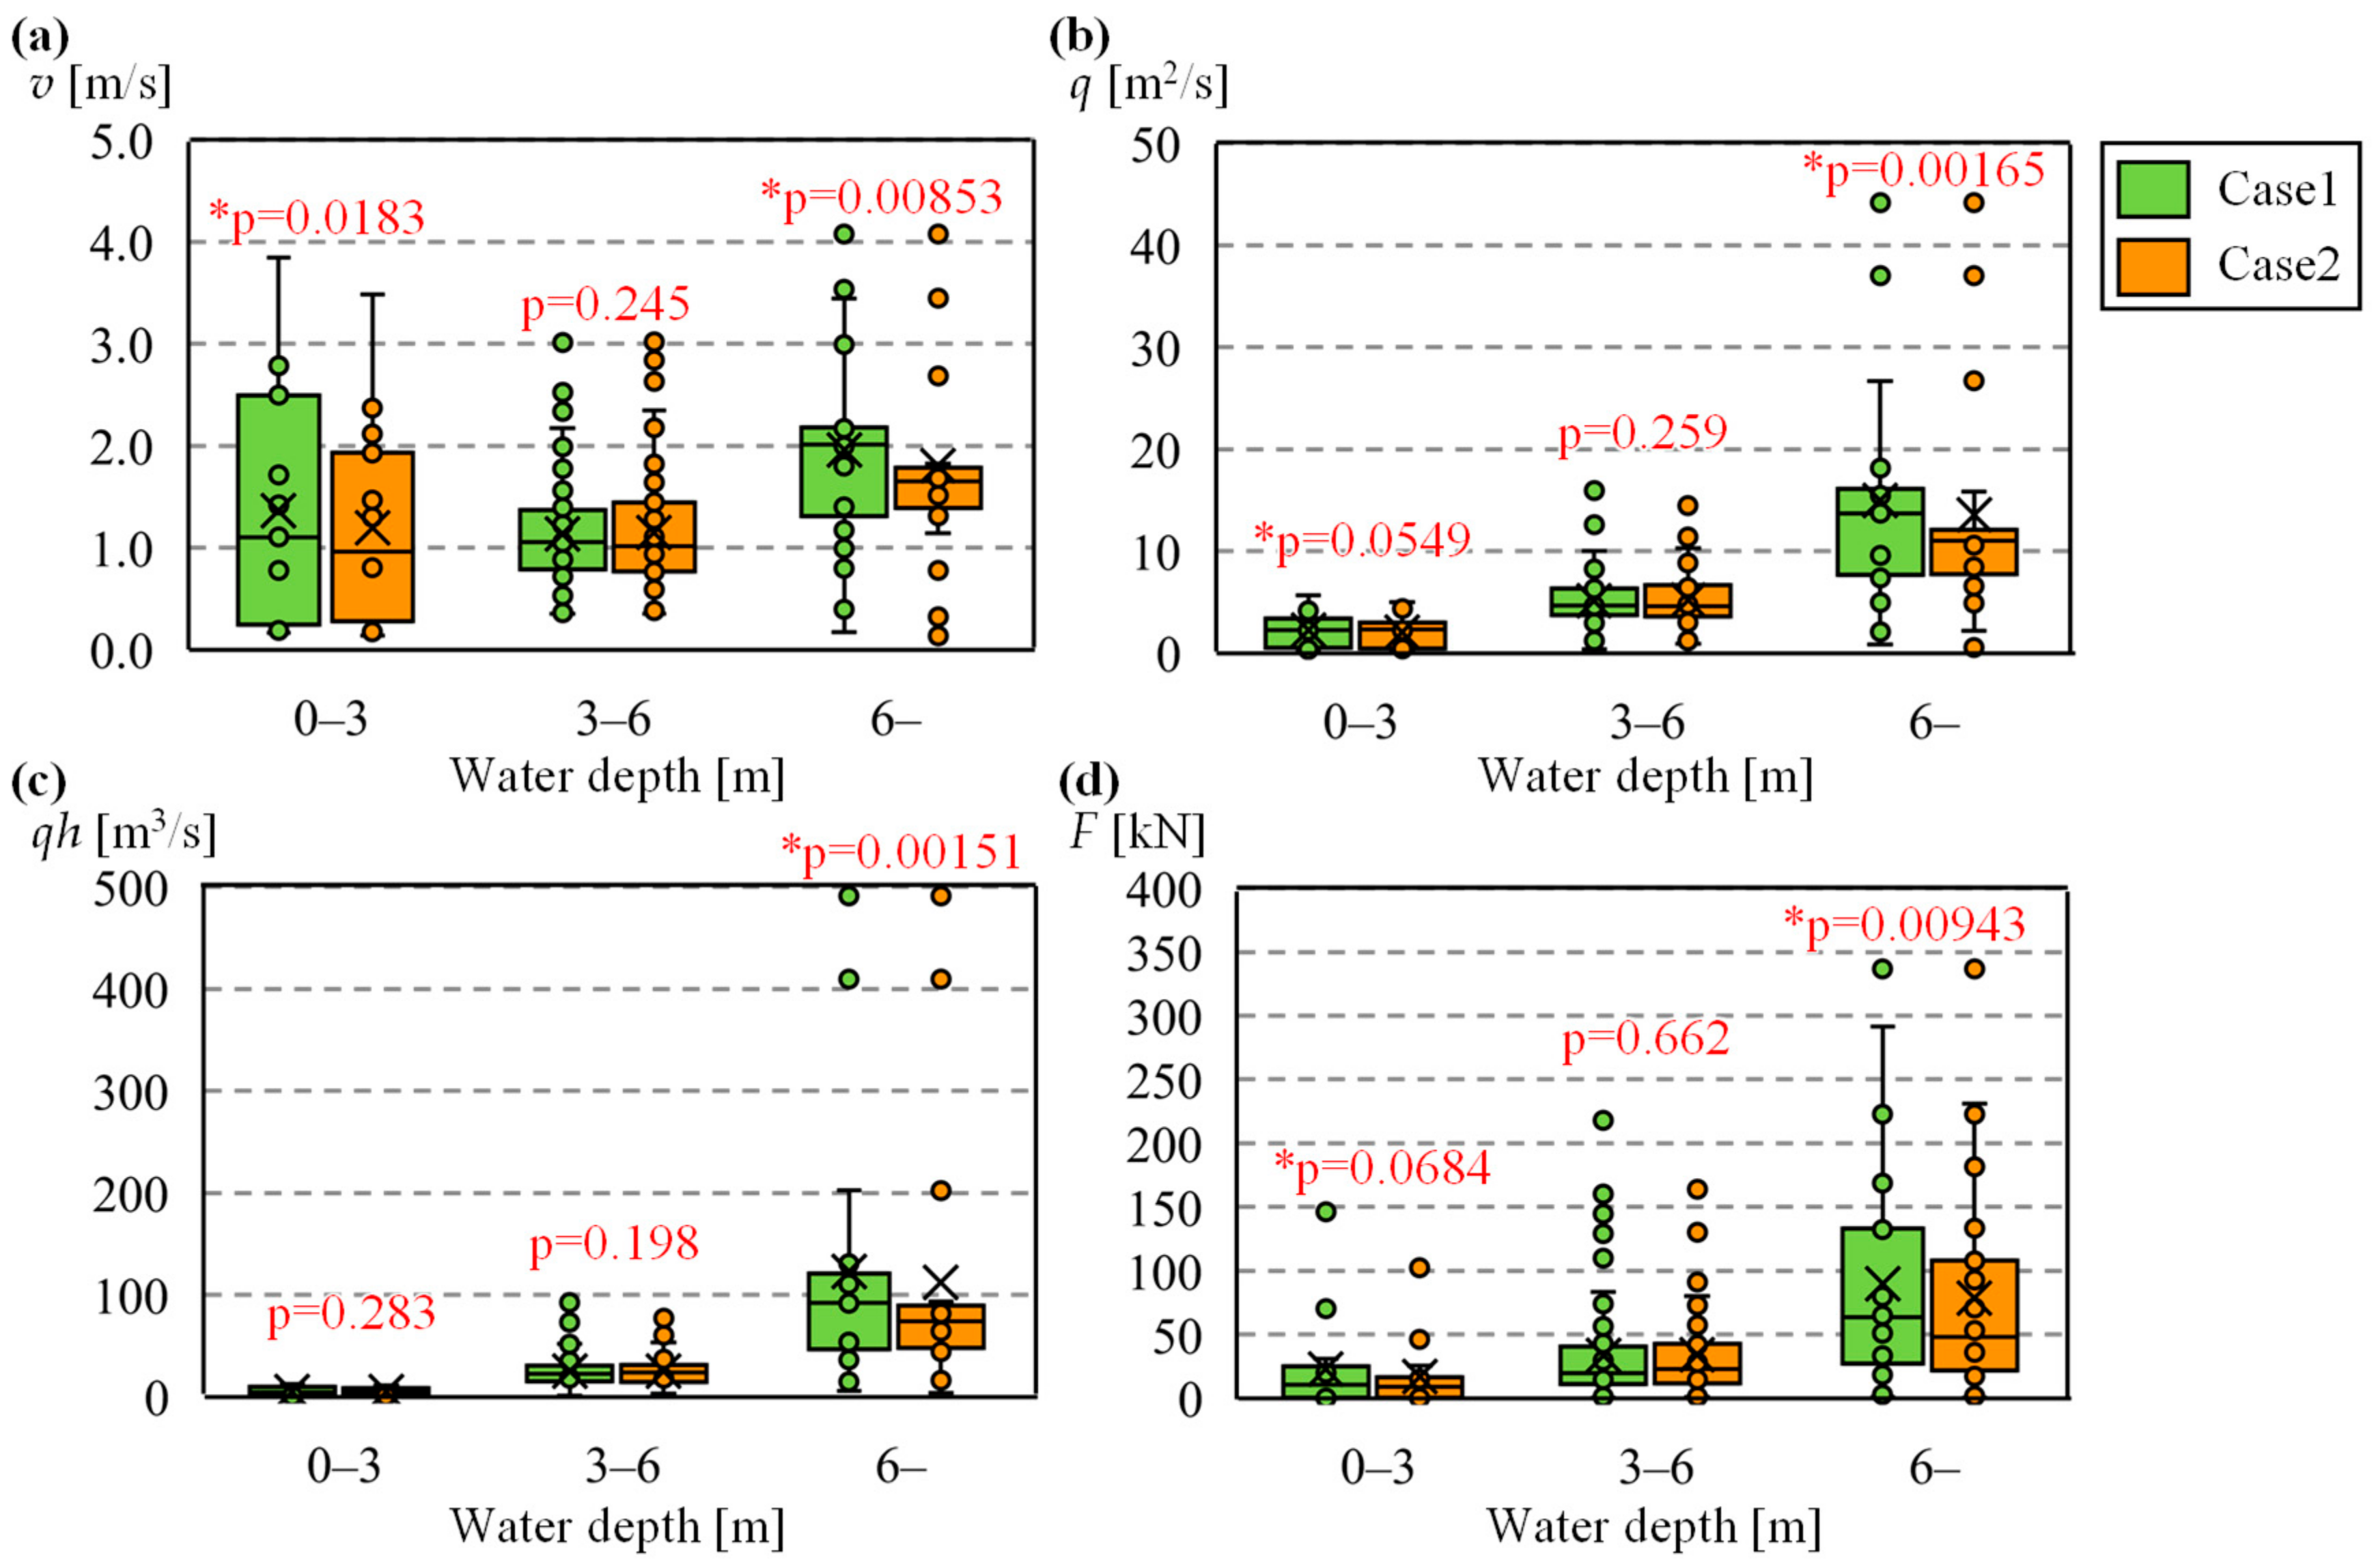
- A comparison of building loss indices, such as fluid forces acting on each building, revealed significant differences in flow velocity between Cases 1 and 2, particularly in the ranges of 0–3 m and >6 m inundation depths, where statistically significant differences were confirmed. Along with the results of the velocity analysis, similar statistically significant differences were also observed in the unit-width discharge q, moment qh, and fluid force F. These differences were attributed to the horizontal and vertical distribution of the flow velocity. These results suggest that the reproducibility of the vertical velocity distribution is a key factor and that the SG model incorporated into the 3D model can evaluate the inundation flow conditions in a manner that accurately reflects the fluid forces acting on the building, thus demonstrating the usefulness of the model.
Supplementary Materials
Author Contributions
Funding
Data Availability Statement
Acknowledgments
Conflicts of Interest
References
- Zhou, Z.Q.; Xie, S.P.; Zhang, R. Historic Yangtze flooding of 2020 tied to extreme Indian Ocean conditions. Proc. Natl. Acad. Sci. USA 2021, 118, e2022255118. [Google Scholar] [CrossRef]
- Dietze, M.; Bell, R.; Ozturk, U.; Cook, K.L.; Andermann, C.; Beer, A.R.; Thieken, A.H. More than heavy rain turning into fast-flowing water—A landscape perspective on the 2021 Eifel floods. Nat. Hazards Earth Syst. Sci. 2022, 22, 1845–1856. [Google Scholar] [CrossRef]
- Koks, E.E.; Van Ginkel, K.C.; Van Marle, M.J.; Lemnitzer, A. Brief communication: Critical infrastructure impacts of the 2021 mid-July western. Nat. Hazards Earth Syst. Sci. 2022, 22, 3831–3838. [Google Scholar] [CrossRef]
- MoPD. Government of Pakistan: Pakistan Floods 2022 Post-Disaster Needs Assessment. Available online: https://www.pc.gov.pk/uploads/downloads/PDNA-2022.pdf (accessed on 24 April 2023).
- Mallapaty, S. Pakistan’s floods have displaced 32 million people-how researchers are helping. Nature 2022, 609, 667. [Google Scholar] [CrossRef] [PubMed]
- Cabinet Office. Government of Japan: On Disaster Damage by the Heavy Rainfall in July 2018 (In Japanese). Available online: http://www.bousai.go.jp/updates/h30typhoon7/pdf/310109_1700_h30typhoon7_01.pdf (accessed on 2 May 2023).
- Cabinet Office. Government of Japan: On Disaster Damage by the Typhoon No. 19 (Hagibis) in 2019 (In Japanese). Available online: https://www.bousai.go.jp/updates/r1typhoon19/pdf/r1typhoon19_45.pdf (accessed on 2 May 2023).
- Cabinet Office. Government of Japan: On Disaster Damage by the Heavy Rainfall in July 2020 (In Japanese). Available online: http://www.bousai.go.jp/updates/r2_07ooame/pdf/r20703_ooame_40.pdf (accessed on 2 May 2023).
- Hirabayashi, Y.; Mahendran, R.; Koirala, S.; Konoshima, L.; Yamazaki, D.; Watanabe, S.; Kim, H.; Kanae, S. Global flood risk under climate change. Clim. Chang. 2013, 3, 816–821. [Google Scholar] [CrossRef]
- Best, J. Anthropogenic stresses on the world’s big rivers. Nat. Geosci. 2019, 12, 7–21. [Google Scholar] [CrossRef]
- Tabari, H. Climate change impact on flood and extreme precipitation increases with water availability. Sci. Rep. 2020, 10, 13768. [Google Scholar] [CrossRef]
- Kawase, H.; Yamaguchi, M.; Imada, Y.; Hayashi, S.; Murata, A.; Nakaegawa, T.; Miyasaka, T.; Takayabu, I. Enhancement of extremely heavy precipitation. Sci. Online Lett. Atmos. 2021, 17A, 7–13. [Google Scholar]
- Nihei, Y.; Oota, K.; Kawase, H.; Sayama, T.; Nakakita, E.; Ito, T.; Kashiwada, J. Assessment of climate change impacts on river flooding due to Typhoon Hagibis in 2019 using non-global warming experiments. J. Flood Risk Manag. 2023, 16, e12919. [Google Scholar] [CrossRef]
- Jonkman, S.N.; Kelman, I. An analysis of the causes and circumstances of flood disaster deaths. Disasters 2005, 29, 75–97. [Google Scholar] [CrossRef]
- Merz, B.; Kreibich, H.; Thieken, A.; Schmidtke, R. Estimation uncertainty of direct monetary flood damage to buildings. Nat. Hazards Earth Syst. Sci. 2004, 4, 153–163. [Google Scholar] [CrossRef]
- McGrath, H.; Abo El Ezz, A.; Nastev, M. Probabilistic depth-damage curves for the assessment of flood-induced building losses. Hazards 2019, 97, 1–14. [Google Scholar] [CrossRef]
- Hasegawa, K.; Yoshino, H.; Yanagi, U.; Azuma, K.; Osawa, H.; Kagi, N.; Shinohara, N.; Haesgawa, A. Indoor environmental problems and health status in water-damaged home due to tsunami in Japan. Build. Environ. 2015, 93, 24–34. [Google Scholar] [CrossRef]
- Comerio, M.A. Disaster recovery and community renewal: Housing approaches. Cityscape 2014, 16, 51–68. [Google Scholar]
- Ghobarah, A. Performance-based design in earthquake engineering: State of development. Eng. Struct. 2001, 23, 878–884. [Google Scholar] [CrossRef]
- Ellingwood, B.R. Earthquake risk assessment of building structures. Reliab. Eng. Syst. Saf. 2001, 74, 251–262. [Google Scholar] [CrossRef]
- Main, J.A.; Fritz, W.P. Database-Assisted Design for Wind: Concepts, Software, and Examples for Rigid and Flexible Buildings; Institute of Standards and Technology, Technology Administration, US Department of Commerce: Washington, DC, USA, 2006; pp. 14–39.
- Buchanan, A.H.; Abu, A.K. Structural Design for Fire Safety; John Wiley & Sons: Hoboken, NJ, USA, 2017; pp. 8–33. [Google Scholar]
- Burvy, R.J.; Deyle, R.E.; Godschalk, D.R.; Olshansky, R.B. Creating hazard resilient communities through land-use planning. Nat. Hazards Rev. 2000, 1, 99–106. [Google Scholar]
- Kreibich, H.; Kreibich, P.; Vliet, M.V.; Moel, H.D. A review of damage-reducing measures to manage fluvial flood risks in a changing climate. Mitig. Adapt. Strateg. Glob. Chang. 2015, 20, 967–989. [Google Scholar] [CrossRef]
- Schubert, J.E.; Sanders, B.E. Building treatments for urban flood inundation models and implications for predictive skill and modeling efficiency. Adv. Water Resour. 2012, 41, 49–64. [Google Scholar] [CrossRef]
- Aburaya, T.; Imamura, F. Proposal for Tsunami Inundation Simulation Using Synthetic Equivalent Roughness Model. Jpn. Soc. Civil Eng. 2002, 49, 276–280. (In Japanese) [Google Scholar] [CrossRef]
- Gallegos, H.A.; Schubert, J.E.; Sanders, B.F. Two-dimensional, high-resolution modeling of urban dam-break flooding: A case study of Baldwin Hills, California. Adv. Water Resour. 2009, 32, 1323–1335. [Google Scholar] [CrossRef]
- Wang, H.V.; Loftis, J.D.; Liu, Z.; Forrest, D.; Zhang, J. The storm surge and sub-grid inundation modeling in New York City during Hurricane Sandy. Sci. Eng. 2014, 2, 226–246. [Google Scholar] [CrossRef]
- Wang, Y.; Chen, A.S.; Fu, G.; Djordjević, S.; Zhang, C.; Savić, D.A. An integrated framework for high-resolution urban flood modelling considering multiple information sources and urban features. Environ. Model. Softw. 2018, 107, 85–95. [Google Scholar] [CrossRef]
- Aronica, G.T.; Lanza, L.G. Drainage efficiency in urban areas: A case study. Hydrol. Process. 2005, 19, 1105–1119. [Google Scholar] [CrossRef]
- Tsubaki, R.; Fujita, I. Unstructured grid generation using LiDAR data for urban flood inundation modelling. Hydrol. Process. 2010, 24, 1401–1420. [Google Scholar] [CrossRef]
- Sanders, B.F.; Schubert, J.E.; Gallegos, H.A. Integral formulation of shallow-water equations with anisotropic porosity for urban flood modeling. J. Hydrol. 2008, 362, 19–38. [Google Scholar] [CrossRef]
- Viero, D.P. Modelling urban floods using a finite element staggered scheme with an anisotropic dual porosity model. J. Hydrol. 2019, 568, 247–259. [Google Scholar] [CrossRef]
- Apel, H.; Aronica, G.T.; Kreibich, H.; Thieken, A.H. Flood risk analyses—How detailed do we need to be? Nat. Hazards 2009, 49, 79–98. [Google Scholar] [CrossRef]
- Ernst, J.; Dewals, B.J.; Detrembleur, S.; Archambeau, P.; Erpicum, S.; Pirotton, M. Micro-scale flood risk analysis based on detailed 2D hydraulic. Nat. Hazards 2010, 55, 181–209. [Google Scholar] [CrossRef]
- Merz, B.; Kreibich, H.; Schwarze, R.; Thieken, A. Assessment of economic flood damage. Nat. Hazards Earth Syst. Sci. 2010, 10, 1697–1774. [Google Scholar] [CrossRef]
- Wing, O.E.J.; Bates, P.D.; Sampson, C.C.; Smith, A.M.; Johnson, K.A.; Erickson, K.A. Validation of a 30 m resolution flood hazard model for the conterminous United States. Water Resour. Res. 2017, 53, 7968–7986. [Google Scholar] [CrossRef]
- Wilson, M.; Bates, P.; Alsdorf, D.; Forsberg, B.; Horritt, M.; Mekack, J.; Frappart, F.; Famiglietti, J. Modeling large-scale inundation of Amazonian seasonally flooded wetlands. Geophys. Res. Lett. 2007, 34, L15404. [Google Scholar] [CrossRef]
- Alho, P.; Aaltonen, J. Comparing a 1D hydraulic model with a 2D hydraulic model for the simulation of extreme glacial outburst floods. Hydrol. Process. 2008, 22, 1407–1572. [Google Scholar] [CrossRef]
- Sanders, B.F.; Schubert, J.E.; Detwiler, R.L. ParBreZo: A parallel, unstructured grid, Godunov-type, shallow-water code for high-resolution flood inundation modeling at the regional scale. Adv. Water Resour. 2010, 33, 1456–1467. [Google Scholar] [CrossRef]
- McMillan, H.K.; Brasington, J. Reduced complexity strategies for modelling urban floodplain inundation. Geomorphology 2007, 90, 226–243. [Google Scholar] [CrossRef]
- Zhang, S.; Wang, T.; Zhao, B. ParBreZo: Calculation and visualization of flood inundation based on a topographic triangle network. J. Hydrol. 2014, 509, 406–415. [Google Scholar] [CrossRef]
- Xian, S.; Lin, N.; Kunreuther, H. Optimal house elevation for reducing flood-related losses. J. Hydrol. 2017, 548, 63–74. [Google Scholar] [CrossRef]
- Liao, K.H.; Le, T.A.; Nguyen, K.V. Urban design principles for flood resilience: Learning from the ecological wisdom of living with floods in the Vietnamese Mekong Delta. Landsc. Urban Plan. 2016, 155, 69–78. [Google Scholar] [CrossRef]
- Yamamoto, T.; Kazama, S.; Touge, Y.; Yanagihara, H.; Tada, T.; Takizawa, H. Evaluation of flood damage reduction throughout Japan from adaptation measures taken under a range of emissions mitigation scenarios. Clim. Chang. 2021, 165, 60. [Google Scholar] [CrossRef]
- Bartier, P.M.; Keller, C.P. Multivariate interpolation to incorporate thematic surface data using inverse distance weighting (IDW). Comput. Geosci. 1996, 22, 795–799. [Google Scholar] [CrossRef]
- Nihei, Y.; Kato, Y.; Sato, K. A new three-dimensional numerical method for large-scale river flow and its application to a flood flow computation. J. Jpn. Soc. Civil Eng. 2005, 803, 115–131. [Google Scholar]
- Kashiwada, J.; Nihei, Y. A High Accurate and Efficient 3D River Flow Model with a New Mode-Splitting Technique. In Proceedings of the 39th IAHR World Congress, Granada, Spain, 19–24 June 2022. [Google Scholar]
- Kashiwada, J.; Kubota, R.; Hiramoto, T.; Yamada, M.; Sayama, T.; Nihei, Y. Building washout rates in the Kuma River flood in 2020 based on the integrated analysis of river flow and inundation flow. Adv. River Eng. 2023, 29, 401–406. [Google Scholar]
- Imai, K.; Imamura, F.; Iwama, S. Advanced tsunami computation for urban regions. J. Jpn. Soc. Civil Eng. Ser. B2 2013, 69, I-311–I-315. [Google Scholar]
- Kuwamura, H. Drag and uplift of a cuboid structure standing in inundation flow—Hydraulic study in natural river flow Part2. J. Struct. Construct. Eng. (Trans. AIJ) 2016, 81, 219–227. [Google Scholar] [CrossRef]
- Wu, W. Computational River Dynamics; Taylar & Francis: Abingdon, UK, 2008; pp. 11–58. [Google Scholar]
- Yokoki, H.; Uchida, T.; Inagaki, A.; Tsukai, M.; Seto, S.; Yokojima, S.; Yoshikawa, Y.; Tsubaki, R.; Saiki, I. Editorial in Special issue on the July 2020 heavy rainfall event in Japan. J. Jpn. Soc. Civil Eng. 2021, 10, 545–549. [Google Scholar] [CrossRef] [PubMed]
- Hirokawa, Y.; Kato, T.; Araki, K.; Mashiko, W. Characteristics of an extreme rainfall event in Kyushu District, Southwestern Japan, in Early July 2020. Sci. Online Lett. Atmos. 2020, 16, 265–270. [Google Scholar] [CrossRef]
- Ogata, Y.; Hotta, T.; Ito, T.; Inoue, T.; Ota, K.; Onomura, S.; Nihei, Y. Relation between inundation, building and human damage, in Kuma River due to Reiwa. J. Jpn. Soc. Civil Eng. Ser. B1 2021, 77, I-457–I-462. [Google Scholar]
- Sayama, T.; Ozawa, T.; Kawakami, T.; Nabesaka, S.; Fukami, K. Rainfall-runoff-inundation analysis of the 2010 Pakistan. Hydrol. Sci. J. 2012, 57, 298–312. [Google Scholar] [CrossRef]
- Kanda, M. Progress in the scale modeling of urban climate. Theor. Appl. Climatol. 2006, 84, 23–33. [Google Scholar] [CrossRef]
- Raupach, M.R. Simplified expressions for vegetation roughness length and zero-plane displacement as a function of canopy height and area index. Bound.-Layer Meteorol. 1994, 71, 211–216. [Google Scholar] [CrossRef]

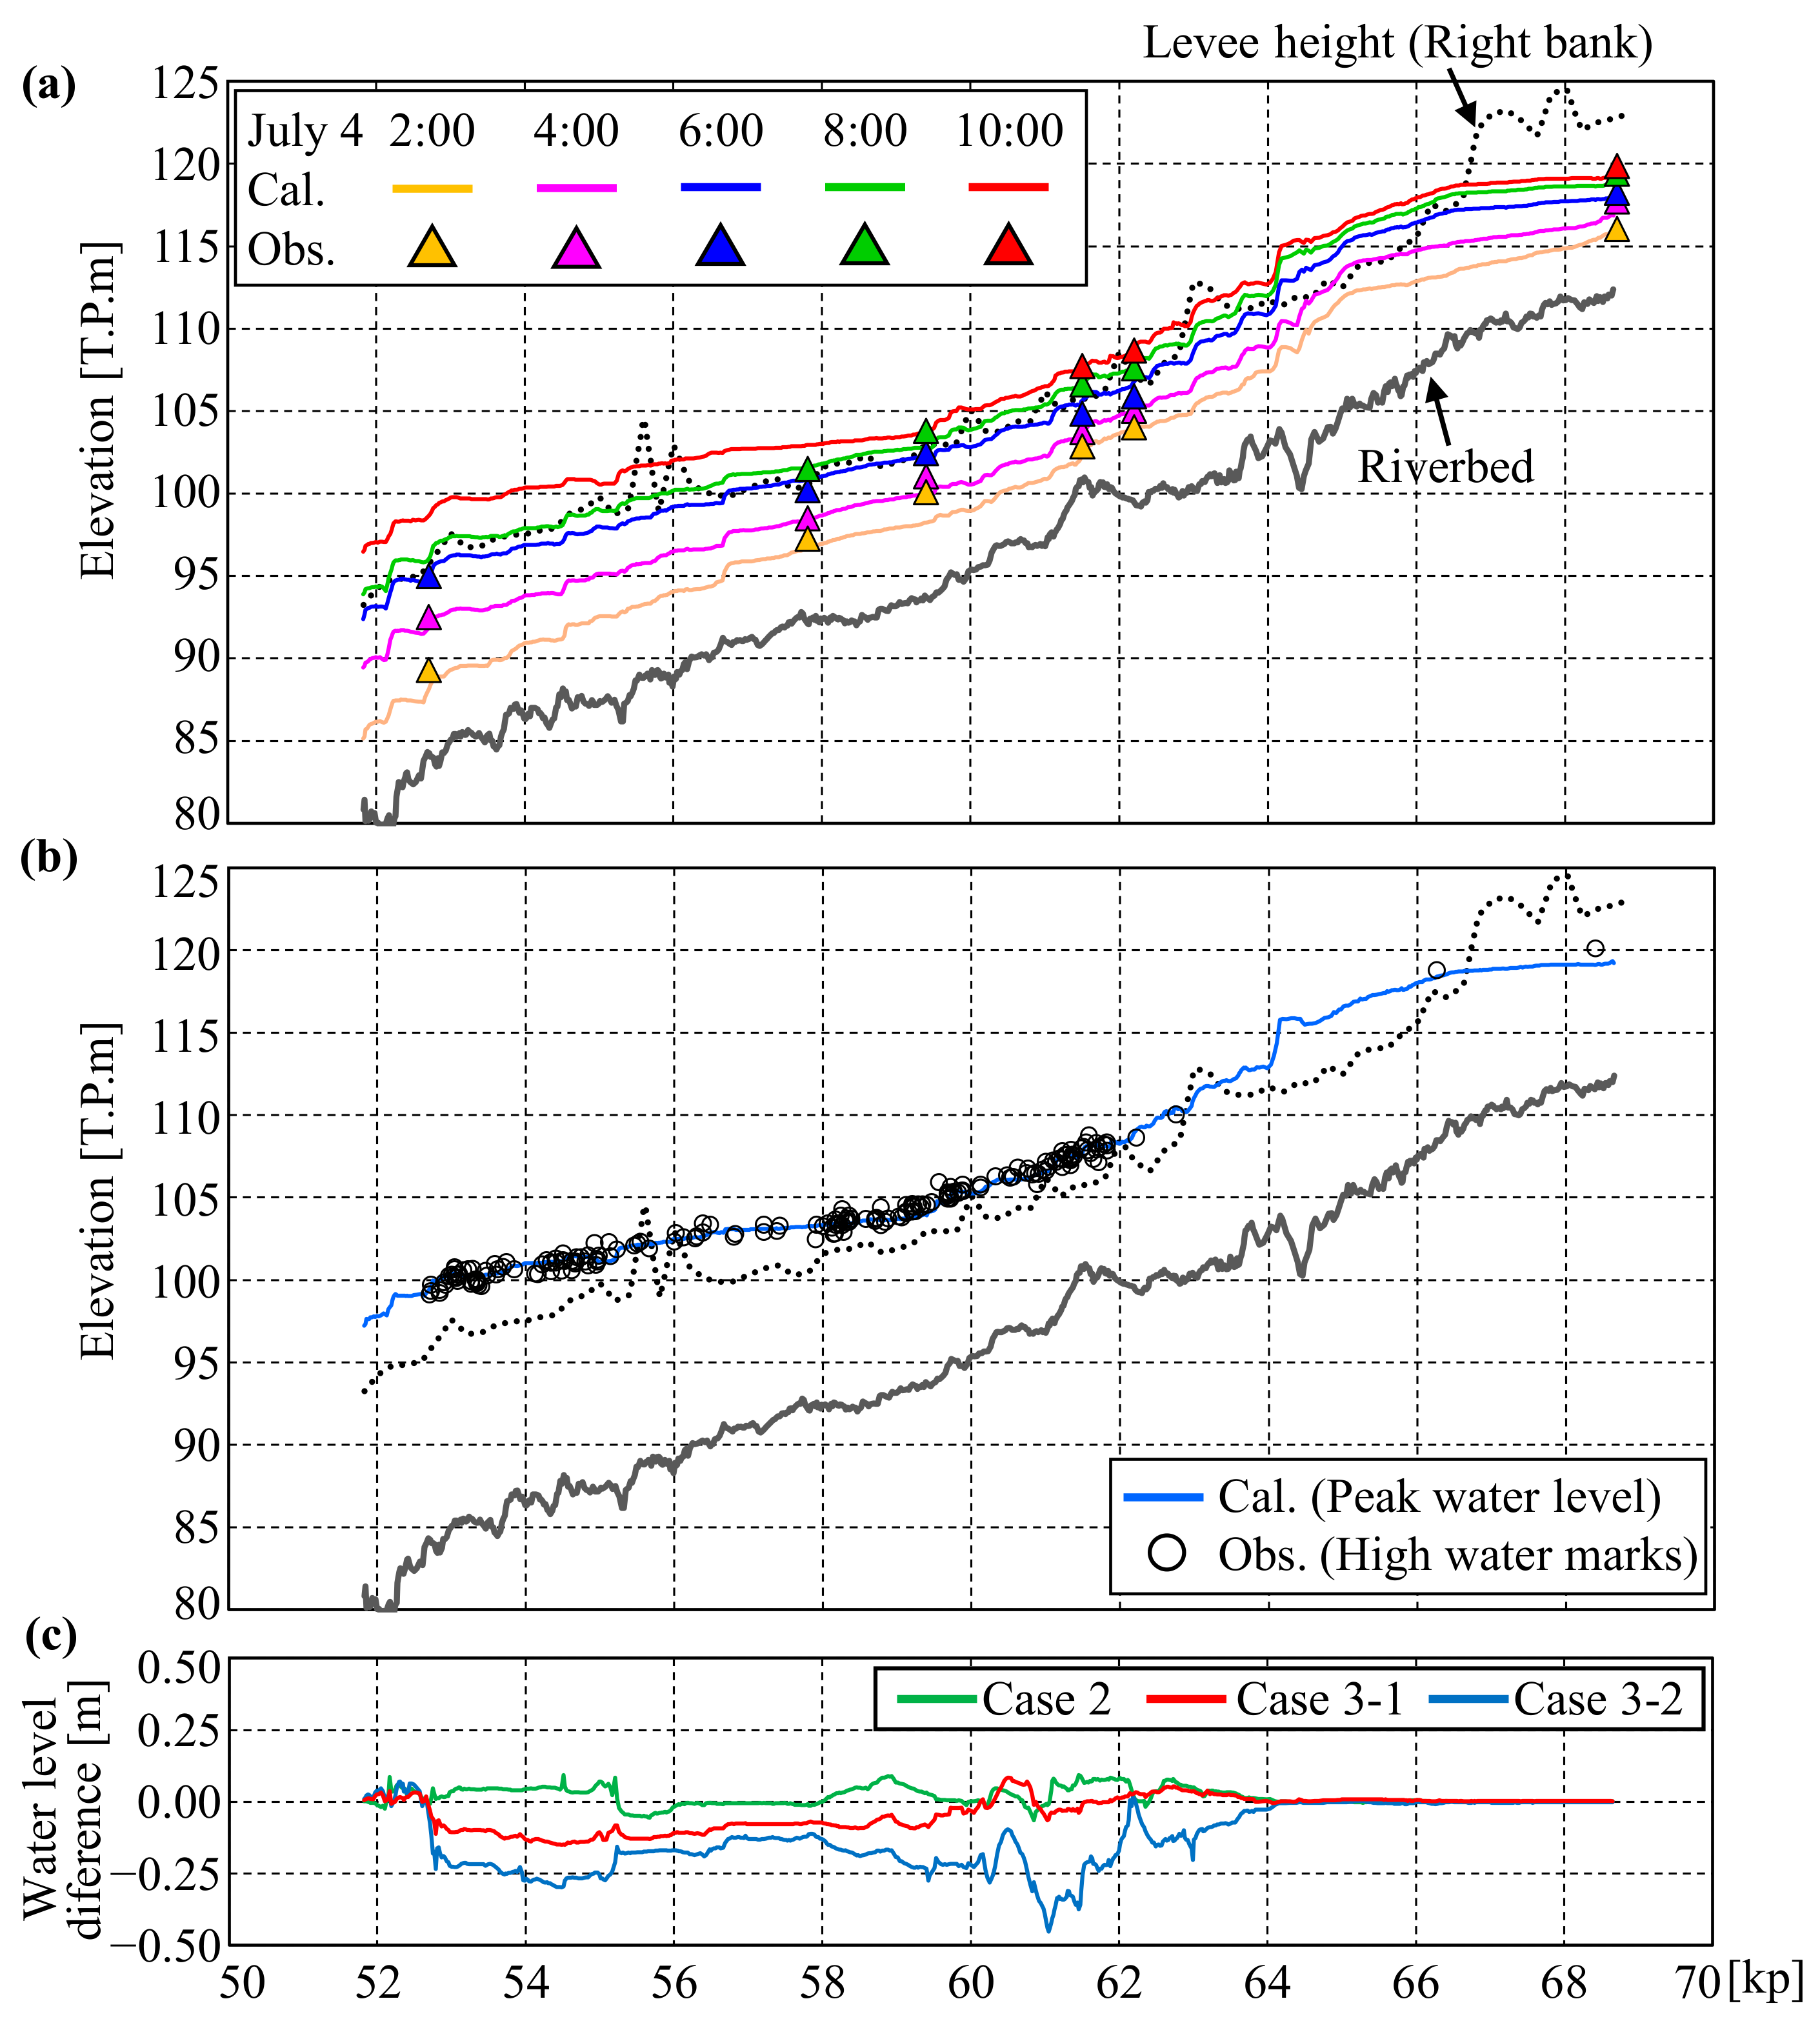

| Peak Water Level | Peak Water Depth | |||||
|---|---|---|---|---|---|---|
| RMSE [m] | Slope | R2 | RMSE [m] | Slope | R2 | |
| Case 1 | 0.3815 | 1.0210 | 0.9898 | 0.4525 | 0.9300 | 0.9367 |
| Case 2 | 0.3626 | 1.0200 | 0.9902 | 0.4421 | 0.9306 | 0.9390 |
| Case 3-1 | 0.4178 | 1.0180 | 0.9875 | 0.4658 | 0.9339 | 0.9261 |
| Case 3-2 | 0.5447 | 1.0060 | 0.9897 | 0.5480 | 0.9452 | 0.9343 |
Disclaimer/Publisher’s Note: The statements, opinions and data contained in all publications are solely those of the individual author(s) and contributor(s) and not of MDPI and/or the editor(s). MDPI and/or the editor(s) disclaim responsibility for any injury to people or property resulting from any ideas, methods, instructions or products referred to in the content. |
© 2023 by the authors. Licensee MDPI, Basel, Switzerland. This article is an open access article distributed under the terms and conditions of the Creative Commons Attribution (CC BY) license (https://creativecommons.org/licenses/by/4.0/).
Share and Cite
Kubota, R.; Kashiwada, J.; Nihei, Y. Subgrid Model of Fluid Force Acting on Buildings for Three-Dimensional Flood Inundation Simulations. Water 2023, 15, 3166. https://doi.org/10.3390/w15173166
Kubota R, Kashiwada J, Nihei Y. Subgrid Model of Fluid Force Acting on Buildings for Three-Dimensional Flood Inundation Simulations. Water. 2023; 15(17):3166. https://doi.org/10.3390/w15173166
Chicago/Turabian StyleKubota, Riku, Jin Kashiwada, and Yasuo Nihei. 2023. "Subgrid Model of Fluid Force Acting on Buildings for Three-Dimensional Flood Inundation Simulations" Water 15, no. 17: 3166. https://doi.org/10.3390/w15173166
APA StyleKubota, R., Kashiwada, J., & Nihei, Y. (2023). Subgrid Model of Fluid Force Acting on Buildings for Three-Dimensional Flood Inundation Simulations. Water, 15(17), 3166. https://doi.org/10.3390/w15173166


