Study on Dynamic Early Warning of Flash Floods in Hubei Province
Abstract
:1. Introduction
2. Materials and Methods
2.1. Study Area
2.2. Data Collection
2.3. Modelling Approaches
2.3.1. Dynamic Rainfall Warning Threshold Analysis Method
2.3.2. Hydrological Model
3. Dynamic Warning Threshold Analysis
3.1. Warning Period
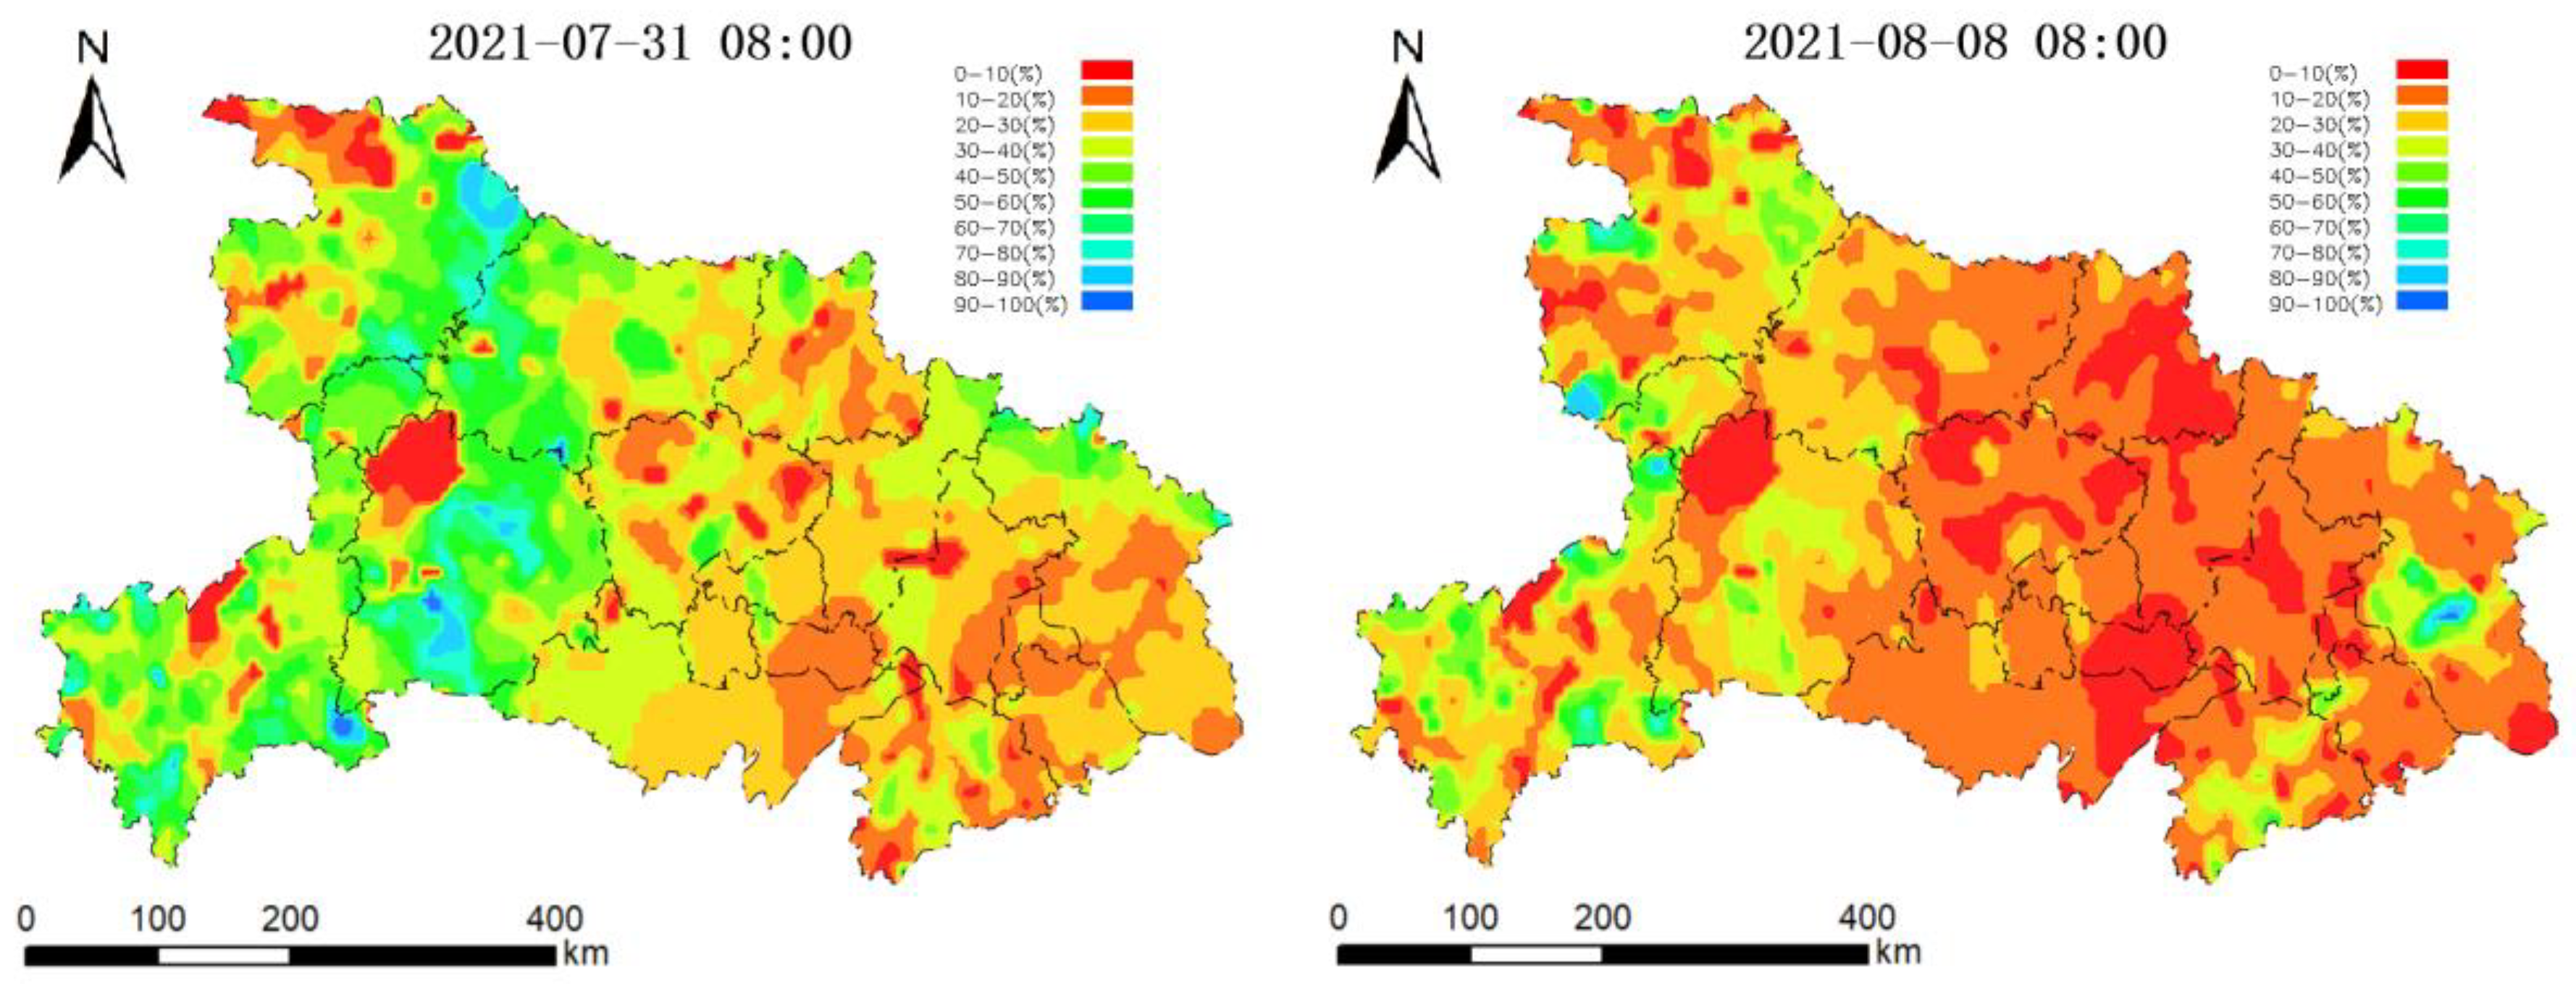
3.2. Soil Moisture Content
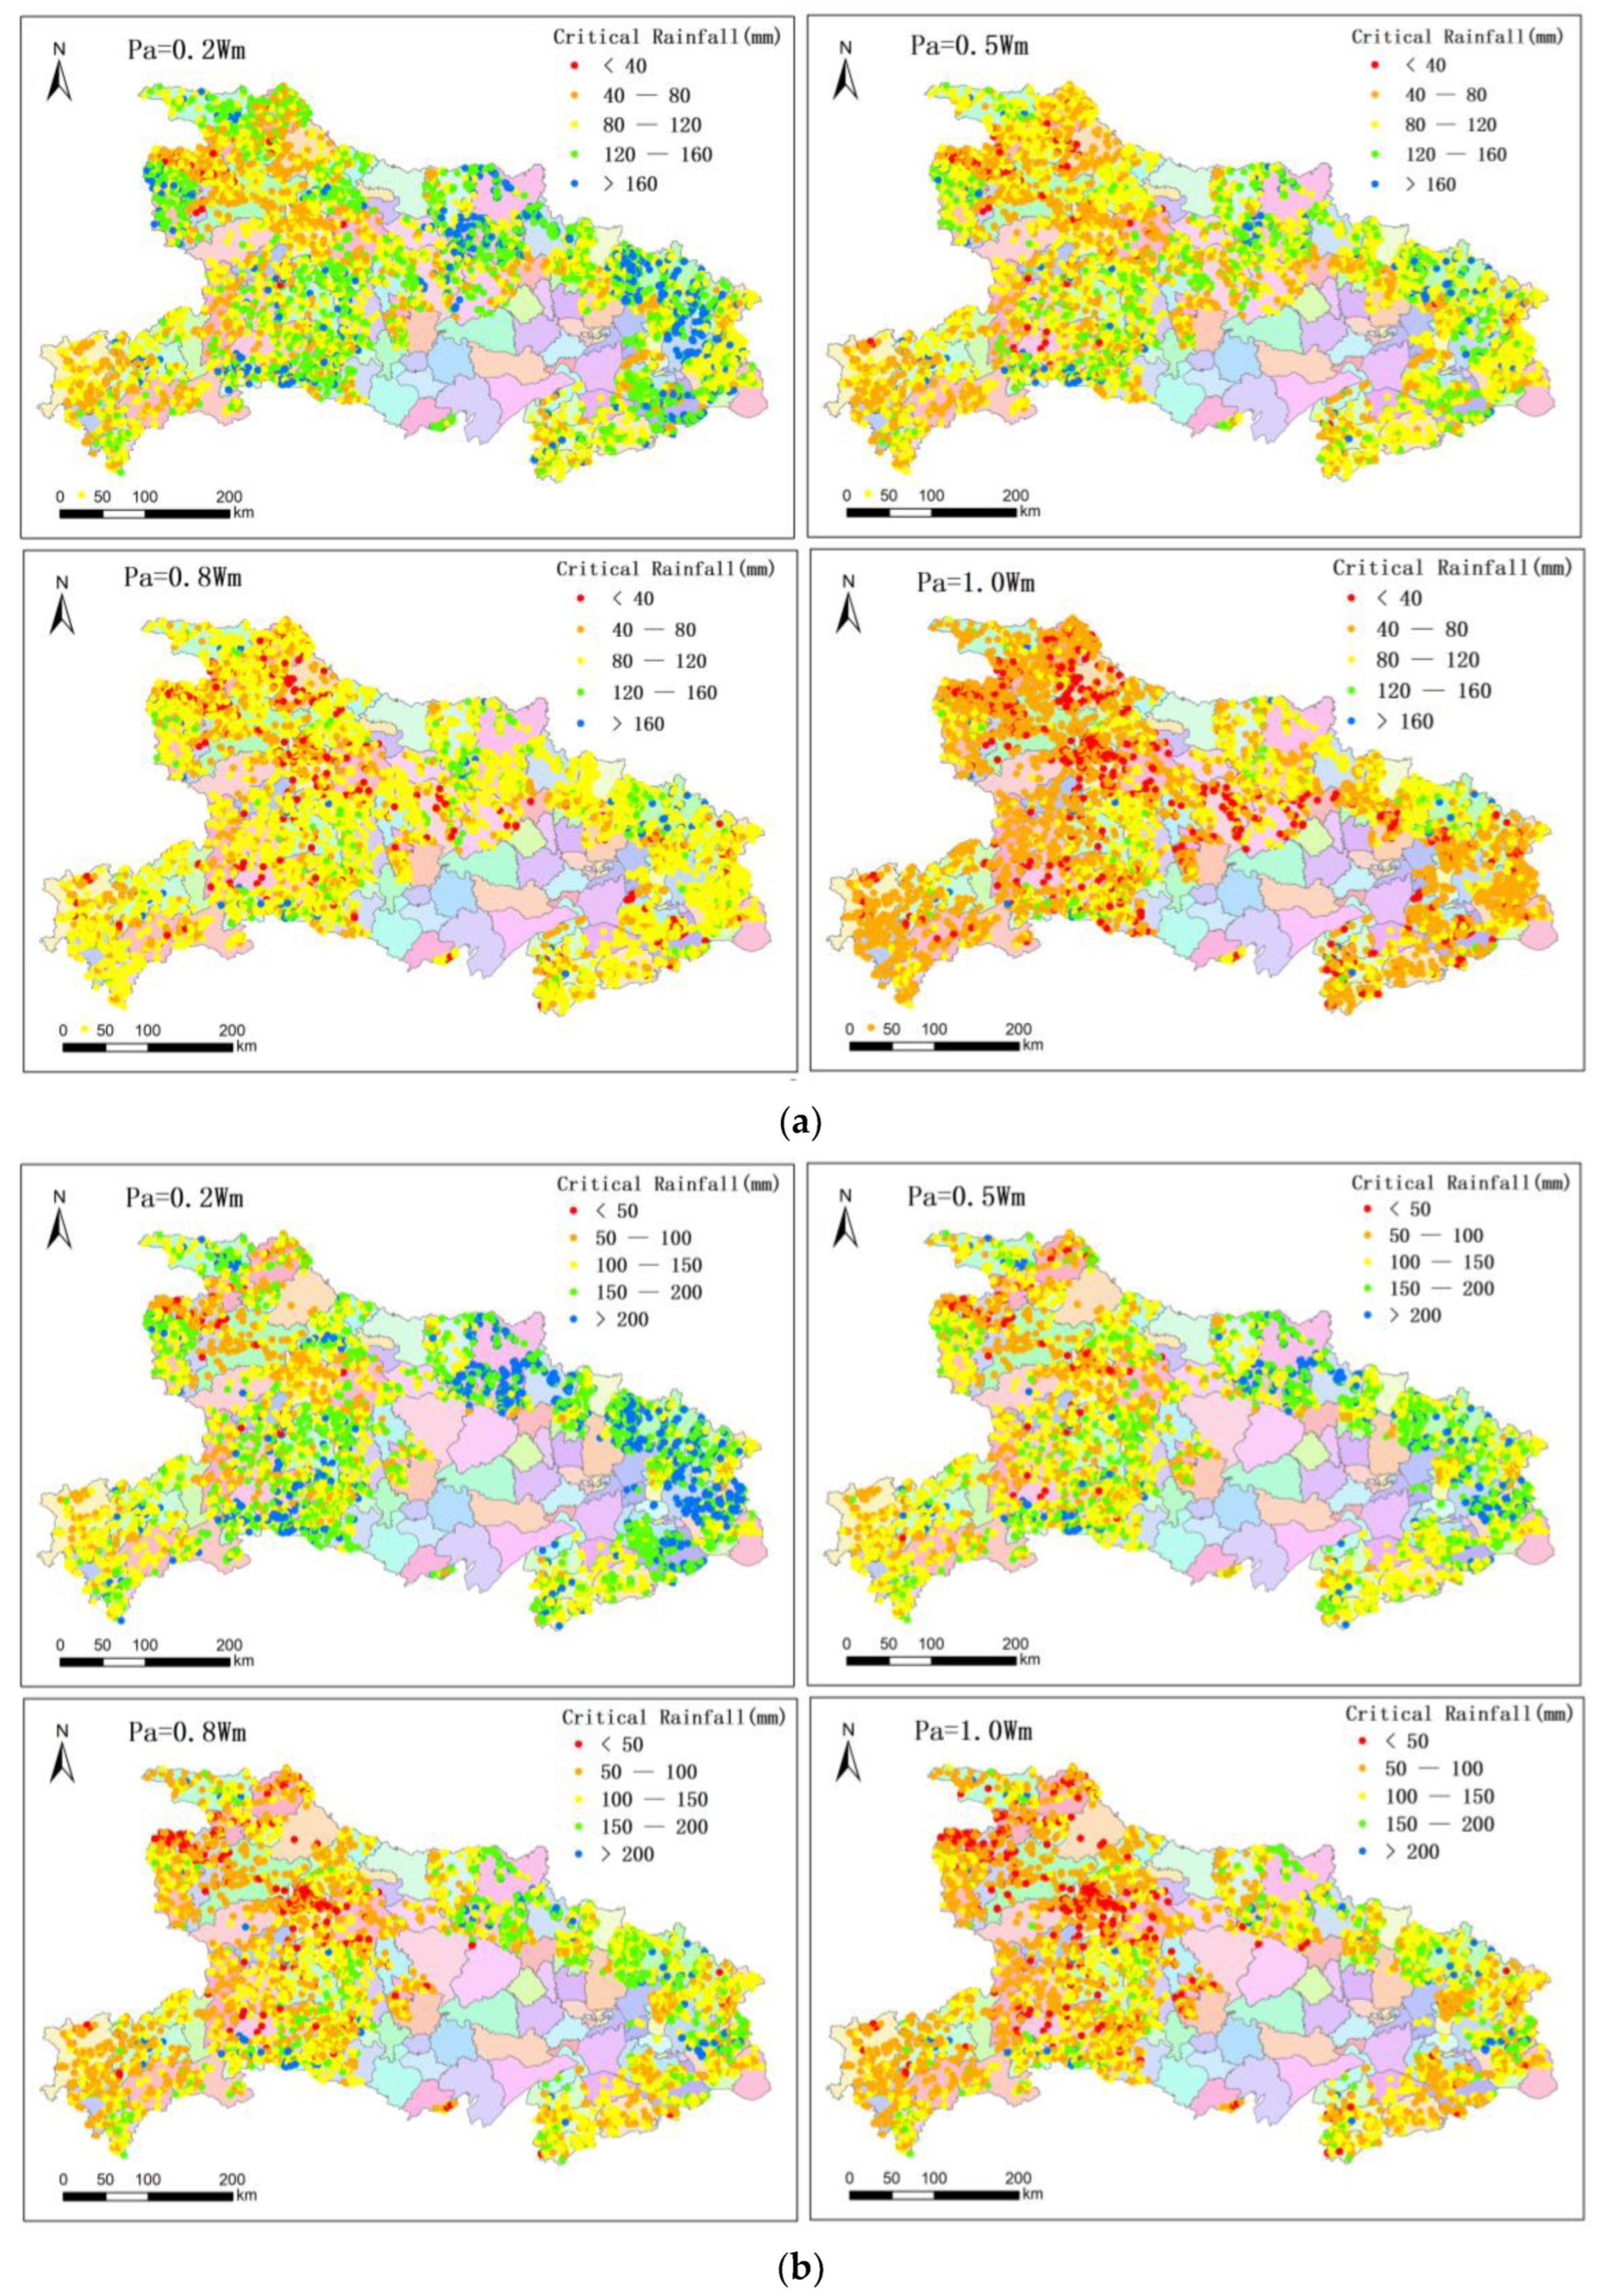
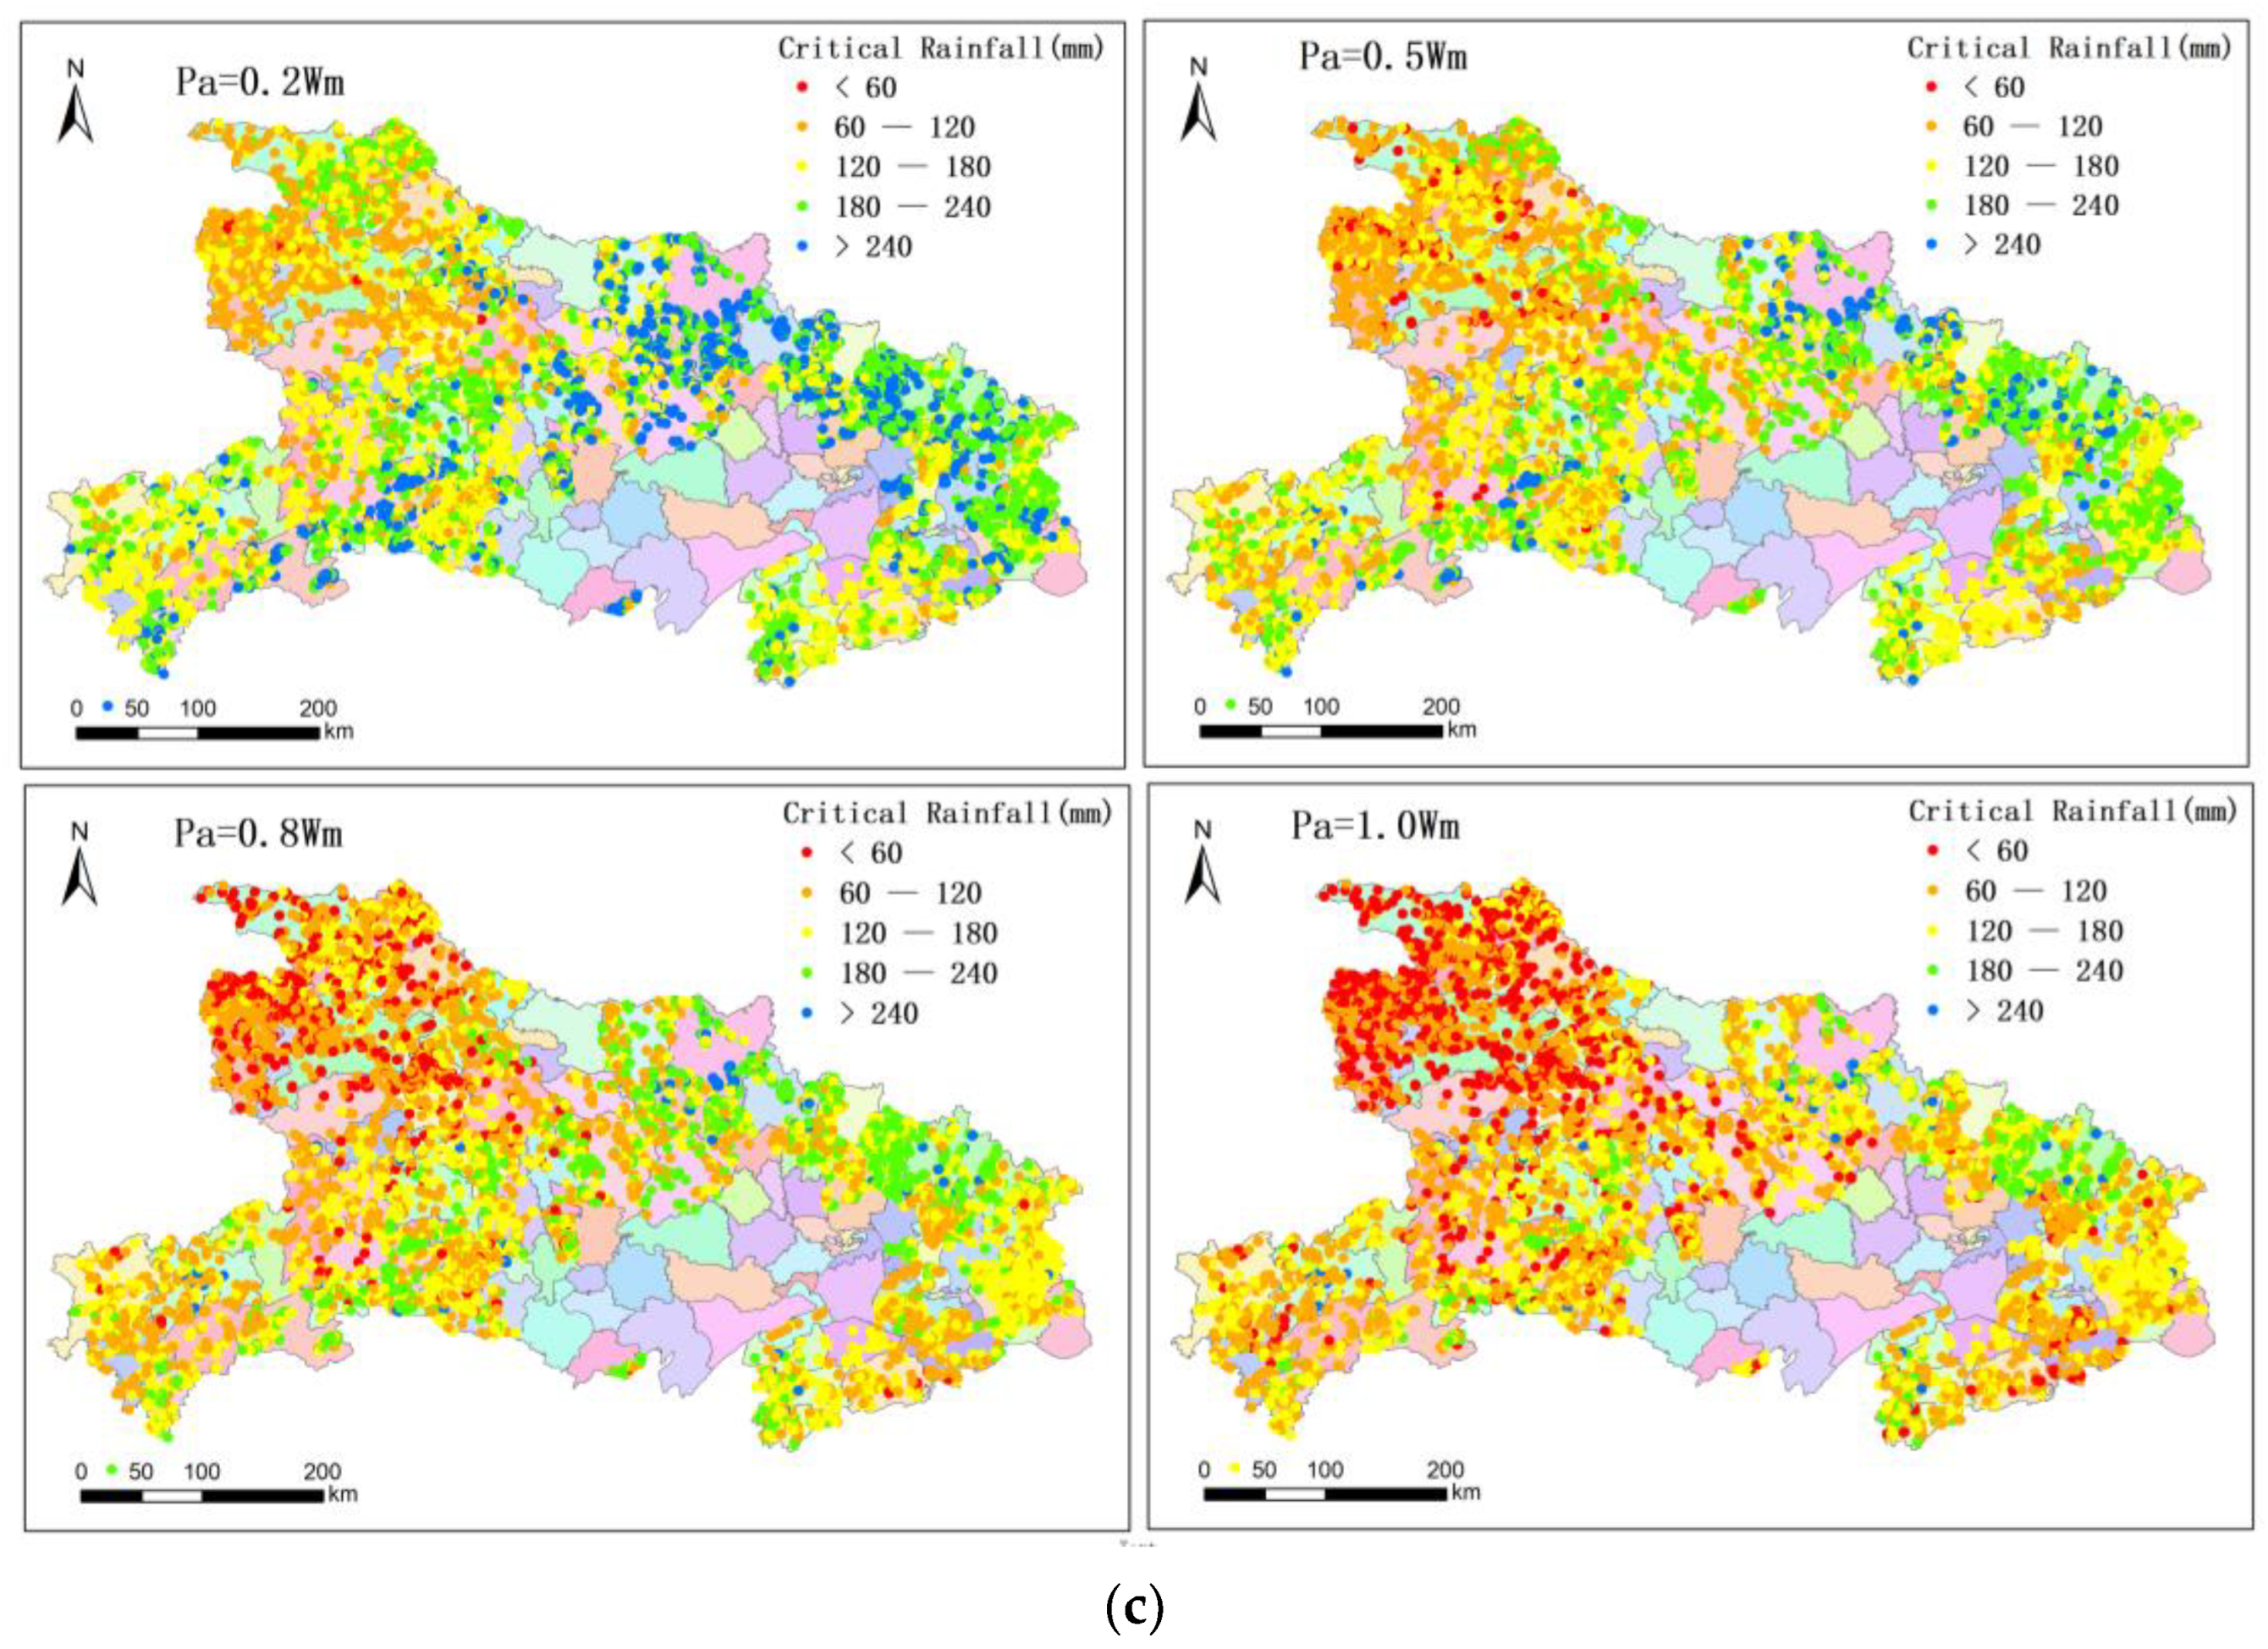
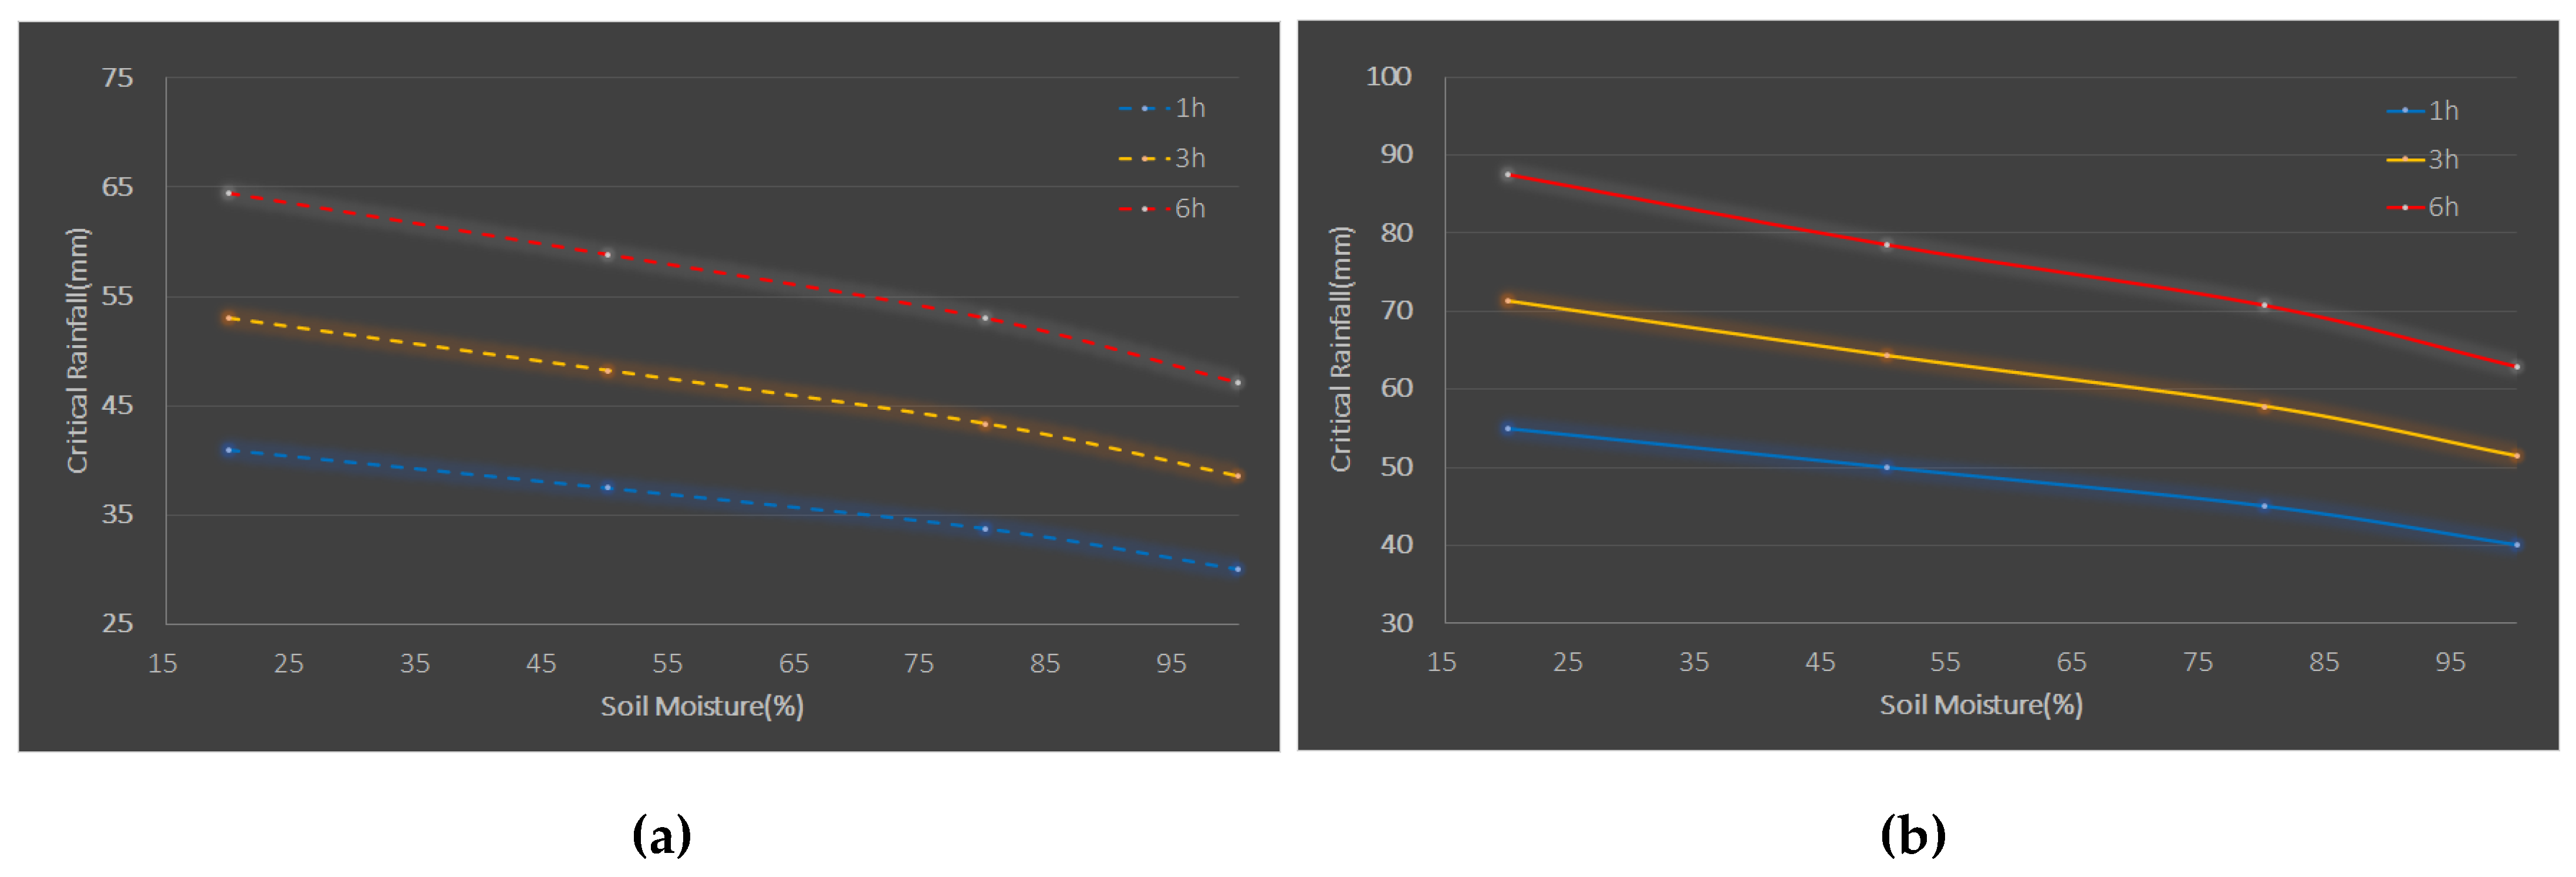
3.3. Critical Rainfall
4. Result and Discussion
5. Conclusions
- (1)
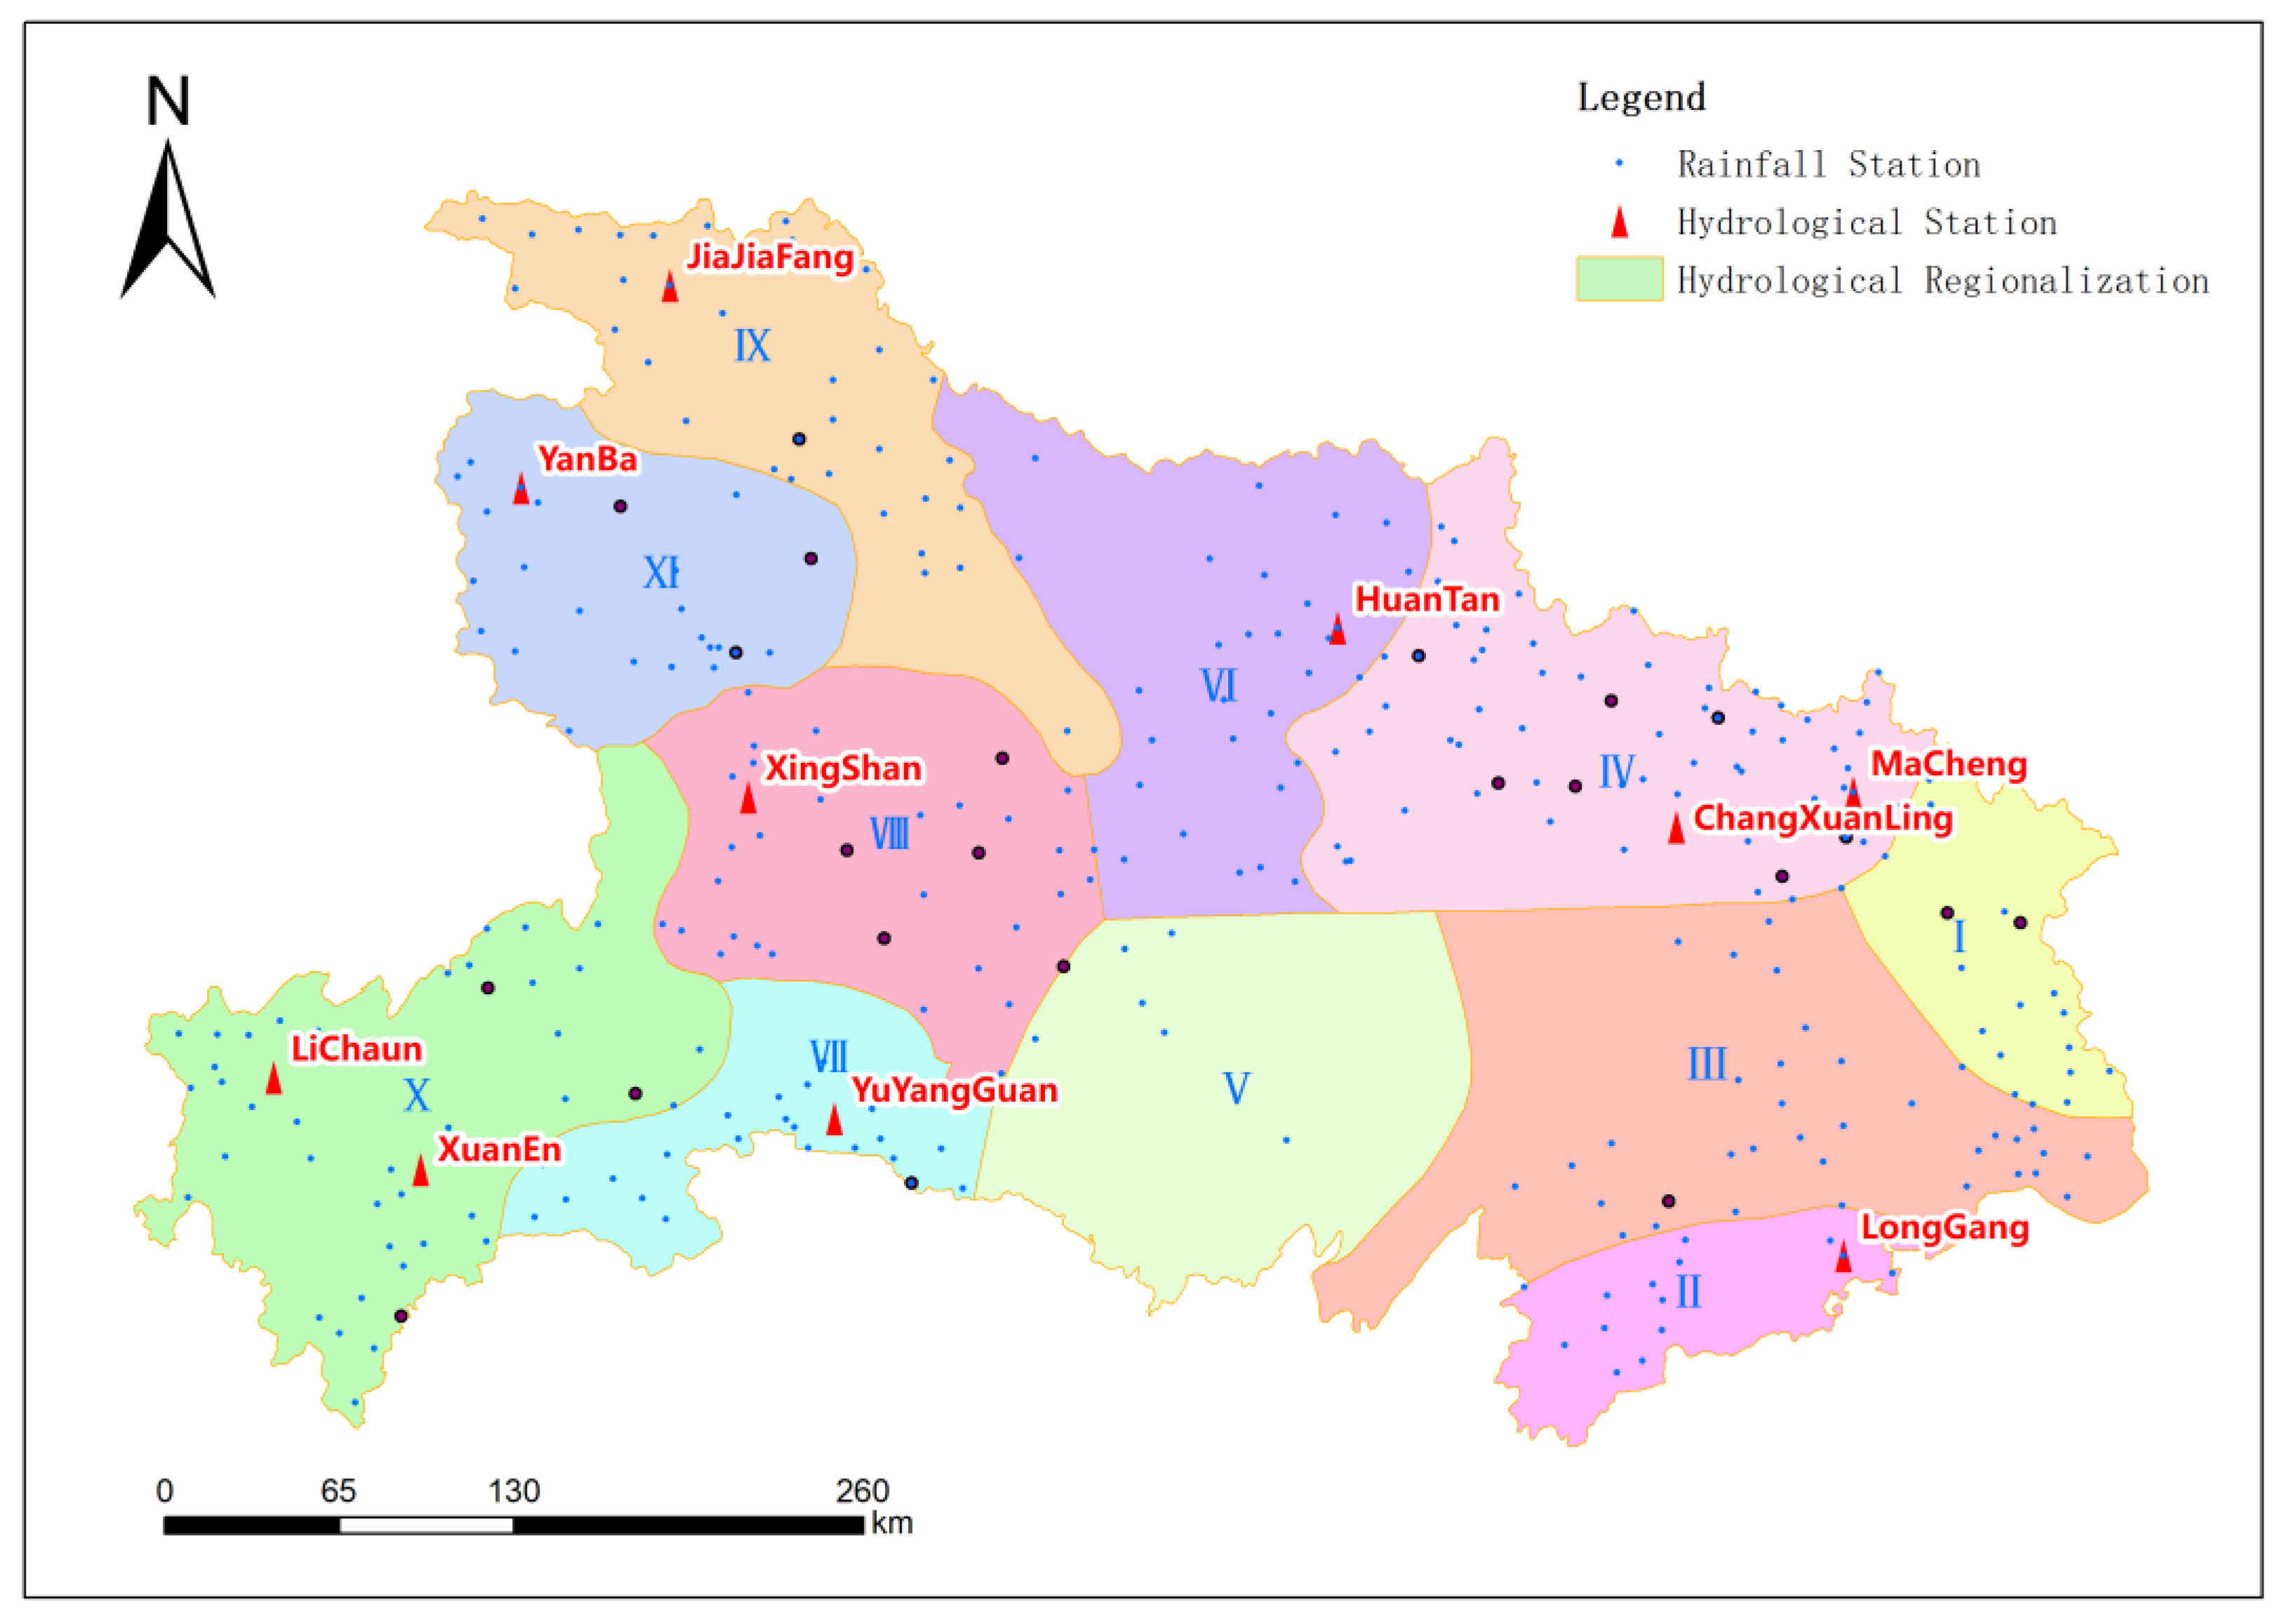
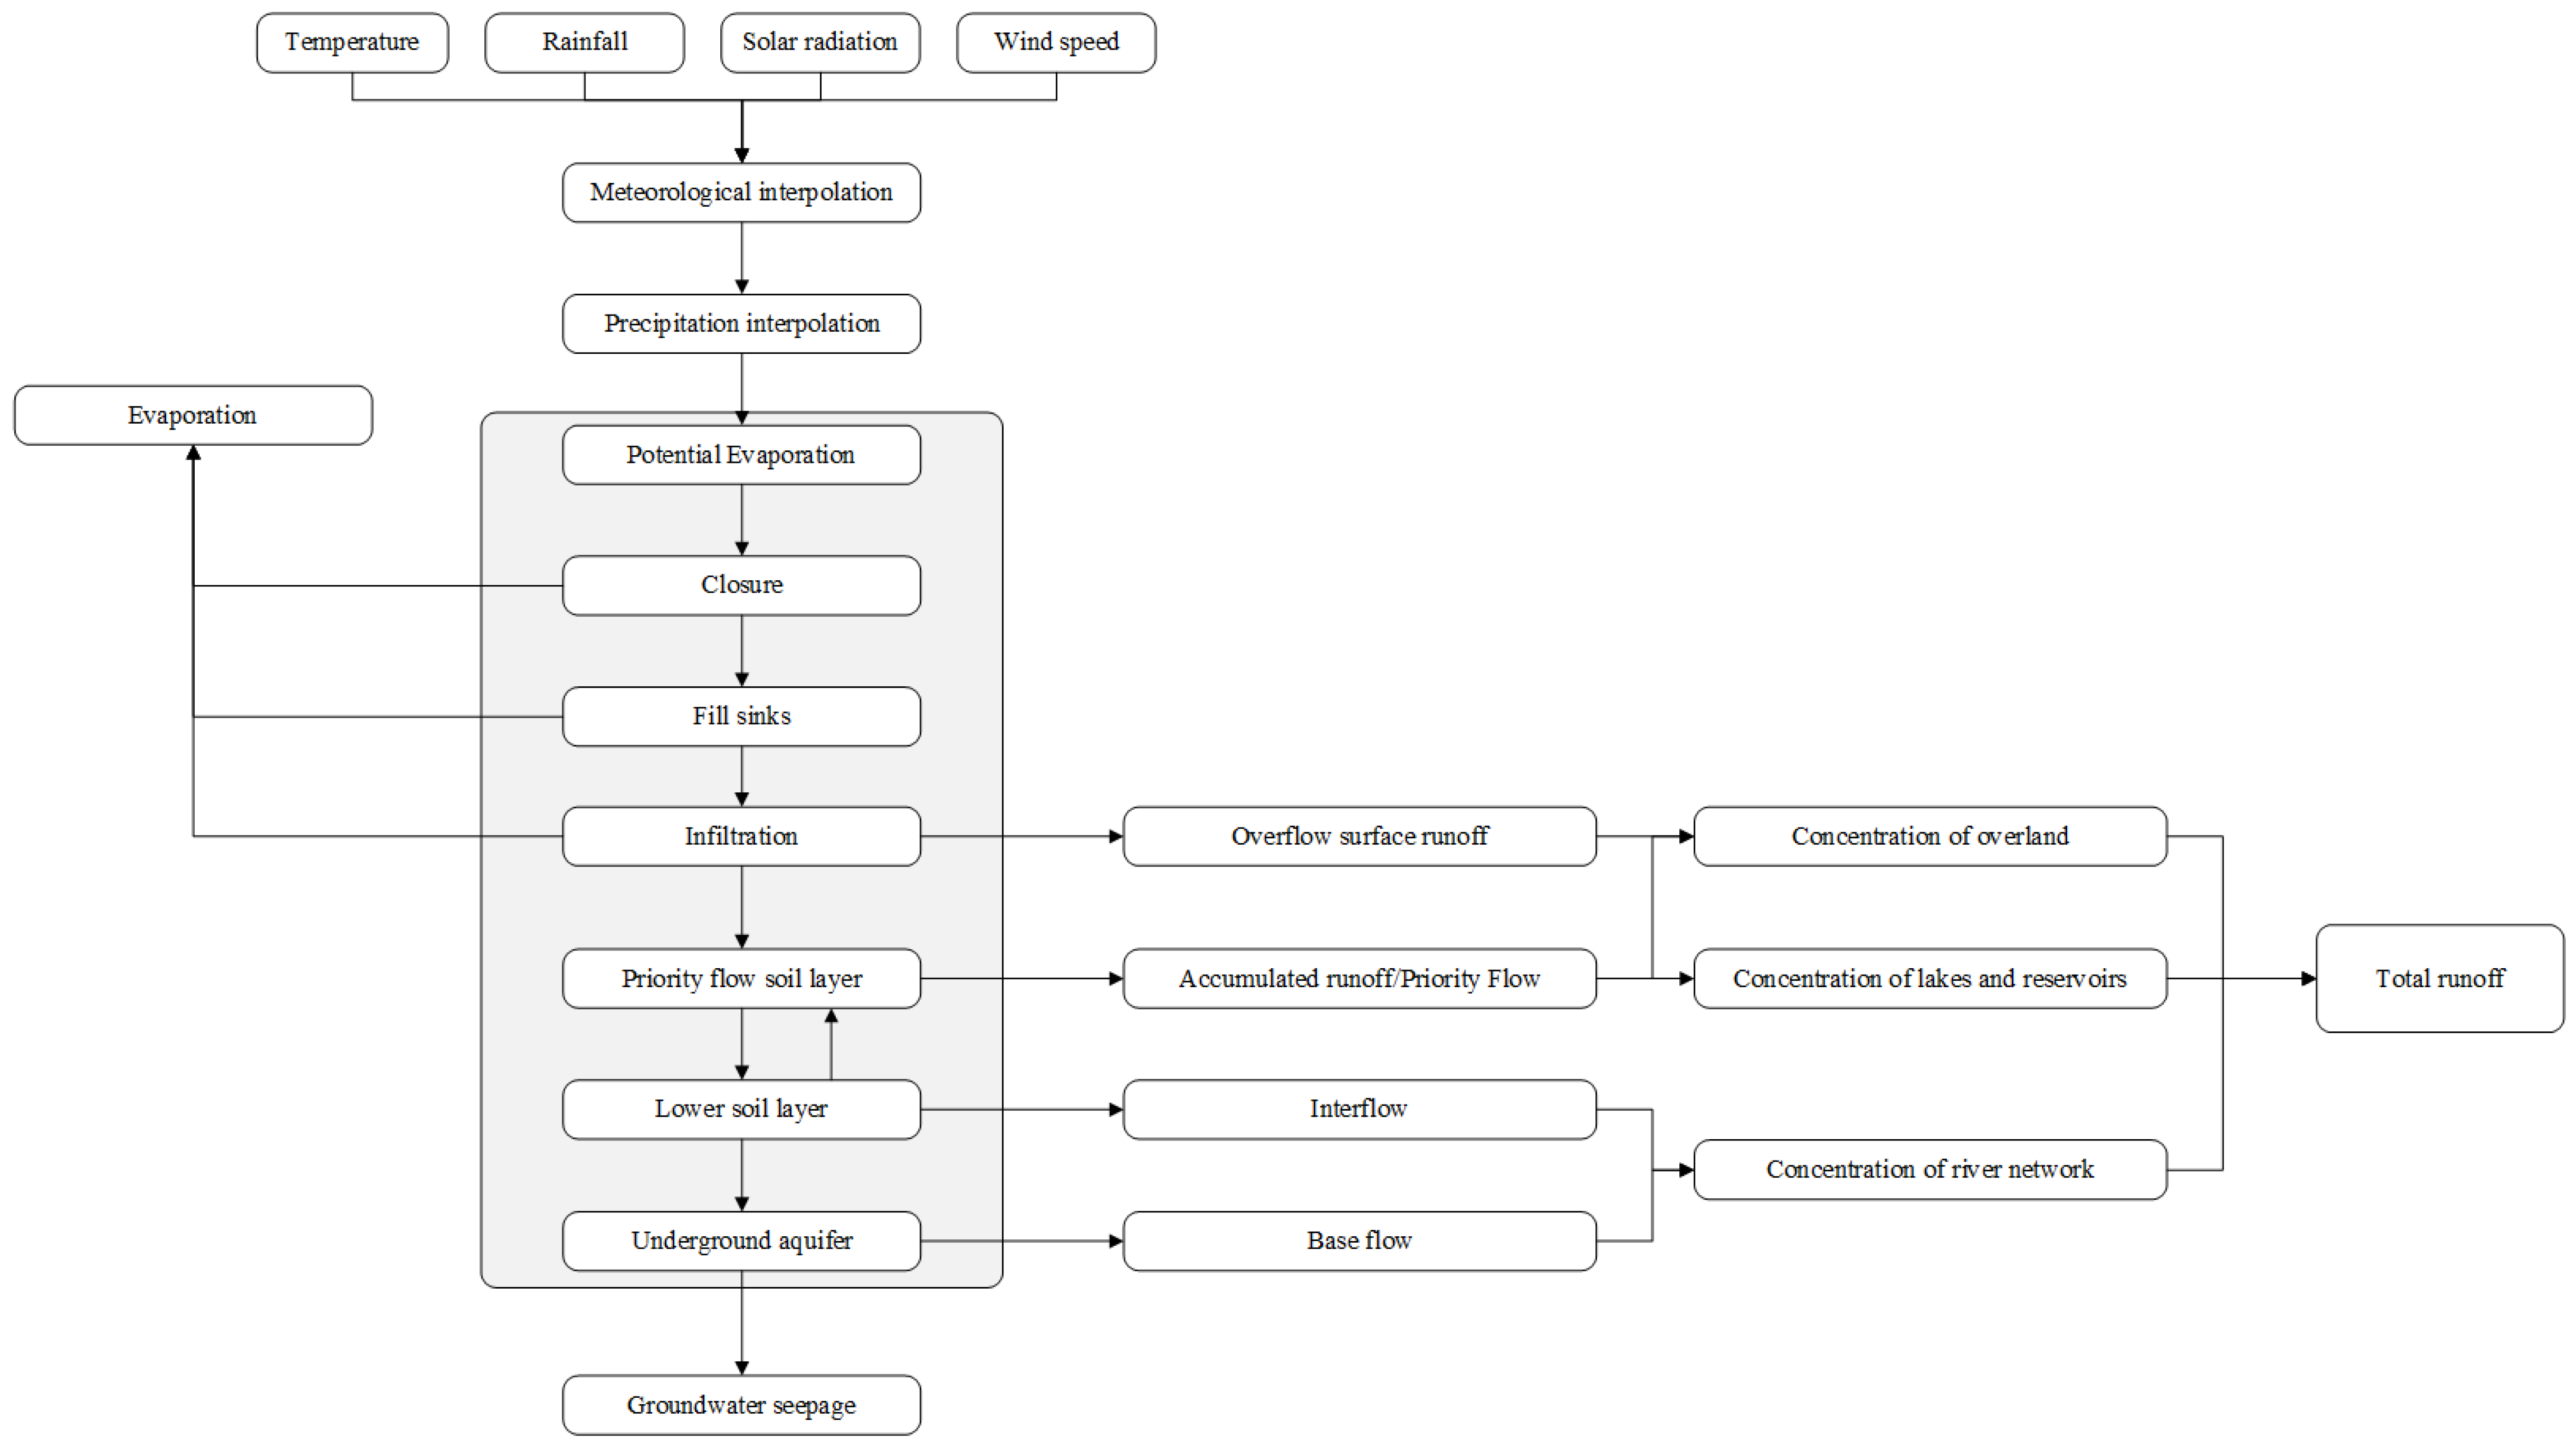
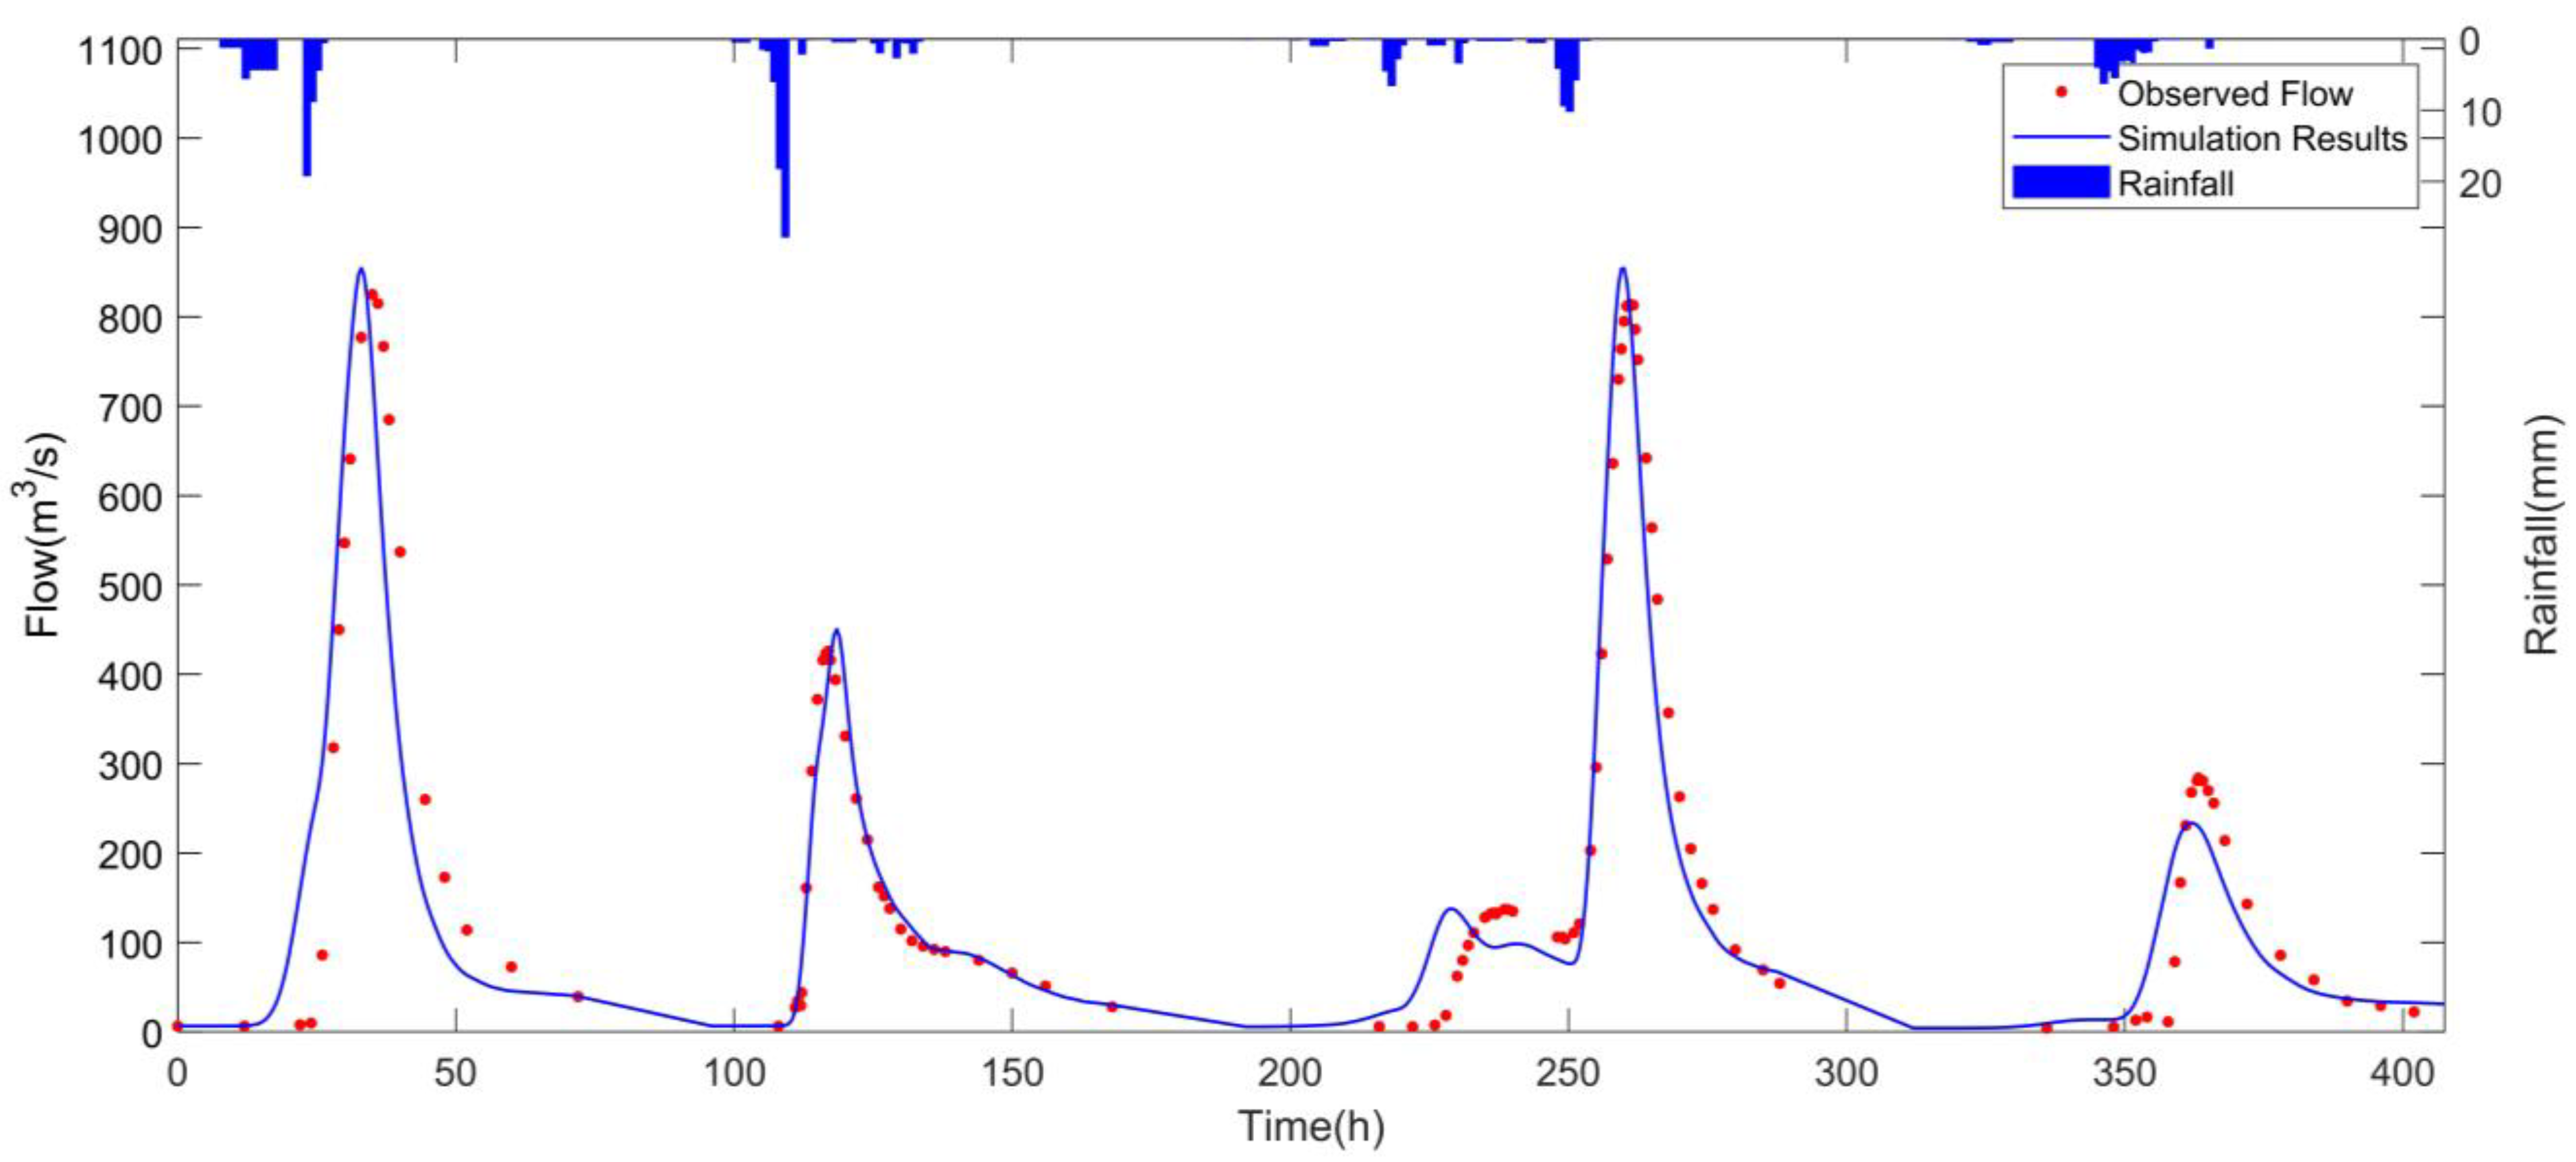
- A total of 108 rainstorm flood processes in 10 typical small and medium-sized rivers were selected from different hydrological zones across Hubei Province for rainfall-runoff simulation. The data selected span from 1970 to 2021, involving 10 hydrological stations and 105 rainfall stations. According to the simulation results of the 108 rainstorm floods, 66 had a flood peak error of no more than 20%, accounting for 61.1% of the total; 84 had a flood volume error of no more than 20%, accounting for 77.8%; 30 and 69 had a Nash–Sutcliffe coefficient of no less than 0.85 and 0.7, respectively, accounting for 27.8% and 63.9%. This suggests the strong applicability of the spatio-temporally mixed model in Hubei Province, which also lays a solid foundation for the calculation of soil moisture and the analysis of dynamic early warning thresholds.
- (2)
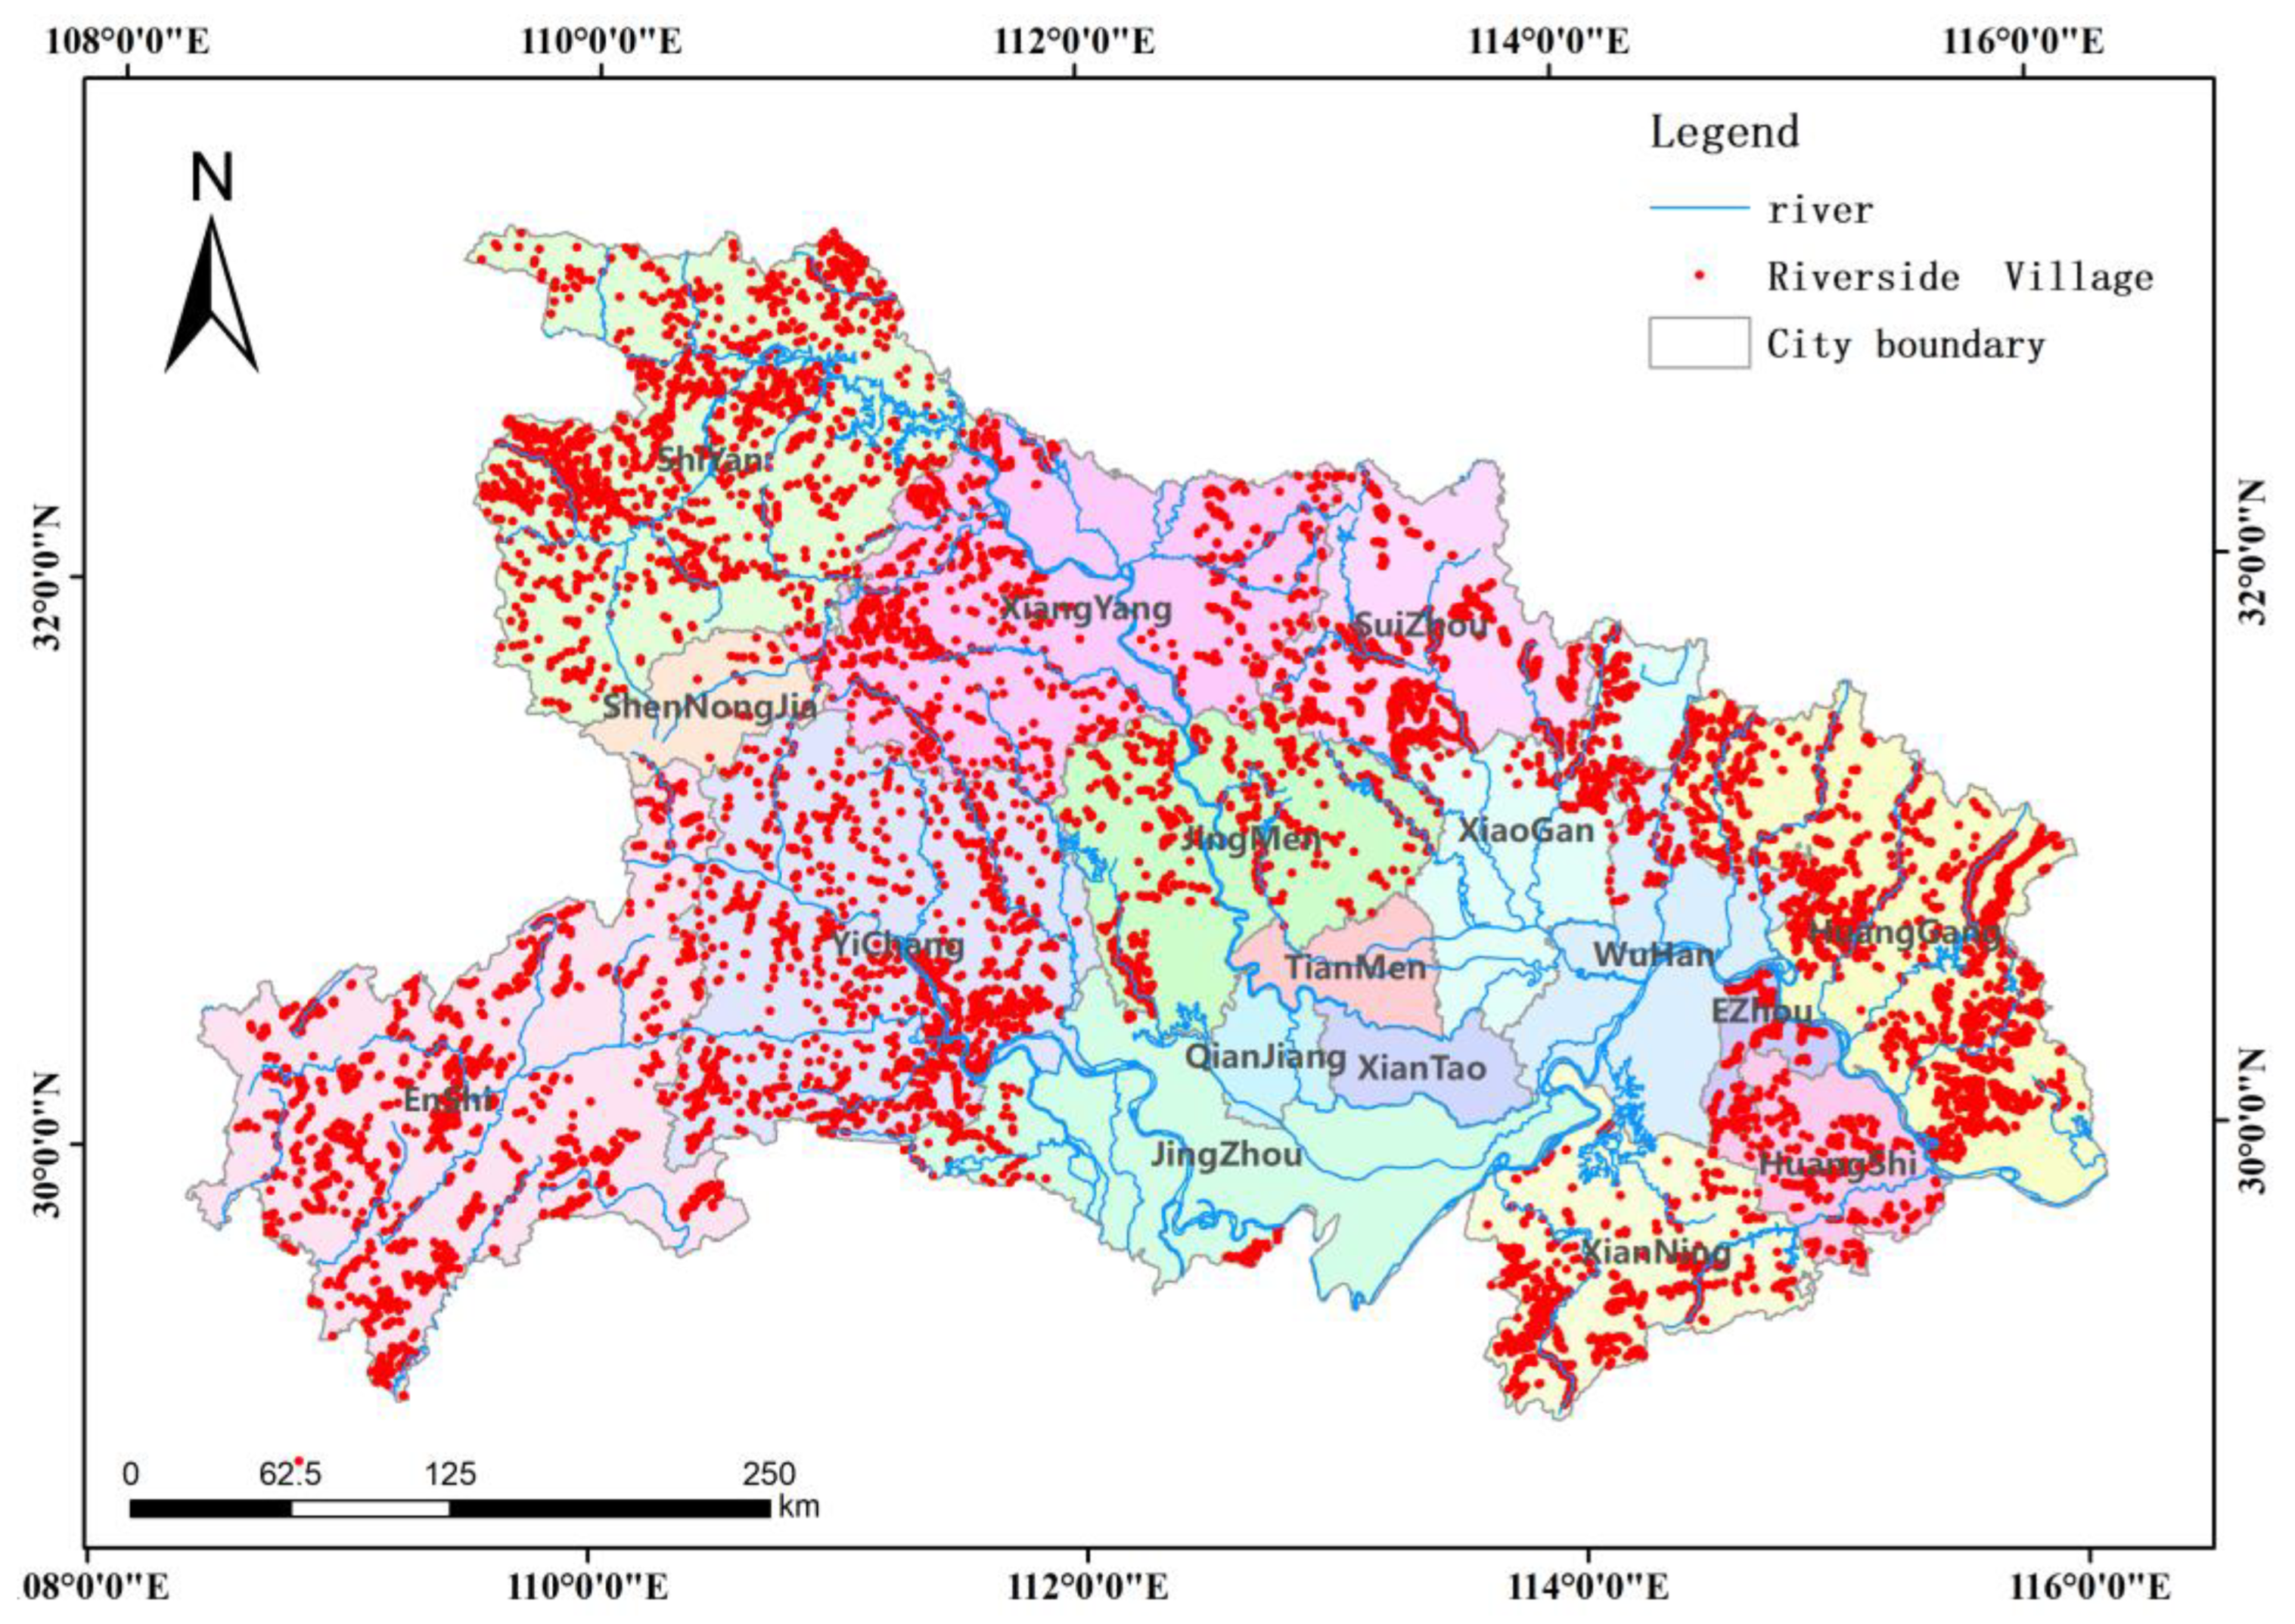
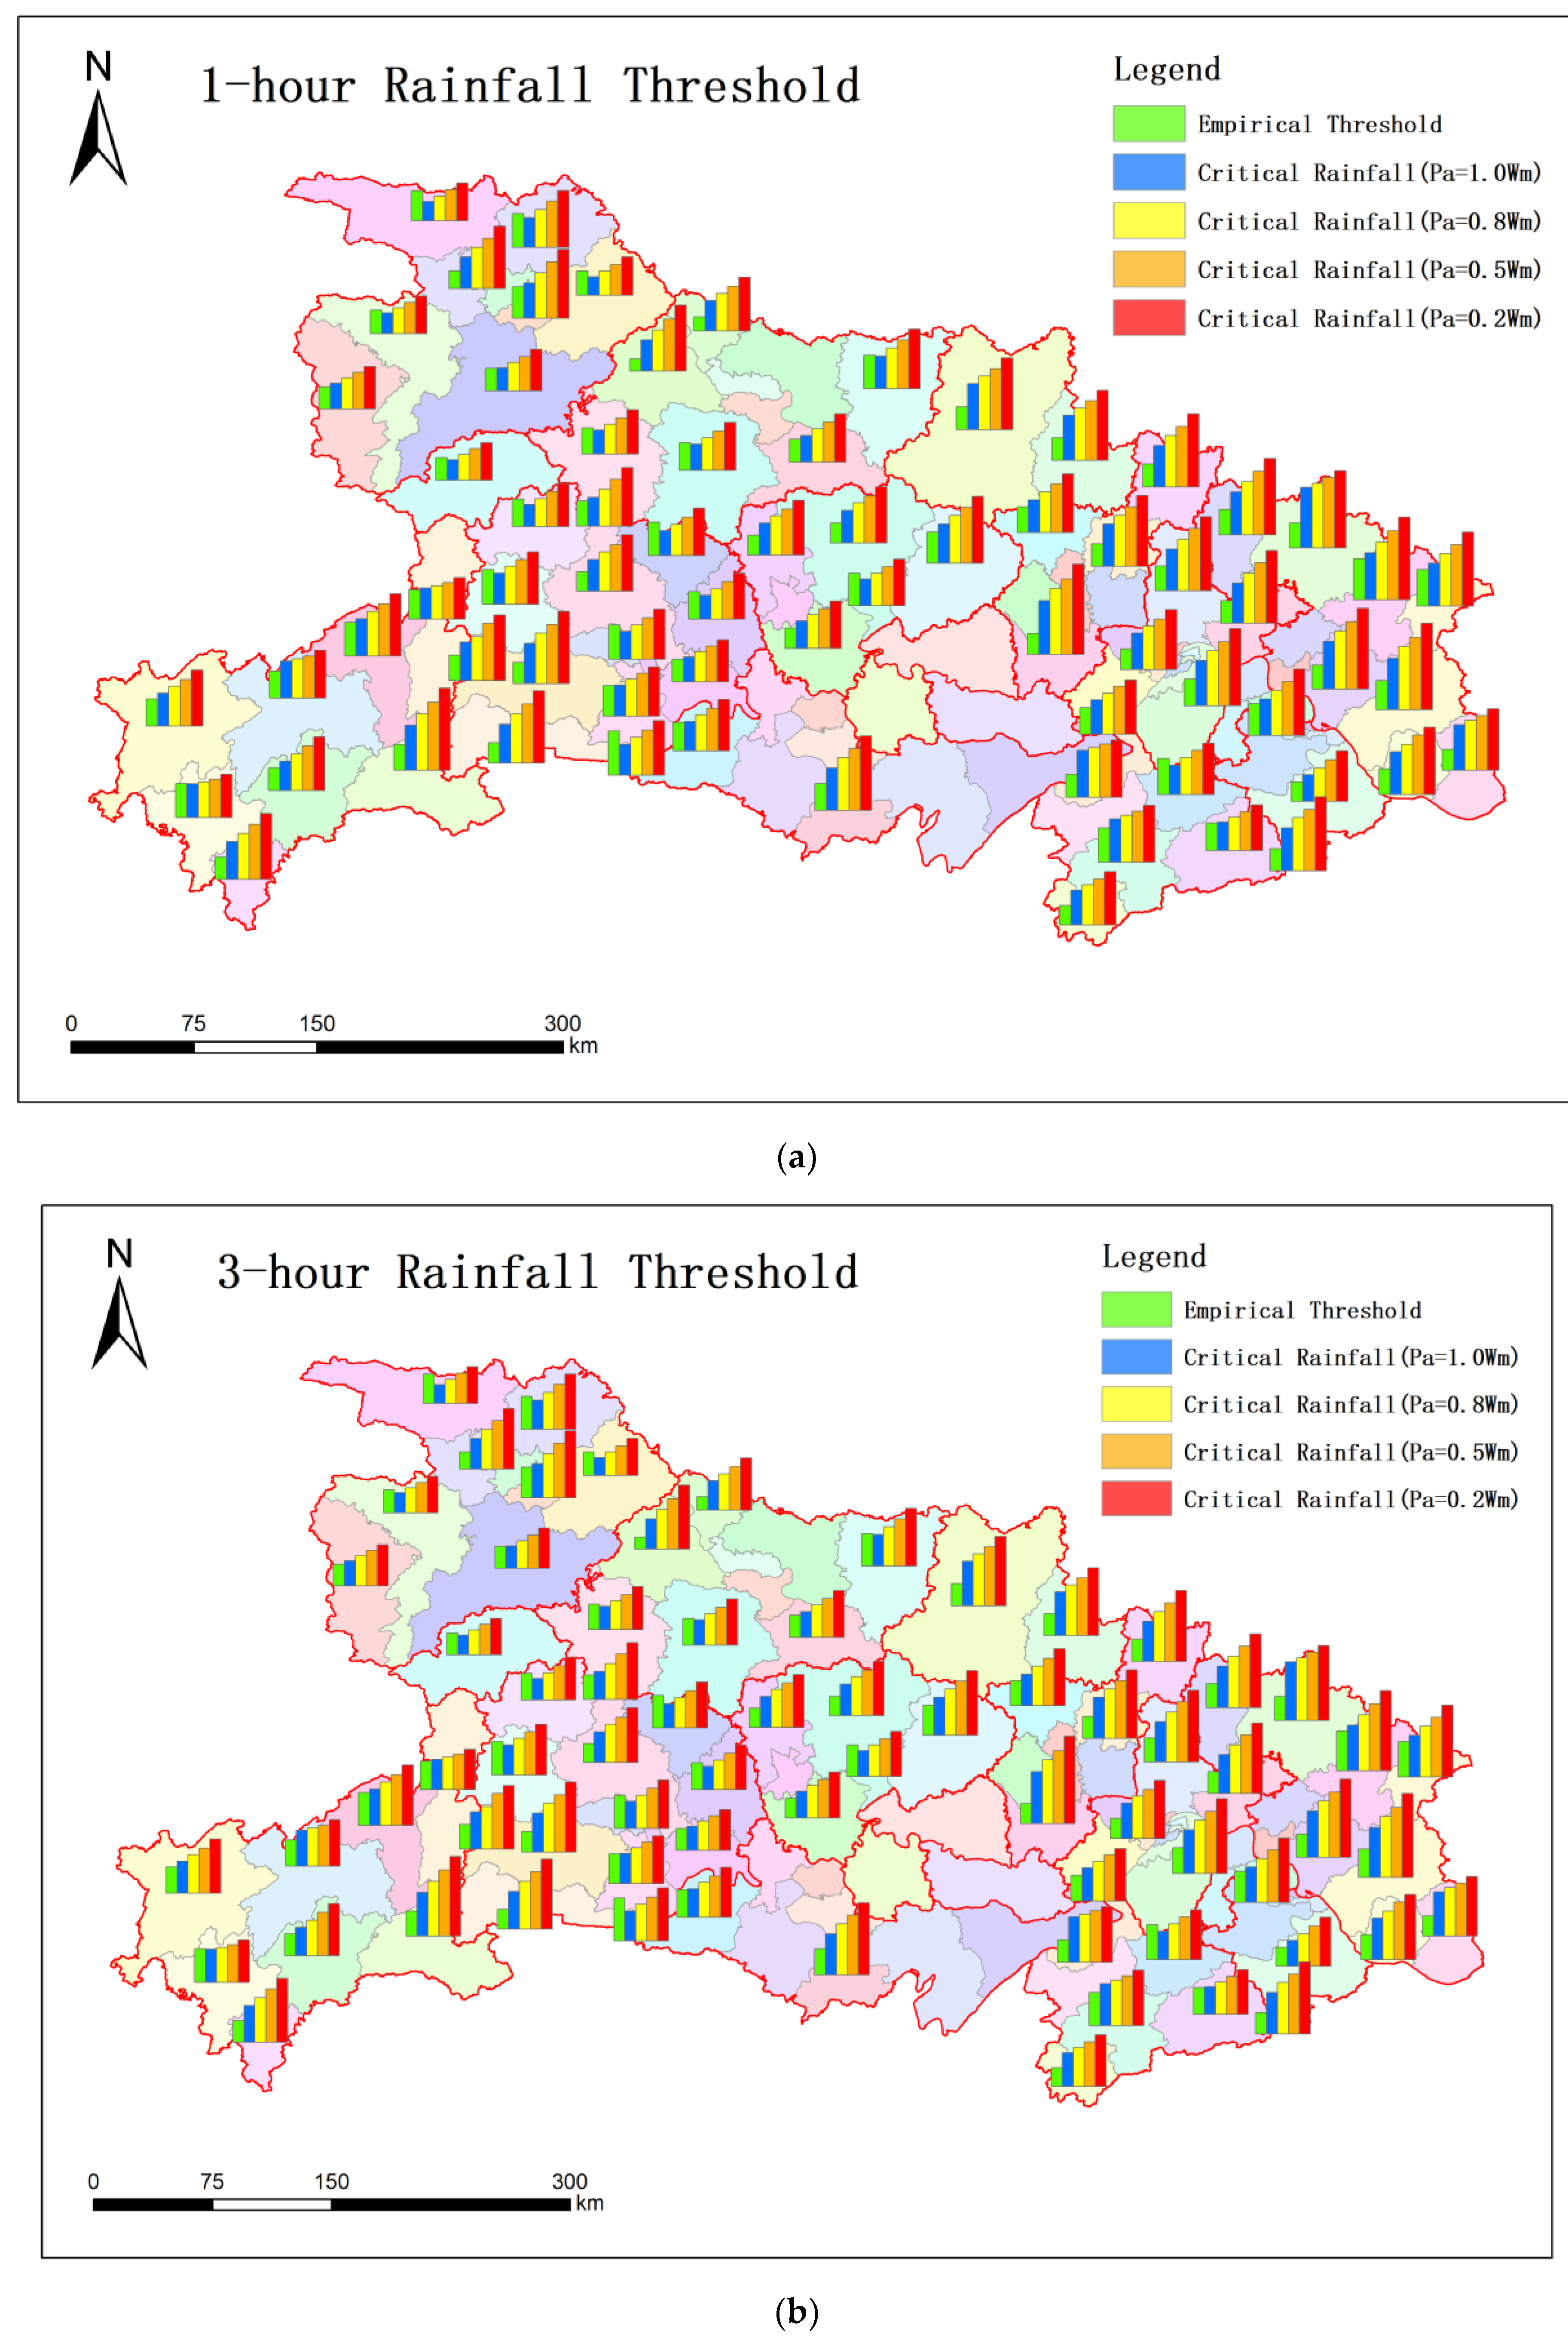
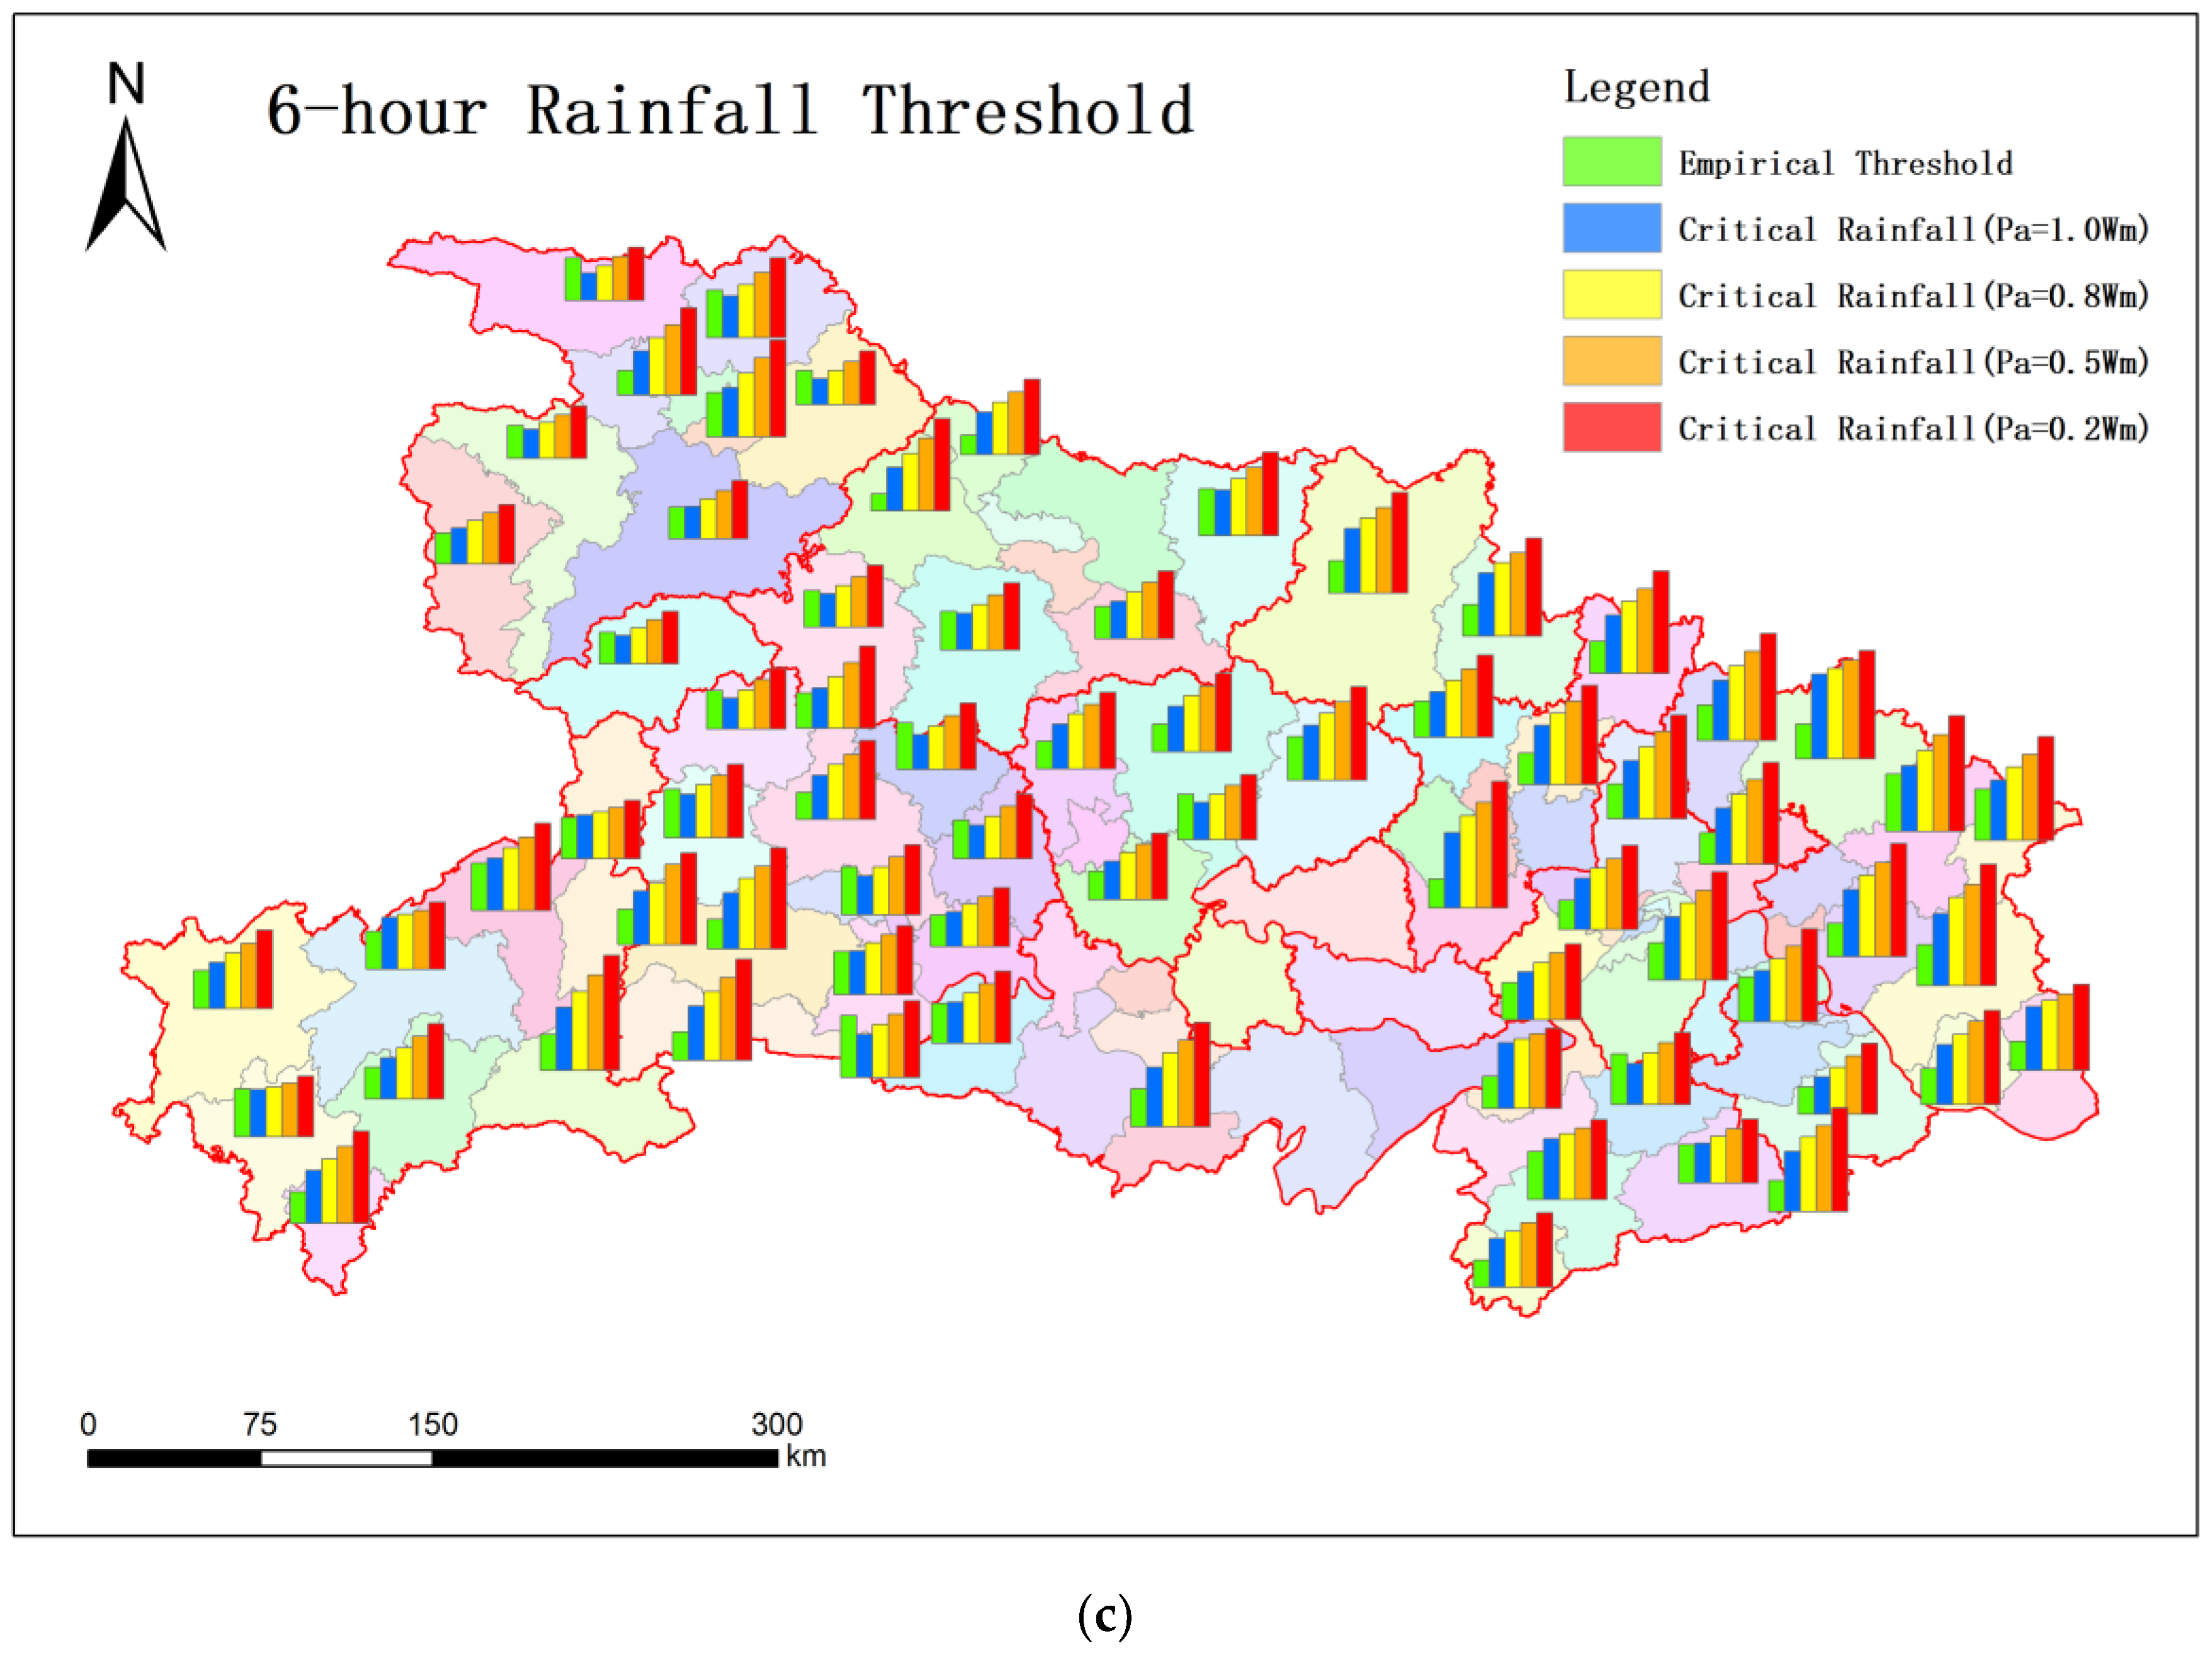
- Through analysis and pilot calculations based on the distributed model, the study determined the critical early warning thresholds for 12,893 riverside villages under different soil moisture conditions and analyzed the 1 h, 3 h, and 6 h critical rainfall thresholds under different soil moisture conditions in affected areas in Hubei Province. The lowest critical rainfall threshold was observed in northwestern Hubei and the highest was in northern Hubei. Among the 14 prefecture-level cities, the lowest critical rainfall threshold occurs in Shiyan and the highest in Suizhou, and the mean critical rainfall in Shiyan is 30–50% lower than that in Suizhou under different soil moisture conditions.
- (3)
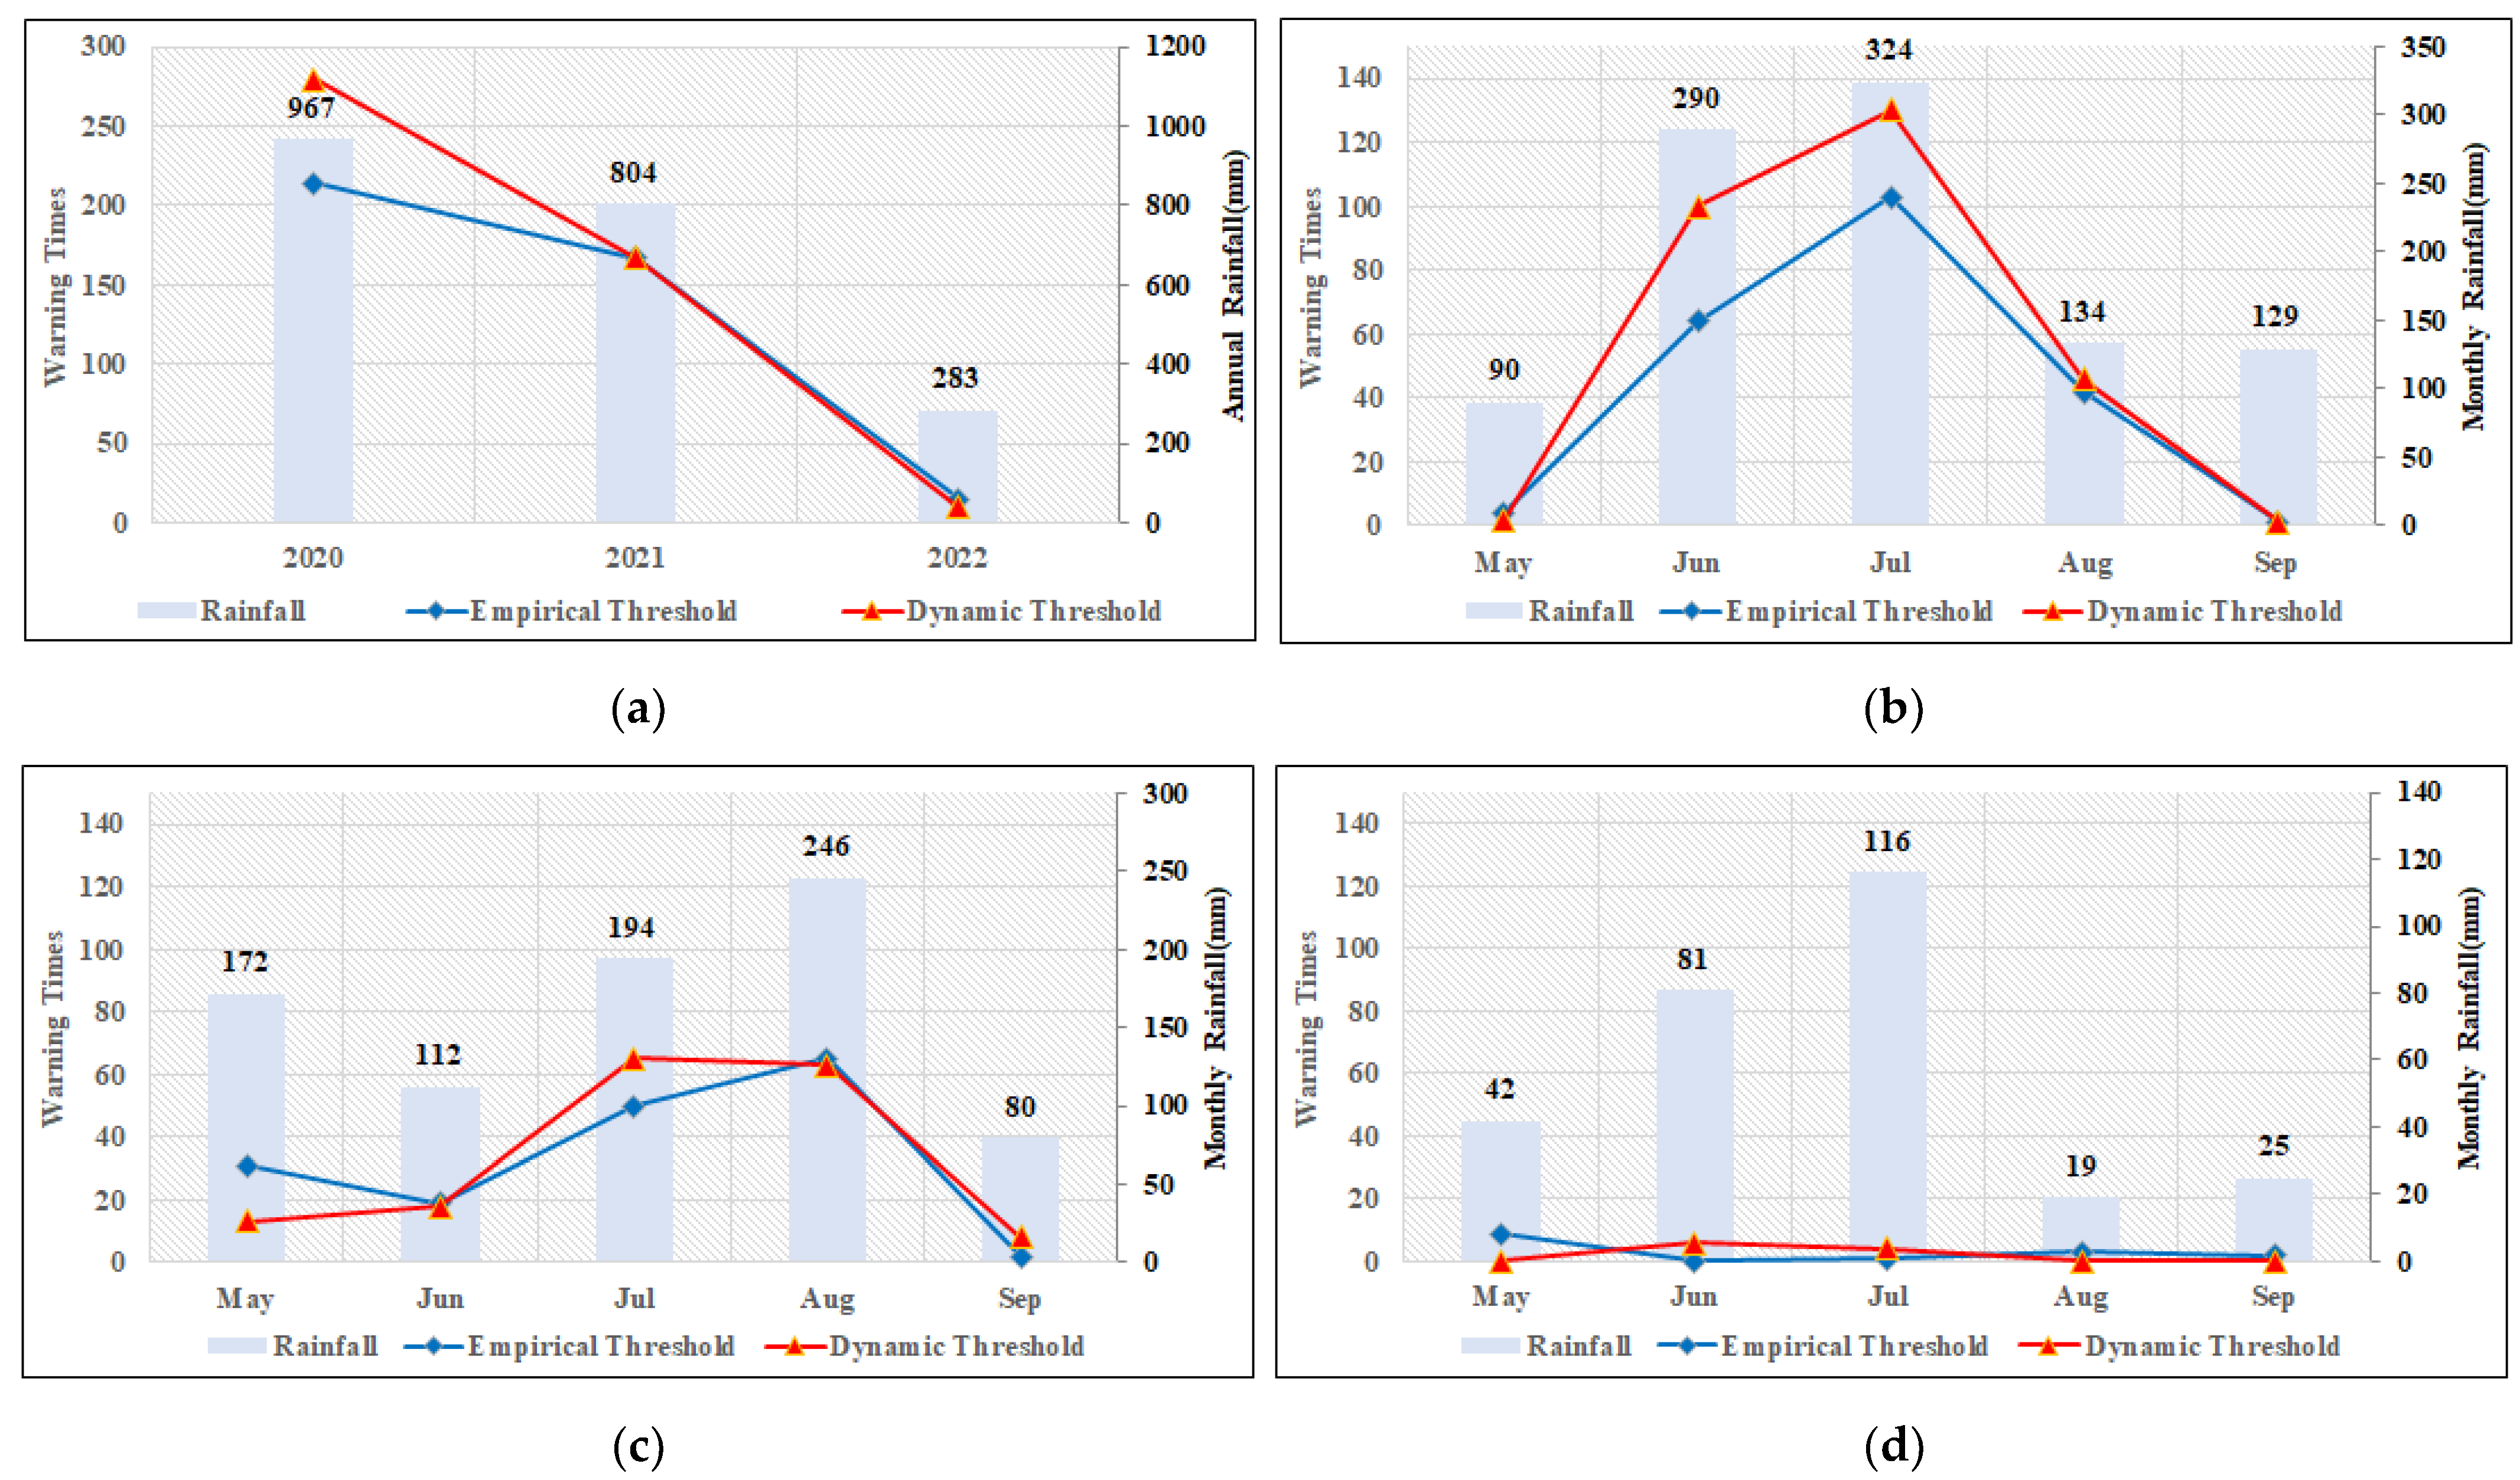
- Both empirical and dynamic thresholds were used for early warning calculations. The results show that, from 2020 to 2022, 396 early warnings were based on empirical thresholds and 456 based on dynamic thresholds, with the latter 15.2% more than the former. Compared with empirical thresholds, dynamic thresholds were relatively high in May, with fewer early warnings; they were relatively low in June and July, making it easier to generate an early warning; the two were almost the same in August and September. From the perspective of total rainfall, more frequent dynamic early warnings were generated in wet years, while more frequent empirical early warnings were generated in dry years, and the two were roughly equally frequent in normal years. Spatially, after dynamic early warning thresholds were adopted, early warnings increased significantly in northwestern Hubei Province, especially in Shiyan and Xiangyang. Dynamic early warning considers the influence of previous soil moisture on the formation of flash floods, uses different flood-stage levels based on the profile survey results in each riverside village, and analyzes the flood discharge capacity of river channels. On this basis, the rainfall warning thresholds under different conditions were formulated. Due to the short sample sequence time, it is currently impossible to clearly infer that the dynamic rainfall warning threshold is better than the empirical threshold, but it can provide valuable reference for similar research.
- (4)
- The determination of early warning thresholds is a long-term process, as these thresholds need to be corrected from time to time in the process of application. In the future, on the one hand, it is essential to integrate supplementary investigation and evaluation data and the results of dynamic inventory management of hazardous areas, and complete the analysis of dynamic early warning rainfall thresholds for a larger range of hazardous areas; on the other hand, it is necessary to conduct an ongoing analysis of the rationality of dynamic rainfall warning thresholds based on flash flood disasters. The verification of rainfall warning thresholds is a long-term endeavor, which requires the correction of early warning thresholds at regular intervals in light of the data on floods that take place from time to time. It is recommended to carry out the practical application after 2–3 years of review.
Author Contributions
Funding
Institutional Review Board Statement
Informed Consent Statement
Data Availability Statement
Conflicts of Interest
References
- Guo, L.; Ding, L.; Sun, D.; Liu, C.J.; He, B.S.; Liu, R.H. Key Techniques of Flash Flood Disaster Prevention in China. J. Hydraul. Eng. 2018, 49, 1123–1136. [Google Scholar] [CrossRef]
- Georgakakos, K. Analytical results for operational flash flood guidance. J. Hydrol. 2006, 317, 81–103. [Google Scholar] [CrossRef]
- Christos, G.; Stavros, D.; Stefanos, S.; Giannaros, T.M.; Koletsis, I.; Oikonomou, C. Hydrometeorological analysis of a flash flood event in an ungauged Mediterranean watershed under an operational forecasting and monitoring context. Meteorol. Appl. 2022, 29, e2079. [Google Scholar] [CrossRef]
- Quenum, G.M.L.D.; Arnault, J.; Klutse, N.A.B.; Zhang, Z.; Kunstmann, H.; Oguntunde, P.G. Potential of the Coupled WRF/WRF-Hydro Modeling System for Flood Forecasting in the Ouémé River (West Africa). Water 2022, 14, 1192. [Google Scholar] [CrossRef]
- Guzzetti, F.; Stark, C.; Salvati, P. Evaluation of flood and landslide risk to the population of Italy Environmental Management. Env. Manage. 2005, 36, 15–36. [Google Scholar] [CrossRef]
- Compton, K.; Ermolieva, T.; Linnerooth-Bayer, J.; Amendola, A.; Faber, R.; Nachtnebel, H.P. Modeling Risk and Uncertainty: Managing Flash Flood Risk in Vienna. In Integrated Catastrophe Risk Modeling; Amendola, A., Ermolieva, T., Linnerooth-Bayer, J., Mechler, R., Eds.; Springer: Dordrecht, The Netherlands, 2013; Volume 32. [Google Scholar]
- Fuchs, S.; Keiler, M.; Sokratov, S. Spatiotemporal dynamics: The need for an innovative approach in mountain hazard risk management. Nat. Hazards 2013, 68, 1217–1241. [Google Scholar] [CrossRef]
- Alfieri, L.; Velasco, D.; Thielen, J. Flash flood detection through a multi-stage probabilistic warning system for heavy precipitation events. Adv. Geosci. 2011, 29, 69–75. [Google Scholar] [CrossRef]
- Wu, S.; Hsu, C.; Lien, H.; Chang, C. Modeling the Effect of Uncertainties in Rainfall Characteristics on Flash Flood Warning Based on Rainfall Thresholds. Nat. Hazards. 2015, 75, 1677–1711. [Google Scholar] [CrossRef]
- Nieland, C.; Mushtaq, S. The effectiveness and need for flash flood warning systems in a regional inland city in Australia. Nat. Hazards. 2016, 80, 153–171. [Google Scholar] [CrossRef]
- Morss, R.; Demuth, J.; Bostrom, A.; Lazo, J.; Lazrus, H. Flash Flood Risks and Warning Decisions: A Mental Models Study of Forecasters, Public Officials, and Media Broadcasters in Boulder, Colorado. Risk Anal. 2015, 35, 2009–2028. [Google Scholar] [CrossRef]
- Liu, C.; Nie, R.; Liu, X.; Xu, W. Research Conception and Achievement Prospect of Key Technologies for Forecast and Early Warning of Flash Flood and Sediment Disasters in Mountainous Rainstorm. Adv. Eng. Sci. 2020, 52, 1–8. [Google Scholar] [CrossRef]
- Hapuarachchi, H.; Wang, Q.; Pagano, T. A review of advances in flash flood forecasting. Hydrol. Process. 2011, 25, 2771–2784. [Google Scholar] [CrossRef]
- Yang, P.; Xu, Z.; Yan, X.; Wang, X. Comparative Study on Methods of Early Warning Index of Flash Flood Disaster Induced by Rainstorm. Adv. Eng. Sci. 2020, 52, 157–165. [Google Scholar] [CrossRef]
- Zhai, X.; Guo, L.; Zhang, Y. Flash flood type identification and simulation based on flash flood behavior indices in China. China Sci. Earth Sci. 2021, 51, 1092–1106. [Google Scholar] [CrossRef]
- He, B.; Ma, M.; Li, Q.; Liu, L.; Wang, X.-H. Current Situation and Characteristics of Flash Flood Prevention in China. China Rural. Water Hydropower 2021, 5, 133–138. [Google Scholar]
- Ding, L.; Guo, L.; Liu, C.; He, B. Technical Progress of Flash Flood Disasters Prevention and Control Systems in China. China Flood Drought Manag. 2020, 30, 11–17. [Google Scholar] [CrossRef]
- Li, Q.; He, B.; Li, C. Exploration and practice for meteorological early warning of flash flood hazards. China Flood Drought Manag. 2020, 30, 31–35. [Google Scholar] [CrossRef]
- Bao, H.; Cao, Y.; Lin, J.; Yang, Y.; Di, J.; Xu, F.; Liu, C. Operational technology advances in meteorological early warning for flash flood disasters. China Flood Drought Manag. 2020, 30, 40–47. [Google Scholar] [CrossRef]
- Zhai, X.; Sun, D.; Liu, R. Technical framework for dynamic early warning index analysis of flash flood disasters. China Flood Drought Manag. 2021, 31, 26–30. [Google Scholar] [CrossRef]
- Zhang, Y.; Zou, Y.; Wang, X.; Zhang, P.; Xu, W. Flash Flood Warning Assessment Considering Temporal Differences. Adv. Eng. Sci. 2021, 53, 10–18. [Google Scholar] [CrossRef]
- Tu, Y.; Zhao, Y.W.; Dong, R.; Wang, H.; Ma, Q.; He, B.S.; Liu, C.J. Study on Risk Assessment of Flash Floods in Hubei Province. Water 2023, 15, 617. [Google Scholar] [CrossRef]
- Zhai, X.Y.; Guo, L.; Liu, R.H.; Zhang, Y.Y. Rainfall threshold determination for flash flood warning in mountainous catchments with consideration of antecedent soil moisture and rainfall pattern. Nat. Hazards 2018, 94, 605–625. [Google Scholar] [CrossRef]
- Hao, S.; Ma, Q.; Zhai, X.; Lyu, G.; Fan, S.; Wang, W.; Liu, C. A New Machine Learning Approach for parameter regionalization of Flash Flood Modelling in Henan Province, China. In Proceedings of the International Conference on Energy, Power and Environmental System Engineering (ICEPESE2021), Shanghai, China, 4–5 July 2021; p. 02010. [Google Scholar] [CrossRef]
- Tian, J.; Fan, S.; Wang, W.; Liu, C.J.; Zhang, Q.Y.; Zhao, X.T.; Ma, S. Comparison between FFMS Model and HEC-HMS Model Applied in Rainstorm and Flood Simulation. Yangtze River Sci. Res. Inst. 2021, 38, 59–65. [Google Scholar]
- Zhang, X.; Zhou, J.; Wen, L. Application of Spatio-Temporal Variable Source Mixed Runoff Model to Flood Simulation of Small Watersheds: A Case Study of Four Small Watersheds in Sichuan and Gansu Province. Water Resour. Water Eng. 2021, 32, 80–90. [Google Scholar]
- Talbot, C.A.; Ogden, F.L. A Method for Computing Infiltration and Redistribution in a Discretized Moisture Content Domain. Water Resour. Res. 2008, 44, W08453. [Google Scholar] [CrossRef]
- Lai, W.; Ogden, F.L.; Steinke, R.C.; Talbot, C.A. An Efficient and Guaranteed Stable Numerical Method for Continuous Modeling of Infiltration and Redistribution with a Shallow Dynamic Water Table. Water Resour. Res. 2015, 51, 1514–1528. [Google Scholar] [CrossRef]
- Bao, W.; Zhao, L. Application of Linearized Calibration Method for Vertically Mixed Runoff Model Parameters. Hydrol. Eng. 2014, 19, 85–91. [Google Scholar] [CrossRef]
- Liu, C.J.; Zhou, J.; Wen, L.; Ma, Q.; Guo, L.; Ding, L.Q.; Sun, D.Y. Research on spatio temporally-mixed runoff model and parameter regionalization for small and medium-sized catchments. J. China Inst. Water Resour. Hydropower Res. 2021, 19, 99–114. [Google Scholar] [CrossRef]
- Nash, J.E.; Sutcliffe, J.V. River flow forecasting through conceptual models part I—A discussion of principles. J. Hydrol. 1970, 10, 282–290. [Google Scholar] [CrossRef]
- Wang, W.C.; Zhao, Y.W.; Tu, Y.; Dong, R.; Ma, Q.; Liu, C.J. Research on Parameter Regionalization of Distributed Hydrological Model Based on Machine Learning. Water 2023, 15, 518. [Google Scholar] [CrossRef]
- Duan, Q.Y.; Gupta, V.K.; Sorooshian, S. Shuffled complex evolution approach for effective and efficient global minimization. J. Optim. Theory Appl. 1993, 76, 501–521. [Google Scholar] [CrossRef]
- Sorooshian, S.; Duan, Q.Y.; Gupta, V.K. Optimal use of the SCE—UA global optimization method for calibrating watershed models. J. Hydrol. 1994, 158, 265–284. [Google Scholar] [CrossRef]


| No. | Description | Purpose | Data Source |
|---|---|---|---|
| 1 | Riverside village investigation and evaluation results | Critical rainfall analysis, and the development of a dynamic early warning threshold chart | Mountain Flood Disaster Investigation and Evaluation Project |
| 2 | Historical rainstorm flood data between 1956 and 2022 | Distributed model calibration | |
| 3 | Rainfall data between 2020 and 2022 | Dynamic rainfall warning and calculation | The Monitoring and Warning Platform for Mountain Flood Disasters in Hubei Province |
| 4 | Empirical early warning thresholds | Early warning threshold rationality analysis | |
| 5 | Early warning records between 2020 to2022 from the flash flood monitoring and early warning platform | Early warning threshold rationality analysis |
| Name | River Name | Hydrological Zone | Catchment Area (km2) |
|---|---|---|---|
| ChangXuanLing | SheShui | IV | 1313 |
| HuanTan | YunShui | VI | 804 |
| JiaJiaFang | TianHe | IX | 1281 |
| LiChuan | QingJiang | X | 513 |
| MaCheng | JuShui | IV | 888 |
| LongGang | LongGangHe | II | 550 |
| XingShan | XiangXi | VIII | 1851 |
| XuanEn | ZhongJianHe | X | 740 |
| YanBa | ZhuXiHe | XI | 598 |
| YuYangGuan | YuYangHe | VII | 465 |
| City | Dry | Normal | Wet | Saturated | ||||||||
|---|---|---|---|---|---|---|---|---|---|---|---|---|
| 1 h | 3 h | 6 h | 1 h | 3 h | 6 h | 1 h | 3 h | 6 h | 1 h | 3 h | 6 h | |
| WuHan | 94 | 158 | 207 | 80 | 132 | 172 | 68 | 113 | 143 | 57 | 95 | 115 |
| HuangShi | 12 | 187 | 210 | 102 | 148 | 178 | 80 | 119 | 144 | 66 | 100 | 120 |
| ShiYan | 95 | 118 | 127 | 81 | 102 | 114 | 70 | 87 | 104 | 61 | 76 | 93 |
| YiChang | 124 | 158 | 181 | 109 | 139 | 159 | 93 | 120 | 140 | 82 | 107 | 125 |
| XiangYang | 101 | 125 | 156 | 85 | 105 | 131 | 73 | 89 | 111 | 63 | 77 | 93 |
| EZhou | 94 | 146 | 188 | 78 | 123 | 157 | 69 | 109 | 133 | 60 | 91 | 111 |
| JingMen | 112 | 143 | 190 | 93 | 119 | 156 | 79 | 99 | 130 | 64 | 80 | 104 |
| XiaoGan | 109 | 148 | 211 | 96 | 133 | 180 | 85 | 118 | 156 | 76 | 109 | 133 |
| JingZhou | 126 | 168 | 198 | 103 | 139 | 166 | 85 | 114 | 141 | 70 | 97 | 118 |
| HuangGang | 131 | 181 | 205 | 109 | 154 | 179 | 90 | 133 | 156 | 77 | 109 | 139 |
| XianNing | 112 | 152 | 181 | 94 | 135 | 161 | 81 | 118 | 142 | 71 | 107 | 129 |
| SuiZhou | 144 | 208 | 251 | 119 | 178 | 218 | 102 | 152 | 191 | 87 | 133 | 167 |
| EnShi | 92 | 130 | 175 | 83 | 118 | 152 | 74 | 104 | 133 | 67 | 94 | 117 |
| Name | Floods Number | Peak Error (%) | Water Error (%) | Peak Time Error (h) | Nash–Sutcliffe Coefficient |
|---|---|---|---|---|---|
| ChangXuanLing | 18 | −14.6 | −10.8 | 4.1 | 0.77 |
| HuanTan | 4 | −8.0 | −3.3 | 1.4 | 0.86 |
| JiaJiaFang | 8 | −29.4 | −22.8 | −2.9 | 0.65 |
| LiChuan | 25 | −13.1 | 13.1 | 1.7 | 0.80 |
| MaCheng | 10 | −13.5 | −11.6 | −6.0 | 0.72 |
| LongGang | 7 | 18.1 | −12.4 | −1.2 | 0.73 |
| XingShan | 16 | −23.8 | 15.1 | −2.1 | 0.72 |
| XuanEn | 3 | −5.6 | −27.3 | −2.9 | 0.72 |
| YanBa | 5 | −21.7 | −17.0 | −1.2 | 0.75 |
| YuYangGuan | 12 | −19.7 | −15.8 | −1.0 | 0.74 |
| Warning Period (h) | Soil Moisture | |||
|---|---|---|---|---|
| 1.0 Wm | 0.8 Wm | 0.5 Wm | 0.2 Wm | |
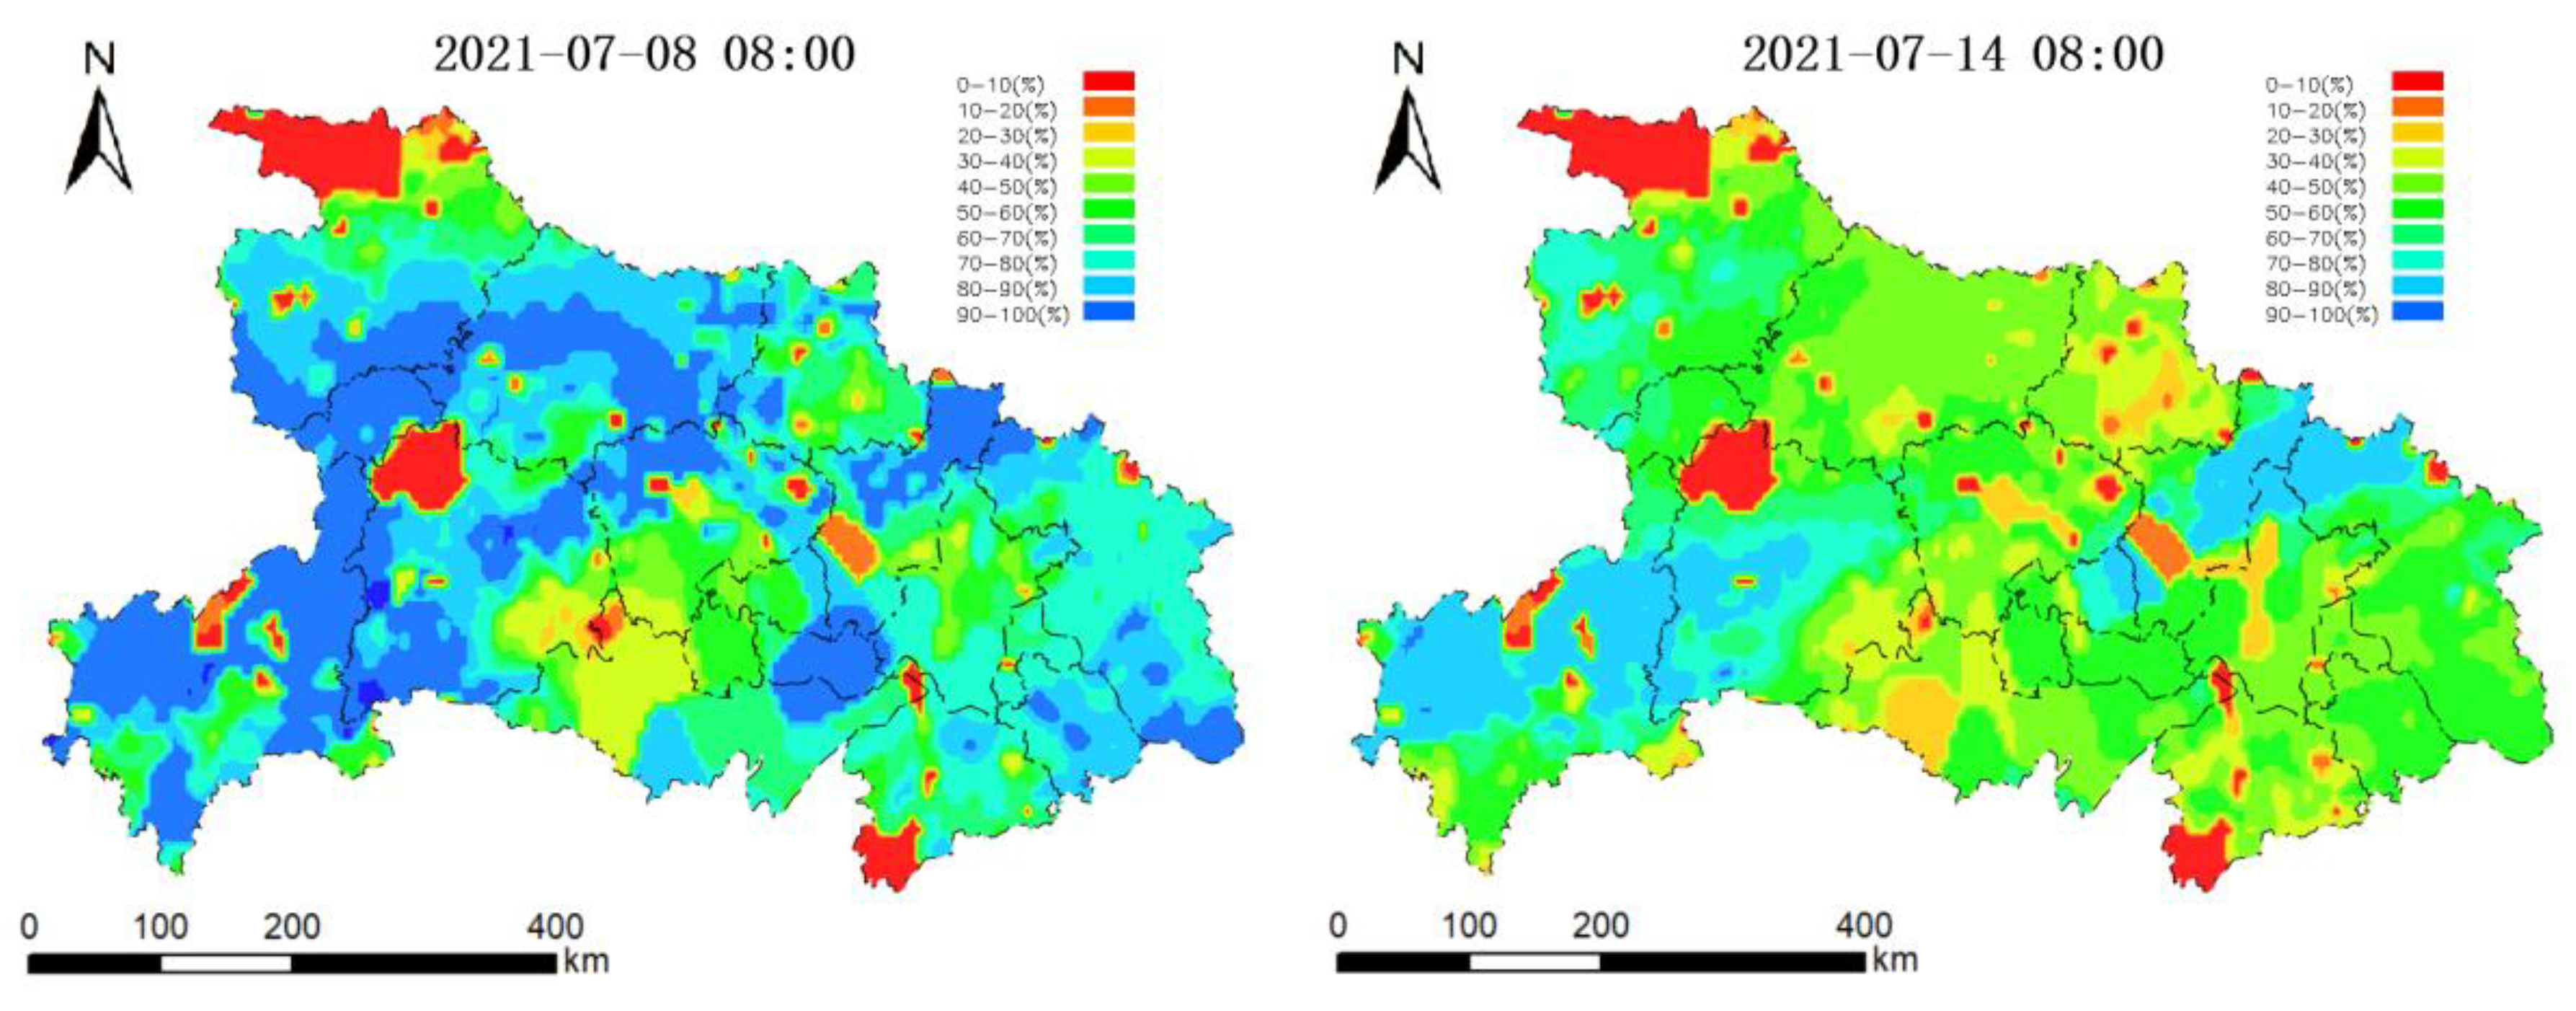
| 1 | 54.1% | 71.6% | 82.4% | 89.2% |
| 3 | 58.1% | 71.6% | 83.8% | 90.5% |
| 6 | 51.4% | 58.1% | 74.3% | 91.9% |
| Year | Month | Monthly Average Rainfall (mm) | Warning Times | |
|---|---|---|---|---|
| Empirical Threshold | Dynamic Threshold | |||
| 2020 | 5 | 90 | 4 | 2 |
| 6 | 290 | 64 | 100 | |
| 7 | 324 | 103 | 130 | |
| 8 | 134 | 42 | 46 | |
| 9 | 129 | 1 | 1 | |
| 2021 | 5 | 172 | 31 | 13 |
| 6 | 112 | 19 | 18 | |
| 7 | 194 | 50 | 65 | |
| 8 | 246 | 65 | 63 | |
| 9 | 80 | 2 | 8 | |
| 2022 | 5 | 42 | 9 | 0 |
| 6 | 81 | 0 | 6 | |
| 7 | 116 | 1 | 4 | |
| 8 | 19 | 3 | 0 | |
| 9 | 25 | 2 | 0 | |
| City | Empirical Threshold | Dynamic Threshold | ||||
|---|---|---|---|---|---|---|
| 2020 | 2021 | 2022 | 2020 | 2021 | 2022 | |
| WuHan | 1 | 0 | 0 | 8 | 6 | 0 |
| HuangShi | 7 | 10 | 0 | 15 | 9 | 0 |
| ShiYan | 3 | 2 | 0 | 23 | 39 | 1 |
| YiChang | 54 | 45 | 6 | 43 | 14 | 3 |
| XiangYang | 17 | 13 | 2 | 28 | 26 | 2 |
| EZhou | 6 | 0 | 0 | 10 | 1 | 0 |
| JingMen | 12 | 8 | 1 | 23 | 10 | 2 |
| XiaoGan | 11 | 11 | 0 | 11 | 9 | 0 |
| JingZhou | 6 | 4 | 1 | 4 | 3 | 1 |
| HuangGang | 56 | 27 | 3 | 46 | 13 | 1 |
| XianNing | 16 | 21 | 0 | 22 | 11 | 0 |
| SuiZhou | 0 | 0 | 1 | 2 | 1 | 0 |
| EnShi | 25 | 26 | 1 | 43 | 24 | 0 |
| ShenNongJia | 0 | 0 | 0 | 1 | 1 | 0 |
| Total | 214 | 167 | 15 | 279 | 167 | 10 |
| Hydrological Zones | Empirical Threshold | Dynamic Threshold | ||||
|---|---|---|---|---|---|---|
| 2020 | 2021 | 2022 | 2020 | 2021 | 2022 | |
| I | 19 | 12 | 4 | 31 | 10 | 2 |
| II | 7 | 11 | 0 | 15 | 10 | 0 |
| III | 43 | 18 | 0 | 48 | 13 | 0 |
| IV | 21 | 21 | 1 | 28 | 18 | 1 |
| V | 9 | 7 | 1 | 0 | 5 | 0 |
| VI | 24 | 16 | 1 | 26 | 18 | 0 |
| VII | 31 | 31 | 3 | 26 | 11 | 2 |
| VIII | 29 | 25 | 4 | 31 | 12 | 4 |
| IX | 4 | 4 | 0 | 19 | 29 | 0 |
| X | 26 | 22 | 1 | 47 | 24 | 0 |
| XI | 1 | 0 | 0 | 8 | 17 | 1 |
| Total | 214 | 167 | 15 | 279 | 167 | 10 |
Disclaimer/Publisher’s Note: The statements, opinions and data contained in all publications are solely those of the individual author(s) and contributor(s) and not of MDPI and/or the editor(s). MDPI and/or the editor(s) disclaim responsibility for any injury to people or property resulting from any ideas, methods, instructions or products referred to in the content. |
© 2023 by the authors. Licensee MDPI, Basel, Switzerland. This article is an open access article distributed under the terms and conditions of the Creative Commons Attribution (CC BY) license (https://creativecommons.org/licenses/by/4.0/).
Share and Cite
Tu, Y.; Zhao, Y.; Meng, L.; Tang, W.; Xu, W.; Tian, J.; Lyu, G.; Qiao, N. Study on Dynamic Early Warning of Flash Floods in Hubei Province. Water 2023, 15, 3153. https://doi.org/10.3390/w15173153
Tu Y, Zhao Y, Meng L, Tang W, Xu W, Tian J, Lyu G, Qiao N. Study on Dynamic Early Warning of Flash Floods in Hubei Province. Water. 2023; 15(17):3153. https://doi.org/10.3390/w15173153
Chicago/Turabian StyleTu, Yong, Yanwei Zhao, Lingsheng Meng, Wei Tang, Wentao Xu, Jiyang Tian, Guomin Lyu, and Nan Qiao. 2023. "Study on Dynamic Early Warning of Flash Floods in Hubei Province" Water 15, no. 17: 3153. https://doi.org/10.3390/w15173153
APA StyleTu, Y., Zhao, Y., Meng, L., Tang, W., Xu, W., Tian, J., Lyu, G., & Qiao, N. (2023). Study on Dynamic Early Warning of Flash Floods in Hubei Province. Water, 15(17), 3153. https://doi.org/10.3390/w15173153


