
Three-Dimensional Numerical Modelling of Real-Field Dam-Break Flows: Review and Recent Advances


Abstract
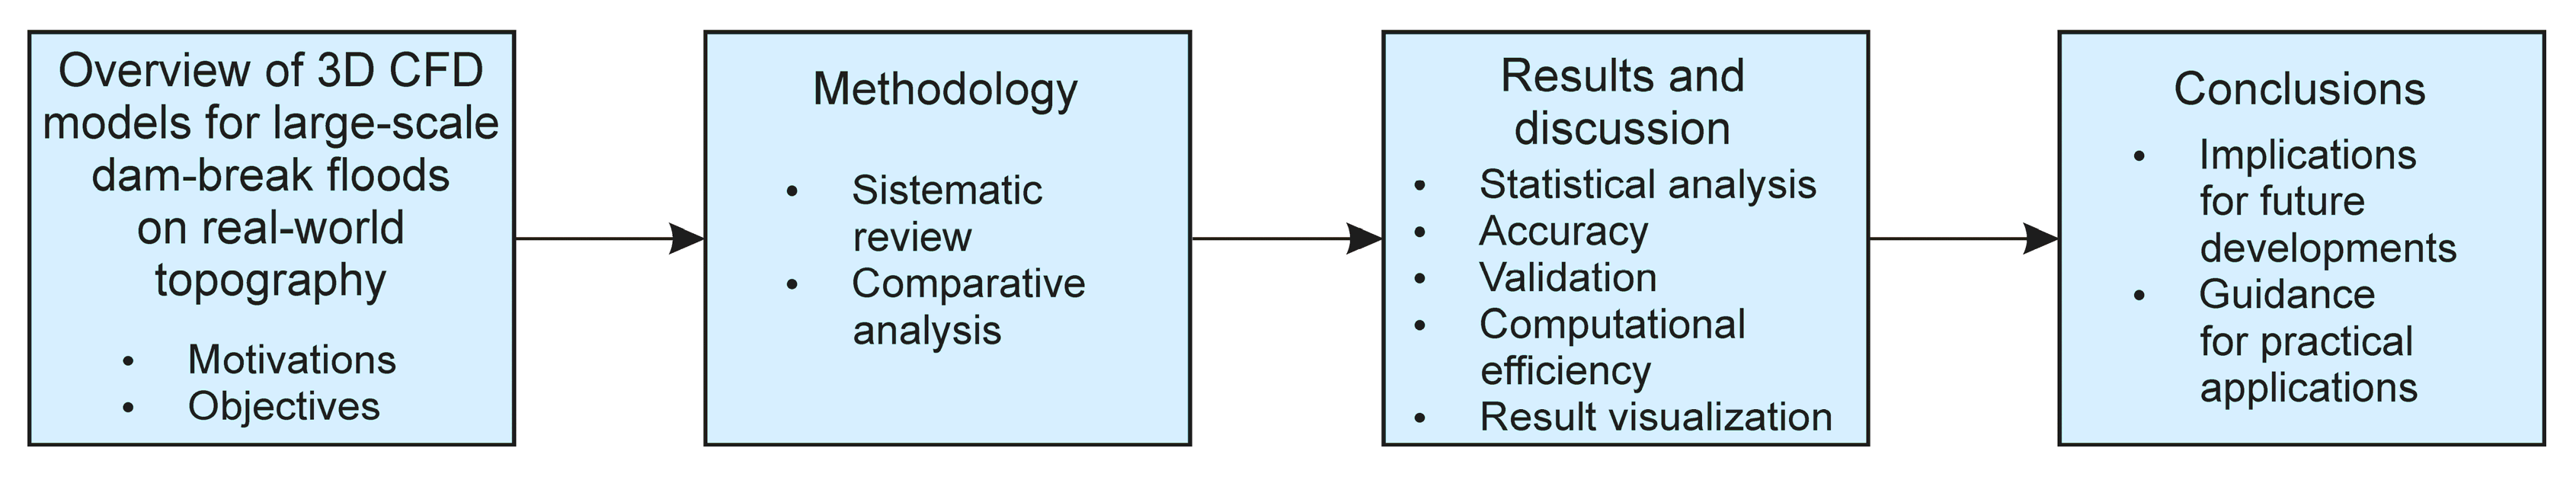
1. Introduction
1.1. Motivations of the Present Review
1.2. Objectives of the Present Review
2. Review and Comparative Analysis

| (1) Reference | (2) Model Name | (3) Model Type 1 | (4) Numerical Method 2 | (5) Case Study | (6) Computational Domain and Elements | (7) Output Data | (8) Focus of the Study | (9) Computational Efficiency 3 | (10) Year | (11) Status |
|---|---|---|---|---|---|---|---|---|---|---|
| Roubtsova and Kahawita [69] * | N/A | Navier–Stokes and continuity equations | Weakly compressible SPH | Historical 1963 overtopping of the Vajont dam (Italy) Volume of the rockslide: 270 million m3 Stored water volume: 115 million m3 (reservoir water level provided) Overtopping water volume: 30 million m3 | Modelled area extent: N/A (the reservoir and the Vajont River downstream) Number of particles: N/A Particle spacing: N/A | Water surface at selected times; transverse water surface profiles at a selected cross-section in the reservoir | Performance of the numerical technique Reconstruction of the event Comparison with field observations | Simulation time: 220 s Run time/ simulation time: ~74 | 2006 | Research |
| Cleary et al. [70]; Prakash et al. [71] | N/A | Navier–Stokes and continuity equations | Weakly compressible SPH | Historical 1928 St. Francis dam break (California) Water volume: 47 million m3 | Modelled area extent: the reservoir and a valley stretch downstream of the dam Number of particles: 1.4 × 10⁶ Particle spacing: 4 m | Flow fields (velocity magnitude) and flooded areas at selected times; motion of wall fragments; flow discharge hydrograph at the dam site; flood arrival times and maximum flood depths at selected locations | Flooding dynamics for different collapse scenarios Comparison with field data Modelling of the motion of dam wall blocks 3D effects Sensitivity on particle resolution (4 m; 6 m; 8 m) | Simulation time: 25 min Run time/ simulation time: N/A | 2010 | Research |
| Cleary et al. [70]; Ye et al. [72]; Cleary et al. [73] | N/A | Navier–Stokes and continuity equations | Weakly compressible SPH | Hypothetical Geheyan dam break (China) Water volume: 3.12 billion m3 Different dam failure scenarios | Modelled area extent: the reservoir and a valley stretch downstream of the dam Number of particles: 1.3 × 10⁶ (fluid), 1.9 × 10⁶ (boundaries) Particle spacing: 15 m (fluid), 30 m (boundaries) | Flow fields (velocity magnitude) and flooded areas at selected times (different views); discharge hydrograph at the dam site; flow discharge hydrographs at selected sections; flood depth hydrographs at selected locations | Flooding dynamics 3D effects Effect of different dam failure scenarios Modelling of the motion of dam wall blocks | Simulation time: 60 min Run time/ simulation time: N/A | 2010 | Research |
| Lee et al. [74] * | N/A | Navier–Stokes and continuity equations | Weakly compressible and truly incompressible SPH | Ski-jump spillway of the Goulours dam (France) | Modelled area extent: The reservoir (assumed to be of prismatic shape) and ~250 m-long valley reach downstream of the dam (according to a 1:20 scale physical model) Number of particles: 9.366 × 10⁵ (wall particles: 2.169 × 10⁵; fictitious particles: 2.196 × 10⁵) Particle spacing (initial): 0.2 m | Spillway flow dynamics; flooded areas at selected times | Qualitative reconstruction of the spillway process Spillway flow features | Simulation time: 16 s Run time/ simulation time: ~2.7 × 10⁴ | 2010 | Research |
| Caboussat et al. [75] | N/A | Incompressible Navier–Stokes equations coupled with VOF | Finite element; implicit time splitting scheme (advection and diffusion steps) | Historical 1959 Malpasset dam break (France) Water volume: 50 million m3 | Modelled area extent: 17.5 km × 9 km Unstructured grid of tetrahedral cells (diffusion step) Number of cells: 1.716 × 10⁶ Spatial resolution: 5 m Structured grid of cubic cells (advection step) Number of cells: N/A Spatial resolution: 2 m | Flooded areas and flow velocity fields at selected times; maximum flood depths and arrival times at selected points | Comparison with physical model data | Simulation time: >8 min Run time/ simulation time: 600 | 2011 | Research |
| Caboussat et al. [75] | N/A | Incompressible Navier–Stokes equations coupled with VOF | Finite element; implicit time splitting scheme (advection and diffusion steps) | Hypothetical Grande-Dixence dam break (Switzerland) Water volume: 400 million m3 | Modelled area extent: 28.9 km × 5.75 km Unstructured grid of tetrahedral cells (diffusion step) Number of cells: 13.876 × 10⁶ Spatial resolution: 50 m Structured grid of cubic cells (advection step) Number of cells: N/A Spatial resolution: 10 m | Flooded areas and flow velocity fields at selected times; flood depth contour maps at selected times | Inundation dynamics | Simulation time: 10 min Run time/ simulation time: N/A | 2011 | Research |
| Vassilevski et al. [76] | N/A | Incompressible Navier–Stokes equations coupled with grid level set function (for free surface tracking); Herschel–Bulkley rheological relation for viscoplastic fluids | Finite difference/ finite volume; Chorin–Temam- Yanenko time splitting scheme | Hypothetical Sayano– Shushenskaya partial dam-break (Russia) Water volume: N/A | Modelled area extent: the reservoir and a valley stretch downstream of the dam Structured octree staggered grid | Flood depth hydrographs at selected points; time series of the bottom pressure at the base of the spillway | Dam-break flow | Simulation time: 100 s Run time/ simulation time: N/A | 2012 | Research |
| Vacondio et al. [77] * | DualSPHysics | Navier–Stokes and continuity equations | Weakly compressible SPH | Historical 1963 overtopping of the Vajont dam (Italy) Volume of the rockslide: 310 million m3 Stored water volume: N/A (reservoir water level provided) | Modelled area extent: the reservoir and a valley stretch downstream of the dam Number of particles: 3.954 × 10⁶ (bottom particles: 2.144 × 10⁶; rockslide particles: 1.274 × 10⁵; fluid particles: 1.683 × 10⁶) Particle size: 5 m | Water surface elevation at selected times; maximum run-up on the reservoir side; water surface elevation in the residual lake; flow velocity field; overflow hydrograph | Reconstruction of the wave generated by the Vajont rockslide and of the dam-overtopping phenomenon Comparison with field observations | Simulation time: 21 min Run time/ simulation time: 177 Parallelization on GPU | 2013 | Open-source |
| Zhainakov and Kurbanaliev [78]; Jainakov et al. [79] | OpenFOAM | RANS coupled with VOF; standard k-ε turbulence model | Finite volume; PIMPLE algorithm; explicit Euler first-order time discretization method | Hypothetical Andijan dam break (Uzbekistan) Water volume: N/A | Modelled area extent: 6 km × 4 km Structured mesh of hexahedral cells Number of cells: 120 × 120 × 80 | Contour maps of the water volume fraction at selected times | Flood wave propagation | Simulation time: 240 s Run time/ simulation time: 135 | 2013 | Open-source |
| Zhainakov and Kurbanaliev [78]; Jainakov et al. [79] | OpenFOAM | RANS coupled with VOF; standard k-ε turbulence model | Finite volume; PIMPLE algorithm; explicit Euler first-order time discretization method | Hypothetical Papan dam break (Kyrgyzstan) Water volume: N/A | Modelled area extent: 5 km × 5 km Structured mesh of hexahedral cells Number of cells: 50 × 60 × 30 | Contour maps of the water volume fraction at selected times | Flood wave propagation | Simulation time: 260 s Run time/ simulation time: 69 | 2013 | Open-source |
| Džebo et al. [80] | Tis Isat | Navier–Stokes and continuity equations | Weakly compressible SPH | Hypothetical break of the embankment of the reservoir of the Kolarjev vrh pumped-storage hydropower plant (Slovenia) Water volume: 3.1 million m3 | Modelled area extent: the reservoir and a 4.5 km long valley stretch downstream Number of particles: (a) 21.890 × 10³; (b) 174.884 × 10³ Particle size: (a) 5 m; (b) 2.5 m | Water surface elevation at selected times; transverse water surface profiles at given cross-sections; flow depth hydrographs at selected gauge points | Flooding dynamics Comparison with 2D depth-averaged model predictions and physical model experimental data Effects of different bottom roughness values and spatial resolutions | Simulation time: 200 s Run time/ simulation time: (a) 30; (b) 981 | 2014 | Research |
| Marsooli and Wu [50] | N/A | RANS coupled with VOF; Smagorinsky eddy viscosity turbulence model | Finite volume; PISO algorithm; CICSAM scheme | Flash flood in the Toce River 1:100 physical model (Italy) Controlled impulsive inflow | Modelled area extent: 5 km long reach of the Toce River (5.5 km × 1.2 km) Unstructured mesh of hexahedral cells Number of cells: 3.1 × 10⁶ | Flow-depth hydrographs at selected points | Comparison with experimental physical model data Comparison with 2D depth-averaged model predictions | Simulation time: 3 min Run time/ simulation time: 4100 | 2014 | Research |
| Zhou et al. [81] | N/A | RANS coupled with VOF; k-ε turbulence model | Finite volume; PISO algorithm | Flash flood in the Toce River 1:100 physical model (Italy) Controlled impulsive inflow | Modelled area extent: 5 km long reach of the Toce River (50 m × 11 m in the physical model; presence of an idealised urban district) Structured mesh of prismatic cells Number of cells: 8.904 × 10³ Spatial resolution: 1 m (horizontal) 10−2 m (vertical) | Water depth hydrographs at selected gauge points | Validation (comparison with physical model experimental data) | Simulation time: 60 s Run time/ simulation time: N/A | 2014 | Research |
| Zhou et al. [81] | N/A | RANS coupled with VOF; k-ε turbulence model | Finite volume; PISO algorithm | Hypothetical Dongwushi dam break (China) Water volume: 161.5 million m3 (Hypothetical dam break of four other dams in the same Haihe River basin, China) | Modelled area extent: upper reach of the valley of the Fuyang River Unstructured mesh of hexahedral cells Number of cells: 79.513 × 10³ | VOF spatial distribution at selected times; flow velocity field at selected times; flow discharge hydrographs at selected cross-sections (including the dam site); flood depth spatial distribution at selected times | Flood wave propagation Dam-break risk analysis | Simulation time: ~47 h Run time/ simulation time: N/A | 2014 | Research |
| Biscarini et al. [82] | OpenFOAM | RANS coupled with VOF; k-ε turbulence model | Finite volume; PISO algorithm; MULES scheme | Historical 1959 Malpasset dam break (France) Water volume: 50 million m3 | Modelled area extent: 17.5 km × 10 km Unstructured mesh Number of cells: 2.203 × 10⁶ Spatial resolution: N/A | Arrival time at selected points; flood hydrographs at selected points; flooded area at selected times; transverse free surface profiles at a river bend cross-sections; velocity fields in selected areas | Comparison with experimental (field and physical model) data 3D effects at sharply curved river bends | Simulation time: 40 min Run time/ simulation time: N/A | 2016 | Open-source |
| TELEMAC Modelling System [83] | TELEMAC-3D | Navier–Stokes and continuity equations (Boussinesq approximation) | Finite element; three-fractional-step algorithm | Historical 1959 Malpasset dam break (France) Water volume: 50 million m3 | Modelled area extent: 17 km × 9 km Unstructured horizontal mesh of triangular elements Number of cells: (a) 26 × 103; (b) 104 × 103 Vertical mesh: 2 or 6 layers regularly spaced in the vertical direction | Flood depth contour maps at selected times; flood depth hydrographs at selected locations | Flood wave propagation | Simulation time: 4000 s Run time/ simulation time: N/A | 2016 | Freeware |
| Amicarelli et al. [84] | SPHERA | Continuity equations of the fluid and solid incompressible phases + volume balance equation; momentum equations of the fluid and solid phases; momentum equation for the mixture | Weakly- compressible SPH; Leapfrog time integration scheme | Erosional dam-break demonstrative ICOLD benchmark Water volume: N/A (reservoir water level provided) | Modelled area extent: 24.627 km × 9.855 km Mobile bottom downstream of the dam (granular material of fixed characteristics) Number of particles: 6.8 × 10⁵ Particle spacing: 4 m | 3D distribution of the particles and velocity fields at selected times; maps of maximum values of mixture depth and specific flow rate; water and bed-load flow rate and mixture depth hydrographs at selected cross-sections | Dynamics of the phenomenon | Simulation time: 25 min Run time/ simulation time: N/A | 2017 | Open-source |
| Wang et al. [85] | N/A | RANS coupled with VOF; k-ε turbulence model | Finite volume; PISO algorithm | Flash flood in the Toce River 1:100 physical model (Italy) Controlled impulsive inflow | Modelled area extent: 5 km long reach of the Toce River (50 m × 11 m in the physical model; two idealised urban district configurations) Unstructured mesh of polyhedral cells Number of cells: ~2 × 10⁵ Spatial resolution: 0.1 m | Computational time; computational error; water depth hydrographs at selected gauge points | Validation (comparison with physical model experimental data) Dam-break flooding of an urban area Comparison of computational performance of different mesh types (polyhedral, tetrahedral, hexahedral) | Simulation time: 60 s Run time/ simulation time: ~20 | 2017 | Research |
| Wang et al. [85] | N/A | RANS coupled with VOF; k-ε turbulence model | Finite volume; PISO algorithm | Hypothetical dam break of an urban reservoir (SZ City, China) Water volume: 94 million m3 | Modelled area extent: 40.12 km2 area Unstructured mesh of polyhedral cells Number of cells: 4.229 × 10⁶ | VOF spatial distribution at selected times; flood depth and flow velocity hydrographs at selected sites in the urban area; velocity and vorticity fields; maximum flood depth and flow velocity contour maps | Dam-break flooding of an urban area | Simulation time: 5 h Run time/ simulation time: N/A | 2017 | Research |
| Wang et al. [86] | DualSPHysics | Navier–Stokes and continuity equations | Weakly compressible SPH | Historical 2015 Fundão tailings dam break (Brazil) Released tailings volume: 32 million m3 | Modelled area extent: N/A (the pond and the area around) Number of particles: 2.988 × 10⁶ (fluid) 18.132 × 10⁶ (boundaries) Particle spacing: 3 m | Flow fields (velocity magnitude) and flooded areas at selected times; flow depth, velocity, and impact pressure time series at a selected location | Tailings flow dynamics Comparison with field data | Simulation time: 30 min Run time/ simulation time: N/A Parallelization on GPU | 2018 | Open-source |
| Wang et al. [86] | DualSPHysics | Navier–Stokes and continuity equations | Weakly compressible SPH | Hypothetical dam break of an operating overhead tailings pond (China) Pond capacity: 33 million m3 | Modelled area extent: N/A (the pond and the area around) Number of particles: 4.463 × 10⁶ (fluid) 3.9 × 10⁶ (boundaries) Particle spacing: 3 m | Flow fields (velocity magnitude) and flooded areas at selected times; flow depth, velocity, and impact pressure time series at a selected location | Tailings flow dynamics | Simulation time: 10 min Run time/ simulation time: N/A Parallelization on GPU | 2018 | Open-source |
| Zhang et al. [87] | N/A | Navier–Stokes and continuity equations (Boussinesq approximation) | Finite element; θ time-stepping method | Hypothetical dike-break flooding on a realistic topography (fixed inflow velocity) | Modelled area extent: 100 m × 100 m Unstructured horizontal mesh of triangular elements; spatial resolution: 5 m Vertical mesh: 1 layer Unstructured mesh of tetrahedral cells Number of cells: 3.114 × 10³ | Velocity fields and flooded areas at selected times | Flood wave propagation 3D effects | Simulation time: 7 min Run time/ simulation time: N/A | 2018 | Research |
| Zhang et al. [87] | N/A | Navier–Stokes and continuity equations (Boussinesq approximation) | Finite element; θ time-stepping method | Hypothetical dike-break flooding in a realistic urban area (flow velocity through the breach: 0.1 m/s) | Modelled area extent: 5.495 km × 2.5 km Unstructured horizontal mesh of triangular elements; spatial resolutions: (a) 30–50 m; (b) 60–100 m; (c) 120–200 m Vertical mesh: 1 layer Unstructured mesh of tetrahedral cells Number of cells: (a) 9376; (b) 3024; (c) 816 | Flooded areas, flood depth contour maps, and velocity fields at selected times; flood depth hydrographs at selected points | 3D effects Sensitivity to the mesh resolution | Simulation time: 6 h Run time/ simulation time: (a) 17.5; (b) 3.5; (c) 0.3 | 2018 | Research |
| Chen et al. [88] | LS-DYNA | Navier–Stokes and continuity equations; material with fluid-elastoplastic properties | SPH | Historical 1985 Stava tailings dam break (Italy) Released tailings volume: 185 × 103 m3 | Modelled area extent: the pond and a 4.2 km long stretch of the valley Number of particles: 11.119 × 10³ (fluid) Particle spacing: 2.5 m | Flow fields (velocity magnitude) and flooded areas at selected times; average velocity profile of the debris flow front; velocity field near the check dam; arrival time at an observation point; final deposition zones; impact force hydrographs (considering a single or multiple check dams) | Debris flow dynamics Fluid–structure interactions Comparison with other numerical results Effect of the presence of hypothetical check dams (rigid indestructible dams or concrete destructible dams) placed at different positions | Simulation time: N/A Run time/ simulation time: N/A | 2019 | Commercial |
| Kurbanaliev et al. [89] | OpenFOAM | RANS coupled with VOF; standard k-ε turbulence model | Finite volume; PISO algorithm; explicit Euler first-order time discretization method | Hypothetical dam-break flow in the Willow Creek Mountain area (California) Water volume: N/A | Modelled area extent: ~8 km × 3 km Mesh of hexahedral cells Number of cells: 0.45 × 10⁶ | Maps of the water volume fraction at selected times; flood depth hydrographs at selected points | Flood wave propagation | Simulation time: 400 s Run time/ simulation time: ~45 | 2019 | Open-source |
| Issakhov and Zhandaulet [90] | N/A | RANS coupled with VOF; three incompressible phases for the simulation of mixed water–mud flow: two Newtonian fluids (air and water) and a non-Newtonian liquid; realizable k-ω turbulence model | Finite volume; PISO algorithm | Hypothetical Mynzhylky erosional dam break (Kazakhstan) Water volume: 50 × 103 m3 | Modelled area extent: 17 × 103 m2, 1.317 km long river reach downstream of the dam Homogeneous mud layer of fixed thickness downstream of the dam Structured mesh of tetrahedral cells Number of cells: 2.433 × 10⁶ Spatial resolution: 0.5 m | Flood depth hydrographs at selected points; water surfaces and inundated areas at selected times (for different mud layer thicknesses) | Flood wave (with mud) propagation Effect of the initial mud layer thickness | Simulation time: 60 s Run time/ simulation time: N/A | 2020 | N/A |
| Munoz and Constantinescu [37] | STAR-CCM+ | RANS coupled with VOF; realizable k-ε turbulence model | Finite volume; SIMPLE algorithm | Hypothetical Coralville dam-break (USA) Water volume: N/A (reservoir water level provided) | Modelled area extent: 18 km long river reach downstream of the dam and floodplains Lake: unstructured grid with polyhedral cells; spatial resolution: 100 m River and floodplains: unstructured grid with prismatic cells; multi-resolution Number of cells: 18 × 106 | Flooded areas at different times; free surface profile along the river at peak flood extent; discharge hydrographs at selected river sections; unit discharge transverse profiles in selected cross-sections at peak flood extent; details of the velocity field | Flood wave propagation 3D effects Comparison with 2D depth-averaged model predictions Recalibration of the 2D model parameter to improve the agreement between 2D and 3D model results | Simulation time: 5 h Run time/ simulation time: 144 Parallelization using MPI | 2020 | Commercial |
| Munoz and Constantinescu [37] | STAR-CCM+ | RANS coupled with VOF; realizable k-ε turbulence model | Finite volume; SIMPLE algorithm | Hypothetical Saylorville dam break (USA) Water volume: N/A (reservoir water level provided) | Modelled area extent: 18 km long river reach downstream of the dam and floodplains Lake: unstructured grid with polyhedral cells; spatial resolution: N/A River and floodplains: unstructured grid with prismatic cells; multi-resolution Number of cells: 40 × 106 | Flooded areas at different times; free surface profile along the river at the end of the simulation; discharge hydrographs at selected river sections | Flood wave propagation 3D effects Comparison with 2D depth-averaged model predictions | Simulation time: 3.75 h Run time/ simulation time: 230 Parallelization using MPI | 2020 | Commercial |
| Wang et al. [91] | DualSPHysics | Navier–Stokes and continuity equations; generalised Herschel–Bulkley– Papanastasiou rheological model | Weakly compressible SPH | Hypothetical Yujiaquan tailings dam break (China) Pond capacity: 52.55 million m3 | Modelled area extent: the pond and the area around (~2 km × 2 km) Number of particles: 3.495 × 10⁶ (fluid) 0.936 × 10⁶ (boundaries) Particle spacing: 2 m | Flow fields (velocity magnitude) and flooded areas at selected times | Tailings flow dynamics | Simulation time: 10 min Run time/ simulation time: N/A Parallelization on GPU | 2020 | Open-source |
| Yu et al. [92] | OpenFOAM | RANS coupled with VOF; standard k-ε turbulence model; Bingham– Papanastasiou rheological model | Finite volume; PISO algorithm | Historical 2019 Feijão (Brumadinho) tailings dam break (Brazil) Pond capacity: 12.7 million m3 Released tailings volume: 11.7 million m3 | Modelled area extent: N/A (suitable area around the reservoir) Unstructured mesh of hexahedral cells Number of cells: 3.242 × 10⁶ Spatial resolution: 10 m (horizontal) 3 m (vertical) | Flow velocity magnitude contour maps at selected times; wave front motion; free surface average velocity hydrograph; flooded area | Tailings flow dynamics Comparison with field data | Simulation time: 2500 s Run time/ simulation time: N/A Parallelization using MPI (analysis of the speed-up of different numbers of processors) | 2020 | Open-source |
| Yu et al. [92] | OpenFOAM | RANS coupled with VOF; standard k-ε turbulence model; Bingham– Papanastasiou rheological model | Finite volume; PISO algorithm | Hypothetical A’xi gold tailings dam break (China) Pond capacity: 3.6 million m3 | Modelled area extent: N/A (suitable area around the reservoir) Unstructured mesh of hexahedral cells; number of cells: 6.657 × 10⁶ Spatial resolution: 3 m | Flow velocity magnitude contour maps at selected times; wave front motion; free surface average velocity hydrograph; flooded area | Tailings flow dynamics | Simulation time: 800 s Run time/ simulation time: N/A Parallelization using MPI (analysis of the speed-up of different numbers of processors) | 2020 | Open-source |
| Zhuang et al. [93] | FLOW-3D | RANS coupled with VOF; RNG k-ε turbulence model | Finite volume | Historical landslide dam break consequent to the 2000 Yigong landslide (China) Water volume: N/A (water depth of 60 m at the barrier lake) | Modelled area extent: ~33 km long stretch of the Yigong River valley Mesh details: N/A | Flood depth contour maps at selected times; flow depth and velocity hydrographs at selected points; flow discharge at selected sections | Landslide and following landslide dam-break coupled 3D simulations Comparison with field data Flood wave propagation | Simulation time: 3 h 20 min Run time/ simulation time: N/A | 2020 | Commercial |
| Amicarelli et al. [94] | SPHERA | Euler and continuity equations | Weakly- compressible SPH | Hypothetical Alpe Gera dam break (Italy) Water volume: 68.1 million m3 | Modelled area extent: 7.9 km × 9.9 km Number of particles: N/A Particle spacing: N/A | Flooded areas; velocity fields at selected times; maximum flood depth contour map; discharge and flood depth hydrographs at selected sections | Urban flood features Comparison with experimental laboratory data Adoption of a flooding damage model | Simulation time: 50 min Run time/ simulation time: N/A | 2021 | Free and open-source |
| Karam et al. [95] | FLOW-3D | RANS coupled with VOF; RNG k-ε turbulence model | Finite volume | Hypothetical Attabad Lake landslide dam break (Pakistan) Water volume: 305 million m3 | Modelled area extent: N/A (stretch of the downstream valley) Multiple mesh blocks of hexahedral cells Number of cells: N/A | Flow depth hydrographs at selected sites; flow discharge hydrographs at selected cross-sections; flood inundation maps and velocity fields at selected times; flood arrival times at selected locations | Flood wave propagation | Simulation time: ~1 h 19 min Run time/ simulation time: N/A | 2021 | Commercial |
| Miliani et al. [96] | N/A | Lattice Boltzmann equation with the Bhatnagar–Gross– Krook (BGK) collisional operator; interface tracking method | Lattice Boltzmann algorithm | Flash flood in the Toce River 1:100 physical model (Italy) Controlled impulsive inflow Two case studies considered: the presence of actual buildings and an idealised array of buildings | Modelled area extent: 5 km long reach of the Toce River (5.5 km × 1.2 km) | Video animations of the numerical results; flood depth hydrographs at selected gauge points | Flood wave propagation | Simulation time: N/A Run time/ simulation time: N/A | 2021 | Research |
| Ai et al. [97] | N/A | RANS coupled with a free-surface equation; non-hydrostatic and hydrostatic versions; standard k-ε turbulence model | Coupled finite volume– finite difference; explicit projection method | Flash flood in the Toce River 1:100 physical model (Italy) Controlled impulsive inflow (high-inflow and low-inflow hydrographs) Array of aligned buildings simulating a simplified urban district | Modelled area extent: 5 km long reach of the Toce River (5.5 km × 1.2 km) Unstructured mesh of prismatic cells with triangular basis in a vertical boundary-fitted coordinate system Number of cells: 1.041 × 10⁵ (2.082 × 10⁴ triangular elements on the bottom and 5 layers along the vertical) | Flow depth hydrographs at selected points | Non-hydrostatic effects Comparison with experimental physical model data Comparison with hydrostatic 3D model predictions | Simulation time: 1 min Run time/ simulation time: 29.4 (high-inflow hydrograph) Run time/ simulation time: 24 (low-inflow hydrograph) | 2022 | Research |
| Issakhov et al. [98] | ANSYS Fluent | RANS coupled with VOF; three incompressible phases for the simulation of mixed water–mud flow: two Newtonian fluids (air and water) and a non-Newtonian liquid; realizable k-ω turbulence model | Finite volume; PISO algorithm | Hypothetical erosional dam-break flow along the Kargalinka River (Kazakhstan) Water volume: 333.5 × 10³ m3 | Modelled area extent: N/A (a stretch of the river) Homogeneous mud layer of fixed thickness downstream of the dam Structured mesh of uniform cells Number of cells: 0.985 × 10⁶ | Water surfaces and inundated areas at different times; flood depth hydrographs at selected points (for different mud layer thicknesses) | Flood wave (with mud) propagation Effect of the initial mud layer thickness | Simulation time: 34.5 s Run time/ simulation time: N/A | 2022 | Commercial |
| Yang et al. [99] | ANSYS CFX | RANS coupled with VOF; standard k-ε turbulence model; Bingham rheological model | Finite volume; PISO algorithm | Hypothetical Dagangding tailings dam break (China) Pond capacity: 3.59 million m3 (Theoretical inflow discharge at the dam site) | Modelled area extent: N/A (selected area downstream of the dam) Unstructured mesh with tetrahedral and pentahedral cells Number of cells: 0.543 × 10⁶ | Flow fields (velocity magnitude) and flooded areas at selected times; wave front advancement and celerity in time; final deposition area and depth distribution; longitudinal and transverse profiles of the final deposit | Tailings flow dynamics | Simulation time: 2000 s Run time/ simulation time: N/A | 2022 | Commercial |
| Zhuang et al. [100] | DAN3D | Hydrodynamic equations; rheological models (Bingham model) | SPH | Historical 2017 Tonglüshan tailings dam break (China) Pond capacity: 15.78 million m3; moved slurry volume: 0.5 million m3 | Modelled area extent: ~2 km × 1.5 km area around the tailings pond Number of particles: 4 × 10³ Particle spacing: N/A | Flow depth maps at different times; final deposition area and slurry depth distribution; maximum velocity magnitude map | Propagation of the tailings slurry Comparison with field data concerning the final deposition distribution of the tailings slurry Sensitivity analysis on the solid concentration of the tailings slurry | Simulation time: 300 s Run time/ simulation time: N/A | 2022 | Freeware |
3. Results and Discussion
3.1. Improvements in Simulation Accuracy
3.2. Model Validation and Calibration
3.3. Improvements in Computational Efficiency
3.4. Improvements in Result Visualization
4. Conclusions
Author Contributions
Funding
Data Availability Statement
Conflicts of Interest
References
- Costa, J.E. Floods from Dam Failures; Open-File Report 85-560; US Geological Survey: Denver, CO, USA, 1985. Available online: https://pubs.usgs.gov/of/1985/0560/report.pdf (accessed on 21 July 2023).
- Charles, J.A.; Tedd, P.; Warren, A. Lessons from Historical Dam Incidents; Project SC080046/R1; Environment Agency: Bristol, UK, 2011. Available online: https://assets.publishing.service.gov.uk/media/603369e7e90e07660cc43890/_Lessons_from_Historical_Dam_Incidents_Technical_Report.pdf (accessed on 21 July 2023).
- Zhang, L.; Peng, M.; Chang, D.; Xu, Y. Dam Failure Mechanisms and Risk Assessment; Wiley: Singapore, 2016. [Google Scholar]
- Graham, W.J. A Procedure for Estimating Loss of Life Caused by Dam Failure; DSO-99-06; US Department of Interior, Bureau of Reclamation, Dam Safety Office: Denver, CO, USA, 1999. Available online: https://www.usbr.gov/ssle/damsafety/TechDev/DSOTechDev/DSO-99-06.pdf (accessed on 21 July 2023).
- ASDSO (Association of State Dam Safety Officials). Lesson Learned from Dam Incidents and Failures—Case Studies. Available online: https://damfailures.org/case-study/ (accessed on 21 July 2023).
- International Water Power and Dam Construction. Learning Historical Dam Safety Lessons. Available online: https://www.waterpowermagazine.com/features/featurelearning-historical-dam-safety-lessons-4958949/ (accessed on 21 July 2023).
- FEMA. Federal Guidelines for Inundation Mapping of Flood Risks Associated with Dam Incidents and Failures; FEMA P-946; Federal Emergency Management Agency, US Department of Homeland Security: Washington, DC, USA, 2013. Available online: https://www.fema.gov/sites/default/files/2020-08/fema_dam-safety_inundation-mapping-flood-risks.pdf (accessed on 25 May 2023).
- CDSO. Guidelines for Mapping Flood Risk Associated with Dams; CDSO_GUD_DS_05_v1.0; Central Dam Safety Organization, Central Water Commission, Dam Safety Rehabilitation Directorate: New Delhi, India, 2018. Available online: https://damsafety.cwc.gov.in/ecm-includes/PDFs/Guidelines_for_Mapping_Flood_Risks_Associated_with_Dams.pdf (accessed on 25 May 2023).
- Morris, M.W. CADAM Concerted Action on Dam Break Modeling; Final Report SR 571; HR Wallingford: Oxford, UK, 2000; Available online: https://eprints.hrwallingford.com/447/1/CADAM.pdf (accessed on 25 May 2023).
- Rizzo, C.; Maranzoni, A.; D’Oria, M. Probabilistic Mapping and Sensitivity Assessment of Dam-Break Flood Hazard. Hydrol. Sci. J. 2023, 68, 700–718. [Google Scholar] [CrossRef]
- Maranzoni, A.; D’Oria, M.; Rizzo, C. Quantitative Flood Hazard Assessment Methods: A Review. J. Flood Risk Manag. 2023, 16, e12855. [Google Scholar] [CrossRef]
- Ferrari, A.; Vacondio, R.; Mignosa, P. High-Resolution 2D Shallow Water Modelling of Dam Failure Floods for Emergency Action Plans. J. Hydrol. 2023, 618, 129192. [Google Scholar] [CrossRef]
- Aureli, F.; Maranzoni, A.; Petaccia, G.; Soares-Frazão, S. Review of Experimental Investigations of Dam-Break Flows over Fixed Bottom. Water 2023, 15, 1229. [Google Scholar] [CrossRef]
- Aureli, F.; Maranzoni, A.; Petaccia, G. Review of Historical Dam-Break Events and Laboratory Tests on Real Topography for the Validation of Numerical Models. Water 2021, 13, 1968. [Google Scholar] [CrossRef]
- Teng, J.; Jakeman, A.J.; Vaze, J.; Croke, B.F.W.; Dutta, D.; Kim, S. Flood Inundation Modelling: A Review of Methods, Recent Advances and Uncertainty Analysis. Environ. Model. Softw. 2017, 90, 201–216. [Google Scholar] [CrossRef]
- De Marchi, G. Sull’Onda di Piena che Seguirebbe al Crollo della Diga di Cancano [On the Dam-Break Wave Resulting from the Collapse of the Cancano Dam]. L’Energia Elettr. 1945, 22, 157–169. (In Italian) [Google Scholar]
- Antunes do Carmo, J.S. Physical Modelling vs. Numerical Modelling: Complementarity and Learning. Preprints 2020, 2020070753. Available online: https://www.preprints.org/manuscript/202007.0753/v2/download (accessed on 21 July 2023).
- Mudashiru, R.B.; Sabtu, N.; Abustan, I.; Balogun, W. Flood Hazard Mapping Methods: A Review. J. Hydrol. 2021, 603, 126846. [Google Scholar] [CrossRef]
- Bates, P.D. Flood Inundation Prediction. Annu. Rev. Fluid Mech. 2022, 54, 287–315. [Google Scholar] [CrossRef]
- Toro, E.F.; Garcia-Navarro, P. Godunov-Type Methods for Free-Surface Shallow Flows: A Review. J. Hydraul. Res. 2007, 45, 736–751. [Google Scholar] [CrossRef]
- Castro-Orgaz, O.; Hager, W.H. Shallow Water Hydraulics; Springer: Cham, Switzerland, 2019. [Google Scholar]
- Toro, E.F. Shock-Capturing Methods for Free-Surface Shallow Flows; John Wiley & Sons: Chichester, UK, 2001. [Google Scholar]
- Castro-Orgaz, O.; Hager, W.H. Non-Hydrostatic Free Surface Flows; Springer: Cham, Switzerland, 2017. [Google Scholar]
- Maranzoni, A.; Tomirotti, M. New Formulation of the Two-Dimensional Steep-Slope Shallow Water Equations. Part I: Theory and Analysis. Adv. Water Resour. 2022, 166, 104255. [Google Scholar] [CrossRef]
- Maranzoni, A.; Tomirotti, M. New Formulation of the Two-Dimensional Steep-Slope Shallow Water Equations. Part II: Numerical Modeling, Validation, and Application. Adv. Water Resour. 2023, 177, 104403. [Google Scholar] [CrossRef]
- Stansby, P.K.; Chegini, A.; Barnes, T.C.D. The Initial Stages of Dam-Break Flow. J. Fluid Mech. 1998, 374, 407–424. [Google Scholar] [CrossRef]
- Ozmen-Cagatay, H.; Kocaman, S. Dam-Break Flows During Initial Stage Using SWE and RANS Approaches. J. Hydraul. Res. 2010, 48, 603–611. [Google Scholar] [CrossRef]
- Soares-Frazão, S.; Zech, Y. Dam Break in Channels with 90° Bend. J. Hydraul. Eng. 2002, 128, 956–968. [Google Scholar] [CrossRef]
- Kocaman, S.; Ozmen-Cagatay, H. The Effect of Lateral Channel Contraction on Dam Break Flows: Laboratory Experiment. J. Hydrol. 2012, 432–433, 145–153. [Google Scholar] [CrossRef]
- Khoshkonesh, A.; Nsom, B.; Bahmanpouri, F.; Dehrashid, F.A.; Adeli, A. Numerical Study of the Dynamics and Structure of a Partial Dam-Break Flow Using the VOF Method. Water Resour. Manage. 2021, 35, 1513–1528. [Google Scholar] [CrossRef]
- Soares-Frazão, S. Experiments of Dam-Break Wave Over a Triangular Bottom Sill. J. Hydraul. Res. 2007, 45 (Suppl. S1), 19–26. [Google Scholar] [CrossRef]
- Ozmen-Cagatay, H.; Kocaman, S.; Guzel, H. Investigation of Dam-Break Flood Waves in a Dry Channel with a Hump. J. Hydro-Environ. Res. 2014, 8, 304–315. [Google Scholar] [CrossRef]
- Soares-Frazão, S.; Zech, Y. Experimental Study of Dam-Break Flow against an Isolated Obstacle. J. Hydraul. Res. 2007, 45 (Suppl. S1), 27–36. [Google Scholar] [CrossRef]
- Aureli, F.; Dazzi, S.; Maranzoni, A.; Mignosa, P.; Vacondio, R. Experimental and Numerical Evaluation of the Force Due to the Impact of a Dam-Break Wave on a Structure. Adv. Water Resour. 2015, 76, 29–42. [Google Scholar] [CrossRef]
- Khoshkonesh, A.; Daliri, M.; Riaz, K.; Dehrashid, F.A.; Bahmanpouri, F.; Di Francesco, S. Dam-Break Flow Dynamics over a Stepped Channel with Vegetation. J. Hydrol. 2022, 613, 128395. [Google Scholar] [CrossRef]
- Zhang, T.; Feng, P.; Maksimović, Č.; Bates, P.D. Application of a Three-Dimensional Unstructured-Mesh Finite-Element Flooding Model and Comparison with Two-Dimensional Approaches. Water Resour. Manage. 2016, 30, 823–841. [Google Scholar] [CrossRef]
- Munoz, D.H.; Constantinescu, G. 3-D Dam Break Flow Simulations in Simplified and Complex Domains. Adv. Water Resour. 2020, 137, 103510. [Google Scholar] [CrossRef]
- Fernandez-Feria, R. Dam-Break Flow for Arbitrary Slopes of the Bottom. J. Eng. Math. 2006, 54, 319–331. [Google Scholar] [CrossRef]
- Castro-Orgaz, O.; Cantero-Chinchilla, F.N. Non-Linear Shallow Water Flow Modelling over Topography with Depth-Averaged Potential Equations. Environ. Fluid Mech. 2020, 20, 261–291. [Google Scholar] [CrossRef]
- Lu, X.; Dong, B.; Zhang, X. A Two-Dimensional Depth-Integrated Non-Hydrostatic Numerical Model for Nearshore Wave Propagation. Ocean Model. 2015, 96, 187–202. [Google Scholar] [CrossRef]
- Cantero-Chinchilla, F.N.; Bergillos, R.J.; Gamero, P.; Castro-Orgaz, O.; Cea, L.; Hager, W.H. Vertically Averaged and Moment Equations for Dam-Break Wave Modeling: Shallow Water Hypotheses. Water 2020, 12, 3232. [Google Scholar] [CrossRef]
- Denlinger, R.P.; Iverson, R.M. Granular Avalanches Across Irregular Three-Dimensional Terrain: 1. Theory and Computation. J. Geophys. Res. Earth Surf. 2004, 109, F01014. [Google Scholar] [CrossRef]
- Denlinger, R.P.; O’Connell, D.R. Computing Nonhydrostatic Shallow-Water Flow over Steep Terrain. J. Hydraul. Eng. 2008, 134, 1590–1602. [Google Scholar] [CrossRef]
- Biscarini, C.; Di Francesco, S.; Manciola, P. CFD Modelling Approach for Dam Break Flow Studies. Hydrol. Earth Syst. Sci. 2010, 14, 705–718. [Google Scholar] [CrossRef]
- Lane, S.N.; Bradbrook, K.F.; Richards, K.S.; Biron, P.A.; Roy, A.G. The Application of Computational Fluid Dynamics to Natural River Channels: Three-Dimensional Versus Two-Dimensional Approaches. Geomorphology 1999, 29, 1–20. [Google Scholar] [CrossRef]
- Versteeg, H.K.; Malalasekera, W. An Introduction to Computational Fluid Dynamics. The Finite Volume Method; Longman Scientific & Technical: Harlow, UK, 1995. [Google Scholar]
- Hirt, C.W.; Nichols, B.D. Volume of Fluid (VOF) Methods for the Dynamics of Free Boundaries. J. Comput. Phys. 1981, 39, 201–225. [Google Scholar] [CrossRef]
- Osher, S.; Fedkiw, R.P. Level Set Methods: An Overview and Some Recent Results. J. Comput. Phys. 2001, 169, 463–502. [Google Scholar] [CrossRef]
- Sussman, M.; Puckett, E.G. A Coupled Level Set and Volume-of-Fluid Method for Computing 3D and Axisymmetric Incompressible Two-Phase Flows. J. Comput. Phys. 2000, 162, 301–337. [Google Scholar] [CrossRef]
- Marsooli, R.; Wu, W. 3-D Finite-Volume Model of Dam-Break Flow over Uneven Beds Based on VOF Method. Adv. Water. Resour. 2014, 70, 104–117. [Google Scholar] [CrossRef]
- Monaghan, J.J. Simulating Free Surface Flows with SPH. J. Comput. Phys. 1994, 110, 399–406. [Google Scholar] [CrossRef]
- Xu, X. An Improved SPH Approach for Simulating 3D Dam-Break Flows with Breaking Waves. Comput. Methods Appl. Mech. Eng. 2016, 311, 723–742. [Google Scholar] [CrossRef]
- Xu, X.; Jiang, Y.-L.; Yu, P. SPH Simulations of 3D Dam-Break Flow Against Various Forms of the Obstacle: Toward an Optimal Design. Ocean Eng. 2021, 229, 108978. [Google Scholar] [CrossRef]
- Cleary, P.W.; Prakash, M. Discrete-Element Modelling: Methods and Applications in the Environmental Sciences. Phil. Trans. R. Soc. Lond. A 2004, 362, 2003–2030. [Google Scholar] [CrossRef] [PubMed]
- Wu, J.; Bao, K.; Zhang, H. Research Progress on Dam-Break Floods. In Proceedings of the 2nd IEEE International Conference on Emergency Management and Management Sciences, Beijing, China, 8–10 August 2011; pp. 334–338. [Google Scholar] [CrossRef]
- Ferrari, A.; Fraccarollo, L.; Dumbser, M.; Toro, E.F.; Armanini, A. Three-Dimensional Flow Evolution after a Dam Break. J. Fluid Mech. 2010, 663, 456–477. [Google Scholar] [CrossRef]
- Xie, Z.; Stoesser, T.; Xia, J. Simulation of Three-Dimensional Free-Surface Dam-Break Flows over a Cuboid, Cylinder, and Sphere. J. Hydraul. Eng. 2021, 147, 6021009. [Google Scholar] [CrossRef]
- Issakhov, A.; Imanberdiyeva, M. Numerical Simulation of the Movement of Water Surface of Dam Break Flow by VOF Methods for Various Obstacles. Int. J. Heat Mass Transf. 2019, 136, 1030–1051. [Google Scholar] [CrossRef]
- Issakhov, A.; Borsikbayeva, A. The Impact of a Multilevel Protection Column on the Propagation of a Water Wave and Pressure Distribution During a Dam Break: Numerical Simulation. J. Hydrol. 2021, 598, 126212. [Google Scholar] [CrossRef]
- Luo, P.; Luo, M.; Li, F.; Qi, X.; Huo, A.; Wang, Z.; He, B.; Takara, K.; Nover, D.; Wang, Y. Urban Flood Numerical Simulation: Research, Methods and Future Perspectives. Environ. Model. Softw. 2022, 156, 105478. [Google Scholar] [CrossRef]
- Mignot, E.; Dewals, B. Hydraulic Modelling of Inland Urban Flooding: Recent Advances. J. Hydrol. 2022, 609, 127763. [Google Scholar] [CrossRef]
- Kumar, V.; Sharma, K.V.; Caloiero, T.; Mehta, D.J.; Singh, K. Comprehensive Overview of Flood Modeling Approaches: A Review of Recent Advances. Hydrology 2023, 10, 141. [Google Scholar] [CrossRef]
- Avila-Aceves, E.; Plata-Rocha, W.; Monjandin-Armenta, S.A.; Rangel-Peraza, J.G. Geospatial Modelling of Floods: A Literature Review. Stoch. Environ. Res. Risk Assess. 2023. [Google Scholar] [CrossRef]
- TELEMAC-3D—3D Hydrodynamics. Available online: http://www.opentelemac.org/index.php/presentation?id=18 (accessed on 27 March 2023).
- FLOW-3D. Available online: https://www.flow3d.com/products/flow-3d/ (accessed on 27 March 2023).
- About OpenFOAM. Available online: https://www.openfoam.com/ (accessed on 27 March 2023).
- DualSPHysics: From Fluid Dynamics to Multiphysics Problems. Available online: https://dual.sphysics.org/ (accessed on 5 April 2023).
- Amicarelli, A.; Manenti, S.; Albano, R.; Agate, G.; Paggi, M.; Longoni, L.; Mirauda, D.; Ziane, L.; Viccione, G.; Todeschini, S.; et al. SPHERA v. 9.0.0: A Computational Fluid Dynamics Research Code, Based on the Smoothed Particle Hydrodynamics Mesh-Less Method. Comput. Phys. Commun. 2020, 250, 107157. [Google Scholar] [CrossRef]
- Roubtsova, V.; Kahawita, R. The SPH Technique Applied to Free Surface Flows. Comput. Fluids 2006, 35, 1359–1371. [Google Scholar] [CrossRef]
- Cleary, P.W.; Prakash, M.; Rothauge, K. Combining Digital Terrain and Surface Textures with Large-Scale Particle-Based Computational Models to Predict Dam Collapse and Landslide Events. Int. J. Image Data Fusion 2010, 1, 337–357. [Google Scholar] [CrossRef]
- Prakash, M.; Rothauge, K.; Cleary, P.W. Modelling the Impact of Dam Failure Scenarios on Flood Inundation Using SPH. Appl. Math. Model. 2014, 38, 5515–5534. [Google Scholar] [CrossRef]
- Ye, F.; Wang, H.; Ouyang, S.; Tang, X.; Li, Z.; Prakash, M. Spatio-Temporal Analysis and Visualization Using SPH for Dam-Break and Flood Disasters in a GIS Environment. In Proceedings of the 2012 International Symposium on Geomatics for Integrated Water Resource Management, Lanzhou, China, 19–21 October 2012. [Google Scholar] [CrossRef]
- Cleary, P.W.; Prakash, M.; Mead, S.; Tang, X.; Wang, H.; Ouyang, S. Dynamic Simulation of Dam-Break Scenarios for Risk Analysis and Disaster Management. Int. J. Image Data Fusion 2012, 3, 333–363. [Google Scholar] [CrossRef]
- Lee, E.-S.; Violeau, D.; Issa, R.; Ploix, S. Application of Weakly Compressible and Truly Incompressible SPH to 3-D Water Collapse in Waterworks. J. Hydraul. Res. 2010, 48 (Suppl. S1), 50–60. [Google Scholar] [CrossRef]
- Caboussat, A.; Boyaval, S.; Masserey, A. On the Modeling and Simulation of Non-Hydrostatic Dam Break Flows. Comput. Visual. Sci. 2011, 14, 401–417. [Google Scholar] [CrossRef][Green Version]
- Vassilevski, Y.V.; Nikitin, K.D.; Olshanskii, M.A.; Terekhov, K.M. CFD Technology for 3D Simulation of Large-Scale Hydrodynamic Events and Disasters. Russ. J. Numer. Anal. Math. Model. 2012, 27, 399–412. [Google Scholar] [CrossRef]
- Vacondio, R.; Mignosa, P.; Pagani, S. 3D SPH Numerical Simulation of the Wave Generated by the Vajont Rockslide. Adv. Water Res. 2013, 59, 146–156. [Google Scholar] [CrossRef]
- Zhainakov, A.Z.; Kurbanaliev, A.Y. Verification of the Open Package OpenFOAM on Dam Break Problems. Thermophys. Aeromech. 2013, 20, 451–461. [Google Scholar] [CrossRef]
- Jainakov, A.; Kurbanaliev, A.; Oskonbaev, M. Large-Scale Modeling of Dam Break Induced Flows. In Dam Engineering; Tosun, H., Ed.; IntechOpen: London, UK, 2019; pp. 59–72. [Google Scholar] [CrossRef]
- Džebo, E.; Žagar, D.; Krzyk, M.; Četina, M.; Petkovšek, G. Different Ways of Defining Wall Shear in Smoothed Particle Hydrodynamics Simulations of a Dam-Break Wave. J. Hydraul. Res. 2014, 52, 453–464. [Google Scholar] [CrossRef]
- Zhou, Z.; Wang, X.; Sun, R.; Ao, X.; Sun, X.; Song, M. Study of the Comprehensive Risk Analysis of Dam-Break Flooding Based on the Numerical Simulation of Flood Routing. Part II: Model Application and Results. Nat. Hazards 2014, 72, 675–700. [Google Scholar] [CrossRef]
- Biscarini, C.; Di Francesco, S.; Ridolfi, E.; Manciola, P. On the Simulation of Floods in a Narrow Bending Valley: The Malpasset Dam Break Case Study. Water 2016, 8, 545. [Google Scholar] [CrossRef]
- TELEMAC Modelling System. 3D Hydrodynamics, TELEMAC-3D Software; Version 7.0, Validation Document; EDF R&D: Paris, France, 2016; Available online: http://www.opentelemac.org/index.php/component/jdownloads/summary/44-v7p0/1302-telemac3d-validation-v7p0?Itemid=54 (accessed on 30 March 2023).
- Amicarelli, A.; Kocak, B.; Sibilla, S.; Grabe, J. A 3D Smoothed Particle Hydrodynamics Model for Erosional Dam-Break Floods. Int. J. Comput. Fluid Dyn. 2017, 31, 413–434. [Google Scholar] [CrossRef]
- Wang, X.; Chen, W.; Zhou, Z.; Zhu, Y.; Wang, C.; Liu, Z. Three-Dimensional Flood Routing of a Dam Break Based on a High-Precision Digital Model of a Dense Urban Area. Nat. Hazards 2017, 86, 1147–1174. [Google Scholar] [CrossRef]
- Wang, K.; Yang, P.; Hudson-Edwards, K.A.; Lyu, W.; Yang, C.; Jing, X. Integration of DSM and SPH to Model Tailings Dam Failure Run-Out Slurry Routing Across 3D Real Terrain. Water 2018, 10, 1087. [Google Scholar] [CrossRef]
- Zhang, T.; Peng, L.; Feng, P. Evaluation of a 3D Unstructured-Mesh Finite Element Model for Dam-Break Floods. Comput. Fluids 2018, 160, 64–77. [Google Scholar] [CrossRef]
- Chen, H.-X.; Li, J.; Feng, S.-J.; Gao, H.-Y.; Zhang, D.-M. Simulation of Interactions Between Debris Flow and Check Dams on Three-Dimensional Terrain. Eng. Geol. 2019, 251, 48–62. [Google Scholar] [CrossRef]
- Kurbanaliev, A.I.; Maksutov, A.R.; Obodoeva, G.S.; Oichueva, B.R. Using OpenFOAM Multiphase Solver InterFoam for Large Scale Modeling. In Proceedings of the 27th World Congress on Engineering and Computer Science, San Francisco, CA, USA, 22–24 October 2019; International Association of Engineers: Hong Kong, China; pp. 366–370. Available online: https://www.iaeng.org/publication/WCECS2019/WCECS2019_pp366-370.pdf (accessed on 25 August 2023).
- Issakhov, A.; Zhandaulet, Y. Numerical Study of Dam Break Waves on Movable Beds for Complex Terrain by Volume of Fluid Method. Water Resour. Manage. 2020, 34, 463–480. [Google Scholar] [CrossRef]
- Wang, K.; Yang, P.; Yu, G.; Yang, C.; Zhu, L. 3D Numerical Modelling of Tailings Dam Breach Run Out Flow over Complex Terrain: A Multidisciplinary Procedure. Water 2020, 12, 2538. [Google Scholar] [CrossRef]
- Yu, D.; Tang, L.; Chen, C. Three-Dimensional Numerical Simulation of Mud Flow from a Tailing Dam Failure Across Complex Terrain. Nat. Hazards Earth Syst. Sci. 2020, 20, 727–741. [Google Scholar] [CrossRef]
- Zhuang, Y.; Yin, Y.; Xing, A.; Jin, K. Combined Numerical Investigation of the Yigong Rock Slide-Debris Avalanche and Subsequent Dam-Break Flood Propagation in Tibet, China. Landslides 2020, 17, 2217–2229. [Google Scholar] [CrossRef]
- Amicarelli, A.; Manenti, S.; Paggi, M. SPH Modelling of Dam-break Floods, with Damage Assessment to Electrical Substations. Int. J. Comput. Fluid Dyn. 2021, 35, 3–21. [Google Scholar] [CrossRef]
- Karam, W.; Khan, F.A.; Alam, M.; Ali, S. Simulation of Dam-Break Flood Wave and Inundation Mapping: A Case Study of Attabad Lake. Int. J. 2021, 9, 703–714. [Google Scholar] [CrossRef]
- Miliani, S.; Montessori, A.; La Rocca, M.; Prestininzi, P. Dam-Break Modeling: LBM as the Way Towards Fully 3D, Large-Scale Applications. J. Hydraul. Eng. 2021, 147, 4021017. [Google Scholar] [CrossRef]
- Ai, C.; Ma, Y.; Ding, W.; Xie, Z.; Dong, G. Three-Dimensional Non-Hydrostatic Model for Dam-Break Flows. Phys. Fluids 2022, 34, 22105. [Google Scholar] [CrossRef]
- Issakhov, A.; Borsikbayeva, A.; Abylkassymova, A.; Issakhov, A.; Khikmetov, A. Numerical Modeling of the Dam-Break Flood over Natural Rivers on Movable Beds. Int. J. Nonlinear Sci. Numer. Simul. 2022. [Google Scholar] [CrossRef]
- Yang, Y.; Zhou, X.; Chen, X.; Xie, C. Numerical Simulation of Tailings Flow from Dam Failure over Complex Terrain. Materials 2022, 15, 2288. [Google Scholar] [CrossRef] [PubMed]
- Zhuang, Y.; Jin, K.; Cheng, Q.; Xing, A.; Luo, H. Experimental and Numerical Investigations of a Catastrophic Tailings Dam Break in Daye, Hubei, China. Bull. Eng. Geol. Environ. 2022, 81, 9. [Google Scholar] [CrossRef]
- Jiang, H.; Zhao, B.; Dapeng, Z.; Zhu, K. Numerical Simulation of Two-Dimensional Dam Failure and Free-Side Deformation Flow Studies. Water 2023, 15, 1515. [Google Scholar] [CrossRef]
- Oertel, M.; Bung, D.B. Comparison of 2D Dam-Break Waves with VOF and SPH Method. In Proceedings of the 35th IAHR World Congress, Chengdu, China, 8–13 September 2013; Tsinghua University Press: Beijing, China; Available online: https://www.iahr.org/library/infor?pid=14676 (accessed on 24 August 2023).
- Purbasari, R.J.; Suryanto, A.; Anam, S. Numerical Simulations of Dam-Break Flows by Lattice Boltzmann Method. AIP Conf. Proc. 2021, 2021, 60027. [Google Scholar] [CrossRef]
- Maquignon, N.; Smaoui, H.; Sergent, P.; Bader, B. A Simplified and Stable Lattice Boltzmann Shallow Water Model. J. Phys. Conf. Ser. 2022, 2202, 12055. [Google Scholar] [CrossRef]
- LeVeque, R.J. Finite Volume Methods for Hyperbolic Problems; Cambridge University Press: Cambridge, UK, 2002. [Google Scholar]
- Dick, E. Introduction to Finite Element Methods in Computational Fluid Dynamics. In Computational Fluid Dynamics, 3rd ed.; Wendt, J.F., Ed.; Springer: Berlin, Germany, 2009; pp. 235–274. [Google Scholar]
- Hervouet, J.-M. Hydrodynamics of Free Surface Flows: Modelling with the Finite Element Method; Wiley: Chichester, UK, 2007. [Google Scholar]
- Munoz, D.H.; Constantinescu, G. A Fully 3-D Numerical Model to Predict Flood Wave Propagation and Assess Efficiency of Flood Protection Measures. Adv. Water Resour. 2018, 122, 148–165. [Google Scholar] [CrossRef]
- Rong, Y.; Zhang, T.; Zheng, Y.; Hu, C.; Peng, L.; Feng, P. Three-Dimensional Urban Flood Inundation Simulation Based on Digital Aerial Photogrammetry. J. Hydrol. 2020, 584, 124308. [Google Scholar] [CrossRef]
- Peng, L.; Zhang, T.; Li, J.; Feng, P. Three-Dimensional Numerical Study of Dam-Break Flood Impacting Problem with VOF Method and Different Turbulence Closures. Water Resour. Manage. 2023, 37, 3875–3895. [Google Scholar] [CrossRef]
- Pu, J.H.; Shao, S.; Huang, Y.; Hussain, K. Evaluations of SWEs and SPH Numerical Modelling Techniques for Dam Break Flows. Eng. Appl. Comput. Fluid Mech. 2013, 7, 544–563. [Google Scholar] [CrossRef]
- Issakhov, A.; Zhandaulet, Y.; Nogaeva, A. Numerical Simulation of Dam Break Flow for Various Forms of the Obstacle by VOF Method. Int. J. Multiph. Flow 2018, 109, 191–206. [Google Scholar] [CrossRef]
- Park, I.-R.; Kim, K.-S.; Kim, J.; Van, S.-H. Numerical Investigation of the Effects of Turbulence Intensity on Dam-Break Flows. Ocean Eng. 2012, 42, 176–187. [Google Scholar] [CrossRef]
- Larocque, L.A.; Imran, J.; Chaudhry, M.H. 3D Numerical Simulation of Partial Breach Dam-Break Flow Using the LES and k–ϵ Turbulence Models. J. Hydraul. Res. 2013, 51, 145–157. [Google Scholar] [CrossRef]
- Yang, S.; Yang, W.; Qin, S.; Li, Q. Comparative Study on Calculation Methods of Dam-Break Wave. J. Hydraul. Res. 2019, 57, 702–714. [Google Scholar] [CrossRef]
- Simsek, O.; Islek, H. 2D and 3D Numerical Simulations of Dam-Break Flow Problem with RANS, DES, and LES. Ocean Eng. 2023, 276, 114298. [Google Scholar] [CrossRef]
- Neal, J.; Villanueva, I.; Wright, N.; Willis, T.; Fewtrell, T.; Bates, P. How Much Physical Complexity is Needed to Model Flood Inundation? Hydrol. Process. 2012, 26, 2264–2282. [Google Scholar] [CrossRef]
- Goutal, N. The Malpasset Dam Failure. An Overview and Test Case Definition. In Proceedings of the 4th CADAM Meeting, Zaragoza, Spain, 18–19 November 1999. [Google Scholar]
- Hervouet, J.-M.; Petitjean, A. Malpasset Dam-Break Revisited with Two-Dimensional Computations. J. Hydraul. Res. 1999, 37, 777–788. [Google Scholar] [CrossRef]
- Alcrudo, F.; Mulet, J. Description of the Tous Dam Break Case Study (Spain). J. Hydraul. Res. 2007, 45 (Suppl. S1), 45–57. [Google Scholar] [CrossRef]
- Pilotti, M.; Maranzoni, A.; Tomirotti, M.; Valerio, G. 1923 Gleno Dam Break: Case Study and Numerical Modeling. J. Hydraul. Eng. 2011, 137, 480–492. [Google Scholar] [CrossRef]
- Testa, G.; Zuccalà, D.; Alcrudo, F.; Mulet, J.; Soares-Frazão, S. Flash Flood Flow Experiment in a Simplified Urban District. J. Hydraul. Res. 2007, 45 (Suppl. S1), 37–44. [Google Scholar] [CrossRef]
- Pilotti, M.; Milanesi, L.; Bacchi, V.; Tomirotti, M.; Maranzoni, A. Dam-Break Wave Propagation in Alpine Valley with HEC-RAS 2D: Experimental Cancano Test Case. J. Hydraul. Eng. 2020, 146, 5020003. [Google Scholar] [CrossRef]
- Güney, M.S.; Tayfur, G.; Bombar, G.; Elci, S. Distorted Physical Model to Study Sudden Partial Dam Break Flows in an Urban Area. J. Hydraul. Eng. 2014, 140, 5014006. [Google Scholar] [CrossRef]
- Norton, J. An Introduction to Sensitivity Assessment of Simulation Models. Environ. Model. Softw. 2015, 69, 166–174. [Google Scholar] [CrossRef]
- Pianosi, F.; Beven, K.; Freer, J.; Hall, J.W.; Rougier, J.; Stephenson, D.B.; Wagener, T. Sensitivity Analysis of Environmental Models: A Systematic Review with Practical Workflow. Environ. Model. Softw. 2016, 79, 214–232. [Google Scholar] [CrossRef]
- Castro-Orgaz, O.; Hager, W.H.; Katopodes, N.D. Variational Models for Nonhydrostatic Free-Surface Flow: A Unified Outlook to Maritime and Open-Channel Hydraulics Developments. J. Hydraul. Eng. 2023, 149, 4023014. [Google Scholar] [CrossRef]
- Yu, D.; Tang, L.; Ye, F.; Chen, C. A Virtual Geographic Environment for Dynamic Simulation and Analysis of Tailings Dam Failure. Int. J. Digit. Earth 2021, 14, 1194–1212. [Google Scholar] [CrossRef]
- Macchione, F.; Costabile, P.; Costanzo, C.; De Santis, R. Moving to 3-D Flood Hazard Maps for Enhancing Risk Communication. Environ. Model. Softw. 2019, 111, 510–522. [Google Scholar] [CrossRef]
- Spero, H.R.; Vazquez-Lopez, I.; Miller, K.; Joshaghani, R.; Cutchin, S.; Enterkine, J. Drones, Virtual Reality, and Modeling: Communicating Catastrophic Dam Failure. Int. J. Digit. Earth 2022, 15, 585–605. [Google Scholar] [CrossRef]
- FLOW-3D Modeling Capabilities. Hybrid Shallow Water/3D Flow. Available online: https://www.flow3d.com/modeling-capabilities/hybrid-shallow-water-3d-flow/ (accessed on 27 April 2023).


| Model | Advantages | Shortcomings |
|---|---|---|
| 2D depth-averaged | Easy to build and implement Computationally cheap Few parameters to calibrate (roughness) Robust and stable | Limitations due to the shallow-water assumptions (hydrostatic distribution of pressure and small bottom slopes) |
| 3D | High accuracy (mild restrictive assumptions) Reproduction of non-hydrostatic effects | Laborious to build and implement Complex calculations Computationally expensive Several parameters involved |
Disclaimer/Publisher’s Note: The statements, opinions and data contained in all publications are solely those of the individual author(s) and contributor(s) and not of MDPI and/or the editor(s). MDPI and/or the editor(s) disclaim responsibility for any injury to people or property resulting from any ideas, methods, instructions or products referred to in the content. |
© 2023 by the authors. Licensee MDPI, Basel, Switzerland. This article is an open access article distributed under the terms and conditions of the Creative Commons Attribution (CC BY) license (https://creativecommons.org/licenses/by/4.0/).
Share and Cite
Maranzoni, A.; Tomirotti, M. Three-Dimensional Numerical Modelling of Real-Field Dam-Break Flows: Review and Recent Advances. Water 2023, 15, 3130. https://doi.org/10.3390/w15173130
Maranzoni A, Tomirotti M. Three-Dimensional Numerical Modelling of Real-Field Dam-Break Flows: Review and Recent Advances. Water. 2023; 15(17):3130. https://doi.org/10.3390/w15173130
Chicago/Turabian StyleMaranzoni, Andrea, and Massimo Tomirotti. 2023. "Three-Dimensional Numerical Modelling of Real-Field Dam-Break Flows: Review and Recent Advances" Water 15, no. 17: 3130. https://doi.org/10.3390/w15173130
APA StyleMaranzoni, A., & Tomirotti, M. (2023). Three-Dimensional Numerical Modelling of Real-Field Dam-Break Flows: Review and Recent Advances. Water, 15(17), 3130. https://doi.org/10.3390/w15173130