Article

Particle Size Distribution and Composition of Soil Sample Analysis in a Single Pumping Well Using a Scanning Electron Microscope Coupled with an Energy Dispersive X-ray (SEM-EDX) and the Laser Diffraction Method (LDM)

by
Naseem Akhtar
1,
Muhammad Izzuddin Syakir
1,2,*,
Saleh Ali Tweib
3,
Muhammad Irman Khalif Ahmad Aminuddin
4,
Mohamad Shaiful Md Yusuff
1,
Abdullah H. Alsabhan
5,
Faisal M. Alfaisal
5,
Shamshad Alam
5 and
Jibran Qadri
6
1
Division of Environmental Technology, School of Industrial Technology, Universiti Sains Malaysia, Gelugor 11800, Pulau Pinang, Malaysia
2
Centre for Global Sustainability Studies, Universiti Sains Malaysia, Gelugor 11800, Pulau Pinang, Malaysia
3
Chemical and Process Engineering, Zawai Higher Institute of Science and Technology, Al-Zawia 16418, Libya
4
School of Materials and Mineral Resources Engineering, Universiti Sains Malaysia, Nibong Tebal 14300, Pulau Pinang, Malaysia
5
Department of Civil Engineering, College of Engineering, King Saud University, Riyadh 11543, Saudi Arabia
6
Department of Civil, Environmental and Architectural Engineering, School of Engineering, University of Padova, Via Marzolo, 935131 Padova, Italy
*
Author to whom correspondence should be addressed.
Water 2023, 15(17), 3109; https://doi.org/10.3390/w15173109
Submission received: 28 July 2023 / Revised: 23 August 2023 / Accepted: 26 August 2023 / Published: 30 August 2023
(This article belongs to the Topic Advances in Well and Borehole Hydraulics and Hydrogeology)

Abstract

:
Soil is a heterogeneous material, and its properties are vital from an agricultural perspective and for groundwater management. However, limited studies have been performed on the soil characteristics (soil texture, water-holding capacity, and soil compositions) of a single pumping well, especially in Malaysia. This article focuses on the soil characteristics and elemental analysis of a single borehole with 11 samples collected around Labu Kubong, Perak. The soil properties were analyzed in the context of particle size distribution (PSD) using the laser diffraction method (LDM), as well as soil composition for elemental analysis using a scanning electron microscope coupled with an energy dispersive X-ray (SEM-EDX). The LDM results revealed the average percentage of clay, silt, and sand to be 0%, 6%, and 94%, respectively, indicating most particles comprised sand particles which in percentages demonstrated a sandy texture with less silt content. Additionally, the water holding capacity is low because of major coarse sand particles in alluvial formations. Moreover, SEM-EDX outcomes displayed an average percentage of elemental composition reported as follows: C (40.77%), O (34.33%), Si (10.66%), Al (5.82%), Fe (1.10%), K (1.10%), As (0.05%), Na (0.04%), and Be (5.62%). Consequently, SEM-EDX outcomes showed these elements were derived from silicified quartz, feldspar, and iron-bearing minerals that originated from shale formations, and the presence of carbon indicates peat formation. Therefore, this study provides information on a single pumping well from an irrigation practice, and this study also recommends regional to global scale studies for supporting sustainable groundwater development worldwide.

1. Introduction

Soil is the uppermost layer of the earth’s crust that is weathered from inorganic parti-cles (the parent material of rocks or minerals), organic materials (decayed plants from humans, peat), and other substances [1,2,3,4,5,6]. The combination of these various components determines the soil properties such as texture, porosity, soil composition, and water holding capacity [7,8,9,10]. The study of soil properties has created much interest among soil scientists and researchers because optimizing the utilization of these characteristicsc (soil texture, soil size and water holding capacity) is important to develop an effective pumping well from an agricultural perspective. [11,12,13,14]. Several factors such as parental materials, topography, time, and climate changes affect the soil properties since each factor varies from region to region, thus creating challenges for varied environments [15]. Therefore, new ways of thinking and innovative technology should be applied to soil properties that are important for the environment, human society, agriculture, and natural resource development and management.
The soil size distribution (SSD) or particle size distribution (PSD) of soil is an important soil physical property that directly determines soil texture classification and has a significant impact on aquifer properties [5]. Additionally, the chemical composition of soil is another important characteristic to consider for supporting its physical properties [16]. However, soil investigation, especially the PSD and chemical composition at the local scale, has remained essentially challenging. Huge advances in technology over the past ten years have made it possible for soil scientists to study and measure the microscopic heterogeneity of soils in different ways that were impossible to manage earlier. Previously, the standard technique used for determining the PSD of soil samples was sieve analysis with a mesh diameter of 63 μm and the sedimentation process [17,18,19]. Previously, over the past several decades, these methods were widely used in soil surveys and the production of associated soil databases due to their cost effectiveness and ease of use [20,21]. However, sieve analysis and the sedimentation procedure are laborious and time-consuming, particularly for measuring particles less than 2 mm, and sometimes they fail to provide continuous PSDs with fine resolution [22].
Presently, a new instrument, such as the laser diffraction method (LDM), is being developed for the assessment of PSD to address the percentage of each soil sample made from coarse to very fine particles based on automatic computer analysis. [22,23,24,25,26]. Several authors have demonstrated that laser diffraction is highly reproducible with a high degree of accuracy as compared to several optical and some other soil size techniques [5,27,28]. Furthermore, the LDM calculates the soil particle size by comparing the measured light scattering to one calibrated for an equivalent sphere. The computer system identifies the soil particle size distribution in the sample under study by using the signals that are generated from the scattered light reaching the detectors [5]. In addition, it calculates the diameters of the particles to be more exact based on spheres with the same amount of cross-sectional area [19,22]. The results of LDM analysis are often presented in the form of volume percentages for the various soil particle fractions.
On the other hand, the scanning electron microscope (SEM) equipped with an energy dispersive x-ray (EDX) is used to investigate numerous microscopic traces, making it simple to define the soil morphology and mineralogical composition of rocks or soils, as well as to measure the absolute surface area of each soil particle [1,4,29,30,31,32,33]. The SEM-EDX method allows for easy, non-destructive, and quick investigations of a wide range of different materials. Nevertheless, several researchers have investigated the utilization of SEM-EDX for environmental laboratory testing [34]. For instance, the size and shape of sand grains in Thai paddy soils were determined using SEM to study the sedimentation history and soil sources [35,36]. The SEM was also used to analyze the surface textures of quartz grains for evaluating environmental events [37]. Moreover, the size and shape of air dust particles from the Indian state of Tamil Nadu were investigated using SEM [38]. Further, Li et al. [39] reported using SEM to analyze Yellow River sediment particles quantitatively. Also, Jamari et al. [40] applied EDX for qualitative and quantitative assessments of Ni, Cu, and Zn in soil and plant samples for phytoremediation applications. The effect of heating on aggregate stability in Mediterranean soils was also studied using SEM-EDX [41,42].
However, limited studies have been performed on the soil characteristics of pumping wells at different depths in alluvial formations using LDM and SEM-EDX techniques worldwide, especially in Malaysia. The soil samples were collected in this study based on a single pumping well developed by the Integrated Agricultural Development Area (IADA) during the drilling process at varying depths around Teluk Intan, Peninsular Malaysia. Initially, the IADA experts performed two lines of geophysical surveys, such as electrical resistivity tomography (ERT) and induced polarization (IP) methods with a pole–dipole configuration applied in Labu Kubong, Teluk Intan, as addressed below. After this, the pumping well was drilled up to 62 m depth, and soil samples were collected. This process was carried out to conduct laboratory analysis from an agricultural perspective and support sustainable groundwater development in alluvial formations around the Labu Kubung area. Therefore, the main objective of this article was to analyze the soil samples for particle size distribution, water holding capacity, and soil texture using the LDM and the soil elemental analysis using SEM-EDX techniques. The use of advanced techniques has greatly increased knowledge of subsurface characterization to conduct a borehole study for subsurface soil profile. The knowledge of soil characteristics based on soil sample analysis is important and essential to make groundwater abstraction in alluvial formations easy, as well as to understand the subsurface lithology information for the substantial stored water in alluvial aquifer formations and aquifer hydraulic characteristics that would be found for groundwater abstraction from pumping wells worldwide.

2. Materials and Methods
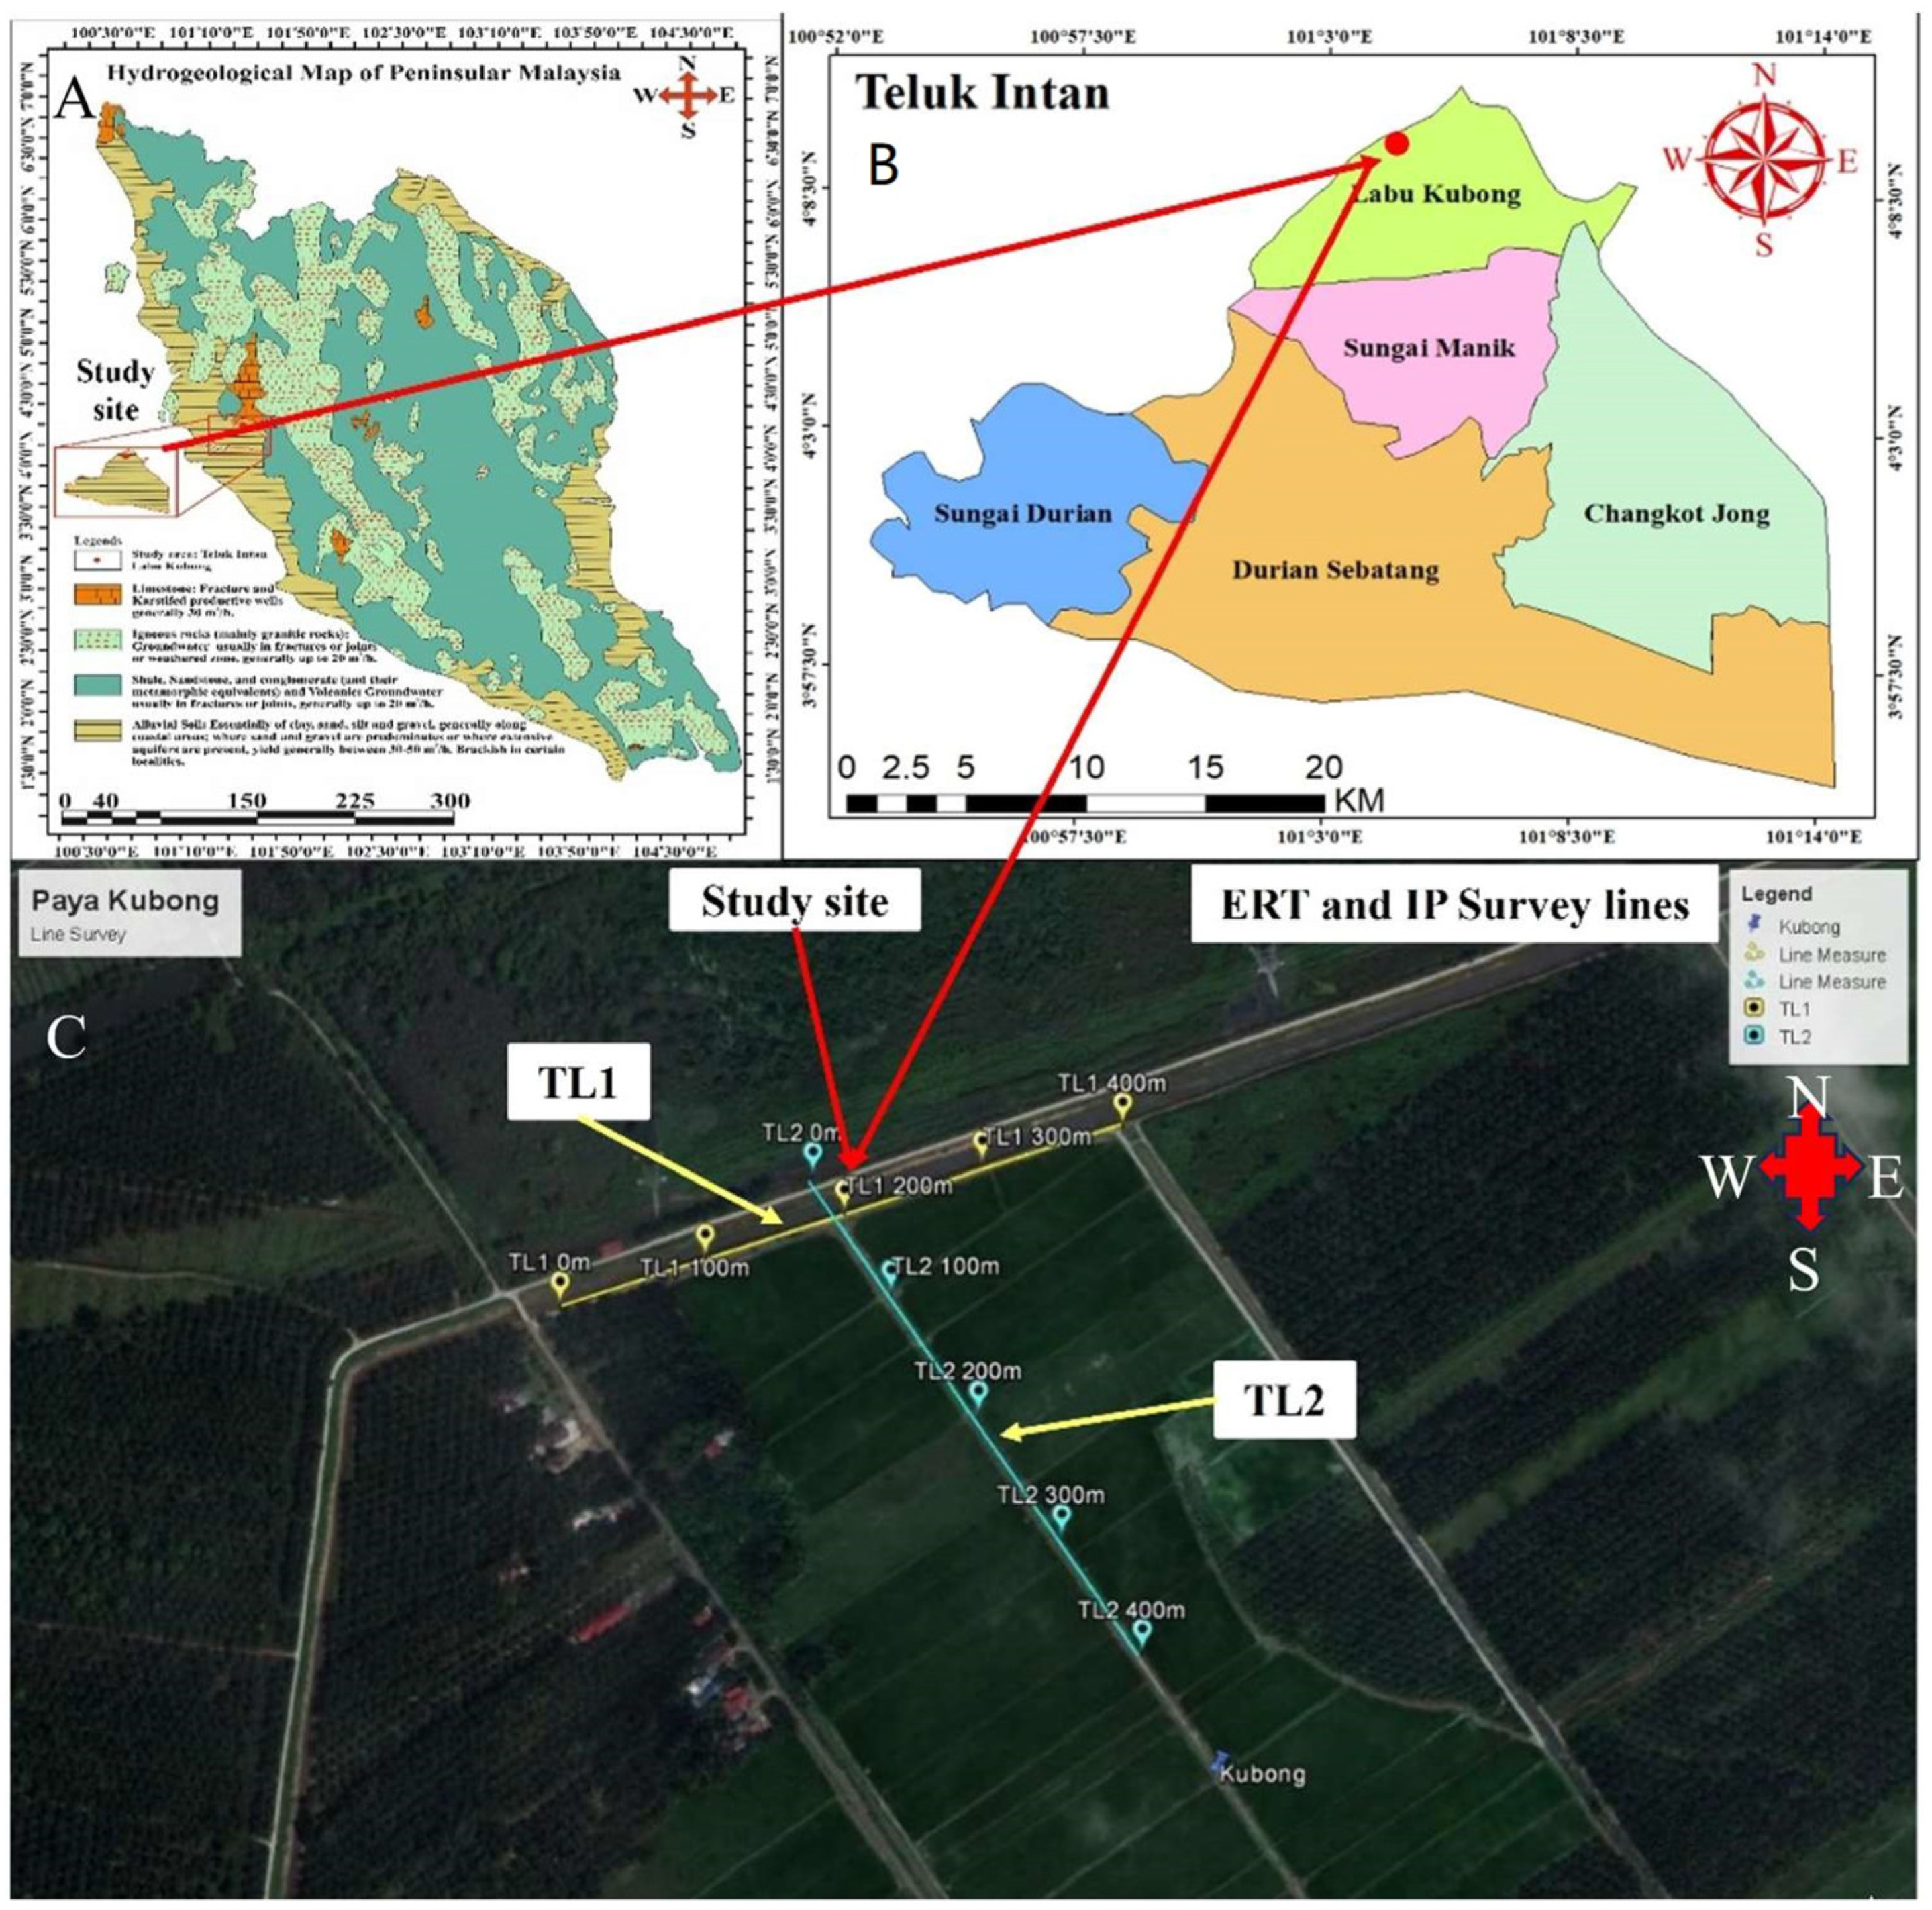
2.1. Study Area

Groundwater development was performed to drill and construct a single tube well developed by the IADA in Labu Kubong, Teluk Intan, Peninsular Malaysia (Figure 1). The coordinate system of the pumping well lies at a longitude of 4°7′18.35″ N and latitude of 101°2′0.67″ E with an average elevation of 39–41 m above sea level. The study area is a naturally flat plain surrounded by rice fields and major streets. The hot season is from June to August, while the rainy season is from March to May and October to December. The mean annual precipitation of the study area is about 2450 mm. The average temperature ranges between 33.5 °C to 23.5 °C (maximum to minimum), and the average relative humidity between 94% and 62% [41]. This area is appropriate for the cultivation of irrigated crops because the Perak River and its tributaries pass through it. However, the surface water resources located near the borehole are limited and far away.

2.2. Geological and Hydrogeological Study

The geological formation of Peninsular Malaysia is historically categorized into three north–south longitudinal belts such as the western belt, the central belt, and the eastern belt (Figure 2). Moreover, the magmatism, stratigraphy, geological, structural, and geophysical characteristics of these belts are associated with their differences [43,44]. The study area is located within the western belt of the Malaysian Peninsula with continental sequences ranging from the Cambrian period through to Quaternary periods, such as alluvial formations, siltstones, sandstones, shell, metamorphic rocks, and unconsolidated deposits [45,46]. The stratigraphy of the study area falls in the Gula formation of the Holocene age (480 ± 120 years), described by Batchelor [45]. This Gula formation was divided into five members based on localities such as Teluk Intan, Port Weld, Bagan Datoh, Parit Buntar, and Matang Gelugor [46]. Therefore, the Labu Kubung area is part of Bagan Datoh, typically composed of clay, silt, and sand and shallow marine, estuarine, and offshore environments [46].
Previous studies showed that high to medium potential aquifer systems can be found in the study area. Also, the alluvial aquifers can be located with a potential range between 30 and 50 m3/d or more than 100 m3/d around various regions of Peninsular Malaysia as shown in the hydrogeological map of Peninsular Malaysia [47,48,49]. However, the potential aquifers can be found in meta-sedimentary formations and igneous rocks, as well as in sedimentary rocks with an average well yield of 10–40 [50]. Furthermore, the alluvium soils in the study area have been deposited in an irregular and discontinuous formation from the surface water due to the flood plain [41]. Although the alluvial formations are highly porous due to poor cementation among grains, the permeability of poorly sorted sediments is low and higher in well-sorted sediments [51]. Further, the alluvial aquifers have a high porosity due to consolidated sandy formations, thus causing high water holding capacity.

2.3. Previous Studies of Geophysical Surveys in the Study Area

Akhtar et al. [52] published an article based on geophysical surveys in the Labu Kubong area. They characterized the subsurface profile of the groundwater aquifer systems located in the Teluk Intan district, Perak, Malaysia, using the ERT and IP methods, along with geo-electrical data that were interpreted using RESIST software (Version 1) with partial curve matching and computer iteration. The horizontal subsurface profiles (TL1 and TL2, as mentioned in Figure 1) were carried out across a distance of 400 m, and the depth was estimated to be 150 m below ground level (MBGL) (Figure 3). Despite all this, the main objective of the present investigation was to validate the results of the ERT and IP surveys by comparing the subsurface profile to the information collected from the in-situ pumping well. As a result, the resistivity values acquired by ERT and the chargeability values detected through IP were modified using two survey lines [52]. Thus, we interpreted and plotted the ERT and IP of survey lines (TL1 and TL2), as shown in Figure 3 and Figure 4.
The geophysical data explained the subsurface profile of Quaternary alluvial formations, consisting of sand, silt, clay, peat, and hard rock at greater depths (>60 m). However, the resistivity values (TL1) of the alluvial formation were shown in the range from 10 to 800 Ωm indicating clay (0 to 30 Ωm), silt (70–150 Ωm), sand (60–800 Ωm), peat (150 Ωm), and hard rock (>1500 Ωm). The chargeability values were recorded in the range of 0 to 1 msec. The TL1 survey line has shown the high to medium groundwater potential zone between 50 and 220 m distance at a depth of 3 to 60 m (Figure 3). However, no adequate potential zones for groundwater resources were found in survey line TL2 (Figure 4). Consequently, this work is to validate and support the geophysical results of this study. Thus, the soil samples were collected along the pumping well to the depth that reached the hard rock at a depth of 62 m.

2.4. Soil Sample Preparation and Instrument Analysis

The soil samples were collected during the drilling process, and the groundwater sample was taken after pump installation by IADA. In-situ soil sampling was carried out between 5.6 m and 61.6 m. A total of 11 soil samples were collected in plastic boxes. Out of the total soil samples, nine samples represented the alluvial formation, one indicated the peat formation after 22 m of depth, and the last showed hard rock at a depth of 61.6 m (Figure 5). Three soil samples were obtained at depths ranging from 5.6 to 22.4 m (S1 5.6 m, S2 11.2 m, and S3 16.8 m); after this peat samples were obtained (S4 22.4 m) at depths of 28 to 62 m (S5 28 m, S6 33.6 m, S7 39.2 m, S8 44.8 m, S9 50.4 m and S10 56 m), and the last sample was observed as hard rock (S11 61.6 m). These samples were collected to observe changes in the composition of the soil or lithological formation in the borehole, but investigation ceased after at 62 m depth hard rock was found.
After collection, these samples were stored in the refrigerator until further analysis. The soil samples were taken to an analytical laboratory and dried in an oven at 40 °C for 24 h. Once these samples were dried, they were handled carefully with a clean spatula, created one at a time, and deliberately arranged on a little piece of foil paper while the technicians wore gloves to avoid infection. In order to remove any moisture content that may be present in the soil, the foil paper that covers each sample should be heated in an oven with a temperature set between 50 and 80 °C. This is an appropriate temperature, as there is a risk that the sample will be ruined if the temperature is raised. After the aluminum foil papers containing the soil samples are removed from the oven, the samples are placed in the middle of two glass slides. After that, the soil sample is ground down into a powder using glass slides as a step-by-step processing tool. As soon as the samples have been withdrawn from the oven, they are placed inside small containers and given the proper labels. Each sample is extracted from its respective container with a variety of gloves and a spatula, and then a stub is affixed. These stubs are first given a thorough cleaning, after which a piece of carbon tape is adhered to the top to secure the sample.

2.5. Particle Size Distribution Using Laser Diffraction Method

After drying, the particle size distribution (PSD) was analyzed using the laser diffraction method (LDM) with the model of Malvern Master Sizer Scirocco 2000 Instruments (Malvern Company, Middle Watch Swavesey, Cambridge, UK). Hence, PSD gives information regarding the size range of particles indicative of a particular material and is determined and reported. Further, PSD is a set of numbers, a histogram, or a mathematical function that indicates the sizes of particles that are present in the particle system, as well as the counts or proportions of those sizes. These samples were defined to calculate the percentage volume of sand, silt, and clay for the range of 0.02–2000 μm. The volumetric percentages were classified as clay (0–2 μm), silt (2–45 μm), and sand (45–10,000 μm) based on the classification of the United States Department of Agriculture method [53]. LDM is particularly useful for determining the sizes of particles ranging from 0.5 to 10,000 μm. This method is an analytical instrument that has been thoroughly validated and is used as an industry standard for quality control. When a laser beam travels through a system that contains dispersed particles, the light is scattered more intensely by larger particles at smaller angles, whereas the light is scattered less intensely by smaller particles at greater angles. LDM does not directly measure the particle size; instead, this method collects data on the angle and intensity of scattered light and then mathematically translates this data into a distribution of the particle sizes.

2.6. Soil Elemental Analysis Using SEM-EDX Methods

The study of soil samples is an appropriate perspective for evaluating the elemental composition of rock formations or soil properties (different kinds of nutrient interaction, their textures, the cementing materials, and the depositional alteration from one mineral to another). It also details the origins of minerals and many geological phenomena [54]. For a diverse range of reasons and using a variety of methods, essential elements in soil formations have been identified (particularly in Malaysia), and other uses have also been explored [1,4,29,30,31,32]. These days, a scanning electron microscope (SEM) is equipped with an energy dispersive X-ray (EDX). This SEM-EDX method is used to analyze microscopic traces and makes it simple to describe the soil morphology and determine what components might be present in the substance [33]. Again, nine soil samples were brought back to the laboratory and dried in an oven at 40 °C for 24 h.
One at a time, a small amount of soil sample was placed onto the stubs. Before inserting the stub into the SEM, its height was measured to be +1 mm, and its width was measured to be +1 mm. After the observations were entered into the computer, the specimen step was modified so that it corresponded with the new information before the SEM was shut off. In order to explore the chemical makeup of the soil in the studied area using EDX (Oxford Instrument, Oxford, UK), the Hitachi SU-8200 SEM was used as a scanning electron microscope. The images of all the samples were captured at a resolution of 1280 by 960 (19.84 pixels). The experiments were carried out under the assumption of a working distance of 7.3 mm, an aperture of 50 m, and a laser voltage of 10 kV. The acquisition duration was set at five seconds for each cycle, and the dwell time was set at one thousand microseconds per pixel. Morphological images were recorded at 100, 200, 500, and 1000 cycles (corresponding to an acquisition duration of 8, 16, 33, and 67 min, respectively).
This was done to determine which acquisition conditions produced the most precise results and help determine the optimal acquisition conditions [55,56]. The first part of this inquiry is devoted to determining the many phases and characteristics that can be found inside a soil aggregate. This soil aggregate was selected because of its highly intricate microstructure. The evaluation of the analysis accuracy was made possible because of this complicated aggregation, which allowed for the determination of the circumstances that led to the best possible acquisition. Additionally, an elemental spectrum was obtained by clicking on various spots in the backscattered picture to determine the elemental content of each of these places and features. This was done to determine the elemental composition of each of them [57]. The final step, an elemental mapping analysis was carried out on each soil sample.

3. Results and Discussions

Soil samples were collected during the process of borehole drilling for two purposes, including the soil size distribution for texture classification study and soil elemental analysis to support the source of alluvial formation and groundwater development in the study area.

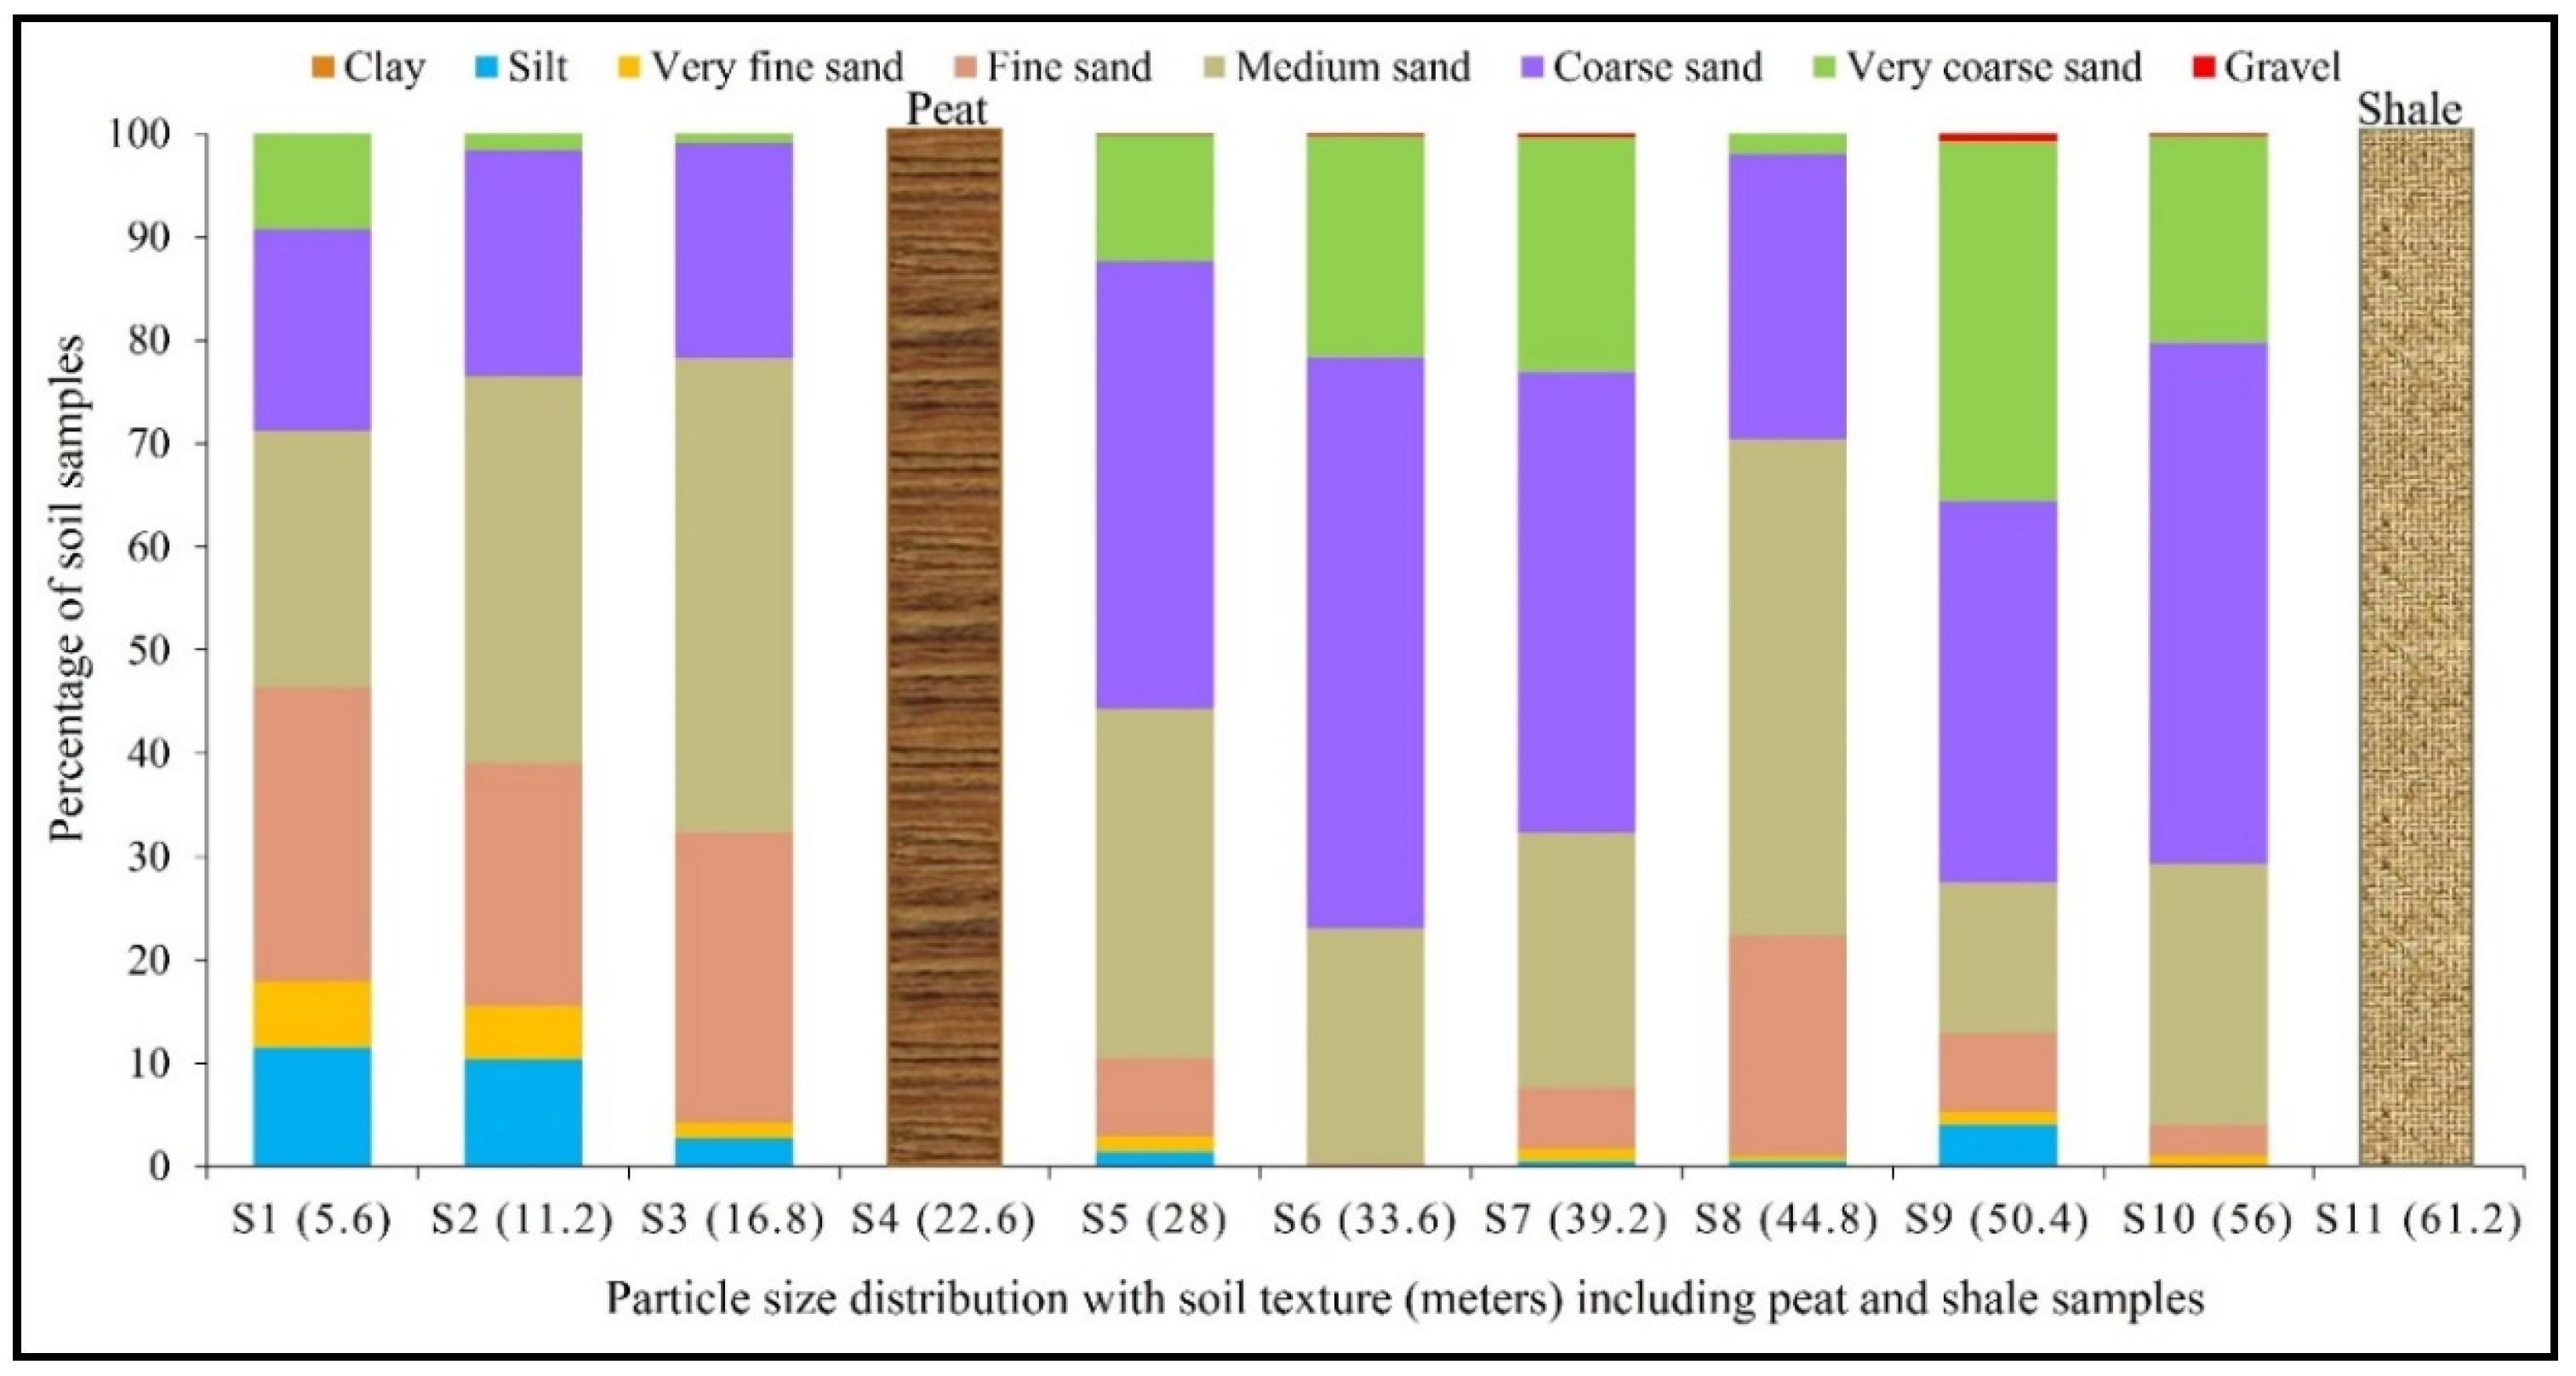
3.1. Soil Texture Investigation

The particle size distribution (PSD) was determined using the Laser Diffraction Method (LDM), which indicates the relationships between particle size and volume percentage. Eleven soil samples were analyzed at the selected soil profile depth, ranging from 5.6 to 61.2 m, to determine the distribution of soil particles. Out of the eleven samples, nine indicate alluvial soil characteristics (Figure 6).
Additional samples of peat and hard rock formations were also obtained. Three soil samples were observed at depths ranging from 5.6 to 22.4 m, indicating silt-to-sand formation (fine to coarse sand). After 22.4 m depth, peat samples were obtained, indicating the sediment and organic debris deposited by rivers are immersed behind mangroves, eventually forming a layer of acidic, waterlogged, and nutrient-poor soil in Peninsular Malaysia [16]. Further, Melling [58] has studied the peat formation found in the study area of Perak region, which encompasses around 107,500 hectares of land, and three million hectares over the entirety of Malaysia.
After the peat layer, the fine to coarse sandy soil with gravel was distinguished by a layer at a depth of 28 to 62 m, demonstrating a consistent increase in soil size with depth (Figure 6). Thus, the sandy formations indicated high porosity and permeability in alluvial formations. The hard rock samples were collected at 61.2 m depth. Overall, LDM results showed the average percentages of clay, silt, and sand were determined to be 0%, 6%, and 94%, respectively. Soil classification is the comprehensive description of soils based on differentiating properties and use-dictating factors. The textural triangle is constrained by the arbitrariness of the PSD scale classification. To date, there is no international agreement regarding the PSD of soils and other attributes of soil types that should be tracked and characterized using PSD scales [59]. Historically, Malaysia has decided to initiate the Proposals for a Unified Classification of Organic Soils of Malaysia to correlate certain similar soils found in Peninsular Malaysia, Sabah, and Sarawak [60]. This initiative is supported by the Department of Agriculture (DOA). For the record, the Soil Survey Division of the Department of Agriculture has established about 290 soil series on the basis of Keys to Soil Taxonomy [8]. Nevertheless, a map for the entirety of Malaysia based on this categorization system has not been published yet [59].
For the range of clay, silt, and sand classification, PSD scales based on USDA methods have been selected for this investigation. The soil classification is also conducted based on the USDA scales of Soil Taxonomy in Peninsular Malaysia [61,62]. Thus, the LDM results are based on the percentage of each soil sample based on volume (%) and particle size. The nine samples of soil particles are marked with red, indicating silts and blue (sands), one peat sample was identified at a depth of 22.6 m (brown colour) and the last samples included hard rock, which was observed at 61.2 m depth and is represented by grey, as shown in Figure 7. According to the USDA, the volumetric soil classifications are clay (0–2 µm), silt (2–50 µm), very fine sand (50–100 µm), fine sand (100–250 µm), medium sand (250–500 µm), coarse sand (500–1000 µm), very coarse sand (1000–2000 µm), and gravel (>2000 µm) [63].
The LDM results indicated that most particles are characterized by sand particles with less silt and without clay content. The sand particles’ size in the borehole profile ranges from very fine sands to very coarse sands. The size of sand particles increases with the depth of the borehole down to 62 m depth. Low gravels were observed at depths between 25 to 62 m. Note that around 30% of the land in Malaysia is coastal alluvial soil or fluvial, while the remaining 70% of the land is covered with residual soil [12]. Streams and rivers are responsible for transporting the alluvial soil to their present position. If the river flowrate is high, then silt and clay will be transported downstream, allowing only sand, gravel, and boulders to be deposited. However, finer soils are formed when water runs more slowly [64], resulting in alluvial deposits which include horizontal strata of varying soil types. In Peninsular Malaysia, alluvium is often composed of silt, clay and sand formation that is only consolidated through desiccation and wreathing [12]. In flat terrain, stream water flows significantly more slowly and frequently through modified channels, forming complex alluvial deposits [65]. For the record, the topography of the study area is flat and mostly composed of sand and a small portion of silt. Thus, most samples have a high percentage of sand with low percentages of gravel and silt in this analysis using LDM.
Furthermore, the water holding capacity of soil is dependent on the soil grain size. Soil with fine particles, such as clay and silt-sized grains, allows for storing a large quantity of water and contributes to storing water for a longer period of time [66,67,68]. In contrast, sandy soils, which contain coarse particles, thus have low water holding capacity [66], as shown in Figure 8. Therefore, the water holding capacity of the soils can be presented as follows: clay (high) > silt (medium) > sand (low). Considering the geophysical results of TL1 and the soil size distribution analysis, the soil textures in the borehole are composed of 94% sand and 6% silt particles, indicating the fluvial origin, which, from a hydrogeology perspective, is an important water supply source. In this case, lithology and stratigraphy constitute the most important controls in unconsolidated deposits, where the potential groundwater zone can be expected at depths between 3 to 62 m of the subsurface layers.
On the other hand, three stratigraphic units have been identified from previous studies. They are the Beruas Formation (similar to the Young Alluvium), Gula Formation (Young Alluvium), and Simpang Formation [69,70,71]. These formations were occupied towards the lowlands of the west coast and deposited in mangrove and shallow marine environments. The lower deposits below the peat layers demonstrate a gradual increase of grain size from coarse to very coarse and minor at greater depth. As a result, the findings of the LDM correlated with the ERT and IP survey line 1 and the subsurface geological Gula formations, as well as the systematics well designed for the pumping test (Figure 9).
In addition, the soil samples were analyzed for their elemental compositions to support the results from geophysical investigation soil distribution analysis.

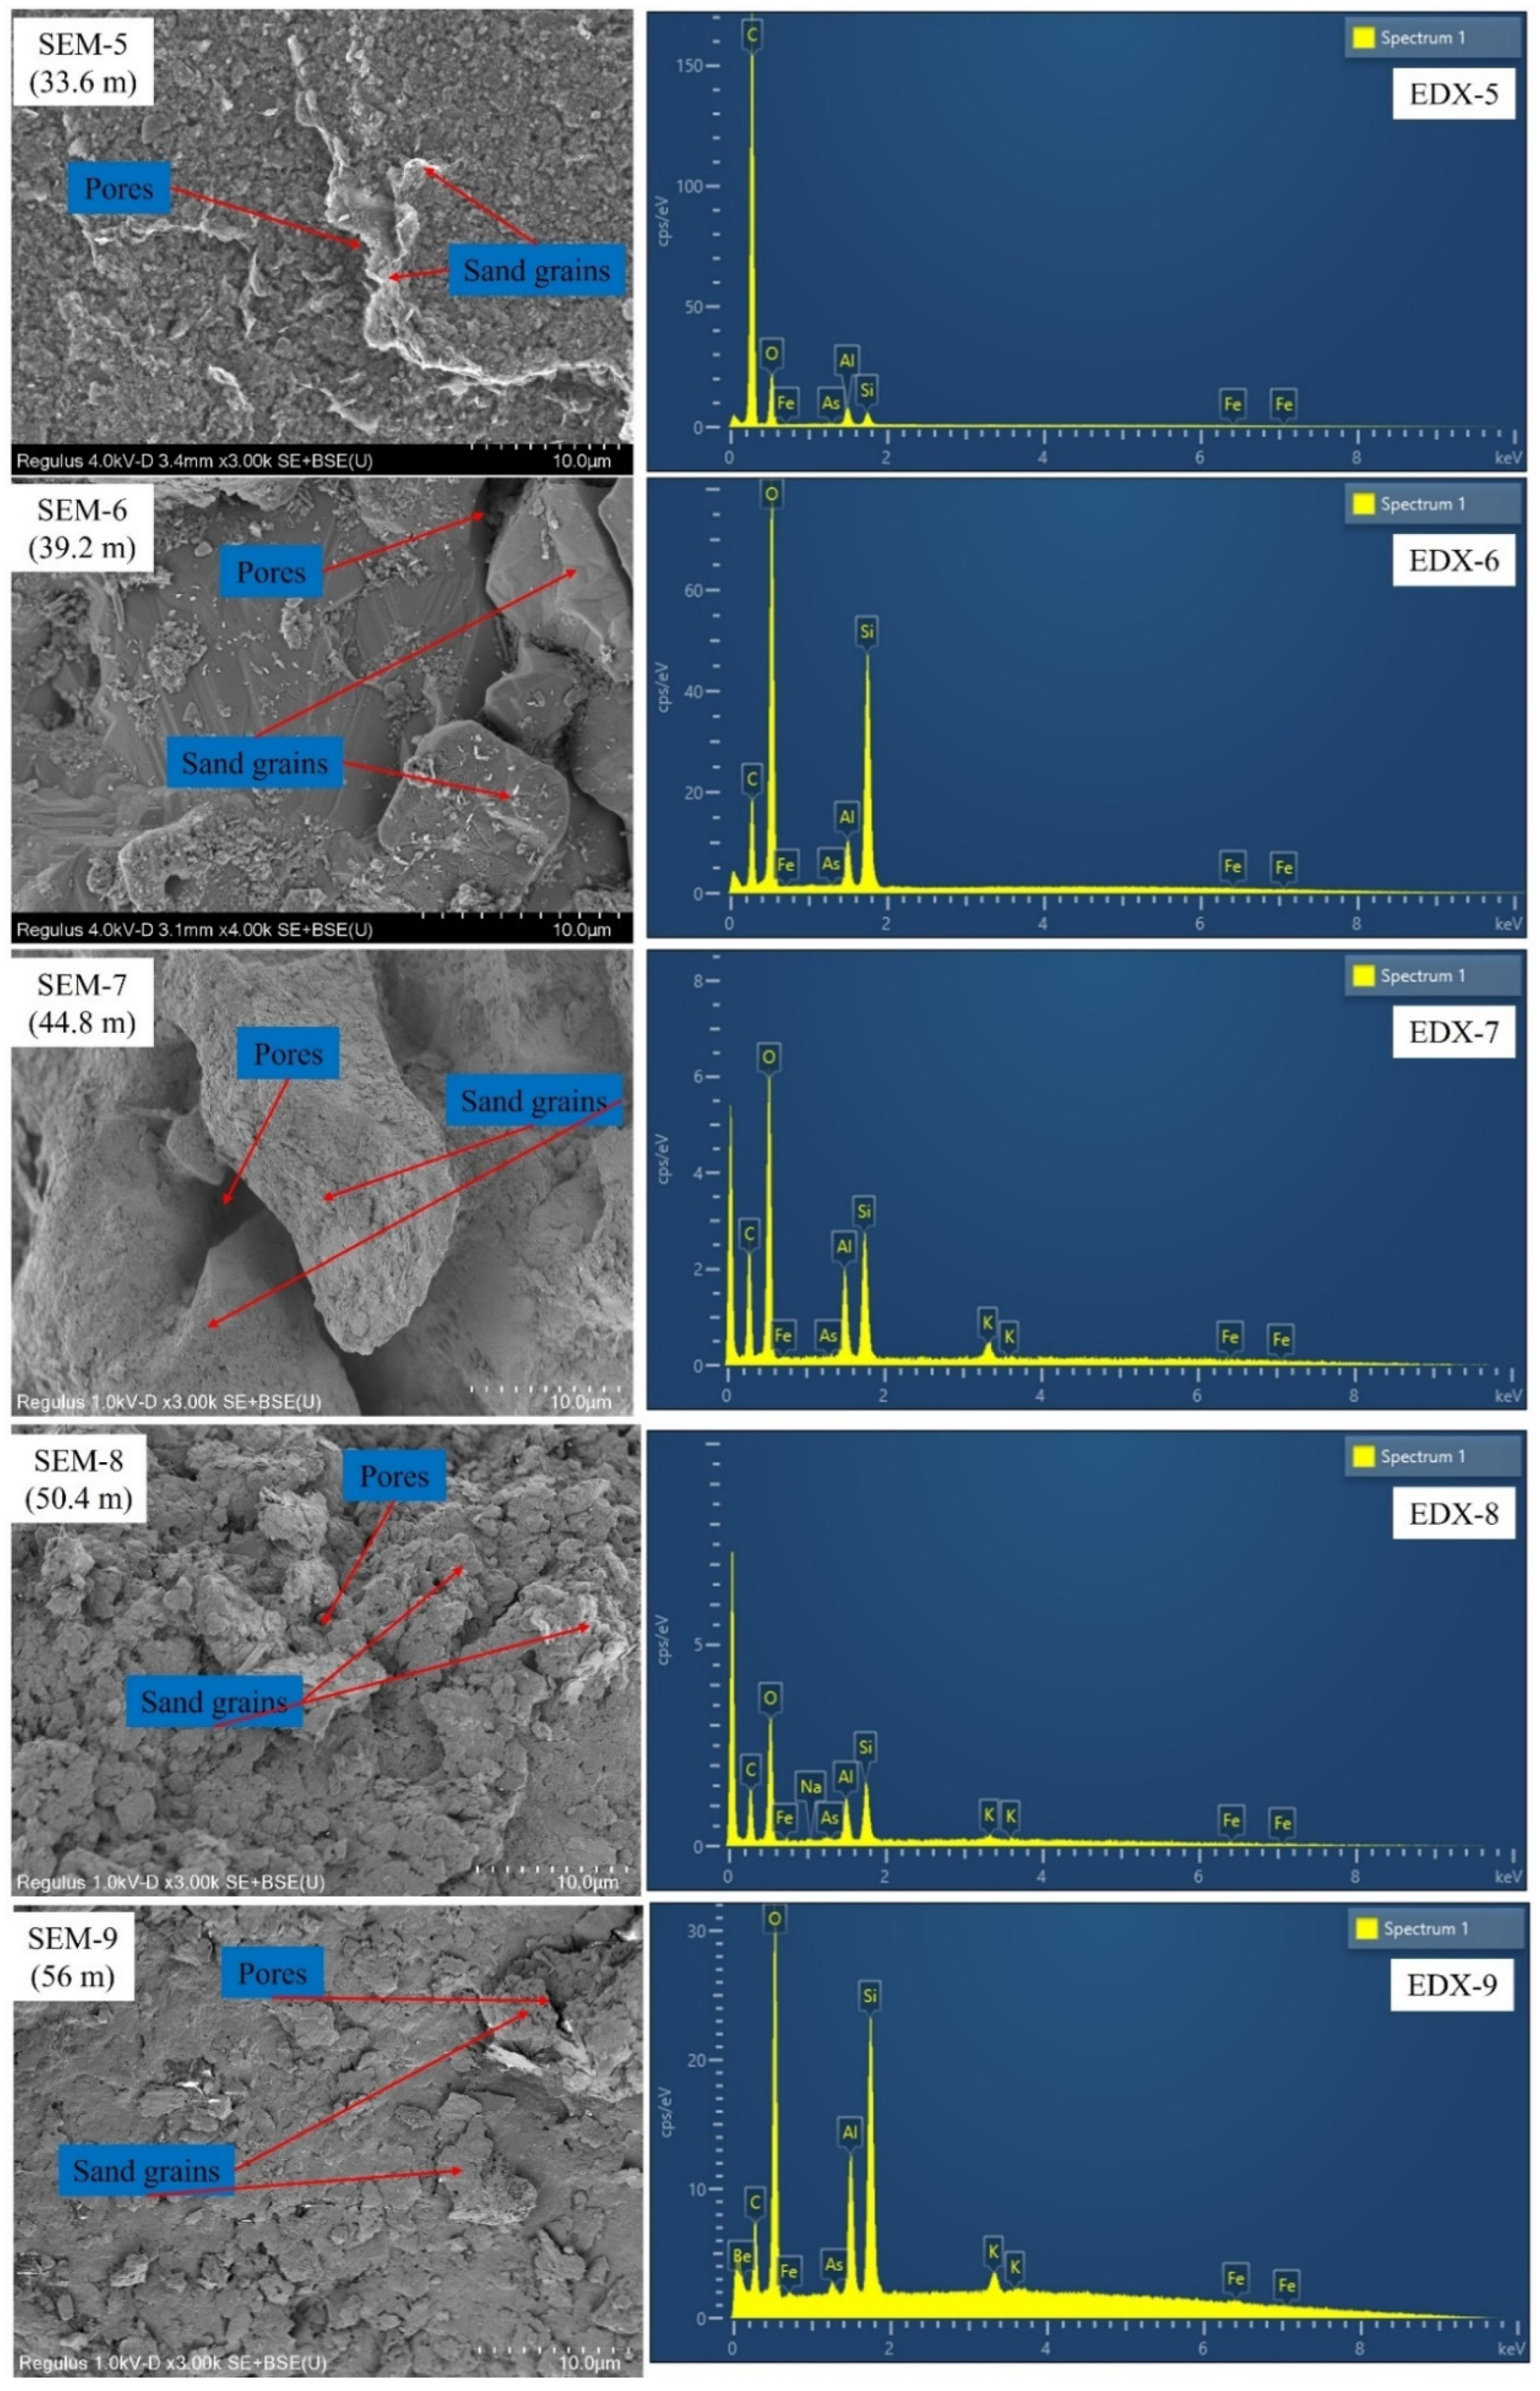
3.2. Chemical Composition of Soil Samples

Soils are combinations of minerals, inorganic or organic compounds, gases, and water [72]. In addition, most soils are formed of grains with a diameter of less than a micrometer, grains which are composed of finer particles with nanoscale structures [56]. In this study, the characteristics of alluvial soils were analyzed using the LDM technique (already discussed above), followed by soil elemental composition using the SEM-EDX method. Nine soil samples were collected from depths at various intervals between 5.6 to 56 m to investigate the soil elemental composition. The SEM instrument is a useful tool that produces high-resolution pictures of the surface morphology of soil samples. Although the SEM images indicate that the particles comprise mixed powders and shapes of minute particles, whereas soil elemental composition using EDX represents the extent to which the soil composition is moving toward more stable elements or minerals [72]. Figure 10 and Figure 11 describe the results of the elemental study in the soil samples.
The SEM-EDX analysis describes the presence of elements in the soil encompassing carbon (C), oxygen (O), aluminum (Al), silicon (Si), potassium (K), sodium (Na), iron (Fe), arsenic (As), and beryllium (Be), which mostly exist in alluvial formations. The overall concentrations of soil samples are described in the y-axis with depths (m) from (5.6 m) to the bottom (56.0 m), where the elemental content is described in the x-axis (Figure 12). Also, the average percentage of elements were reported as follows: C (40.77%), O (34.33%), Si (10.66%), Al (5.82%), Fe (1.10%), K (1.10%), As (0.05%), Na (0.04%), and Be (5.62%).
The investigation of the soil profile using SEM-EDX indicates that the highest concentration of elements is represented by carbon, oxygen, silicon, aluminum, iron, and potassium, with trace quantities of sodium, arsenic, and beryllium. Oxygen, silicon, aluminum, iron, calcium, sodium, and potassium are approximately 98% of the earth’s crust, while other elements account for the remaining 2%. In addition, feldspar and quartz are the main minerals that are found in the continental crust [73]. In these soil samples, it is predominantly consisting of feldspar, silicified quartz, and iron-bearing particles. On the other hand, the carbon content was detected in each sample as a result of the peat formation that occurred in Peninsular Malaysia [57]. Previous studies have suggested that tectonic events are key events for subsurface formations in Peninsular Malaysia that can be reflected in their soil particles, i.e., the dominance of sand grains by seawater geosyncline sedimentation that was split in two by geoanticlinal ridges such as the eastern eugeosyncline (deeper water deposits) and the western miogeosyncline (shallower water deposits) [74].
These elements (as mentioned) have been identified in the soil because of natural deposition by geological sources. Furthermore, the marine environment and the iron-bearing minerals indicate that the alluvial soil in the study region has a color that ranges from white to reddish with a brownish color, possibly due to peat formation. Silica particles (often referred to as SiO2) have a high Si and O concentration, suggesting quartz mineral (almost 50% by weight). In addition, the pure silica particles originate mainly from natural sources [75]. Moreover, potassium and sodium elements represent the feldspar group (also referred to as alkali feldspars). The alkali feldspars contain a concentration of elements such as K-feldspar (KAlSi3O8) and Na-feldspar (NaAlSi3O8). In addition, feldspars account for approximately 60% of the total weight of the crust of the earth by weight [76].
The concentration of the above elements in the alluvial soil indicated that quartz and feldspar minerals may originate from shale rock formations [77]. Although shale rock consists of clay 30–60%, quartz makes up 30%, feldspar contains 4–20%, and other minerals are found in trace amounts [73]. According to Shaw et al. [78], the average mineralogical makeup of shale consists of around 60.9% clay minerals with organic matter, 30% quartz, 4.5% feldspar, 3.6% carbonate, and less than 0.5% iron oxides. Therefore, the last soil sample collected at a depth of 62 m indicates the shale rock formation (characterized by black colors and elemental compositions as discussed above). In addition, some authors have also reported the black shale presence around the Perak region such as the Kroh Formation around the Gerik area [79] and the Belata Formation across the Tanjung Malim border of Perak and Selangor [80]. They demonstrated that the black shales are essentially made up of various combinations of quartz, feldspars, carbonates, pyrite, and clay minerals consisting of kaolinite, illites, smectites, chlorites, and mixed layers of various forms of clay [80].
In addition, shale rock that consists of a high percentage of organic matter may be siliceous, argillaceous, or calcareous depending on the kind of minerals that make up its composition. Also, organic shales are referred to as black shales because of the black color that was deposited along with them during their formation as a result of the presence of organic matter [79]. According to the results of geophysical surveys, clay content has been found in the alluvial formation around the study area. Therefore, this research revealed that quartz fragments and alkali feldspar minerals, based on SEM-EDX results, are derived from the shale rock formation that is mostly constituted of silicon and oxide minerals with trace quantities of As and Be, as well as iron-bearing minerals.
Furthermore, soil organic carbon is found in the form of organic matter or fresh plant remnants, which are derived from humus, and charcoal materials [81]. For most highland soils, topsoil contains between 0.5% and 3% organic carbon. Out of this, 5% to 50% of soil organic carbon is generated from charcoal or peat [82,83]. Several studies have been performed in the alluvial areas around Malaysia and found an average 50% organic carbon content [84,85,86]. Peat is found in Peninsular Malaysia around the coastal regions of West Johore, northwest Selangor, Perak Tengah, Perak Hilir, and Teluk Intan, while on the east coast, peat is found in Kuantan, Pekan, and Endau-Rompin [58,87,88]. Thus, the soil size distribution indicates the silt–sand sequences of the Gula formation are “sandwiched” between the Beruas formation on the top and the Simpang formation at the bottom. In addition, the SEM-EDX results demonstrated that the elemental compositions represent the shale rocks in the study area.

4. Conclusions

Malaysia has faced water stress due to severe drought, the effects of climate change, and the limited availability of water resources in isolated areas. Further, rice is one of the vital crops of Malaysia; hence, a huge volume of the available water is required for agricultural paddy land. Thus, this study focused on soil characteristics to develop groundwater for paddy irrigation in isolated plot regions. Consequently, after geophysical survey information, soil characteristics were evaluated using nine soil samples collected at depths ranging from 5.6 to 61.2 m, together with one peat and one hard rock sample. The LDM findings indicated the average percentages of silt and sand were found to be 6% and 94%, respectively, signifying that sand particles with a sandy texture were more abundant than silt formations in the pumping well system. The SEM-EDX analyzed the average percentage of elements following the order, such as C (40.77%) > O (34.33%) > Si (10.66%) > Al (5.82%) > Fe (1.10%) > K (1.10%) > As (0.05%) > Na (0.04%) > Be (5.62%). As a result, these elements are deposited naturally in alluvial formations by geological sources of weathering minerals like quartz, K-feldspar, and Na-feldspar, which originated from shale rock formations, while carbon is deposited primarily from peat. Further, SEM-EDX results also agreed with the soil characteristics, indicating that shale rock underlies the Gula formation. This study will provide information on well pumping from irrigation practices and supports the development of groundwater in alluvial formations in a sustainable manner.

Author Contributions

Conceptualization, N.A. and M.I.S.; Methodology, N.A. and M.I.S. and Data Curation, N.A. and M.S.M.Y.; Writing-Original Draft Preparation, N.A.; Writing—Review and Editing, N.A., M.I.S., S.A.T., M.I.K.A.A., A.H.A., F.M.A., S.A., and M.S.M.Y.; Visualization, N.A., M.I.S., M.I.K.A.A. and S.A.; Supervision, M.I.S. and M.I.K.A.A.; Project Administration, M.I.S.; Funding Acquisition, N.A., J.Q., A.H.A., F.M.A., and M.I.S. All authors have read and agreed to the published version of the manuscript.

Funding

This research received no external funding.

Data Availability Statement

Figures and tables are provided for viewing the data. The raw data can be made accessible to interested parties by the first author upon request.

Acknowledgments

We gratefully acknowledge the School of Industrial Technology, Universiti Sains Malaysia, Minden 11800, Pulau Pinang, Malaysia for providing the required research facilities and data for this work. The authors would also like to acknowledge the support provided by Researchers Supporting Project Number RSP2023R473, King Saud University, Riyadh, Saudi Arabia.

Conflicts of Interest

The authors declare that they have no known competing financial interests or personal relationships that could have appeared to influence the work reported in this paper.

References

  1. Afrin, H. Stabilization of Clayey Soils Using Chloride Components. Am. J. Civ. Eng. 2017, 5, 365–370. [Google Scholar] [CrossRef]
  2. Abd El-Aal, A.K.; Salah, M.K.; Khalifa, M.A. Acoustic and Strength Characterization of Upper Cretaceous Dolostones from the Bahariya Oasis, Western Desert, Egypt: The Impact of Porosity and Diagenesis. J. Pet. Sci. Eng. 2020, 187, 106798. [Google Scholar] [CrossRef]
  3. Asmeda, R.; Noorlaila, A.; Norziah, M.H. Relationships of Damaged Starch Granules and Particle Size Distribution with Pasting and Thermal Profiles of Milled MR263 Rice Flour. Food Chem. 2016, 191, 45–51. [Google Scholar] [CrossRef] [PubMed]
  4. Ho, S.Y.; Wasli, M.E.B.; Perumal, M. Evaluation of Physicochemical Properties of Sandy-Textured Soils under Smallholder Agricultural Land Use Practices in Sarawak, East Malaysia. Appl. Environ. Soil Sci. 2019, 2019, 7685451. [Google Scholar] [CrossRef]
  5. Polakowski, C.; Ryżak, M.; Sochan, A.; Beczek, M.; Mazur, R.; Bieganowski, A. Particle Size Distribution of Various Soil Materials Measured by Laser Diffraction—The Problem of Reproducibility. Minerals 2021, 11, 465. [Google Scholar] [CrossRef]
  6. Rasmin, R. Comparison between Sieve Analysis & Hydrometer with Laser Particle Analyzer to Determine Particle Size Distribution. Master’s Thesis, Universiti Malaysia Pahang, Kuantan, Malaysia, 2009. [Google Scholar]
  7. Moench, M.; Burke, J.; Moench, Y. Rethinking the Approach to Groundwater and Food Security; Institute for Social and Environmental Transition Boulder: Wheat Ridge, CO, USA, 2003. [Google Scholar]
  8. USDA. Keys to Soil Taxonomy, 12th ed.; U.S. Government Printing Office (Soil Conservation Service): Washington, DC, USA, 2014.
  9. VRO. Practical Note: Soil Colour; Victorian Resources Online. 2019. Available online: www.bettersoils.com.au (accessed on 2 March 2019).
  10. Finch, H.J.S.; Samuel, A.M.; Lane, G.P.F. Soils and Soil Management. In Lockhart & Wiseman’s Crop Husbandry Including Grassland; Elsevier: Amsterdam, The Netherlands, 2014; pp. 37–62. [Google Scholar] [CrossRef]
  11. Gardner, C.M.K.; Laryea, K.B.; Unger, P.W. Soil Physical Constraints to Plant Growth and Crop Production; United Nations: Rome, Italy, 1999. [Google Scholar]
  12. Marto, A.; Yusoff, S.Y.M. Major Soil Type, Soil Classification, and Soil Maps. In Soils of Malaysia; Ashraf, M.A., Othman, R., Ishak, C.F., Eds.; CRC Press Taylor & Francis Group: Boca Raton, FL, USA, 2018; p. 205. [Google Scholar]
  13. Raveendra, R.; Singh, V.P.; Upadhyay, A. Soil Analysis. In Planning and Evaluation of Irrigation Projects: Methods and Implementation; Academic Press: Cambridge, MA, USA; Elsevier: Amsterdam, The Netherlands, 2017; pp. 505–523. [Google Scholar] [CrossRef]
  14. Rawls, W.J.; Brakensiek, C.L.; Saxton, K.E. Estimation of Soil Water Properties. Trans.—Am. Soc. Agric. Eng. 1982, 25, 1316–1321. [Google Scholar] [CrossRef]
  15. Brady, N.C.; Weil, R. Elements of the Nature and Properties of Soils; Pearson Prentice Hall: Hoboken, NJ, USA, 2013. [Google Scholar]
  16. Jafery, K.M.; Embong, Z.; Othman, N.K.; Yaakob, N.; Shah, M.; Hashim, N.Z.N. SEM-EDX and AFM Analysis for the Surface Corrosion Morphology Structure and Roughness on Embedded X70 External Pipeline in Acidic Soil (Peat) Environment. Mater. Today Proc. 2021, 48, 1929–1935. [Google Scholar] [CrossRef]
  17. Buurman, P.; Pape, T.; Muggler, C.C. Laser Grain-Size Determination in Soil Genetic Studies 1. Practical Problems. Soil Sci. 1997, 162, 211–218. [Google Scholar] [CrossRef]
  18. Allen, T. Particle Size Analysis by Sieving. In Powder Sampling and Particle Size Determination; Elsevier: Amsterdam, The Netherlands, 2003; pp. 208–250. [Google Scholar]
  19. Sedláčková, K.; Ševelová, L. Comparison of Laser Diffraction Method and Hydrometer Method for Soil Particle Size Distribution Analysis. Acta Hortic. Regiotect. 2021, 24, 49–55. [Google Scholar] [CrossRef]
  20. Ryzak, M.; Bieganowski, A.; Walczak, R.T. Application of Laser Diffraction Method for Determination of Particle Size Distribution of Grey-Brown Podzolic Soil. Res. Agric. Eng. 2007, 53, 34–38. [Google Scholar] [CrossRef]
  21. Wang, W.P.; Liu, J.L.; Zhang, J.B.; Li, X.P.; Cheng, Y.N.; Xin, W.W.; Yan, Y.F. Evaluation of Laser Diffraction Analysis of Particle Size Distribution of Typical Soils in China and Comparison with the Sieve-Pipette Method. Soil Sci. 2013, 178, 194–204. [Google Scholar] [CrossRef]
  22. Yang, Y.; Wang, L.; Wendroth, O.; Liu, B.; Cheng, C.; Huang, T.; Shi, Y. Is the Laser Diffraction Method Reliable for Soil Particle Size Distribution Analysis? Soil Sci. Soc. Am. J. 2019, 83, 276–287. [Google Scholar] [CrossRef]
  23. Yahaya, S.; Jikan, S.S.; Badarulzaman, N.A.; Adamu, A.D. Chemical Composition and Particle Size Analysis of Kaolin. Path Sci. 2017, 3, 1001–1004. [Google Scholar] [CrossRef]
  24. Rashid, N.A.A.; Abustan, I.; Adlan, M.N. Effect of Particle Size Distribution to Remove Contaminants in Groundwater at Dengkil, Selangor. Appl. Mech. Mater. 2015, 773–774, 1158–1162. [Google Scholar] [CrossRef]
  25. Aweng, E.; Ismid, S.; Maketab, M.; Liyana, A.A. Sediment Size Distribution at Three Rivers with Different Types of Land Use in Endau Catchment Area, Kluang, Johor, Malaysia. J. Appl. Sci. Environ. Manag. 2016, 20, 508–511. [Google Scholar] [CrossRef]
  26. Rosli, N.; Saad, R.; Rahman, N.; Ismail, N.A. Soft Soils: A Study on Their Electrical Resistivity Values and Geotechnical Properties (Porosity, SPT and Particle Size Distribution). War. Geol. 2020, 46, 186–190. [Google Scholar] [CrossRef]
  27. Roberson, S.; Weltje, G.J. Inter-instrument Comparison of Particle-size Analysers. Sedimentology 2014, 61, 1157–1174. [Google Scholar] [CrossRef]
  28. Goossens, D. Techniques to Measure Grain-size Distributions of Loamy Sediments a Comparative Study of Ten Instruments for Wet Analysis. Sedimentology 2008, 55, 65–96. [Google Scholar] [CrossRef]
  29. Abdullah, G.M.S.; Wahhab, H.I.A. Stabilisation of Soils with Emulsified Sulphur Asphalt for Road Applications. Road Mater. Pavement Des. 2019, 20, 1228–1242. [Google Scholar] [CrossRef]
  30. Wong, M.K.; Selliah, P.; Ng, T.F.; Hassan, M.H.A.; Ranst, E.V.; Inubushi, K. Impact of Agricultural Land Use on Physicochemical Properties of Soils Derived from Sedimentary Rocks in Malaysia. Soil Sci. Plant Nutr. 2020, 66, 214–224. [Google Scholar] [CrossRef]
  31. Sujaul, I.M.; Ismail, B.S.; Tayeb, M.A.; Barzani, M.G.; Sahibin, A.R. Morphological and Physico-Chemical Characteristics of Soils in the Tasik Chini Catchment in Pahang, Malaysia. Pertanika J. Sci. Technol. 2016, 24, 71–87. [Google Scholar]
  32. Gasim, M.B.; Ismail, B.S.; Mir, S.I.; Rahim, S.A.; Toriman, M.E. The Physico-Chemical Properties of Four Soil Series in Tasik Chini, Pahang, Malaysia. Asian J. Earth Sci. 2011, 4, 75–84. [Google Scholar] [CrossRef]
  33. Philip, S.; Singh, N. Comparative Soil Analysis by Scanning Electron Microscope: A Forensic Perspective. Int. J. Emerg. Technol. 2020, 11, 915–923. [Google Scholar]
  34. Brodowski, S.; John, B.; Flessa, H.; Amelung, W. Aggregate-Occluded Black Carbon in Soil. Eur. J. Soil Sci. 2006, 57, 539–546. [Google Scholar] [CrossRef]
  35. Prakongkep, N.; Suddhiprakarn, A.; Kheoruenromne, I.; Gilkes, R.J. SEM Image Analysis for Characterization of Sand Grains in Thai Paddy Soils. Geoderma 2010, 156, 20–31. [Google Scholar] [CrossRef]
  36. Cengiz, S.; Karaca, A.C.; Çakir, I.; Üner, H.B.; Sevindik, A. SEM-EDS Analysis and Discrimination of Forensic Soil. Forensic Sci. Int. 2004, 141, 33–37. [Google Scholar] [CrossRef] [PubMed]
  37. Vos, K.; Vandenberghe, N.; Elsen, J. Surface Textural Analysis of Quartz Grains by Scanning Electron Microscopy (SEM): From Sample Preparation to Environmental Interpretation. Earth-Sci. Rev. 2014, 128, 93–104. [Google Scholar] [CrossRef]
  38. Kumar, R.S.; Rajkumar, P. Characterization of Minerals in Air Dust Particles in the State of Tamilnadu, India through FTIR, XRD and SEM Analyses. Infrared Phys. Technol. 2014, 67, 30–41. [Google Scholar] [CrossRef]
  39. Li, D.; Li, Y.; Wang, Z.; Wang, X.; Li, Y. Quantitative, SEM-Based Shape Analysis of Sediment Particles in the Yellow River. Int. J. Sediment Res. 2016, 31, 341–350. [Google Scholar] [CrossRef]
  40. Jamari, S.; Embong, Z.; Bakar, I. Elemental Composition Study of Heavy Metal (Ni, Cu, Zn) in Riverbank Soil by Electrokinetic-Assisted Phytoremediation Using XRF and SEM/EDX. AIP Conf. Proc. 2014, 1584, 221–227. [Google Scholar] [CrossRef]
  41. Jiménez-Pinilla, P.; Mataix-Solera, J.; Arcenegui, V.; Delgado, R.; Martín-García, J.M.; Lozano, E.; Martínez-Zavala, L.; Jordán, A. Advances in the Knowledge of How Heating Can Affect Aggregate Stability in Mediterranean Soils: A XDR and SEM-EDX Approach. Catena 2016, 147, 315–324. [Google Scholar] [CrossRef]
  42. Lešer, V.; Milani, M.; Tatti, F.; Tkalec, Ž.P.; Štrus, J.; Drobne, D. Focused Ion Beam (FIB)/Scanning Electron Microscopy (SEM) in Tissue Structural Research. Protoplasma 2010, 246, 41–48. [Google Scholar] [CrossRef]
  43. Metcalfe, I. Tectonic Evolution of the Malay Peninsula. J. Asian Earth Sci. 2013, 76, 195–213. [Google Scholar] [CrossRef]
  44. Makoundi, C.; Zaw, K.; Large, R.R.; Meffre, S.; Lai, C.K.; Hoe, T.G. Geology, Geochemistry and Metallogenesis of the Selinsing Gold Deposit, Central Malaysia. Gondwana Res. 2014, 26, 241–261. [Google Scholar] [CrossRef]
  45. Pour, A.B.; Hashim, M. Structural Mapping Using PALSAR Data in the Central Gold Belt, Peninsular Malaysia. Ore Geol. Rev. 2015, 64, 13–22. [Google Scholar] [CrossRef]
  46. Sun, C.; Yang, X.; Du, G.; Abdul Aziz, J.H. Genesis of the Selinsing Gold Deposit, Peninsular Malaysia: Constraints from Mineralogy, Geochemistry and in Situ Sulfur Isotope Compositions of Sulfides. Ore Geol. Rev. 2019, 113, 103111. [Google Scholar] [CrossRef]
  47. Fauzie, M.J. Evaluation of Groundwater Potential for Irrigation at the Seberang Perak Aquifer. Master’s Thesis, Universiti Putra Malaysia, Serdang, Malaysia, 2013. [Google Scholar]
  48. Batchelor, D.A.F. Clarification of Stratigraphic Correlation and Dating of Late Cainozoic Alluvial Units in Peninsular Malaysia. Bull. Geol. Soc. Malaysia 2015, 61, 75–84. [Google Scholar] [CrossRef]
  49. Hassan, K. A Summary of the Quaternary Geology Investigations in Seberang Prai, Pulau Pinang and Kuala Kurau. Bull. Geol. Soc. Malaysia 1990, 26, 47–53. [Google Scholar] [CrossRef]
  50. Jais, D.B.M. Hydrogeological Map of Malaysia—Present Status and Future Plan; Coordinating Committee for Geoscience Programme (CCOP) Technical Secretariat: Bangkok, Thailand, 2017. [Google Scholar]
  51. Chong, F.S.; Tan, D.N.K. Hydrogeological Activities in Peninsular Malaysia and Sarawak. Bull. Geol. Soc. Malays. 1986, 20, 827–842. [Google Scholar] [CrossRef]
  52. Akhtar, N.; Mislan, M.S.; Syakir, M.I.; Anees, M.T.; Yusuff, M.S.M. Characterization of Aquifer System Using Electrical Resistivity Tomography (ERT) and Induced Polarisation (IP) Techniques. In IOP Conference Series: Earth and Environmental Science; IOP Publishing Ltd.: Selangor, Malaysia, 2021; Volume 880, pp. 1–14. [Google Scholar]
  53. SSDS. Soil Survey Manual; Soil Survey Division Staff, United States Department of Agriculture, Handbook. No. 18; U.S. Govt. Print. Office: Washington, DC, USA, 1993.
  54. Sapari, N.; Azie, R.Z.R.; Jusoh, H. Quantity and Quality of Groundwater in Fractured Metasedimentary Rocks of the West Coast of Peninsular Malaysia. Sains Malays. 2011, 40, 537–542. [Google Scholar]
  55. Schwartz, F.W.; Zhang, H. Introduction to Ground Water. In Fundamentals of Groundwater; John Wiley & Sons: New York, NY, USA, 2003; p. 115. [Google Scholar]
  56. Scimeca, M.; Bischetti, S.; Lamsira, H.K.; Bonfiglio, R.; Bonanno, E. Energy Dispersive X-Ray (EDX) Microanalysis: A Powerful Tool in Biomedical Research and Diagnosis. Eur. J. Histochem. 2018, 62, 89–99. [Google Scholar] [CrossRef]
  57. Sharma, R.; Patel, K.S.; Lata, L.; Milosh, H. Characterization of Urban Soil with SEM-EDX. Am. J. Anal. Chem. 2016, 07, 724–735. [Google Scholar] [CrossRef]
  58. Melling, L. Peatland in Malaysia. In Tropical Peatland Ecosystems; Springer: Sarawak, Malaysia, 2015; pp. 1–651. [Google Scholar]
  59. Deng, J.; Ma, C.; Yu, H. Different Soil Particle-Size Classification Systems for Calculating Volume Fractal Dimension-a Case Study of Pinus Sylvestris Var. Mongolica in Mu Us Sandy Land, China. Appl. Sci. 2018, 8, 1872. [Google Scholar] [CrossRef]
  60. Paramanathan, S. Register of Soils—Peninsular Malaysia; Soils and Analytical Services Bulletin-Kementerian Pertanian: Kuala Lumpur, Malaysia, 1978. [Google Scholar]
  61. Soil Survey Staff. Keys to Soil Taxonomy, 5th ed.; United States Department of Agriculture (USDA) and Soil Management Support Services (SMSS): Blacksburg, VA, USA; Pocahontas Press: Dublin, VA, USA, 1992.
  62. Paramananthan, S. Soils of Malaysia: Their Characteristics and Identification, 1st ed.; Academy of Sciences Malaysia: Kuala Lumpur, Malaysia, 2000. [Google Scholar]
  63. Soil Survey Staff. Keys to Soil Taxonomy, 13th ed.; United States Department of Agriculture (USDA), Natural Resources Conservation Service (NRCS): Washington, DC, USA, 2022. Available online: https://directives.sc.egov.usda.gov/viewerFS.aspx?hid=21311 (accessed on 19 March 2019).
  64. Paramanathan, S. Selected Papers on Soil Science Problem Soil; ACT and Param Agricultural Soil Surveys: Petaling Jaya, Malaysia, 2014. [Google Scholar]
  65. Indraratna, B.; Balasubramaniam, A.S. Performance of Test Embankment Constructed to Failure on Soft Marine Clay. J. Geotech. Eng. 1993, 119, 1326–1329. [Google Scholar] [CrossRef]
  66. Hunt, N.; Gilkes, R. Farm Monitoring Handbook. In Farm Monitoring Handbook; University of Western Australia, Land Management Society, and National Dryland Salinity Program: Crawley, Australia, 1992; pp. 13–62. [Google Scholar]
  67. O’Green, A.T. Soil Water Dynamics. Nat. Educ. Knowl. 2013, 4, 1–9. [Google Scholar] [CrossRef]
  68. Haqiqi, I.; Grogan, D.; Hertel, T.; Schlenker, W. Quantifying the Impacts of Compound Extremes on Agriculture and Irrigation Water Demand. Hydrol. Earth Syst. Sci. 2021, 25, 551–564. [Google Scholar] [CrossRef]
  69. Suntharalingam, T. Quaternary Stratigraphy and Prospects for Placer Tin in the Taiping-Lumut Area, Perak. Bull. Geol. Soc. Malaysia 1984, 17, 9–32. [Google Scholar] [CrossRef]
  70. Suntharalingam, T. Studies on the Quaternary Geology of Peninsular Malaysia. Geol. Soaiety Malaysia Dep. Geol. Univ. Malay Kuala Lumpur 1984, 10, 101–136. [Google Scholar]
  71. Kasim, S.A.; Ismail, M.S.; Salim, A.M. Cenozoic Stratigraphy, Sedimentation and Tectonic Setting, Onshore Peninsular Malaysia: A Review. In Proceedings of the Third International Conference on Separation Technology 2020 (ICoST 2020), Johor, Malaysia, 15–16 August 2020; Advances in Engineering Research. Atlantis Press: Amsterdam, The Netherlands, 2021; Volume 200, pp. 265–280. [Google Scholar] [CrossRef]
  72. Torres, E.S.; Adajar, M.A.Q. Geotechnical Characterization of Alluvial Soil as an Alternative Roadway Construction Material. Int. J. Geomate 2021, 20, 125–131. [Google Scholar] [CrossRef]
  73. Deer, W.A.; Howie, R.A.; Zussman, J. An Introduction to the Rock-Forming Minerals, 3rd ed.; Berforts Information Press: Hertfordshire, UK, 2013. [Google Scholar] [CrossRef]
  74. Roslan, N. The Potential Susceptibility of Urban Hardrock Aquifers to Hydraulic and Contaminant Stresses: The Case of Shah Alam, Malaysia. Ph.D. Thesis, The University of Birmingham, Birmingham, UK, 2017. [Google Scholar]
  75. Li, W.; Shao, L.; Wang, Z.; Shen, R.; Yang, S.; Tang, U. Size, Composition, and Mixing State of Individual Aerosol Particles in a South China Coastal City. J. Environ. Sci. 2010, 22, 561–569. [Google Scholar] [CrossRef]
  76. Cong, Z.; Kang, S.; Dong, S.; Liu, X.; Qin, D. Elemental and Individual Particle Analysis of Atmospheric Aerosols from High Himalayas. Environ. Monit. Assess. 2010, 160, 323–335. [Google Scholar] [CrossRef]
  77. Pachauri, T.; Singla, V.; Satsangi, A.; Lakhani, A.; Kumari, K.M. SEM-EDX Characterization of Individual Coarse Particles in Agra, India. Aerosol Air Qual. Res. 2013, 13, 523–536. [Google Scholar] [CrossRef]
  78. Shaw, D.B.; Weaver, C.E. The Mineralogical Composition of Shales. J. sedmintary Petrol. 1965, 35, 213–222. [Google Scholar]
  79. Shoieb, M.A.; Sum, C.W.; Ismail, M.S.; Tsegab, H. International Journal of Advanced and Applied Sciences Geological Characteristic of the Kroh Formation in the Upper Perak Shales, Western Peninsula Malaysia. Int. J. Adv. Appl. Sci. 2019, 6, 102–106. [Google Scholar]
  80. Boateng, E.O.; Gebretsadikab, H.T.; Weng Sum, C.; Ben Awuah, J.; Padmanabhan, E. Mineralogical Analyses of Belata Black Shale, Perak, Peninsular Malaysia. War. Geol. 2020, 46, 12–16. [Google Scholar] [CrossRef]
  81. Lal, R. Carbon Management in Agricultural Soils. Mitig. Adapt. Strateg. Glob. Chang. 2007, 12, 303–322. [Google Scholar] [CrossRef]
  82. Schmidt, M.W.I.; Skjemstad, J.O.; Czimczik, C.I.; Prentice, K.M. Comparative Analysis of Black Carbon in Soils We Measured in Eight Soil Samples Exploiting Benzenecarboxylic Acids as Molecular Markers or Applying MAS NMR (Magic Angle. Global Biogeochem. Cycles 2001, 15, 163–167. [Google Scholar] [CrossRef]
  83. Spohn, M. Phosphorus and Carbon in Soil Particle Size Fractions: A Synthesis. Biogeochemistry 2020, 147, 225–242. [Google Scholar] [CrossRef]
  84. Yule, C.M.; Lim, Y.Y.; Lim, T.Y. Degradation of Tropical Malaysian Peatlands Decreases Levels of Phenolics in Soil and in Leaves of Macaranga Pruinosa. Front. Earth Sci. 2016, 4, 45. [Google Scholar] [CrossRef]
  85. Too, C.C.; Keller, A.; Sickel, W.; Lee, S.M.; Yule, C.M. Microbial Community Structure in a Malaysian Tropical Peat Swamp Forest: The Influence of Tree Species and Depth. Front. Microbiol. 2018, 9, 2859. [Google Scholar] [CrossRef]
  86. Dom, S.P.; Ikenaga, M.; Lau, S.Y.L.; Radu, S.; Midot, F.; Yap, M.L.; Chin, M.Y.; Lo, M.L.; Jee, M.S.; Maie, N.; et al. Linking Prokaryotic Community Composition to Carbon Biogeochemical Cycling across a Tropical Peat Dome in Sarawak, Malaysia. Sci. Rep. 2021, 11, 6416. [Google Scholar] [CrossRef] [PubMed]
  87. Wetlands International. A Quick Scan of Peatlands; Kleine Natuur Initiatief Projekten (KNIP): Petaling Jaya, Malaysia, 2010. [Google Scholar]
  88. Nuruddin, A.A.; Leng, H.M.; Basaruddin, F. Peat Moisture and Water Level Relationship in a Tropical Peat Swamp Forest. J. Appl. Sci. 2006, 6, 2517–2519. [Google Scholar]
Figure 1. Location of the study area in Peninsular Malaysia. (A) Hydrogeological Map of Peninsular Malaysia, (B) Labu Kubong study area in Teluk Intan, and (C) TL1 represents the horizontal survey line and TL2 shows the vertical survey line profile of ERT and IP.
Water 15 03109 g001
Figure 2. Geological setting of Peninsular Malaysia (A) Geological formation of Peninsular Malaysia and (B) Subsurface formation of Teluk Intan.
Water 15 03109 g002
Figure 3. Resistivity and chargeability profile of survey line TL1 showed the potential groundwater zones characterized by subsurface geological profile.
Water 15 03109 g003
Figure 4. Resistivity and chargeability profile of survey line TL2 showed the potential groundwater zones characterized by subsurface geological profile.
Water 15 03109 g004
Figure 5. Soil samples collected during drilling process.
Water 15 03109 g005
Figure 6. Particle size distribution showed the volume percentage against particle size of 9 soil samples.
Water 15 03109 g006
Figure 7. Particle size distribution indicates the percentage of nine soil samples including peat and shale samples with depth (m).
Water 15 03109 g007
Figure 8. Composition of 94% sand and 6% silt indicating low water holding capacity. Hence, in a saturated permeable geologic unit, such composition allows the aquifer system to transmit a significant quantity of water under normal hydraulic gradients (Modified from [67]).
Water 15 03109 g008
Figure 9. Variations of soil size distribution with the depth of subsurface along with the systematics well designed for the pumping test in the study area of Labu Kubong, Perak.
Water 15 03109 g009
Figure 10. SEM describes the morphology of sand particles with pores, and EDX defines the element concentration of soil grains from one to four samples taken at depths of 5.6 to 28 m.
Water 15 03109 g010
Figure 11. SEM describes the surface morphology of sand particles with pores, and EDX explains the element concentration of soil grains analyzed at depths between 5.6 to 28 m.
Water 15 03109 g011
Figure 12. The element concentration in the soil samples found in the study area.
Water 15 03109 g012
Disclaimer/Publisher’s Note: The statements, opinions and data contained in all publications are solely those of the individual author(s) and contributor(s) and not of MDPI and/or the editor(s). MDPI and/or the editor(s) disclaim responsibility for any injury to people or property resulting from any ideas, methods, instructions or products referred to in the content.

