Article

Lake Ice Simulation and Evaluation for a Typical Lake on the Tibetan Plateau

1
College of Water Resources and Architectural Engineering, Northwest A&F University, Yangling 712100, China
2
College of Natural Resources and Environment, Northwest A&F University, Yangling 712100, China
3
State Key Laboratory of Numerical Modeling for Atmospheric Sciences and Geophysical Fluid Dynamics (LASG), Institute of Atmospheric Physics, Chinese Academy of Sciences, Beijing 100029, China
4
Hubei Key Laboratory of Petroleum Geochemistry and Environment, Yangtze University, Wuhan 430100, China
5
College of Resources and Environment, Yangtze University, Wuhan 430100, China
*
Authors to whom correspondence should be addressed.
Water 2023, 15(17), 3088; https://doi.org/10.3390/w15173088
Submission received: 27 July 2023 / Revised: 17 August 2023 / Accepted: 18 August 2023 / Published: 29 August 2023
(This article belongs to the Special Issue Lake Processes and Lake’s Climate Effects under Global Warming)

Abstract

:
This study aims to simulate the lake ice conditions in the Nam Co lake using a lake ice model, which is a one-dimensional physics-based model that utilizes enthalpy as the predictor variable. We modified the air density schemes within the model to improve the accuracy of the lake ice simulation. Additionally, the process of lake ice sublimation was included, and the effect of lake water salinity on the freezing point was considered. Using the improved lake ice model, we simulated lake surface water temperature, lake ice thickness, and interannual variations in lake ice phenology, and we compared these results with observations at Nam Co. The results demonstrate that the improved model better reproduces the lake surface water temperature, lake ice thickness, and lake ice phenology at Nam Co. Additionally, the thin air density affects lake processes by weakening sensible heat and latent heat, which ultimately leads to a delayed ice-on date and a slightly earlier ice-free date in Nam Co. This study contributes to an enhanced understanding of the freeze–thaw processes in Nam Co and reduces the biases in lake ice simulation on the Tibetan Plateau through the lake model improvement.

1. Introduction

The Tibetan Plateau is situated between 26° N to 39.5° N and 73° E to 104.5° E, boasting a distinct high-altitude terrain with an average elevation exceeding 4000 m [1,2]. This elevated topography results in significantly lower local temperatures and air density compared to the adjacent plains [3]. Most areas experience a monthly average temperature below 10 °C, while the central plateau registers an average annual temperature below 0 °C [4]. The year-round low temperatures facilitate the presence of ample permafrost and ice across the Tibetan Plateau [5,6]. Moreover, the Tibetan Plateau serves as the origin of numerous Asian rivers and harbors many lakes [7,8,9], thus earning the renowned title of the ‘Asian Water Tower’ [10].
The Tibetan Plateau is home to 32,843 lakes [11], comprising approximately 50% of the total number of lakes in China [12]. However, the majority of these lakes are smaller than 1 km2, with only over 1,000 lakes exceeding 1 km2 [13,14,15]. Several studies have shown that both the area and number of the lakes on the Tibetan Plateau have increased in recent years [11,16,17,18]. The consistently low temperatures on the Tibetan Plateau cause the lakes in mid–low latitudes to freeze during winter [19]. However, recent studies have indicated that the ice-covered period on the Tibetan Plateau have been shortened due to global warming [19,20,21,22,23]. The presence of lake ice cover plays a crucial role in the physical processes of lakes on the Tibetan Plateau. Lake ice phenology, including the timing of freeze-up, break-up, and the duration of ice cover, serves as a highly sensitive indicator of climate change [24]. Lake ice thickness and temperature have an impact on lake–atmosphere interactions [25,26,27,28]. Following the freezing of the lake surface on the Tibetan Plateau, evaporation from the lake surface typically reduces by 40–60% compared to the ice-free state [27]. Furthermore, the spatial distribution of lake ice plays a role in lake-effect precipitation [29]. Therefore, studying lake ice is essential for comprehending the processes occurring in lakes [24].
The Tibetan Plateau experiences a harsh climate and is a remote region, posing challenges for conducting studies during the period with lake ice cover [30]. Therefore, numerical models have become an excellent complement to field campaigns for studying lake ice. Recent studies have indicated that the atmospheric boundary layer stratification remained consistently stable or neutral during the ice-covered period [27,31]. The turbulent atmosphere-ice heat fluxes and the net heat gain by the lake are significantly lower compared to the ice-free period [27]. To evaluate the impact of lake ice, we selected a deep lake, Nam Co, which has a maximum depth of over 95 m. We considered lake surface temperature, lake ice thickness, and lake ice phenology. Most prior studies on lake ice have primarily focused on shallow lakes at single points [32,33,34]. However, the majority of current lake models rely solely on energy balance and statistical empirical formulas to estimate lake ice thickness. Examples include the Community Land Model (CLM) and the Flake model [35,36]. For this study, we selected a lake model developed by Ren et al. (2014) (RLake) and utilized enthalpy as predictive variables during the ice-on period [37].
We conducted a modeling case study for Nam Co, situated in the central Tibetan Plateau. Our objectives are as follows: (1) We enhance the accuracy and reliability of the RLake model by coupling more reasonable schemes. These improvements encompass the integration of more realistic air density, and ice sublimation schemes. Furthermore, the model considers the influence of lake salinity on the freezing point. (2) Using the improved lake ice model, we choose Nam Co as an example to evaluate the ice thickness based on a single lake surface temperature point and the lake ice phenology. (3) We discuss the impact of low air density on the ice phenology of the plateau.

2. Materials and Methods

2.1. Study Area

Nam Co is located in the central Tibetan Plateau (90°16′–91°03′ E, 30°30′–30°55′ N) with an elevation of 4718 m (Figure 1). This lake is a closed inland lake, and it gains water from precipitation and melting glacier and loses water mainly through evaporation and ground water [38,39]. The bathymetry of Nam Co is shown in Figure 1, where the maximum depth is about 95 m and the mean depth is about 40 m [40,41]. The high elevation generates the low air density and pressure, with the annual average values near the lake surface being 0.73 kg/m3 and 571.2 hPa, respectively (Nam Co station) [42,43]. The highest monthly temperature in the lake area is about 10 °C, the lowest one is around −12 °C [44], the annual precipitation is about 297–550 mm, and the long-term mean annual evaporation is about 832 mm [40,45,46]. Nam Co is barely affected by human activities, making it an ideal location for studying natural lake processes. Nam Co is a typical Tibetan Plateau lake, which has been focused in many studies [40,47,48,49,50].

2.2. Meteorological and Observational Data

2.2.1. Climate Forcing Data

For this modeling study, the China Meteorological Forcing Data (CMFD) was selected as the forcing data to driver our lake model. A detailed description of this model can be found in Section 2.3. The CMFD dataset was obtained from the Institute of TP Research, Chinese Academy of Sciences (ITPCAS) [51,52]. It covers the region of 70–140° E and 15–55° N for the period of 1979–2018, with a spatial resolution of 0.1° (~10 km) and a time step of 3 h. We utilized this dataset specifically for the Nam Co area and focused on the period of 2000–2013. The CMFD dataset includes various meteorological variables required by the lake model used in this study, such as precipitation, downward shortwave radiation, downward long wave radiation, near-surface air temperature, specific humidity, wind speed, and surface pressure. It is important to note that the CMFD dataset is a combination of satellite data and regular meteorological observation data from the China Meteorological Administration (CMA). However, during our verification process using the in situ Nam Co weather station data (available only for the period of 2011–2013), we identified significant biases in the wind speed data of the CMFD dataset (figures not shown). To rectify these biases, we employed a linear regression approach. We utilized the Nam Co weather station data along with the corresponding grid cell CMFD wind speed data to develop a regression equation. This equation was then applied to the CMFD wind speed data covering the Nam Co area, encompassing a total of 18 grid cells (Figure 2), for the study period of 2000–2013.

2.2.2. Observational Data

In this study, we used observational data including lake temperature, lake depth, lake ice thickness, and ice phenology for model evaluation and input. The Moderate-resolution Imaging Spectroradiometer (MODIS) daily land surface temperature data at a 0.05° resolution [53,54] were used to verify lake surface temperature simulations. The MODIS data have four values each day, and we averaged these four values to generate daily surface temperature. The Nam Co depth data used for model input were from Wang et al. (2009), and the lake ice thickness observations for the period of 2007–2011 were from Qu et al. (2012), who collected the data near the Nam Co meteorological station. The ice phenology data for Nam Co were obtained from Gou et al. (2015) including the dates of ice-on and ice-free and the ice duration for the period of 2000–2011 [41,55,56]. The ice-on date refers to the date when the observation area starts to freeze. The ice-free date indicates the date when the observation area is completely free of ice.

2.3. The Lake Model

2.3.1. The Original Lake Model

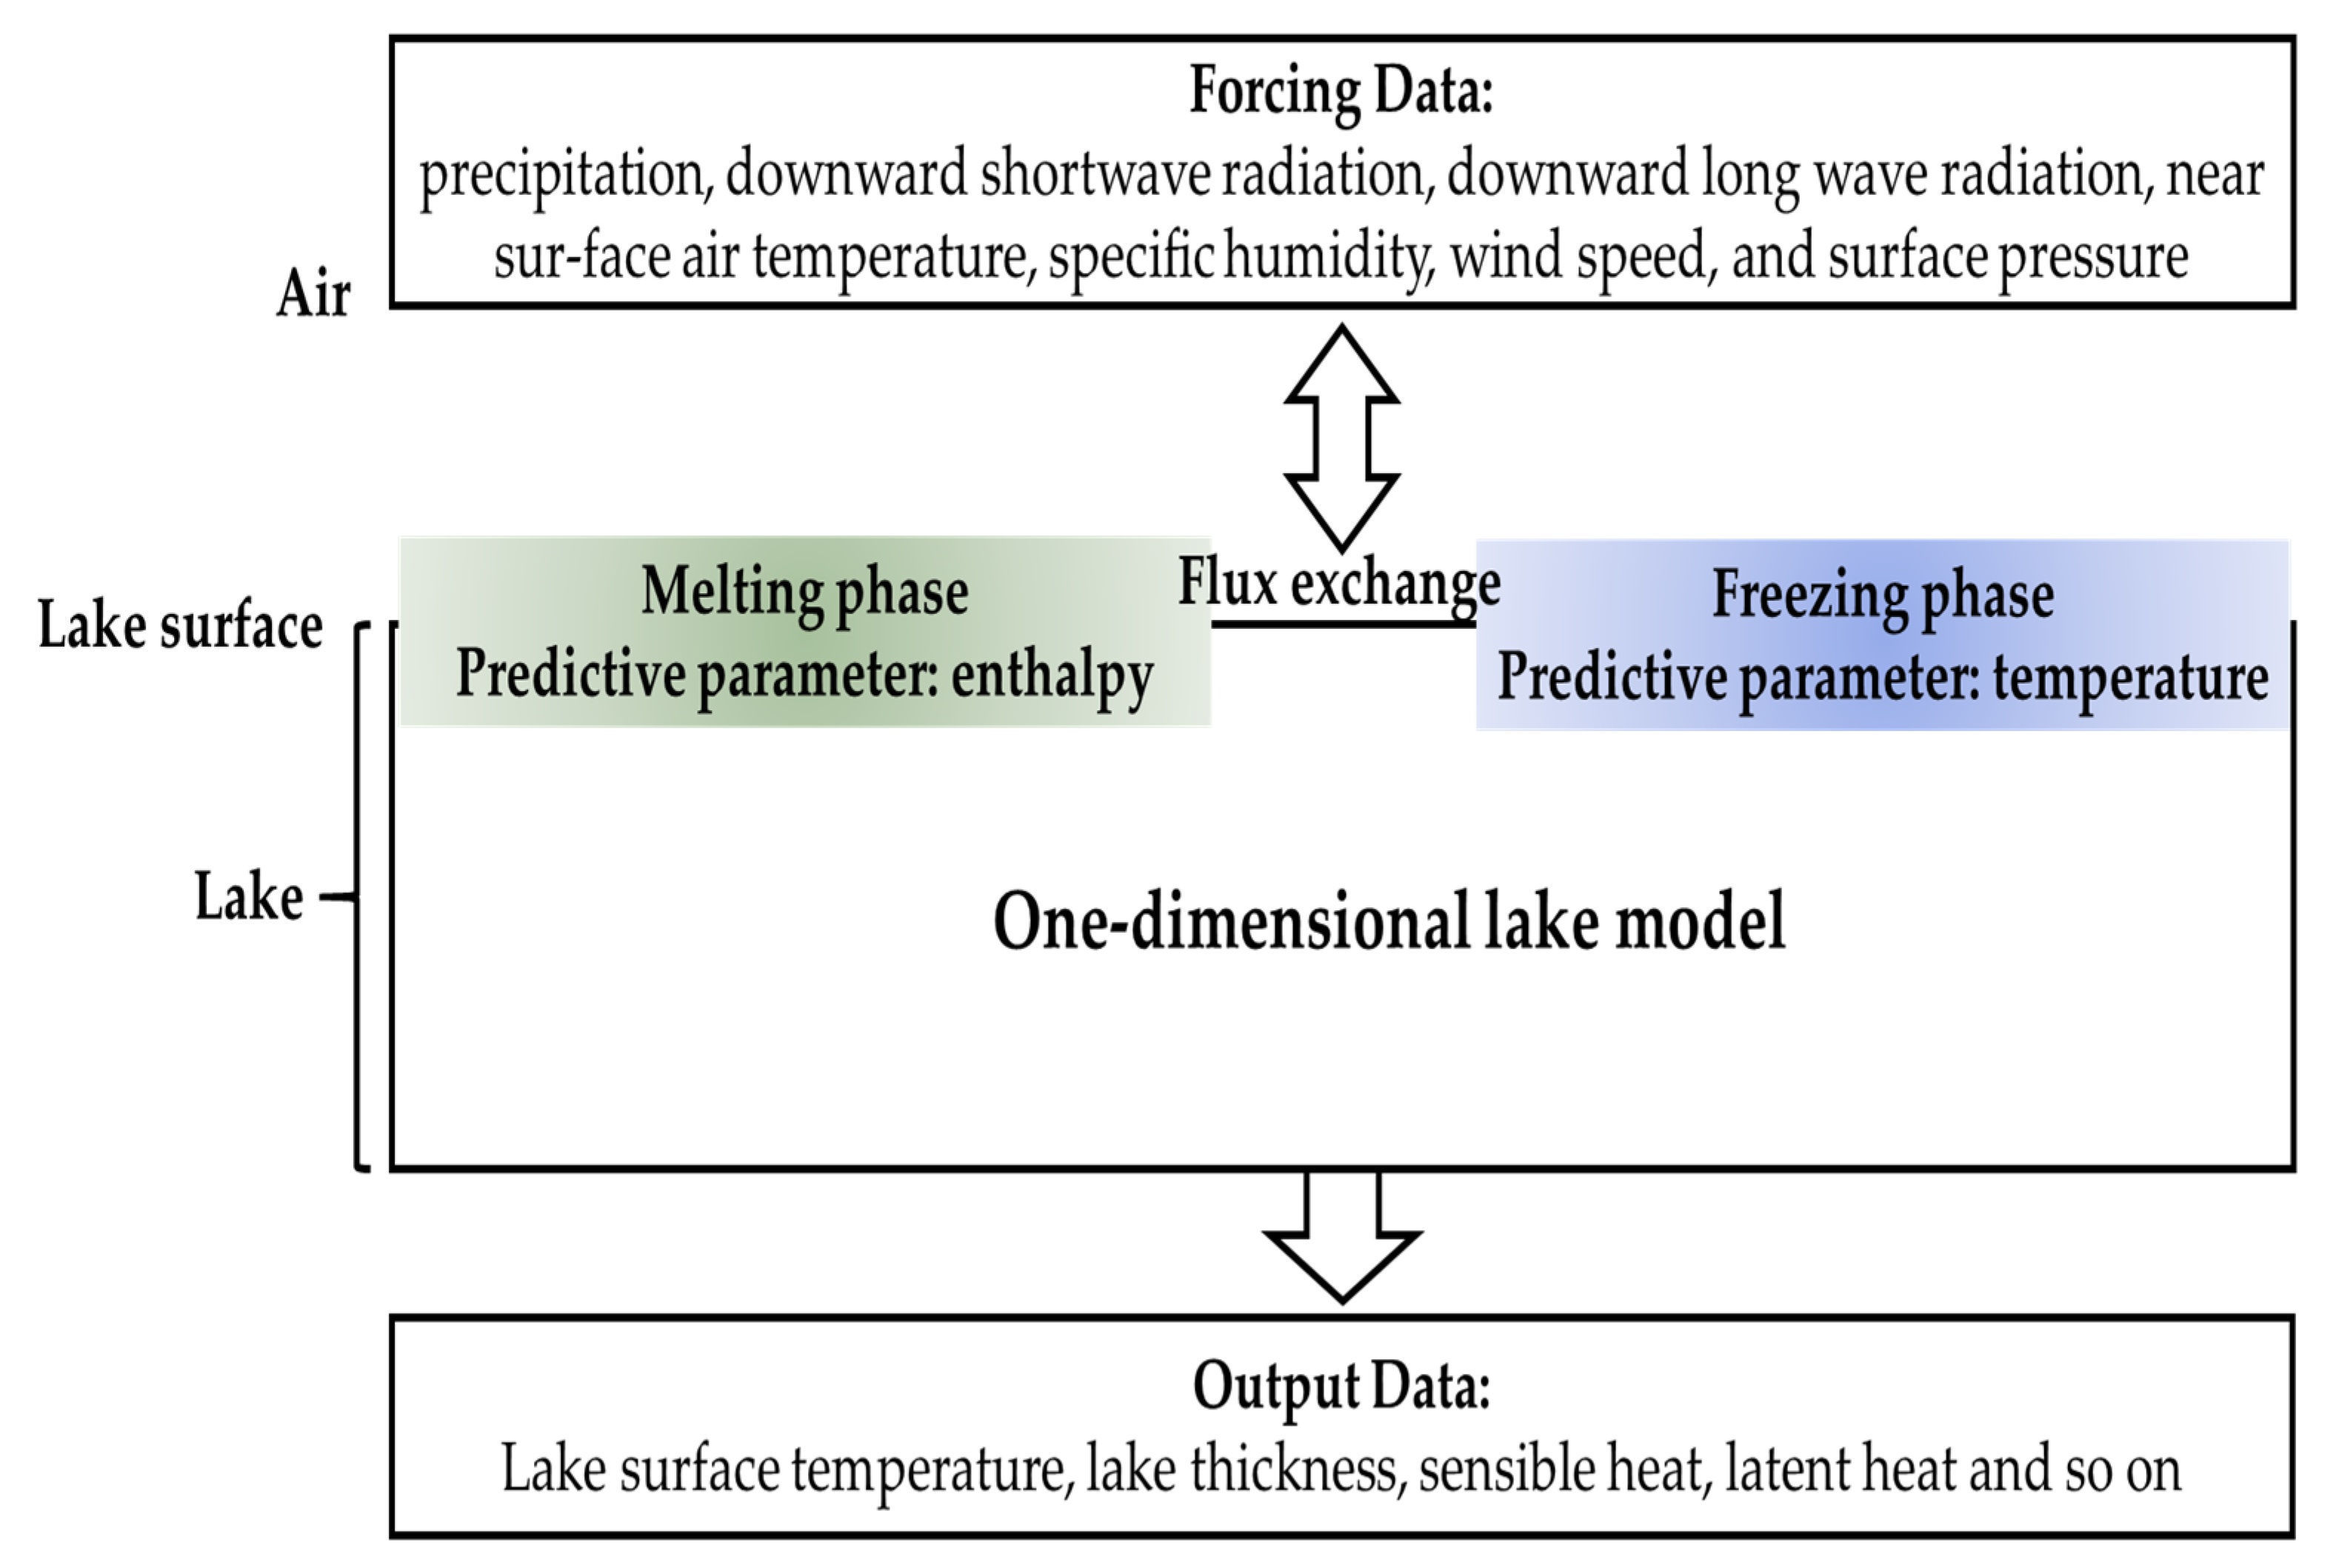
For this study, we used a one-dimensional lake model developed by Ren et al. (2014) to simulate ice processes in Nam Co [37]. This model is based on the energy balance equation using lake temperature as the prognostic variable during the non-freezing phase. But in the freezing phase, enthalpy is employed as the prognostic variable to filter out the effects of water phase change (Figure 2) [57]. The lake model simulates the heat and mass exchange processes between the atmosphere and lake surface. The water mixing is described with an eddy diffusion scheme adopted from Henderson-Sellers [58]. RLake is a layered model, and the layer number and thickness of each layer can be flexibly defined by the user. For this study, we set the total layer number to 56–60 depending on the lake depth in Nam Co. We placed a particular emphasis on the upper strata of the lake: the top 30 layers were precisely set at a thickness of 0.01 m each. This decision was made to capture and reflect the diurnal variations and the subtle fluctuations in lake variables that occur daily. Following the setting of these 30 layers, we gradually and arbitrarily increased the thickness of each successive layer until it culminated at the lake’s bottom. The thickness of the layers near the lake’s bottom varied widely, ranging from a minimum of 4 m to a maximum of 28 m, once again depending on the particular depth of the Nam Co at different regions.
In addition, RLake physically simulates the ice processes and depth. The continuous ice mass is simulated in RLake through the convective adjustment for an unstable stratified water column. In this model, the ice thickness of each lake layer ( d i c e ) was calculated using enthalpy:
d i c e = H d L f ρ i c e
where d is the thickness of each lake layer (m), the ice depth is the sum of the ice thicknesses of all lake layers, ρ i c e is the ice density (917 kg/m3), H is the enthalpy in the layer (J/m3), and L f is the latent heat of fusion (3.337 × 10⁵ J/kg).
H = ρ i c e c i c e ( T T f r e ) ρ w a t e r L f
where c i c e is the specific heat of ice, T is the temperature of each lake layer (K), T f r e is the freezing temperature (273.15 K), and ρ w a t e r is the water density (1000 kg/m3).

2.3.2. The Lake Model Improvement

For this study, we improved RLake by modifying the air density calculation and including the ice sublimation processes. In the original RLake, the air density is set to a constant with a value of 1.225 kg/m3. In this study, the air density ( ρ a t m ) was calculated according to:
ρ a t m = P a t m 0.378 e a t m R d a   T a t m
where P a t m is the atmospheric pressure (Pa), R d a is the gas constant for dry air (287.0423 J/kg−1 K−1), T a t m is the air temperature (K) at 2 m, and e a t m   is the atmospheric vapor pressure (Pa). The water vapor pressure ( e a t m ) calculation scheme is as follows:
e a t m = q a t m P a t m 0.622 + 0.37 q a t m
where q a t m is the atmospheric specific humidity.
In addition, the effect of sublimation on the ice depth is neglected in the original RLake. However, ice sublimation in the Tibetan Plateau could be an important process that affects the ice depth in an environment of strong solar radiation and dry climate. Thus, the ice sublimation process was parameterized as follows and was added to RLake:
T s u b = t ρ i c e ρ a t m u * q *
T s u b is the loss of ice thickness due to sublimation (m), t is the time step (s), u * is the friction velocity (m/s), and q * is the moisture (kg/kg).
Nam Co is a saline lake, and the water salinity is about 1.5 g/L [43]. The freezing point temperature is about −0.08 °C with such a salinity (the National Snow and Ice Data Center (NSIDC) (http://nsidc.org/cryosphere/seaice/characteristics/brine_salinity.html, accessed on 20 July 2023)), which is very close to 0 °C. Thus, we still used 0 °C as the ice freezing point in this study.

3. Results

3.1. Lake Surface Temperature and Lake Ice Thickness

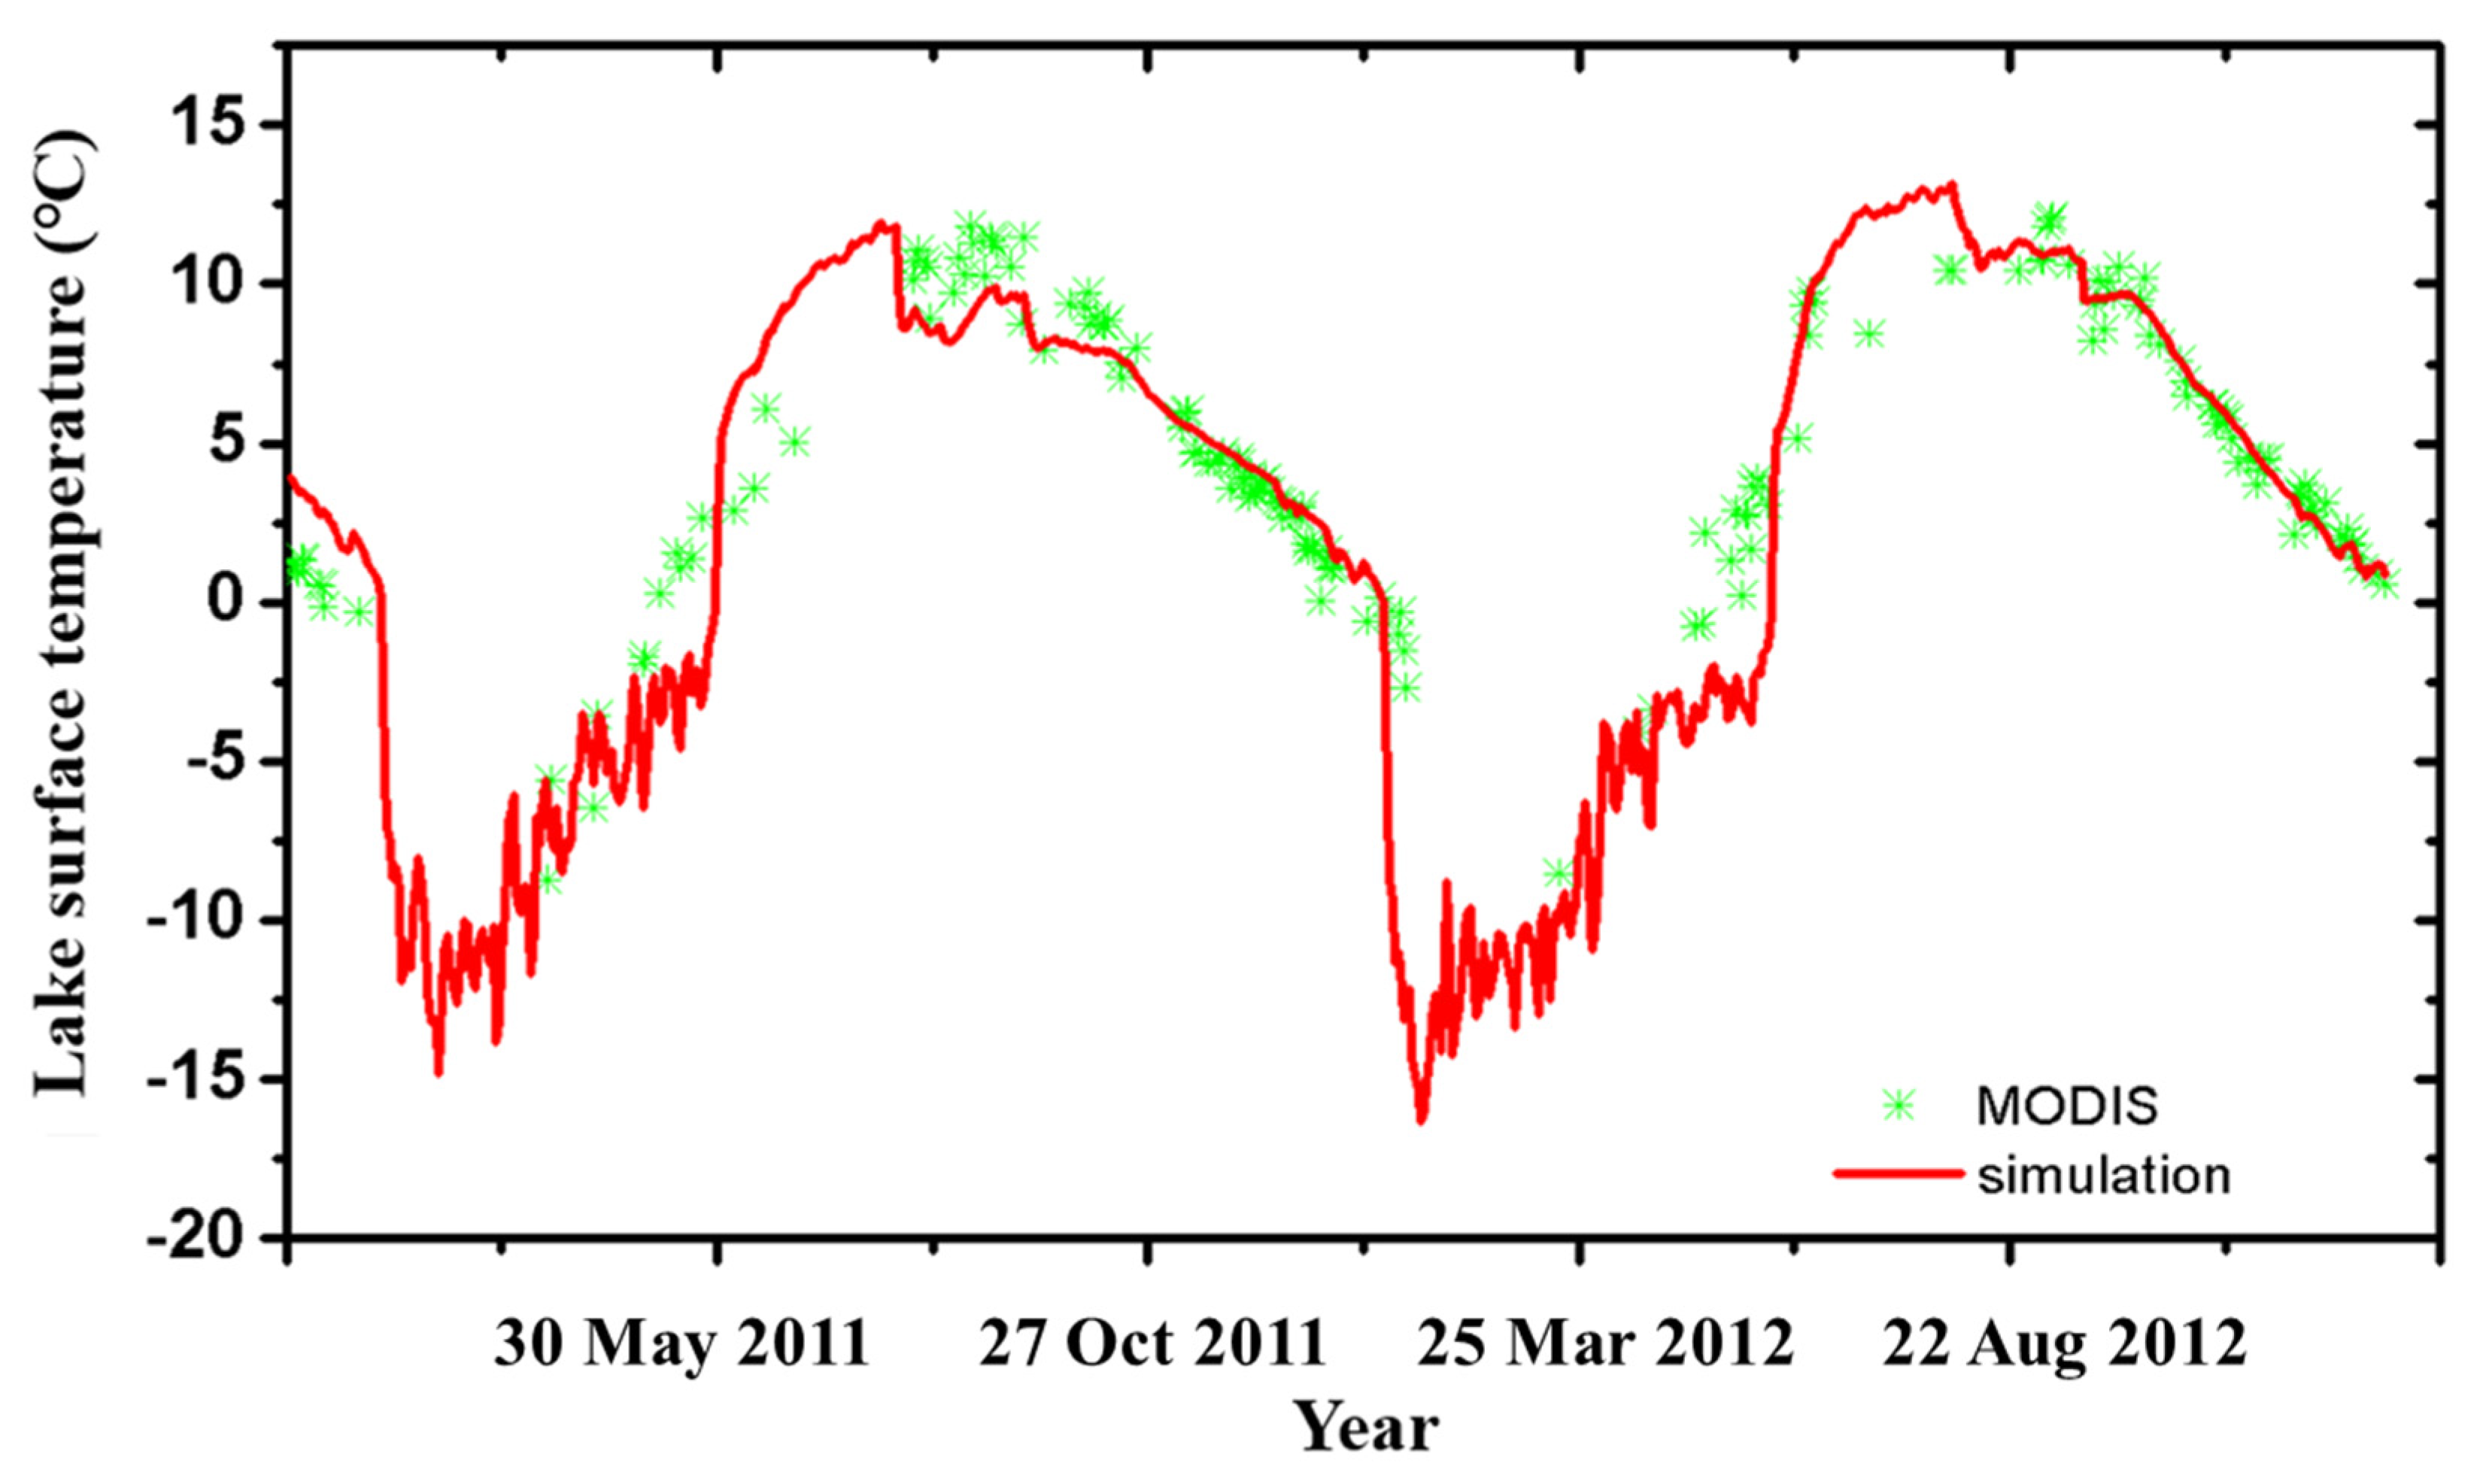
The lake surface temperature serves as a valuable indicator for evaluating lake models as it reflects the lake processes and lake–atmosphere exchange. Assessing the accuracy of lake models heavily relies on this factor. We compared the simulated lake surface temperature for Nam Co over a ten-year span from 2011 to 2012 with MODIS data. The simulation was performed at the central location of Nam Co, which represents the deepest point of the entire lake with a depth exceeding 90 m (30.75° N, 90.75° E). Superior results at this location demonstrate the strong modeling capability of the simulation. Figure 3 demonstrates a satisfactory agreement between the simulated lake surface temperatures and the MODIS data, displaying a correlation coefficient of 0.89 and an average error of 1.75 °C. This alignment suggests that our improved RLake model not only effectively captures the lake–atmosphere exchange but also replicates real lake processes. Therefore, this positions the RLake model as a reliable tool for further simulations regarding lake ice.
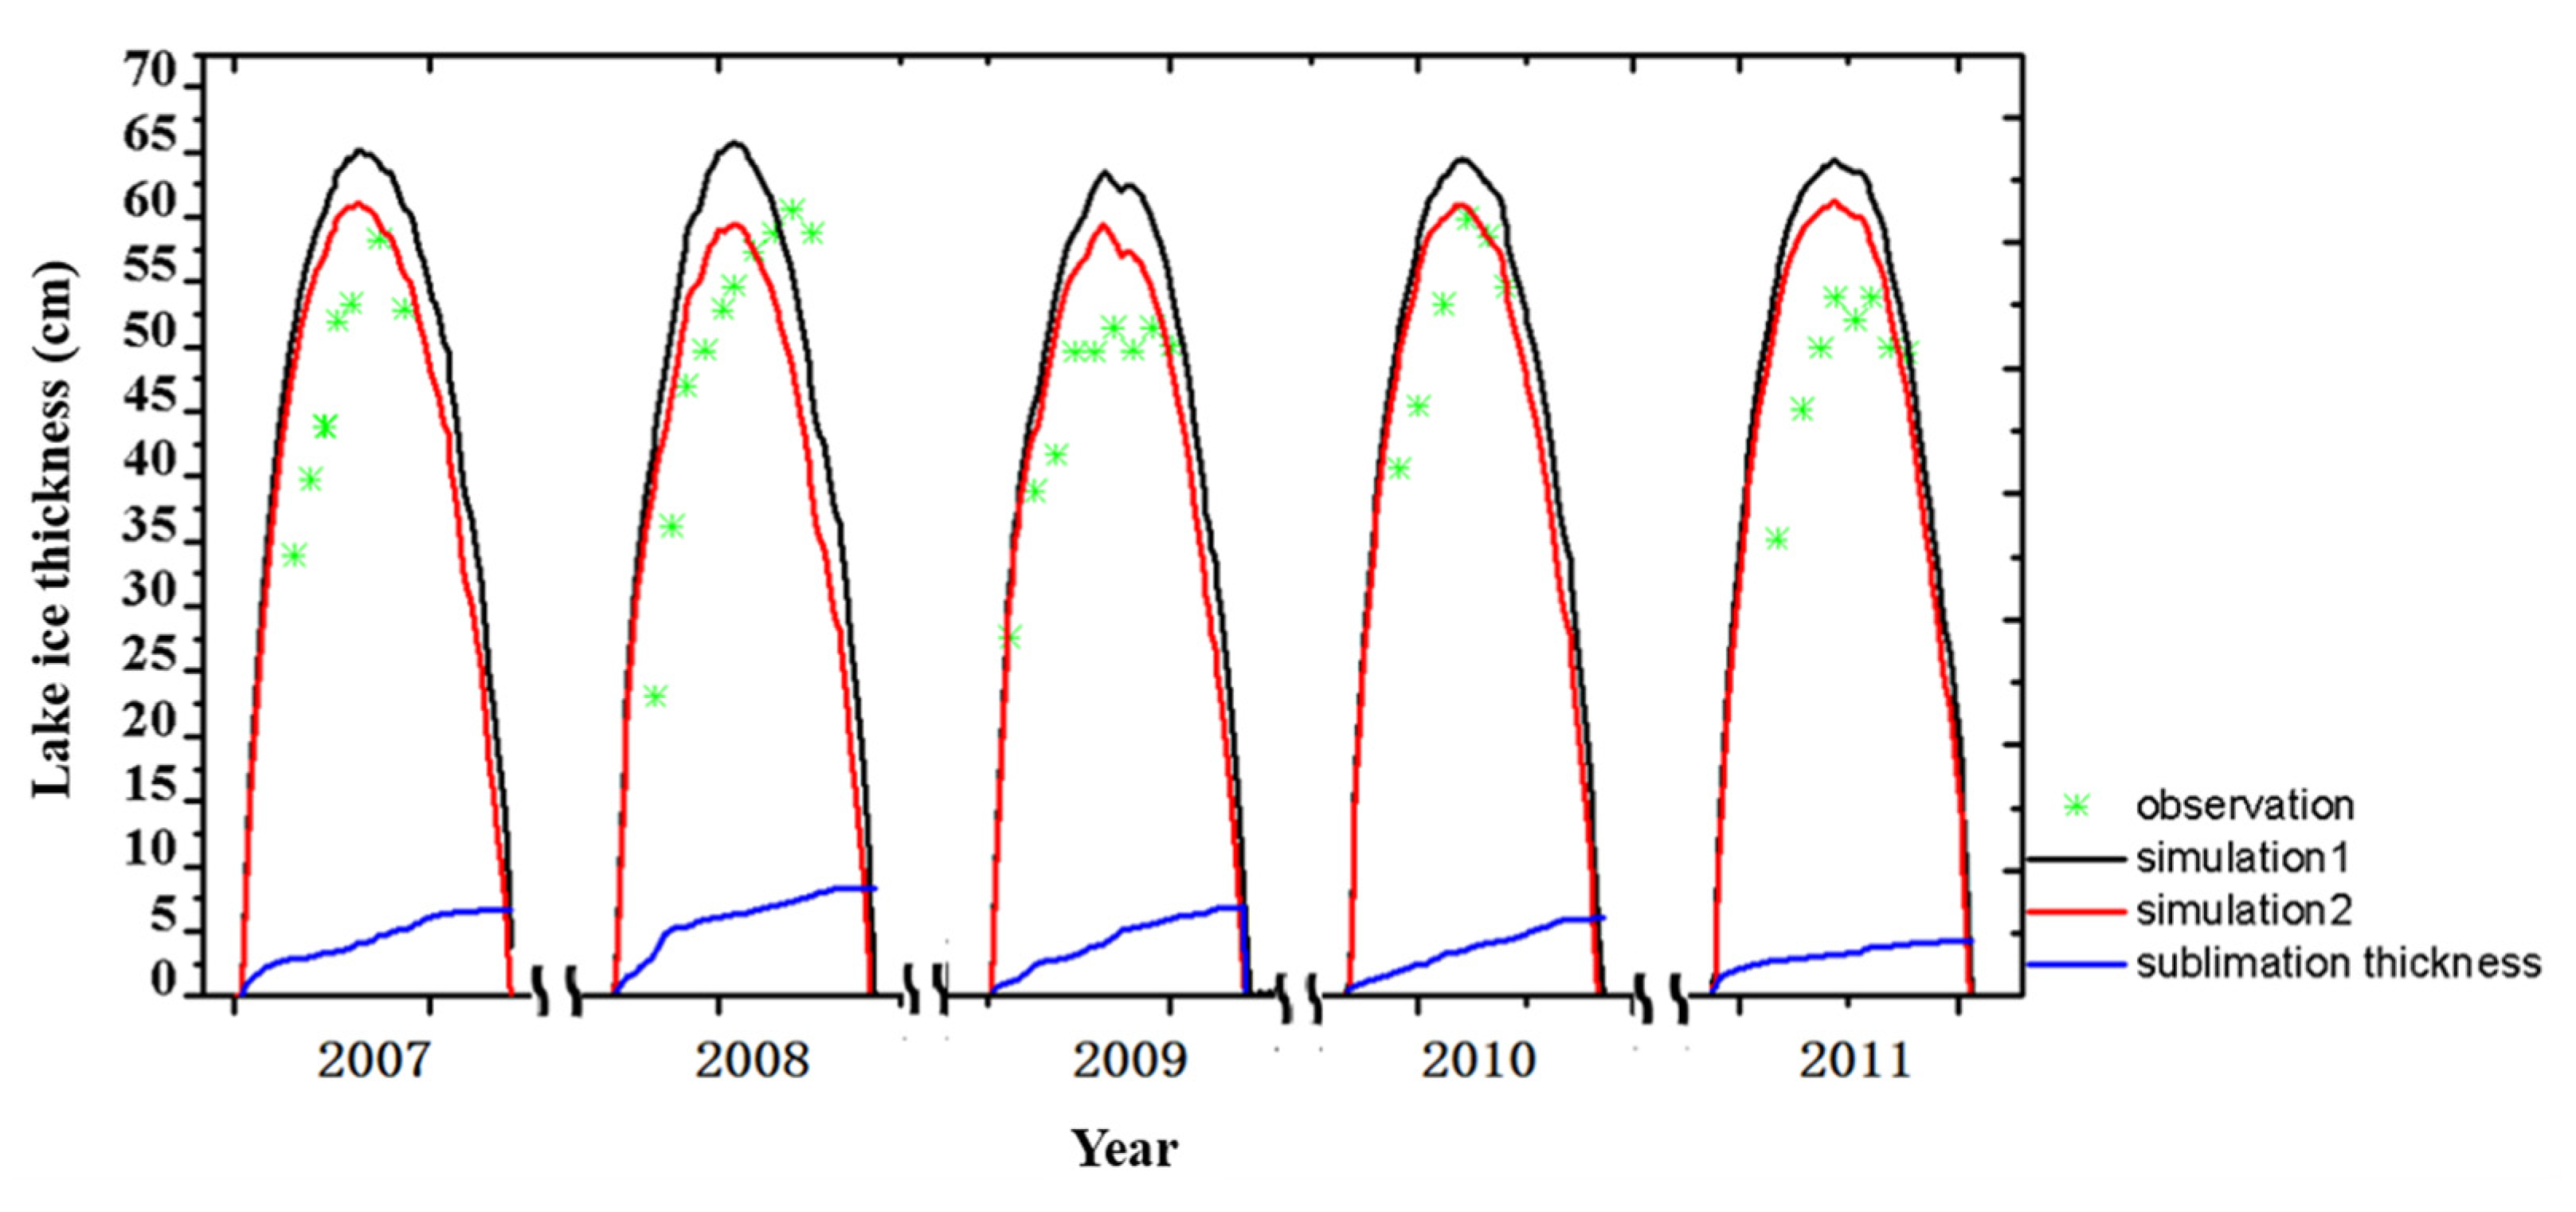
The improved RLake model was utilized to simulate ice thickness (represented by the black line in Figure 4), and a comparison was conducted with the observed ice thickness curve by Qu et al. (2012) at Nam Co from 2006 to 2011 [55]. The simulation was performed at the closest point to the observation location, located at coordinates 30.85 °N, 90.95° E. Based on the lake depth data provided in Figure 1, we set the lake depth at this coordinate to 36.3 m. Figure 3 illustrates the comparison results, showing that the simulated ice thickness generally exceeds the observed value. This disparity is attributed to the significant impact of sublimation loss on lake ice thickness [27]. Consequently, the RLake model was enhanced by incorporating the ice sublimation process (Section 2.3.2).
After incorporating the sublimation parameterization scheme into the RLake model, the simulation outcomes, delineated by the red line in Figure 4, show a closer congruence with the observed data, yielding a correlation coefficient of 0.87, an average error of 5.4 cm, and a mean annual sublimation of 6.9 cm. Notably, in the Nam Co region, even with the combined influences of low ambient humidity and strong lake winds, sublimation significantly impacts the simulation of lake ice thickness, accounting for approximately 10% of the yearly average ice thickness. This refinement emphasizes the significance of sublimation and affirms the capability of the model to faithfully replicate the year-to-year variations in the ice thickness of Nam Co.
Figure 4 reveals that in 2009, the ice thickness was markedly thinner compared to other observed years. This observation aligns with the forcing data, which indicates that 2009 experienced higher average winter temperatures than other years. Moreover, the reduction in ice thickness due to sublimation in 2011 was lower compared to other years, which can be attributed to lower wind speeds and higher humidity based on the forcing data.

3.2. The Change in Lake Ice Phenology

To investigate the impact of climate change on the lake ice of Nam Co, we simulated the ice phenology of Nam Co using an improved lake ice model. The results, presented in Figure 5, illustrate that both the MODIS data and simulation results indicate a delay in the ice-on date, an advancement in the ice-free date, and a reduction in the duration of lake ice cover. However, the model simulation exhibits these trends as more pronounced changes compared to the MODIS observation. The most significant disparity between the simulation results and MODIS data pertains to the ice-free date. The simulation results indicate an advancement of ice melt, foreseeing the ice-free date arriving 1.76 day/year earlier. In contrast, the MODIS data point to a more conservative shift, anticipating the ice-free date moving up by only 0.54 day/year within the same times. The simulation results for the ice-on date did not differ significantly from the MODIS data. The simulation results indicate a delay of 1.19 day/year for the ice-on date, while the MODIS data shows a delay of 1.01 day/year for the icing date. Regarding the duration of lake ice cover, over the course of these thirteen years, the simulation results showed a decrease of 2.76 day/year, whereas the MODIS data exhibited a decrease of 1.72 day/year. Overall, the lake ice phenological patterns from both our simulations and MODIS observations emphatically highlight the profound impact of climate change in Nam Co.

4. Discussion

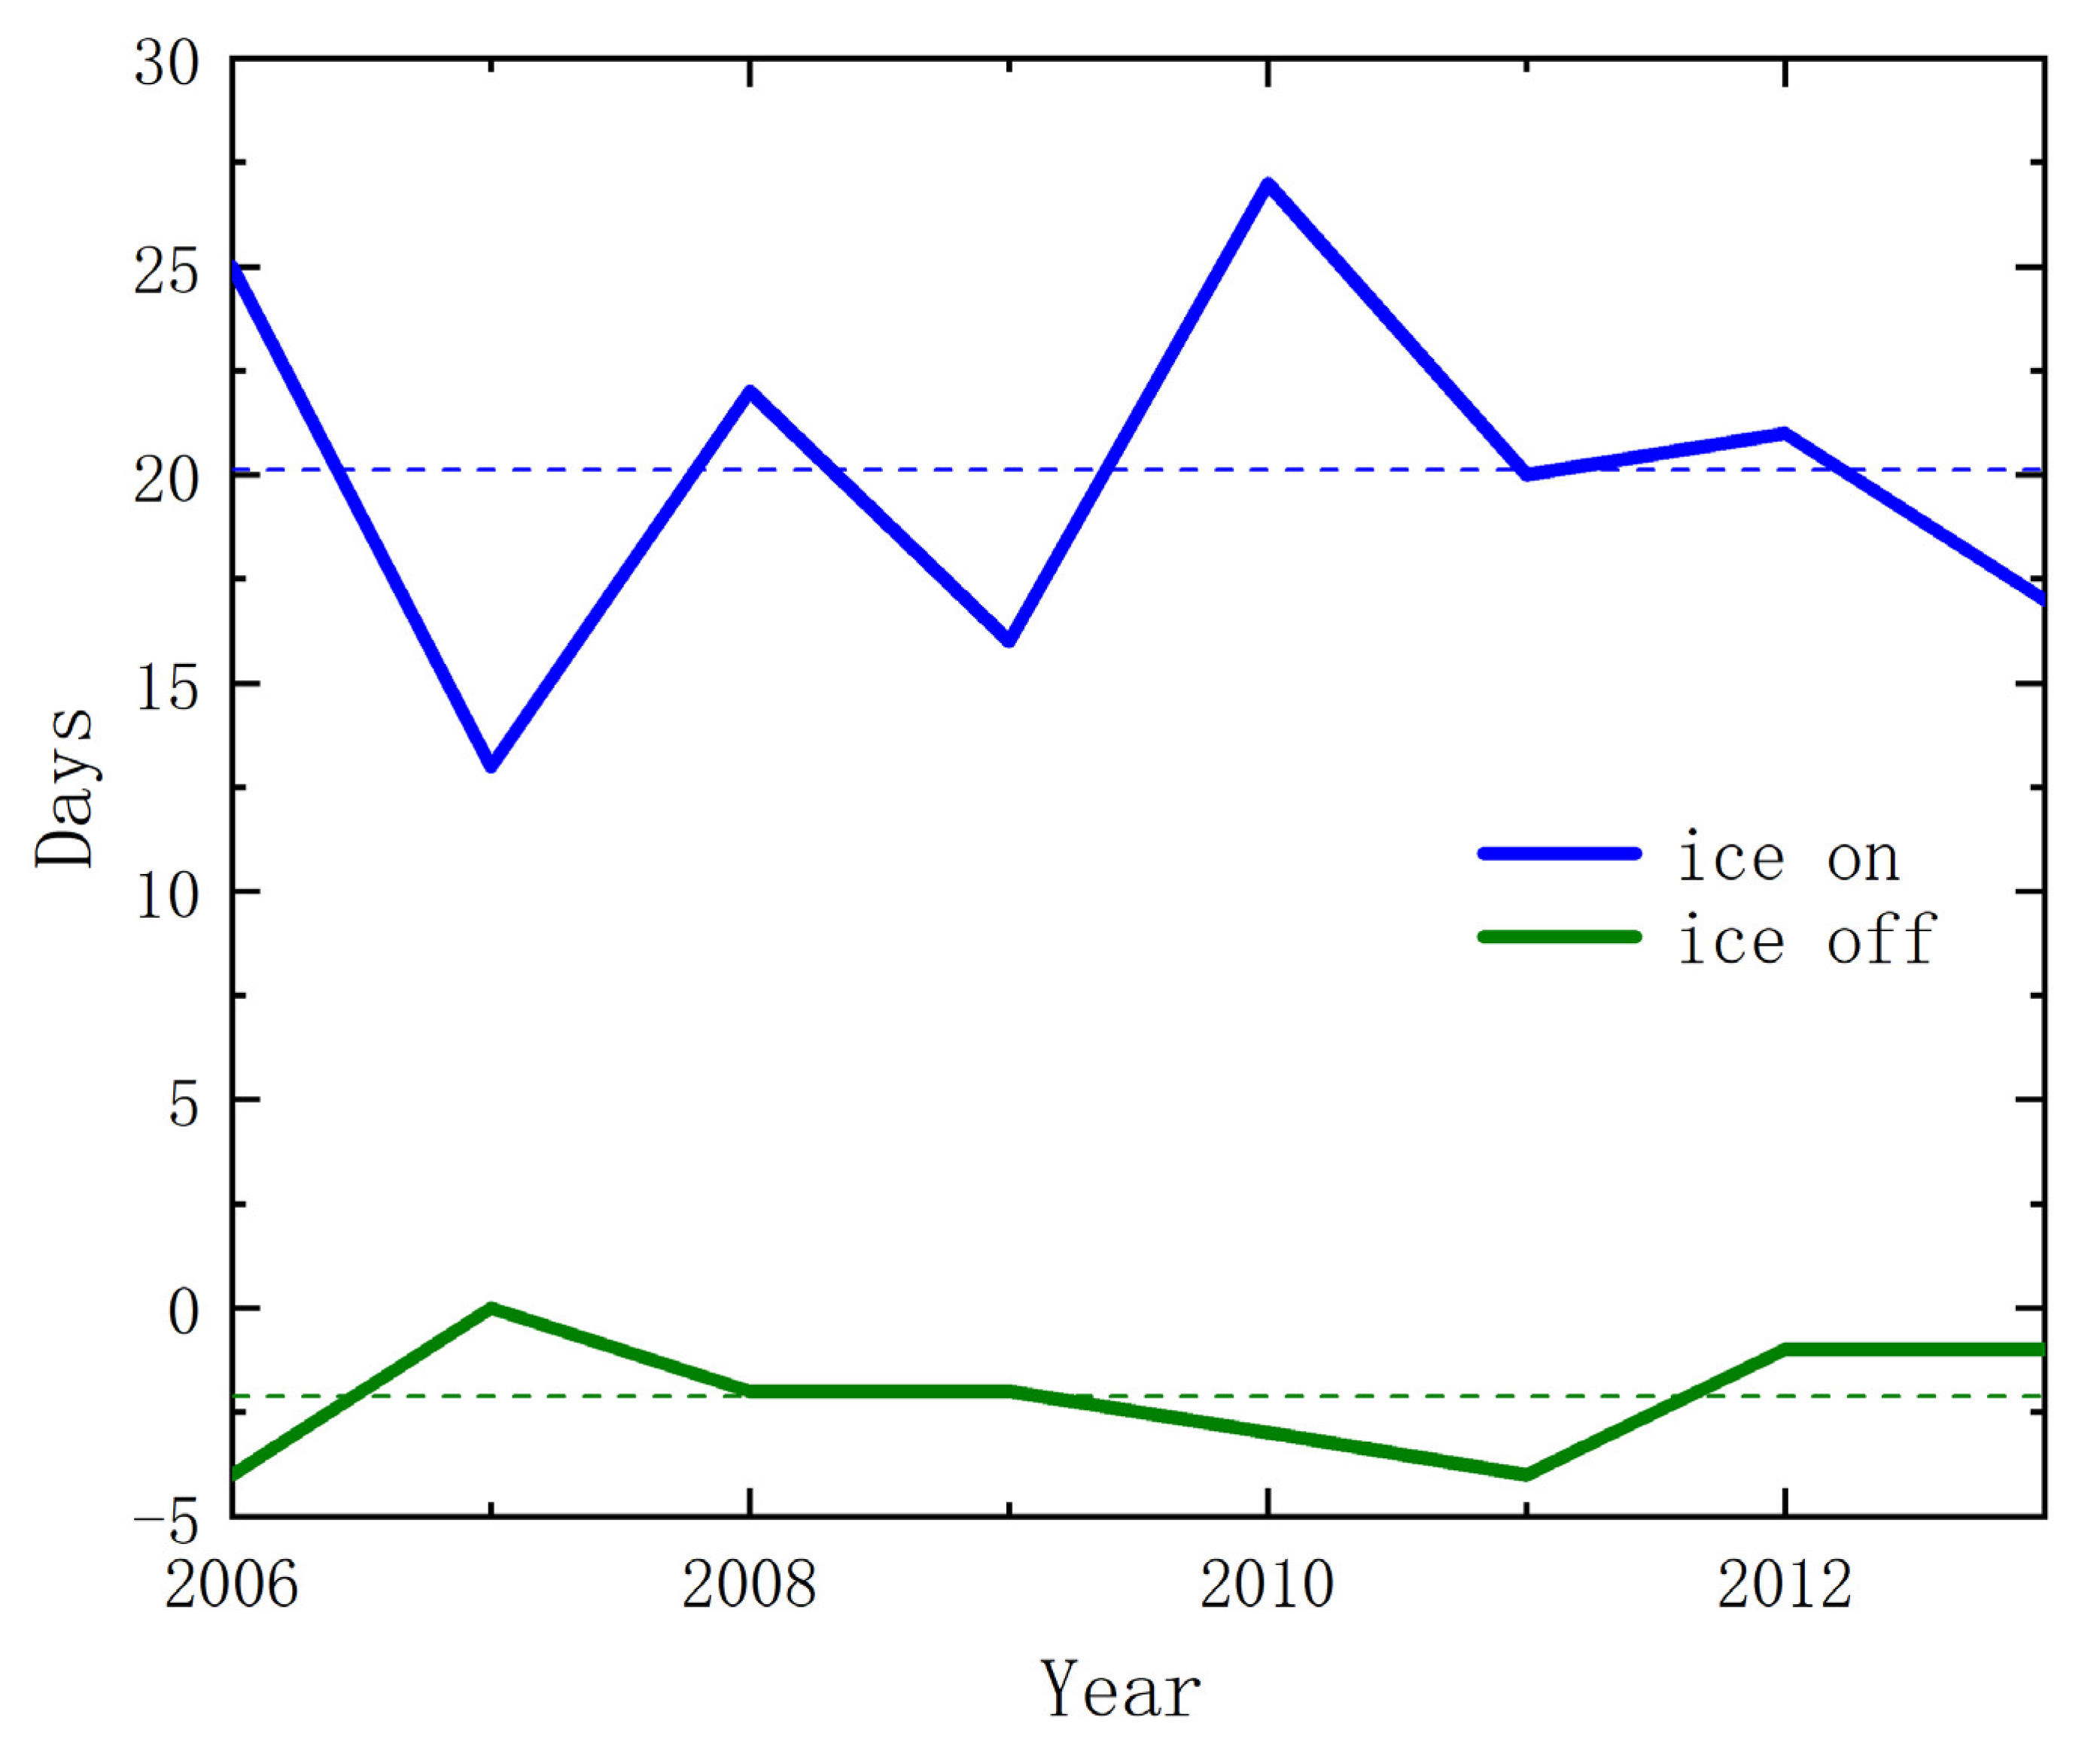
To investigate the effect of low air density on lake ice, we conducted two tests. Test 1 involved using a standard value at standard atmospheric pressure, with the air density set at 0 °C. This test aimed to simulate the freezing and thawing process at a presumed low altitude for Nam Co. In Test 2, we employed the air density calculation scheme described in the model introduction and utilized forced data to calculate the air density. This set of tests aimed to simulate the actual freeze–thaw process of Nam Co. Both tests were conducted at a specific location, with the lake depth set at 36m, and the simulation period spanning from 2006 to 2013.
The results of the single-point test indicated that air density primarily influences the ice-on date of Nam Co. A lower air density on the Tibetan Plateau leads to a delayed ice-on date and a slightly earlier ice-free date (Figure 6). The low air density on the plateau weakened the energy exchange between the lake and the atmosphere, particularly reducing the sensible and latent heat fluxes, with a significant reduction in the latent heat fluxes (Figure 7). Further analysis reveals that two types of energy impact the freeze–thaw process on the lake surface: energy stored within the lake and atmospheric forcing. During freezing, the stored heat in the lake suppresses the freezing of the lake surface, while the low temperature atmospheric forces promote the freezing of the lake surface. The low air density on the Tibetan Plateau weakens the effect of atmospheric forcing on the freeze–thaw process of the lake, allowing the energy stored in the lake to have a greater impact, leading to a delayed ice-on date. During thawing, the energy stored in the lake and atmospheric forcing contributes to the ice-thawing of the lake surface. Therefore, during this stage, although the influence of atmospheric forcing is weakened by the low air density, due to the fact that these two energies have a coherent impact on the lake surface, the ice-free dates of the lake surface are only slightly advanced.
Owing to the distinctive climatic conditions of the Tibetan Plateau, numerical simulations of its lakes have revealed limitations, especially in modeling the deep lake ice-on phase. Notably, these simulations often prematurely predict the commencement of lake ice-on [49,59,60,61,62,63]. In response, the RLake model employed enthalpy as the predictive variable throughout the freezing phase, effectively addressing complications associated with the phase transitions of freezing and thawing in water [57]. Figure 3 illustrates a marked correlation between our simulated results and observed data concerning lake freeze–thaw timings, achieving a correlation coefficient of 0.89. Although the simulation of lake ice thickness in Figure 4 appears marginally high, its trajectory corresponds closely with the observational findings, devoid of significant phase deviations. Consequently, the incorporation of enthalpy as the predictive parameter proves pivotal in elevating the precision of freeze simulations for lakes on the Tibetan Plateau.
Our simulation yielded an overestimation of Nam Co Lake’s ice thickness, in contrast to Li et al. (2021), who reported an underestimation for Ngoring Lake [62]. The ice phenology of the north Europe lake, Lake Inari, also shows the same trend of change: a delayed ice-on date, an earlier ice-free date, and a shortened ice duration [64,65]. However, the rate of change in the ice phenology of Nam Co Lake far exceeds that of the Lake Inari, whether in simulation results or remote sensing data [64,65]. Contrarily, Guo et al. (2017) deduced a delayed ice melt date for Nam Co Lake based on remote sensing data, diverging from our findings [66]. Such variations are likely due to differing research time frames. Moreover, changes in both the lake surface temperature and ice cover will impact the aquatic ecosystem of Nam Co, leading to phenomena such as an increase in phytoplankton, shifts in community composition, biodiversity changes, and species invasions [23].
The Tibetan Plateau, characterized by its lower latitude, arid conditions, and minimal atmospheric dust, demonstrates a high transparency that intensifies radiation. In winter, amplified wind speeds coupled with dryness over the lake contribute to marked sublimation of the ice, which in turn affects its thickness. Simultaneously, studies on lake ice phenology have found that due to global warming, the freezing dates of lake ice are delayed, melting dates are advanced, and the duration of lake ice cover is shortened. These changes have all impacted the sublimation of lake ice. This sublimation, integral to the lake’s evaporation mechanism, modulates the lake’s water level and its overall expanse, fostering a feedback mechanism between salinity and evaporation rates [67]. This study posits that factors such as snowfall, rainfall, surface runoff, and groundwater influx compensate for the water deficit caused by sublimation, thereby stabilizing annual lake surface elevations. However, the recent literature suggests a rise in the water level of Nam Co and an expansion of its surface area in recent years, which may influence its salinity and evaporation rate [18,68,69]. While our investigation was constrained to a bidimensional analysis and overlooked fluctuations in the water elevation, future endeavors employing a tridimensional lake model may offer enhanced perspectives on the subject.

5. Conclusions

This study enhanced the RLake model by incorporating additional air density parameterization schemes from the CLM. Additionally, it considered the effects of lake salinity and sublimation on the freezing point and ice thickness. The improved lake ice model demonstrates excellent accuracy in simulating the temperature and thickness of individual lake points. The correlation coefficient between the simulated lake surface temperature and MODIS data is 0.89, with an average error of 1.75 °C. The correlation coefficient between the simulated lake ice thickness and field observation data is 0.87, with an average error of 5.4 cm. Meanwhile, it accurately reproduces the MODIS trends, including delayed ice-on dates, advanced ice-free dates, and a shorter duration of lake ice cover. However, the model still faces challenges in accurately simulating the spatial variability and dynamics of the entire lake surface. Future research should focus on enhancing the lake model’s representation of the connectivity between the lake and its surrounding environment to improve simulation accuracy.

Author Contributions

Y.S. and J.J.; Methodology, Y.S. and J.J.; Formal analysis, Y.S.; Investigation, Y.S. and Z.L.; Data curation, Y.S. and J.J.; Writing—review and editing, Y.S., J.J. and Z.L.; Supervision, Y.L. and X.W.; Project administration, Y.L. and X.W.; Funding acquisition, Y.S. and J.J. All authors have read and agreed to the published version of the manuscript.

Funding

This research was supported by the National Key R&D Program of China (Grant No. 2021YFC3000802) and the National Natural Science Foundation of China No. 42288101.

Data Availability Statement

Publicly available datasets were analyzed in this study. These data can be found here: http://poles.tpdc.ac.cn/zh-hans/ (accessed on 20 July 2023).

Acknowledgments

We thank Junbo Wang for providing lake depth data in Nam Co, Bin Qu for providing lake ice thickness observations, and Peng Gou for providing ice phenology data for Nam Co.

Conflicts of Interest

The authors declare no conflict of interest.

References

  1. Li, G.; Yu, Z.; Wang, W.; Ju, Q.; Chen, X. Analysis of the spatial Distribution of precipitation and topography with GPM data in the Tibetan Plateau. Atmos. Res. 2021, 247, 5259. [Google Scholar] [CrossRef]
  2. Wu, J.; Wang, G.; Chen, W.; Pan, S.; Zeng, J. Terrain gradient variations in the ecosystem services value of the Qinghai-Tibet Plateau, China. Glob. Ecol. Conserv. 2022, 34, e02008. [Google Scholar] [CrossRef]
  3. Yang, M.; Nelson, F.E.; Shiklomanov, N.I.; Guo, D.; Wan, G. Permafrost degradation and its environmental effects on the Tibetan Plateau, A review of recent research. Earth Sci. Rev. 2010, 103, 31–44. [Google Scholar] [CrossRef]
  4. Liu, X.; Yin, Z.Y.; Shao, X.; Qin, N. Temporal trends and variability of daily maximum and minimum, extreme temperature events, and growing season length over the eastern and central Tibetan Plateau during 1961–2003. J. Geophys. Res. Atmos. 2006, 111, D19. [Google Scholar] [CrossRef]
  5. Cheng, G.; Jin, H. Permafrost and groundwater on the Qinghai-Tibet Plateau and in northeast China. Hydrogeol. J. 2013, 21, 5. [Google Scholar] [CrossRef]
  6. Wang, Y.; Xu, Y.; Spencer, R.G.; Zito, P.; Kellerman, A.; Podgorski, D.; Xiao, W.; Wei, D.; Rashid, H.; Yang, Y. Selective leaching of dissolved organic matter from alpine permafrost soils on the Qinghai-Tibetan Plateau. J. Geophys. Res. Biogeosci. 2018, 123, 1005–1016. [Google Scholar] [CrossRef]
  7. Jiang, C.; Yin, L.; Li, Z.; Wen, X.; Luo, X.; Hu, S.; Yang, H.; Long, Y.; Deng, B.; Huang, L.; et al. Microplastic pollution in the rivers of the Tibet Plateau. Environ. Pollut. 2019, 249, 91–98. [Google Scholar] [CrossRef]
  8. Xu, R.G.; Qiao, G.; Wu, Y.J.; Cao, Y.J. Extraction of rivers and lakes on Tibetan Plateau Based on Google Earth Engine. Int. Arch. Photogramm. Remote Sens. Spat. Inf. Sci. 2019, 42, 1797–1801. [Google Scholar] [CrossRef]
  9. Li, Y.; Hou, Z.; Zhang, L.; Song, C.; Piao, S.; Lin, J.; Peng, S.; Fang, K.; Yang, J.; Qu, Y.; et al. Rapid expansion of wetlands on the Central Tibetan Plateau by global warming and El Niño. Sci. Bull. 2023, 68, 485–488. [Google Scholar] [CrossRef]
  10. Yao, T.; Bolch, T.; Chen, D.; Gao, J.; Immerzeel, W.; Piao, S.; Su, F.; Thompson, L.; Wada, Y.; Wang, L.; et al. The imbalance of the Asian water tower. Nat. Rev. Earth Environ. 2022, 3, 618–632. [Google Scholar] [CrossRef]
  11. Zhang, G.; Yao, T.; Xie, H.; Zhang, K.; Zhu, F. Lakes’ state and abundance across the Tibetan Plateau. Chin. Sci. Bull. 2014, 59, 3010–3021. [Google Scholar] [CrossRef]
  12. Li, X.Y.; Ma, Y.J.; Huang, Y.M.; Hu, X.; Wu, X.C.; Wang, P.; Li, G.; Zhang, S.; Wu, H.; Jiang, Z.; et al. Evaporation and surface energy budget over the largest high-altitude saline lake on the Qinghai-Tibet Plateau. J. Geophys. Res. Atmos. 2016, 121, 10470–10485. [Google Scholar] [CrossRef]
  13. Yang, X.; Lu, X. Drastic change in China’s lakes and reservoirs over the past decades. Sci. Rep. 2014, 4, 6041. [Google Scholar] [CrossRef] [PubMed]
  14. Feng, H.; Squires, V.R. Socio-environmental dynamics of alpine grasslands, steppes and meadows of the Qinghai–Tibetan Plateau, China, A commentary. Appl. Sci. 2020, 10, 6488. [Google Scholar] [CrossRef]
  15. Zhao, R.; Fu, P.; Zhou, Y.; Xiao, X.; Grebby, S.; Zhang, G.; Dong, J. Annual 30-m big Lake Maps of the Tibetan Plateau in 1991–2018. Sci. Data 2022, 9, 164. [Google Scholar] [CrossRef] [PubMed]
  16. Wan, W.; Long, D.; Hong, Y.; Ma, Y.; Yuan, Y.; Xiao, P.; Duan, H.; Han, Z.; Gu, X. A lake data set for the Tibetan Plateau from the 1960s, 2005, and 2014. Sci. Data 2016, 3, 1–13. [Google Scholar] [CrossRef] [PubMed]
  17. Yang, K.; Lu, H.; Yue, S.; Zhang, G.; Lei, Y.; La, Z.; Wang, W. Quantifying recent precipitation change and predicting lake expansion in the Inner Tibetan Plateau. Clim. Chang. 2018, 147, 149–163. [Google Scholar] [CrossRef]
  18. Zhang, G.; Yao, T.; Xie, H.; Yang, K.; Zhu, L.; Shum, C.K.; Bolch, T.; Yi, S.; Allen, S.; Jiang, L.; et al. Response of Tibetan Plateau lakes to climate change, Trends, patterns, and mechanisms. Earth Sci. Rev. 2020, 208, 103269. [Google Scholar] [CrossRef]
  19. Kropáček, J.; Maussion, F.; Chen, F.; Hoerz, S.; Hochschild, V. Analysis of ice phenology of lakes on the Tibetan Plateau from MODIS data. Cryosphere 2013, 7, 287–301. [Google Scholar] [CrossRef]
  20. Benson, B.J.; Magnuson, J.J.; Jensen, O.P.; Card, V.M.; Hodgkins, G.; Korhonen, J.; Livingstone, D.M.; Stewart, K.M.; Weyhenmeyer, G.A.; Granin, N.G. Extreme events, trends, and variability in Northern Hemisphere lake-ice phenology (1855–2005). Clim. Change 2012, 112, 299–323. [Google Scholar] [CrossRef]
  21. Cai, Y.; Ke, C.Q.; Li, X.; Zhang, G.; Duan, Z.; Lee, H. Variations of lake ice phenology on the Tibetan Plateau from 2001 to 2017 based on MODIS data. J. Geophys. Res. Atmos. 2019, 124, 825–843. [Google Scholar] [CrossRef]
  22. Sharma, S.; Blagrave, K.; Magnuson, J.J.; O’Reilly, C.M.; Oliver, S.; Batt, R.D.; Magee, M.R.; Straile, D.; Weyhenmeyer, G.A.; Winslow, L.; et al. Widespread loss of lake ice around the Northern Hemisphere in a warming world. Nat. Clim. Chang. 2019, 9, 227–231. [Google Scholar] [CrossRef]
  23. Woolway, R.I.; Kraemer, B.M.; Lenters, J.D.; Merchant, C.J.; O’Reilly, C.M.; Sharma, S. Global lake responses to climate change. Nat. Rev. Earth Environ. 2020, 1, 388–403. [Google Scholar] [CrossRef]
  24. Magnuson, J.J.; Robertson, D.M.; Benson, B.J.; Wynne, R.H.; Livingstone, D.M.; Arai, T.; Assel, R.A.; Barry, R.G.; Card, V.A.; Kuusisto, E.; et al. Historical trends in lake and river ice cover in the Northern Hemisphere. Science 2000, 289, 1743–1746. [Google Scholar] [CrossRef]
  25. Leppäranta, M. Freezing of Lakes and the Evolution of Their Ice Cover; Springer Science & Business Media: Berlin/Heidelberg, Germany, 2014. [Google Scholar]
  26. Heiskanen, J.J.; Mammarella, I.; Ojala, A.; Stepanenko, V.; Erkkilä, K.M.; Miettinen, H.; Sandstr öm, H.; Eugster, W.; Leppäranta, M.; Järvinen, H.; et al. Effects of water clarity on lake stratification and lake-atmosphere heat exchange. J. Geophys. Res. Atmos. 2015, 120, 7412–7428. [Google Scholar] [CrossRef]
  27. Huang, W.; Cheng, B.; Zhang, J.; Zhang, Z.; Vihma, T.; Li, Z.; Niu, F. Modeling experiments on seasonal lake ice mass and energy balance in the Qinghai–Tibet Plateau, a case study. Hydrol. Earth Syst. Sci. 2019, 23, 2173–2186. [Google Scholar] [CrossRef]
  28. Kirillin, G.B.; Shatwell, T.; Wen, L. Ice-covered lakes of Tibetan Plateau as solar heat collectors. Geophys. Res. Lett. 2021, 48, e2021GL093429. [Google Scholar] [CrossRef]
  29. Vavrus, S.; Notaro, M.; Zarrin, A. The role of ice cover in heavy lake-effect snowstorms over the Great Lakes Basin as simulated by RegCM4. Mon. Weather. Rev. 2013, 141, 148–165. [Google Scholar] [CrossRef]
  30. Fu, Y.; Ma, Y.; Zhong, L.; Yang, Y.; Guo, X.; Wang, C.; Xu, X.; Yang, K.; Xu, X.; Liu, L.; et al. Land-surface processes and summer-cloud-precipitation characteristics in the Tibetan Plateau and their effects on downstream weather, A review and perspective. Natl. Sci. Rev. 2020, 7, 500–515. [Google Scholar] [CrossRef]
  31. Carrivick, J.L.; Tweed, F.S.; Sutherland, J.L.; Mallalieu, J. Toward Numerical Modeling of Interactions Between Ice-Marginal Proglacial Lakes and Glaciers. Front. Earth Sci. 2020, 8, 577068. [Google Scholar] [CrossRef]
  32. Yang, Y.; Leppäranta, M.; Cheng, B.; Li, Z. Numerical modelling of snow and ice thicknesses in Lake Vanajavesi, Finland. Tellus A Dyn. Meteorol. Oceanogr. 2012, 64, 17202. [Google Scholar] [CrossRef]
  33. Surdu, C.M.; Duguay, C.R.; Brown, L.C.; Fernández Prieto, D. Response of ice cover on shallow lakes of the North Slope of Alaska to contemporary climate conditions (1950–2011), radar remote-sensing and numerical modeling data analysis. Cryosphere 2014, 8, 167–180. [Google Scholar] [CrossRef]
  34. Stepanenko, V.M.; Repina, I.A.; Ganbat, G.; Davaa, G. Numerical simulation of ice cover of saline lakes. Izv. Atmos. Ocean. Phys. 2019, 55, 129–138. [Google Scholar] [CrossRef]
  35. Oleson, K.; Lawrence, D.M.; Bonan, G.B.; Drewniak, B.; Huang, M.; Koven, C.D.; Yang, Z.L. Technical Description of Version 4.5 of the Community Land Model (CLM); NCAR Technical Notes (NCAR/TN-478+STR); National Center for Atmospheric Research: Boulder, CO, USA, 2013; p. 605. [Google Scholar] [CrossRef]
  36. Mironov, D.V. Parameterization of Lakes in Numerical Weather Prediction, Description of a Lake Model; DWD: Offenbach, Germany, 2008; p. 41. [Google Scholar]
  37. Ren, X.; Li, Q.; Chen, W.; Liu, H. A New Lake Model for Air-Lake Heat Exchange Process and Evaluation of Its Simulation Ability. Chin. J. Atmos. Sci. 2014, 38, 993–1004. [Google Scholar] [CrossRef]
  38. Zhou, S.; Kang, S.; Chen, F.; Joswiak, D.R. Water balance observations reveal significant subsurface water seepage from Lake Nam Co, south-central Tibetan Plateau. J. Hydrol. 2013, 491, 89–99. [Google Scholar] [CrossRef]
  39. Du, Y.; Huang, Z.; Xie, M.; Farooq, A.; Chen, C. Temporal Variations in the Quantity of Groundwater Flow in Nam Co Lake. Water 2018, 10, 941. [Google Scholar] [CrossRef]
  40. Lazhu; Yang, K.; Wang, J.; Lei, Y.; Chen, Y.; Zhu, L.; Ding, B.; Qin, J. Quantifying evaporation and its decadal change for Lake Nam Co, central Tibetan Plateau. J. Geophys. Res. Atmos. 2016, 121, 7578–7591. [Google Scholar] [CrossRef]
  41. Wang, J.; Zhu, L.; Daut, G.; Ju, J.; Lin, X.; Wang, Y.; Zhen, X. Bathymetric survey and modern limnological parameters of Nam Co, central Tibet. J. Lake Sci. 2009, 21, 128–134. [Google Scholar] [CrossRef]
  42. Cong, Z.; Kang, S.; Gao, S.; Zhang, Y.; Li, Q.; Kawamura, K. Historical trends of atmospheric black carbon on Tibetan Plateau as reconstructed from a 150-year lake sediment record. Environ. Sci. Technol. 2013, 47, 2579–2586. [Google Scholar] [CrossRef]
  43. Wang, J.; Huang, L.; Ju, J.; Daut, G.; Ma, Q.; Zhu, L.; Haberzettl, T.; Baade, J.; Mäusbacher, R.; Hamilton, A.; et al. Seasonal stratification of a deep, high-altitude, dimictic lake, Nam Co, Tibetan Plateau. J. Hydrol. 2020, 584, 124668. [Google Scholar] [CrossRef]
  44. Krause, P.; Biskop, S.; Helmschrot, J.; Flügel, W.A.; Kang, S.; Gao, T. Hydrological system analysis and modelling of the Nam Co basin in Tibet. Adv. Geosci. 2010, 27, 29–36. [Google Scholar] [CrossRef]
  45. Gao, T.G.; Kang, S.C.; Zhang, T.J.; Yang, D.Q.; Shang, J.G.; Qin, X. Stream temperature dynamics in Nam Co basin, southern Tibetan Plateau. J. Mt. Sci. 2017, 14, 2458–2470. [Google Scholar] [CrossRef]
  46. Wu, Y.J.; Qiao, G.; Li, H.W. Water level changes of Nam-Co lake based on satellite altimetry data series. Int. Arch. Photogramm. Remote Sens. Spat. Inf. Sci. 2017, 42, 1555–1560. [Google Scholar] [CrossRef]
  47. Liu, J.; Kang, S.; Gong, T.; Lu, A. Growth of a high-elevation large inland lake, associated with climate change and permafrost degradation in Tibet. Hydrol. Earth Syst. Sci. 2010, 14, 481–489. [Google Scholar] [CrossRef]
  48. Keil, A.; Berking, J.; Mügler, I.; Schütt, B.; Schwalb, A.; Steeb, P. Hydrological and geomorphological basin and catchment characteristics of Lake Nam Co, South-Central Tibet. Quat. Int. 2010, 218, 118–130. [Google Scholar] [CrossRef]
  49. Dai, Y.; Yao, T.; Li, X.; Ping, F. The impact of lake effects on the temporal and spatial distribution of precipitation in the Nam Co basin, Tibetan Plateau. Quat. Int. 2018, 475, 63–69. [Google Scholar] [CrossRef]
  50. Li, Y.J.; Qiao, G. Information Extraction and Change Analysis of Major Lakes in Tibetan Plateau Based on Landsat Remote Sensing Images. ISPRS Int. Arch. Photogramm. Remote Sens. Spat. Inf. Sci. 2017, 42, 1541–1546. [Google Scholar] [CrossRef]
  51. Yang, K.; He, J.; Tang, W.; Lu, H.; Qin, J.; Chen, Y.; Li, X. China meteorological forcing dataset (1979–2018). In A Big Earth Data Platform for Three Poles; TPDC: Beijing, China, 2019. [Google Scholar] [CrossRef]
  52. He, J.; Yang, K.; Tang, W.; Lu, H.; Qin, J.; Chen, Y.; Li, X. The first high-resolution meteorological forcing dataset for land process studies over China. Sci. Data 2020, 7, 25. [Google Scholar] [CrossRef]
  53. Eleftheriou, D.; Kiachidis, K.; Kalmintzis, G.; Kalea, A.; Bantasis, C.; Koumadoraki, P.; Spathara, M.E.; Tsolaki, A.; Tzampazidou, M.I.; Gemitzi, A. Determination of annual and seasonal daytime and nighttime trends of MODIS LST over Greece-climate change implications. Sci. Total Environ. 2018, 616, 937–947. [Google Scholar] [CrossRef]
  54. Wang, Y.R.; Hessen, D.O.; Samset, B.H.; Stordal, F. Evaluating global and regional land warming trends in the past decades with both MODIS and ERA5-Land land surface temperature data. Remote Sens. Environ. 2022, 280, 113181. [Google Scholar] [CrossRef]
  55. Qu, B.; Kang, S.; Chen, F.; Zhang, Y.; Zhang, G. Lake Ice and Its Effect Factors in the Nam Co Basin, Tibetan Plateau. Progress. Inquisitiones Mutat. Clim. 2012, 8, 327–333. [Google Scholar]
  56. Gou, P.; Ye, Q.H.; Wei, Q. Lake ice change at the Nam Co Lake on the Tibetan Plateau during 2000–2013 and influencing factors. Prog. Geogr. 2015, 34, 1241–1249. [Google Scholar] [CrossRef]
  57. Sun, S.; Yan, J.; Xia, N.; Li, Q. The model study of water mass and energy exchange between the inland water body and atmosphere. Sci. China Ser. G-Phys. Mech. Astron. 2008, 51, 1010–1021. [Google Scholar] [CrossRef]
  58. Henderson-Sellers, B. New formulation of eddy diffusion thermocline models. Appl. Math. Model. 1985, 9, 441–446. [Google Scholar] [CrossRef]
  59. Ao, Y.; Lyu, S.; Li, Z.; Wen, L.; Zhao, L. Numerical simulation of the climate effect of high-altitude lakes on the Tibetan Plateau. Sci. Cold Arid. Reg. 2018, 10, 379–391. [Google Scholar]
  60. Zhu, L.; Jin, J.; Liu, X.; Tian, L.; Zhang, Q. Simulations of the impact of lakes on local and regional climate 612 over the Tibetan Plateau. Atmos. Ocean 2018, 56, 230–239. [Google Scholar] [CrossRef]
  61. Zhang, Q.; Jin, J.; Wang, X.; Budy, P.; Barrett, N.; Null, S.E. Improving lake mixing process simulations in the Community Land Model by using K profile parameterization. Hydrol. Earth Syst. Sci. 2019, 23, 4969–4982. [Google Scholar] [CrossRef]
  62. Li, Z.; Lyu, S.; Wen, L.; Zhao, L.; Ao, Y.; Meng, X. Study of freeze-thaw cycle and key radiation transfer parameters in a Tibetan Plateau lake using LAKE2.0 model and field observations. J. Glaciol. 2021, 67, 91–106. [Google Scholar] [CrossRef]
  63. Ma, X.; Yang, K.; La, Z.; Lu, H.; Jiang, Y.; Zhou, X.; You, X.; Li, X. Importance of parameterizing lake surface and internal thermal processes in WRF for simulating freeze onset of an alpine deep lake. J. Geophys. Res. Atmos. 2022, 127, e2022JD036759. [Google Scholar] [CrossRef]
  64. Noori, R.; Bateni, S.M.; Saari, M.; Almazroui, M.; Torabi Haghighi, A. Strong warming rates in the surface and bottom layers of a boreal lake: Results from approximately six decades of measurements (1964–2020). Earth Space Sci. 2022, 9, e2021EA001973. [Google Scholar] [CrossRef]
  65. Noori, R.; Woolway, R.I.; Saari, M.; Pulkkanen, M.; Kløve, B. Six decades of thermal change in a pristine lake situated north of the Arctic Circle. Water Resour. 2022, 58, e2021WR031543. [Google Scholar] [CrossRef]
  66. Gou, P.; Ye, Q.; Che, T.; Feng, Q.; Ding, B.; Lin, C.; Zong, J. Lake ice phenology of Nam Co, Central Tibetan Plateau, China, derived from multiple MODIS data products. J. Great Lakes Res. 2017, 43, 989–998. [Google Scholar] [CrossRef]
  67. Barry, R.G.; Gan, T.Y. The Global Cryosphere: Past, Present, and Future; Cambridge University Press: Singapore, 2022. [Google Scholar]
  68. Brun, F.; Treichler, D.; Shean, D.; Immerzeel, W.W. Limited contribution of glacier mass loss to the recent increase in Tibetan Plateau lake volume. Front. Earth Sci. 2020, 8, 582060. [Google Scholar] [CrossRef]
  69. Wang, J.; Li, M.; Wang, L.; She, J.; Zhu, L.; Li, X. Long-Term Lake Area Change and Its Relationship with Climate in the Endorheic Basins of the Tibetan Plateau. Remote Sens. 2021, 13, 5125. [Google Scholar] [CrossRef]
Figure 1. The bathymetry of Nam Co (a) and the location of Nam Co on Tibetan Plateau (b). The red pentacle is the Nam Co meteorological station. The red points are the site of eighteen simulation points, and their size and color intensity represent the lake depth value at that point.
Water 15 03088 g001
Figure 2. RLake model structure.
Water 15 03088 g002
Figure 3. Comparison between simulated values (red line) and MODIS data (green points) of daily lake surface temperature at 30.75° N, 90.75° E during the period of 2011–2012 in Nam Co. Lake depth: 93.3 m.
Water 15 03088 g003
Figure 4. Comparison between modeled (red line) and observed (green points) ice thickness at 30.85° N, 90.95° E on Nam Co during the 2007–2011 period. The blue line represents ice thickness loss due to sublimation, while the black line represents ice thickness without sublimation loss.
Water 15 03088 g004
Figure 5. Time series of ice-on (a), ice-free (b), and total ice duration (c) in Nam Co from 2000 to 2013 are presented using both simulated (red line) and MODIS data (black line).
Water 15 03088 g005
Figure 6. Time series of simulated differences in lake ice phenology between Test 1 and Test 2 at various air densities on Nam Co from 2006 to 2013. The solid line depicts the lake ice phenology differences from both tests, while the dashed line shows their average value.
Water 15 03088 g006
Figure 7. Comparison of simulation results of Test 1 and Test 2; (a) simulate sensible heat; (b) simulated latent heat.
Water 15 03088 g007
Disclaimer/Publisher’s Note: The statements, opinions and data contained in all publications are solely those of the individual author(s) and contributor(s) and not of MDPI and/or the editor(s). MDPI and/or the editor(s) disclaim responsibility for any injury to people or property resulting from any ideas, methods, instructions or products referred to in the content.