Article

The Transient Characteristics of the Cavitation Evolution of the Shroud of High-Speed Pump-Jet Propellers under Different Operating Conditions

1
Xi’an Precision Machinery Research Institute, Xi’an 710075, China
2
National Pump and System Engineering Technology Research Center, Jiangsu University, Zhenjiang 212013, China
*
Author to whom correspondence should be addressed.
Water 2023, 15(17), 3073; https://doi.org/10.3390/w15173073
Submission received: 13 June 2023 / Revised: 17 August 2023 / Accepted: 22 August 2023 / Published: 28 August 2023
(This article belongs to the Special Issue Advancements in the Complex Vortex Flow in Hydraulic Machinery)

Abstract

:
Pump-jet propellers are currently the mainstream propulsion method for underwater vehicles, and cavitation is an important factor limiting the high speed and miniaturization of pump-jet propellers. In order to explore the cavitation performance of high-speed pump-jet propellers, based on the modified SST turbulence model and the Zwart cavitation model, a three-dimensional numerical simulation of unsteady internal cavitation flow was carried out by comparing the impeller with specific speed ns = 1920 using FLUENT 2020R2 software. At the same time, the occurrence and development process of cavitation under 0.95 Q, 1.0 Q, and 1.05 Q conditions were analyzed (Q is the mass flow), the changes in gas volume fraction in the impeller channel were captured, the distribution characteristics of cavitation under different NPSH values were explored, and the change law of cavitation with time was determined. The results show that, when NPSH dropped to 95 m, the impeller cavitation first occurred under the 1.05 Q operating condition, and the impeller cavitation volume fraction was 0.0379525. When NPSH dropped to 85 m, the impeller cavitation occurred under the 1.0 Q operating condition, and the impeller cavitation volume fraction was 0.0185164. When NPSH dropped to 80 m, the impeller cavitation occurred under the condition of 0.95 Q, and the volume fraction of the impeller cavitation was 0.013541. The high-speed pump-jet propeller had better anti-cavitation ability with a small flow rate. The cavitation distribution law under the three operating conditions was similar; cavitation was first generated on the impeller inlet edge and near the shroud, and the vacuoles with large volumes were mostly concentrated on the impeller inlet side. As the NPSH gradually decreased, the entire flow channel was gradually occupied by vacuoles. As the flow decreased, the corresponding NPSH also decreased. When NPSH dropped to 50 m, the volume fraction of the impeller under all three operating conditions reached around 0.4. As the cavitation only occurred on the suction surface, the volume fraction of the cavitation on the suction surface exceeded 0.8, at which time the impeller had already undergone severe cavitation. Within a complete cycle, bubbles first appeared at the inlet edge of the impeller (measured near the shroud) and gradually spread toward the middle and rear of the impeller, ultimately covering the suction surface of the impeller. Under the design condition, the experimental results of the model pump were consistent with the numerical simulation results, and the error was only 2.68%, thus verifying the reliability of the numerical simulation. The research results provide a reference for the in-depth study of the cavitation performance of high-speed pump-jet propellers and provide a good theoretical basis and practical significance in the engineering field for the high-speed and miniaturization process of high-speed pump-jet propellers.

1. Introduction

A pump-jet propeller consists of an annular conduit, a stator (diffuser), and a rotor (impeller) [1], and it has the advantages of high propulsion efficiency, high critical speed, low cavitation, and low radiation noise compared with a traditional propeller [2]. The pump-jet propeller is the mainstream propulsion method for underwater vehicles. With the rapid development of underwater vehicles, the propulsion system is becoming more and more complex, the performance and technical indicators of the propulsion system are constantly improving, and the demand for pump-jet propellers with high cabin capacity and compact structure is becoming more and more urgent; thus, it is urgent to achieve breakthroughs in the technical problems of high-speed and miniaturization of pump-jet propellers. Cavitation is an important factor limiting the high speed and miniaturization of pump-jet propellers, and cavitation at the shroud is one of the primary types of cavitation in pump-jet propellers.
Reviewing the existing references, it was found that the study of cavitation phenomena in pump-jet propellers is similar to traditional pumps, mainly using a combination of experimental and numerical simulation methods.
Sang-Ho [3] and Yuan [4] et al. performed PIV experiment measurements to investigate the distribution of vacuoles. Hu [5] used the triple-octave spectrum analysis method to analyze the experimental data and obtained the vibration and noise characteristics caused by cavitation. Al Obaidi et al. [6,7,8,9] used acoustic and vibration detection techniques to detect and diagnose cavitation in centrifugal pumps and studied the influence of air injection at the pump inlet on its performance. The influence of different operating conditions on cavitation was studied by using different statistical characteristics in the time domain. At the same time, microphones were used instead of sensors in the low frequency range of the experiment, which reduced the experimental cost to some extent. However, the experiments conducted in the abovementioned studies are costly, and the research period is long.
CFD is a computer science-based numerical simulation method that models and simulates fluid motion by using numerical methods. Replacing real experiments with CFD calculations can effectively reduce experimental costs and shorten design cycles. Yangping Lu [10] proposed some pump cavitation detection methods based on energy, pressure, high-speed photography, acoustic emission noise, and vibration. The criterion of “3% head” of pumps is often used to detect whether cavitation occurs in the pump, but the limitation of this method is that cavitation has already gradually developed when the head drops by 3%. Based on the modified k–ω turbulence model and the Zwart–Gerber–Belamri (ZGB) cavitation model, Thamsen et al. [11] used transient numerical simulation methods to study the cavitation performance of a centrifugal pump, and compared with the experiment, the error was 4.1%. Chai [12] used numerical simulation software CFX 2013 to simulate the cavitation performance of a centrifugal pump, which was consistent with the experimental results. Chengcheng Qiu [13], Wang [14], and HuQixiang et al. [15] used the k–ε turbulence model combined with the ZGB cavitation model to analyze the cavitation performance of a pump-jet propeller and compared it with the towing experiment, and the error in the difference between the simulation and experiment was about 2%. The current research references on cavitation at the shroud mainly focus on medium- and low-speed pump-jet propellers. Yi [16], Kan [17], and R.B. Medvitz et al. [18] applied a realizable k–ε turbulence model combined with the Schnerr–Sauer cavitation model to study cavitation performance. Marco [19] provided a calculation program that can effectively evaluate the propulsion performance of high-speed pump-jet propellers based on critical cavitation points. Desheng Zhang et al. [20] simulated and analyzed the formation of a three-dimensional tip-leakage vortex (TLV) cavitation cloud of an axial-flow pump with a specific speed of 728 and the periodic collapse phenomenon of the TLV-induced suction-side perpendicular cavitation vortex (SSPCV). Xi Shen et al. [21] conducted experimental and numerical studies on the unsteady characteristics of the leakage vortex structure of the tip of a low-speed pump-jet propeller blade at 1450 r/min and revealed the evolution mechanism and influencing factors of the transient vortex morphology. Al Obaidi et al. [22,23,24,25,26] used CFD numerical methods to qualitatively and quantitatively analyze the internal flow field and pressure pulsation of axial-flow pumps. The sliding grid method and the k–ε turbulence model were used to explore the effects of different impeller blade angles and different diffusers on the structure and performance of the flow field of axial-flow pumps under unsteady conditions. By monitoring the static and dynamic conditions, as well as the total pressure, shear stress, velocity, and turbulent flow energy, and by setting different measuring pressure points, the average pressure in the pump was determined, and the influence of diffusers on the average pressure was analyzed. Their numerical calculation results provide theoretical guidance for the further design and research of axial-flow pumps. The abovementioned studies mainly focus on the cavitation performance of pump-jet propellers at medium and low speed, while the research on the cavitation performance of high-speed pumps has not been reported.
This study aimed to reveal the evolution mechanism of the cavitation transient process at the shroud of high-speed pump-jet propellers and provide a theoretical basis for further research on the high speed and miniaturization of pump-jet propellers. We considered a high-speed pump-jet propeller with a rotational speed of 18,000 r/min (specific speed ns = 1920) as the research object, and we conducted numerical simulation calculations on the pump-jet propeller at 0.95 Q, 1.0 Q, and 1.05 Q and verified the reliability of the numerical simulation through experiments. Furthermore, the changes in the impeller cavitation volume fraction under different NPSH allowances and different flow rates were recorded using numerical simulation. Through the numerical calculation of the pump-jet propeller under unsteady conditions, the distribution characteristics of cavitation on the impeller surface at different times under different flow conditions were obtained using post-treatment technology, and the change law of cavitation over time was explored. At the same time, the blade-to-blade surface of the impeller blade channel with a parameter span of 0.5 was selected to analyze the velocity nephogram of the impeller blade at different times under different operating conditions, so as to explore the relationship between impeller cavitation and the speed of the pump-jet propeller. The research methods and the results of this paper provide theoretical support and practical significance in the engineering field for the subsequent design and optimization of pump-jet propellers.

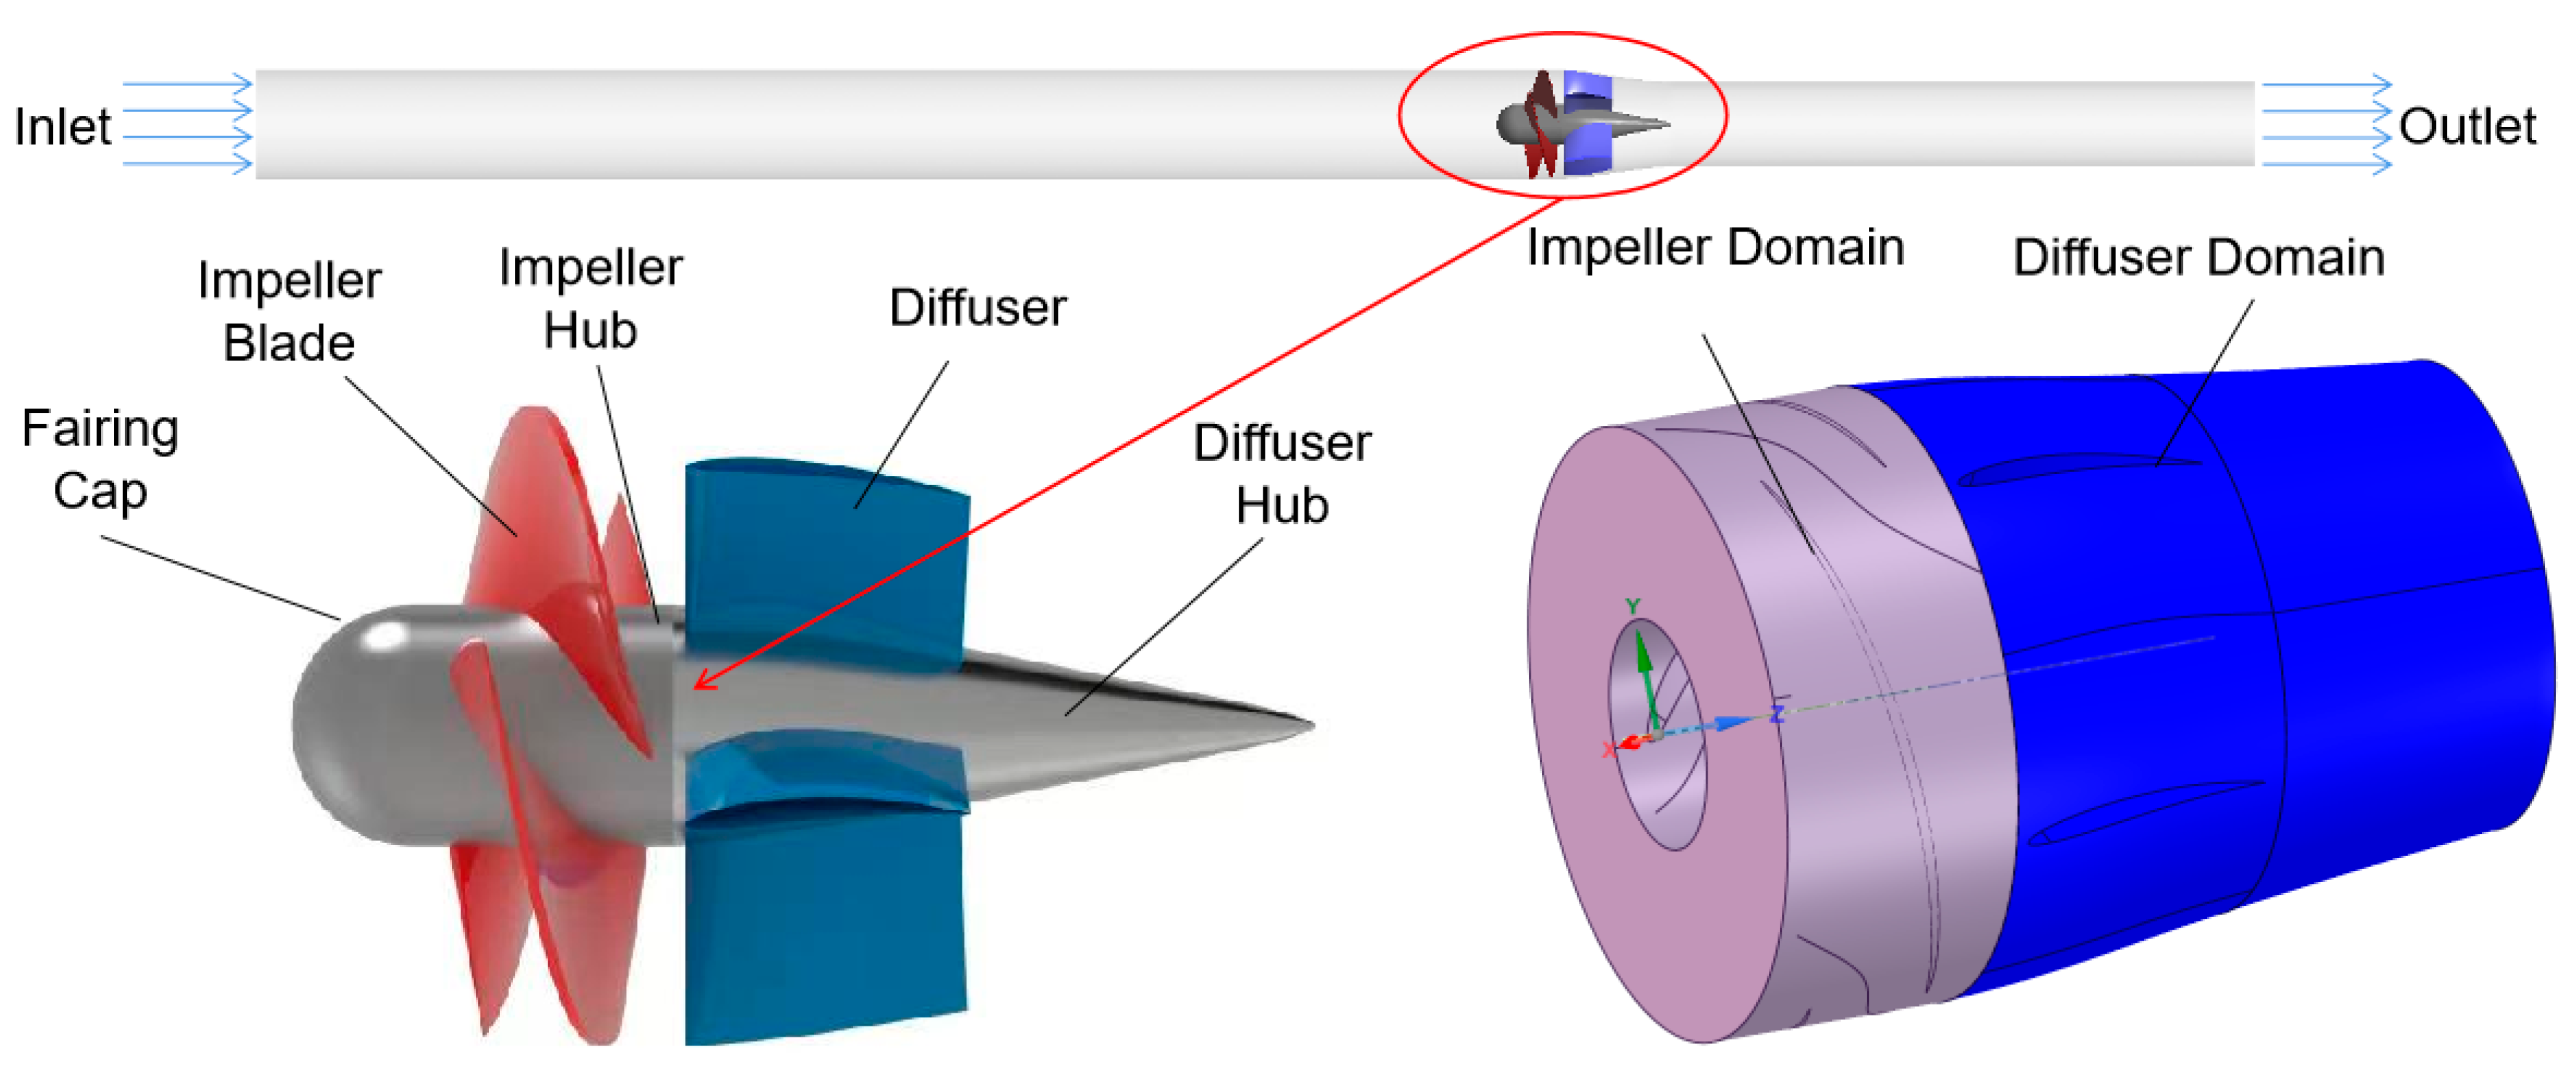
2. Calculation Model

Establishment of the Calculation Model

A high-speed pump-jet propeller is composed of three parts: an impeller, a diffuser, and an annular conduit. The basic parameters mainly include the diameter of the impeller shroud, D = 175 mm; the number of impeller blades, z1 = 3; the number of diffuser blades, z = 5; and the design speed, n = 18,000 r/min. The calculation domain of the model includes four parts, namely the inlet extension section, the impeller, the diffuser, and the outlet extension section, in which the inlet extension section is 10 D and the outlet extension section is 5 D. This is because the longer the set length of the inlet section in the simulation, the smaller the outlet reflux, and the faster the convergence rate. D is the impeller diameter. The three-dimensional calculation model is shown in Figure 1.

3. Numerical Simulation and Boundary Conditions

3.1. Turbulence Model

In this paper, taking into account the transmission of the turbulent shear stress, the k–ω equation of the SST model was used to accurately predict the beginning of the flow and the extent of fluid separation under negative pressure gradient, without over-predicting the eddy viscosity [27], and therefore this equation is suitable for the calculation of the parameters of the high-speed pump-jet propeller.
t ( ρ k ) + x j ( ρ k u j ) = x j ( Γ k k x j ) + P k Y k
t ( ρ ω ) + x i ( ρ ω u i ) = x j ( Γ ω ω x j ) + P ω Y ω + D ω
where k is the turbulent kinetic energy; ω is the dissipation rate; P k ,   P ω   is the generation term of the turbulent kinetic energy; D ω   is the diffusion term; Y k , Y ω is the turbulent viscosity; t is the time; u i , u j is the average turbulent velocity; x i , x j is the coordinate component; and Γ k , Γ ω is the effective diffusion coefficient.
For the cavitation flow, the density of the gas–liquid two-phase mixed medium in the impeller domain changes greatly, and the mixed phase density ρm has a certain influence on the turbulent viscosity coefficient. The turbulent viscosity coefficient μt is modified by modifying the density function ƒ(ρm), which is determined as follows:
ρ m = α v ρ v + ρ 1 ( 1 α v )
ƒ ( ρ m ) = ρ v + ( ρ m ρ v ) n ( ρ 1 ρ v ) 1 n
μ t = ƒ ( ρ m ) C μ k 2 ω
where ρm is the mixed phase density; αv is the gas-phase volume fraction; ρv and ρl are the density of gas and liquid phases, respectively; C μ is the viscosity coefficient, which is 1; k is the turbulent kinetic energy; and ω is the turbulent frequency. If the correction coefficient n is appropriate, the value can be effectively reduced, and the phenomenon of unsteady cavitation shedding in the impeller domain can be accurately simulated.

3.2. Cavitation Model

The Zwart cavitation model was used to establish the governing equation, which involves a mixture of water and steam containing a large number of steam bubbles [28]. The vapor-phase volume fraction is expressed by calculating the mass transfer rate of the vapor and liquid. The equations for the condensation term (m+) and the evaporation term (m) are, respectively, expressed as follows:
ρ v α v t + · ( ρ v α v u i ) = m + m
m + = C p 3 α v ρ v R b ( 2 3 · p p v p 1 ) 1 2 ,   p > p v ;
m = C d 3 α n ( 1 α v ) ρ v R b ( 2 3 · p p v p 1 ) 1 2 ,   p < p v ;
where pv is the saturated vapor pressure, and the value is 3169 Pa; Rb is the cavity radius, and the value is 1 × 10⁻⁶ m; αn is the volume fraction of the cavitation nucleon, and the value is 5 × 10⁻⁴; and C p and C d are the condensation coefficient and the evaporation coefficient, which are 0.01 and 50, respectively.

3.3. Boundary Conditions

The commercial software Fluent 2020R2 was used for the numerical simulation of the high-speed pump-jet propeller. The model for the cavitation analysis of gas–liquid two-phase flow was a homogeneous flow model. The water and vapor phases were considered homogeneous fluid media with the same velocity field and pressure field. The SST k–ω turbulence model combined with the Zwart cavitation model was adopted to establish the governing equation. The setting of the boundary conditions is very important for the reliability of the calculation results. Therefore, the boundary conditions of the high-speed pump-jet propeller were set as follows: Considering the actual situation, in the steady numerical simulation calculation, the impeller region was set as the rotating region, whereas the diffuser region, the inlet region, and the outlet region were set as the stationary region. The inlet boundary condition was set to “total pressure”, and the outlet boundary condition was set to the “normal speed” outlet. The convergence accuracy was set to 10−4. The interface between the rotating and stationary components was set to “transient frozen rotor interface” in the transient calculation. Two grid interfaces were generated before the inlet and after the outlet of the impeller to simulate the flow field with dynamic and stationary interference. The Rayleigh–Plesset bubble dynamic homogeneous flow model was used to simulate the occurrence and collapse of cavitation [29]. The specific numerical simulation was performed in three steps: Firstly, the simulation of the steady flow field inside the high-speed pump-jet propeller was carried out, and the reference pressure was set as a standard atmospheric pressure; cavitation was not considered in the steady calculation. Then, the cavitation simulation of the high-speed pump-jet propeller was carried out using the mixture flow model with the simulated steady flow field considered the initial condition. Finally, the cavitation simulation result was used as the initial value, and the instantaneous equation was discretized using the finite volume method, with every 1° rotation of the impeller considered a time step. In order to improve the convergence accuracy, the difference in the total pressure at the inlet and outlet of the high-speed pump-jet propeller was determined to monitor the state of the propeller. When the difference was less than 0.1%, the flow field was considered to be stable. On this basis, a periodic calculation was carried out, and the simulation results of the last cycle were obtained for analysis.

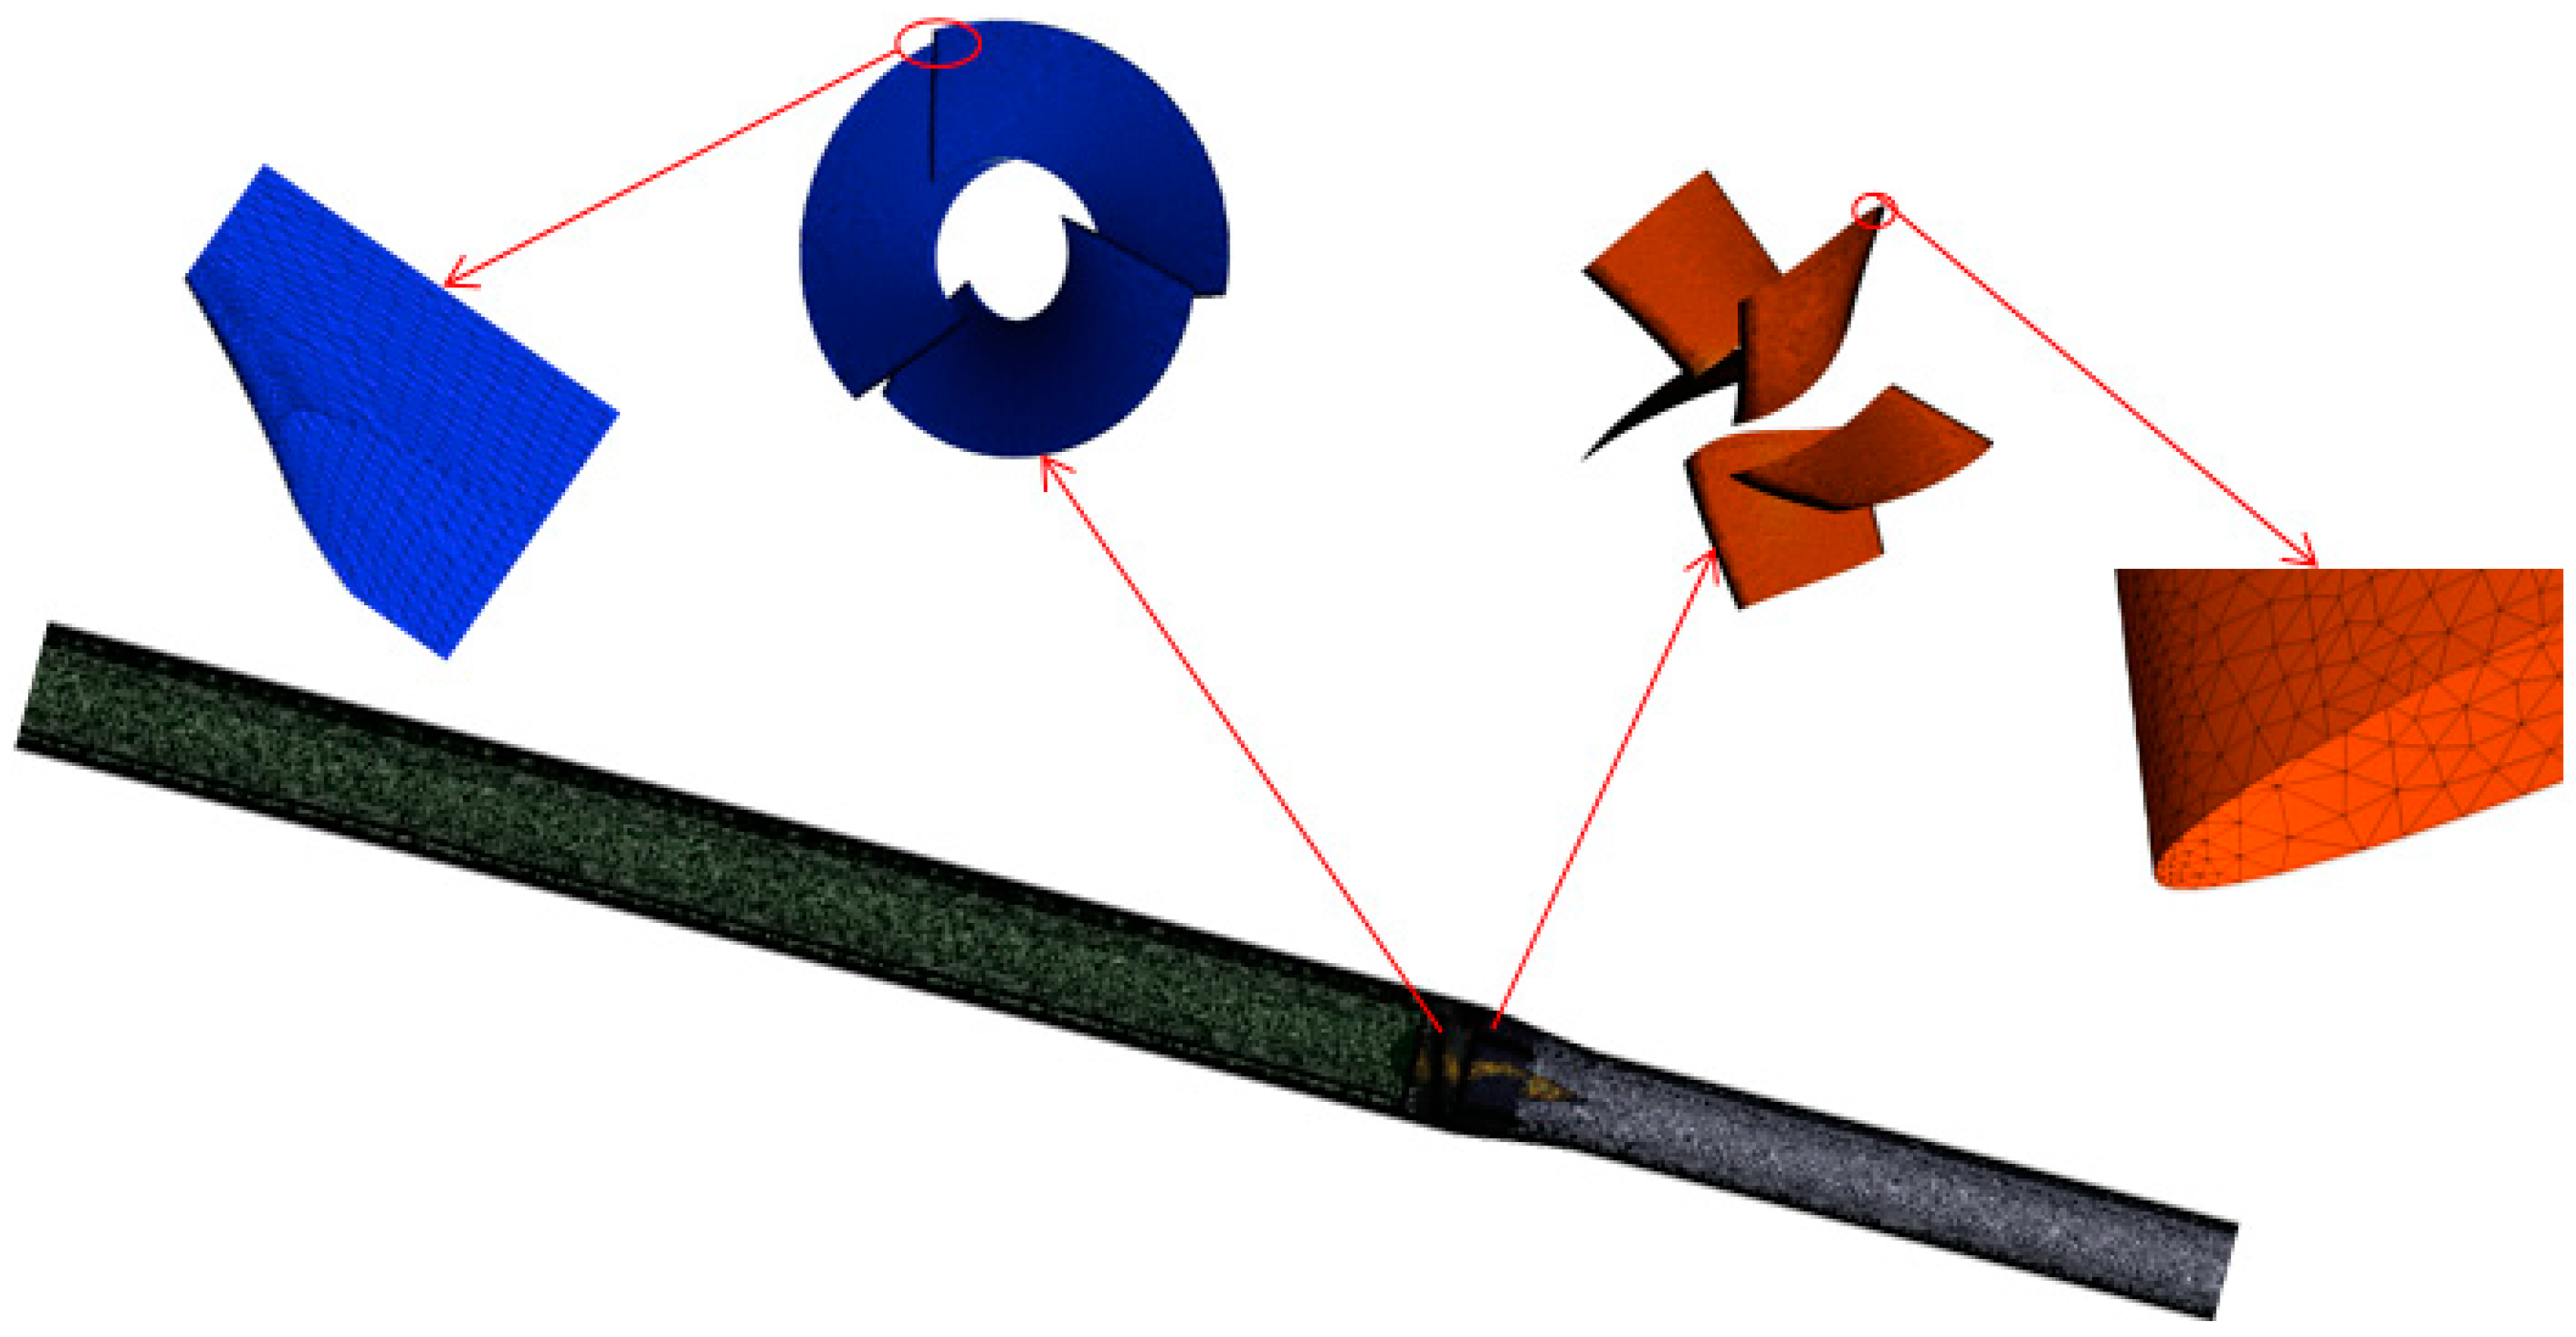
3.4. Grid Division and Grid Independence Test

A tetrahedral mesh was used to divide the grid, and the impeller and diffuser were locally encrypted. Generally speaking, the more the number of grids, the more accurate the calculation results of pressure, shaft power, and efficiency. However, when the number of grids increases to a certain extent, the number of grids no longer has any influence on the above parameters. In order to verify the influence of the number of grids on the numerical simulation results and select an appropriate number of grids, we developed five different grid schemes for the whole basin model of the high-speed pump-jet propeller and considered the efficiency as the evaluation index to verify the grid independence. The five grid schemes and the calculation results are shown in Table 1. As can be seen from Table 1, with the increase in the number of grids, the efficiency increased from Scheme 1 to Scheme 4, increasing from 85.74% to 88.15%, with a large variation. Comparing the efficiency of Scheme 4 and Scheme 5, we found that it increased from 88.15% to 88.17%, and the grid number had little effect on the efficiency. Considering the calculation time and accuracy, Scheme 4 was selected to carry out the simulation calculation, in which the grid number of the inlet extension section was 1,463,765, the grid number of the impeller was 3,077,421, the grid number of the diffuser was 2,951,054, and the grid number of the outlet extension section was 1,277,839. The grid division for the calculation is shown in Figure 2.

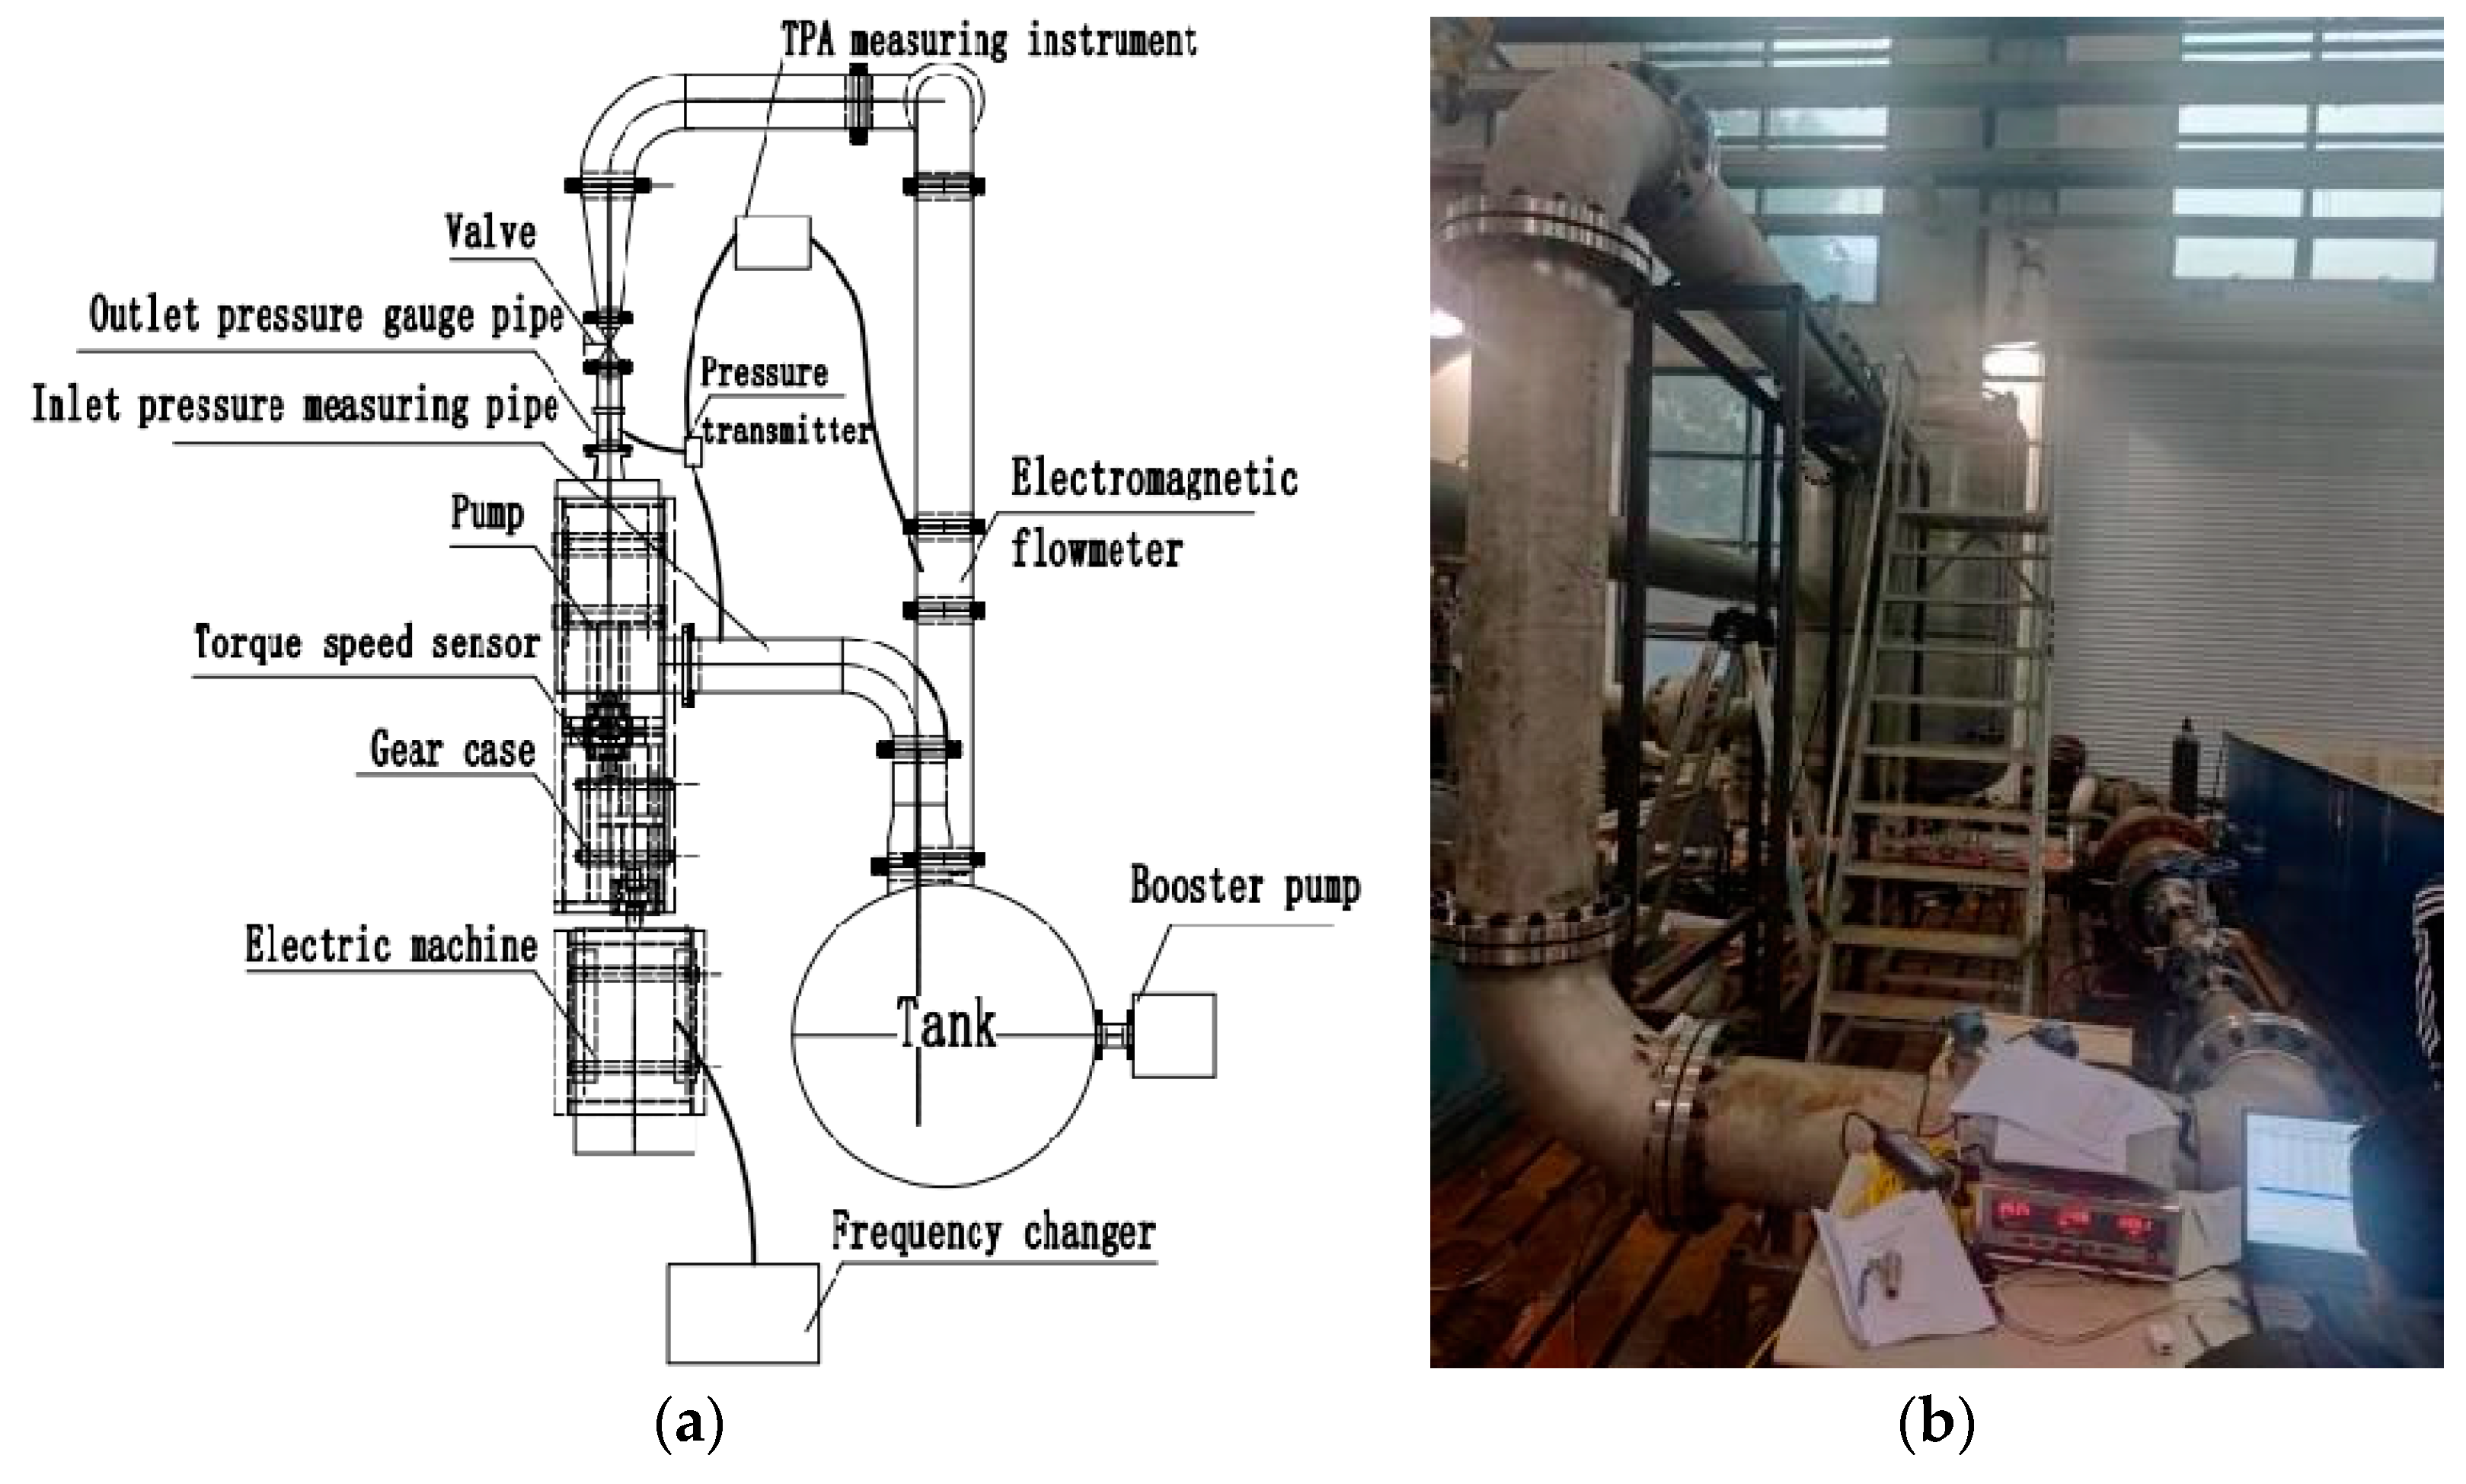
4. Experimental System and Experimental Method

4.1. Experimental System

A cavitation experiment of the high-speed pump-jet propeller was performed to determine the critical cavitation value. According to reference [21], five cavitation vacuoles were generated on the surface of the propeller, and these cavitation values were used to determine the critical cavitation value. Reference [22] defines the criterion for cavitation and quantitatively stipulates that the criterion for cavitation is a 3% decrease in the total pressure difference between the inlet and the outlet. Reference [22] is more suitable for guiding the experimental research work in this paper and can provide a quantitative decision threshold. The cavitation experiment was carried out on a closed experiment system, which mainly included a booster pump, a stabilizer tank, an electromagnetic flowmeter, a valve, inlet and outlet pressure measuring tubes, a pressure transmitter, a high-speed pump-jet propeller prototype, a torque speed sensor, a gearbox, a motor, a frequency converter, a TPA measuring instrument, etc. The power of the motor was 250 kW, and the speed was 2980 r/min. The gearbox transmission ratio was 1:6.5. The schematic diagram of the experiment system is shown in Figure 3a, and the physical diagram of the experiment system is shown in Figure 3b.

4.2. Experimental Methods and Results

After injecting water into the experiment system, the booster pump was started, the system was pressurized to 2.5 MPa, and then the motor was started, and the frequency of the inverter was adjusted to the rated speed of the pump-jet propeller. After the system stabilized, the TPA tester was started to collect and record the test values of flow, pressure, speed, torque, etc. At the same time, the TPA tester was also used to perform real-time calculation and analysis of the inlet and outlet pressure difference and fully determine the test values under the 2.5 MPa operating condition. Gradually, the pressure was reduced in the circulation pipeline, and several appropriate system pressure values were selected according to the change in experimental results within the pressure range of 2.5 MPa–0 MPa, and the above steps were repeated until the difference in the total pressure at the inlet and outlet dropped by 3%. The experimental results of the cavitation under different system pressures were obtained, and the cavitation experiment was completed. We only carried out the experiment under the 1.0 Q condition. Cavitation experimental results are shown in Figure 4.

5. Calculation Results and Analysis

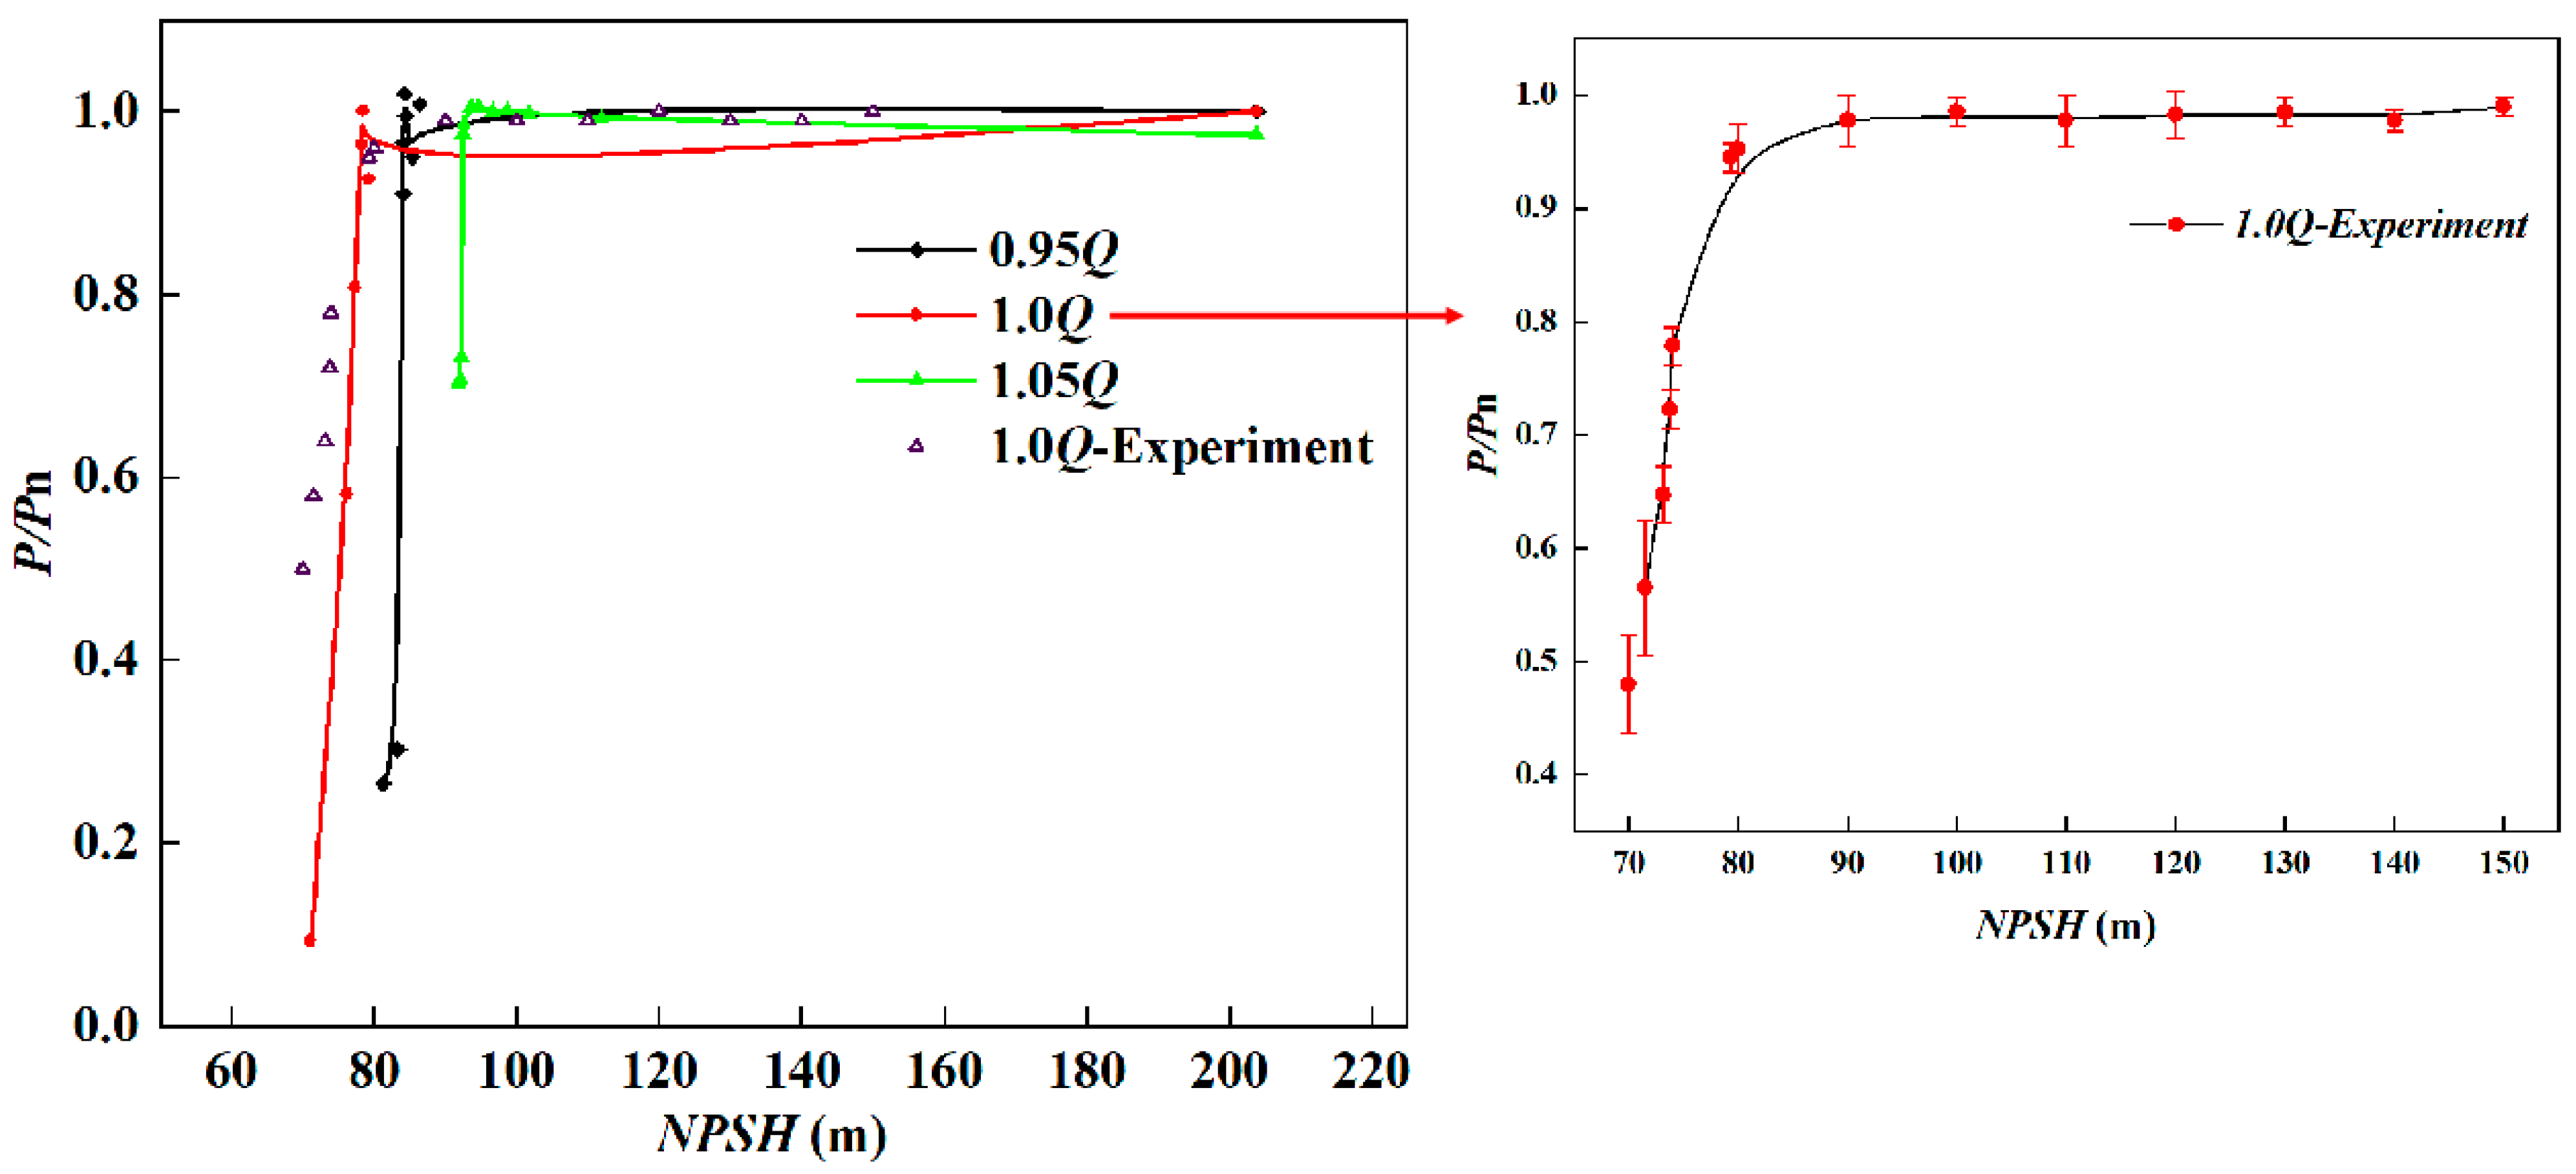
5.1. Cavitation Experiment and Analysis

When the internal pressure of the pump-jet propeller was lower than the vaporization pressure, vacuoles occurred in the flow channel. Therefore, the cavitation of the pump-jet propeller under three operating conditions of 0.95 Q~1.05 Q was calculated by continuously reducing the pressure and changing the NPSH. Figure 4 shows the change in the total pressure difference P/Pn between the inlet and outlet with NPSH under different operating conditions. The total pressure difference between the inlet and outlet of the experimental pump was reduced by 3%, and the corresponding NPSH is NPSHc. As can be seen in Figure 4, with the gradual reduction in the flow rate, the NPSHc value of the pump-jet propeller became increasingly lower, and the critical points of cavitation under the three conditions were 78.27 m, 84.14 m, and 92.46 m, respectively. In the actual operation of the pump-jet propeller, the appropriate reduction in the flow rate is conducive to improving the cavitation performance of the pump-jet propeller. Under the design condition, the NPSHc of the high-speed pump-jet propeller was 84.14 m. Near the critical cavitation point, the head of the high-speed pump-jet propeller decreased slightly, and once the NPSH was less than the NPSHc, serious cavitation occurred in the high-speed pump-jet propeller, and the impeller’s functional force on the fluid decreased, and the total pressure difference between the inlet and outlet decreased rapidly. A comparison of the experimental data at 1.0 Q with the simulation data revealed that the NPSHc of the experiment was 86.4 m, slightly higher than the simulated value. This is caused by the loss of the experiment device, and the experimental results verify the accuracy of the numerical simulation and provide a reference for subsequent transient cavitation simulation.

5.2. Cavity Change Characteristic Analysis

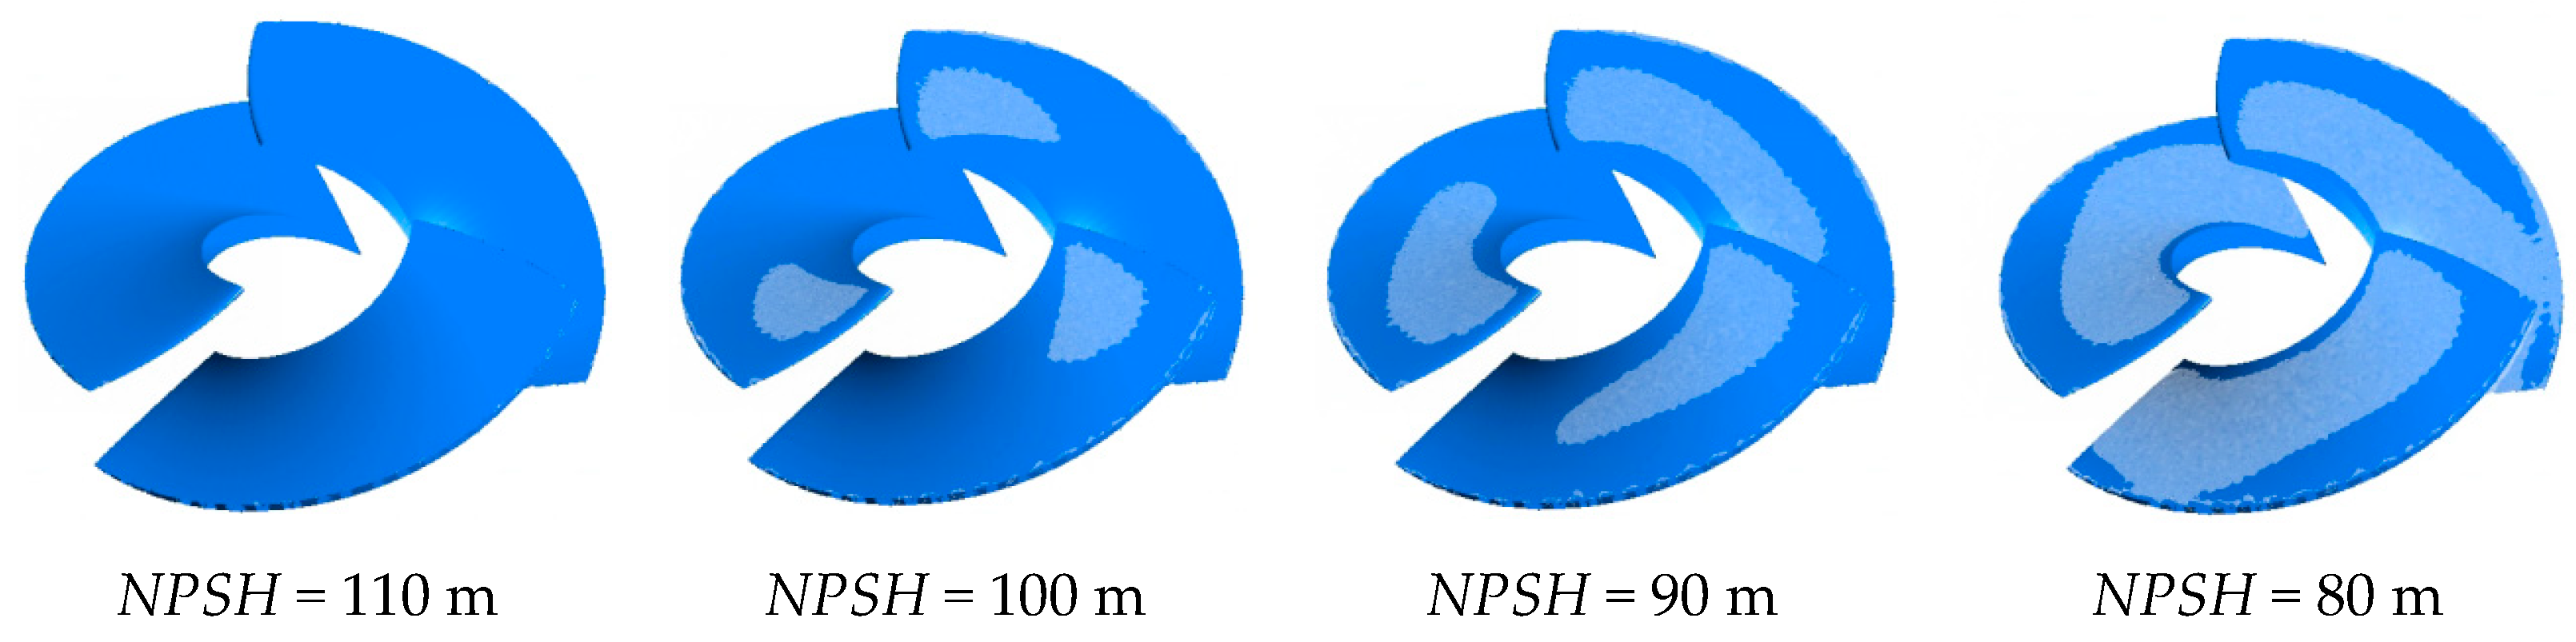
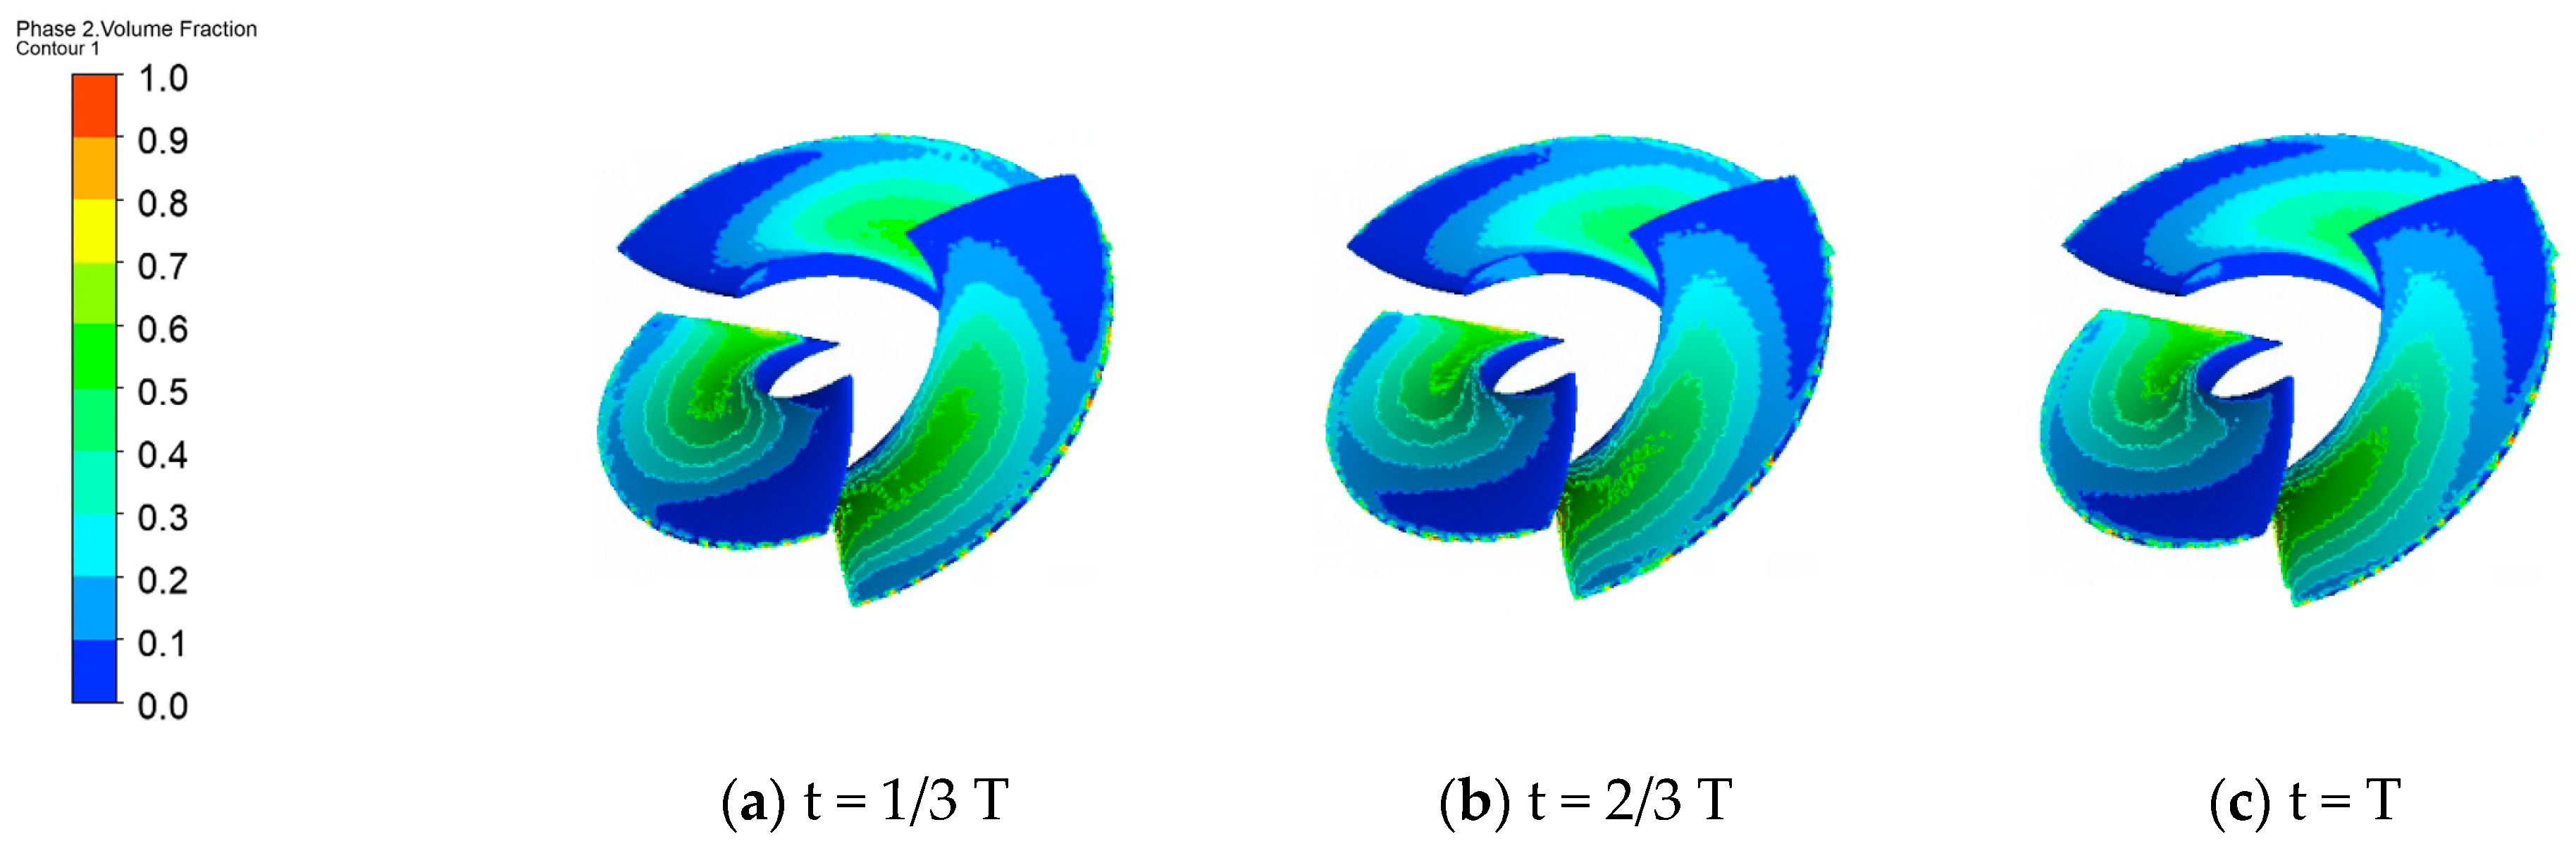
5.2.1. Change in the Impeller Cavity Volume Fraction

The proportion of the volume of cavitation vacuoles in a fluid is defined as the vacuole volume fraction. Table 2 shows the change in the vacuole volume fraction with the NPSH under three operating conditions. It can be seen from Table 2 that, when NPSH = 95 m, cavitation occurred first in the impeller at 1.05 Q. With the decrease in NPSH, the vacuole volume fraction gradually increased. When NPSH = 85 m, a small number of vacuoles appeared in the impeller at 1.0 Q, and when NPSH = 80 m, a small number of vacuoles appeared in the impeller at 0.95 Q. NPSH continued to decrease until NPSH = 60 m, when the cavity volume fraction under the three operating conditions was approximately equal, at which time serious cavitation occurred in the impeller. Due to the high pressure on the back of the impeller of the high-speed pump-jet propeller, there was basically no cavitation on the back of the impeller, and the cavitation was only concentrated on the suction surface of the impeller.

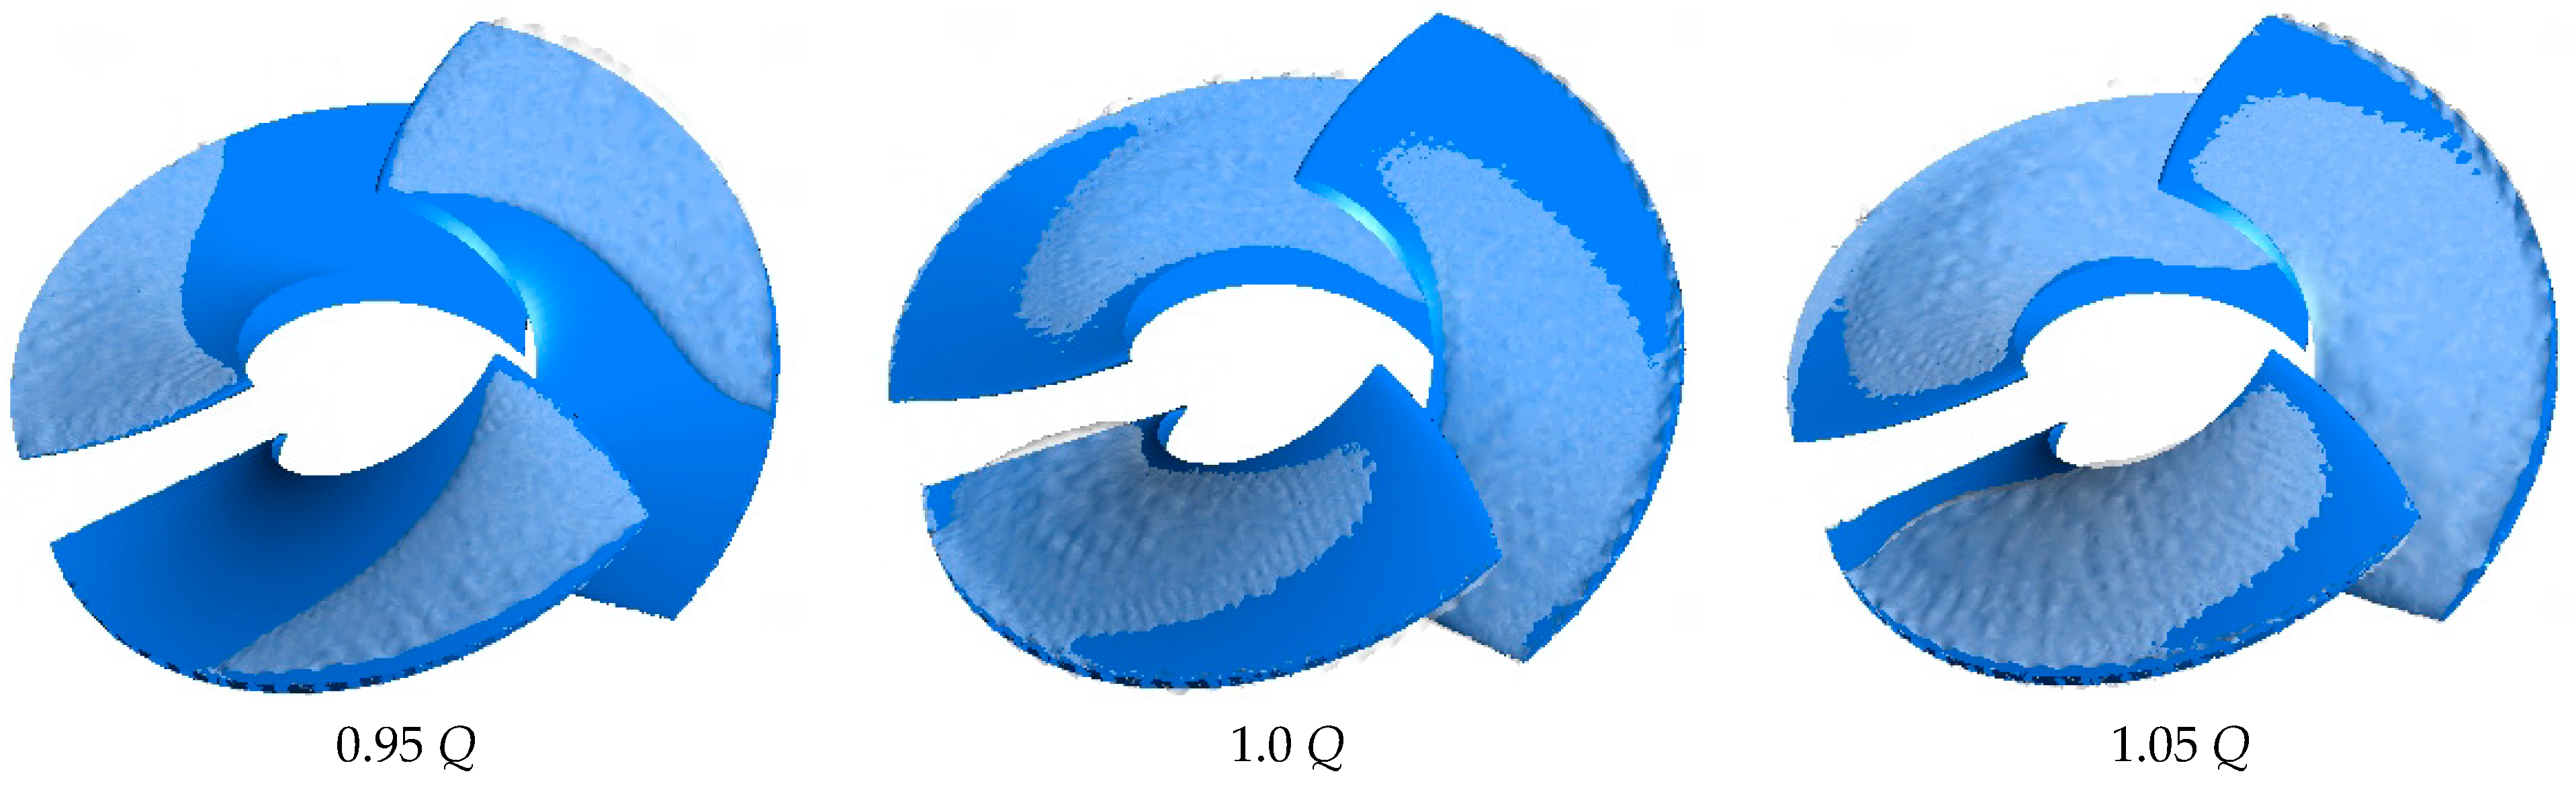
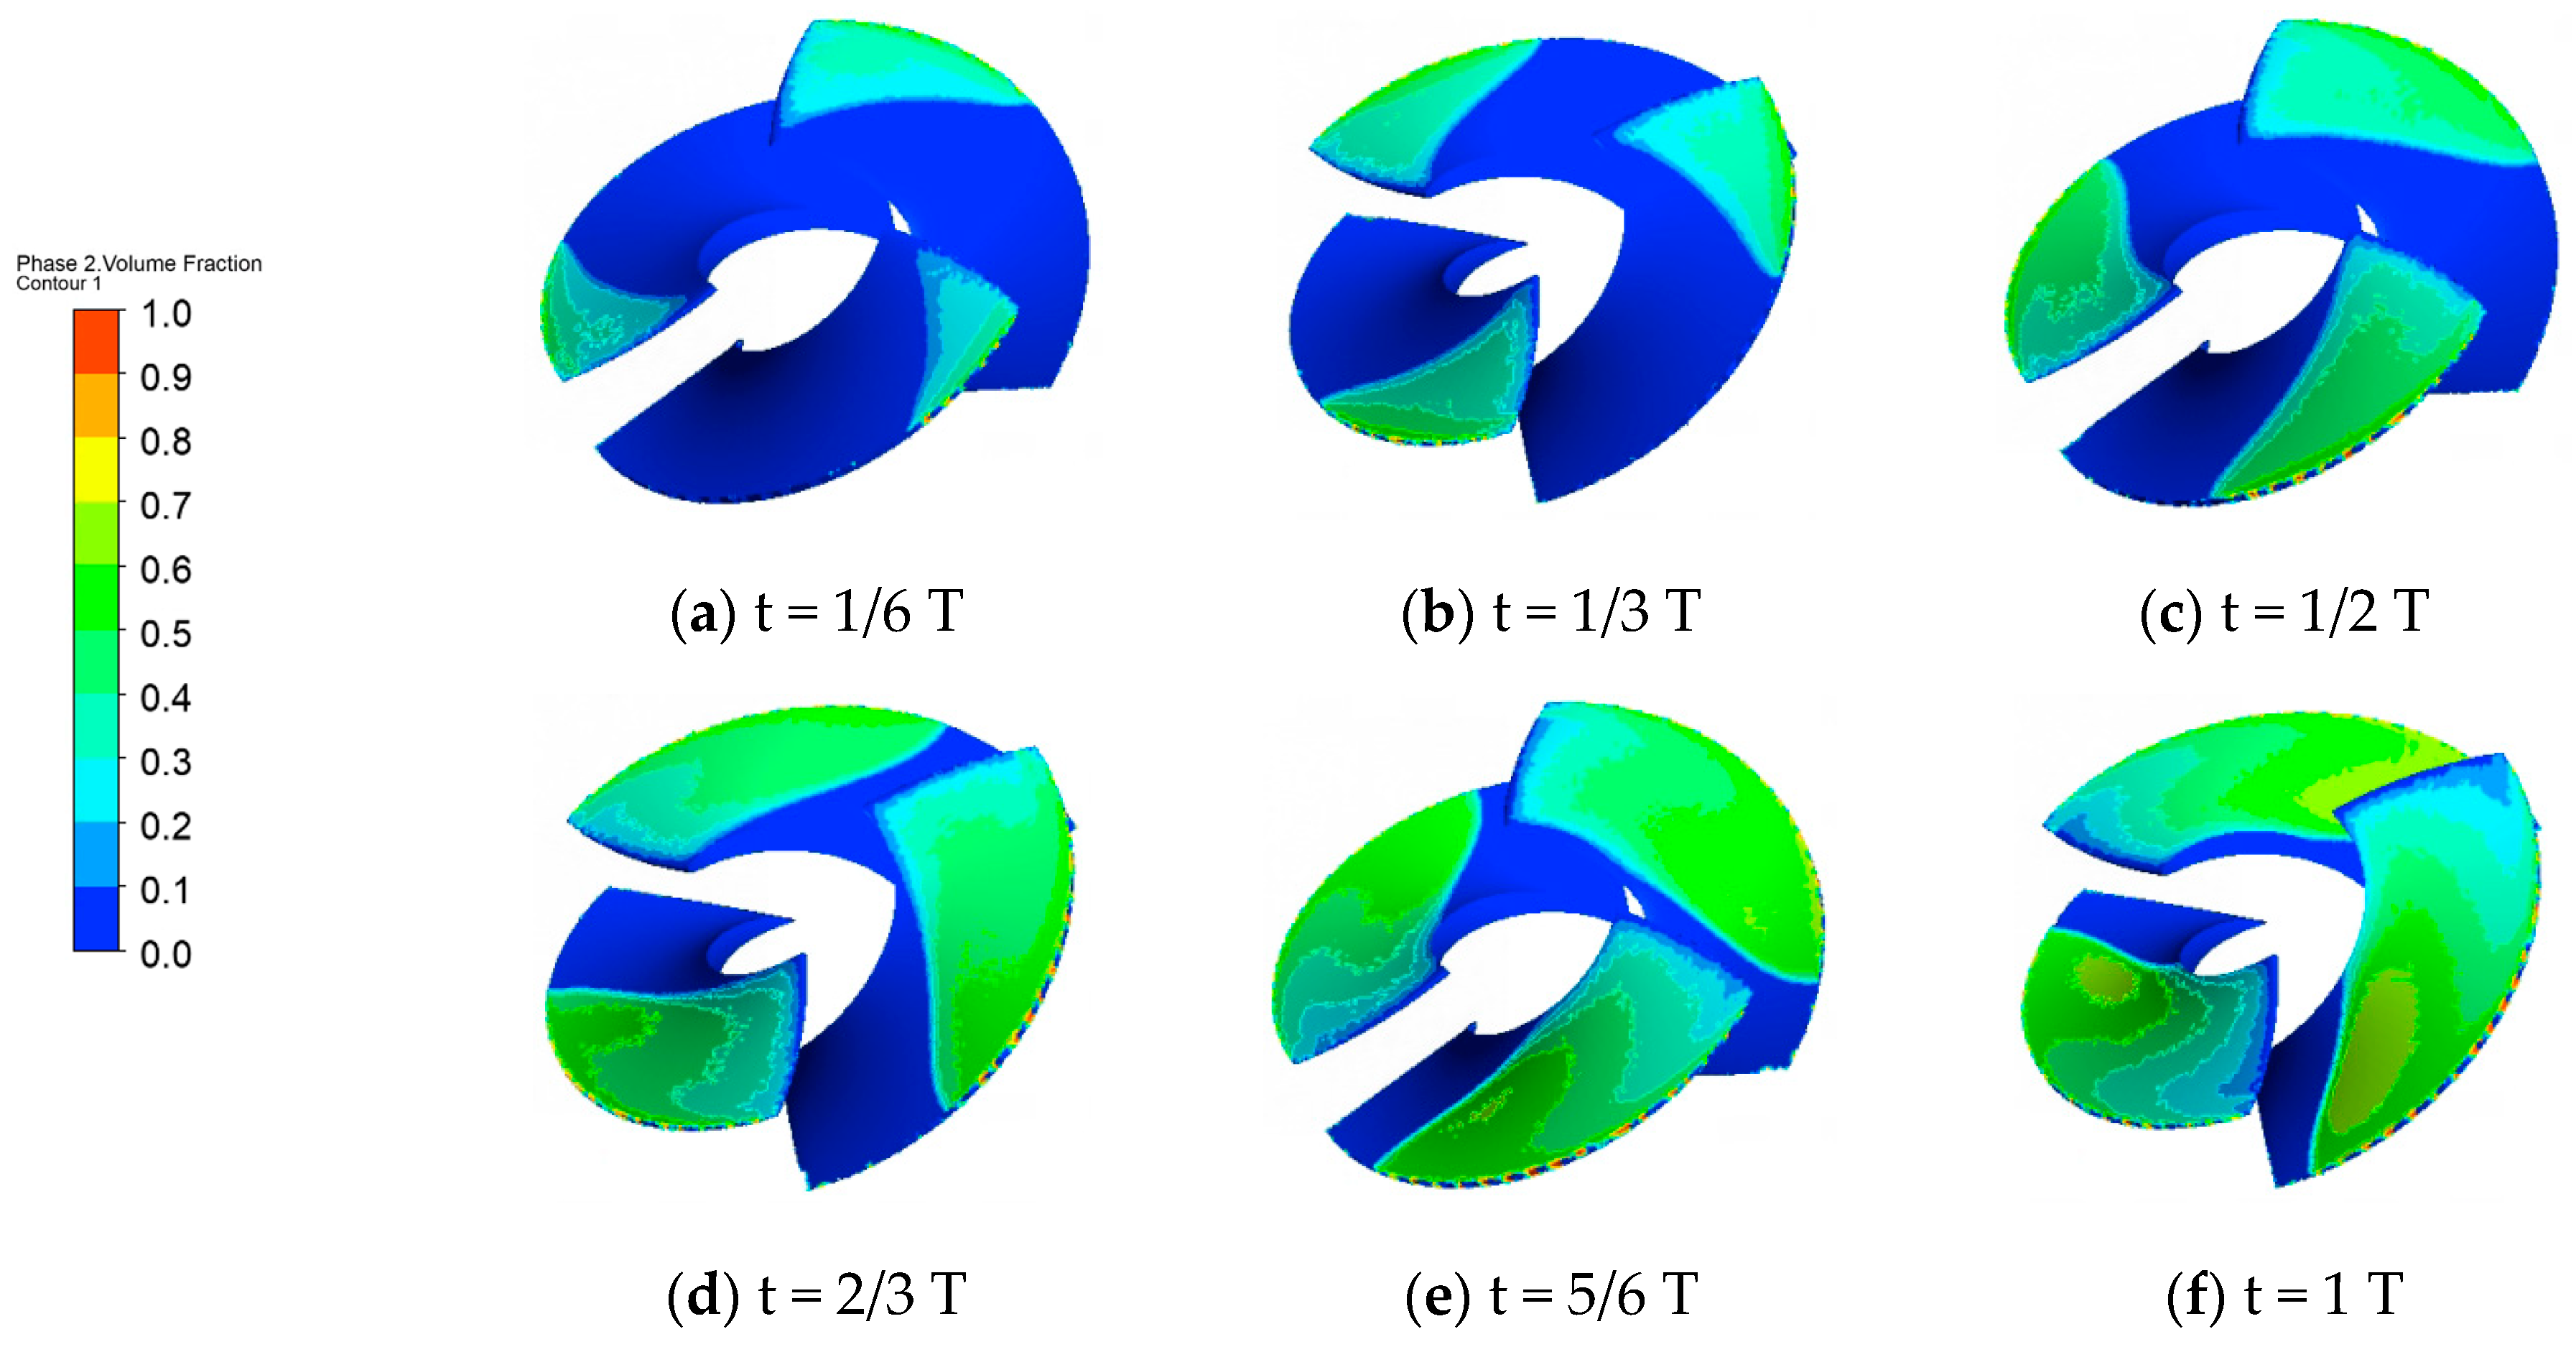
5.2.2. Cavitation Distribution of Impeller Blades

The share of the volume of vacuoles in the fluid is the vacuole volume fraction. Figure 5 shows the distribution characteristics of the vacuoles on the impeller of the high-speed pump-jet propeller under different NPSH values under the design condition.
Figure 6 shows the distribution characteristics of the vacuoles on the impeller of the high-speed pump-jet propeller under different operating conditions with an NPSH of 70 m.
Figure 5 clearly shows the cavitation of the impeller of the high-speed pump-jet propeller. In the beginning, the vacuoles were mainly concentrated at the inlet of the blades. With the decrease in NPSH, the cavitation region of the impeller gradually spread to the middle of the impeller, the content of large vacuoles gradually increased, and the area of the cavitation region further expanded. The cavitation phenomenon of the suction surface of the impeller under different NPSH values was analyzed. When NPSH = 110 m, the NPSH did not reach the NPSHc value, no vacuole was generated at this time, and the pump-jet propeller ran under stable conditions at this time. When the NPSH decreased to 100 m, the NPSH reached the NPSHc value, so cavitation occurred at the inlet of the impeller. When the NPSH continued to decrease until it reached 90 m, the cavitation started from the inlet edge and spread to the whole blade. When NPSH = 70 m, the cavitation area basically covered the whole blade. When the NPSH value continued to decrease, cavitation became more and more serious, and it eventually blocked the flow channel. Thus, the operation of the pump-jet propeller was affected.
As can be seen from Figure 6, when the NPSH was 70 m, and the flow rate was 0.95 Q, the impeller was in the stage of cavitation development, and the cavitation phenomenon had not yet spread to the entire blade. With the increase in the flow rate, it can be seen that the vacuoles gathered at the outlet of and the middle of the impeller, and the impeller underwent serious cavitation.

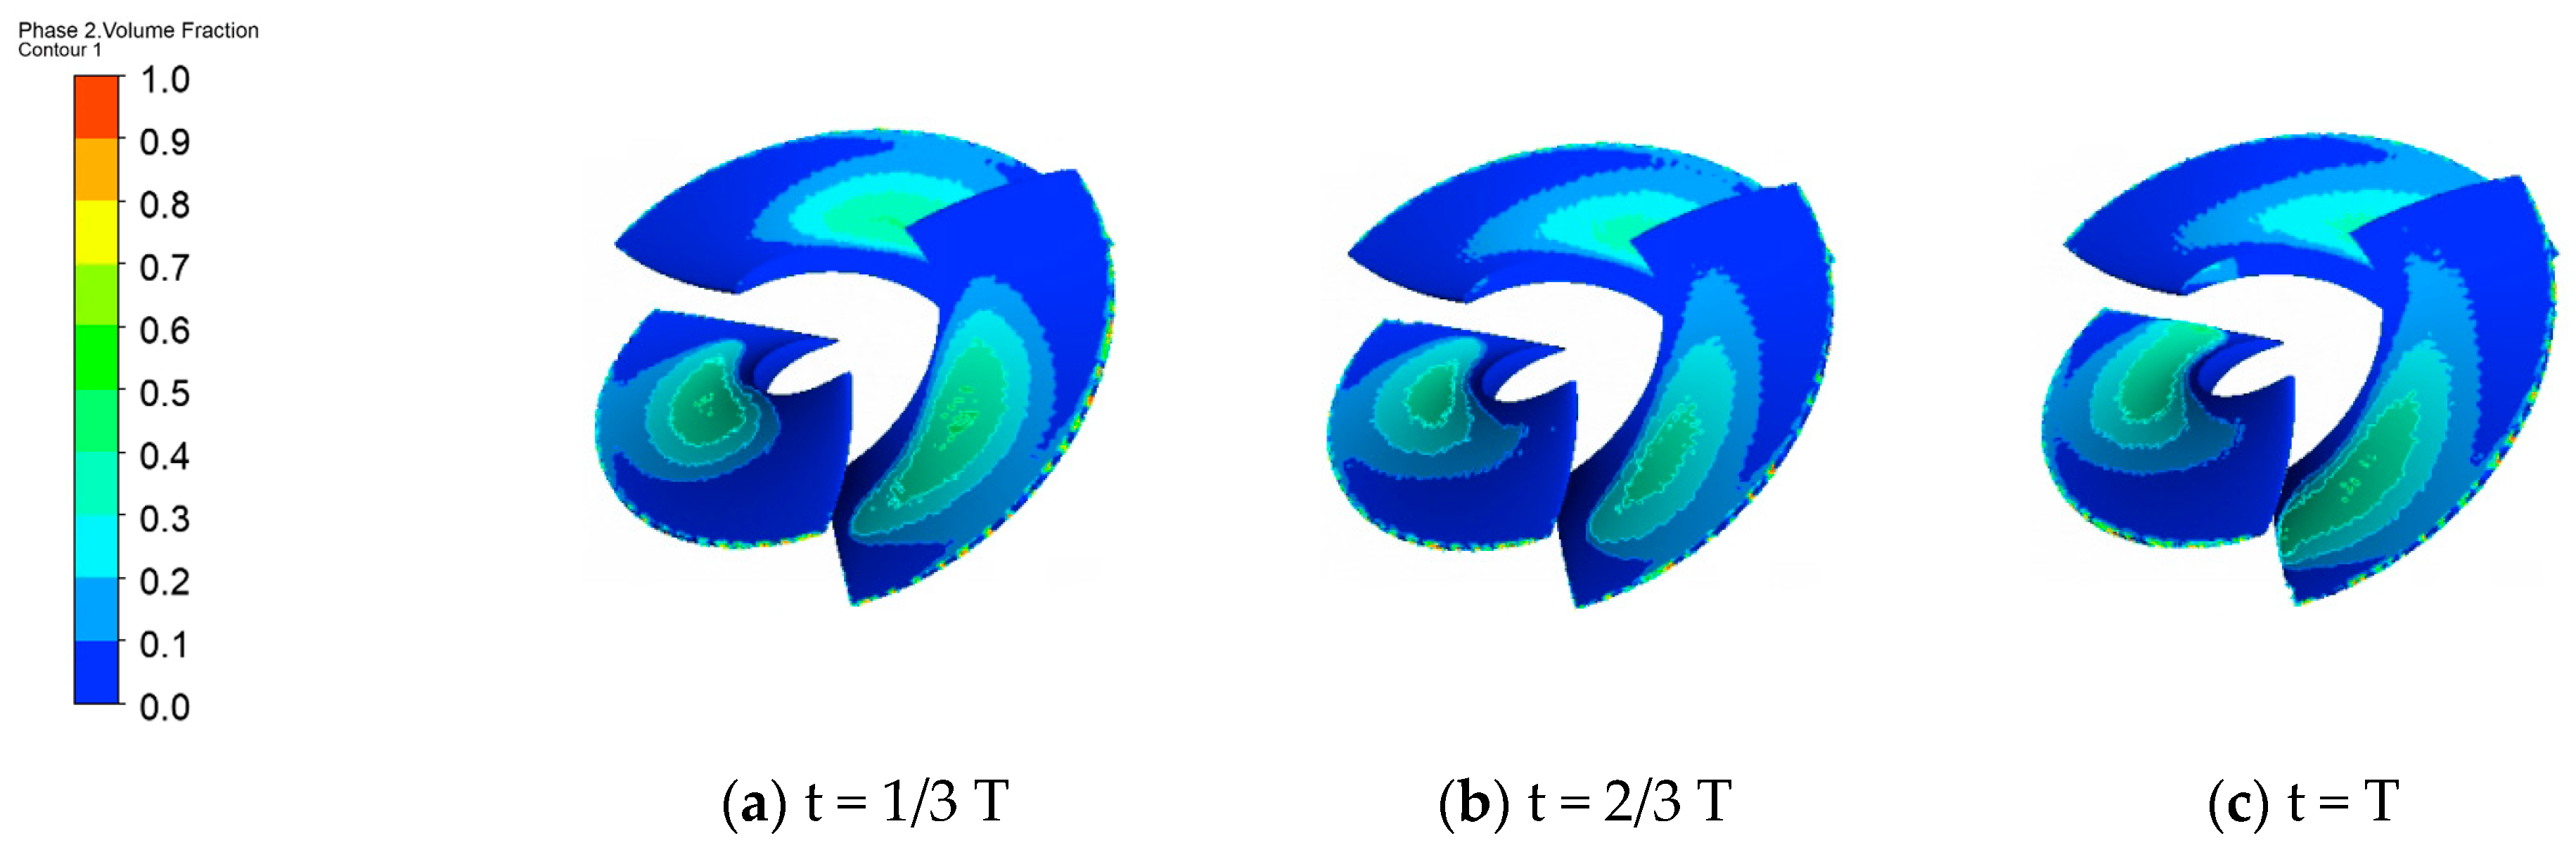
5.2.3. Characteristics of Cavitation Changes in Impeller Blades

Figure 7, Figure 8 and Figure 9 show the changes in the surface vacuoles of the blade when NPSH = 70 m.
Compared with a set of figures under 0.95 Q, the process of vacuole development of the impeller can be clearly observed: At 1/6 T, cavitation first occurred at the inlet edge and the shroud of the pump-jet propeller impeller blades. This is because the inlet edge of the blade was greatly affected by the inlet flow, and the speed at the inlet was large, resulting in low pressure. This ultimately caused the inlet edge of the pump-jet propeller blade to be prone to cavitation. From the root of the blade to the shroud of the blade, the circular velocity of the fluid increased gradually, and the circular velocity reached its peak at the tip clearance, where the pressure dropped sharply until the critical cavitation pressure was reached, and cavitation occurred at the tip of the blade. Until 1/2 T, which is the stage of cavitation development, the vacuoles slowly spread backward, the content of large-volume vacuoles increased slowly, and the total coverage area of the vacuoles expanded slightly. In this stage, the cavitation phenomenon became more obvious, and after this, large vacuoles began to flow rapidly toward the outlet, and by the end of the cycle, the vacuoles were fully developed. At this time, the vacuoles basically occupied the entire blade, the flow channel was blocked, and cavitation was serious.
Comparing the two sets of diagrams at 1.0 Q and 1.05 Q flow, it can be inferred that, when NPSH = 70 m, the vacuoles covered more than half of the impeller, and the vacuoles fell off at the inlet of the impeller; at this time, cavitation was extremely serious.
By analyzing and comparing the phenomena at different times and under different operating conditions, it was found that even though the three flow points selected were similar, the total area of the vacuole distribution at the same time was very different. This is because the pump-jet propeller selected in this paper has a higher specific speed, and even a small flow difference will lead to a large deviation of kinetic energy. Therefore, we analyzed the 50% spanwise surface velocity vector diagram of the impeller.
As can be seen from the 50% spanwise surface velocity vector diagram of the impeller in Table 3, the surface velocity of the impeller increased rapidly with the increase in the flow rate. The effect of centrifugal force increased rapidly, and when the flow rate reached 1.05 Q, the high-speed area almost covered the entire impeller, which inevitably led to a significant reduction in the surface pressure of the impeller, thus accelerating the generation of vacuoles. In high-speed pump-jet propellers, the uneven distribution of fluid velocity can lead to a high local flow rate, resulting in a local pressure drop. When the fluid velocity exceeds a certain threshold, a local low-pressure area is formed, which promotes the cavitation of the fluid. It can be clearly seen from Table 3 that, at 0.95 Q, an obvious high-speed zone was formed at the inlet of the impeller suction surface, which easily led to cavitation. At 1.0 Q and 1.05 Q, the overall velocity of the impeller increased further, and the high-speed region spread to the suction surface of the entire impeller, which inevitably led to a more serious cavitation phenomenon. By comparing the velocity cloud map at 0.95 Q with the cavitation distribution map in Figure 7, it can be clearly seen that, with the change in time from 1/6 T to T, the high-speed region of the impeller gradually diffused from the inlet of the impeller suction surface to the middle. Correspondingly, cavitation also gradually diffused from the inlet of the suction surface of the impeller to the middle of the impeller, eventually covering more than half of the impeller.
It can be seen from the above analysis that, in the transient cavitation simulation calculation under the same inlet pressure, the NPSH value at 0.95 Q was much smaller than the other two conditions, and the mass cavitation content was also small. Therefore, in the design process of the blades of high-speed pump-jet propellers, the cavitation performance of the blades can be greatly improved by properly reducing the flow rate. At the same time, in the design and optimization process of the pump, attention should be paid to controlling the fluid velocity distribution to avoid excessive local flow to reduce the risk of cavitation.

6. Conclusions

By using the SST k–ω turbulence model and the Zwart cavitation model, the calculation of the unsteady flow field of the model pump under different cavitation states was carried out, and the evolution process of the vacuoles in the impeller channel under three flow conditions was explored. The conclusions are as follows:
(1) With the decrease in NPSH, cavitation first appeared near the shroud and inlet edge of the impeller blades. When NPSH dropped to the critical cavitation point, the volume of the vacuole region grew rapidly, the content of large-volume vacuoles increased exponentially, and the impeller began to enter a state of severe cavitation. Then, the cavitation region spread to the outlet of the impeller, and the cavitation eventually blocked the impeller flow path.
(2) The blade at the inlet had not yet operated, and the pressure was mainly affected by the inflow condition. From the twisting of the blades, it can be seen that the impeller blades near the hub side were closer to the inlet and were greatly affected by the incoming flow. Therefore, cavitation is more likely to occur near the hub side at the high-speed pump-jet propeller inlet, and it is recommended to improve this phenomenon by selecting an appropriate blade placement angle during its design.
(3) When NPSH dropped to 95 m, the impeller cavitation first occurred under the 1.05 Q operating condition, and the impeller cavitation volume fraction was 0.0379525. When NPSH dropped to 85 m, the impeller cavitation occurred under the 1.0 Q operating condition, and the impeller cavitation volume fraction was 0.0185164. When NPSH dropped to 80 m, the impeller cavitation occurred under the condition of 0.95 Q, and the volume fraction of the impeller cavitation was 0.013541. The high-speed pump-jet propeller had better anti-cavitation ability at a small flow rate. As NPSH continued to decrease, serious cavitation occurred in the impeller under the three operating conditions, and the volume fraction of the impeller’s cavitation was approximately equal. The cavitation distribution law under the three operating conditions is the same. Under the condition of 0.95 Q, the NPSH of the impeller was low, and the anti-cavitation performance was good. When no serious cavitation occurred, with the same inlet pressure, numerical calculations revealed that the mass vacuole content on the blade surface under 0.95 Q was less than that under 1.0 Q and 1.05 Q. It is suggested that a small flow rate should be considered in the design of high-speed pump-jet propellers, which will reduce the NPSHc to a certain extent and improve the anti-cavitation performance of high-speed pump-jet propellers.
(4) By analyzing and comparing the phenomena at different times and under different operating conditions, it was found that, even though the three selected flow points were similar, there were significant differences in the total area of bubble distribution at the same time. This is because the pump-jet propeller selected in this article has a high specific speed, and even a small flow difference can lead to significant kinetic energy deviation. In the design and optimization process of pumps, attention should be paid to controlling the distribution of fluid velocity to avoid excessive local flow and reduce the risk of cavitation.
In this paper, the variation in the volume fraction of cavitation in the impeller was discussed, and the characteristics of cavitation distribution under different operating conditions and the change law of cavitation with time were explored. The above conclusions provide a reference for the further study of cavitation performance and parameter design of high-speed pump-jet propellers. However, the current work is still inadequate. Firstly, cavitation is related to vapor pressure and corresponding temperature. If another temperature is chosen, cavitation may be reduced. At present, no relevant research was carried out regarding this aspect. Secondly, we did not carry out optimization and multiparameter impact analysis. Finally, we did not study high-speed pump-jet propellers under variable operating conditions. In the future, we plan to carry out research on high-speed pump-jet propellers at different ambient temperatures, with more parameters, conduct performance optimization, and analyze the system under variable conditions.

Author Contributions

Methodology, G.G.; Software, W.S.; Investigation, J.Y.; Resources, Q.F. and R.Z.; Data curation, Y.D.; Writing – original draft, W.S.; Funding acquisition, G.G. All authors have read and agreed to the published version of the manuscript.

Funding

This study was funded by the National Natural Science Foundation of China (U20A20292).

Conflicts of Interest

The authors declare no conflict of interest.

References

  1. Sbragio, R.; Moura, A.J.d.S.; da Silva, R.C. Design and Cfd Self-Propulsion Analysis of A Ducted Propeller for A Darpa Suboff Hull Autonomous Underwater Vehicle. In Proceedings of the International Conference on Ocean, Offshore and Arctic Engineering, Online, 3–7 August 2020. [Google Scholar]
  2. Xia, C.Z.; Cheng, L.; Shang, Y.N.; Zhou, J.R.; Yang, F.; Jin, Y. Numerical simulation on the cavitation of waterjet propulsion pump. Iop Conf. 2016, 129, 012011. [Google Scholar] [CrossRef]
  3. Rakibuzzaman; Kim, K.; Suh, S.-H. Numerical and experimental investigation of cavitation flows in a multistage centrifugal pump. J. Mech. Sci. Technol. 2018, 32, 1071–1078. [Google Scholar] [CrossRef]
  4. Yuan, Z.; Zhang, Y.; Zhang, J.; Zhu, J. Experimental studies of unsteady cavitation at the tongue of a pump-turbine in pump mode—ScienceDirect. Renew. Energy 2021, 177, 1265–1281. [Google Scholar] [CrossRef]
  5. Hu, F.; Chen, T.; Wu, D.; Wang, L. Experiment study of cavitation induced vibration and noise of guide vane mixed flow pump. J. Drain. Irrig. Mach. Eng. 2013, 31, 1021–1024. [Google Scholar]
  6. Al-Obaidi, A.R.; Mishra, R. Experimental investigation of the effect of air injection on performance and detection of cavitation in the centrifugal pump based on vibration technique. Arab. J. Sci. Eng. 2020, 45, 5657–5671. [Google Scholar] [CrossRef]
  7. Al-Obaidi, A.R. Experimental comparative investigations to evaluate cavitation conditions within a centrifugal pump based on vibration and acoustic analyses techniques. Arch. Acoust. 2020, 45, 541–556. [Google Scholar]
  8. Al-Obaidi, A.R. Experimental investigation of cavitation characteristics within a centrifugal pump based on acoustic analysis technique. Int. J. Fluid Mech. Res. 2020, 47, 501–515. [Google Scholar] [CrossRef]
  9. Al-Obaidi, A. Experimental and Numerical Investigations on the Cavitation Phenomenon in a Centrifugal Pump. Ph.D. Dissertation, University of Huddersfield, Huddersfield, UK, 2018. [Google Scholar]
  10. Lu, Y.; Tan, L.; Han, Y.; Liu, M. Cavitation-vibration correlation of a mixed flow pump under steady state and fast start-up conditions by experiment. Ocean Eng. 2022, 251, 111158. [Google Scholar] [CrossRef]
  11. Thamsen, P.U.; Bubelach, T.; Pensler, T.; Springer, P. Cavitation in Single-Vane Sewage Pumps. Int. J. Rotating Mach. 2008, 2008, 354020. [Google Scholar] [CrossRef]
  12. Chai, L.; Li, S.; Hu, H.; Ye, H. Analysis of impeller geometric parameters affecting the centrifugal pump cavitation performance based on CFD simulations. In Proceedings of the 6th International Symposium on Fluid Machinery and Fluid Engineering, Wuhan, China, 22–25 October 2014. [Google Scholar]
  13. Qiu, C.; Huang, Q.; Pan, G.; Shi, Y.; Dong, X. Numerical simulation of hydrodynamic and cavitation performance of pumpjet propulsor with different tip clearances in oblique flow. Ocean Eng. 2020, 209, 107285. [Google Scholar] [CrossRef]
  14. Wang, B.-L.; Liu, Z.-H.; Li, H.-Y.; Wang, Y.-Y.; Liu, D.-C.; Zhang, L.-X.; Peng, X.-X. On the numerical simulations of vortical cavitating flows around various hydrofoils. J. Hydrodyn. Ser B 2017, 29, 926–938. [Google Scholar] [CrossRef]
  15. Hu, Q.; Yang, Y.; Shi, W.; Cao, W.; Shi, Y. Cavitating Flow in the Volute of a Centrifugal Pump at Flow Rates Above the Optimal Condition. J. Mar. Sci. Eng. 2021, 9, 446. [Google Scholar]
  16. Ji, B.; Luo, X.; Wang, X.; Peng, X.; Wu, Y.; Xu, H. Unsteady numerical simulation of cavitating turbulent flow in centrifugal pumps. J. Lanzhou Univ. Technol. 2008, 133, 011102. [Google Scholar]
  17. Kan, K.; Zheng, Y.; Chen, Y.; Xie, Z.; Yang, G.; Yang, C. Numerical study on the internal flow characteristics of an axial-flow pump under stall conditions. J. Mech. Sci. Technol. 2018, 32, 4683–4695. [Google Scholar] [CrossRef]
  18. Medvitz, R.B.; Kunz, R.F.; Boger, D.A.; Lindau, J.W.; Yocum, A.M.; Pauley, L.L. Performance Analysis of Cavitating Flow in Centrifugal Pumps Using Multiphase CFD. J. Fluids Eng. 2002, 124, 377–383. [Google Scholar] [CrossRef]
  19. Altosole, M.; Benvenuto, G.; Figari, M.; Campora, U. Dimensionless Numerical Approaches for the Performance Prediction of Marine Waterjet Propulsion Units. Int. J. Rotating Mach. 2012, 2012, 321306. [Google Scholar] [CrossRef]
  20. Zhang, D.; Shi, L.; Shi, W.; Zhao, R.; Wang, H.; Van Esch, B.B. Numerical analysis of unsteady tip leakage vortex cavitation cloud and unstable suction-side-perpendicular cavitating vortices in an axial flow pump. Int. J. Multiph. Flow 2015, 77, 244–259. [Google Scholar] [CrossRef]
  21. Shen, X.; Zhao, X.; Xu, B.; Zhang, D.; Yang, G.; Shi, W.; van Esch, B.B. Unsteady characteristics of tip leakage vortex structure and dynamics in an axial flow pump. Ocean Eng. 2022, 266, 112850. [Google Scholar] [CrossRef]
  22. Al-Obaidi, A.R. Analysis of the effect of various impeller blade angles on characteristic of the axial pump with pressure fluctuations based on time-and frequency-domain investigations. Iran. J. Sci. Technol. Trans. Mech. Eng. 2021, 45, 441–459. [Google Scholar] [CrossRef]
  23. Al-Obaidi, A.R. Influence of guide vanes on the flow fields and performance of axial pump under unsteady flow conditions: Numerical study. J. Mech. Eng. Sci. 2020, 14, 6570–6593. [Google Scholar] [CrossRef]
  24. Al-Obaidi, A.R.; Mohammed, A.A. Numerical Investigations of Transient Flow Characteristic in Axial Flow Pump and Pressure Fluctuation Analysis Based on the CFD Technique. J. Eng. Sci. Technol. Rev. 2019, 12, 70–79. [Google Scholar] [CrossRef]
  25. Al-Obaidi, A.R. Numerical investigation of flow field behaviour and pressure fluctuations within an axial flow pump under transient flow pattern based on CFD analysis method. J. Phys. Conf. Ser. 2019, 1279, 012069. [Google Scholar] [CrossRef]
  26. Al-Obaidi, A.R. Effect of Different Guide Vane Configurations on Flow Field Investigation and Performances of an Axial Pump Based on CFD Analysis and Vibration Investigation. Exp. Tech. 2023, 1–20. [Google Scholar] [CrossRef]
  27. Milani, M.; Montorsi, L.; Muzzioli, G.; Lucchi, A. A Cfd Approach for The Simulation of An Entire Swash-Plate Axial Piston Pump Under Dynamic Operating Conditions. In International Mechanical Engineering Congress and Exposition; American Society of Mechanical Engineers: New York, NY, USA, 2020. [Google Scholar]
  28. Zhang, Y.; Song, P.; Xu, C.; Tian, Y.; Zhang, J. Experimental and Numerical Investigations of Cavitation in a Centrifugal Pump with Pre-whirl Regulation. Trans. Chin. Soc. Agric. Mach. 2014, 45, 131–137. [Google Scholar]
  29. Han, W.; Zhang, T.; Su, Y.L.; Chen, R.; Qiang, Y.; Han, Y. Transient Characteristics of Water-Jet Propulsion with a Screw Mixed Pump during the Startup Process. Math. Probl. Eng. 2020, 2020, 5691632. [Google Scholar] [CrossRef]
Figure 1. Three-dimensional calculation model.
Water 15 03073 g001
Figure 2. Meshing.
Figure 2. Meshing.
Water 15 03073 g002
Figure 3. The experimental system. (a) Experiment schematic diagram; (b) Experiment device.
Water 15 03073 g003
Figure 4. Cavitation performance curve.
Water 15 03073 g004
Figure 5. The distribution of high-speed pump-jet propeller vacuoles under different NPSH values.
Water 15 03073 g005
Figure 6. Cavitation distribution at different flow rates of the high-speed pump-jet propeller.
Water 15 03073 g006
Figure 7. Changes in blade vacuoles (0.95 Q).
Water 15 03073 g007
Figure 8. Changes in blade vacuoles (1.0 Q).
Water 15 03073 g008
Figure 9. Changes in blade vacuoles (1.05 Q).
Water 15 03073 g009
Table 1. Grid independence test.
SchemeImpeller DomainDiffuser DomainInternal DomainEfficiency/%
165925998944047617785.74
21091644183649664449486.32
32173485204754790927087.47
43077421295105414376588.15
553972573523181369777888.17
Table 2. Variation in volume fraction of cavitation.
NPSH (m)Volume Fraction of Cavitation
0.95 Q1.0 Q1.05 Q
500.4026320.4025820.402554
600.3352450.3352370.335237
700.2746990.274580.274566
800.0135410.1173680.203432
8500.01851640.159795
90000.11025
95000.0379525
100000
150000
200000
Table 3. The 50% spanwise surface velocity vector diagram of the impeller.
t 1/6 T1/3 T1/2 T2/3 T5/6 TT
0.95 QWater 15 03073 i001Water 15 03073 i002
1.0 QWater 15 03073 i003Water 15 03073 i004
1.1 QWater 15 03073 i005Water 15 03073 i006
Disclaimer/Publisher’s Note: The statements, opinions and data contained in all publications are solely those of the individual author(s) and contributor(s) and not of MDPI and/or the editor(s). MDPI and/or the editor(s) disclaim responsibility for any injury to people or property resulting from any ideas, methods, instructions or products referred to in the content.

