


Biogeochemical In Situ Barriers in the Aquifers near Uranium Sludge Storages


Abstract
:1. Introduction
2. Materials and Methods
2.1. Sample Collection
2.2. Abundance of Microbial Community
2.3. DNA Sample Preparation and 16S rRNA Gene Analysis
2.4. Laboratory Experiments of Bioremediation Modeling
2.5. Analytical Methods
3. Results
3.1. Geological, Hydrogeological, and Hydrogeochemical Characteristics of Sludge Pond Sites
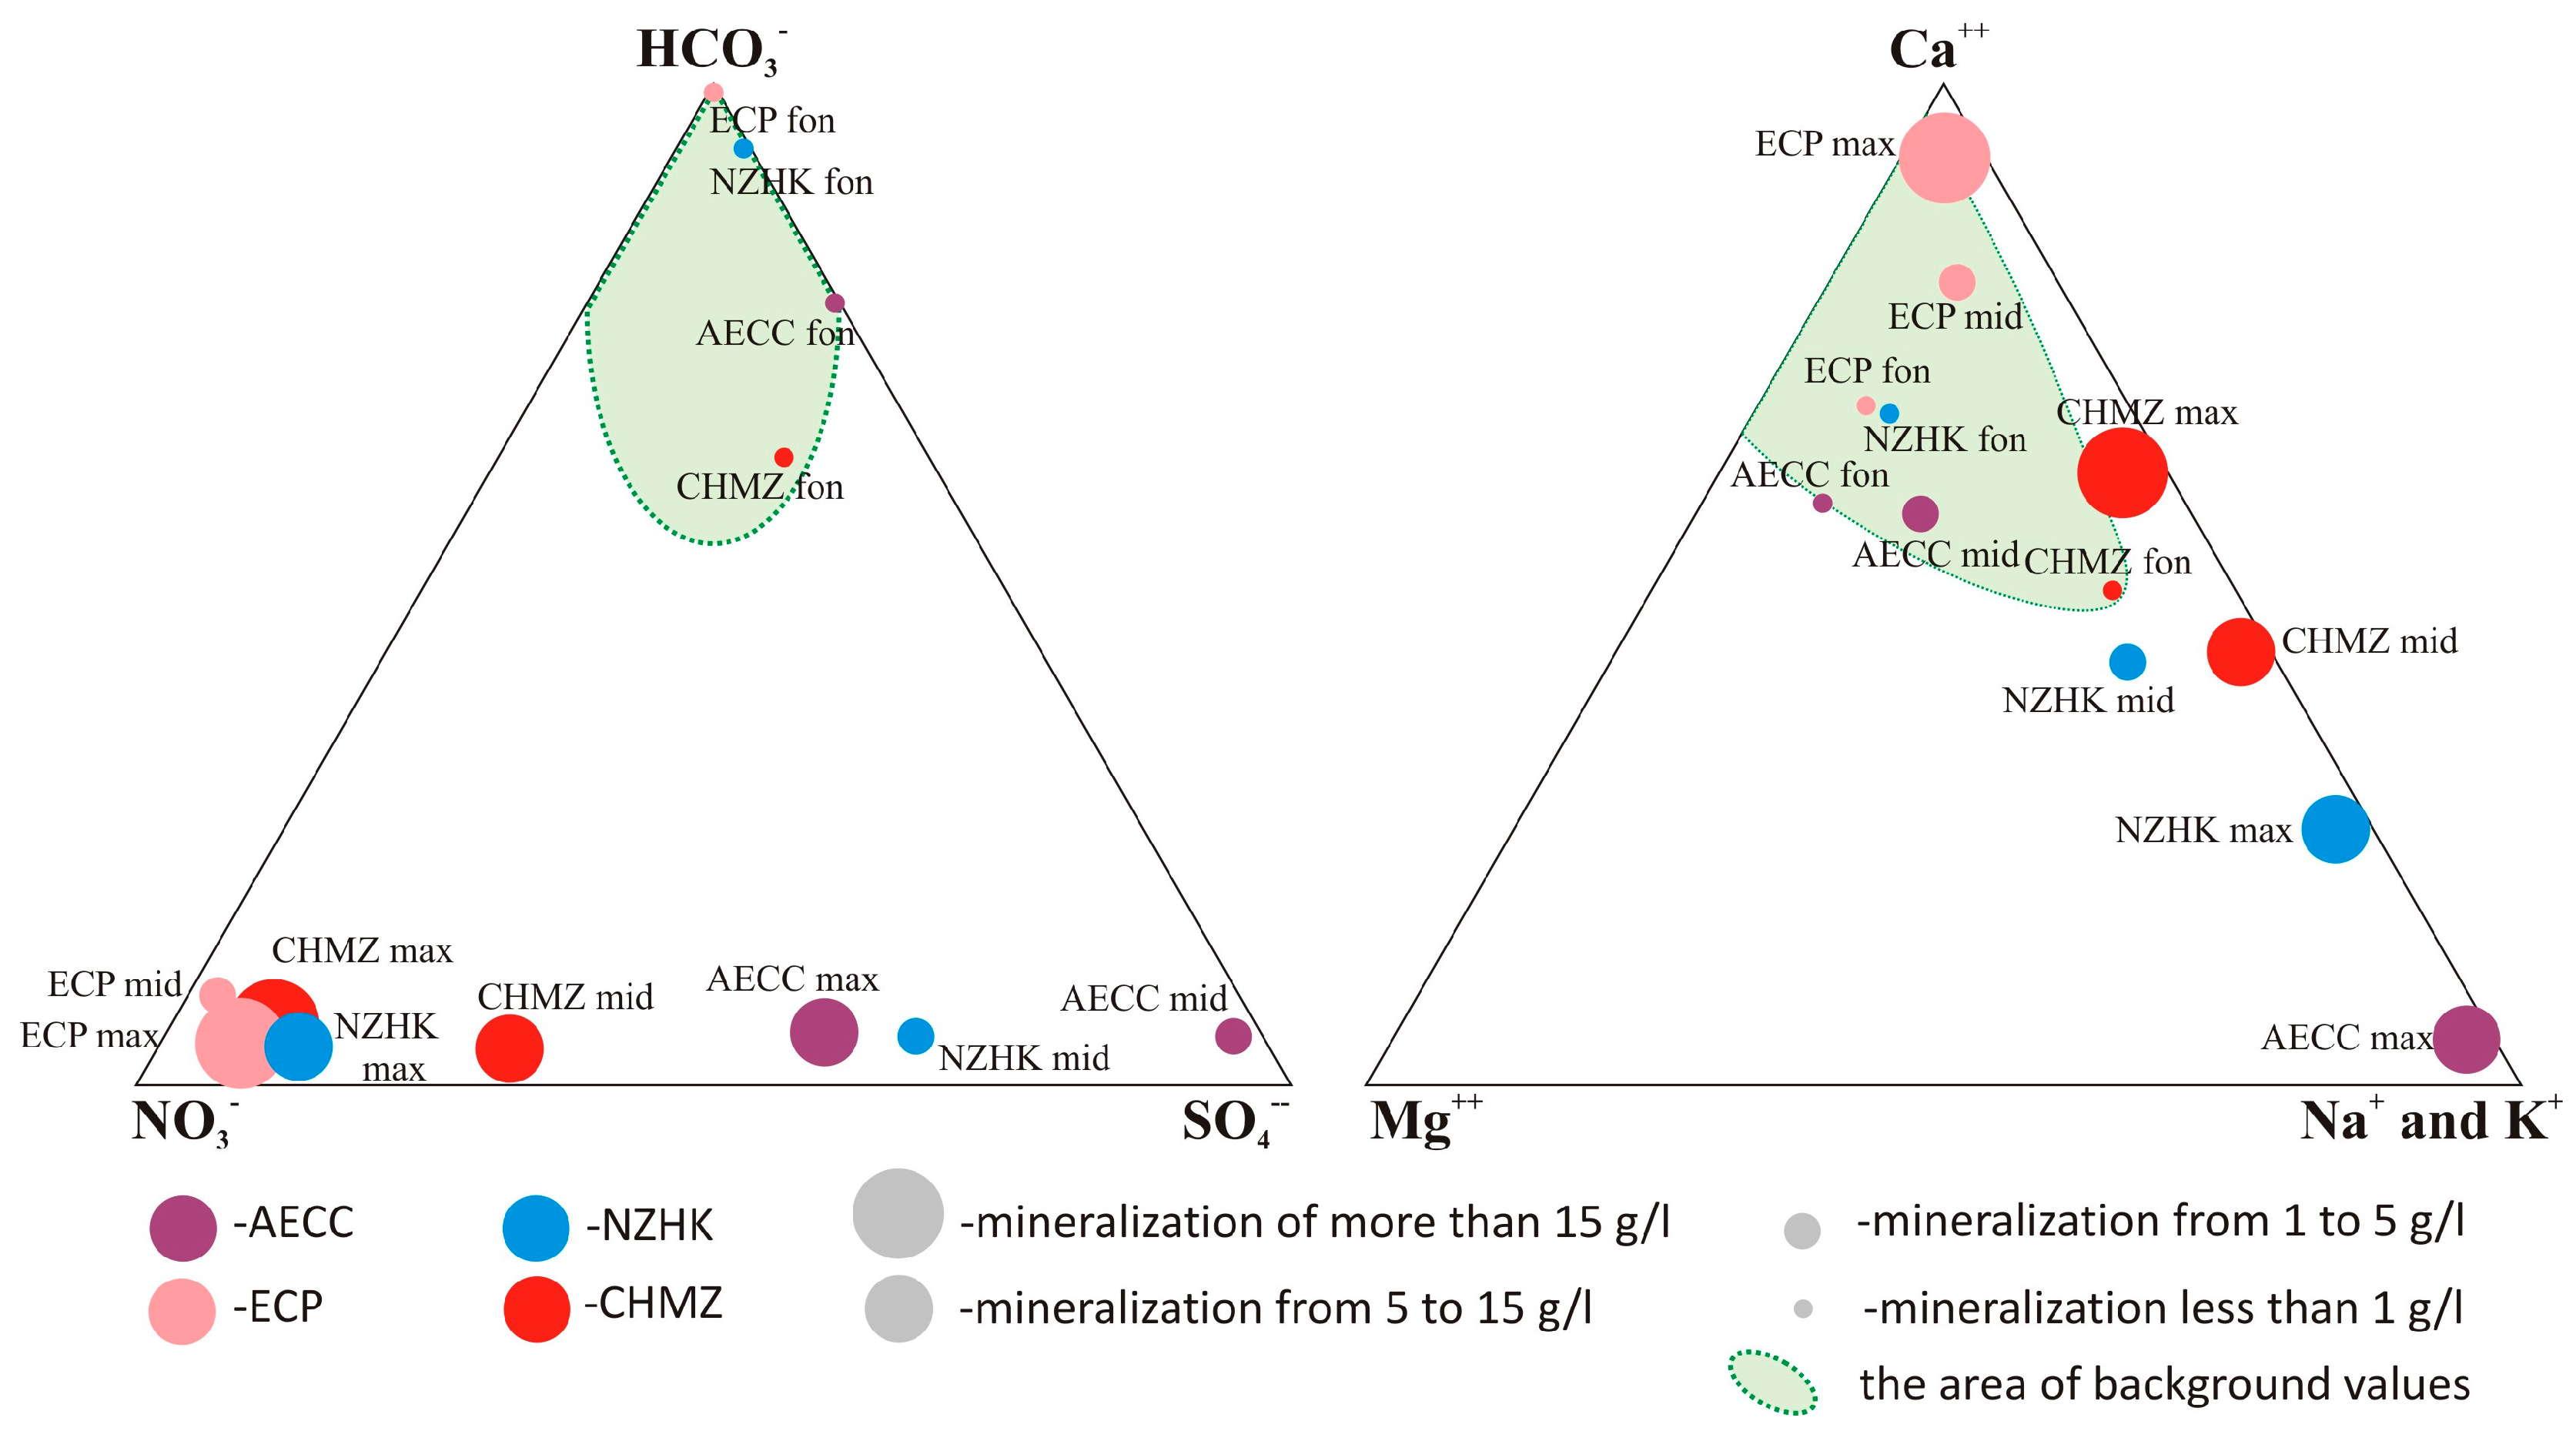
3.2. Chemical Composition of Groundwater
3.3. Microbiological Characteristics of Groundwater
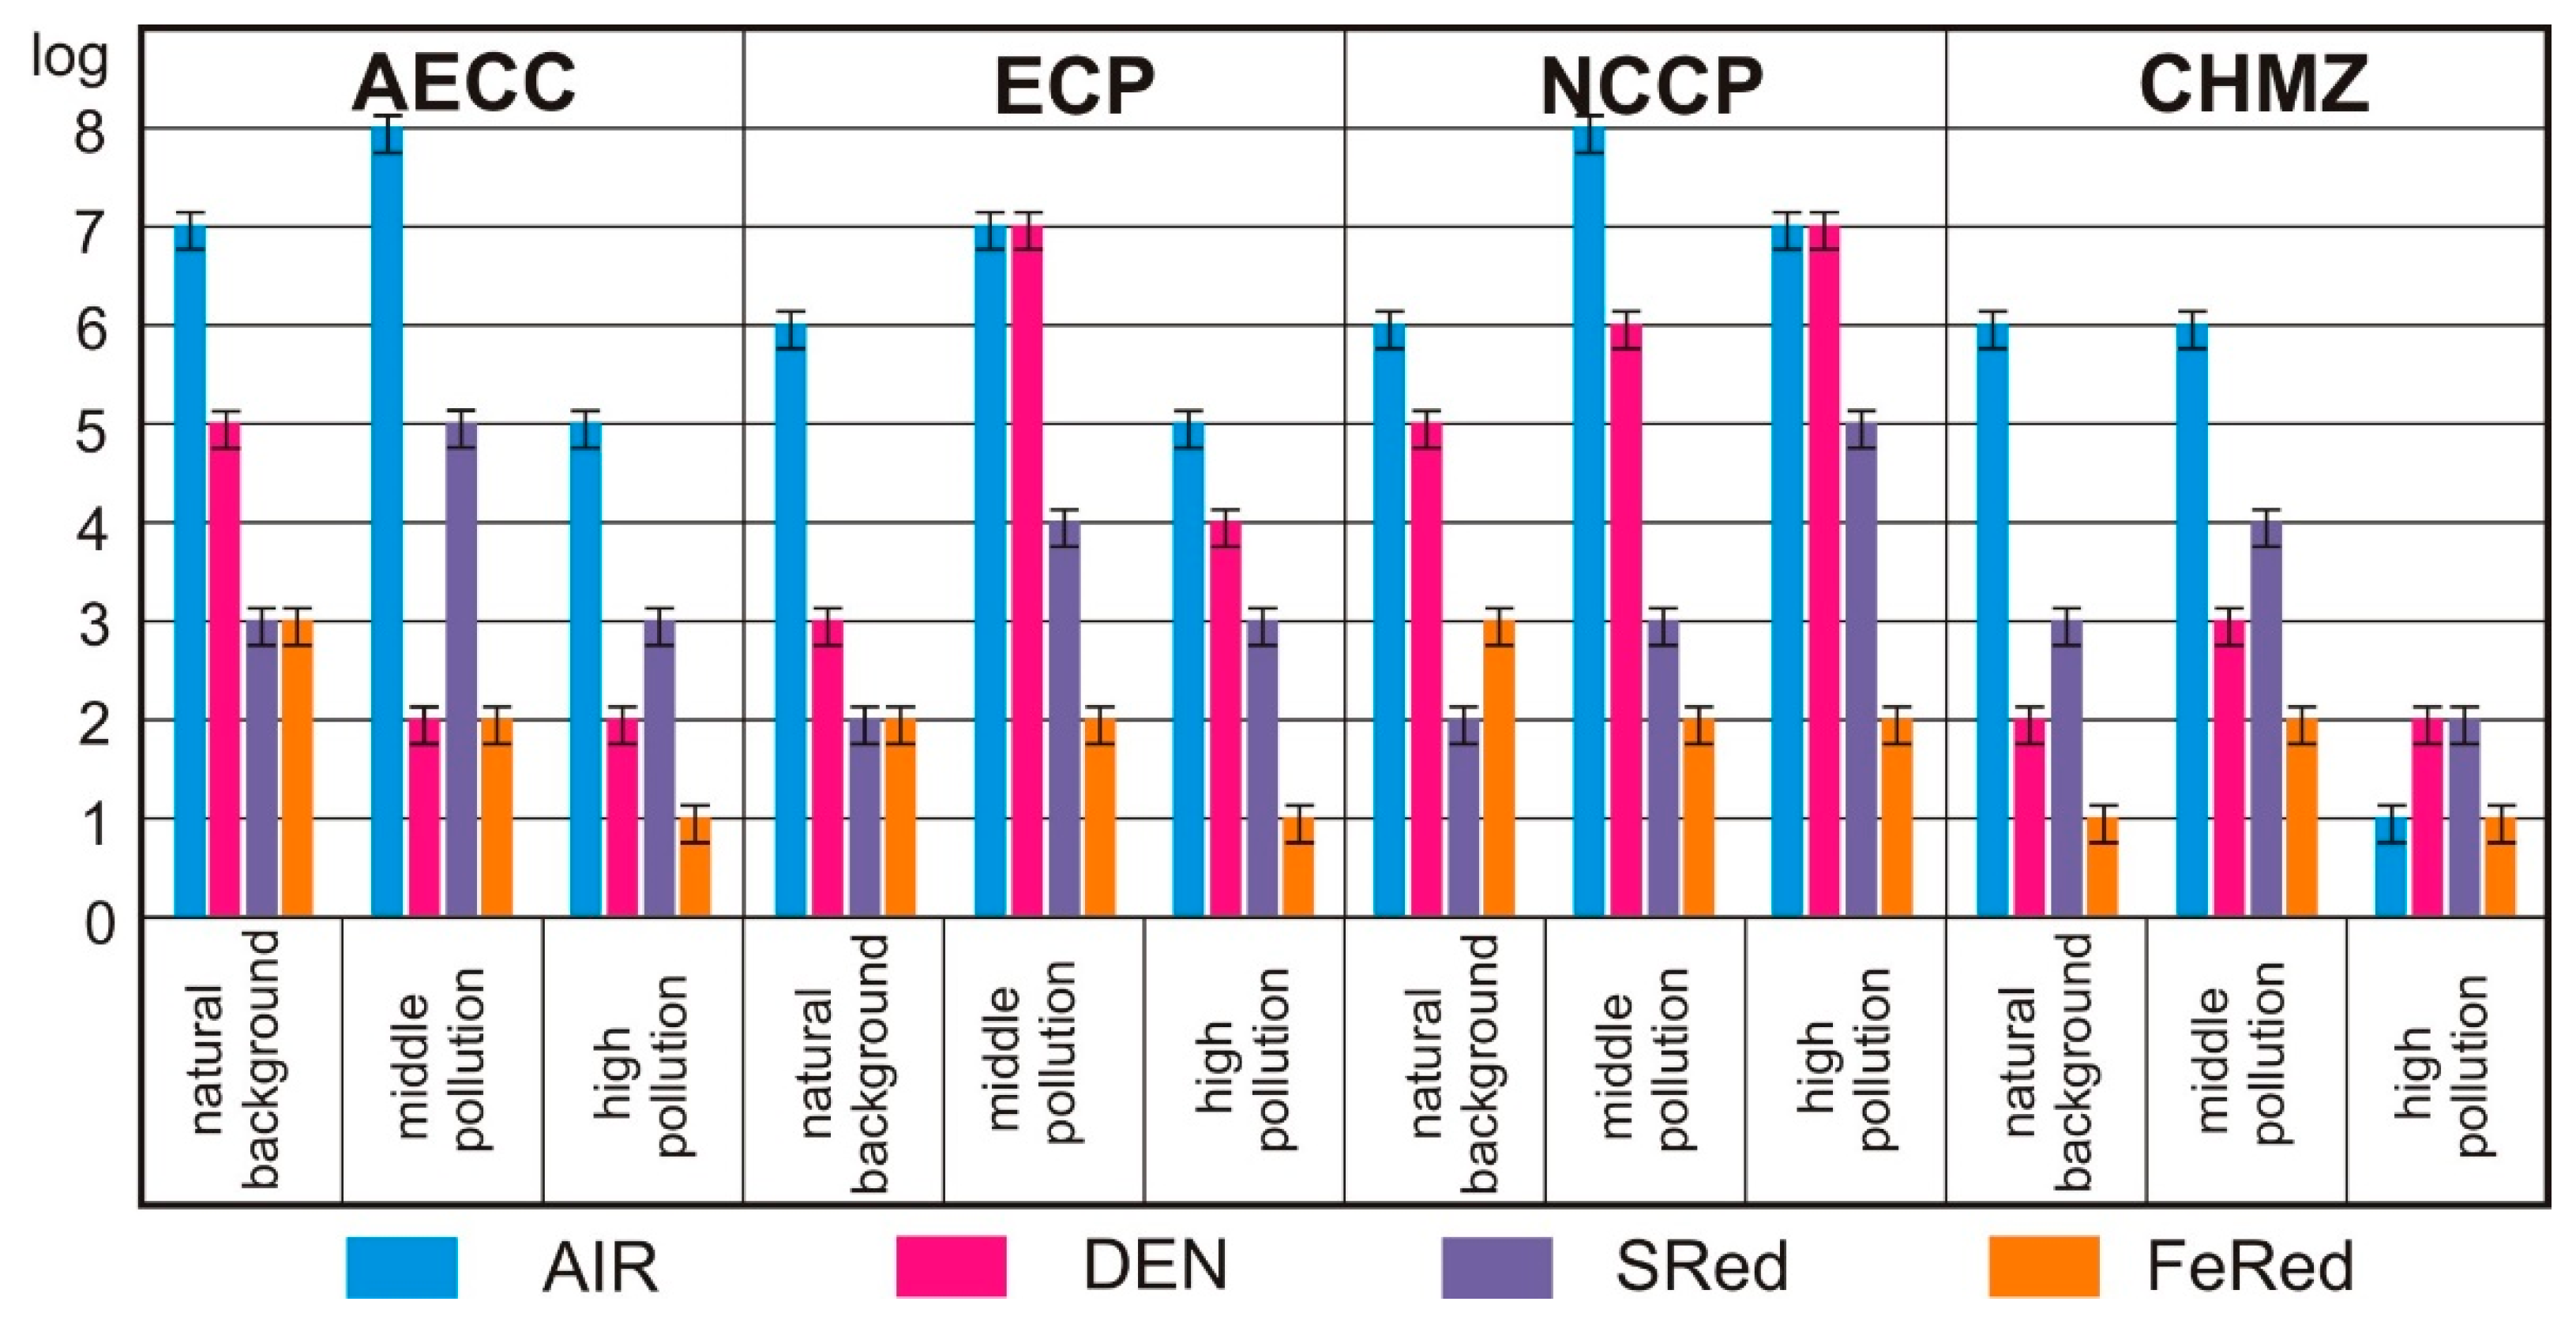
3.3.1. Analysis of Bacterial Abundance of the Main Physiological Groups
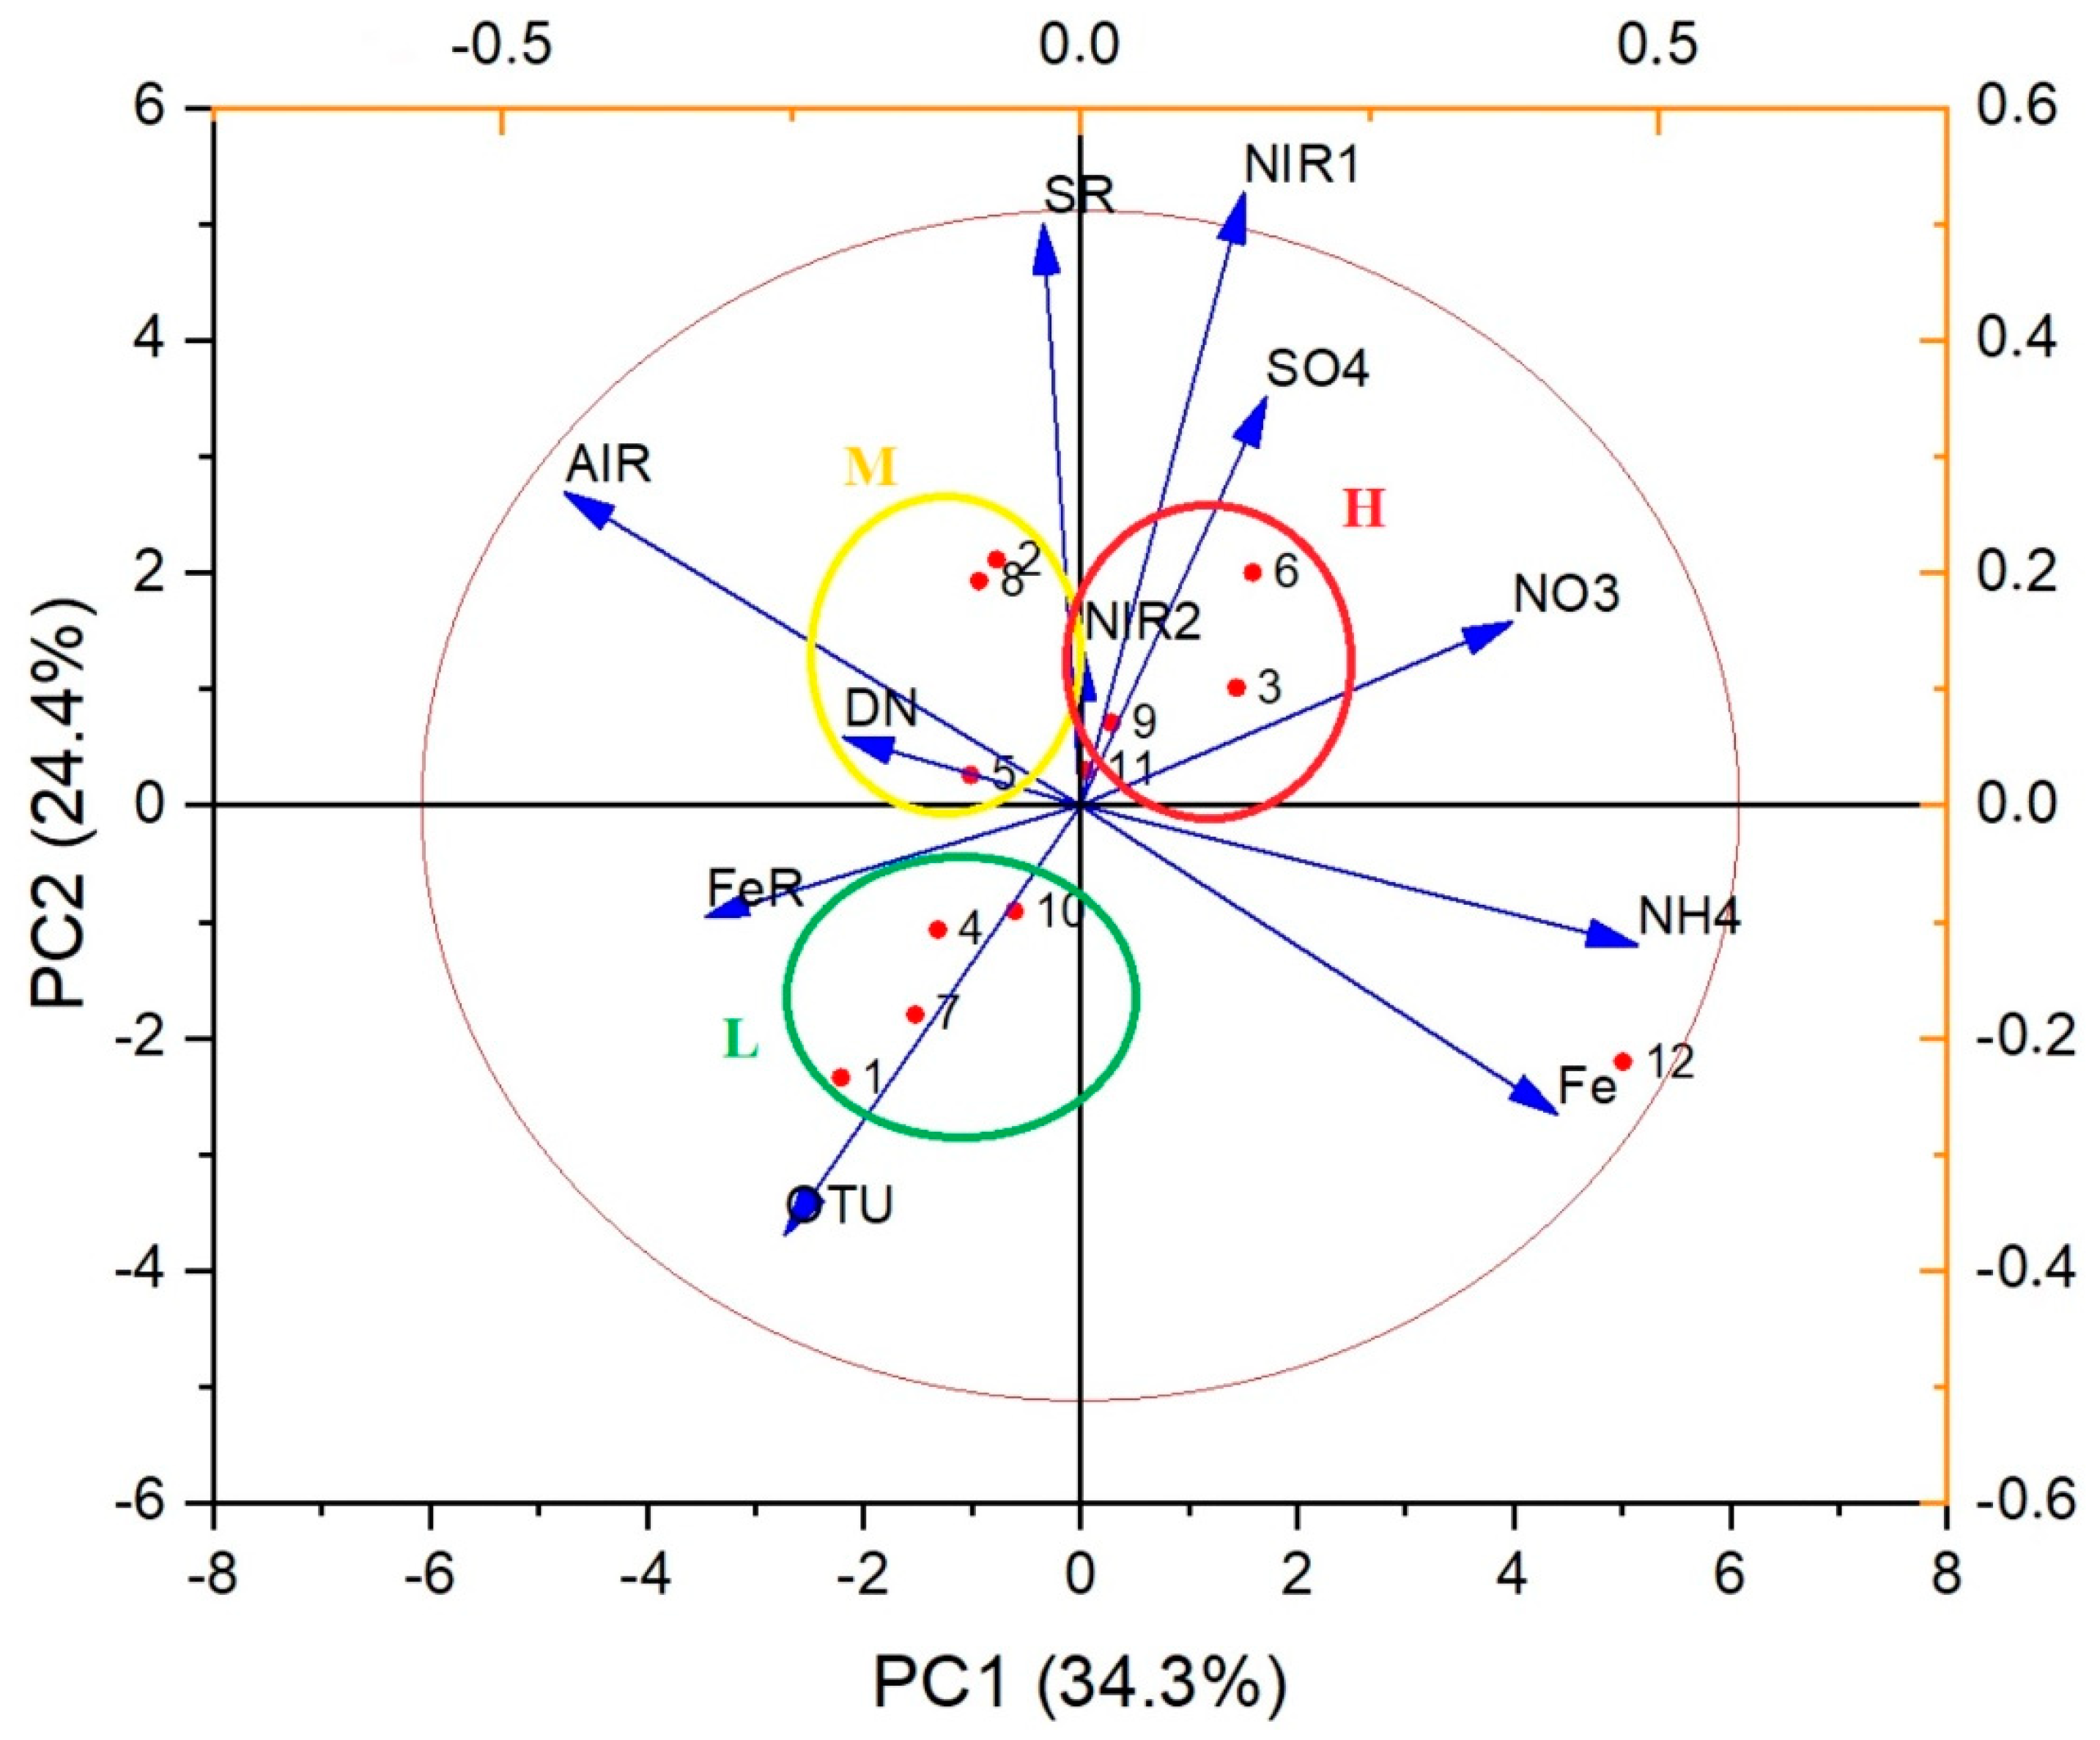
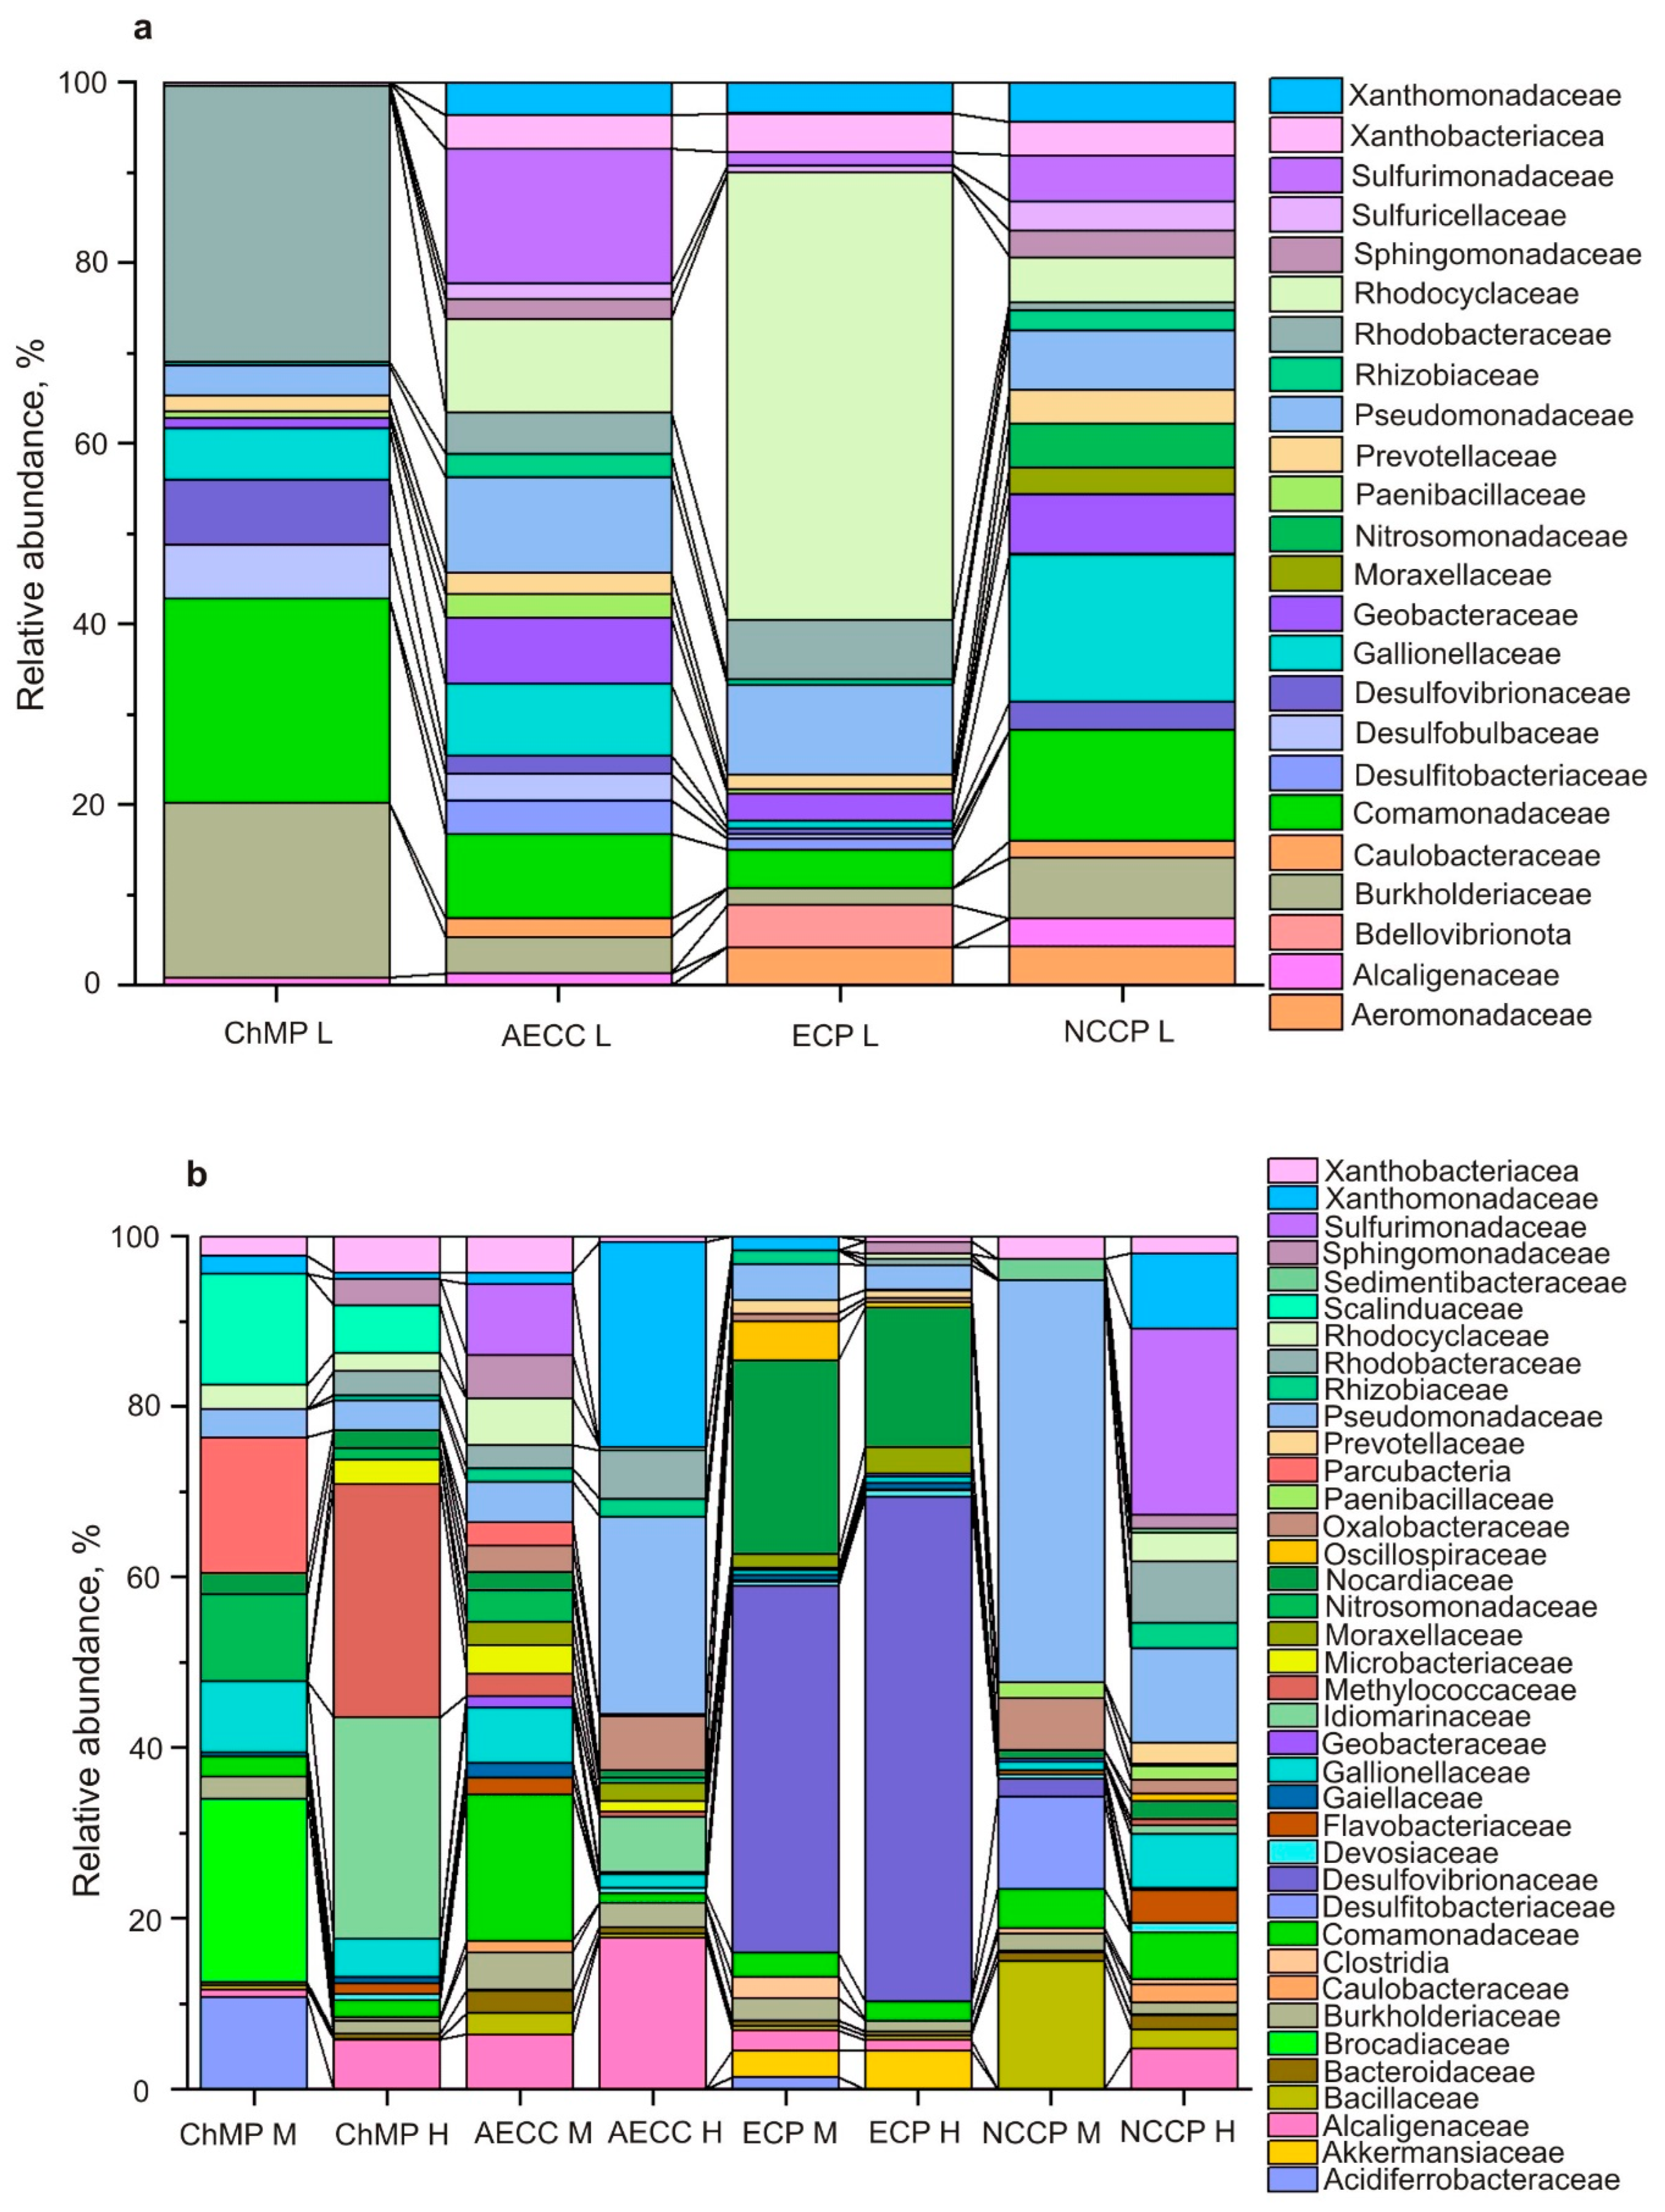
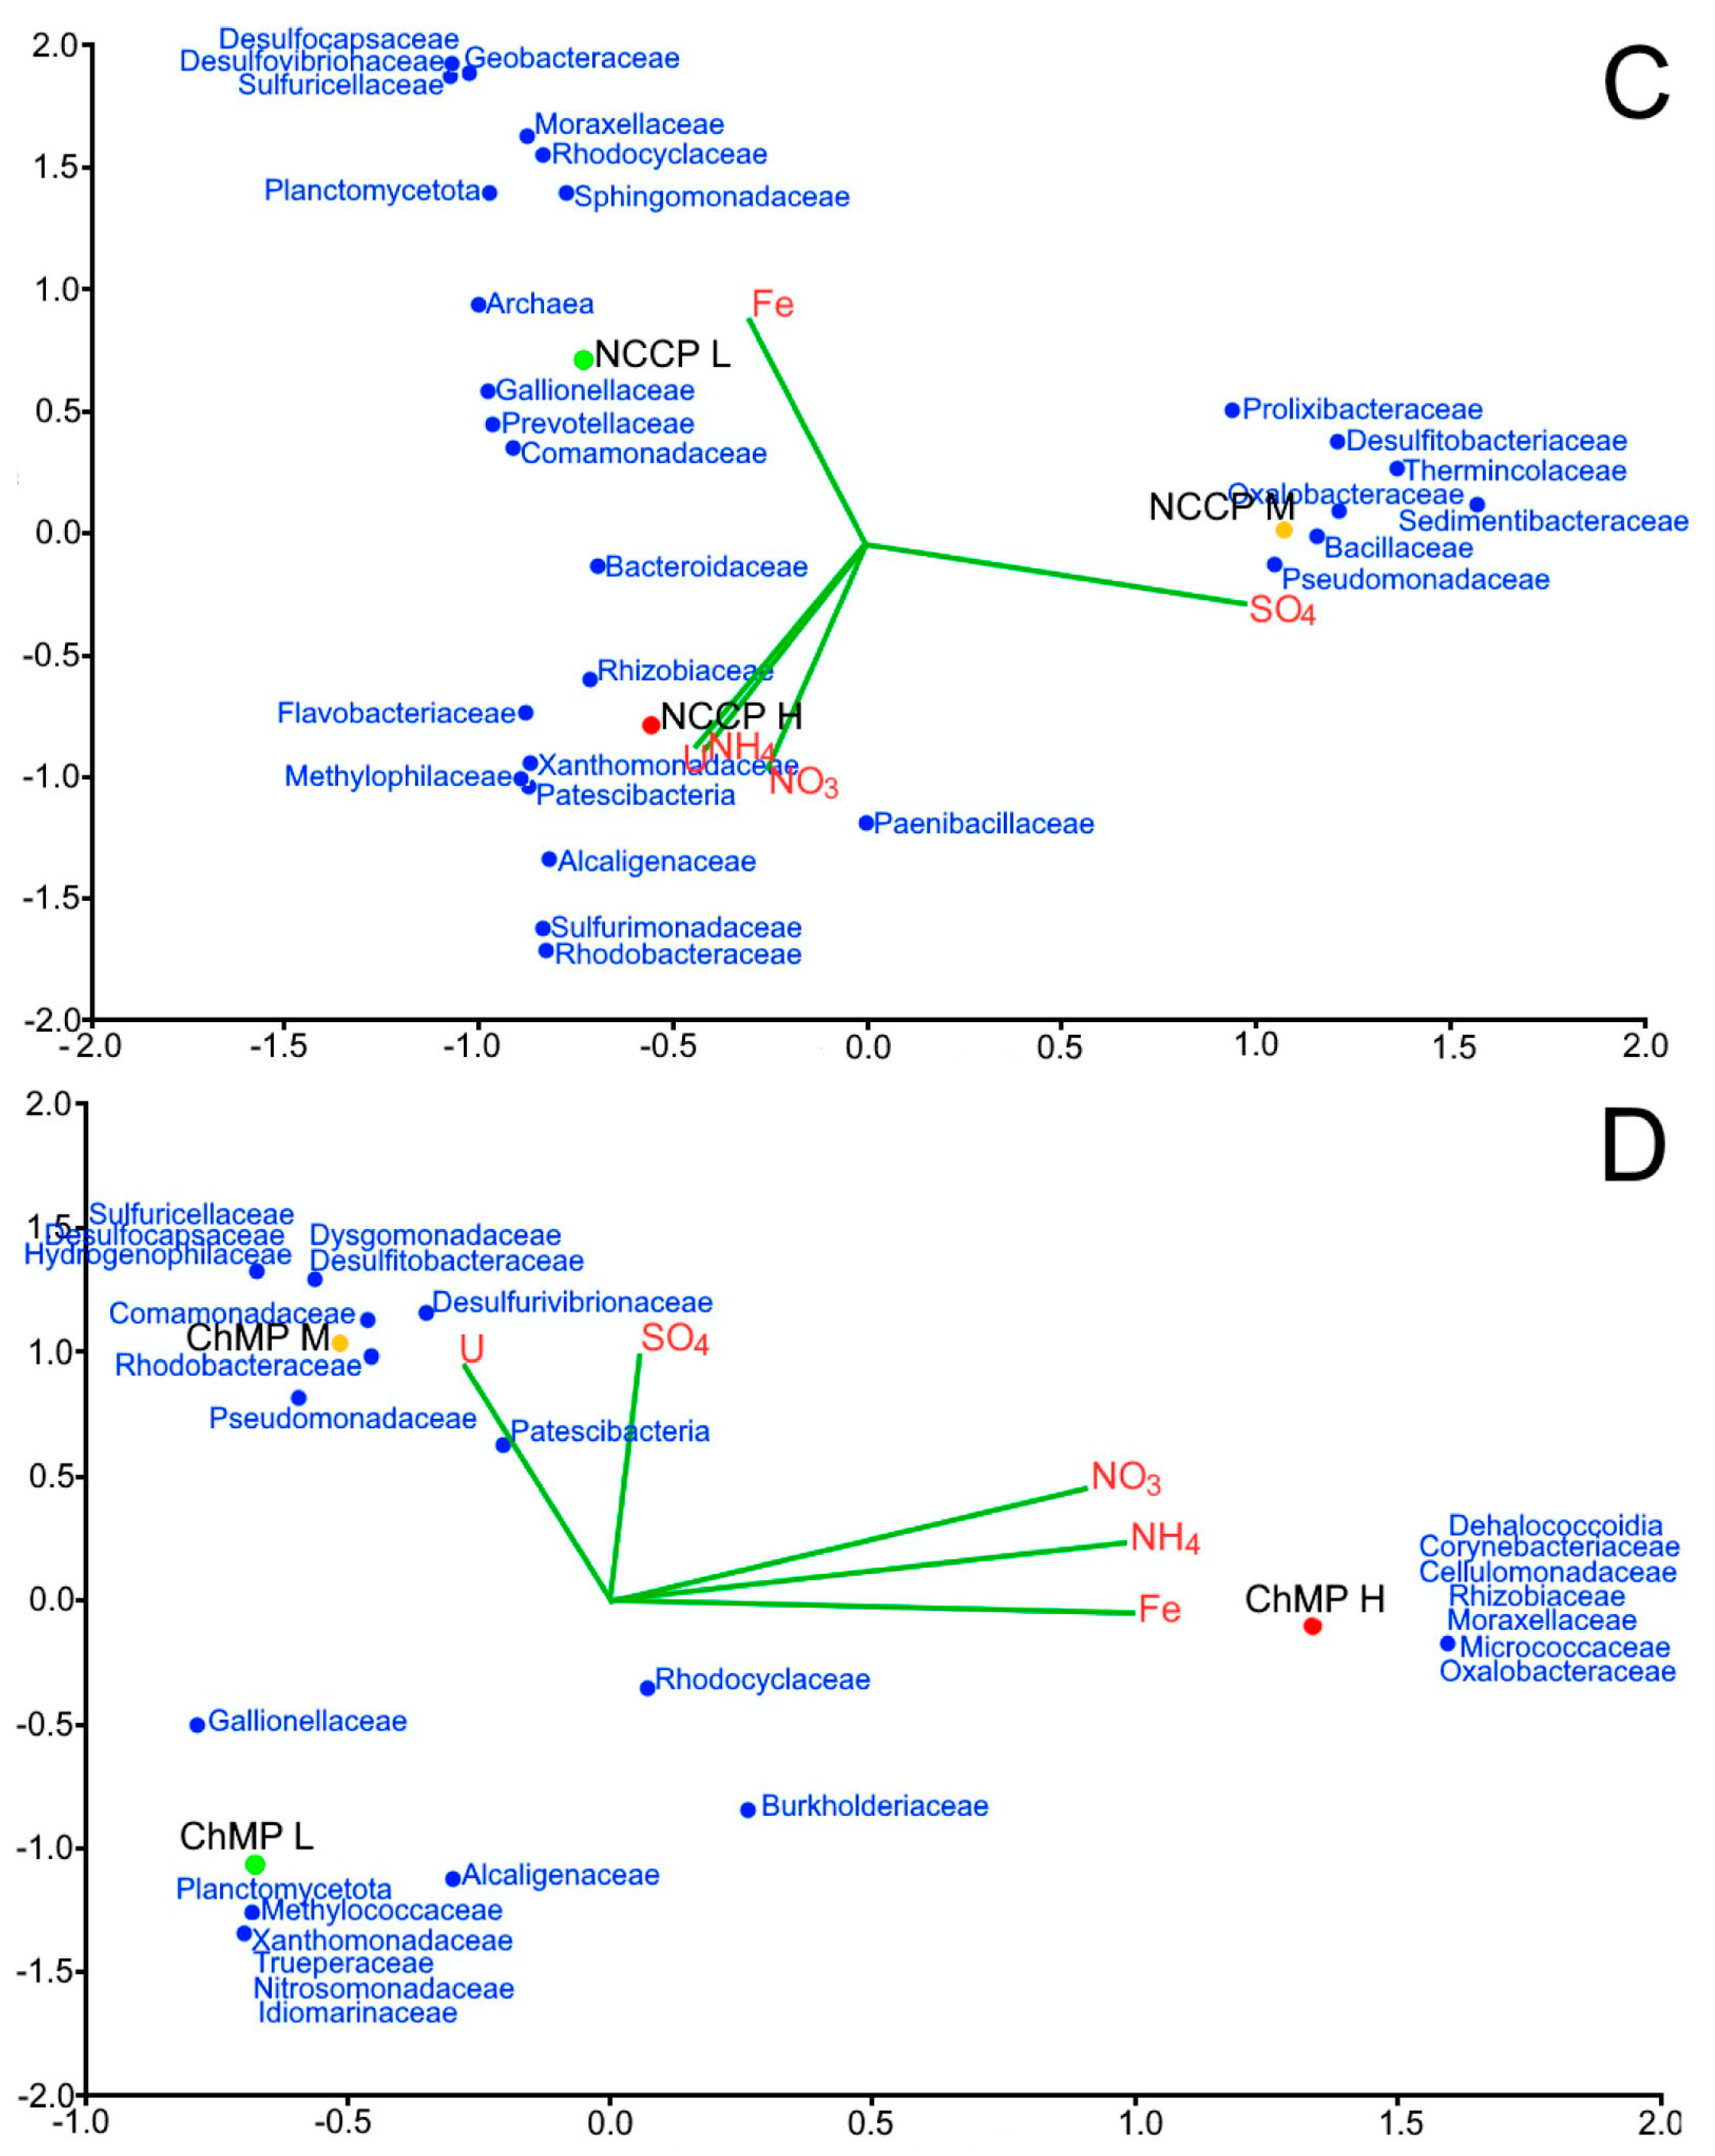
3.3.2. Microbial Diversity Analysis Using 16S rRNA Gene Sequence Analysis
4. Experimental Groundwater Purification
5. Discussion
5.1. Microbiology
5.2. Hydrochemistry
5.3. Geology and Hydrogeology
5.4. Technology
6. Conclusions
Author Contributions
Funding
Institutional Review Board Statement
Informed Consent Statement
Data Availability Statement
Acknowledgments
Conflicts of Interest
References
- Othmane, G.; Allard, T.; Morin, G.; Selo, M.; Brest, J.; Llorens, I.; Chen, N.; Bargar, J.R.; Fayek, M.; Calas, G. Uranium association with iron-bearing phases in mill tailings from Gunnar, Canada. Environ Sci. Technol. 2013, 47, 12695–12702. [Google Scholar] [CrossRef]
- Liu, B.; Peng, T.; Sun, H.; Yue, H. Release behavior of uranium in uranium mill tailings under environmental conditions. J. Environ. Radioact. 2017, 171, 160–168. [Google Scholar] [CrossRef]
- Yin, M.; Sun, J.; Chen, Y.; Wang, J.; Shang, J.; Belshaw, N.; Shen, C.; Liu, J.; Li, H.; Linghu, W.; et al. Mechanism of uranium release from uranium mill tailings under long-term exposure to simulated acid rain: Geochemical evidence and environmental implication. Environ. Pollut. 2019, 244, 174–181. [Google Scholar] [CrossRef] [PubMed]
- Fuhrmann, M.; Benson, C.H.; Likos, W.J.; Stefani, N.; Michaud, A.; Waugh, W.J.; Williams, M.M. Radon fluxes at four uranium mill tailings disposal sites after about 20 years of service. J. Environ. Radioact. 2021, 237, 106719. [Google Scholar] [CrossRef] [PubMed]
- Harries, J.; Levins, D.; Ring, B.; Zuk, W. Management of waste from uranium mining and milling in Australia. Nucl. Eng. Des. 1997, 176, 15–21. [Google Scholar] [CrossRef]
- Linge, I. Special Radioactive Wastes; SAM Poligrafist Ltd.: Moscow, Russia, 2015; pp. 85–190. (In Russian) [Google Scholar]
- Neves, O.; Matias, M.J. Assessment of groundwater quality and contamination problems ascribed to an abandoned uranium mine (Cunha Baixa region, Central Portugal). Environ. Geol. 2008, 53, 1799–1810. [Google Scholar] [CrossRef]
- Salminen, J.M.; Petäjäjärvi, S.J.; Tuominen, S.M.; Nystén, T.H. Ethanol-based in situ bioremediation of acidified, nitrate-contaminated groundwater. Water. Res. 2014, 63, 306–315. [Google Scholar] [CrossRef]
- Wu, W.M.; Carley, J.; Fienen, M.; Mehlhorn, T.; Lowe, K.; Nyman, J.; Luo, J.; Gentile, M.E.; Rajan, R.; Wagner, D.; et al. Pilot-scale in situ bioremediation of uranium in a highly contaminated aquifer. 1. Conditioning of a treatment zone. Environ. Sci. Technol. 2006, 40, 3978–3985. [Google Scholar] [CrossRef]
- Francis, A.J.; Nancharaiah, Y.V. In situ and ex situ bioremediation of radionuclide-contaminated soils at nuclear and norm sites. In Environmental Remediation and Restoration of Contaminated Nuclear and Norm Sites; Velzen, L.V., Ed.; Series in Energy; Woodhead Publishing: Sawston, UK, 2015; pp. 185–236. [Google Scholar] [CrossRef]
- Cleary, A.; Lloyd, J.R.; Newsome, L.; Shaw, S.; Boothman, C.; Boshoff, G.; Atherton, N.; Morris, K. Bioremediation of strontium and technetium contaminated groundwater using glycerol phosphate. Chem. Geol. 2019, 509, 213–222. [Google Scholar] [CrossRef]
- Xu, M.; Wu, W.M.; Wu, L.; He, Z.; Van Nostrand, J.D.; Deng, Y.; Luo, J.; Carley, J.; Ginder-Vogel, M.; Gentry, T.J.; et al. Responses of microbial community functional structures to pilot-scale uranium in situ bioremediation. ISME J. 2010, 4, 1060–1070. [Google Scholar] [CrossRef]
- Alessi, D.S.; Lezama-Pacheco, J.S.; Janot, N.; Suvorova, E.I.; Cerrato, J.M.; Giammar, D.E.; Davis, J.A.; Fox, P.M.; Williams, K.H.; Long, P.E.; et al. Speciation and reactivity of uranium products formed during in situ bioremediation in a shallow alluvial aquifer. Environ. Sci. Technol. 2014, 48, 12842–12850. [Google Scholar] [CrossRef]
- Boguslavsky, A.E.; Gaskova, O.L.; Naymushina, O.S.; Popova, N.M.; Safonov, A.V. Environmental monitoring of low-level radioactive waste disposal in electrochemical plant facilities in Zelenogorsk, Russia. Appl. Geochem. 2020, 119, 104598. [Google Scholar] [CrossRef]
- Safonov, A.V.; Andryushchenko, N.D.; Ivanov, P.V.; Boldyrev, K.A.; Babich, T.L.; German, K.E.; Zakharova, E.V. Biogenic factors of radionuclide immobilization on sandy rocks of upper aquifers. Radiochemistry 2019, 61, 99–108. [Google Scholar] [CrossRef]
- Safonov, A.V.; Boguslavsky, A.E.; Gaskova, O.L.; Boldyrev, K.A.; Shvartseva, O.S.; Khvashchevskaya, A.A.; Popova, N.M.; Braga, S. Biogeochemical modelling of uranium immobilization and aquifer remediation strategies near NCCP sludge storage facilities. Appl. Sci. 2021, 11, 2875. [Google Scholar] [CrossRef]
- Safonov, A.V.; Boguslavskii, A.E.; Boldyrev, K.A.; Zayceva, L.V. Biogenic factors of formation of geochemical uranium anomalies near the sludge storage of the Novosibirsk Chemical Concentrate Plant. Geochem. Int. 2019, 57, 709–715. [Google Scholar] [CrossRef]
- Nazina, T.N.; Safonov, A.V.; Kosareva, I.M.; Ivoilov, V.S.; Poltaraus, A.B.; Ershov, B.G. Microbiological processes in the Severnyi deep disposal site for liquid radioactive wastes. Microbiology 2010, 79, 528–537. [Google Scholar] [CrossRef]
- Safonov, A.V.; Perepelov, A.V.; Babich, T.L.; Popova, N.M.; Grouzdev, D.S.; Filatov, A.V.; Shashkov, A.S.; Demina, L.I.; Nazina, T.N. Structure and gene cluster of the O-polysaccharide from Pseudomonas Veronii A-6-5 and its uranium bonding. Int. J. Biol. Macromol. 2020, 165, 2197–2204. [Google Scholar] [CrossRef] [PubMed]
- Koch, A.L. Most probable numbers. In Methods for General and Molecular Bacteriology; Murray, R.G.E., Wood, W.A., Krieg, N.R., Eds.; American Society for Microbiology: Washingron, DC, USA, 1994; pp. 257–260. [Google Scholar]
- Postgate, J.R. The Sulphate-Reducing Bacteria; Cambridge University Press: New York, NY, USA, 1979; pp. 133–144. [Google Scholar]
- Adkins, J.P.; Cornell, L.A.; Tanner, R.S. Microbial composition of carbonate petroleum reservoir fluids. Geomicrobiol. J. 1992, 10, 87–97. [Google Scholar] [CrossRef]
- Daigger, G. Oxygen and carbon requirements for biological nitrogen removal processes accomplishing nitrification, nitritation, and anammox. Water Environ. Res. 2014, 86, 204–209. [Google Scholar] [CrossRef]
- Gaskova, O.L.; Boguslavsky, A.E. Groundwater geochemistry near the storage sites of low-level radioactive waste: Implications for uranium migration. Proced. Earth Planet. Sci. 2013, 7, 288–291. [Google Scholar] [CrossRef]
- Safonov, A.V.; Boguslavsky, A.E.; Boldyrev, K.A.; Gaskova, O.L.; Naimushina, O.S.; Popova, N.M. Geochemical modeling of the uranium behavior in groundwater near the sludge storages during bioremediation. Geochem. Int. 2021, 59, 56–65. [Google Scholar] [CrossRef]
- Boguslavskii, A.E.; Gas’kova, O.L.; Shemelina, O.V. Geochemical model of the environmental impact of low-level radioactive sludge repositories in the course of their decommissioning. Radiochemistry 2016, 58, 323–328. [Google Scholar] [CrossRef]
- Nalivaiko, K.A.; Skripchenko, S.Y.; Titova, S.M.; Semenishchev, V.S. Radioactive wastes from near-surface storage facility of uranium conversion production. J. Radioanal. Nucl. Chem. 2023, 332, 2499–2512. [Google Scholar] [CrossRef]
- Boguslavskii, A.; Gaskova, O.; Shemelina, O. Uranium migration in the ground water of the region of sludge dumps of the Angarsk Electrolysis Chemical Combine. Chem. Sustain. Dev. 2012, 20, 465–478. [Google Scholar]
- Gabriel, J. Development of soil microbiology methods: From respirometry to molecular approaches. JIMB 2010, 37, 1289–1297. [Google Scholar] [CrossRef]
- Roswell, M.; Dushoff, J.; Winfree, R. A conceptual guide to measuring species diversity. Oikos 2021, 130, 321–338. [Google Scholar] [CrossRef]
- Safonov, A.V.; Babich, T.L.; Sokolova, D.S.; Grouzdev, D.S.; Tourova, T.P.; Poltaraus, A.B.; Zakharova, E.V.; Merkel, A.Y.; Novikov, A.P.; Nazina, T.N. Microbial community and in situ bioremediation of groundwater by nitrate removal in the zone of a radioactive waste surface repository. Front. Microbiol. 2018, 9, 1985. [Google Scholar] [CrossRef]
- Safonov, A.; Lavrinovich, E.; Emel’yanov, A.; Boldyrev, K.; Kuryakov, V.; Rodygina, N.; Zakharova, E.; Novikov, A. Risk of colloidal and pseudo-colloidal transport of actinides in nitrate contaminated groundwater near a radioactive waste repository after bioremediation. Sci. Rep. 2022, 12, 4557. [Google Scholar] [CrossRef]
- Safonov, A.; Popova, N.; Boldyrev, K.; Lavrinovich, E.; Boeva, N.; Artemiev, G.; Kuzovkina, E.; Emelyanov, A.; Myasnikov, I.; Zakharova, E.; et al. The microbial impact on U, Pu, Np, and Am immobilization on aquifer sandy rocks, collected at the deep LRW injection site. J. Geochem. Explor. 2022, 240, 107052. [Google Scholar] [CrossRef]
- Sharp, J.O.; Lezama-Pacheco, J.S.; Schofield, E.J.; Junier, P.; Ulrich, K.U.; Chinni, S.; Veeramani, H.; Margot-Roquier, C.; Webb, S.M.; Tebo, B.M.; et al. Uranium speciation and stability after reductive immobilization in aquifer sediments. Geochim. Cosmochim. Acta 2011, 75, 6497–6510. [Google Scholar] [CrossRef]
- Zhong, L.; Liu, C.; Zachara John, M.; Kennedy Dave, W.; Szecsody James, E.; Wood, B. Oxidative remobilization of biogenic uranium(IV) precipitates: Effects of Iron(II) and pH. J. Environ. Qual. 2005, 34, 1763–1771. [Google Scholar] [CrossRef] [PubMed]
- Popova, N.; Vishnyakova, A.; Artemiev, G.; Sitanskaia, A.; Litti, Y.; Safonov, A. Biofilms of anammox bacteria on mineral carriers to establish a subterranean permeable barrier. Int. J. Environ. Sci. Technol. 2023, 20, 2159–2170. [Google Scholar] [CrossRef]
- Botchkova, E.; Vishnyakova, A.; Popova, N.; Sukhacheva, M.; Kolganova, T.; Litti, Y.; Safonov, A. Characterization of enrichment cultures of anammox, nitrifying and denitrifying bacteria obtained from a cold, heavily nitrogen-polluted aquifer. Biology 2023, 12, 221. [Google Scholar] [CrossRef]
- Chen, W.T.; Chen, K.F.; Surmpalli, R.Y.; Zhang, T.C.; Ou, J.H.; Kao, C.M. Bioremediation of trichloroethylene-polluted groundwater using emulsified castor oil for slow carbon release and acidification control. Water Environ. Res. 2022, 94, e1673. [Google Scholar] [CrossRef]
- Lacroix, E.; Brovelli, A.; Holliger, C.; Barry, D.A. Control of groundwater pH during bioremediation: Improvement and validation of a geochemical model to assess the buffering potential of ground silicate minerals. J. Contam. Hydrol. 2014, 160, 21–29. [Google Scholar] [CrossRef]
- Mehta, V.; Maillot, F.; Wang, Z.; Catalano, J.; Giammar, D. Effect of reaction pathway on the extent and mechanism of uranium (VI) immobilization with calcium and phosphate. Environ. Sci. Technol. 2016, 50, 3128–3136. [Google Scholar] [CrossRef] [PubMed]
- Shelobolina, E.S.; O’Neill, K.; Finneran, K.T.; Hayes, L.A.; Lovley, D.R. Potential for in situ bioremediation of a low-pH, high-nitrate uranium-contaminated groundwater. Soil Sediment Contam. 2003, 12, 865–884. [Google Scholar] [CrossRef]
- Van Nostrand, J.D.; Wu, L.; Wu, W.M.; Huang, Z.; Gentry, T.J.; Deng, Y.; Carley, J.; Carroll, S.; He, Z.; Gu, B.; et al. Dynamics of microbial community composition and function during in situ bioremediation of a uranium-contaminated aquifer. Appl. Environ. Microbiol. 2011, 77, 3860–3869. [Google Scholar] [CrossRef] [PubMed]


| Plant | Type | Eh | pH; | Cond | ∑CO3− | SO42− | Cl− | NH4 | NO3 | Fe | Ca2+ | Na | Mg | K | Mn | P | Si | U |
|---|---|---|---|---|---|---|---|---|---|---|---|---|---|---|---|---|---|---|
| mV | mS/cm2 | HCO3−, mg/L | mg/L | mg/L | mg/L | mg/L | mg/L | mg/L | mg/L | mg/L | mg/L | mg/L | mg/L | mg/L | mkg/L | |||
| AECC | AECC L | 115 ±2.3 | 7.39 ±0.2 | 0.73 ±0.01 | 96 ±9.6 | 27 ±1.3 | 6.5 ±0.45 | 0.28 ±0.03 | 0.98 ±0.07 | 13.9 ±0.7 | 34 ±1.7 | 5.3 ±0.26 | 18.3 ±0.9 | 0.72 ±0.04 | 0.41 ±0.02 | 0.20 ±0.01 | 7.5 ±0.38 | 0.090 ±0.005 |
| AECC M | 136 ±2.7 | 7.10 ±0.2 | 2.35 ±0.05 | 89 ±8.9 | 1620 ±81 | 49 ±3.4 | 0.20 ±0.02 | 45 ±3.2 | 1.66 ±0.08 | 299 ±15 | 94 ±4.7 | 120 ±6.0 | 3.1 ±0.15 | 0.07 ±0.004 | 0.31 ±0.02 | 7.1 ±0.36 | 0.24 ±0.012 | |
| AECC H | 34 ±0.7 | 9.78 ±0.2 | 9.4 ±0.19 | 413 ±41 | 3720 ±186 | 350 ±25 | 103 ±10.3 | 2440 ±171 | 3.3 ±0.17 | 115 ±5.8 | 1519 ±76 | 5.0 ±0.25 | 139 ±7.0 | 0.81 ±0.04 | 1.16 ±0.06 | 1.27 ±0.06 | 0.26 ±0.013 | |
| ECP | ECP L | −128 ±2.6 | 7.35 ±0.2 | 0.34 ±0.01 | 267 ±26 | 0.55 ±0.03 | 1.6 ±0.11 | 0.50 ±0.05 | 0.80 ±0.06 | 1.59 ±0.08 | 78 ±3.9 | 11.7 ±0.6 | 25 ±1.2 | 2.0 ±0.1 | 1.12 ±0.06 | 0.40 ±0.02 | 5.7 ±0.29 | 0.23 ±0.012 |
| ECP M | 90 ±1.8 | 6.70 ±0.2 | 1.86 ±0.04 | 215 ±22 | 143 ±1.15 | 65 ±4.6 | 17 ±1.7 | 2330 ±163 | 2.0 ±0.1 | 602 ±30 | 71 ±5.5 | 60 ±3.0 | 5.0 ±0.25 | 0.73 ±0.04 | 1.29 ±0.06 | 5.5 ±0.27 | 3.0 ±0.15 | |
| ECP H | 94 ±1.9 | 7.50 ±0.2 | 20.3 ±0.41 | 204 ±20 | 800 ±40 | 17 ±1.2 | 68 ±7 | 11,500 ±805 | 15.4 ±0.77 | 5340 ±267 | 127 ±6.4 | 120 ±6.0 | 11.0 ±0.55 | 2.16 ±0.11 | 10.0 ±0.5 | 7.0 ±0.35 | 5.6 ±0.28 | |
| NCCP | NCCP L | −71 ±1.4 | 7.01 ±0.2 | 0.88 ±0.2 | 393 ±39 | 24 ±1.2 | 21 ±1.5 | 1.0 ±0.1 | 5.9 ±0.41 | 5.26 ±0.26 | 103 ±5.2 | 12.4 ±0.62 | 35 ±1.7 | 1.83 ±0.09 | 1.33 ±0.07 | 0.53 ±0.03 | 6.7 ±0.34 | 2.0 ±0.1 |
| NCCP M | −29 ±0.6 | 6.51 ±0.2 | 7.1 ±0.14 | 151.00 ±0.6 | 1920 ±96 | 750 ±53 | 1.1 ±0.1 | 900 ±63 | 3.5 ±0.17 | 556 ±28 | 563 ±28 | 160 ±8.0 | 8.9 ±0.45 | 2.2 ±0.11 | 0.47 ±0.02 | 1.19 ±0.06 | 0.86 ±0.04 | |
| NCCP H | 57 ±1.1 | 7.40 ±0.2 | 15.9 ±0.32 | 195 ±20 | 590 ±30 | 2984 ±209 | 120 ±12 | 4740 ±332 | 2.7 ±0.13 | 804 ±40 | 2013 ±101 | 72 ±3.6 | 91 ±4.5 | 2.5 ±0.12 | 0.07 ±0.003 | 4.9 ±0.24 | 3422 ±171 | |
| ChMP | ChMP L | −70 ±1.4 | 7.20 ±0.2 | 0.71 ±0.01 | 53.8 ±54 | 21.4 ±1.0 | 10.9 ±0.8 | 7.8 ±0.8 | 11.5 ±0.81 | 1.40 ±0.07 | 132 ±6.6 | 100 ±5.0 | 31 ±1.5 | 16.5 ±0.83 | 0.83 ±0.04 | 0.010 ±0.001 | 3.2 ±0.16 | 0.01 ±0.001 |
| ChMP M | 162 ±3.2 | 7.80 ±0.2 | 8.9 ±0.18 | 212 ±21 | 1585 ±79 | 1131 ±79 | 88 ±8.8 | 3460 ±242 | 5.1 ±0.26 | 1113 ±56 | 1058 ±53 | 29 ±01.5 | 234 ±11.7 | 1.04 ±0.05 | 0.010 ±0.001 | 12.4 ±0.62 | 1.90 ±0.095 | |
| ChMP H | 195 ±3.9 | 6.50 ±0.2 | 16.9 ±0.34 | 319 ±32 | 780 ±39 | 2260 ±158 | 292 ±29 | 7100 ±497 | 67 ±3.4 | 2940 ±147 | 1549 ±77 | 76 ±3.8 | 47 ±2.4 | 2.4 ±0.12 | 0.39 ±0.02 | 19.7 ±0.99 | 4930 ±247 |
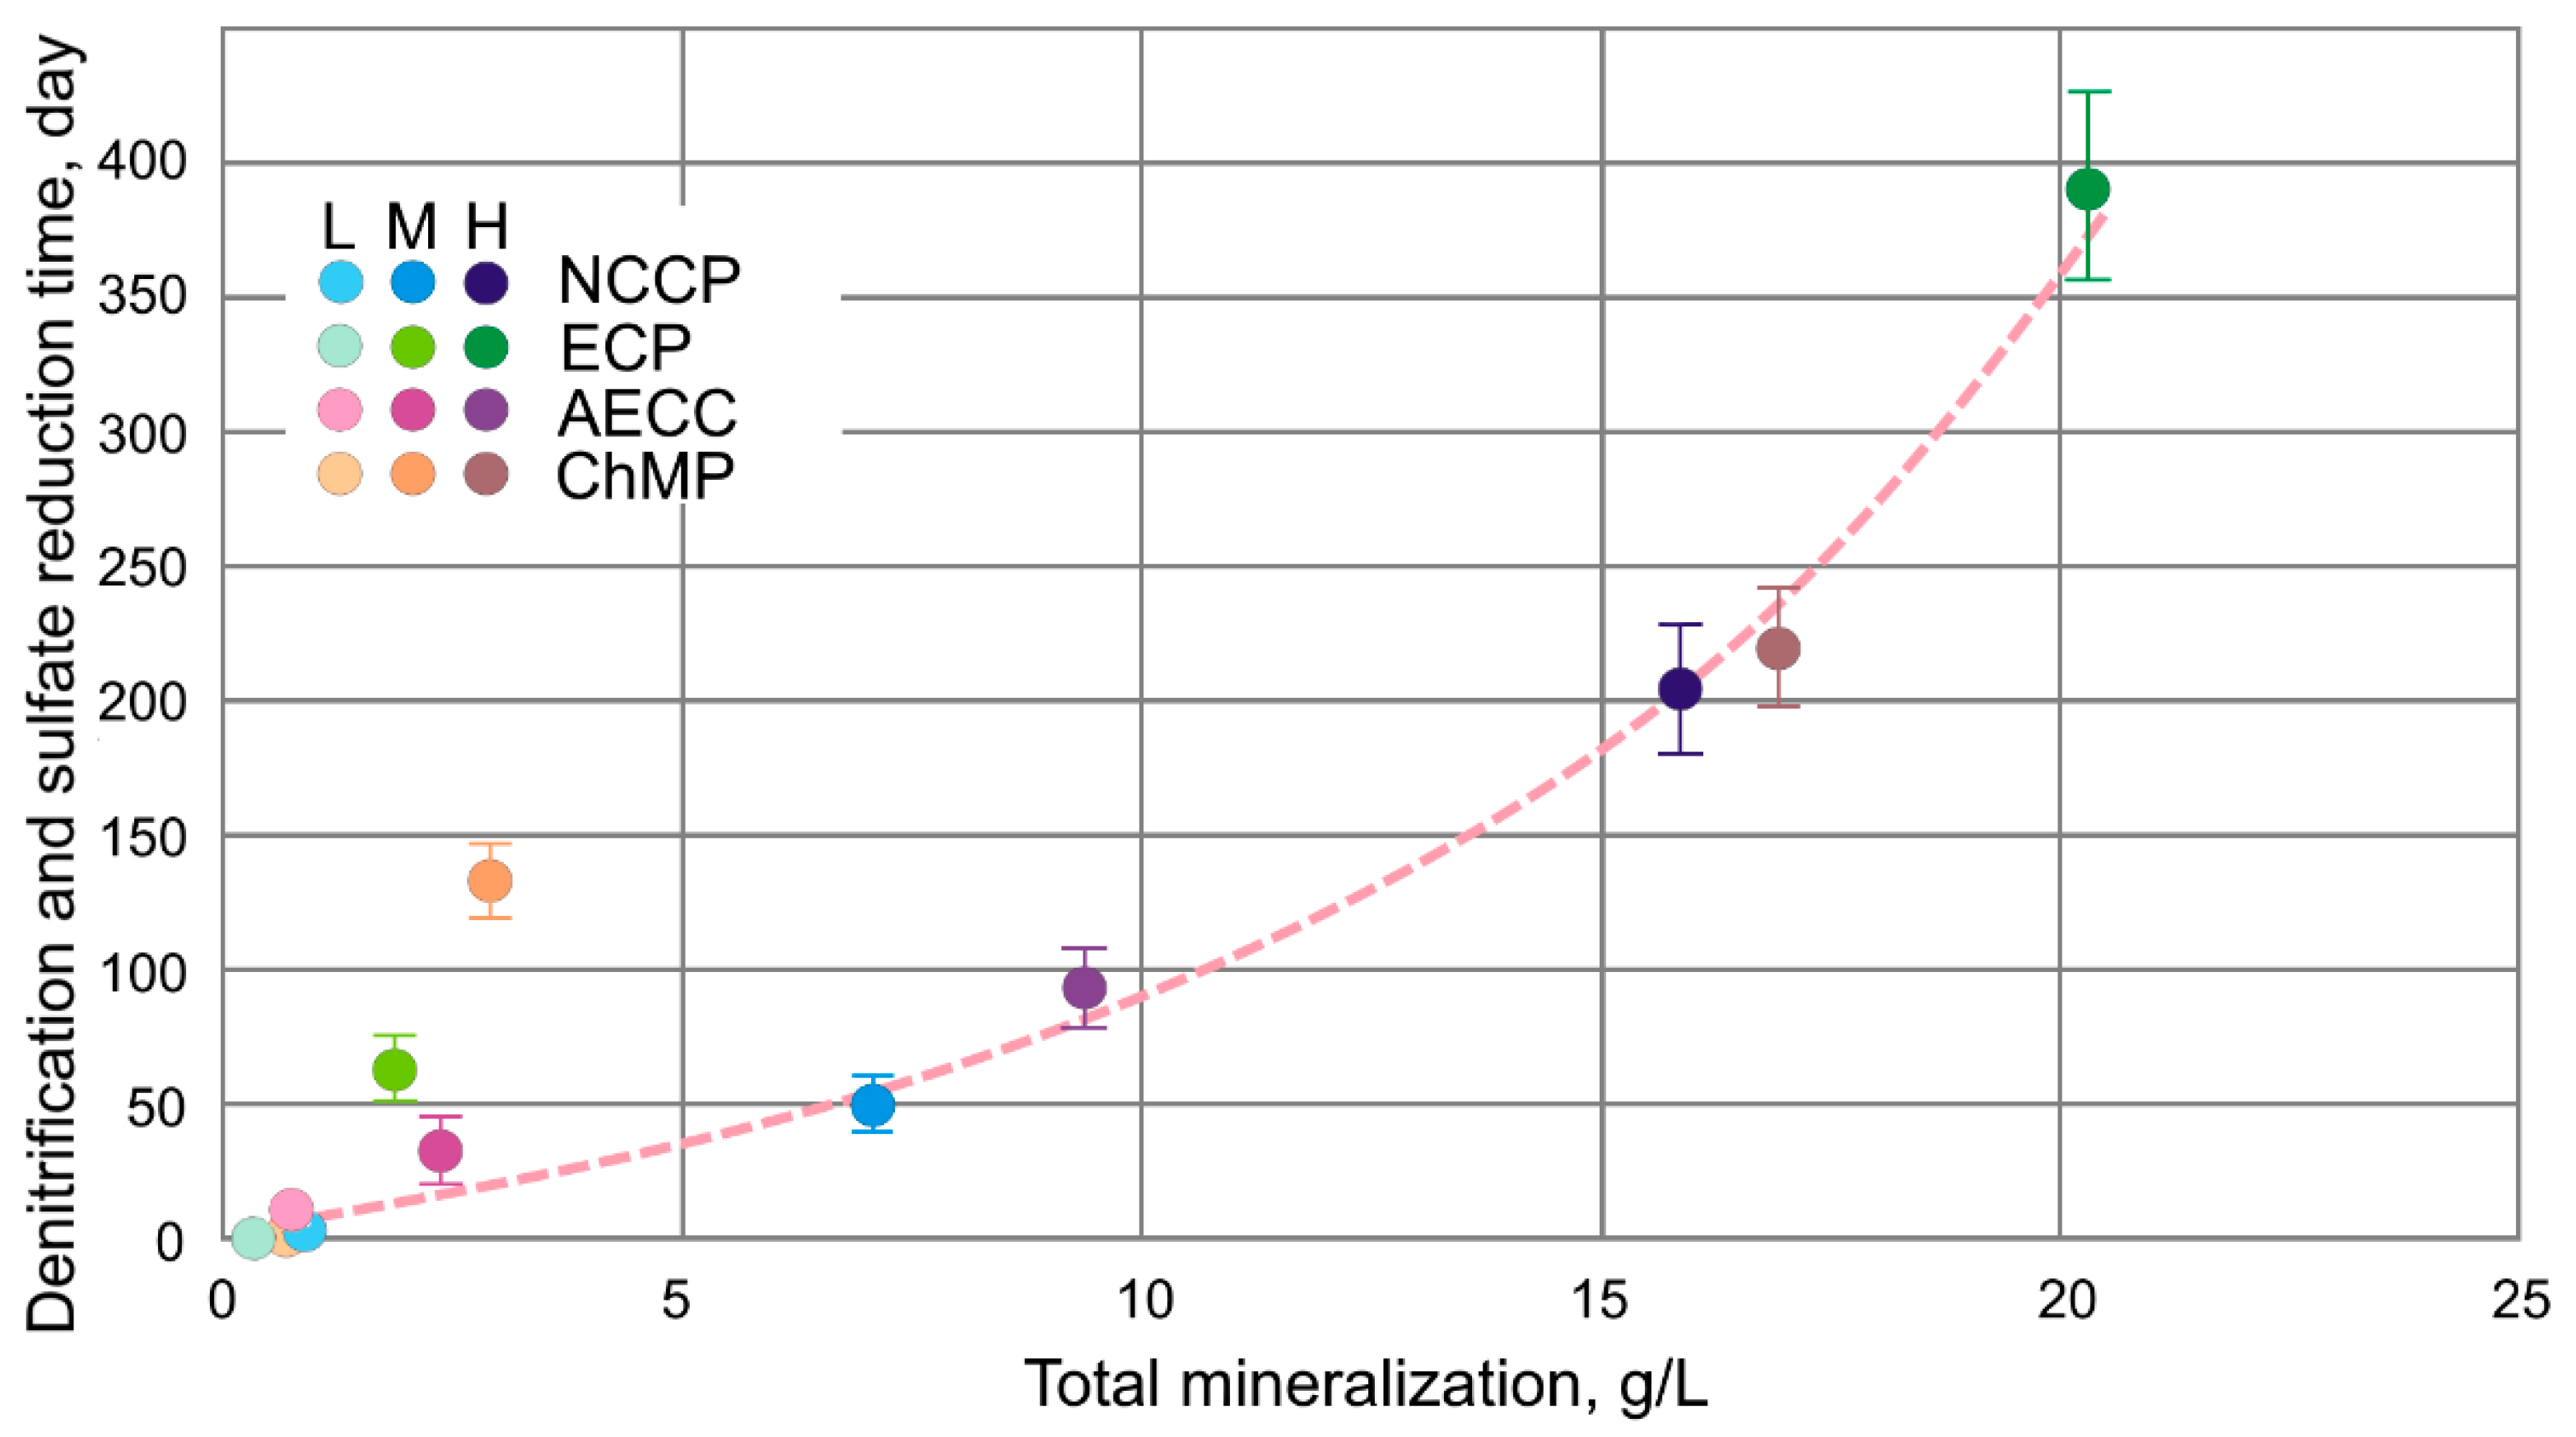
| Sample | Total Mineralization | Initial Nitrate mg/L | Initial Sulfate mg/L | Time for Anaerobiosis Formation | Denitrification Rate | Sulfate Reduction Rate | Total Purification Time |
|---|---|---|---|---|---|---|---|
| AECC L | 0.73 | 1000 * | 500 * | 4 | 250 ± 14.5 | 28 ± 1.7 | 12 |
| AECC M | 2.35 | 1000 * | 1615 | 6 | 200 ± 10.0 | 36 ± 2.0 | 30 |
| AECC H | 9.38 | 3290 | 8248 | 11 | 127 ± 7.2 | 73 ± 4.5 | 75 |
| ECP L | 0.34 | 1000 * | 200 * | 3 | 200 ± 10.0 | 13 ± 0.9 | 0 |
| ECP M | 1.86 | 2334 | 143 | 14 | 93 ± 5.5 | 2.3 ± 0.3 | 40 |
| ECP H | 20.28 | 11,200 | 358 | 50 | 62 ± 3.7 | 1.1 ± 0.3 | 210 |
| NCPP L | 0.88 | 1000 * | 358 | 3 | 143 ± 8.8 | 34 ± 2.0 | 7 |
| NCPP M | 7.06 | 1124 | 500 * | 5 | 161 ± 9.0 | 7.4 ± 0.5 | 45 |
| NCPP H | 15.86 | 6169 | 1769 | 12 | 82 ± 4.5 | 9.0 ± 0.6 | 130 |
| ChMP L | 0.71 | 1000 * | 500 * | 4 | 200 ± 10.0 | 24 ± 1.5 | 14 |
| ChMP M | 2.9 | 1000 * | 1180 | 7 | 111 ± 6.0 | 8.7 ± 0.6 | 90 |
| ChMP H | 16.9 | 2240 | 2370 | 25 | 25 ± 1.5 | 12.1 ± 0.8 | 140 |
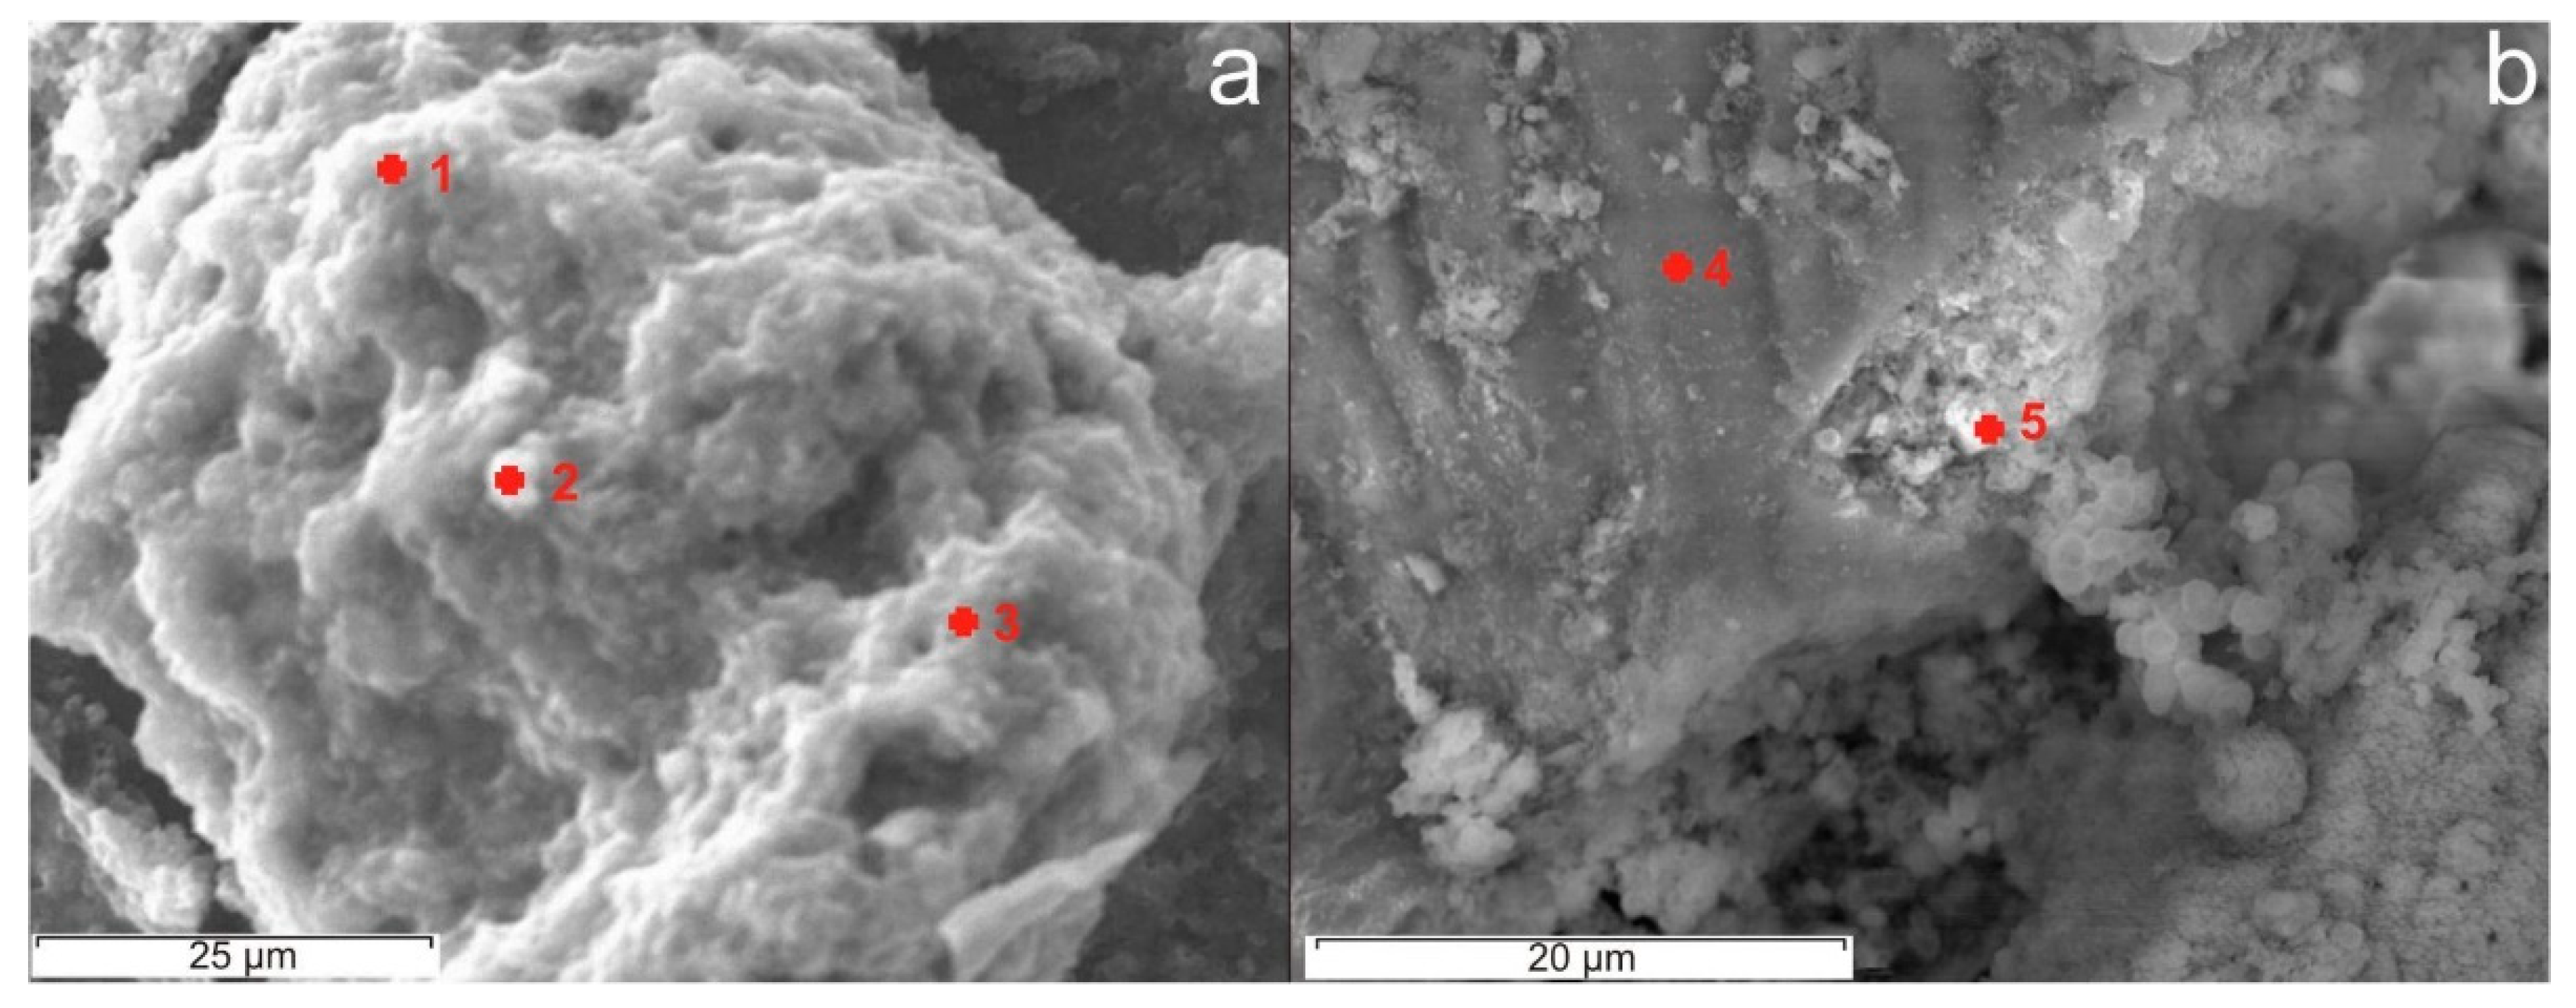
| Point | Si | Al | Fe | Mg | Ca | K | U | P | S |
|---|---|---|---|---|---|---|---|---|---|
| 1 | 3.0 ± 0.15 | 1.3 ± 0.19 | 9.4 ± 0.47 | 0.3 ± 0.02 | - | 2.1 ± 0.14 | 32 ± 1.6 | 4.0 ± 0.21 | - |
| 2 | 5.0 ± 0.25 | 1.10 ± 0.08 | 0.67 ± 0.05 | - | - | 2.6 ± 0.18 | 36 ± 1.8 | 4.6 ± 0.23 | 0.22 ± 0.02 |
| 3 | 3.3 ± 0.16 | 0.86 ± 0.06 | 0.55 ± 0.04 | - | - | 3.0 ± 0.21 | 42 ± 2.1 | 5.2 ± 0.26 | 0.26 ± 0.02 |
| 4 | 31 ± 1.6 | 9.9 ± 0.5 | - | - | 0.30 ± 0.02 | 11.0 ± 0.55 | - | - | - |
| 5 | 5.0 ± 0.25 | 1.10 ± 0.08 | - | - | 4.1 ± 0.3 | - | 13 ± 0.65 | 3.2 ± 0.16 | 0.10 ± 0.01 |
| Object | TDS | NO3 | SO4 | NH4 | AIR | DN | SR | Shannon | OTU Den | OTU An | Denitrification Rate | Sulfate Reduction Rate | Denitrification Time | Sum | |
|---|---|---|---|---|---|---|---|---|---|---|---|---|---|---|---|
| AECC mid AECC | 5 | 3 | 2 | 5 | 1 | 5 | 4 | 1 | 5 | 0 | 5 | 4 | 5 | 45 | rapidly |
| NCPP mid | 3 | 3 | 2 | 5 | 1 | 1 | 2 | 3 | 5 | 0 | 4 | 1 | 5 | 35 | rapidly |
| AECC max | 3 | 2 | 1 | 3 | 2 | 5 | 2 | 4 | 5 | 0 | 3 | 5 | 4 | 39 | rapidly |
| ECP mid | 4 | 2 | 2 | 5 | 1 | 1 | 3 | 3 | 2 | 0 | 3 | 1 | 4 | 31 | moderately |
| ChMP mid | 4 | 2 | 1 | 3 | 2 | 4 | 3 | 4 | 1 | 1 | 3 | 1 | 3 | 32 | moderately |
| NCPP max | 2 | 1 | 1 | 3 | 1 | 1 | 4 | 5 | 5 | 0 | 2 | 2 | 3 | 30 | moderately |
| ChMP max | 2 | 1 | 1 | 1 | 5 | 5 | 1 | 3 | 1 | 1 | 1 | 3 | 3 | 28 | slowly |
| ECP max | 1 | 1 | 1 | 4 | 2 | 3 | 2 | 3 | 2 | 0 | 2 | 1 | 1 | 23 | slowly |
Disclaimer/Publisher’s Note: The statements, opinions and data contained in all publications are solely those of the individual author(s) and contributor(s) and not of MDPI and/or the editor(s). MDPI and/or the editor(s) disclaim responsibility for any injury to people or property resulting from any ideas, methods, instructions or products referred to in the content. |
© 2023 by the authors. Licensee MDPI, Basel, Switzerland. This article is an open access article distributed under the terms and conditions of the Creative Commons Attribution (CC BY) license (https://creativecommons.org/licenses/by/4.0/).
Share and Cite
Boguslavsky, A.; Shvartseva, O.; Popova, N.; Safonov, A. Biogeochemical In Situ Barriers in the Aquifers near Uranium Sludge Storages. Water 2023, 15, 3020. https://doi.org/10.3390/w15173020
Boguslavsky A, Shvartseva O, Popova N, Safonov A. Biogeochemical In Situ Barriers in the Aquifers near Uranium Sludge Storages. Water. 2023; 15(17):3020. https://doi.org/10.3390/w15173020
Chicago/Turabian StyleBoguslavsky, Anatoly, Olga Shvartseva, Nadezhda Popova, and Alexey Safonov. 2023. "Biogeochemical In Situ Barriers in the Aquifers near Uranium Sludge Storages" Water 15, no. 17: 3020. https://doi.org/10.3390/w15173020
APA StyleBoguslavsky, A., Shvartseva, O., Popova, N., & Safonov, A. (2023). Biogeochemical In Situ Barriers in the Aquifers near Uranium Sludge Storages. Water, 15(17), 3020. https://doi.org/10.3390/w15173020