Article

Groundwater Quality Assessment for Drinking and Irrigation Purposes at Al-Jouf Area in KSA Using Artificial Neural Network, GIS, and Multivariate Statistical Techniques

1
Department of Civil Engineering, College of Engineering, Jouf University, Sakakah 72388, Saudi Arabia
2
Environmental Engineering Department, Faculty of Engineering, Zagazig University, Zagazig 44519, Egypt
3
Civil Engineering Department, College of Engineering, Shaqra University, Al-Duwadmi 11911, Saudi Arabia
4
Water Desalination and Reuse Center, Division of Biological and Environmental Science and Engineering, King Abdullah University of Science and Technology, Thuwal 23955, Saudi Arabia
5
Construction Engineering & Utilities Department, Faculty of Engineering, Zagazig University, Zagazig 44519, Egypt
6
Computer Engineering Department, Engineering and Information Technology College, Buraydah Private Colleges, Buraydah 51418, Saudi Arabia
7
Computer and Systems Engineering Department, Faculty of Engineering, Zagazig University, Zagazig 44519, Egypt
8
Department of Computer Science, College of Science and Humanities, Shaqra University, Al Quwaiiyah 11961, Saudi Arabia
*
Author to whom correspondence should be addressed.
Water 2023, 15(16), 2982; https://doi.org/10.3390/w15162982
Submission received: 18 July 2023 / Revised: 9 August 2023 / Accepted: 14 August 2023 / Published: 18 August 2023

Abstract

:
Groundwater is an essential resource for drinking and agricultural purposes in the Al-Jouf region, Saudi Arabia. The main objective of this study is to assess groundwater quality for drinking and irrigation purposes in the Al-Jouf region. Physicochemical characteristics of groundwater were determined, including total dissolved solids (TDS), pH, electric conductivity (EC), hardness, and various anions and cations. The groundwater quality index (WQI) was calculated to determine the suitability of groundwater for drinking purposes. The EC, sodium percentage (Na+ %), magnesium hazard (MH), sodium adsorption ratio (SAR), potential salinity (PS), and Kelley’s ratio (KR) were assessed to evaluate the suitability of groundwater for irrigation. Effective statistical tests and Feed-forward neural network (FFNN) modeling were applied to reveal the correlation between parameters and predict WQI. The results indicated that approximately all samples are appropriate for drinking and irrigation uses except samples of the Al Qaryat region. The ionic abundance ranking was Na+ > Ca2+ > Mg2+ > K+ for cations, and Cl > SO42− > NO3 for anions. Moreover, the groundwater is dominated by alkali metals (K+ and Na+) and controlled by the rock–water interaction process. The indicators of groundwater quality for irrigation and drinking according to the following criteria (Na+ %, SAR, KR, MH, PS, WQI (WHO), and WQI (BIS)) can be predicted by the FFNN with root mean square errors (RMSE) of 0.136, 0.070, 0.022, 0.073, 2.45 × 10³, 1.45 × 10⁻², and 1.18 × 10⁻², respectively, and R2 of 0.99, 1.00, 0.99, 0.99, 1.00, 1.00, and 1.00, respectively.

1. Introduction

In the Kingdom of Saudi Arabia (KSA), demand for drinking and irrigation water increases due to population increase and agricultural expansion [1]. The KSA suffers from water scarcity and depends mainly on seawater desalination and/or groundwater for domestic purposes [2]. Desalinated water and groundwater represented 63% or 2.14 billion m3 and 37% or 1.26 billion m3 of the water distributed per year, respectively [1]. Groundwater is generally used for domestic, drinking, industrial, and agricultural purposes. Around 97% of irrigation water comes from groundwater resources [3]. Groundwater is also favored for drinking purposes because of its safety and quality compared to surface water; however, human activation increased affected its quality and added a lot of physical, chemical, and microbial pollutants [4,5,6].
Groundwater pollution is a global problem with significant effects on human health and environmental security [7]. The quality of groundwater can be influenced by different factors, such as geology, weathering system, the amount of recharged water, and the interaction between rock and water [5,8,9]. Sources of aquifer degradation include lithogenic, anthropogenic, and seawater intrusion [1]. Anthropogenic pollution comes from industrial effluents, fertilizers, pesticides, domestic wastewater, and landfills; meanwhile, geogenic pollution derives from geological sources [10,11]. Carbonate sedimentary rocks enriched with gypsum mineral is a geogenic source of sulfate [12]. Magnesium may be derived from geogenic (ion exchange, ferromagnesium minerals, and seawater) or anthropogenic sources such as industrial wastage and mining activities. The presence of CO2 in the soil zone and ion exchange can be a source of calcium in the groundwater [13]. Sodium may be attributed to persistent evaporation and cation exchange and can also be derived from processes such as silicate weathering and reactions of cation exchange [14]. Chlorine can be derived from some anthropogenic sources or from different sources, such as weathering of minerals and leaching [15]. Exposure to potentially toxic chemicals can cause serious adverse human health effects, including a variety of cancers, intellectual disabilities, and neurological, cardiovascular, kidney, and bone diseases [8].
Thus, there is more attention to irrigation as well as drinking water quality guidelines according to national and international standards such as Saudi Standards, Metrology and Quality Organization (SASO), Bureau of Indian Standard (BIS), and World Health Organization (WHO) [16,17,18]. The water quality index (WQI) is essential to evaluate the water quality that can be compared with national or international standards [19]. Also, the quality of groundwater for irrigation purposes can be assessed using various indicators such as electric conductivity (EC), sodium percentage (Na+ %), magnesium hazard (MH), potential salinity (PS), sodium adsorption ratio (SAR), and Kelley’s ratio (KR) [20,21,22].
Many studies investigated groundwater quality for agriculture and drinking purposes in some regions in KSA. Most of the groundwater pollutants in several cities of KSA are of natural origin [2]. More than two-thirds of wells in the Albaha region are inappropriate for irrigation and drinking uses [4]. Most of the groundwater in the Khulais region, Makkah Province, was unsuitable for irrigation purposes [1]. The water quality of groundwater is acceptable and could be used safely for drinking and domestic purposes in the Jazan region [23]. The groundwater is suitable for irrigation; however, it is unsafe water for drinking at the Salilah village, Madinah Munawara [22].
In fact, artificial neural networks (ANNs) are widely used in different environmental applications to examine the match between the measured and predicted concentrations of certain important parameters [24,25,26,27]. The acceptable performance of ANNs in modeling is two-fold; first, it supports the theoretical analysis, and second, it provides a helpful model to predict the level of output parameters for similar input data. In terms of groundwater management, GIS/ANN modeling is an alternative data analysis to obtain fast results using a less complicated approach whose results are satisfactory [28,29].
Al-Jouf region is one of the agricultural areas in KSA [3]. Due to the increase in drinking water requirements and the unexpected acceleration of agricultural activities in the Al-Jouf area, there is an urgent interest in studying groundwater quality for irrigation and drinking purposes. Moreover, the studies related to groundwater quality in the Al-Jouf region are very limited. Therefore, the main objective of this study is to assess groundwater quality for drinking and irrigation purposes in the Al-Jouf region in KSA. This can be achieved by analyzing some important physical and chemical parameters of groundwater and evaluating WQI, then comparing it with national and international standards. Multivariate statistical techniques to reveal correlations between parameters and GIS for the spatial distribution of parameters and groundwater quality will be applied. Moreover, this study will contribute to testing Feed-forward neural network (FFNN) model to forecast and predict groundwater quality indices for irrigation and drinking purposes. The effect of the important design parameters of FFNNs, such as the number of hidden layers, training algorithm, and activation functions, will be considered.
Geological setting: Al-Jouf region is differentiated geologically by several lithological units. The Sirhan Formation, which dates from the Miocene to the Pliocene Epochs, is composed of friable calcareous sandstone, limestone, and shale layers with small chert and clay beds [30]. The Upper Tertiary and Quaternary rocks of Harrat al Harrah are formed of flood basalts that overlie Tertiary sedimentary rocks (Sirhan Formation) [31]. Calcareous and gypsiferous duricrusts, gravel, eolian sand, alluvium, and sabkha deposits are among the Quaternary deposits. These deposits are difficult to trace individually because they overlap and have broad and ambiguous borders [32].
Unconsolidated gravel deposits, eolian sand, and alluvium (silt, sand, and gravel) dominate the region. The calcareous duricrust is large, cemented, hard, and weathering rubbly, resembling massive limestone. Eolian deposits are typically found atop alluvial materials such as sand sheets or dunes. These dunes are a mix of barchanoid ridge-type and linear (sief) dunes that move east to southeast due to northwesterly and southwesterly wind patterns. In the Wadi as Sirhan and the smaller basins, alluvial silt, sand, and gravel create enormous deposits. Interlayered sheets and lenticular masses of poorly sorted gravels and gravelly sands, moderately sorted sands, and clayey silts dominate these deposits. The notable elongated sabkhas are formed of silt and clay layers interbedded with gypsum and calcite and are situated along the northeast trending axis of the Wadi as Sirhan [3]. Figure 1 shows geological provinces, geological units, volcanics, and intrusives at the Al-Jouf region according to Open-File Report 97-470B by USGS [33].

2. Material and Methods

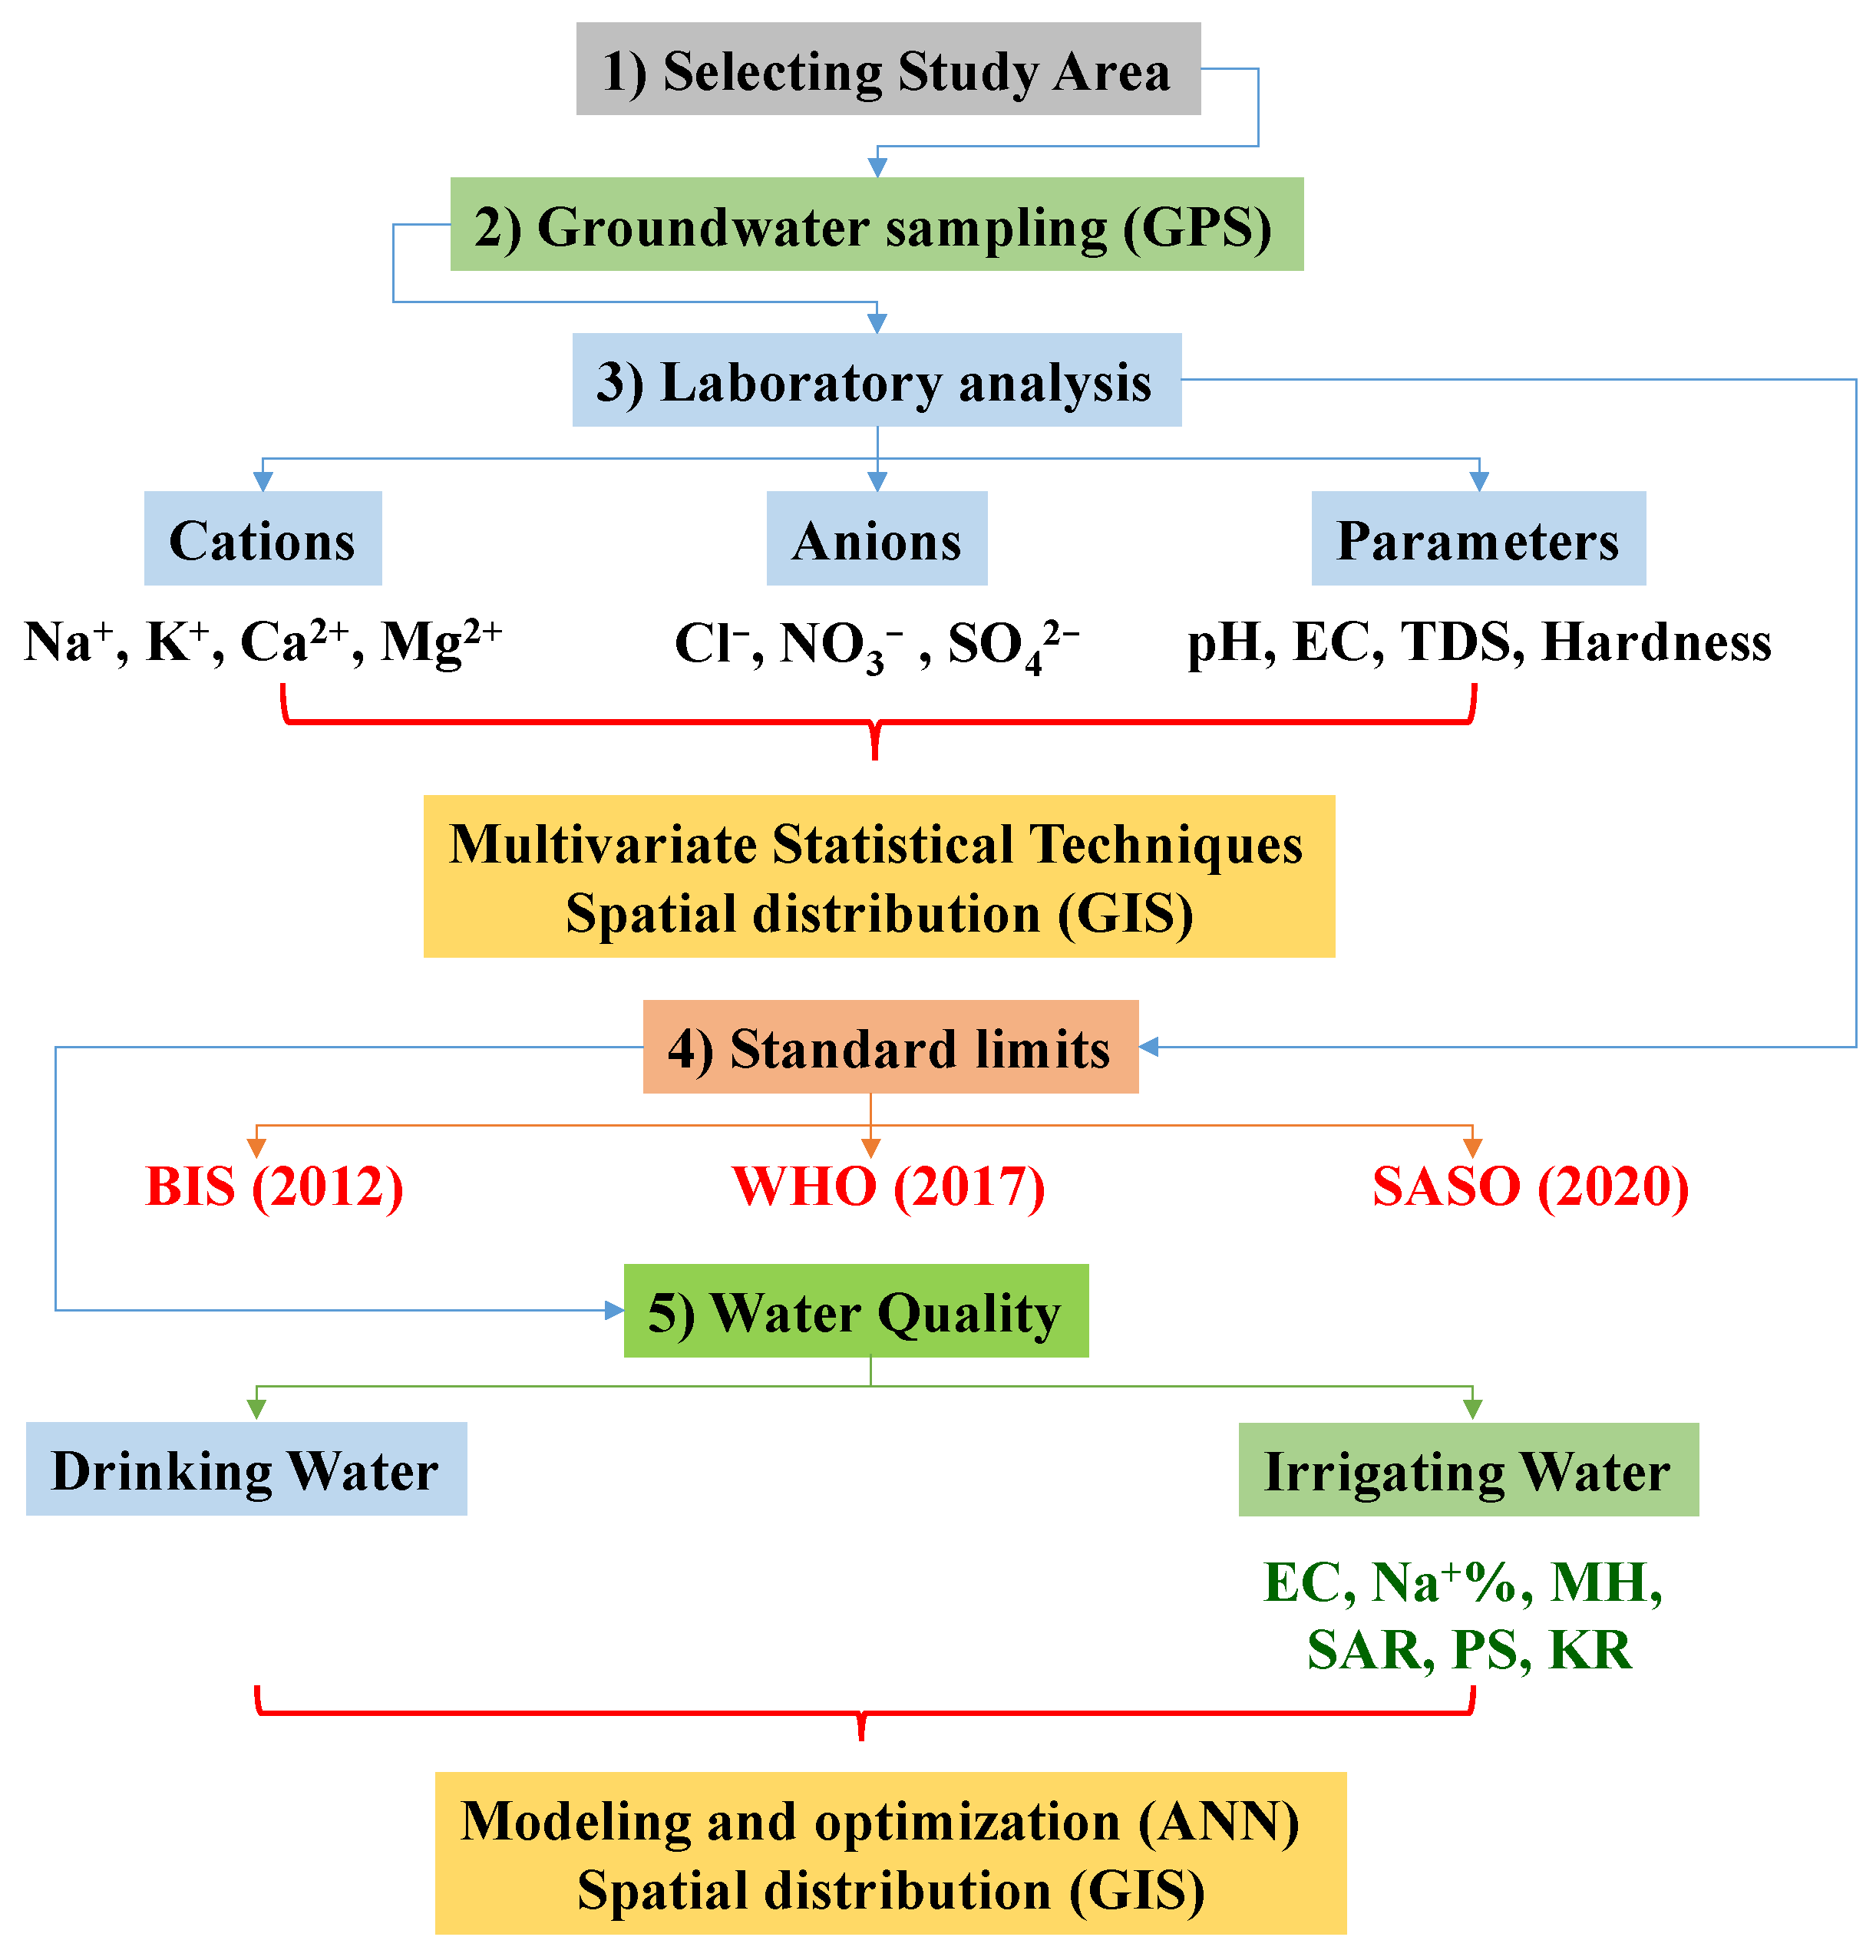
Figure 2 shows the methodology of the current study, which includes groundwater sampling and analysis, comparing the obtained results with national and international standards, statistical analysis for the different parameters, modeling, and optimization of the different indices, and spatial distribution for sample locations, different parameters, and water quality index using GIS.

2.1. Water Sampling and Analysis

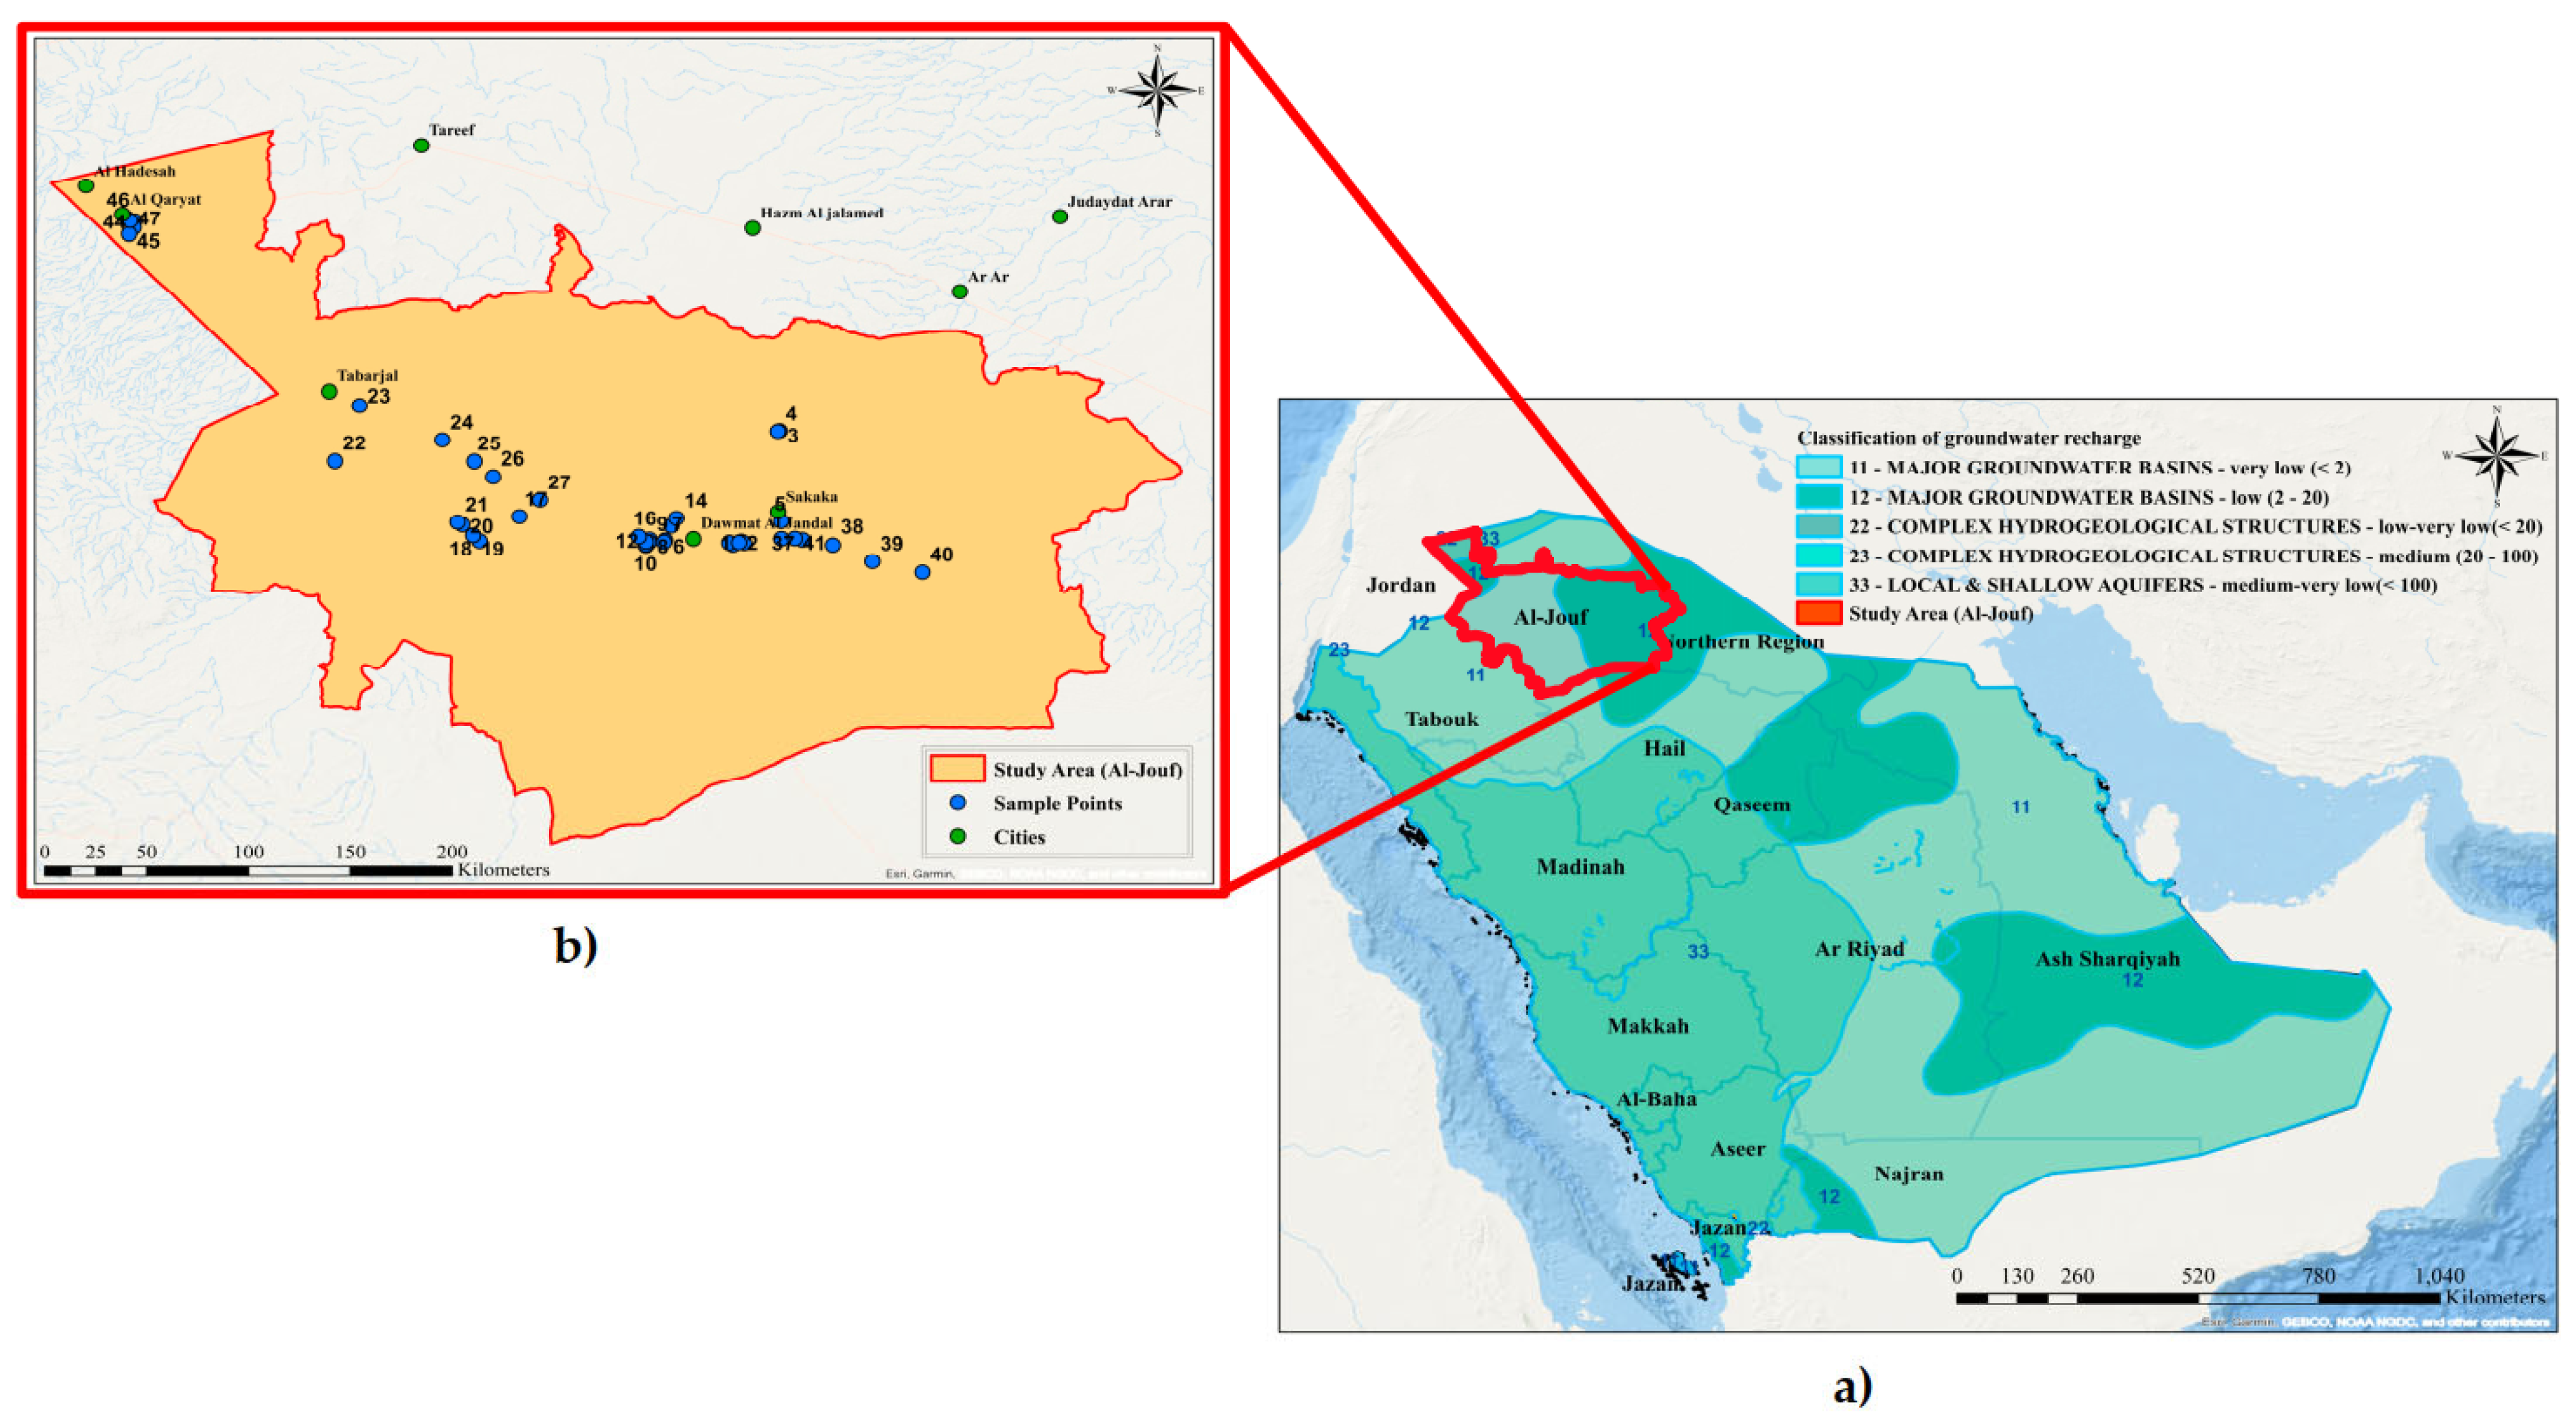
The current study was performed in the irrigated areas of the Al-Jouf region in KSA. A total of 47 selected samples of groundwater were gathered from agriculture farms at different locations, see Figure 3a,b. The farms varied from small (5–10 ha) to medium (20–25 ha) and big size (50–100 ha). The wells varied in depth from 100 to 300 m. The sampling was running for at least 2–3 h to get a representative sample from each agriculture farm. A 300 mL capacity sample was collected in a sterile plastic bottle from each well and sealed properly, then stored in an ice box until subsequent laboratory analysis.
All water samples were analyzed to measure the concentration of different cations (Ca2+, Na+, K+, and Mg2+) using 5110 ICP-OES (Agilent technologies, Santa Clara, CA, USA) and anions (Cl, SO42−, and NO3) using Ion Chromatography (Dionex, ICS 1600) (Thermo Scientific, Santa Clara, CA, USA). In addition, Orion 5-star plus instrument (Thermo Scientific, Santa Clara, CA, USA). has been used for measuring pH, EC, TDS, and hardness. Three measurements per sample were taken, and the average value was calculated.

2.2. Water Quality Index

2.2.1. Drinking Purpose

The groundwater quality index for drinking use was calculated based on drinking water standards of BIS and WHO. Ten important physicochemical parameters were used for calculating WQI (Table 1). WQI has been calculated according to a previous study [20].

2.2.2. Irrigation Purpose

To determine the suitability of groundwater for irrigation purposes, important parameters for groundwater quality such as EC, Na+ %, SAR, MH, KR, and PS were calculated according to [20,36,37,38,39] using the following equations:
Na +   % = Na + + K + Ca 2 + + Mg 2 + +   Na + +   K +   ×   100
MH = Mg 2 + Ca 2 + + Mg 2 +   ×   100
SAR = Na + Ca 2 + + Mg 2 + / 2
PS = Cl + 1 2 SO 4 2
KR = Na + Ca 2 + +   Mg 2 +

2.3. Data Analysis Utilizing GIS

The spatial distribution of groundwater experimental data using GIS has been applied for making groundwater assessments. In the current study, location data of groundwater samples was mapped in Figure 3b through a point layer created by GIS software version 10.8. Each sample point received a different code, which was then inserted into the point attribute table. The database file has separate columns for each sampling site’s chemical parameter values and sample codes. The spatial distribution maps for the different parameters, and WQI were created using the geodatabase. The maps were illustrated using the inverse distance weighted (IDW) interpolation technique from the spatial analyst tools in the ArcGIS V10.8 toolbox has been utilized to produce the spatial distribution maps [40]. The inverse distance weighted technique is one of several interpolation techniques to map the parameters of water quality by interpolating data spatially, and it is one of the most widely use techniques in previously similar studies [41].

2.4. Multivariate Statistical Techniques

The statistical analysis was carried out using MS Excel and Statistical Package for Social Sciences (SPSS 22.0). Minimum (Min), maximum (Max), mean, and standard deviation (SD) of each parameter were calculated. Pearson’s correlation analysis was applied to recognize the relationship between the different parameters. Moreover, dimensionality reduction was performed by running principal component analysis (PCA) procedure. Then, factor analysis (FA) was carried out for more interpretation of latent variables in collected records. It was used to extract the principal factors based on eigenvalues.
The term hydrogeochemical facies indicates to chemical character of water solutions that are found in systems. Various techniques, such as statistical and graphical analysis, can be used to interpret hydrogeochemistry of groundwater, but Gibbs and Piper’s diagrams are commonly utilized to create hydrogeochemical facies [20]. So, they were used to study the similarities and differences in the composition of water and to classify them into certain chemical types.

2.5. Artificial Neural Network

Artificial neural networks (ANNs) are statistical modeling used in various engineering applications to model and predict different environmental problems [24,25,26,27]. In this study, three levels are featured in the Feed-forward neural network (FFNN) that consists of three layers, see Figure 4. The input layer is the layer from which the model’s inputs to the model originate. These inputs come from the analysis of TDS, pH, EC, hardness, and various anions and cations in groundwater samples. The WQI, Na+ %, SAR, KR, MH, and PS were calculated to determine the groundwater suitability for irrigation and drinking purposes. There are M neurons in the hidden layer with a particular activation function, as described by tansig in Equation (6), are present in the hidden layer. One neuron in the output layer has a purelin-like activation function, which is used to predict the suitability of groundwater.
tansig ( x ) = 2 1 + exp 2 x     1
Finding the best weights and biases for the connections between layers in the network is the goal of network training, where x is the input to this function. The neuron output can often be written as in Equation (7).
o j = f ( i = 1 k W i j + b j )
where, o j . denotes the output of the j-th neuron in a layer that is not an input, W i j . denotes the weight of the connection between the i-th neuron in the layer before, b j . denotes the bias value, and f ( · ) denotes the activation function.
The training process of an FFNN-based predictive model is shown in a flowchart in Figure 5. The training (70%), validation (15%), and testing groups are randomly formed from the data samples (15%). A range of 70–30% is a common test criterion for neural network models in diverse applications. It is widely used in similar previous studies [25,26]. Starting from a random set of weights and biases for all compounds, the FFNN is trained. The root mean square error (RMSE), given in Equation (8), and the coefficient of determination R2 are used to evaluate the performance of the model, given in Equation (9).
RMSE = 1 N i = 1 N ( T i     O i ) 2
R 2   = 1     i = 1 N ( T i     O i ) 2 i = 1 N ( T i     T - ) 2
where N is the sample size (training, validation, or test), T i is the target value (i.e., the outcome of the experiment), T ¯ represents the mean of target values, and O i is the output of the corresponding model. To track model behavior and avoid overfitting, the RMSE is calculated for both the training set and the validation set. After the training phase is completed, the RMSE for the test set is determined. The entire procedure is repeated for a predetermined number of runs to determine the average model behavior.

3. Results and Discussion

3.1. Groundwater Parameter Analysis

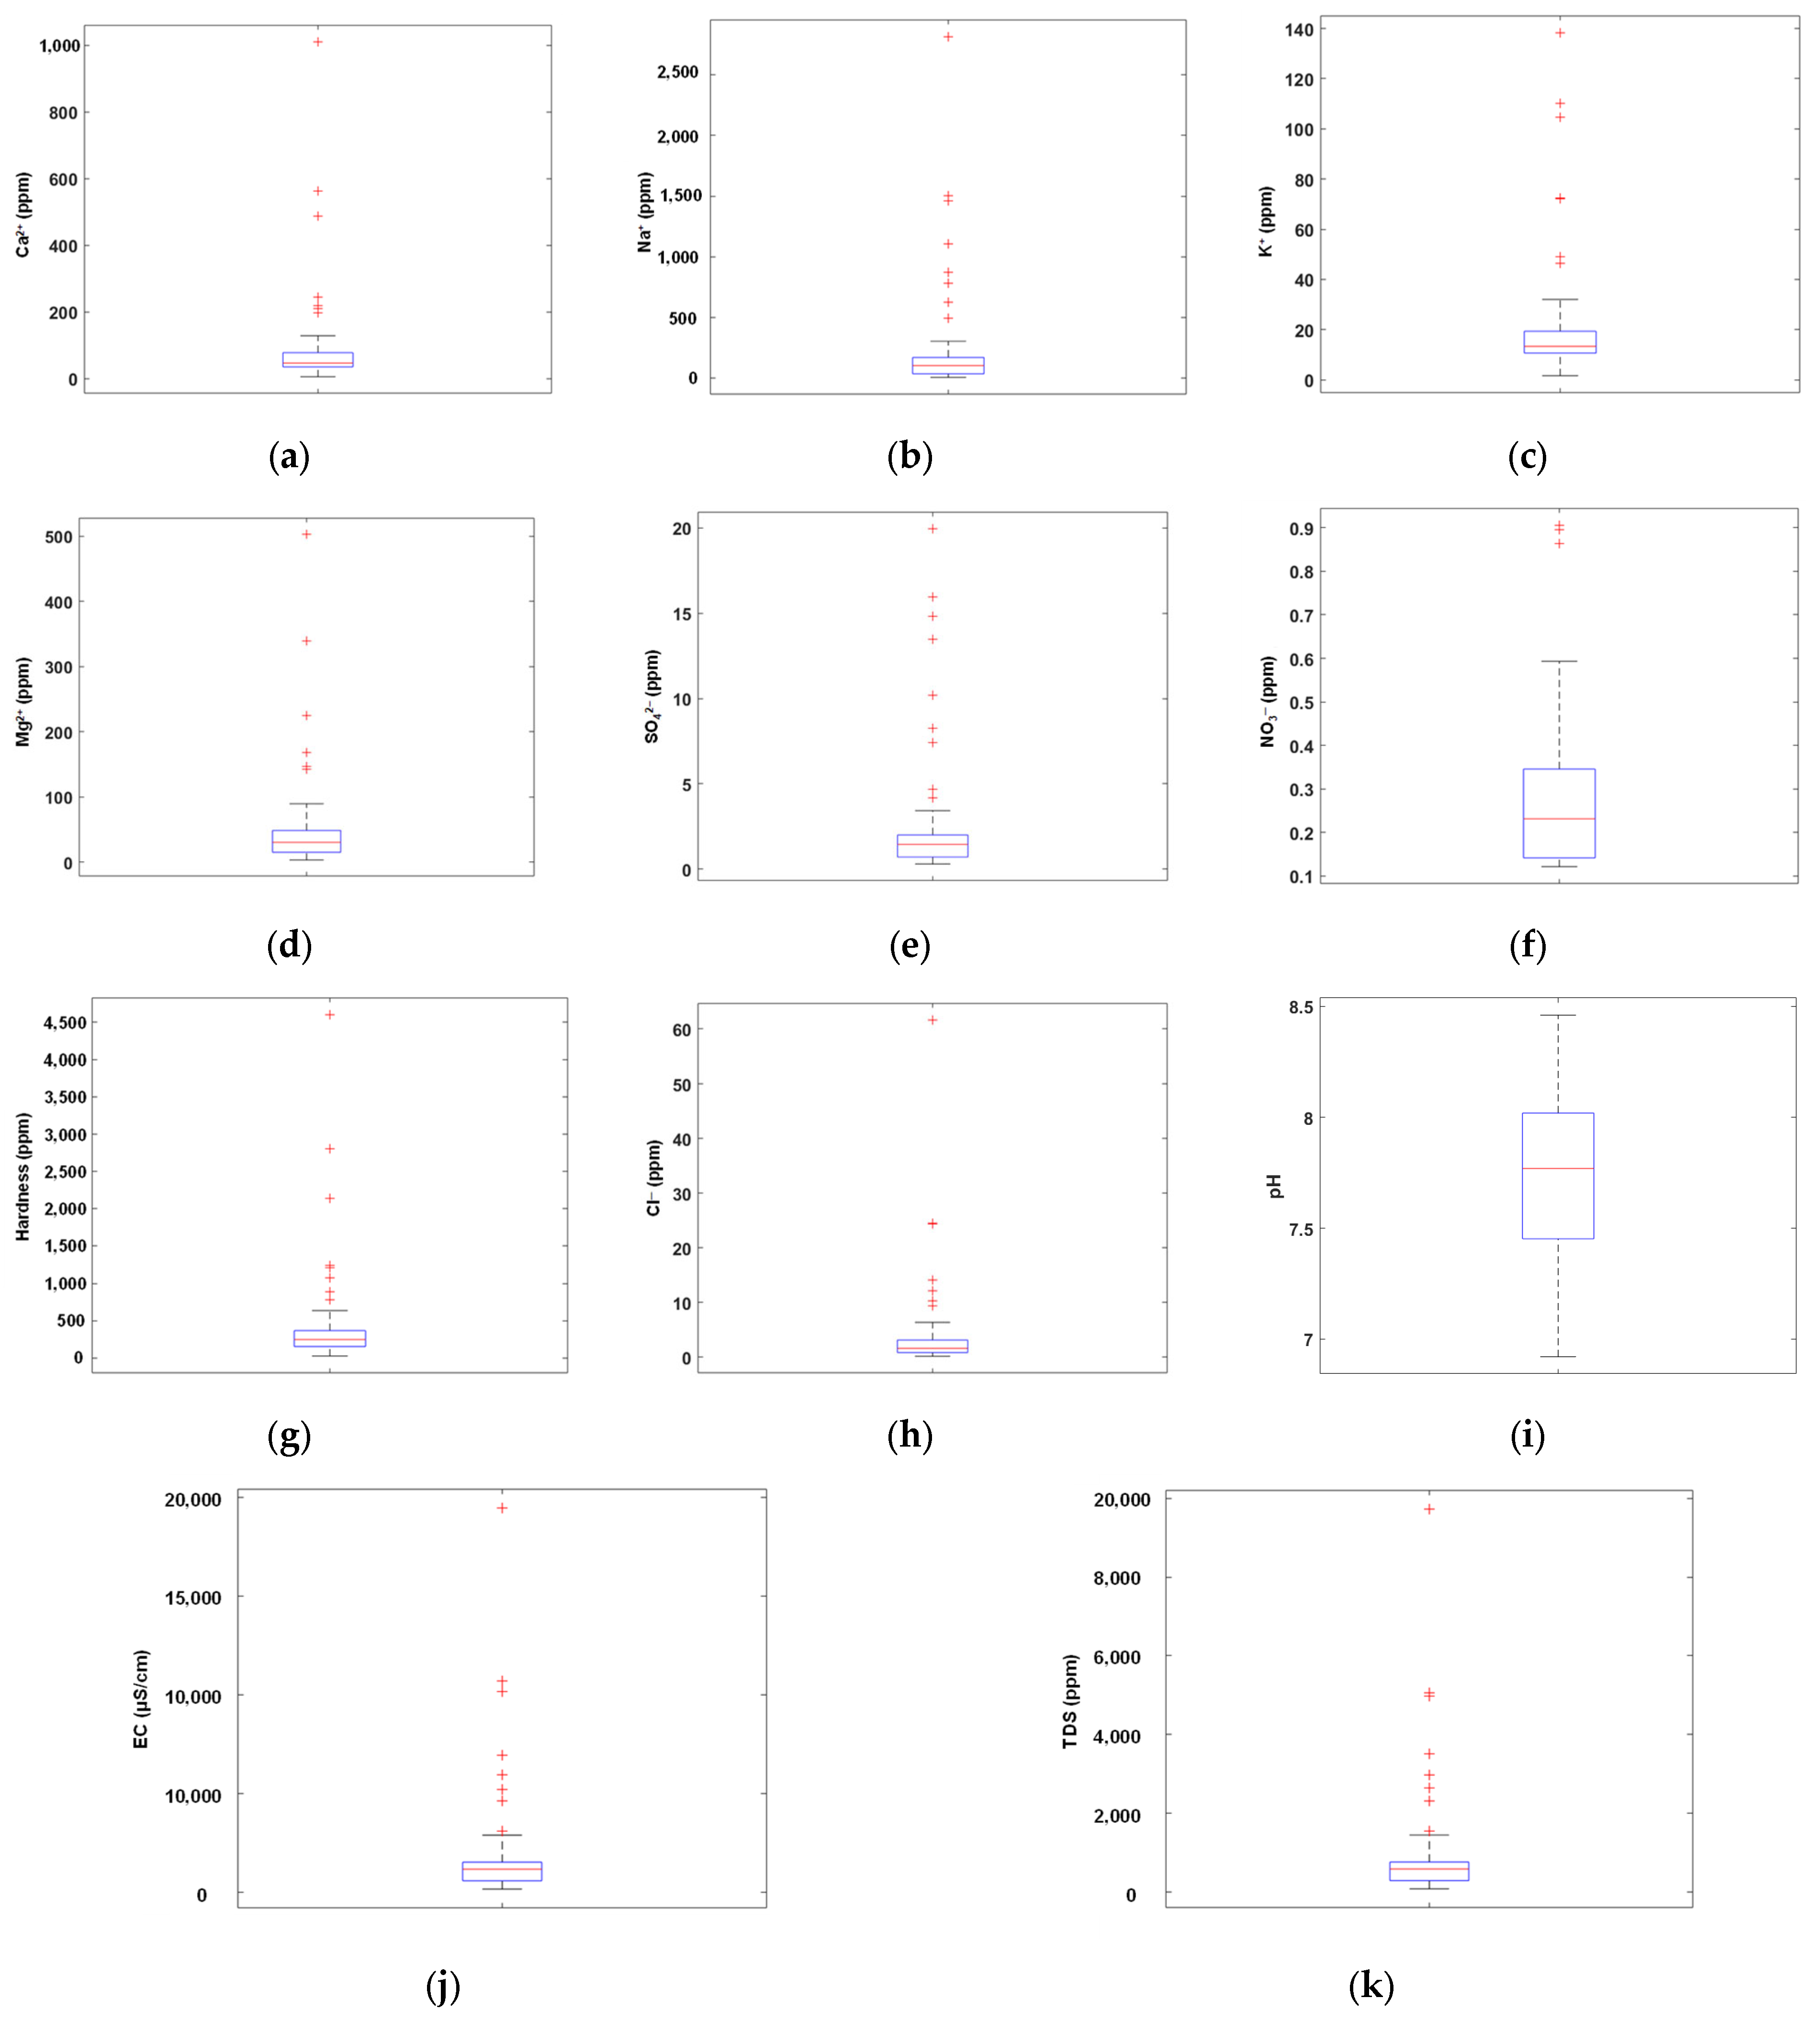
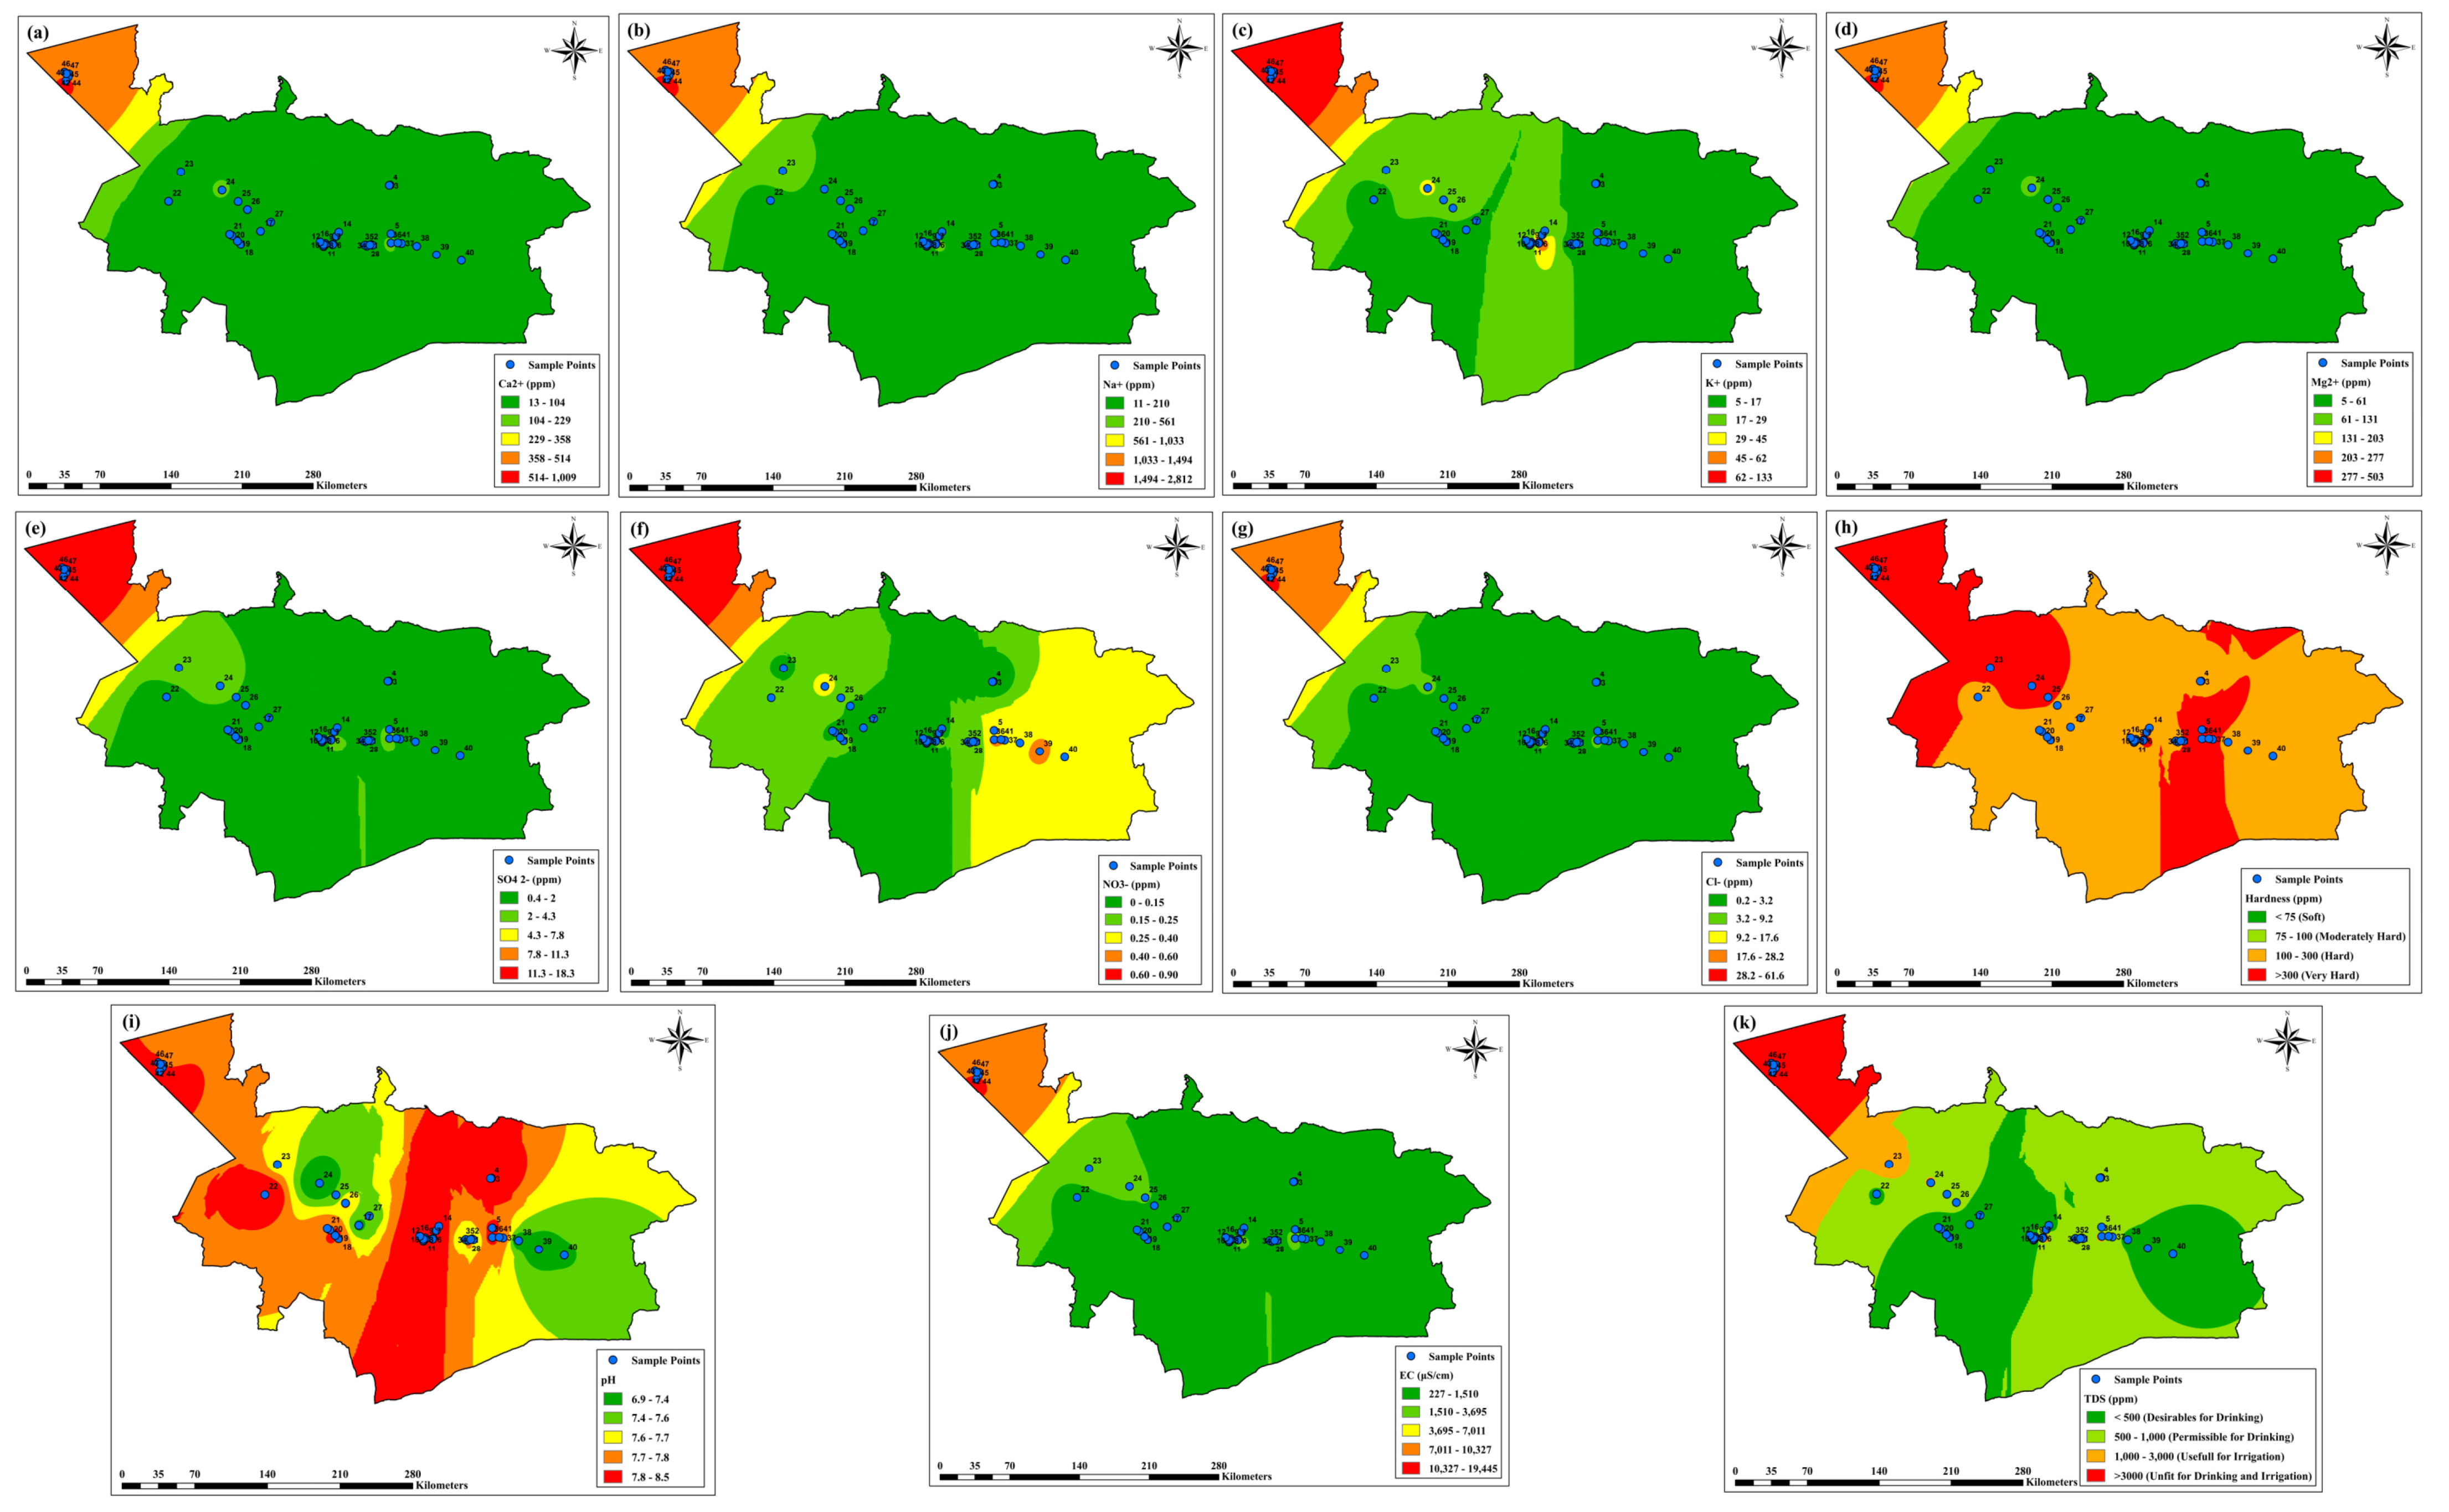
To determine groundwater suitability for drinking, groundwater parameters were compared with the BIS, WHO, and SASO standards [16,17,18], as shown in Table 2. Figure 6 illustrates the characteristics and variations of the different parameters. The Ca2+ concentration is useful for the growth of teeth and bones [13]. The Ca2+ concentration in the samples ranged from 5.30 to 1010.40 ppm, with an average of 103.93 ppm. Almost all samples have Ca2+ concentration within the permissible limit (200 ppm), except samples in the Al Qaryat region (northern west of Al-Jouf region), see Figure 7a. The Na+ concentration varied from 5.30 to 2815.10 ppm, with an average of 275.74 ppm. Most of the samples have Na+ concentration below the permissible limit of 200 ppm, while a Na+ concentration higher than the permissible limit was detected for samples at the Al Qaryat region, as observed in Figure 7b. K+ concentration varied from 1.60 to 138.30 ppm, with an average of 23.88 ppm. More than 50% of the samples were found to have K+ concentration above the permissible limits (12 ppm); see the spatial distribution of K+ concentrations in Figure 7c. Mg2+ concentration ranged between 3.10 and 503.00 ppm, with an average of 59.94 ppm. The samples were found to be below the permissible limit, while samples in the Al Qaryat region showed higher Mg2+ concentrations than the permissible value of 150 ppm, see Figure 7d. The abundance order of cations was Na+ > Ca2+ > Mg2+ > K+.
High concentrations of SO42− indicate that groundwater is unsuitable for use [12]. Its concentration ranged from 0.30 to 19.96 ppm, with an average of 3.06 ppm, indicating very low concentrations below the permissible limits; see the spatial distribution of SO42− in Figure 7e. NO3 concentration is considered a groundwater pollutant due to industrialization, agricultural activities, and population growth increase [14]. The high nitrate concentration in groundwater results in health problems such as cancer and Blue baby disease [42]. Its concentration varied from 0.12 to 0.91 ppm with an average of 0.30 ppm, indicating very low concentrations below the permissible limits; see spatial distribution in Figure 7f. The high concentration of Cl in groundwater creates a salty taste and affects human health, causing kidney stones [15]. Its concentration ranged from 0.17 to 61.65 ppm, with an average of 4.77 ppm. All the groundwater samples showed values below the permissible limits; see its spatial distribution in Figure 7g. The results indicate the abundance of anions as Cl > SO42− > NO3 in the study area.
The groundwater water hardness is due to the presence of magnesium and calcium, and other metal ions [20]. Almost all the samples are below permissible limits and suitable for drinking purposes, while the Al Qaryat region showed hardness values higher than the permissible value of 600 ppm; see Figure 7h. The pH of groundwater varied from 6.92 to 8.46, with a mean value of 7.74, indicating a slightly alkaline nature of groundwater. All pH samples are within permissible limits of the standards; see Figure 7i. The values of EC for groundwater samples varied from 142 to 19470 μS/cm and had a mean value of 2194.47 μS/cm. The high value of EC implies high mineral content and salinity of groundwater with high infiltration and low runoff [43]. The groundwater type can be classified as follow: low salt concentrations (<1500 μS/cm), medium salt enrichment (1500–3000 μS/cm), and high salt enrichment (>3000 μS/cm) [44]. Almost all samples of groundwater have low salt enrichment except samples in the Al Qaryat region; see Figure 7j. TDS in groundwater includes all inorganic salts, which indicate the salinity and water suitability for human consumption [17]. TDS varied from 71 to 9730 ppm, with a mean value of 1090.40 ppm. Most samples were below the permissible limits except the samples in the Al Qaryat region that have TDS values higher than 2000 ppm, as shown in Figure 7k.

3.2. Multivariate Statistical Analysis

3.2.1. Correlation Analysis

Pearson’s correlation matrices are indicated in Figure 8. The r value that is from (±0.80 to ±1.00) gives a strong correlation, (±0.50 to ±0.80) indicates a moderate relationship, and (±0.00 to ±0.50) indicates a weak relationship between parameters of water quality occurred. As illustrated in Figure 8, a strong positive correlation exists for the following: EC with Ca2+, Na+, Mg2+, K+, SO42, Cl, pH, and hardness; TDS with Ca2+, Na+, Mg2+, K+, SO42, Cl, pH, hardness, and EC; Cl with Ca2+, Na+, Mg2+, and hardness; hardness with Ca2+, Na+, Mg2+, and SO42; SO42 with Ca2+, Na+, Mg2+, and K+; both Mg2+ and K+ with Ca2+ and Na+; and finally, Ca2+ with Na+.

3.2.2. Principal Component Analysis

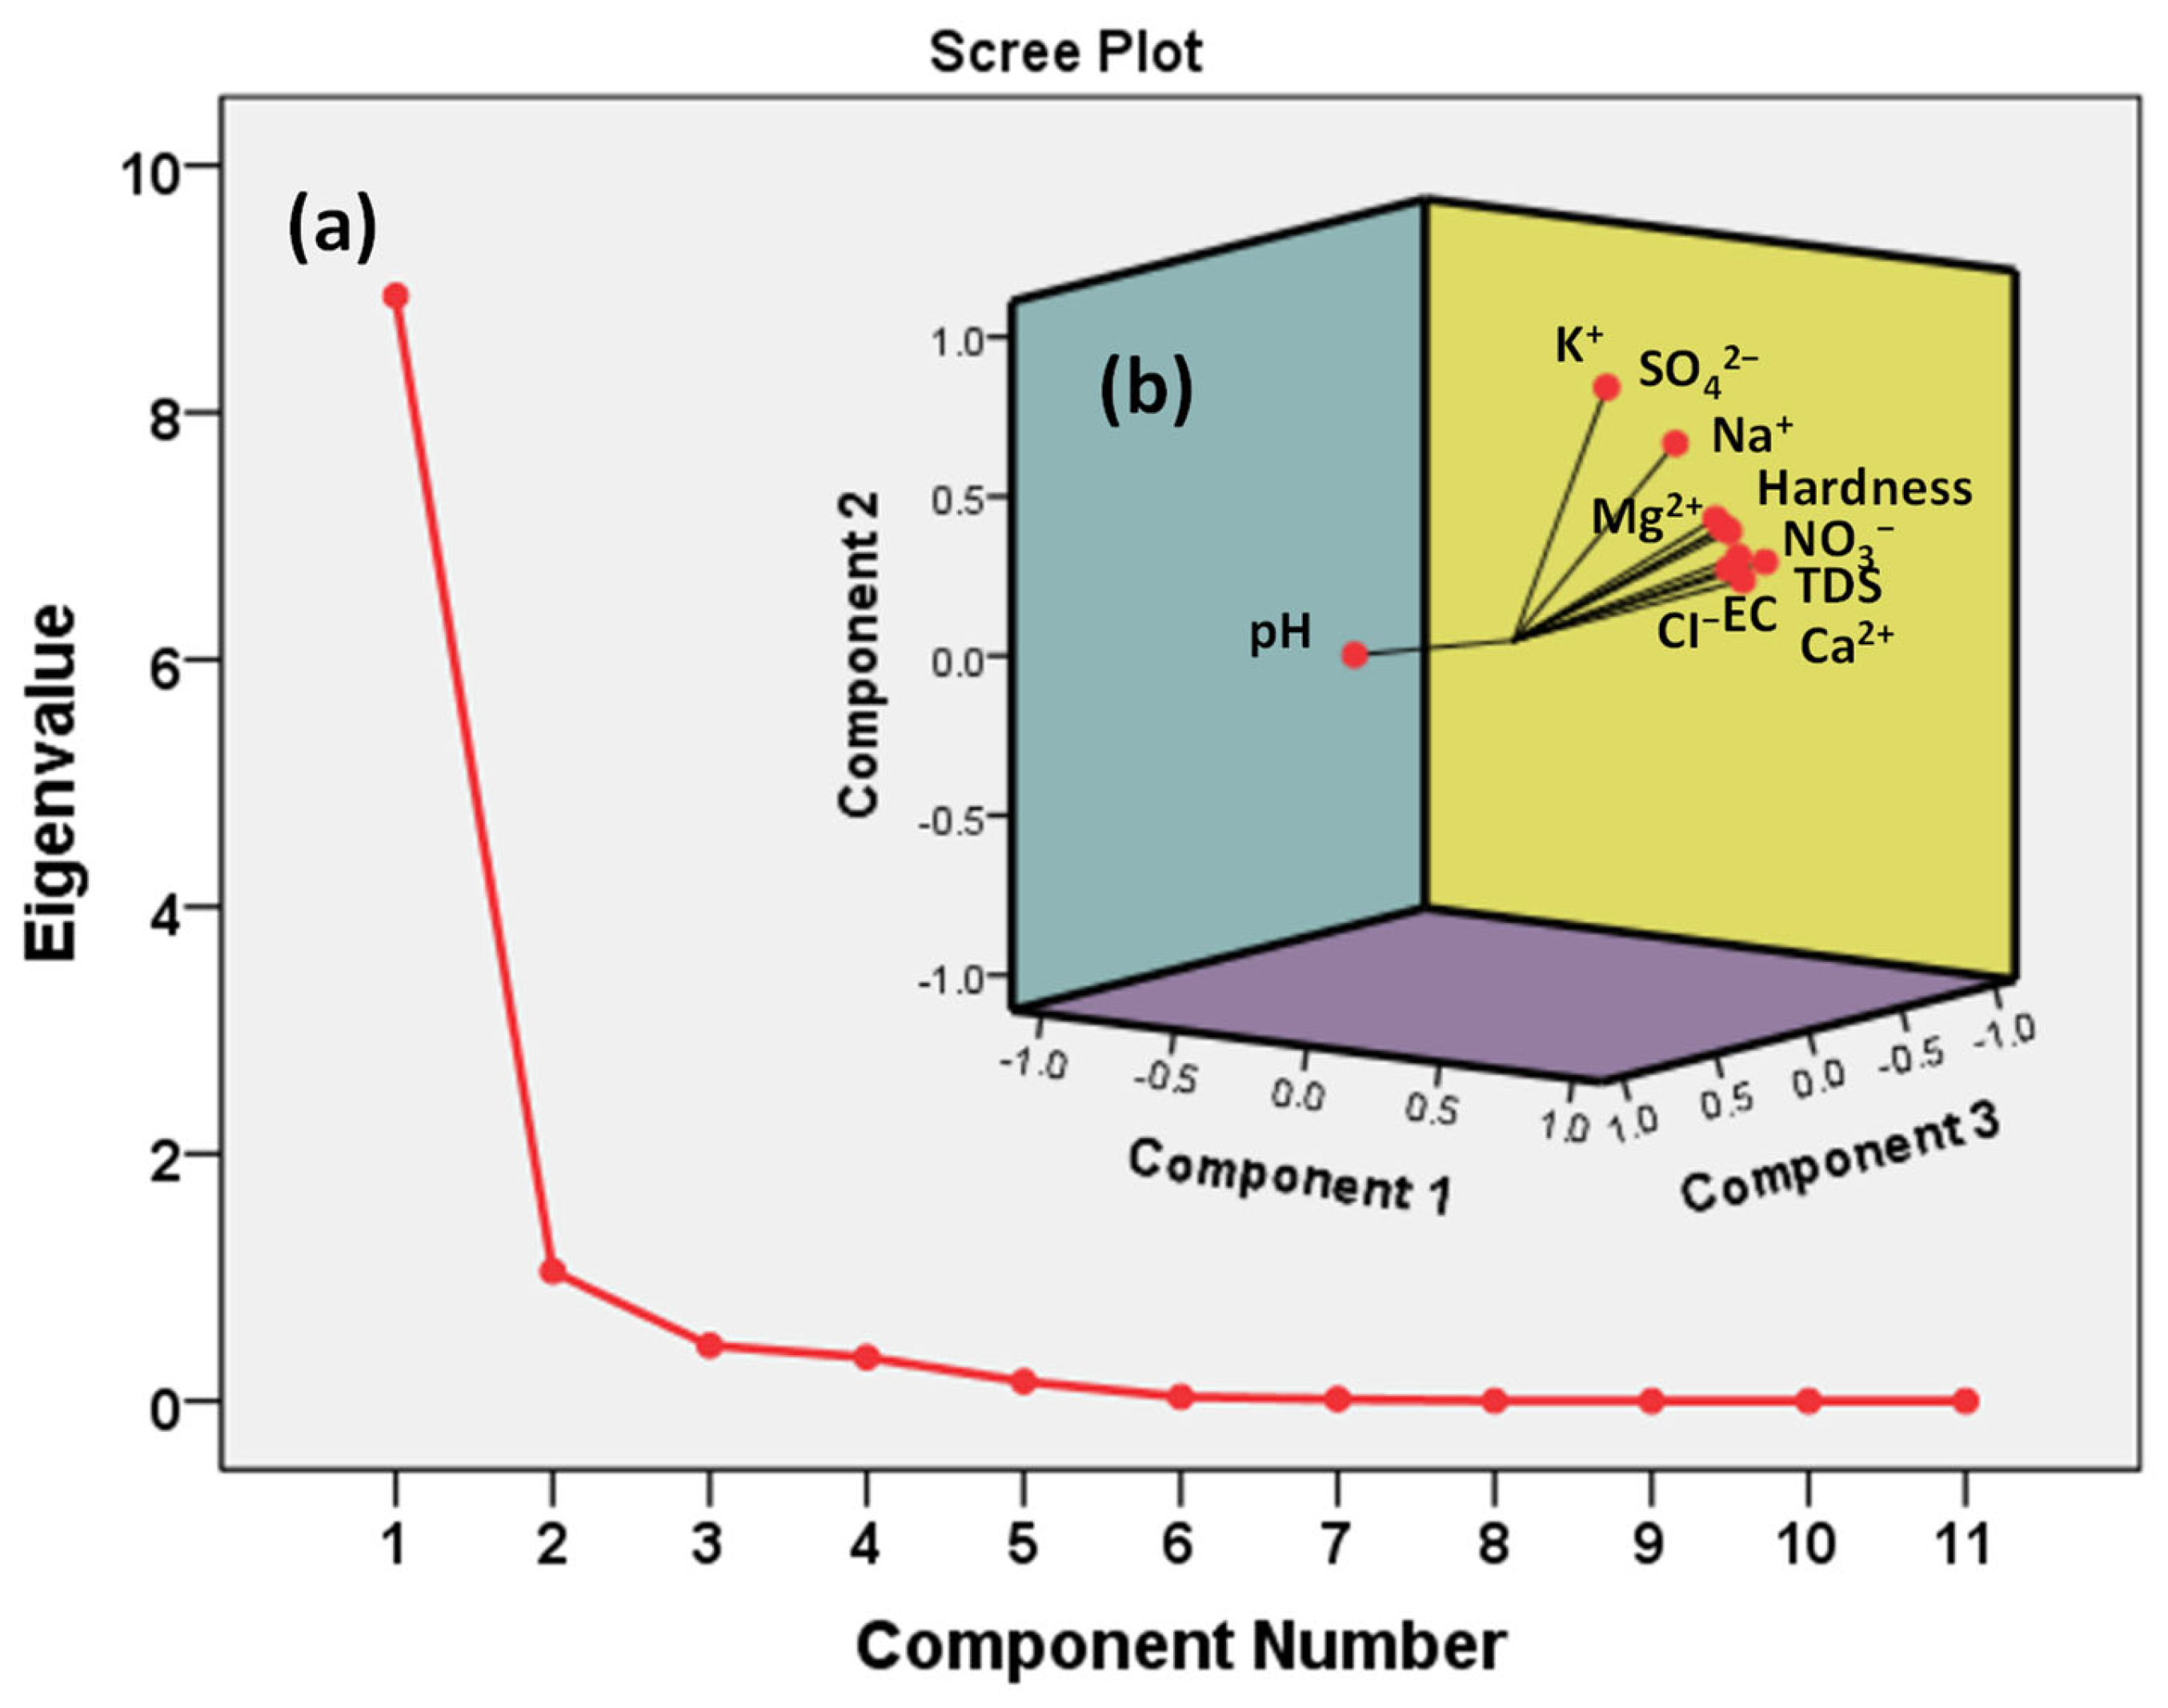
Figure 9 illustrates the results of PCA of the measured parameters, and the numerical results of FA are presented in Table 3. The three principal factors explain 94.92% of the total variance, where F1 explains 81.31% of total variance, F2 accounts for 9.53% of total variance, and F3 explains only 4.08% of the total variance. The parameters Ca2+, Na+, K+, Mg2+, SO42, NO3, Hardness, Cl, EC, and TDS are most significant in the first component (F1) and highly positively correlated with each other and negatively correlated with pH, which is the most significant parameter in the second component (F2), while K+ has a notable contribution in F3.

3.2.3. Hydrogeochemical Facies

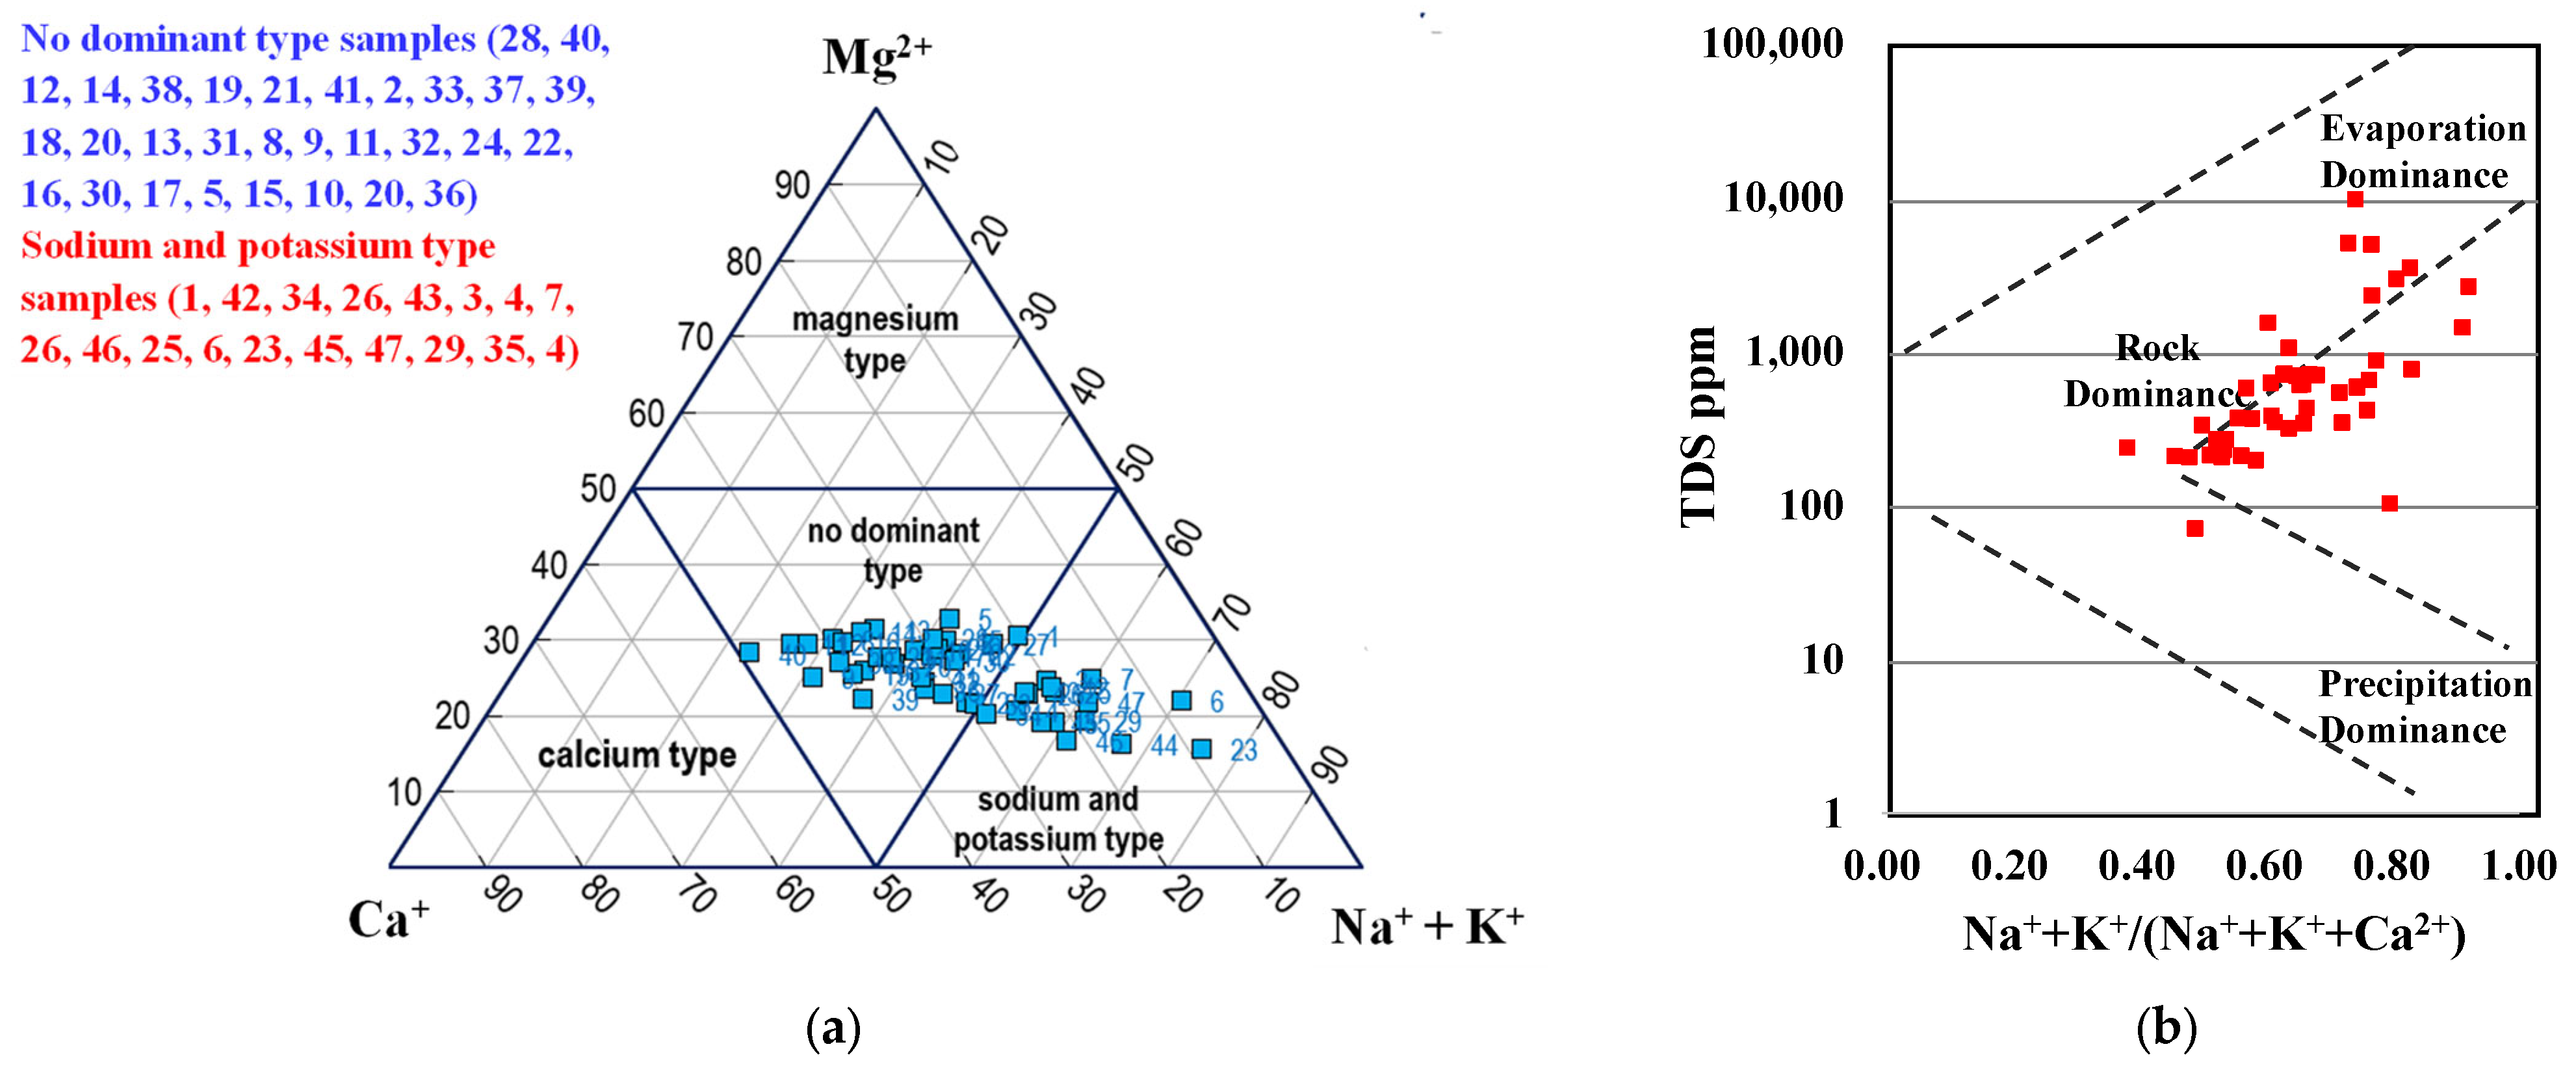
In the current study, the Piper diagram shows that the plotted samples fall in the sodium and potassium types; see Figure 10a. Gibbs plot can also be used to obtain a better understanding of hydrochemical processes such as precipitation, rock–water interaction, and evaporation in groundwater chemistry [45]. In this study, the ratio of major anions of the water samples calculated using Equation (10) was plotted against TDS values to indicate the mechanism controlling groundwater composition; see Figure 10b.
Major   anions = Na + + K + Ca 2 + + Na + + K +
The results illustrate that almost all the samples point toward the water–rock interaction domain, with few samples trending toward the evaporation domain. Thus, chemical weathering of rock-forming minerals affects groundwater quality through rock dissolution caused by water below the surface circulates. The samples in the evaporation domain may be attributed to semi-arid environmental climate conditions and surface pollution sources, mainly excessive fertilizer usage, irrigation return flow, industrial outflows, and domestic discharges. Similar results have been found in previous studies [20,45,46].

3.3. Assessment of Groundwater Quality for Drinking

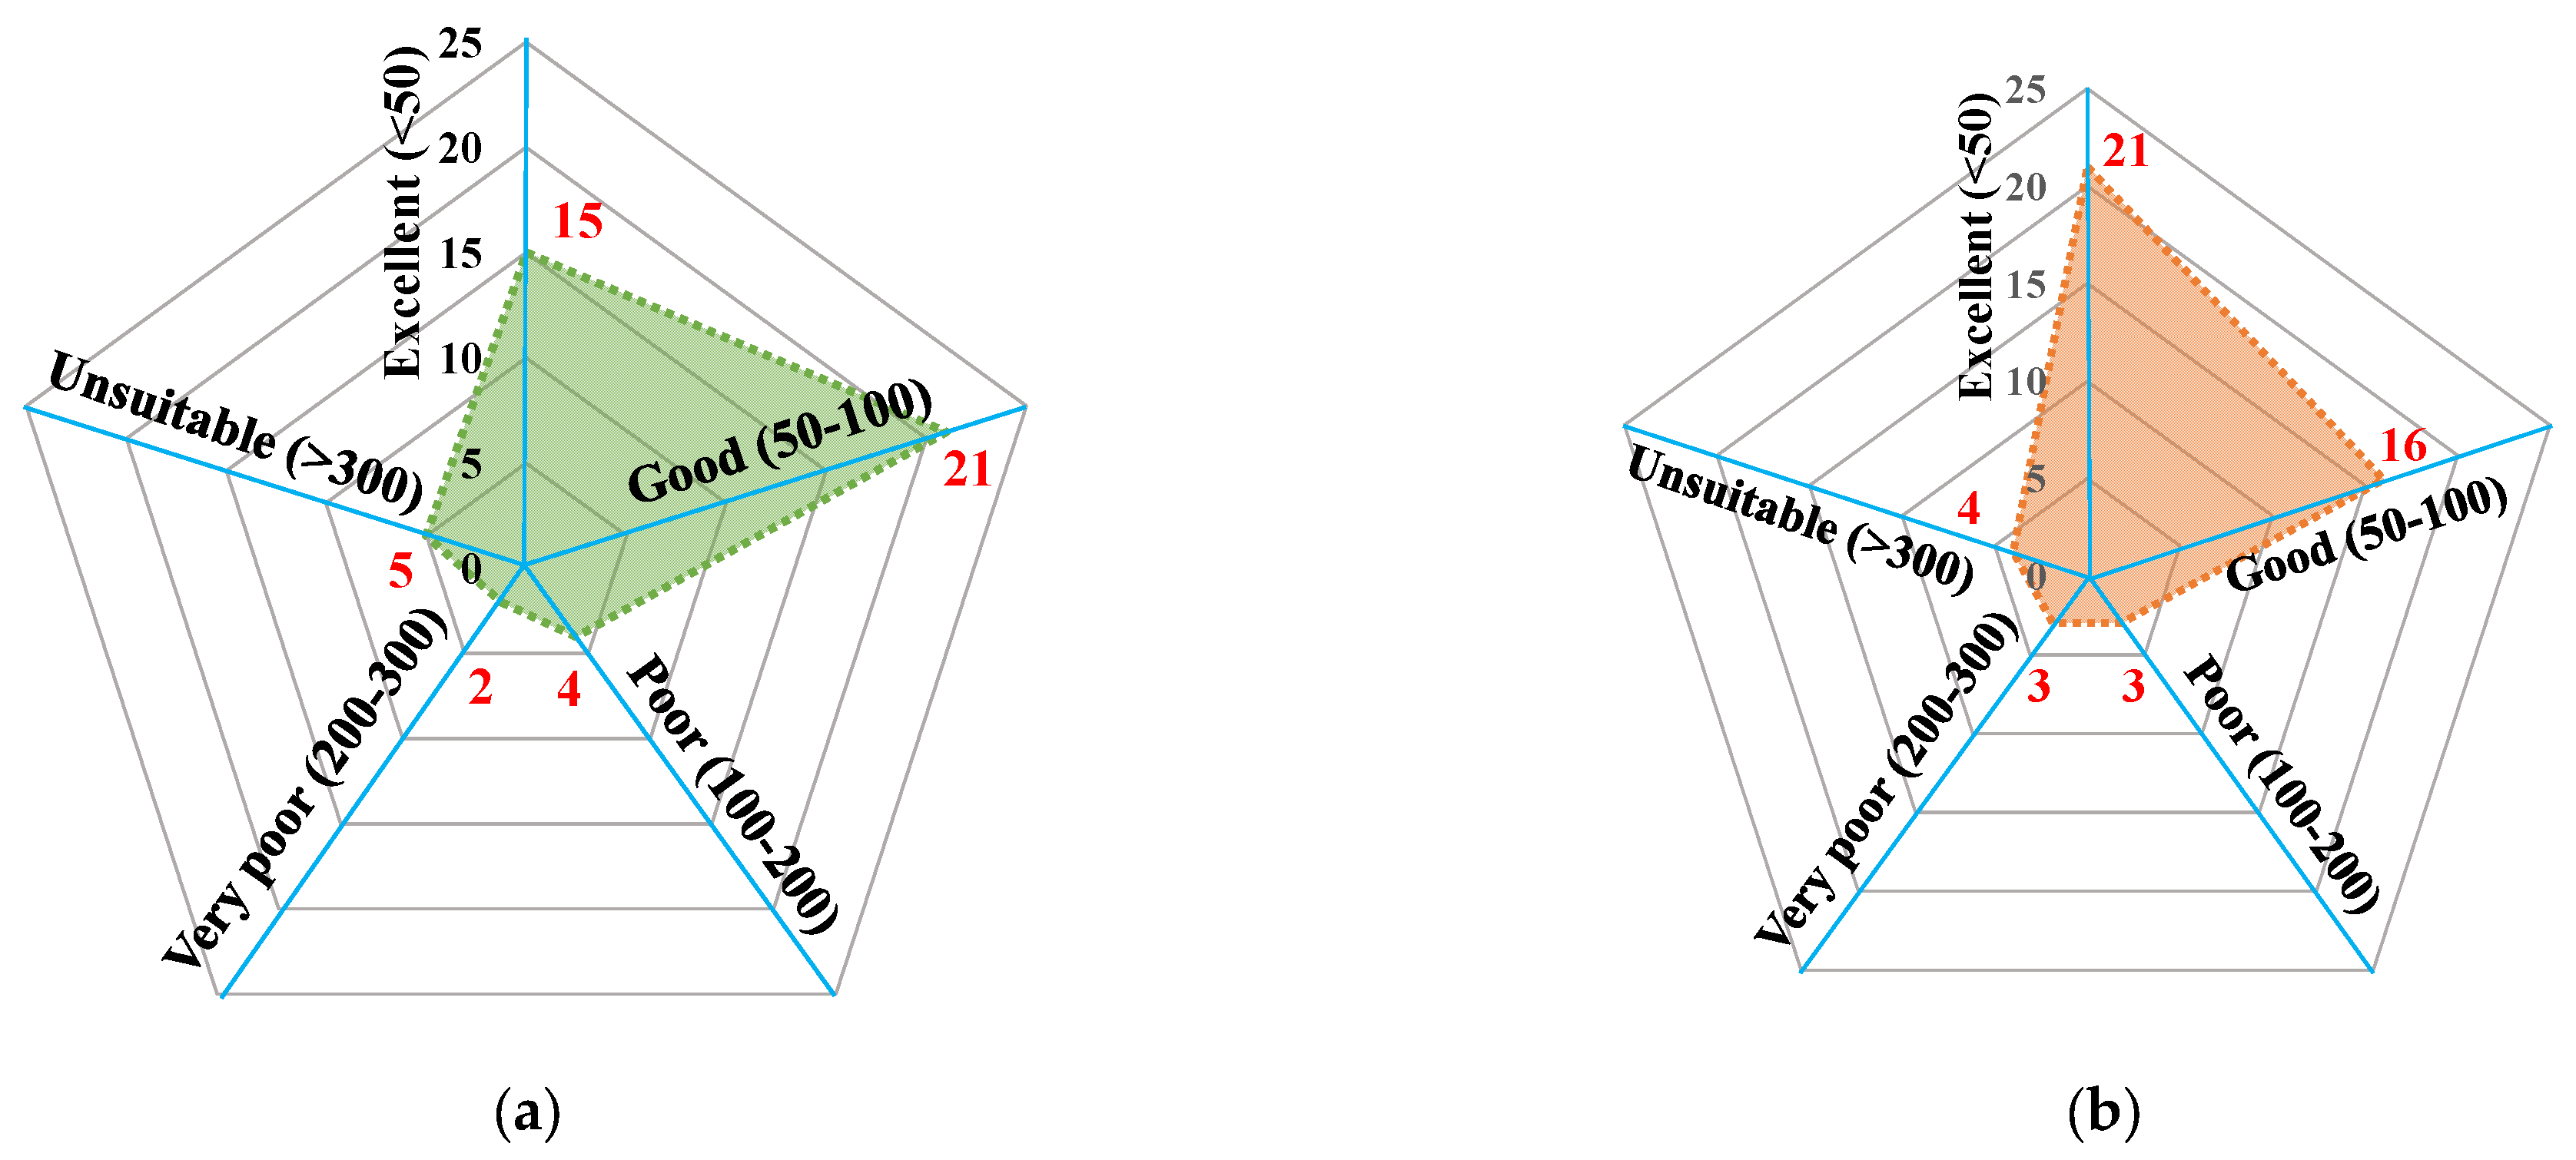
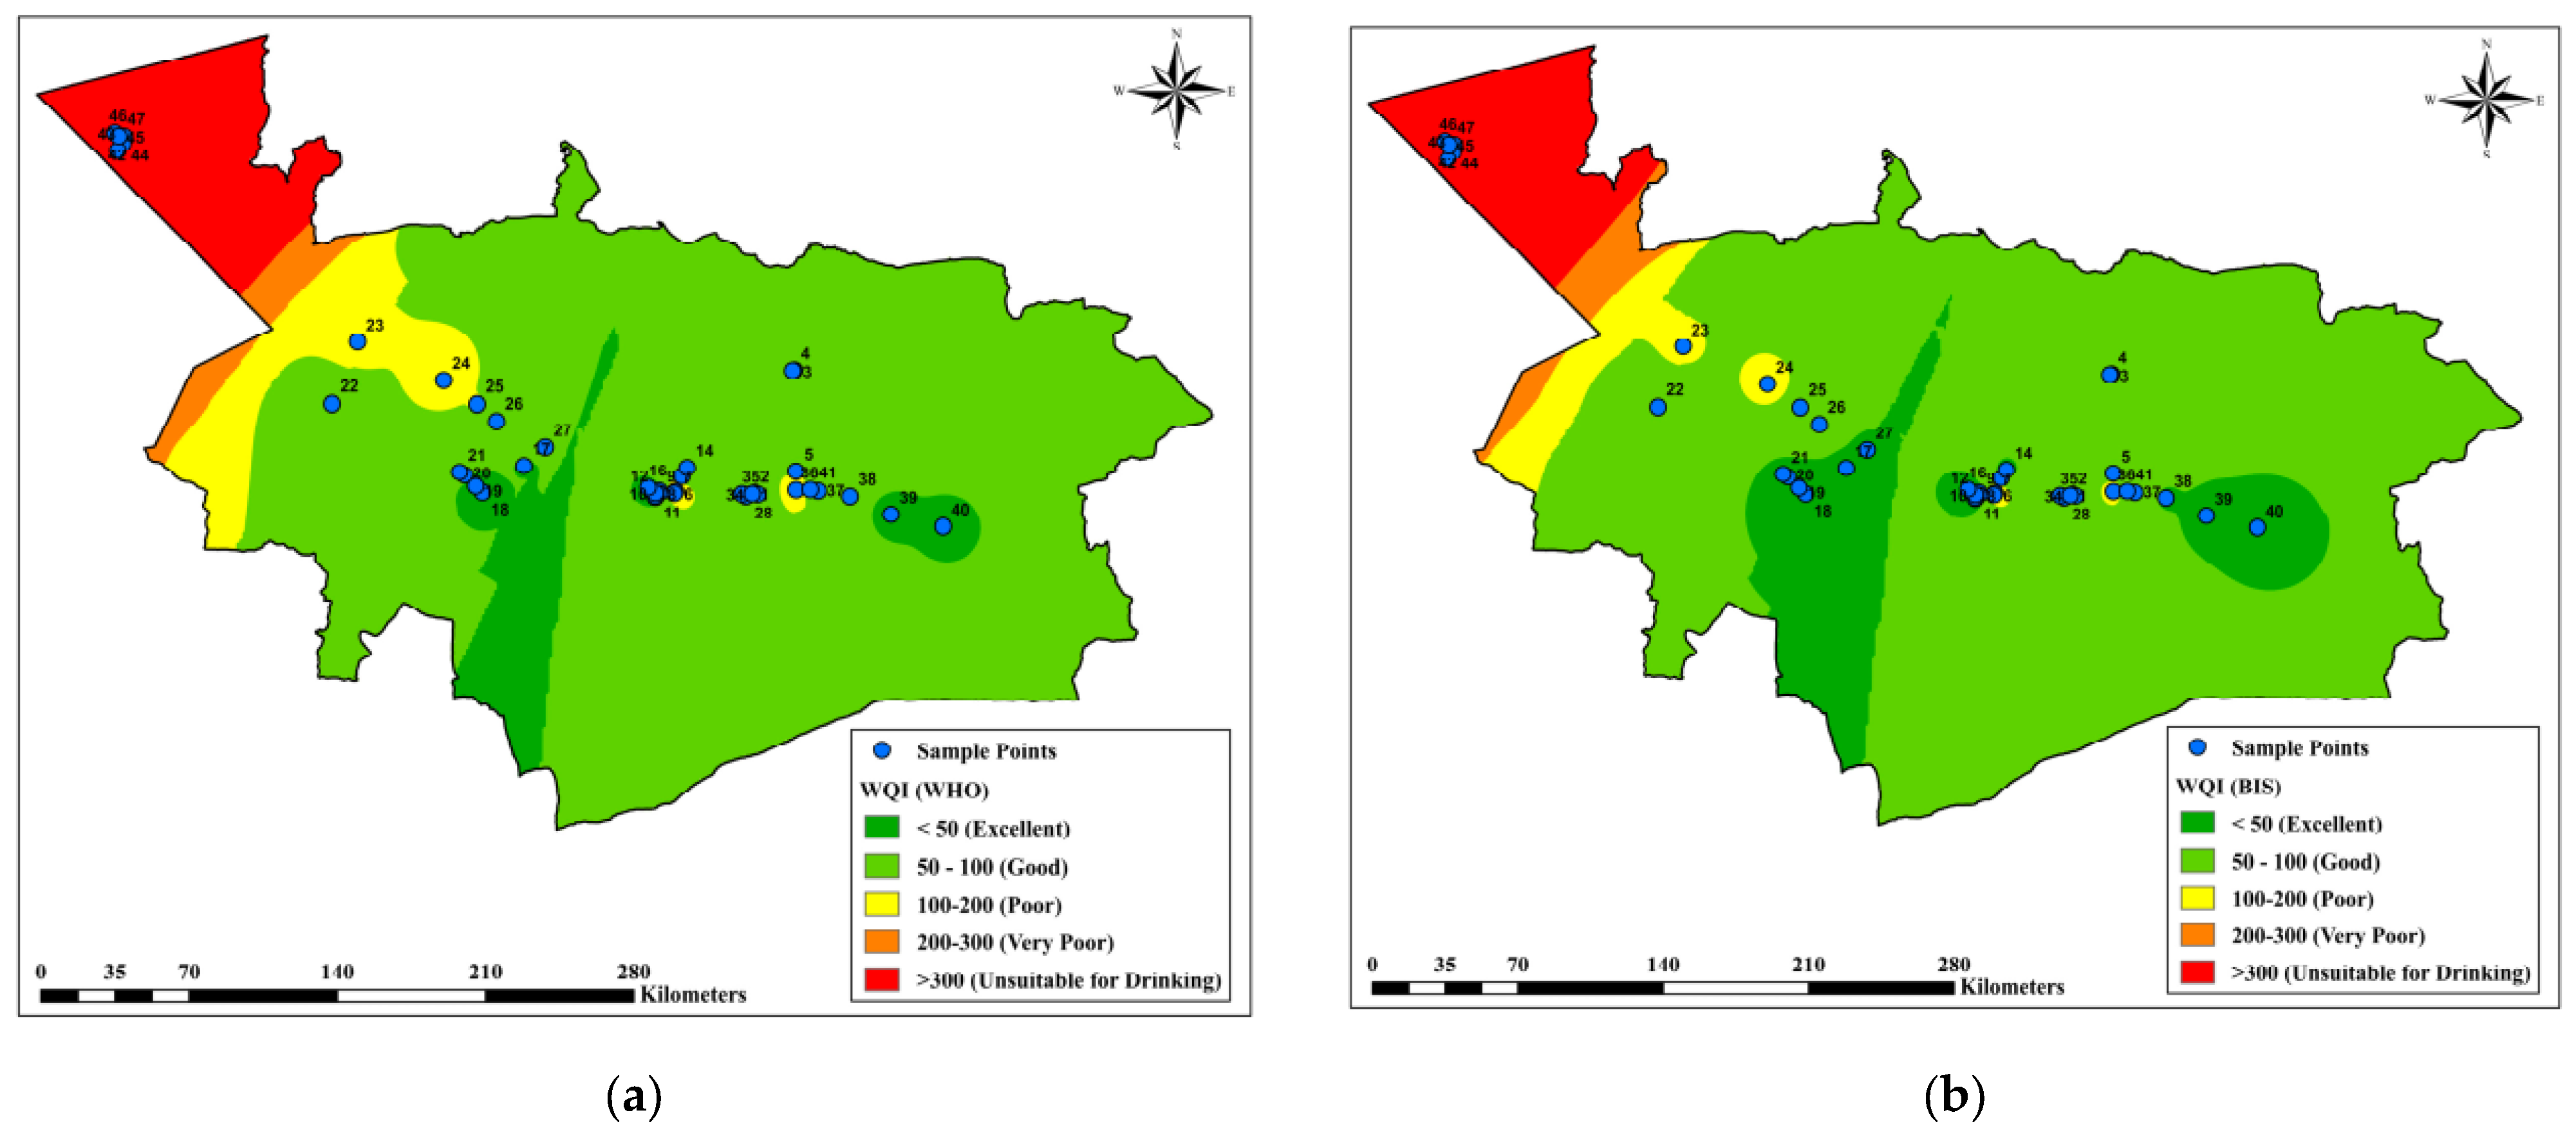
The calculated WQI values ranged from 14.80 to 897.61, with an average of 112.78 for BIS, and from 5.64 to 1050.84, with an average of 129.07 for WHO. The WQI was classified into five types: excellent water type (>50(, good water type (50 and 100), poor water type (100 to 200), very poor water type (200 and 300), and water as unsuitable for drinking < (300) [42]. Figure 11 shows radar maps of WQI based on WHO and BIS. According to WHO standards, 15 samples (31.91% of the total) are excellent, and 21 samples (44.68% of the total) are good water for drinking, see Figure 11a. Regarding BIS, 21 samples (44.68% of the total) are excellent, and 16 samples (34.04% of the total) are good water for drinking, as shown in Figure 11b. However, the Al Qaryat region had yielded WQI values of more than 300, so its water is not appropriate for drinking. Figure 12a,b show the spatial distribution of WQI for WHO and BIS, respectively.

3.4. Assessment of Groundwater Quality for Irrigation

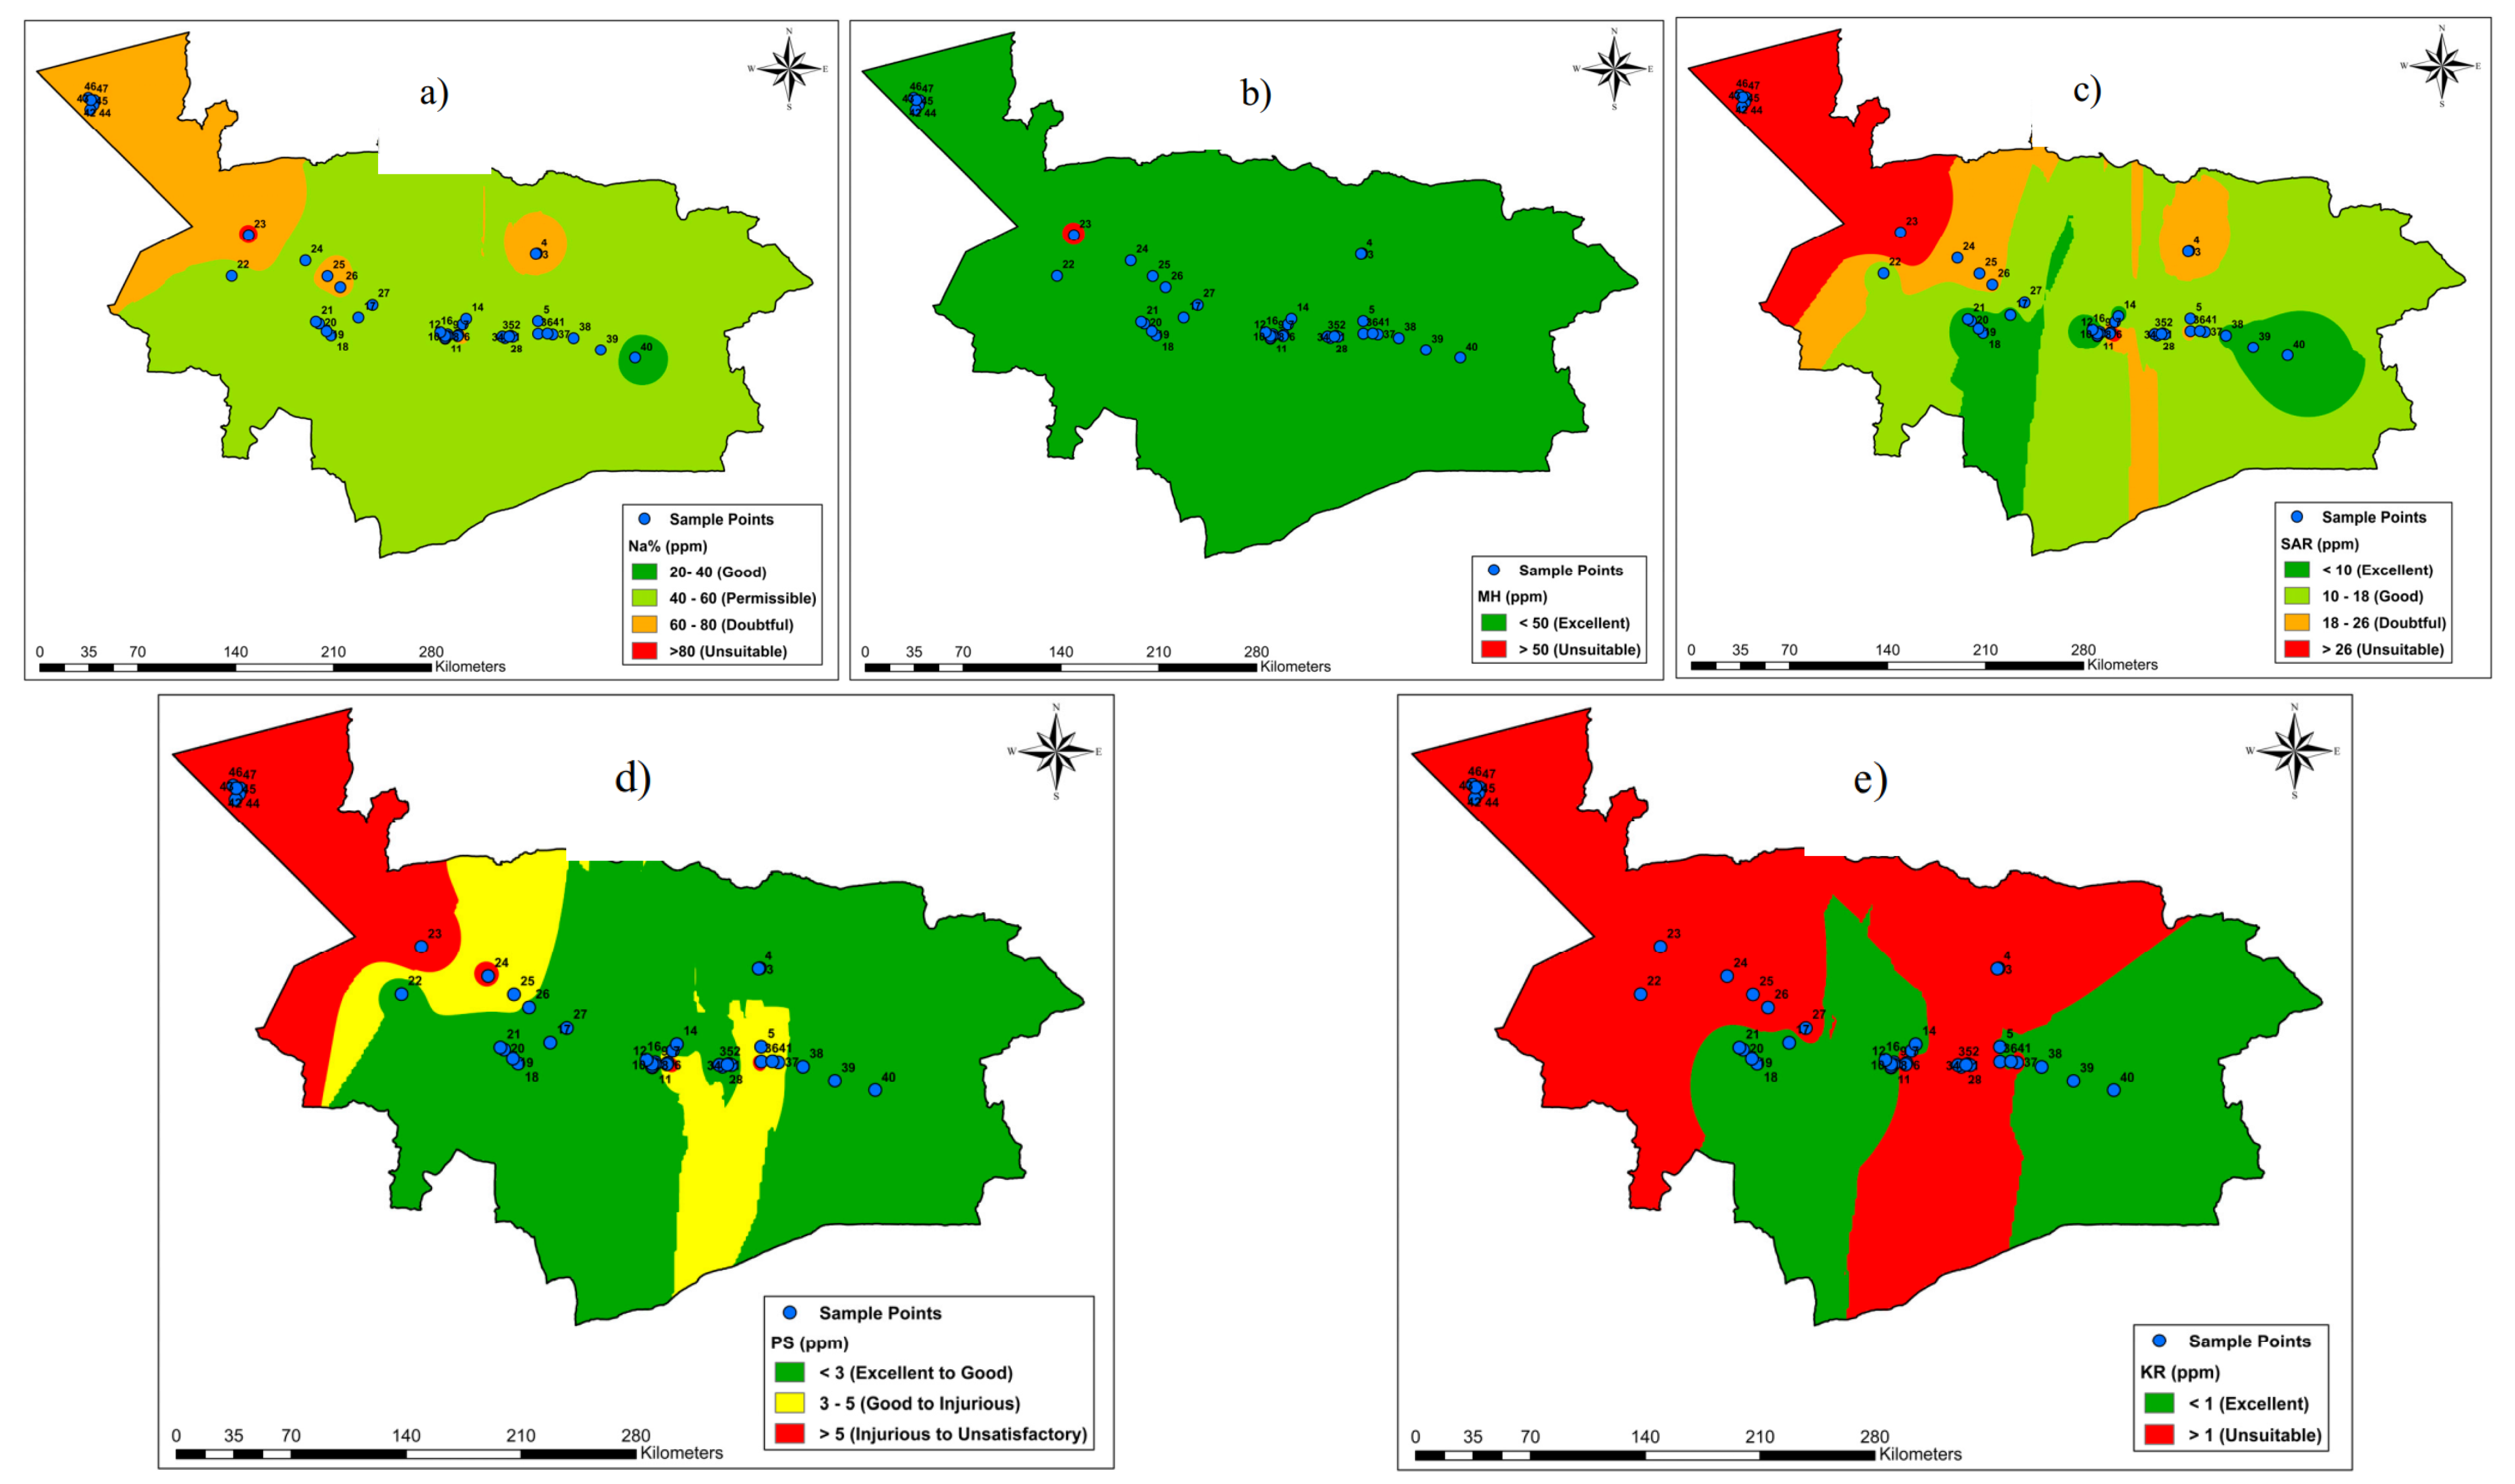
Groundwater quality for irrigation use can be assessed by different parameters such as EC, Na+ % MH, SAR, PS, and KR. The groundwater classification for irrigation purposes based on these parameters is indicated in Table 4; meanwhile, spatial distribution is illustrated in Figure 13. The EC represents the dissolved salt concentration in the groundwater and indicates salinity hazard for crops [20,47]. Around 83% of samples are excellent to good and suitable for crop growth. On the other hand, the sodium reacts with the soil and decreases its texture and permeability, so the high sodium percentage in water can cause soil degradation [47]. The values of Na+ % varied between 31.63% and 83.02% and had a mean value of 55.75%. Based on BIS standards, the water has Na+ % less than 60% suitable for irrigation. Most of the samples (64% of the total) yielded Na+ % less than 60%, indicating it is suitable for irrigation use.
MH is a function of Ca2+ and Mg2+, which are important nutrients for crops, and their high values in groundwater increase the soil pH; moreover, the high quantity of Mg2+ ions in the water of irrigation has a negative effect on the quality of soil, where it causes soil alkaline and decreases the crop production [48]. Around 95.74% of all water samples had MH values less than 50 and were appropriate for irrigation. SAR results showed that 36.17% of the samples are considered excellent water, and 23.40% of the samples represent good for irrigation use. Meanwhile, 21.28% of the samples have a high sodium hazard, so they are unsuitable for irrigation. Most of the unsuitable samples were collected from the Al Qaryat region. According to PS results, 63.83% of the samples are excellent to good, which indicates their suitability for irrigation use. However, 21.28% of the samples are inappropriate for irrigation, and most of them were collected from the Al Qaryat region. Regarding the KR ratio, 48.94% of the samples are less than 1 and suitable for irrigation.

3.5. Artificial Neural Network

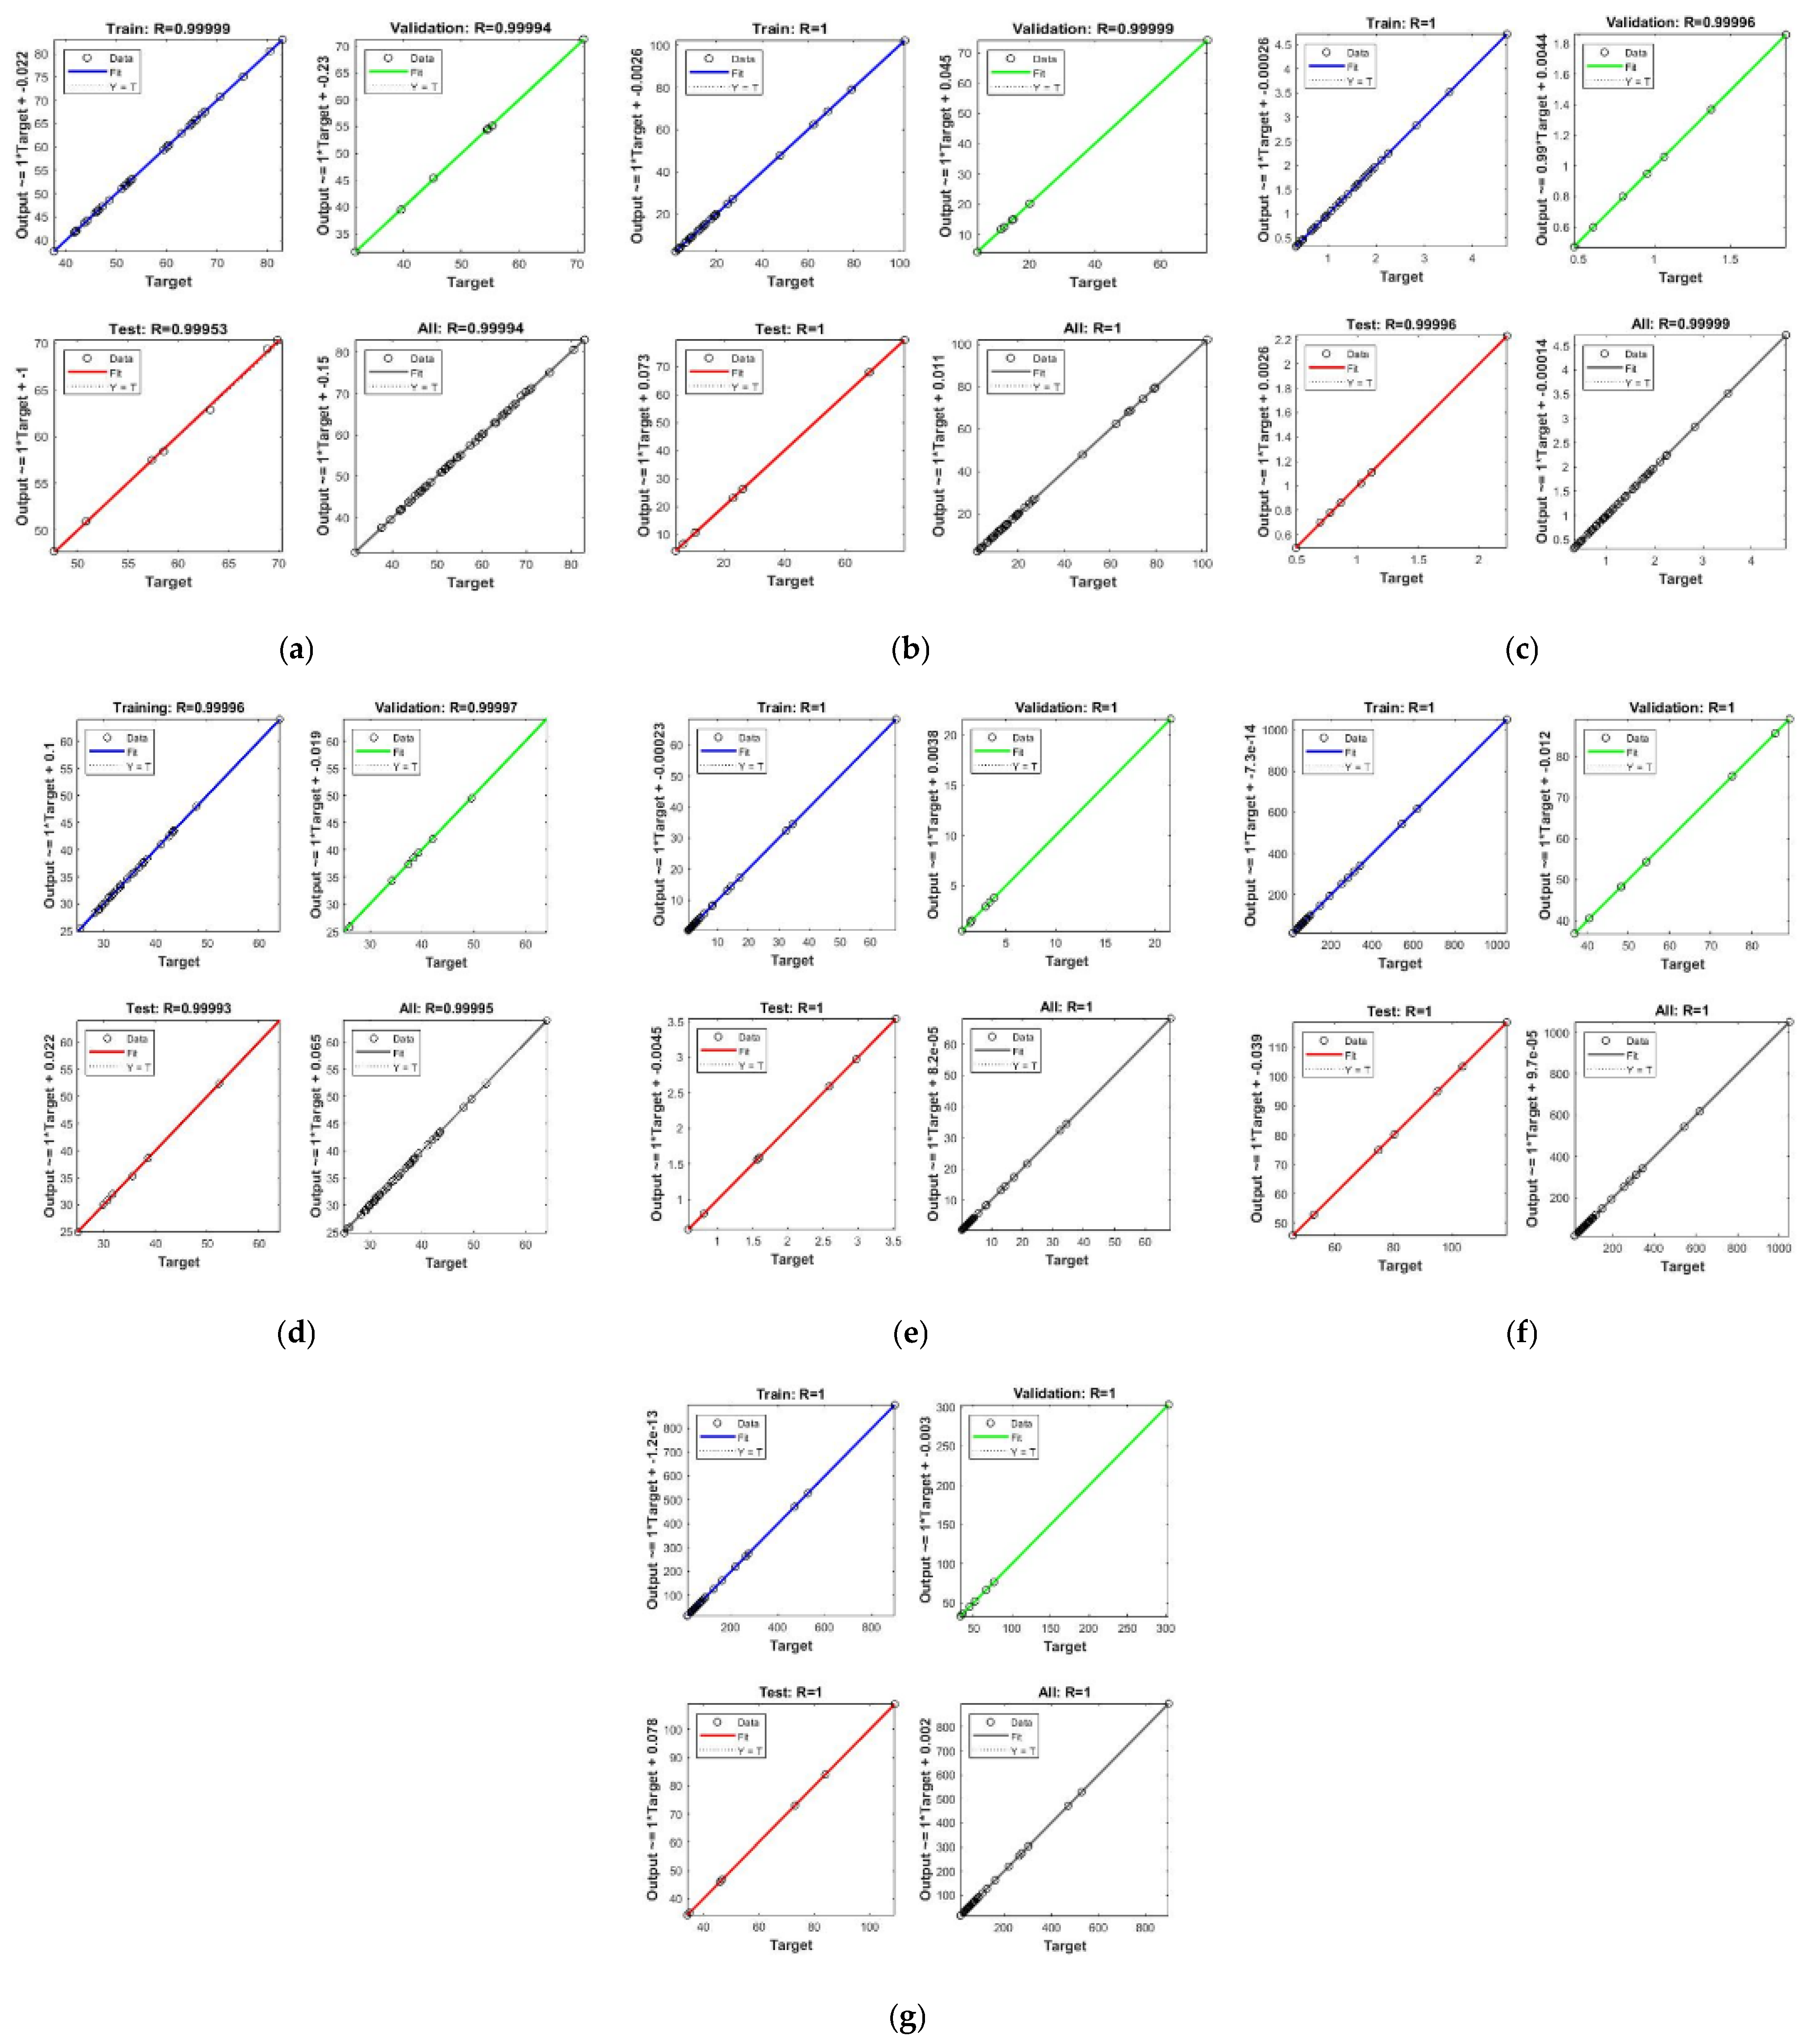
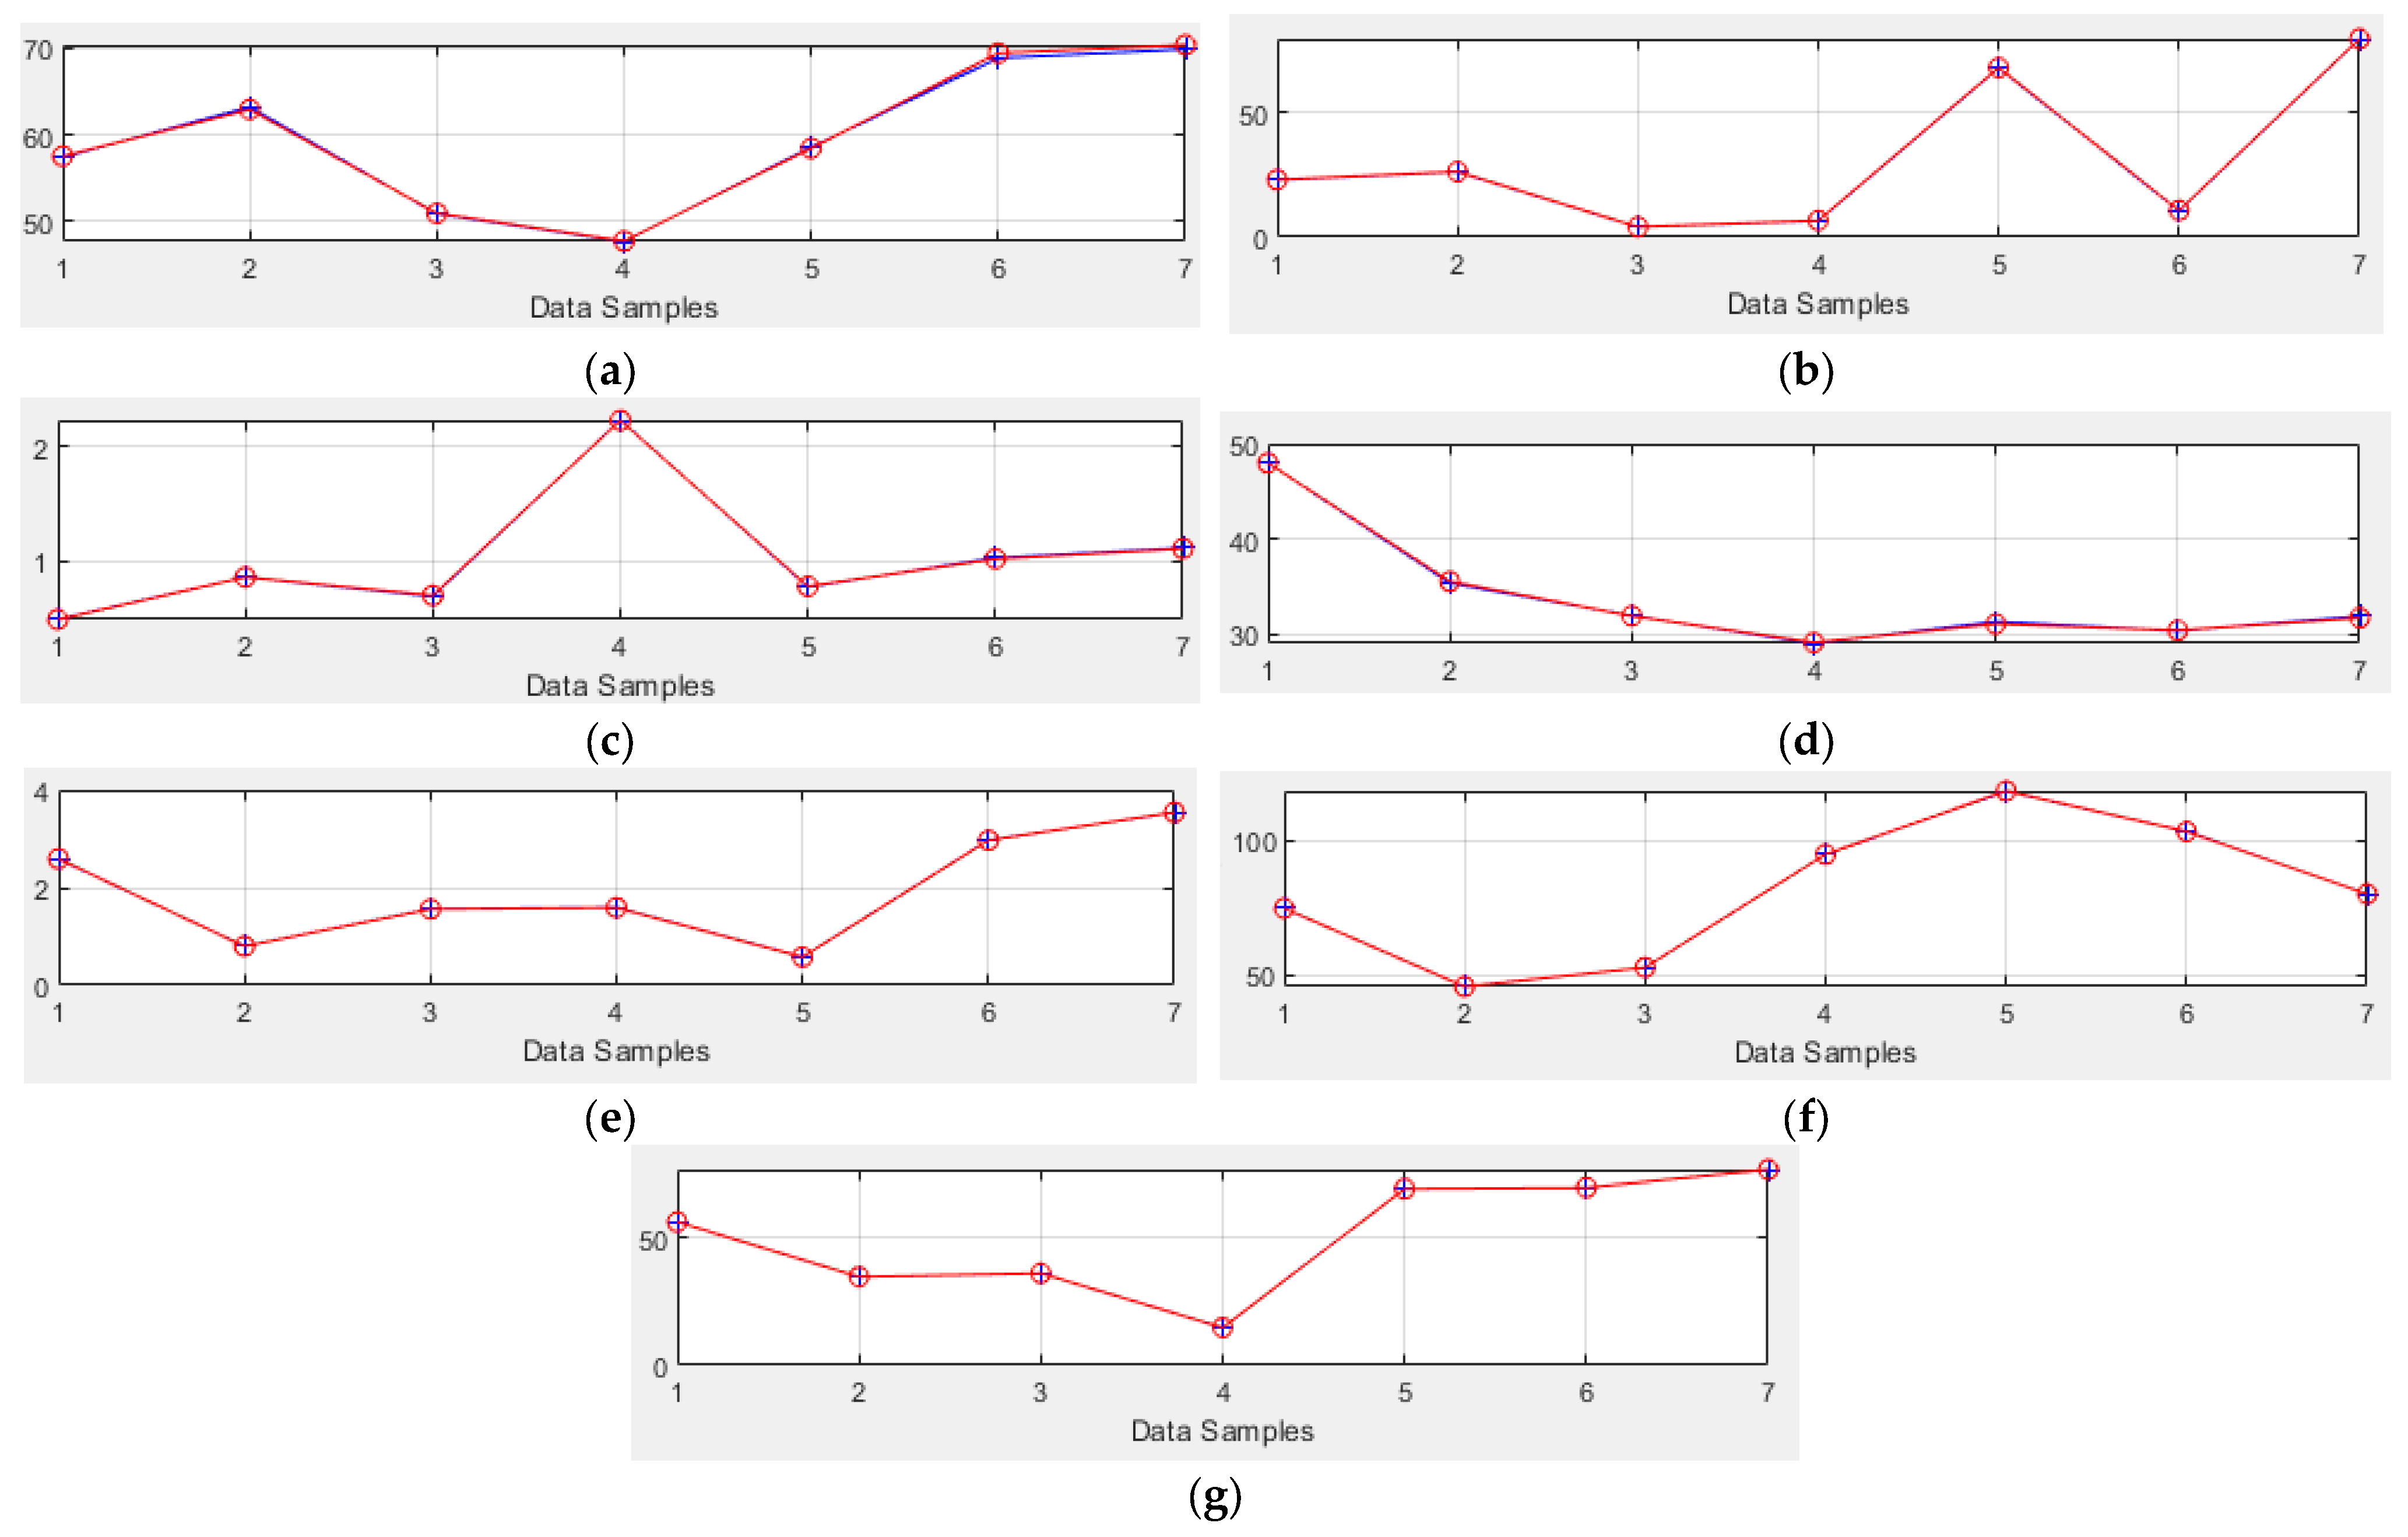
The groundwater quality for drinking and irrigation purposes has been predicted using FFNN. Model performance is best assessed through multiple runs because the model starts with random weights for connections and randomly divides data patterns. After performing the entire training process in Figure 5 for 20 separate computer runs, the best, average, and standard deviation values of RMSE are presented. A computer with a 2.8 GHz core i5 and 8 GB of memory is used to train the analyzed models. ANN Toolbox, a piece of Matlab software R2020a, is used for simulation [49]. The simulations demonstrate how effectively the process can be modeled by the FFNN with 19 neurons in the hidden layer. The training approach is Bayesian regularization backpropagation, whereas the activation function of the hidden layer is the hyperbolic tangent sigmoid (tansig) (trainbr). To avoid overfitting, the model must be trained for an average of 25 epochs. According to Figure 14, the regression coefficient for each of the patterns’ training, validation, test, and total is above 0.999. The FFNN predictions for the entire data set are highlighted in Figure 15 because they agree well with the experimental patterns. Figure 16 shows the experimental results and the FFNN predictions for the test patterns. To choose the best configurations for the network and its training, the FFNN hyperparameters are also investigated. The numerical results of the hidden layer size evaluation for the test set for a range of values (10, 17, 19, 21, and 25) are shown in Table 5. Compared to using only 19 neurons, using 21 neurons and 25 neurons in the hidden layer leads to a slight improvement in model performance, but the cost of training complexity increases. Performance suffers noticeably when there are 17 fewer neurons in the hidden layer (higher RMSE compared to using 19 neurons).
According to Table 6, the training algorithm (trainbr) performs better than (trainlm), Scaled Conjugate, and Gradient Backpropagation (trainscg). (tansig) is the best option for the activation function, while radbas or the triangular basis transfer function (tribas) give worse RMSE results, as shown in Table 7. In summary, the selection of the ideal FFNN training settings was made considering a wide range of options. The suitability of the developed FFNN for the existing experimental data shows that the model can be used to accurately predict the output of inputs under similar experimental conditions. In addition, the model may need to be re-trained and its structure modified if the experimental conditions or inputs change. However, the procedure described above for selecting the optimal regression model will be useful.

4. Conclusions

The results of physical and chemical analysis, WQI, and GIS showed that most of the groundwater samples in the studied area are suitable for drinking and irrigation purposes, except samples in the Al Qaryat region. According to WHO standards, 31.91% of samples were excellent, and 44.68% of samples were good water for drinking. Regarding BIS, 44.68% of samples were excellent, and 34.04% of samples were good water for drinking. Based on spatial distribution, unsuitable samples for drinking were observed in the Al Qaryat region. The ionic abundance ranking was Na+ > Ca2+ > Mg2+ > K+ for cations, and Cl > SO42− > NO3 for anions. A strong positive correlation existed between the different parameters except for pH. The Piper diagram and Gibbs diagram indicate that the groundwater is dominated by alkali metals (K+ and Na+) and controlled by rock–water interaction process. The EC results showed that most of the samples were in the excellent to good category for irrigation except those of the Al Qaryat region. The Na+ % and MH indicated that 64.00% and 95.74% of samples were suitable for irrigation use, respectively. SAR showed that 36.17% of samples were excellent water, and 23.40% of the samples were good for irrigation use. PS and KR results depicted that 63.83% and 48.94% of the samples were suitable for irrigation use, respectively. Moreover, the applied FFNN was successfully established and showed high accuracy in predicting the indices Na+ %, SAR, KR, MH, PS, WQI (WHO), and WQI (BIS). The values of RMSE ranged between 0.136 and 2.45 × 10⁻³, whilst R2 reached 1.00 for most output parameters.

Author Contributions

Conceptualization, R.A., M.M.A.d. and N.S.; methodology, R.A., M.M.A.d. and N.S.; analysis, R.A., M.M.A.d., R.L., M.A.M., A.M.H., B.M.N. and N.S. The first draft of the manuscript was written by M.M.A.d., A.M.H., B.M.N. and N.S.; revised and presented suggestive comments about the previous versions of the manuscript, R.A., M.M.A.d. and N.S.; analysis, R.A., M.M.A.d., R.L., M.A.M., A.M.H., B.M.N. and N.S. All authors have read and agreed to the published version of the manuscript.

Funding

Ministry of Education in Saudi Arabia; project number 223202.

Data Availability Statement

Data for this work can be found within the article, and for further data, feel free to contact the corresponding authors.

Acknowledgments

The authors extend their appreciation to the Deputyship for Research & Innovation, Ministry of Education in Saudi Arabia, for funding this research work through project number 223202.

Conflicts of Interest

The authors confirm that there are no conflict concerning the publication of this manuscript.

References

  1. Khan, M.Y.A.; El Kashouty, M.; Gusti, W.; Kumar, A.; Subyani, A.M.; Alshehri, A. Geo-temporal signatures of physicochemical and heavy metals pollution in Groundwater of Khulais region—Makkah Province, Saudi Arabia. Front. Environ. Sci. 2022, 9, 699. [Google Scholar] [CrossRef]
  2. Mallick, J.; Singh, C.K.; AlMesfer, M.K.; Singh, V.P.; Alsubih, M. Groundwater quality studies in the kingdom of Saudi Arabia: Prevalent research and management dimensions. Water 2021, 13, 1266. [Google Scholar] [CrossRef]
  3. Youssef, A.M.; Abu Abdullah, M.M.; Pradhan, B.; Gaber, A.F.D. Agriculture sprawl assessment using multi-temporal remote sensing images and its environmental impact; Al-Jouf, KSA. Sustainability 2019, 11, 4177. [Google Scholar] [CrossRef]
  4. Albaggar, A.K.A. Investigation of some physical, chemical, and bacteriological parameters of water quality in some dams in Albaha region, Saudi Arabia. Saudi J. Biol. Sci. 2021, 28, 4605–4612. [Google Scholar] [CrossRef] [PubMed]
  5. Masoud, M.; El Osta, M.; Alqarawy, A.; Ezzeldin, H. Application of Environmental Isotopes and Hydrochemistry to Identify the Groundwater Recharge in Wadi Qanunah Basin, Saudi Arabia. Sustainability 2023, 15, 2648. [Google Scholar] [CrossRef]
  6. Najah, A.; Teo, F.Y.; Chow, M.F.; Huang, Y.F.; Latif, S.D.; Abdullah, S.; Ismail, M.; El-Shafie, A. Surface water quality status and prediction during movement control operation order under COVID-19 pandemic: Case studies in Malaysia. Int. J. Environ. Sci. Technol. 2021, 18, 1009–1018. [Google Scholar] [CrossRef] [PubMed]
  7. Karunanidhi, D.; Subramani, T.; Roy, P.D.; Li, H. Impact of groundwater contamination on human health. Environ. Geochem. Health 2021, 43, 643–647. [Google Scholar] [CrossRef] [PubMed]
  8. Barzegar, R.; Asghari Moghaddam, A.; Adamowski, J.; Nazemi, A.H. Assessing the potential origins and human health risks of trace elements in groundwater: A case study in the Khoy plain, Iran. Environ. Geochem. Health 2019, 41, 981–1002. [Google Scholar] [CrossRef]
  9. Apollaro, C.; Fuoco, I.; Gennaro, E.; Giuliani, L.; Iezzi, G.; Marini, L.; Radica, F.; Di Luccio, F.; Ventura, G.; Vespasiano, G. Advanced argillic alteration at Cave di Caolino, Lipari, Aeolian Islands (Italy): Implications for the mitigation of volcanic risks and the exploitation of geothermal resources. Sci. Total Environ. 2023, 889, 164333. [Google Scholar] [CrossRef]
  10. Fuoco, I.; Figoli, A.; Criscuoli, A.; Brozzo, G.; De Rosa, R.; Gabriele, B.; Apollaro, C. Geochemical modeling of chromium release in natural waters and treatment by RO/NF membrane processes. Chemosphere 2020, 254, 126696. [Google Scholar] [CrossRef]
  11. Kumar, J.; Biswas, B.; Verghese, S. Assessment of groundwater quality for drinking and irrigation purpose using geospatial and statistical techniques in a semi-arid region of Rajasthan, India. J. Geol. Soc. India 2021, 97, 416–427. [Google Scholar] [CrossRef]
  12. Magesh, N.S.; Krishnakumar, S.; Chandrasekar, N.; Soundranayagam, J.P. Groundwater quality assessment using WQI and GIS techniques, Dindigul district, Tamil Nadu, India. Arab. J. Geosci. 2013, 6, 4179–4189. [Google Scholar] [CrossRef]
  13. Subba Rao, N. Groundwater quality from a part of Prakasam district, Andhra Pradesh, India. Appl. Water Sci. 2018, 8, 1–18. [Google Scholar] [CrossRef]
  14. Zhang, Q.; Xu, P.; Qian, H. Assessment of groundwater quality and human health risk (HHR) evaluation of nitrate in the Central-Western Guanzhong Basin, China. Int. J. Environ. Res. Public Health 2019, 16, 4246. [Google Scholar] [CrossRef] [PubMed]
  15. Mohamed, A.K.; Liu, D.; Song, K.; Mohamed, M.A.A.; Aldaw, E.; Elubid, B.A. Hydrochemical analysis and fuzzy logic method for evaluation of groundwater quality in the North Chengdu Plain, China. Int. J. Environ. Res. Public Health 2019, 16, 302. [Google Scholar] [CrossRef] [PubMed]
  16. IS 10500; BIS Drinking Water-Specification. Bureau of Indian Standards: New Delhi, India, 2012.
  17. WHO. Guidelines for Drinking-Water Quality: Fourth Edition Incorporating the Frst Addendum; World Health Organization: Geneva, Switzerland, 2017. [Google Scholar]
  18. SASO. Technical Regulation for Water Rationalization Tools Version (1)—Amendment (1); Official Gazette (06-04-16-156), Saudi Standards; Metrology and Quality Organization (SASO): Riyadh, Saudi Arabia, 2020. [Google Scholar]
  19. Chidiac, S.; El Najjar, P.; Ouaini, N.; El Rayess, Y.; El Azzi, D. A comprehensive review of water quality indices (WQIs): History, models, attempts and perspectives. Rev. Environ. Sci. Bio/Technol. 2023, 22, 349–395. [Google Scholar] [CrossRef]
  20. Kouser, B.; Bala, A.; Verma, O.; Prashanth, M.; Khosla, A.; Pir, R.A. Hydrochemistry for the assessment of groundwater quality in the Kathua region, Jammu and Kashmir, India. Appl. Water Sci. 2022, 12, 143. [Google Scholar] [CrossRef]
  21. Ravichandran, R.; Ayyavoo, R.; Rajangam, L.; Madasamy, N.; Murugaiyan, B.; Shanmugam, S. Comparative Analysis of Groundwater Quality Index for Bhavani River Basin Using Remote Sensing and Statistical Analysis. Jordan J. Civ. Eng. 2023, 17, 58–70. [Google Scholar] [CrossRef]
  22. El Maghraby, M.; Bamousa, A.O. Evaluation of groundwater quality for drinking and irrigation purposes using physicochemical parameters at Salilah area, Madinah Munawarah District, Saudi Arabia. J. Taibah Univ. Sci. 2021, 15, 695–709. [Google Scholar] [CrossRef]
  23. Alhababy, A.M.; Al-Rajab, A.J. Groundwater quality assessment in Jazan region, Saudi Arabia. Curr. World Environ. J. 2015, 10, 22–28. [Google Scholar] [CrossRef]
  24. Abdel Daiem, M.M.; Hatata, A.; Galal, O.H.; Said, N.; Ahmed, D. Prediction of biogas production from anaerobic Co-digestion of Waste Activated sludge and wheat straw using two-dimensional mathematical models and an artificial neural network. Renew. Energy 2021, 178, 226–240. [Google Scholar] [CrossRef]
  25. Abdel Daiem, M.M.; Hatata, A.; El-Gohary, E.H.; Abd-Elhamid, H.F.; Said, N. Application of an artificial neural network for the improvement of agricultural drainage water quality using a submerged biofilter. Environ. Sci. Pollut. Res. 2021, 28, 5854–5866. [Google Scholar] [CrossRef] [PubMed]
  26. Abdel Daiem, M.M.; Hatata, A.; Said, N. Modeling and optimization of semi-continuous anaerobic co-digestion of activated sludge and wheat straw using Nonlinear Autoregressive Exogenous neural network and seagull algorithm. Energy 2022, 241, 122939. [Google Scholar] [CrossRef]
  27. Alrowais, R.; Said, N.; Alotaibi, A.; Hatata, A.; Essa, M.A.; Abdel Daiem, M.M. Comparing the effect of mesophilic and thermophilic anaerobic co-digestion for sustainable biogas production: An experimental and recurrent neural network model study. J. Clean. Prod. 2023, 392, 136248. [Google Scholar] [CrossRef]
  28. Latif, S.D.; Azmi, M.; Ahmed, A.N.; Fai, C.M.; El-Shafie, A. Application of artificial neural network for forecasting nitrate concentration as a water quality parameter: A case study of Feitsui Reservoir, Taiwan. Int. J. Des. Nat. Ecodyn. 2020, 15, 647–652. [Google Scholar] [CrossRef]
  29. Badr, E.-S.A.; Tawfik, R.T.; Alomran, M.S. An Assessment of Irrigation Water Quality with Respect to the Reuse of Treated Wastewater in Al-Ahsa Oasis, Saudi Arabia. Water 2023, 15, 2488. [Google Scholar] [CrossRef]
  30. Wallace, C.A.; Dini, S.M.; Al-Farasani, A.A. Geological Map of the Wadi as Sirhan Quadrangle, Sheet 30C, Kingdom of Saudi Arabia with Explanatory Notes: Saudi Geological Survey, Geoscience Map, 2000, GM-127C, Scale 1: 250,000. Available online: https://sgs.gov.sa/en/products/geologic-map-of-wadi-as-sirhan-quadrangle-sheet-30ckingdom-of-saudi-arabia-with-explanatory-notes (accessed on 8 August 2023).
  31. Coleman, R.G.; Gregory, R.T.; Brown, G.F. Cenozoic Volcanic Rocks of Saudi Arabia; US Department of the Interior, Geological Survey: Reston, VA, USA, 1983; Volume 83.
  32. Geological Survey (US); Meissner, C.R. Preliminary Geologic Map of the Wadi as Sirhan Quadrangle, Sheet 30C, Kingdom of Saudi Arabia; Department of the Interior, US Geological Survey: Reston, VA, USA, 1990.
  33. Pollastro, R.M.; Karshbaum, A.S.; Viger, R.J. Open-File Report 97-470B; US Geological Survey Open File Report 97, 470B; US Geological Survey: Reston, VA, USA, 1997.
  34. BGR; UNESCO. Groundwater Resources of the World 1: 25 000 000; BGR: Hannover, Germany; UNESCO: Paris, French, 2008. [Google Scholar]
  35. Esri; Garmin; GEBCO; NOAA NGDC; Other Contributors. Oceans Base Map. 2023. Available online: https://services.arcgisonline.com/ArcGIS/rest/services/Ocean/World_Ocean_Base/MapServer (accessed on 8 August 2023).
  36. Szabolcs, I.; Darab, C. The Influence of Irrigation Water of High Sodium Carbonate Content of Soils. In Proceedings of 8th International Congress Soil Science Sodics Soils; Szabolics, I., Ed.; Research Institute for Soil Science and Agricultural Chemistry of the Hungarian Academy of Sciences, ISSS Trans II: Tsukuba, Japan, 1964; pp. 802–812. [Google Scholar]
  37. Adimalla, N.; Li, P.; Qian, H. Evaluation of groundwater contamination for fluoride and nitrate in semi-arid region of Nirmal Province, South India: A special emphasis on human health risk assessment (HHRA). Hum. Ecol. Risk Assess. Int. J. 2018, 25, 1107–1124. [Google Scholar] [CrossRef]
  38. Tahmasebi, P.; Mahmudy-Gharaie, M.H.; Ghassemzadeh, F.; Karimi Karouyeh, A. Assessment of groundwater suitability for irrigation in a gold mine surrounding area, NE Iran. Environ. Earth Sci. 2018, 77, 766. [Google Scholar] [CrossRef]
  39. Thorne, D.W. Alkali Soils: Their Formation, Properties and Reclamation. WP Kelley. New York: Reinhold, 1951. 176 pp. $5.00. Science 1951, 114, 558. [Google Scholar] [CrossRef]
  40. Alshehri, F.; Abdelrahman, K. Integrated approach for the investigation of groundwater quality using hydrochemical and geostatistical analyses in Wadi Fatimah, western Saudi Arabia. Front. Earth Sci. 2023, 11, 1166153. [Google Scholar] [CrossRef]
  41. Kanagaraj, G.; Elango, L. Hydrogeochemical processes and impact of tanning industries on groundwater quality in Ambur, Vellore district, Tamil Nadu, India. Environ. Sci. Pollut. Res. 2016, 23, 24364–24383. [Google Scholar] [CrossRef] [PubMed]
  42. Adimalla, N.; Dhakate, R.; Kasarla, A.; Taloor, A.K. Appraisal of groundwater quality for drinking and irrigation purposes in Central Telangana, India. Groundw. Sustain. Dev. 2020, 10, 100334. [Google Scholar] [CrossRef]
  43. Ravikumar, P.; Somashekar, R.K. Principal component analysis and hydrochemical facies characterization to evaluate groundwater quality in Varahi river basin, Karnataka state, India. Appl. Water Sci. 2017, 7, 745–755. [Google Scholar] [CrossRef]
  44. Subba Rao, N. PIG: A numerical index for dissemination of groundwater contamination zones. Hydrol. Process. 2012, 26, 3344–3350. [Google Scholar] [CrossRef]
  45. Ndoye, S.; Fontaine, C.; Gaye, C.B.; Razack, M. Groundwater quality and suitability for different uses in the Saloum area of Senegal. Water 2018, 10, 1837. [Google Scholar] [CrossRef]
  46. Geetha, S.; Dharmendira, K.M. Investigation of hydrochemical dynamics of groundwater in coastal blocks of Tiruvallur district, Tamilnadu, India. J. Chil. Chem. Soc. 2021, 66, 5352–5357. [Google Scholar] [CrossRef]
  47. Naidu, S.; Gupta, G.; Singh, R.; Tahama, K.; Erram, V.C. Hydrogeochemical processes regulating the groundwater quality and its suitability for drinking and irrigation purpose in parts of coastal Sindhudurg District, Maharashtra. J. Geol. Soc. India 2021, 97, 173–185. [Google Scholar] [CrossRef]
  48. Snousy, M.G.; Wu, J.; Su, F.; Abdelhalim, A.; Ismail, E. Groundwater quality and its regulating geochemical processes in Assiut Province, Egypt. Expo. Health 2022, 14, 305–323. [Google Scholar] [CrossRef]
  49. Beale, M.H.; Hagan, M.T.; Demuth, H.B. Neural network toolbox. In User’s Guide MathWorks; The MathWorks, Inc.: Natick, MA, USA, 2010; Volume 2, pp. 77–81. [Google Scholar]
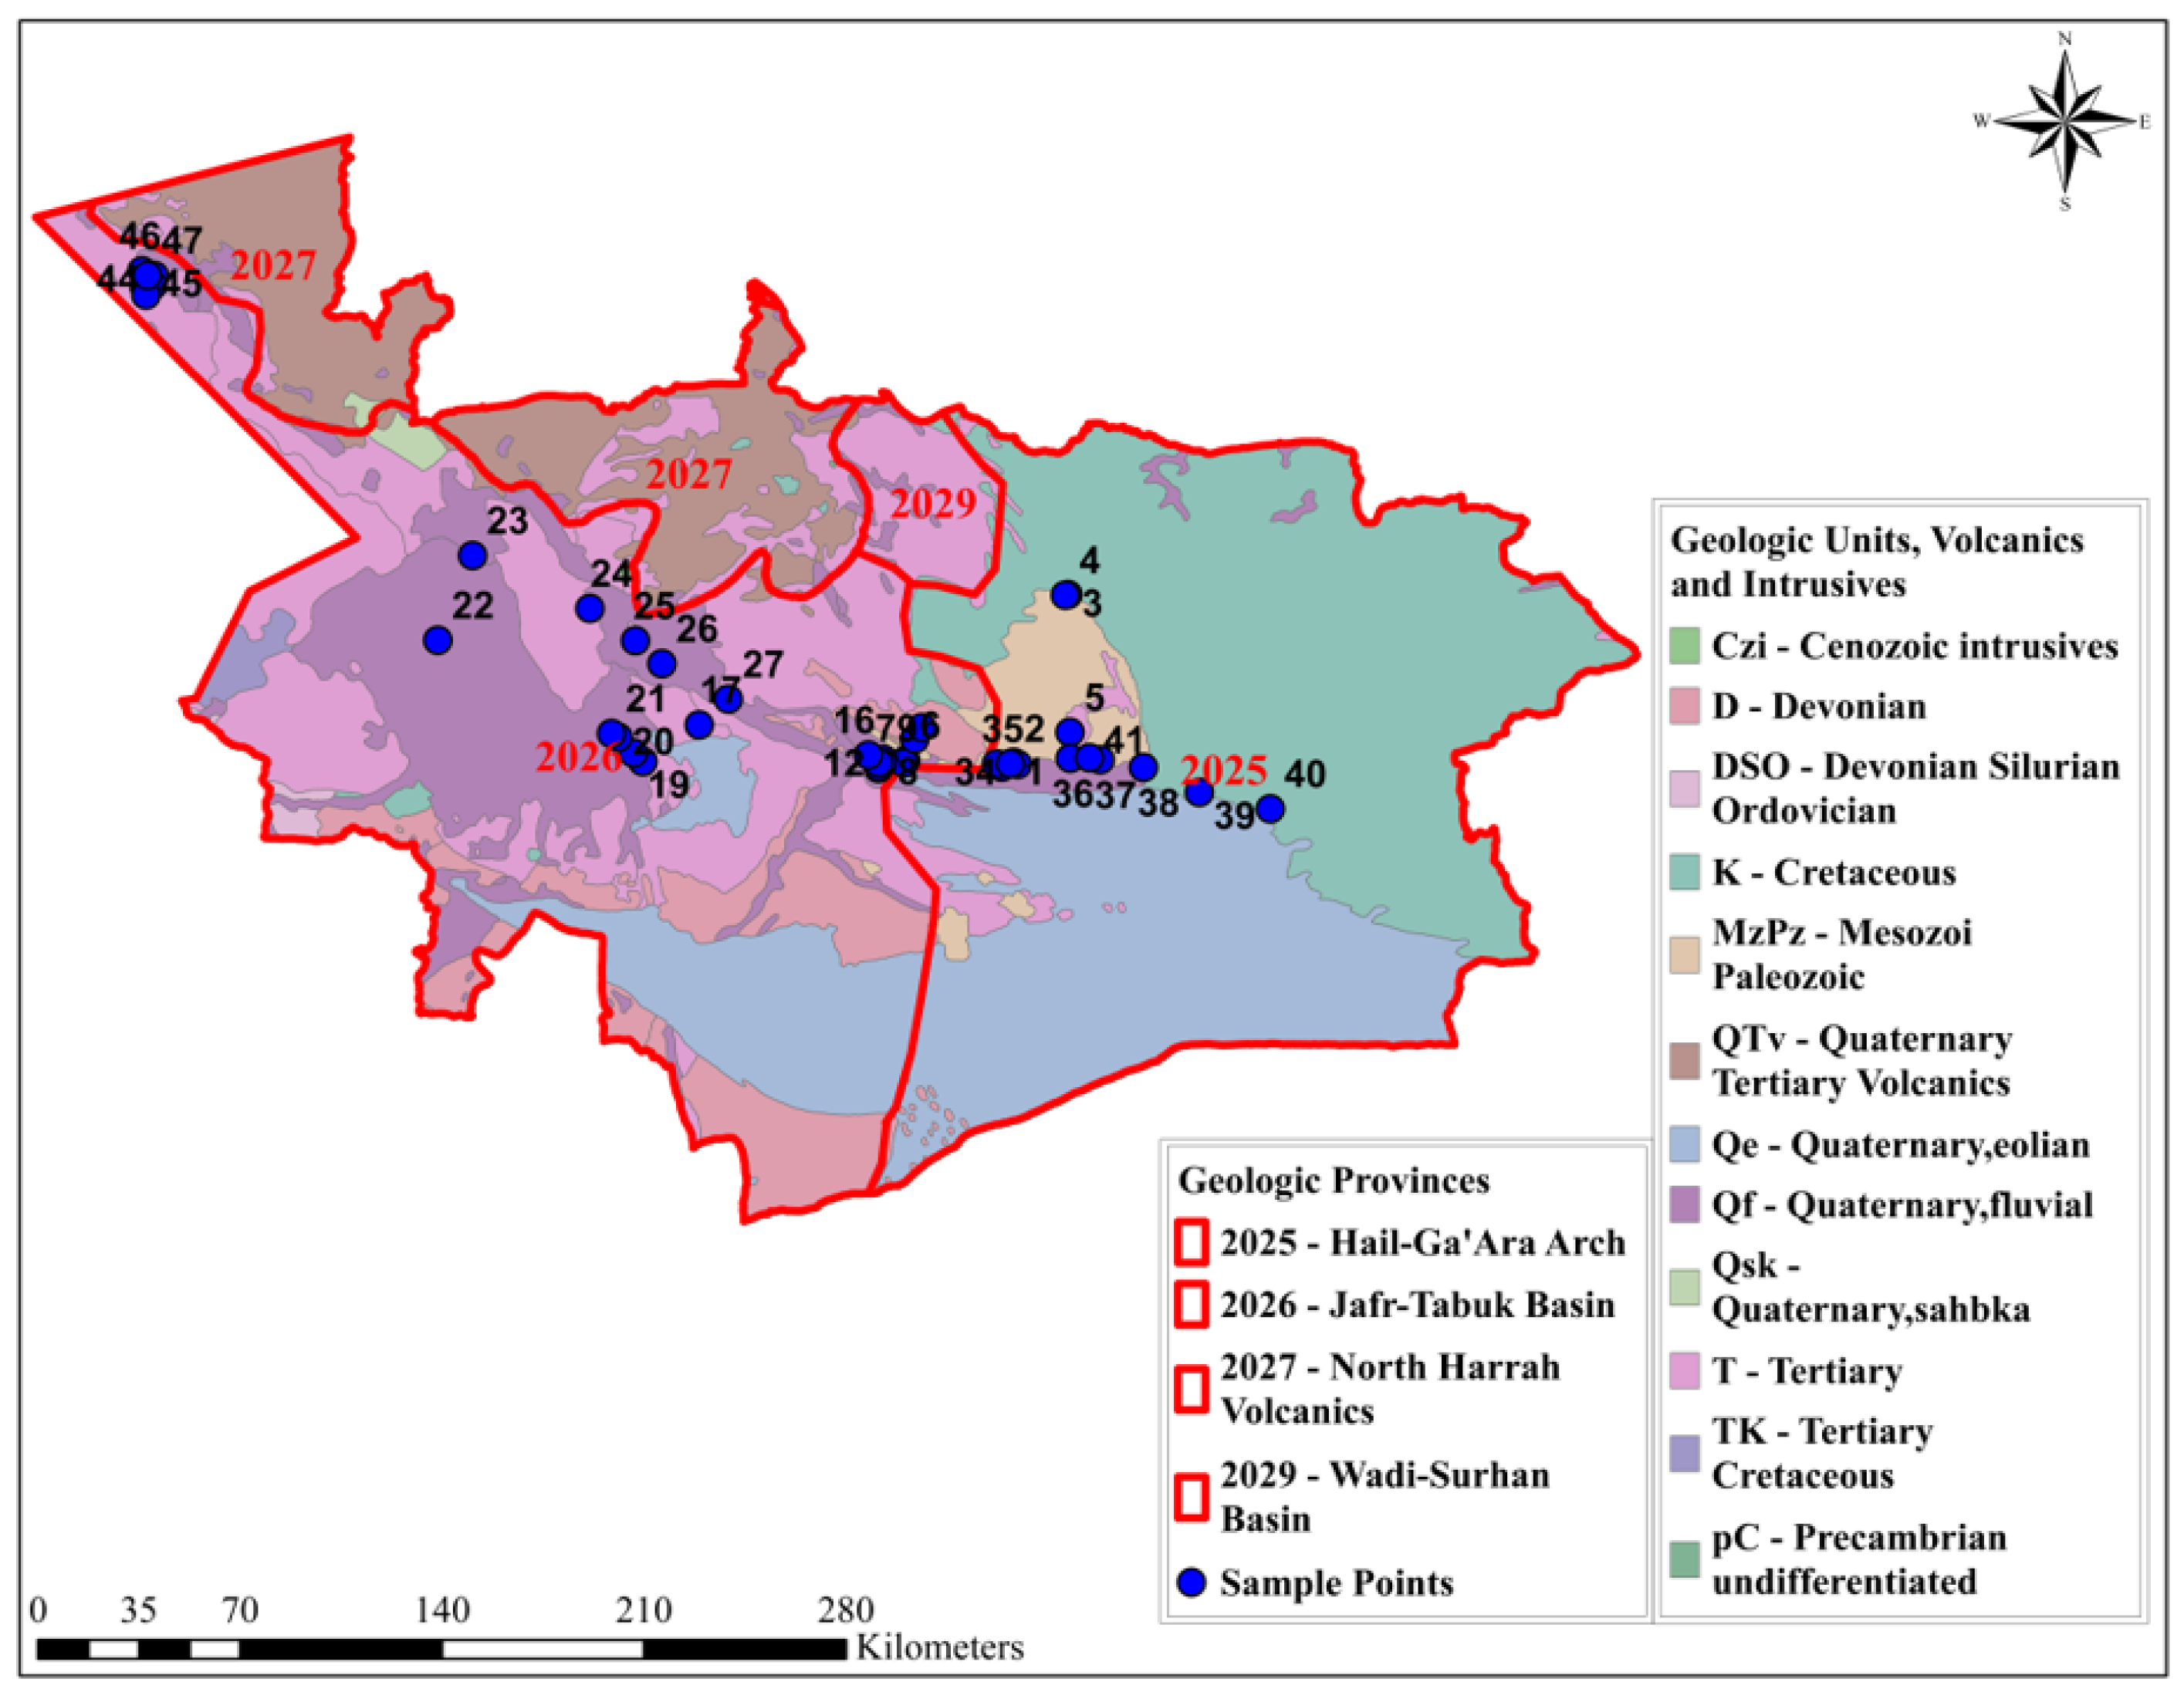
Figure 1. Schematic geological map of Al-Jouf Region.
Water 15 02982 g001
Figure 2. Research methodology of the current study.
Water 15 02982 g002
Figure 3. Map of (a) groundwater resources in KSA and (b) water sample locations at Al-Jouf region [34,35].
Water 15 02982 g003
Figure 4. A hidden layer in the FFNN structure.
Water 15 02982 g004
Figure 5. Flow chart for predicting the suitability of groundwater for drinking water supply using FFNN.
Water 15 02982 g005
Figure 6. Boxplot of the numerical values of (a) Ca2+, (b) Na+, (c) K+, (d) Mg2+, (e) SO42, (f) NO3, (g) Cl, (h) hardness, (i) pH, (j) EC, and (k) TDS in the study area.
Water 15 02982 g006
Figure 7. Spatial distribution of (a) Ca2+, (b) Na+, (c) K+, (d) Mg2+, (e) SO42, (f) NO3, (g) Cl, (h) hardness, (i) pH, (j) EC, and (k) TDS in the study area.
Water 15 02982 g007
Figure 8. Pearson correlation matrix, where r is computed for each pair of traits. The bold-only values are significant at p ≤ 0.05, and the underlined-bold values are significant at p ≤ 0.01.
Water 15 02982 g008
Figure 9. PCA of the measured parameters (a) screen plot of the characteristic roots (eigenvalues); (b) component plot in the rotated space.
Water 15 02982 g009
Figure 10. Hydrogeochemical facies for the classification of groundwater (a) Piper diagram and (b) Gibbs plot.
Water 15 02982 g010
Figure 11. Radar maps of WQI according to (a) WHO and (b) BIS standards.
Water 15 02982 g011
Figure 12. Spatial distribution of WQI according to (a) WHO and (b) BIS standards.
Water 15 02982 g012
Figure 13. Spatial distribution of (a) Na+ %, (b) MH, (c) SAR, (d) PS, and (e) KR.
Water 15 02982 g013
Figure 14. The estimated linear regression relationships for training, validation, testing, and overall, per model for the FFNN model (a) Na+ %, (b) SAR, (c) KR, (d) MH, (e) PS, and WQI according to (f) WHO and (g) BIS standards.
Water 15 02982 g014
Figure 15. FFNN predictions for each model for the entire set of experimental data samples for (a) Na+ %, (b) SAR, (c) KR, (d) MH, (e) PS, and WQI according to (f) WHO and (g) BIS standards (data1 Water 15 02982 i001 and predicted values Water 15 02982 i002).
Water 15 02982 g015
Figure 16. For each model, FFNN predictions for the test set of experimental data samples for (a) Na+ %, (b) SAR, (c) KR, (d) MH, (e) PS, and WQI according to (f) WHO and (g) BIS standards (data1 Water 15 02982 i003 and predicted values Water 15 02982 i004).
Water 15 02982 g016
Table 1. Weight and relative weight of the used parameters and desirable values for BIS and WHO.
ParametersWeightage (wi)
[10]
Relative Weigh (Wi)Desirable Values
BIS
[16]
WHO
[17]
pH30.098.508.50
TDS (ppm)40.09500500
Hardness (ppm)30.09200100
Ca2+ (ppm)30.097575
Na+ (ppm)20.06200200
K+ (ppm)20.131212
Mg2+ (ppm)30.063050
Cl (ppm)40.13250200
SO42− (ppm)30.09200200
NO3 (ppm)50.164550
∑ wi = 32∑ Wi = 1
Table 2. Descriptive statistical for physicochemical parameters and standard limits for drinking use.
SampleUnitMinMaxMeanSDBIS [16]WHO [17]SASO [18]
DPDPDP
pH-6.928.467.74±0.346.58.56.58.56.58.5
EC(µS/cm)142.0019,470.002194.47±3483.80------
TDS(ppm)71.009730.001090.40±1723.08500200050015001000-
Hardness (ppm)26.824594.32506.36±803.91200600100500--
Ca2+(ppm)5.301010.40103.93±172.867520075200200-
Na+(ppm)5.302815.10275.74±519.32-200-200200-
K+(ppm)1.60138.3023.88±29.14-12-12--
Mg2+(ppm)3.10503.0059.94±91.713010050150150-
Cl(ppm)0.1761.654.77±10.062501000200600250-
SO42−(ppm)0.3019.963.06±4.55200400200400250-
NO3(ppm)0.120.910.30±0.2145-50-50-
Note(s): D: Desirable limits. P: Permissible limits.
Table 3. Numerical results of the main three factors out of FA and the corresponding commonalities (Bold numbers are the most significant values).
ParametersF1F2F3Commonalities
Ca2+0.972−0.033−0.2020.986
Na+0.9920.022−0.0030.985
K+0.8240.1290.5110.956
Mg2+0.989-0.024−0.0450.981
SO42−0.900−0.0080.2870.892
NO30.772−0.365−0.0720.734
Hardness0.986−0.029−0.1300.991
Cl0.9720.015−0.1630.971
pH0.2300.946−0.1040.959
EC0.9970.005−0.0340.994
TDS0.9960.007−0.0350.992
Eigenvalues8.9441.0490.449
(%) of Variance81.3129.5344.078
Cumulative (%) of Variance81.31290.84694.924
Table 4. The classification of groundwater for irrigation purposes based on these parameters (EC, Na+ %, MH, SAR, PS, and KR).
ParameterRangeClassificationNumber of SamplesPercentage of Sample (%)
EC μS/cm<700Excellent1736.17
700–3000Good2246.81
>3000Fair817.02
Na+ %<20Excellent00.00
20–40Good36.38
40–60Permissible2757.45
60–80Doubtful1531.91
>80Unsuitable 24.26
MH<50Excellent4595.74
>50Unsuitable 24.26
SAR<10Excellent1736.17
10–18Good123.40
18–26Doubtful919.15
>26Unsuitable 1021.28
PS<3Excellent to good3036.17
3–5Good to injurious723.40
>5Injurious to Unsuitable 1021.28
KR<1Excellent2348.94
>1Unsuitable 2451.06
Table 5. Effect of the number of neurons used in the hidden layer of each model.
ModelMeasure1017192125
Na+ %RMSE0.8310.1360.3360.5720.456
R20.9650.9900.9910.9850.988
SARRMSE0.3140.1030.0700.2030.120
R20.9950.9991.0000.9910.999
KRRMSE0.0200.0450.0220.0800.048
R21.0001.0001.0001.0001.000
MHRMSE0.3860.2380.0730.5090.132
R20.9810.9901.0000.9880.998
PSRMSE0.0030.0100.0020.0060.023
R21.0001.0001.0001.0001.000
WQI (WHO)RMSE0.0140.0520.0140.11140.073
R21.0001.0001.0000.9991.000
WQI (BIS)RMSE0.3270.0420.0110.2460.087
R20.9871.001.000.9901.00
Table 6. Effect of the training algorithm used in each model.
ModelMeasuretrainlmtrainscgtrainbr
Na+ %RMSE0.1361.4931.349
R20.9980.8860.984
SARRMSE0.0700.6760.796
R21.0000.9980.985
KRRMSE0.0220.1200.281
R20.9960.9610.990
MHRMSE0.0731.4151.209
R20.9920.9700.980
PSRMSE2.45 × 1030.1421.63 × 10−2
R21.0000.9991.000
WQI (WHO)RMSE1.45 × 10−21.1102.12 × 10−2
R21.000.9981.000
WQI (BIS)RMSE1.18 × 10−21.8704.80 × 10−2
R21.0000.9991.000
Table 7. Effect of the hidden layer’s activation function in each model.
ModelMeasureRadbastribastansig
Na+ %RMSE2.6021.2850.136
R20.9960.9700.998
SARRMSE0.0810.3040.070
R21.0000.9971.000
KRRMSE0.0710.0450.022
R21.0001.0000.996
MHRMSE0.4510.2230.073
R20.9970.9990.992
PSRMSE3.12 × 10−32.55 × 10−32.45 × 10−3
R21.0001.0001.000
WQI (WHO)RMSE1.65 × 10−22.82 × 10−31.45 × 10−2
R21.0001.0001.000
WQI (BIS)RMSE3.73 × 10−32.48 × 10−31.18 × 10−2
R21.0001.0001.000
Disclaimer/Publisher’s Note: The statements, opinions and data contained in all publications are solely those of the individual author(s) and contributor(s) and not of MDPI and/or the editor(s). MDPI and/or the editor(s) disclaim responsibility for any injury to people or property resulting from any ideas, methods, instructions or products referred to in the content.