Article

Ascertainment of Hydropower Potential Sites Using Location Search Algorithm in Hunza River Basin, Pakistan

1
Northwest Institute of Eco-Environment and Resources, University of Chinese Academy of Sciences, Lanzhou 730000, China
2
University of Chinese Academy of Sciences, Beijing 100049, China
3
China-Pakistan Joint Research Center on Earth Sciences, CAS-HEC, Islamabad 45320, Pakistan
4
Centre of Excellence in Water Resources Engineering, University of Engineering and Technology Lahore, Lahore 54890, Pakistan
5
Xinjiang Institute of Ecology and Geography, University of Chinese Academy of Sciences, Urumqi 830000, China
*
Author to whom correspondence should be addressed.
Water 2023, 15(16), 2929; https://doi.org/10.3390/w15162929
Submission received: 30 May 2023 / Revised: 29 July 2023 / Accepted: 7 August 2023 / Published: 14 August 2023
(This article belongs to the Topic Hydroelectric Power)

Abstract

:
The recent energy shortfall in Pakistan has prompted the need for the development of hydropower projects to cope with the energy and monetary crisis. Hydropower in the northern areas is available yet has not been explored too much. Focusing on the sustainable development goal (SDG) “Ensure access to affordable, reliable, sustainable and modern energy”, thirteen proposed sites were selected from upstream to downstream of the Hunza River for analysis. The head on all the proposed sites was determined by taking the elevation difference between the proposed turbine and the intake at all sites. The discharge on all proposed ungauged sites was determined using ArcGIS for watershed delineation and the area ratio method along with Soil Conservation Service–Curve Number (SCS-CN) by using gauged data of Hunza River provided by Water and Power Development Authority (WAPDA) Pakistan at Daniyor bridge Gilgit, Shimshal and the Passo tributaries of Hunza River. The Location Search Algorithm (LSA) approach used a multi-criteria decision-making tool (MDM) to make a decision matrix considering the location and constraint criteria and then normalizing the decision matrix using benefit and cost criteria, the relative weights were assigned to all criteria using a rank sum weighted method and the sites were ranked on the basis of the final score. The results revealed that Hunza River has a significant hydropower potential and based on the final score in the LSA approach, proposed site 13, site 4 and site 9 were concluded as the most promising sites among proposed alternatives. The proposed methodology could be an encouraging step for decision makers for future hydropower development in Pakistan.

1. Introduction

As a renewable energy source, hydropower is a versatile, dependable, and economical source of electricity generation and sustainable water-resource management [1]. Modern and advanced hydropower plants are accelerating our transition to clean energy, providing adequate power, and storage for irrigation purposes, and helping in climate-mitigation services. Hydropower is the most environmentally clean kind of renewable energy, with its emissions of greenhouse gases among the minimum. It contributes 16% of the world’s total energy consumption [2]. In the near future, the installed energy capacity of hydropower could reach more than 1064 GW, which would still be far less than the projected economically feasible hydropower generation. Economic constraints, urbanization, a revolution in hydrological regimes, and less available resources are the main issues affecting the exploitation and allocation of potential hydropower sites in different parts of the world, especially in developing countries, and about 70% of economically feasible hydroelectric energy is yet to be developed due to these constraints. Hence, sustainable hydropower could help us to meet the Paris agreement on climate change and the United Nations (UN) agenda of sustainable development [3].
Pakistan, the sixth largest population in the world, is one of the developing countries with an abundant potential for renewable energy resources; however, it is still facing a crisis of power production and there is a shortfall of the energy of about 5000 MW to 8000 MW [4]. I should be noted that the Ministry of Water and Power in Pakistan documented the first-ever energy policy in 2006 to mainstream hydropower development into the economic plan of the country. The policy consisted of three main phases: long-term, medium-term, and short-term plans. The short-term plans were designed to embellish the scheme to provide an attractive incentive for renewable energy development; however, the objectives could not be met due to financial and political constraints. A similar kind of situation was observed in other phases of energy policy in Pakistan. In energy policy, the exploration of different possible sites was also emphasized to put Pakistan on the renewable energy map of the world, especially the northern areas of Pakistan, which have significant hydropower potential which had still not been explored, mainly because of underinvestment by the government in the energy sector, partly implemented policies along with structural reforms, and a lack of proper identification of the hydropower potential of different rivers [5]. For example, only the Indus River has a potential of 60 GW; however, only 19% of it has been identified or used [6]. Moreover, despite a severe energy shortfall in the country, the progress in sustainable energy development has been too slow to meet the demand for energy in Pakistan, whereas hydropower installation has hastily increased worldwide. Today, the recent energy crises have provoked the Ministry to identify the hydropower potential of different rivers in-country and explore cheap, sustainable potential hydropower sites to meet the country’s energy demands.
In the past, significant numbers of studies have been conducted for the estimation of the hydropower potential of the river and suitable sites using different approaches and tools. Most of these studies have used the classical approach or field investigation (one of the traditional methods for hydropower potential), whereas recently, advanced tools (e.g., Geographic Information Systems (GIS) and remote sensing (RS)) have been used in many research studies [7,8,9,10,11,12,13]. The conventional method (paper mapping) consumes a significant amount of money and time, which limits the scope of these methods, especially in remote regions with complex terrains. Moreover, rational approximation simply uses the river flow and elevation for power potential approximation through site survey at a single point, or two points, or at a very small area [14]. However, high power potentials can be found in inaccessible remote regions with rough terrain, making this technique impossible for the reliable assessment of power potential and significant sites. In addition to that, the chances of human error and the effect of subjective judgment hinder the reliability of these methods [15].
To overcome these difficulties, GIS and RS techniques and Geo-Spatial Information Systems (GSIS) have recently been adopted for location analysis because of their time- and cost-effectiveness. For example, [14] used GIS for assessing hydropower potential using the spatial decision support system. Other than this, numerous studies have been conducted to analyze GIS data and search for suitable locations [16,17], also recommended a location-analysis method for searching hydropower potential sites using GSIS. In addition, several studies have also used the spatial process-based development of location analysis systems by managing and analyzing RS data using GIS [18]. The mentioned studies comprehensibly considered various aspects of location analysis (e.g., environmental, economic, and social); however, they did not utilize precise methodology for the selection of a site based on multivariable, rather than the single-head, difference between the powerhouse and the weir of the site.
For location search analysis, techniques based on the multivariate, multi-criteria decision-making tool (MDM) are convenient methods that allow us to rank other options and to choose a suitable one among them by assessing up to a few measures. These methods are considered a useful technique to analyze the issues related to decision-making processes. More specifically, MDM is a process to find the optimum alternative from all the available practicable options [19,20]. In recent years, the use of MDM approaches (e.g., a technique for order preference by the simulation of the ideal solution (TOPSIS), the analytic hierarchy process (AHP) and analytic network process (ANP) method) for the complicated problem have increased, especially in water resource engineering and management [21,22,23,24]. Similarly, a study by [25] focused on the review of reservoir operation optimizations using a Metaheuristic Algorithm.
Hence, focusing on the sustainable development goal (SDG) “Ensure access to affordable, reliable, sustainable and modern energy” [26], and keeping in view the utilization of MDM and GIS, a location-analysis methodology was adopted to search for hydropower potential sites in the Hunza River basin and select the most promising hydel potential site at Hunza River. Details about the study area, methodology, results, and conclusion are represented in the following sections, respectively.

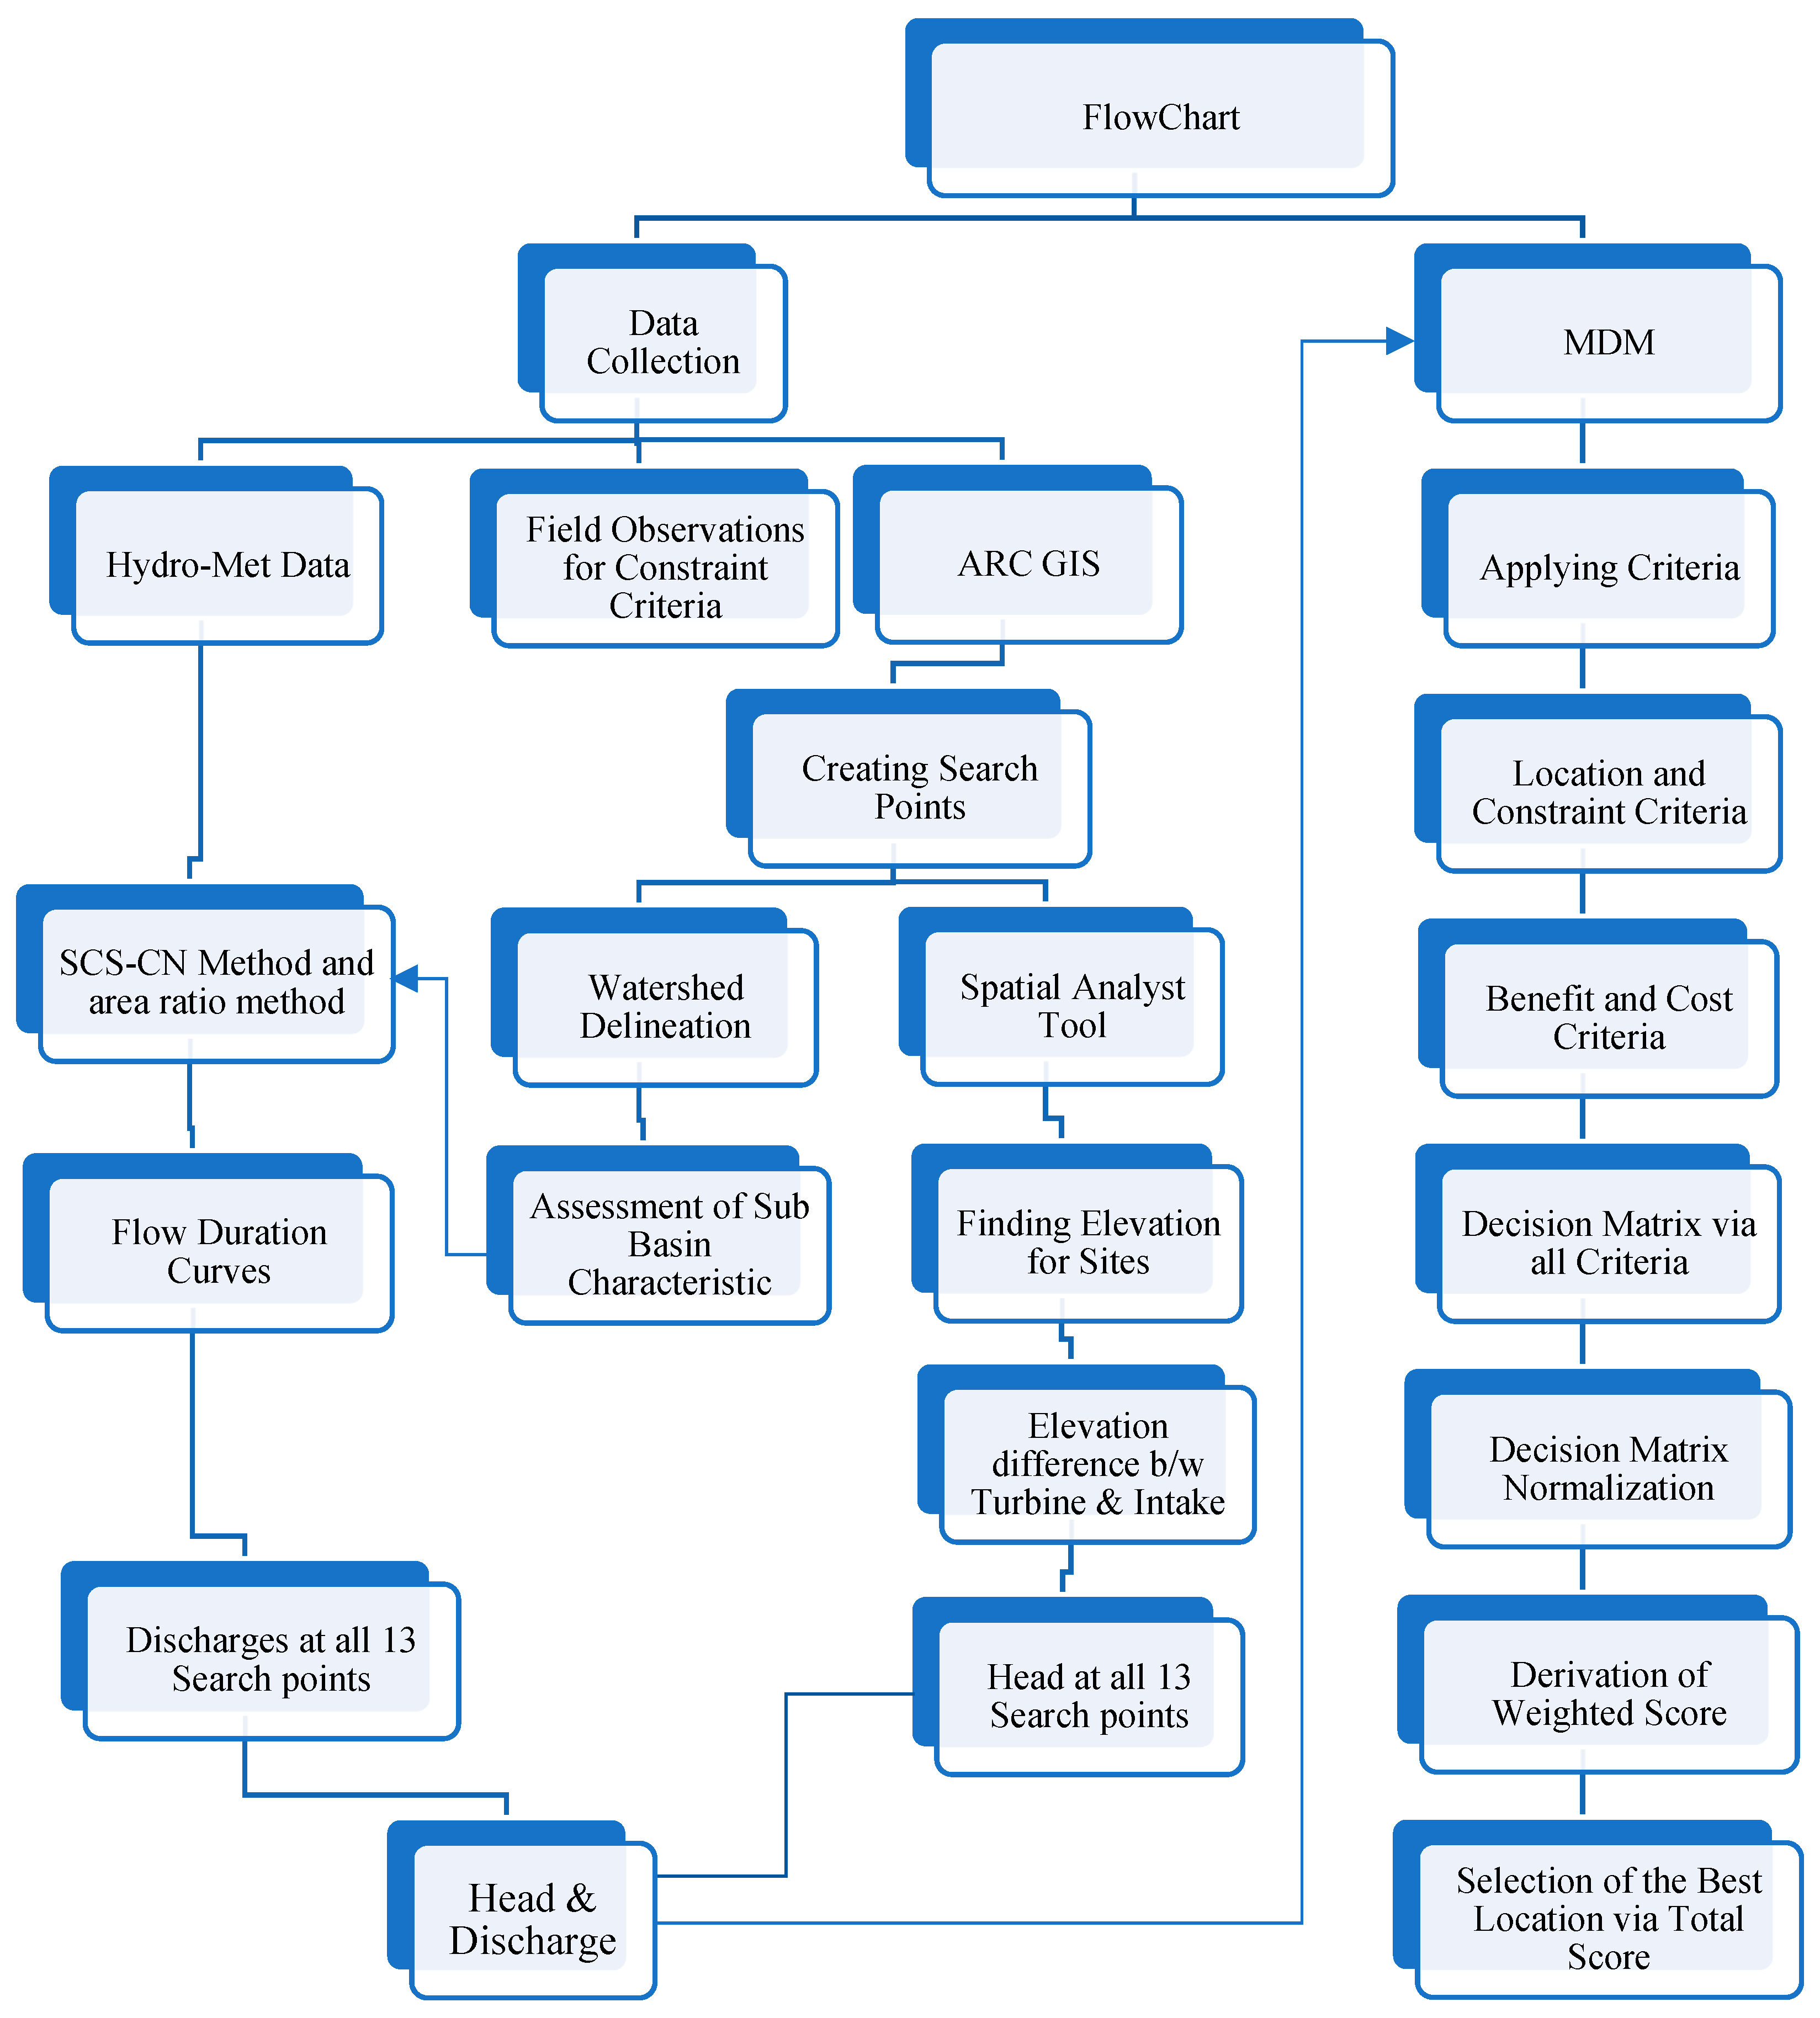
2. Materials and Methods
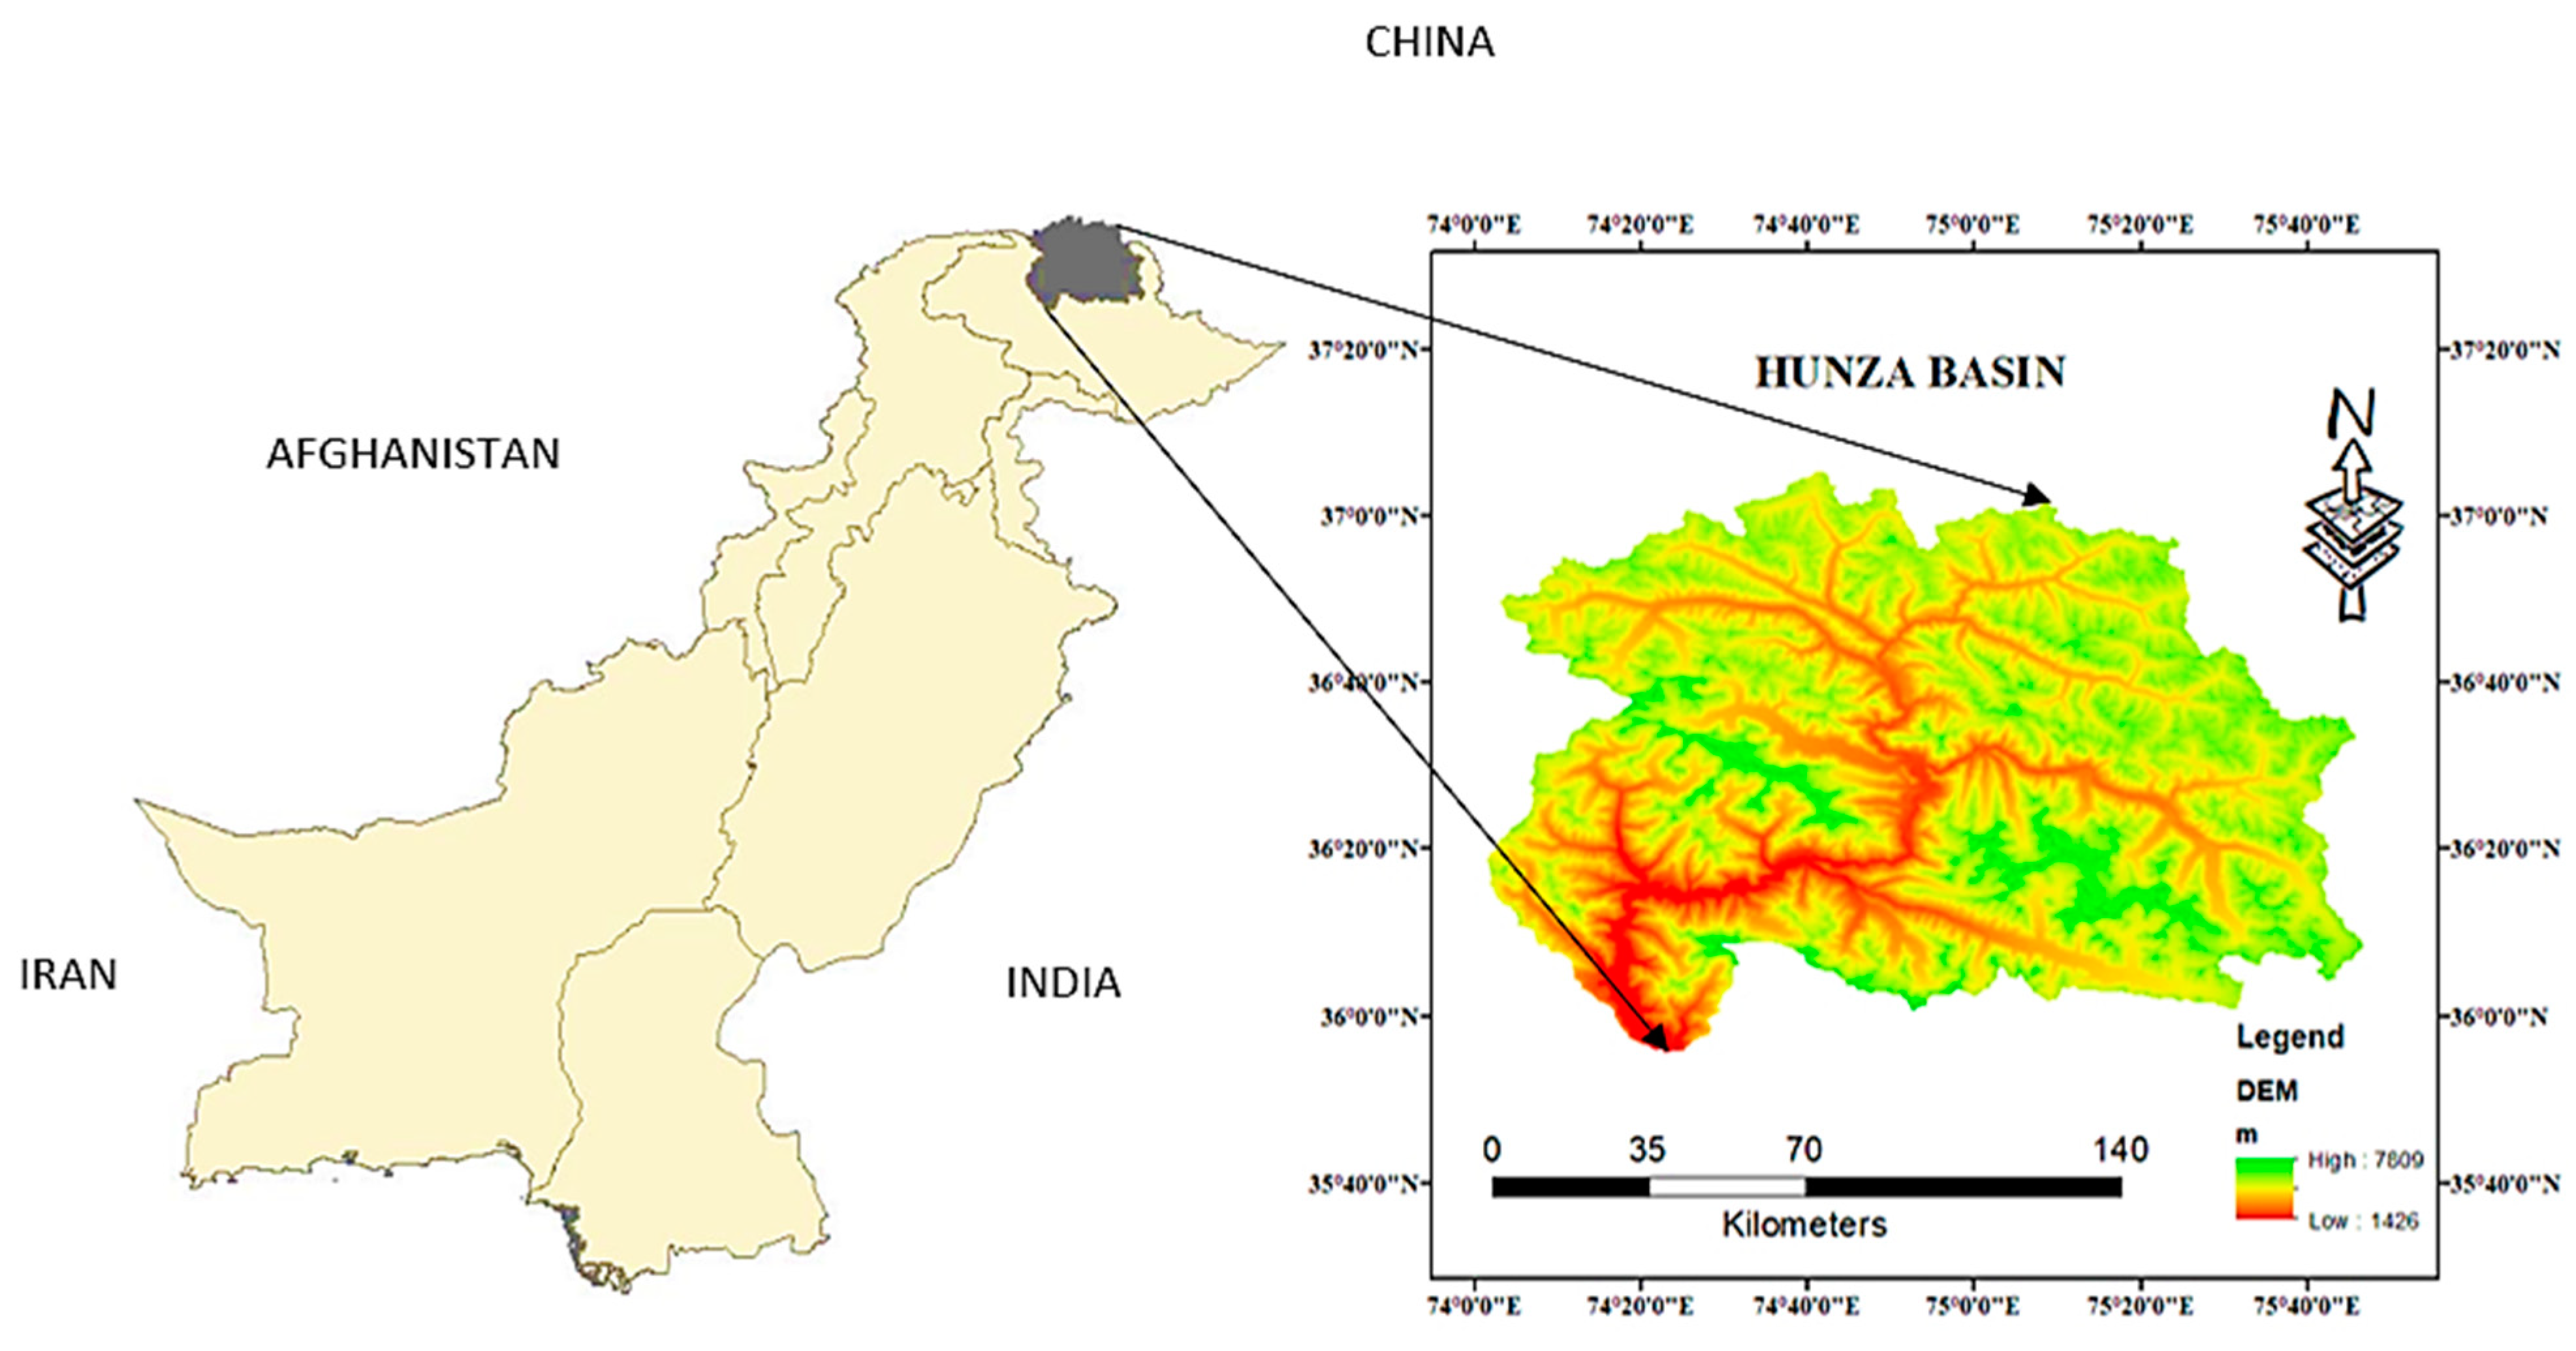
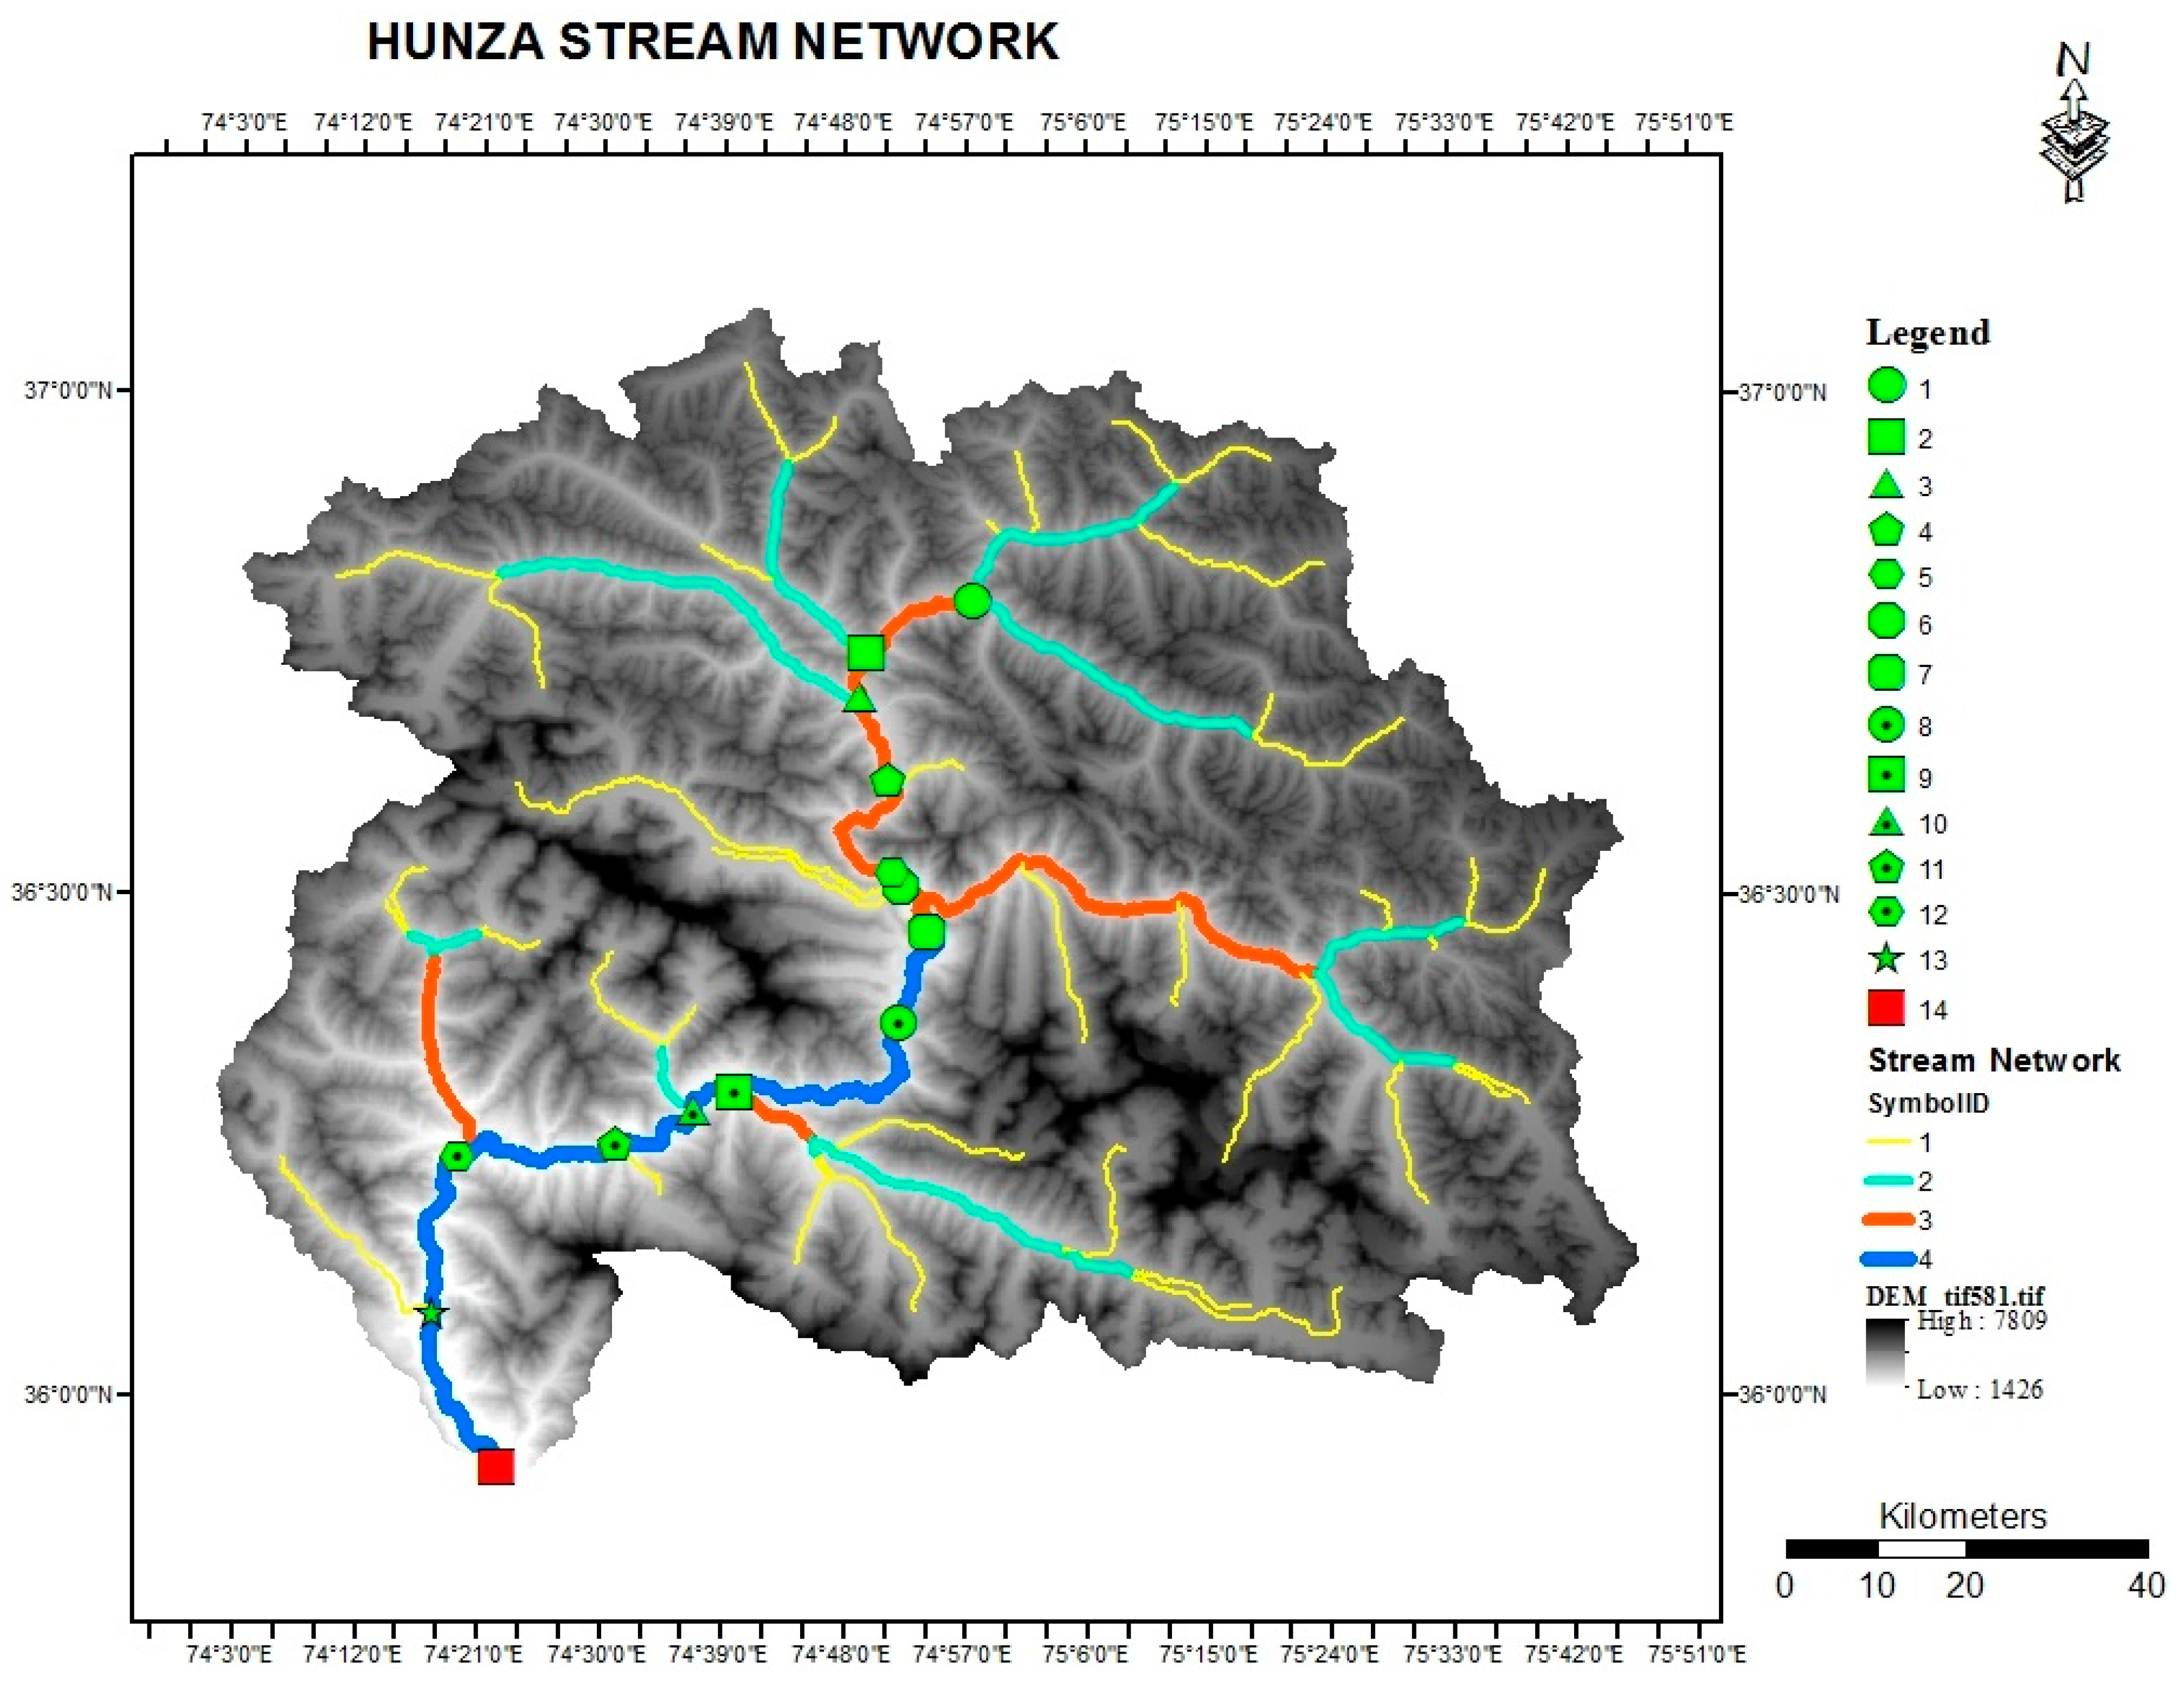
The methodology was adopted in this study to identify the best suitable location for hydropower generation using GIS and MDM approaches as represented in the flowchart (Figure 1). The detailed description is provided below.

2.1. Study Area

The study area, i.e., Hunza River basin (36.31° N, 74.64° E), as shown in Figure 2, is located in the mountainous valley in Gilgit-Baltistan, Pakistan, and has a basin area of 13,733 km2 with a 231.76 km total length of the river. Several medium- and small-sized perennials as well as non-perennial tributaries cum rivers, and streams, such as Chalt, Daniyor, Chupurson, Khyber, Khuda_abad, Khunjeraab, Hisper, Hassanabad, Misgar, Hoper, Nalter, Rakaaposhi, Verjerab and Shimmshal, contribute to the flow of Hunza River, making its mean annual flow 323 m3/s. The Hunza River basin joins the Nalter River and the Gilgit River before it falls into the mighty Indus River [4].
Hence, keeping in mind the possibility of hydropower potential in the Hunza river basin, the current study focuses on the identification of suitable sites in Hunza district, Gilgit-Baltistan, Pakistan. To conduct the identification of potential sites, the flow data were collected from the Surface-water Hydrology Project of Water and Power Development Authority (SWHP-WAPDA) of Pakistan for a period of 55 years (1960–2015) at Daniyor Bridge and for a period of 20 years (1995–2015) at Shimshal and Passo tributaries. The meteorological data of four available stations, i.e., Khunjerab, Naltar, Passo, and Khunjerab were obtained for the assessment of flow at different sub-basins. Moreover, the open-access Advanced Spaceborne Thermal Emission (ASTER)’s 30 m Digital Elevation Model (http://srtm.csi.cgiar.org) (accessed on 28 July 2018) was used for GIS-based DEM processing and the estimation of elevation, area and available head and different proposed sites.

2.2. Multi-Criteria Decision Making (MDM)

Multi-criteria decision-making (MDM) is used for screening, prioritizing, selecting, or ranking the alternatives, and relies on the human assessment of a finite number of options according to a number of competing standards. The steps involved in MDM follow the sequence of (1) the selection of criteria; (2) the estimation of location criteria; (3) the normalization of location and constraint criteria; (4) assigning the weights to individual criteria; (5) the final Ranking of suitable sites based on the weighted average score; and (6) the estimation of hydropower potential and plant factor and conclusion.
Step 1:
Selection of Criteria.
Considering conditions of the study area, different topographic, hydrologic, water resource-related, and socioeconomic criteria were used based on extensive literature, i.e., Refs [12,15,27,28], etc. The criteria were subdivided into location and constraint criteria, as represented in Table 1. For power calculations, head and discharge were used. Head and discharge were included in the location criteria and were estimated using GIS and a mathematical equation, respectively. The constraint criteria (as used by [11]) consist of criteria which can affect the sustainability of hydropower sites rather than the discharge and head. Furthermore, these constraint criteria were also divided based on the benefit (higher value represents positive aspect) or cost (higher value represents negative) aspect. Table 1 depicts the power criteria and constraint criteria along with their order number for MDM processing.
Based on benefit and cost criteria analysis, the intangible criteria were converted to numerical values (from zero to ten) to create a decision matrix for each site, as shown in Table 2. If the proposed site contains a large agriculture area, the environmental impact assessment is considered, and resettlement issues would occur in case of construction of a hydropower project at that location. So, a value of 1 will be assigned to it according to the scale. Similarly, if the selected proposed location has a much smaller agriculture area, it means that no issues of environmental impact assessment would rise. So, a value of 9 is assigned to it. Similarly, a site with a particularly good access gets a value 9 on the scale while a site with difficult or no access is assigned a value up to 1.
Step 2:
Estimation of Location Criteria.
(a)
Head Determination at Proposed Sites
Thirteen search points were proposed as hydropower potential sites along the centerline of the river for marking the proposed locations of the plant. These search points were taken as locations of the powerhouse where turbines were to be installed. It was known that the Hunza River is completely supported by glacier-fed tributaries. So, from upstream to downstream, all thirteen recommended locations were chosen by selecting search points right before a new tributary to receive a varied discharge at each site to further examine its appropriateness. At all these search points, the longitude and latitude were marked on the map, as shown in Figure 3. Sites were selected on a GIS map along the river centerline to mark proposed plant/turbine locations and intake locations. Proposed sites were marked using ArcGIS Editor Toolbar. The elevation at each proposed site was extracted from DEM using a spatial analyst tool. Then, head was calculated for all thirteen search points/sites using the difference between the elevation head and tail water level. The head was calculated using the difference in elevation of the intake point and the turbine position. Three factors were examined while determining the natural head at each search site. First, upstream of each search location, a suitable thin cross-section of the river was discovered. Second, there was a curve to achieve a better fall or head at the powerhouse locations, and third, there was a cup-shaped valley behind the sites where a reservoir could be built.
(b)
Estimation of Flow Duration Curve at Ungauged Sites
The data were obtained using the Soil Conservation Service Curve Number (SCS-CN) approach and the area ratio method for ungauged stations due to the lack of discharge data at various places. To estimate the discharge of sub-basins with meteorological stations, the SCS-CN approach was used, while the area ratio method was used to synthesize the data of remaining points. Moreover, watershed delineation at all thirteen points was carried out to divide the Hunza basin into thirteen sub-basins and the catchment characteristics (e.g., area, length, and CN) were estimated using GIS. Details of the SCS-CN method and area ratio method are given below.
The SCS-CN is the most widely used method for runoff estimation at the ungauged basin. SCS-CN is developed by the United States Department of Agriculture, keeping in view the hydrologic abstraction and land represented by CN. The curve number (CN) mainly depends on land use, soil type, and antecedent moisture conditions (AMCs) [29,30,31]. The SCS-CN is the most popular method for the hydrology of small catchment due to its simplicity, the incorporation of many factors, and well [30]. Using the SCS-CN method, the runoff (Q) is estimated using rainfall (P), curve number (CN), and initial abstraction ( I a ) , as given below:
P I a Q S = Q P I a
Q = P λ S 2 P + 1 λ S P λ S     else   Q = 0
where S is maximum potential retention and calculated S = 1000 C N 10   if   P   in   inches and S = 2540 C N 25.4   if   P   in   cm , λ = 0.2, and CN is the tabulated dimensionless index and ranges from 0–100. For the current study, CN was taken as 80 for the area of Hunza, as Hunza is very vegetative and grassy.
In cases where no flow data are available, then the area ratio method can be used for the estimation of flow for sites using existing data from one or more nearby homogenous streamflow-gauging stations [32]. In the area ratio method, it is assumed that the runoff per unit area in the target ungauged basin is equal to that in the donor basin. To estimate the runoff of the target ungauged basin ( Q u ), this method is quite simple and requires the runoff of the donor ( Q g ), area of the donor ( A g ), and area of the target ungauged basin ( A u ). Several studies have used the area ratio method and found it quite effective in the region with a scarce gauging network [33,34,35]. Moreover, it is widely used in the region, where still no rainfall–runoff relation has been developed.
Q u = K A u A g ϕ × Q g
where ϕ is an exponent parameter estimated by the regression analysis of flow and area of the gauged basin, and K is a bias correction factor = 1.0 [32,35].
Following the estimation and collecting of flow data at each of the thirteen locations, the flow duration curve (FDC) for each of the points that were chosen was generated. To produce FDC, the runoff from each suggested site was separately arranged in descending order. Following this step, the associated percentiles were determined using the Weibull plotting algorithm. Furthermore, for the current study, Q100, Q90, Q80, Q70, Q60, and Q50, were extracted from the FDC of each proposed location.
Q100 represents the flow that is equaled or exceeded 100% of the time. Q50 represents the flow that is equaled or exceeded 50% of the time.
Step 3:
Normalization of location and constraint criteria.
After the estimation of location criteria and conversion of constraint criteria into numerical values, a combined decision matrix for each proposed site was developed. The decision matrix was then normalized based on benefit and cost criteria using Equations (4) and (5), respectively.
For   Benefit   Criteria n i j = b i j b m a x b m i n m a x
For   Cost   Criteria n i j = c i j m a x c m i n m a x
where bij represents the ith value of jth benefit criteria, and cij indicating the ith value of jth cost criteria, max, and min in subscript represents the respective maximum and minimum value of cost and benefit criteria, and nij is the normalized value.
Step 4:
Assigning the weights to individual criterion.
The rank-sum weighted approach was used after the decision matrix was normalized and weights were assigned to each criterion. The weights in the rank-sum (RS) method are the normalized rankings of the individuals, which are determined by dividing their combined ranks by the sum of all ranks [36].
W j = 2 n + 1 r j n n + 1
where rj is the jth criterion’s ranking and j = 1, 2, 3……n.
Step 5:
Final Ranking of suitable sites based on the weighted average score.
After the determination of relative weights for each criterion, each relative weight was multiplied by its associated criterion, and the sum of these six weights was used to rank the recommended sites.
Step 6:
Estimation of hydropower potential and plant factor.
After evaluating the feasible locations using the MDM approach, the available hydropower potential was calculated for all recommended sites in the Hunza river basin using a worldwide efficiency of 81% [27].
P = η ρ g H Q 1000
where η = global efficiency, typically from 75 to 88 (%), g = gravitational acceleration, 9.81 (m/s2), ρ = density of water 1000 (kg/m3), P = mean annual electric power (kW), H = head (m), Q = discharge (m3/s), i.e., Q50 is used for the discharge for the calculation of power as Q50 represents the flow that is equaled or exceeded 50% of the time [37]. According to [38], the flow rate in Q50 is almost constant throughout the year, despite being lower than in Q75 and Q90. As a result, this discharge has been used in this study’s Q50 estimation of rivers’ potential for producing power.
Furthermore, for the calculation of the plant factor, using the average discharge equation, Q a v g , the energy (E) in GWh was calculated using Equations (8) and (9) and then the plant factor using Equation (10).
Q a v g = [ Q 100 + Q 90 + Q 80 + Q 70 + Q 60 + ( 5 Q 50 ) ] 10
where Q100, Q90, Q80, Q70, Q60 and Q50 are the percentage exceedances of discharges for each site from flow duration curves at 100%, 90%, 80%, 70%, 60% and 50% probability.
E = 8.76 η Q a v g g H 1000
where E is energy in GWh, H = head (m), g = gravitational acceleration, 9.81 (m/s2), η = global efficiency, typically from 75 to 88 (%) and Q a v g is derived from Equation (7).
P l a n t   factor = E 8.76 P × 100
where E is energy in GWh, and P is power in MW.

3. Results

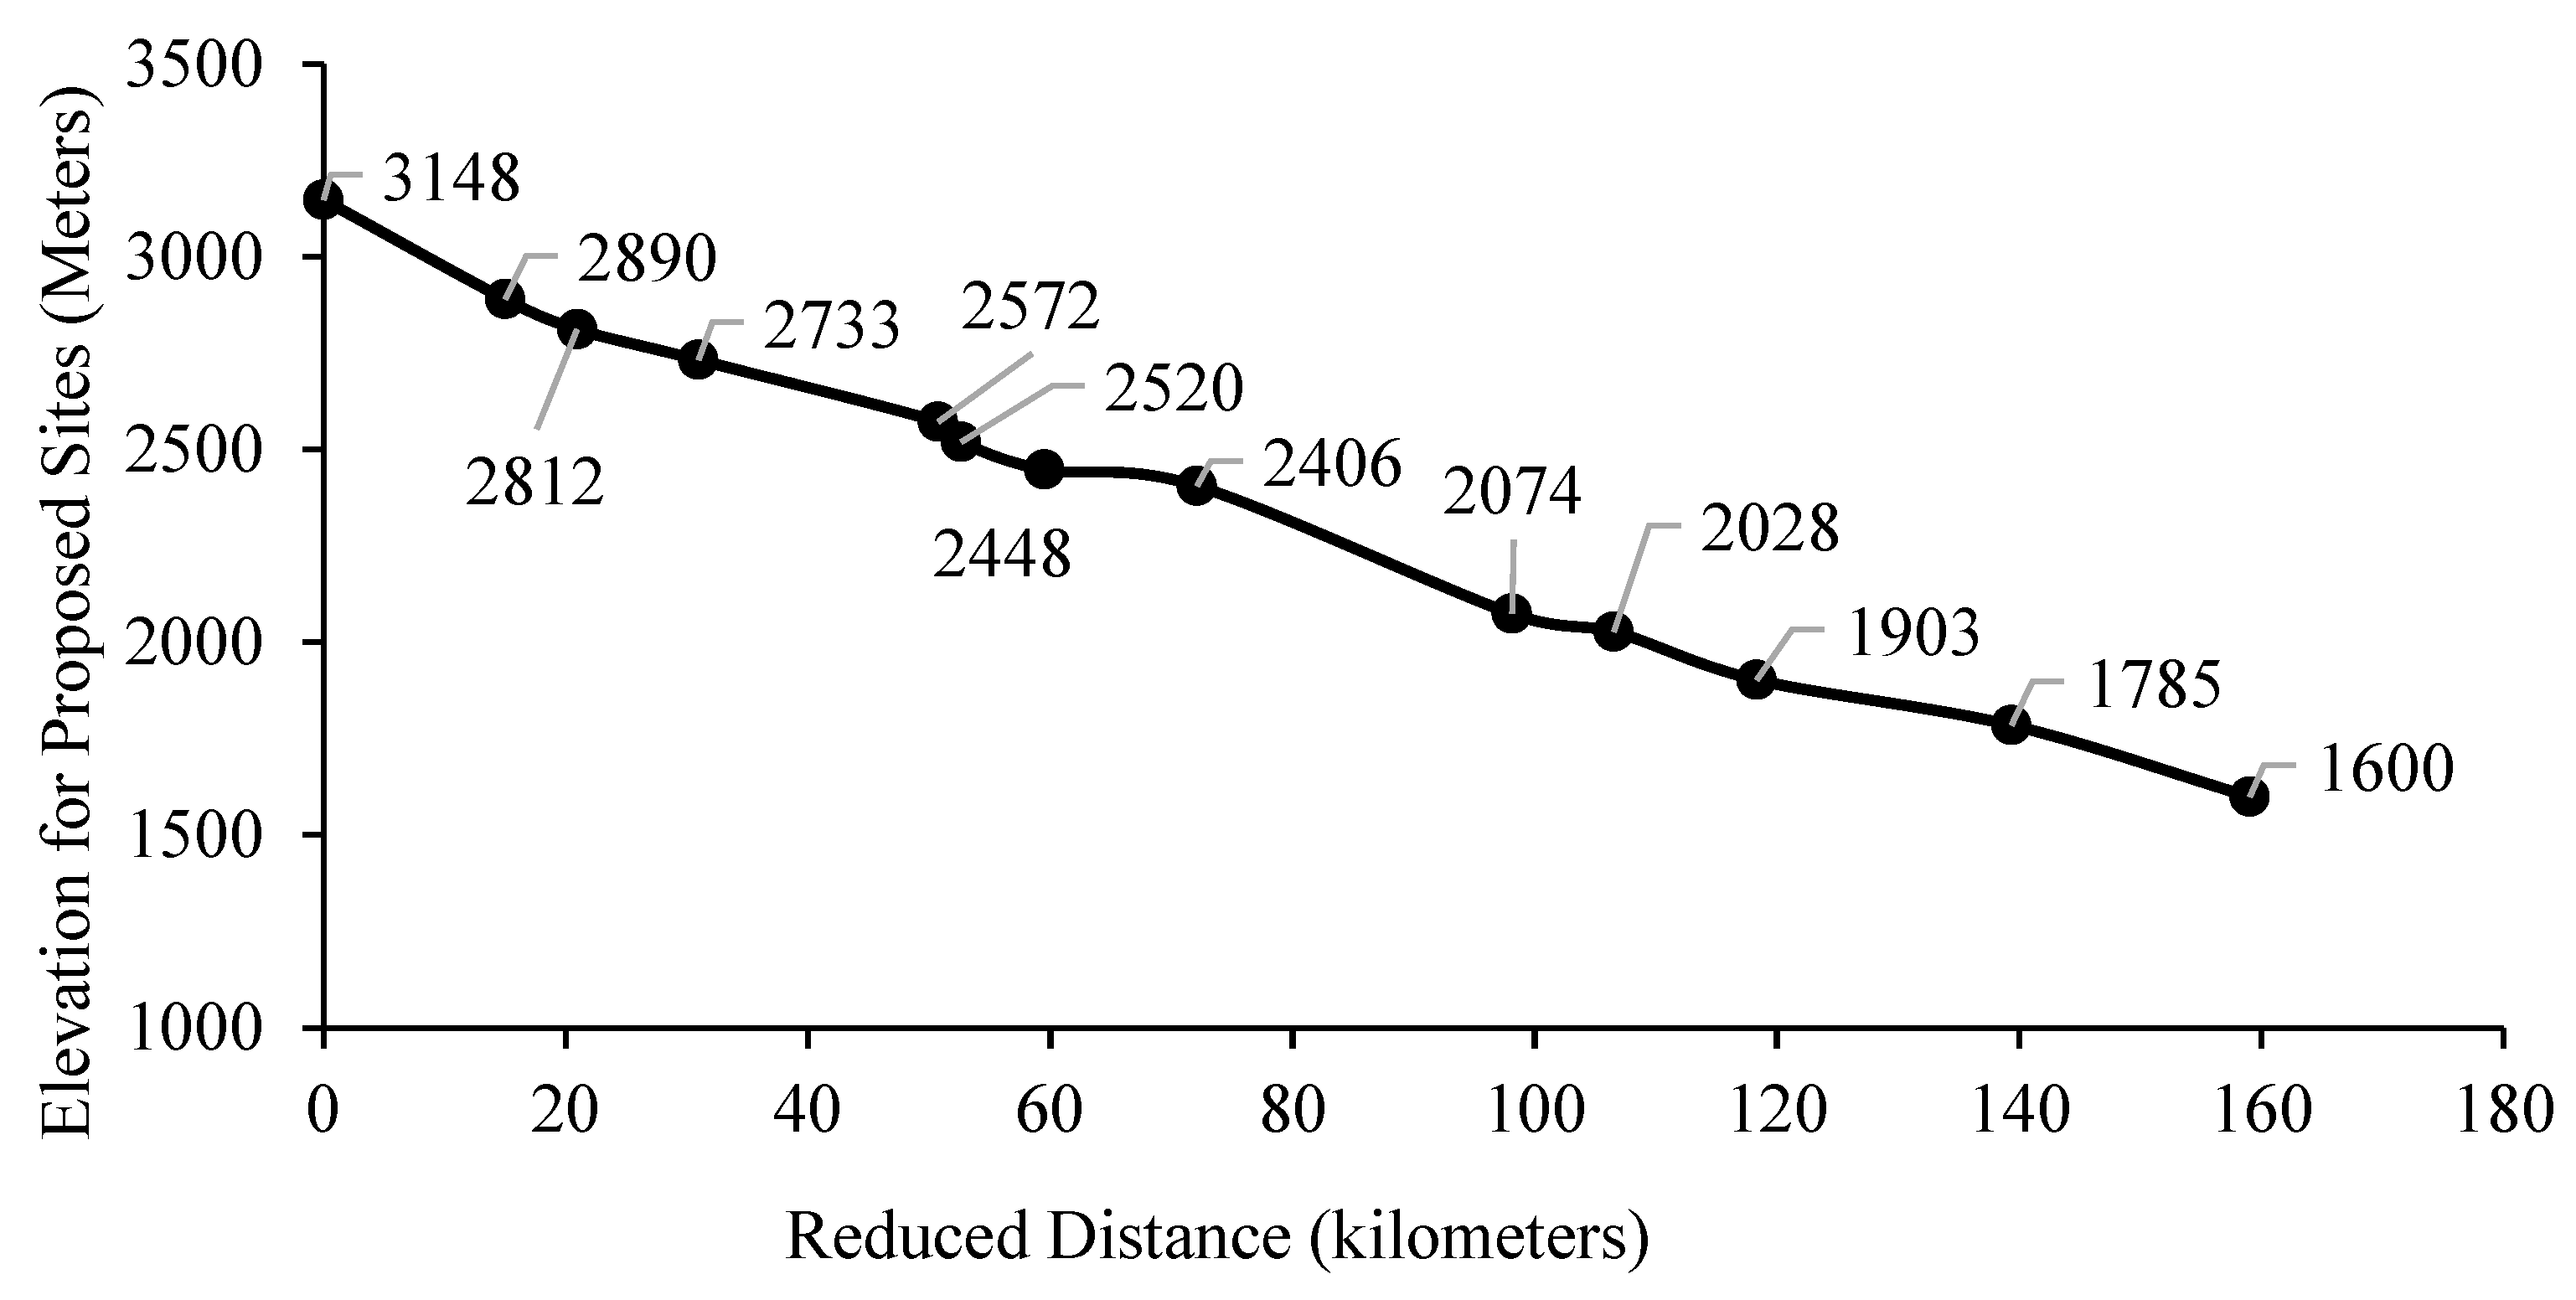
3.1. Head Determination

For assessment of the head at the marked thirteen sites, the elevations of both the proposed dam/weir and powerhouse locations were derived using DEM processing with the spatial analyst tools of GIS. The derived profile of the Hunza River is graphically represented in Figure 4 by using the derived elevation of each site against the reduced distance (RD) along with the derived river profile of Hunza River with respect to the elevation of the intake point of the proposed sites. The RD was taken from the upstream to downstream of the river in such a way that site one (1) was considered RD 0 km and so on.
For the purpose of head determination, locations were chosen on a GIS map of the Hunza River basin along the river’s centerline to indicate potential plant/turbine locations and intake locations. ArcGIS Editor Toolbar was used to mark proposed locations. Using the spatial analyst tool, the elevation at each proposed site was extracted from the DEM. The difference between the elevations of the head and tail waters is then used to calculate the head for each of the thirteen search points/sites. The first point was used as the intake point and the second as the powerhouse/turbine position to calculate the elevation difference/head, as shown in Table 3. Based on the results, it was observed that sites 5, 4, and 1 have the top three highest heads, i.e., 117, 94.5 and 80.79, respectively.

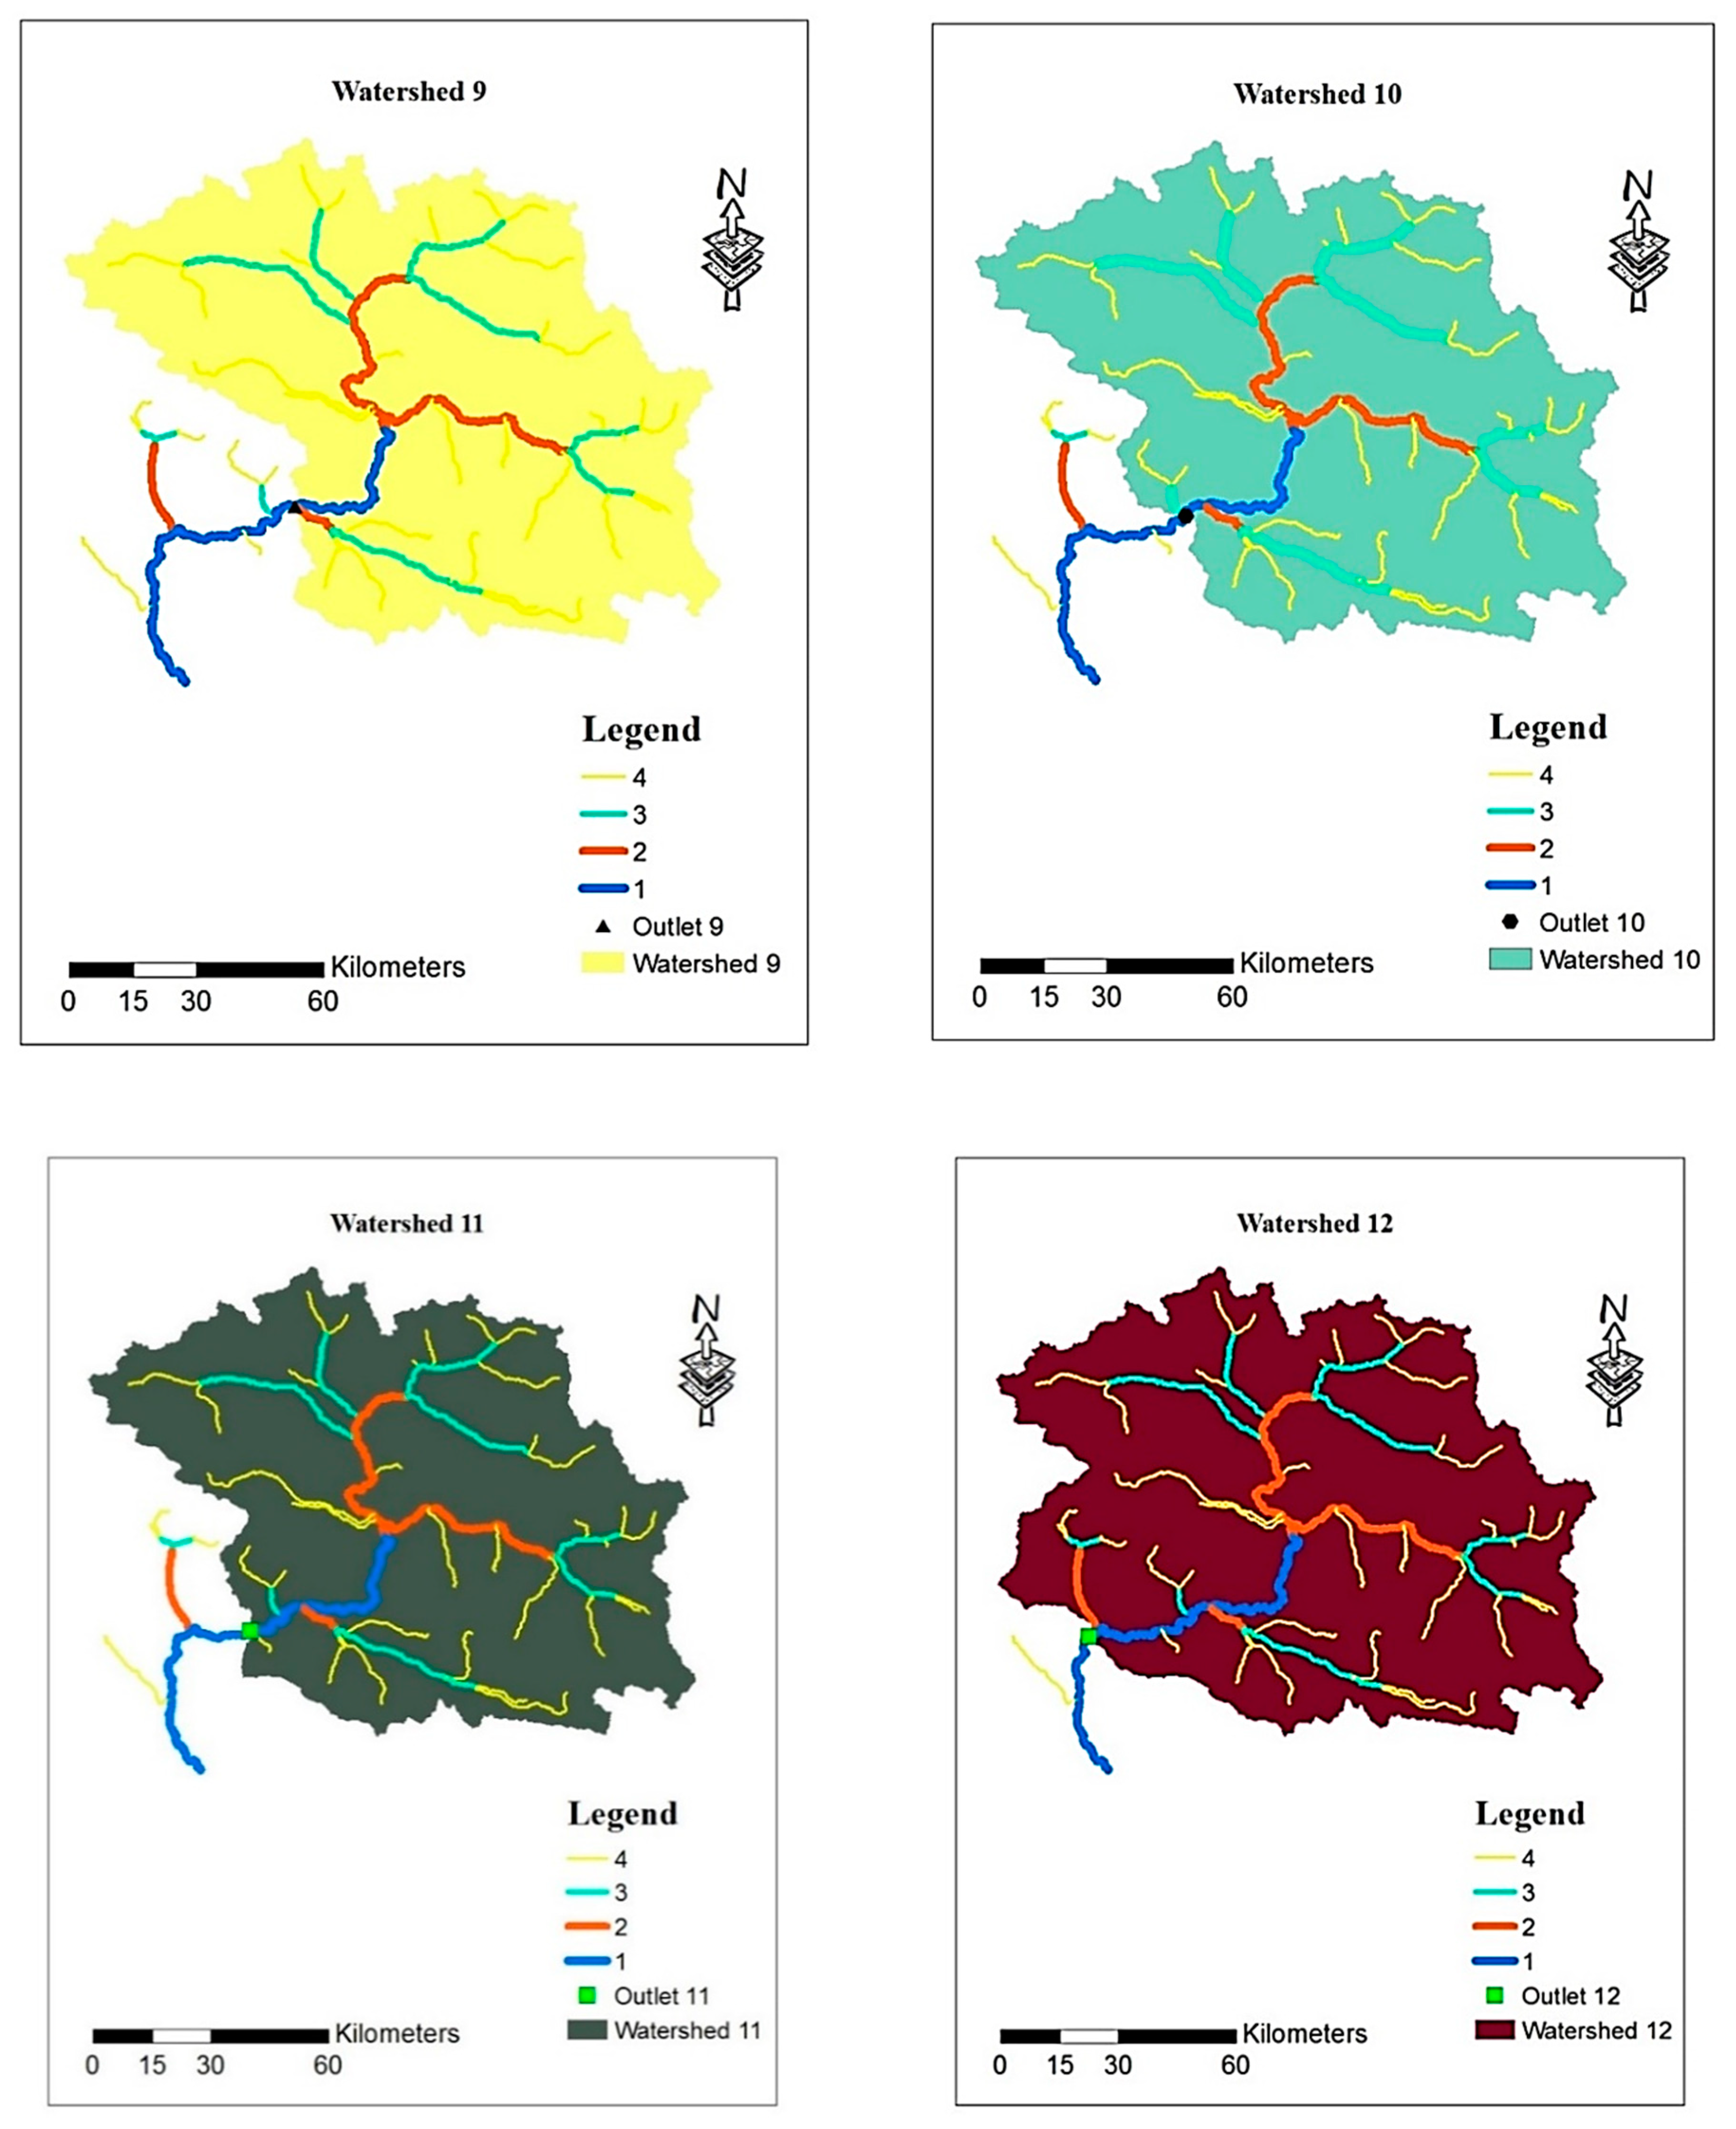
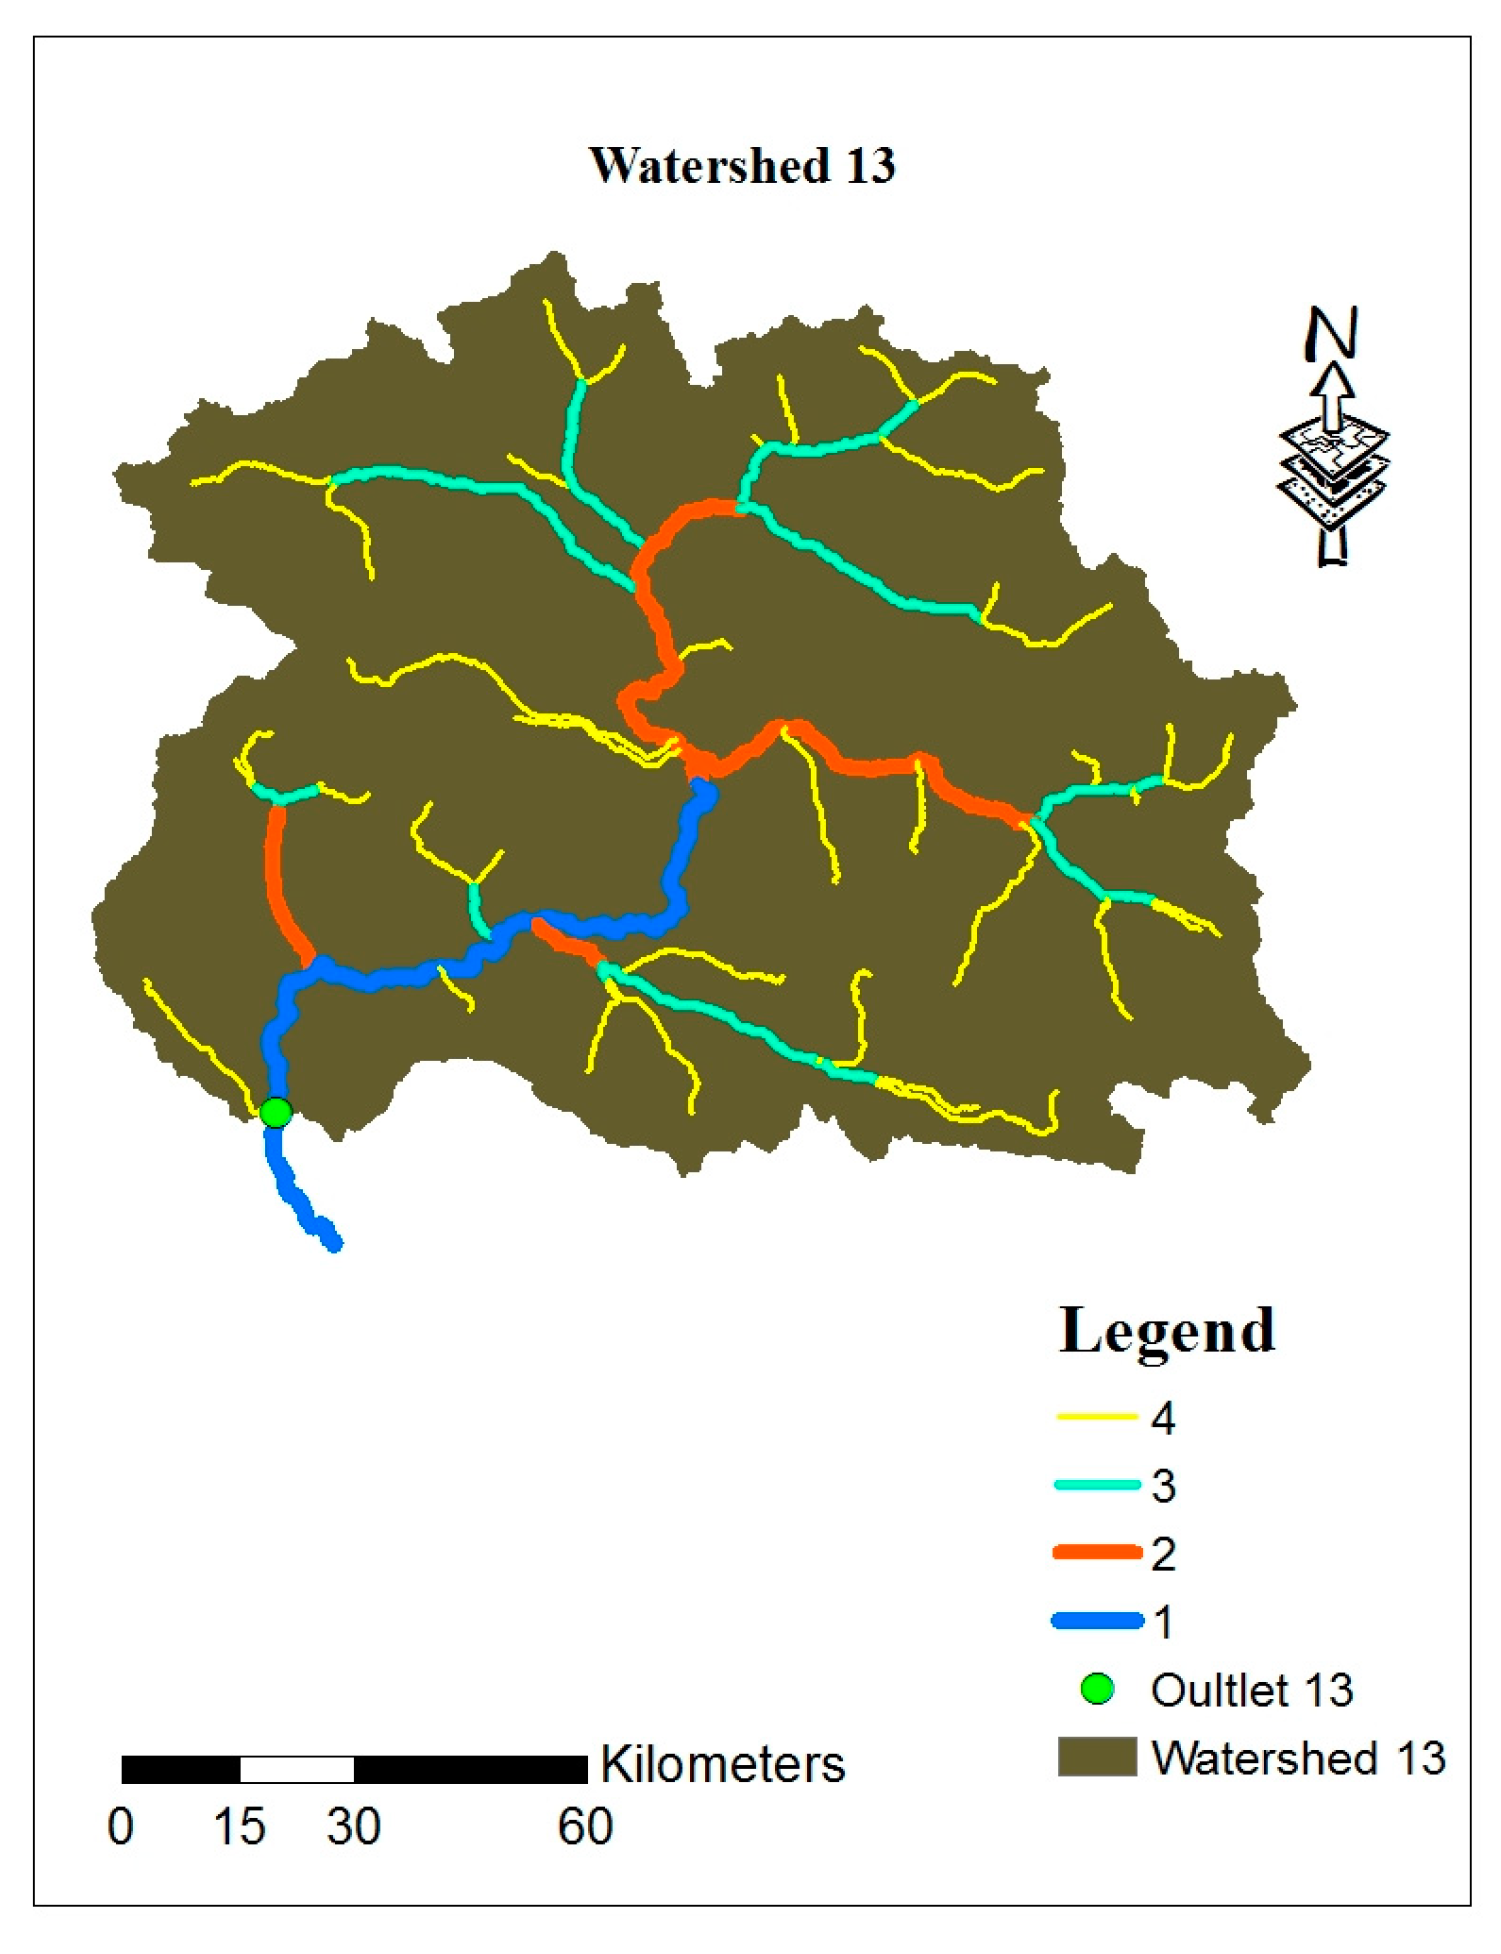
3.2. Watershed Delineation for All Sites

The catchment characteristics, including the watershed area of each site and CN, were calculated using GIS and CN-Tables to carry out the estimation of discharge with SCS-CN and AR methods. Figure 5 shows the watershed delineation from upstream to downstream using the arc hydro tool in GIS.

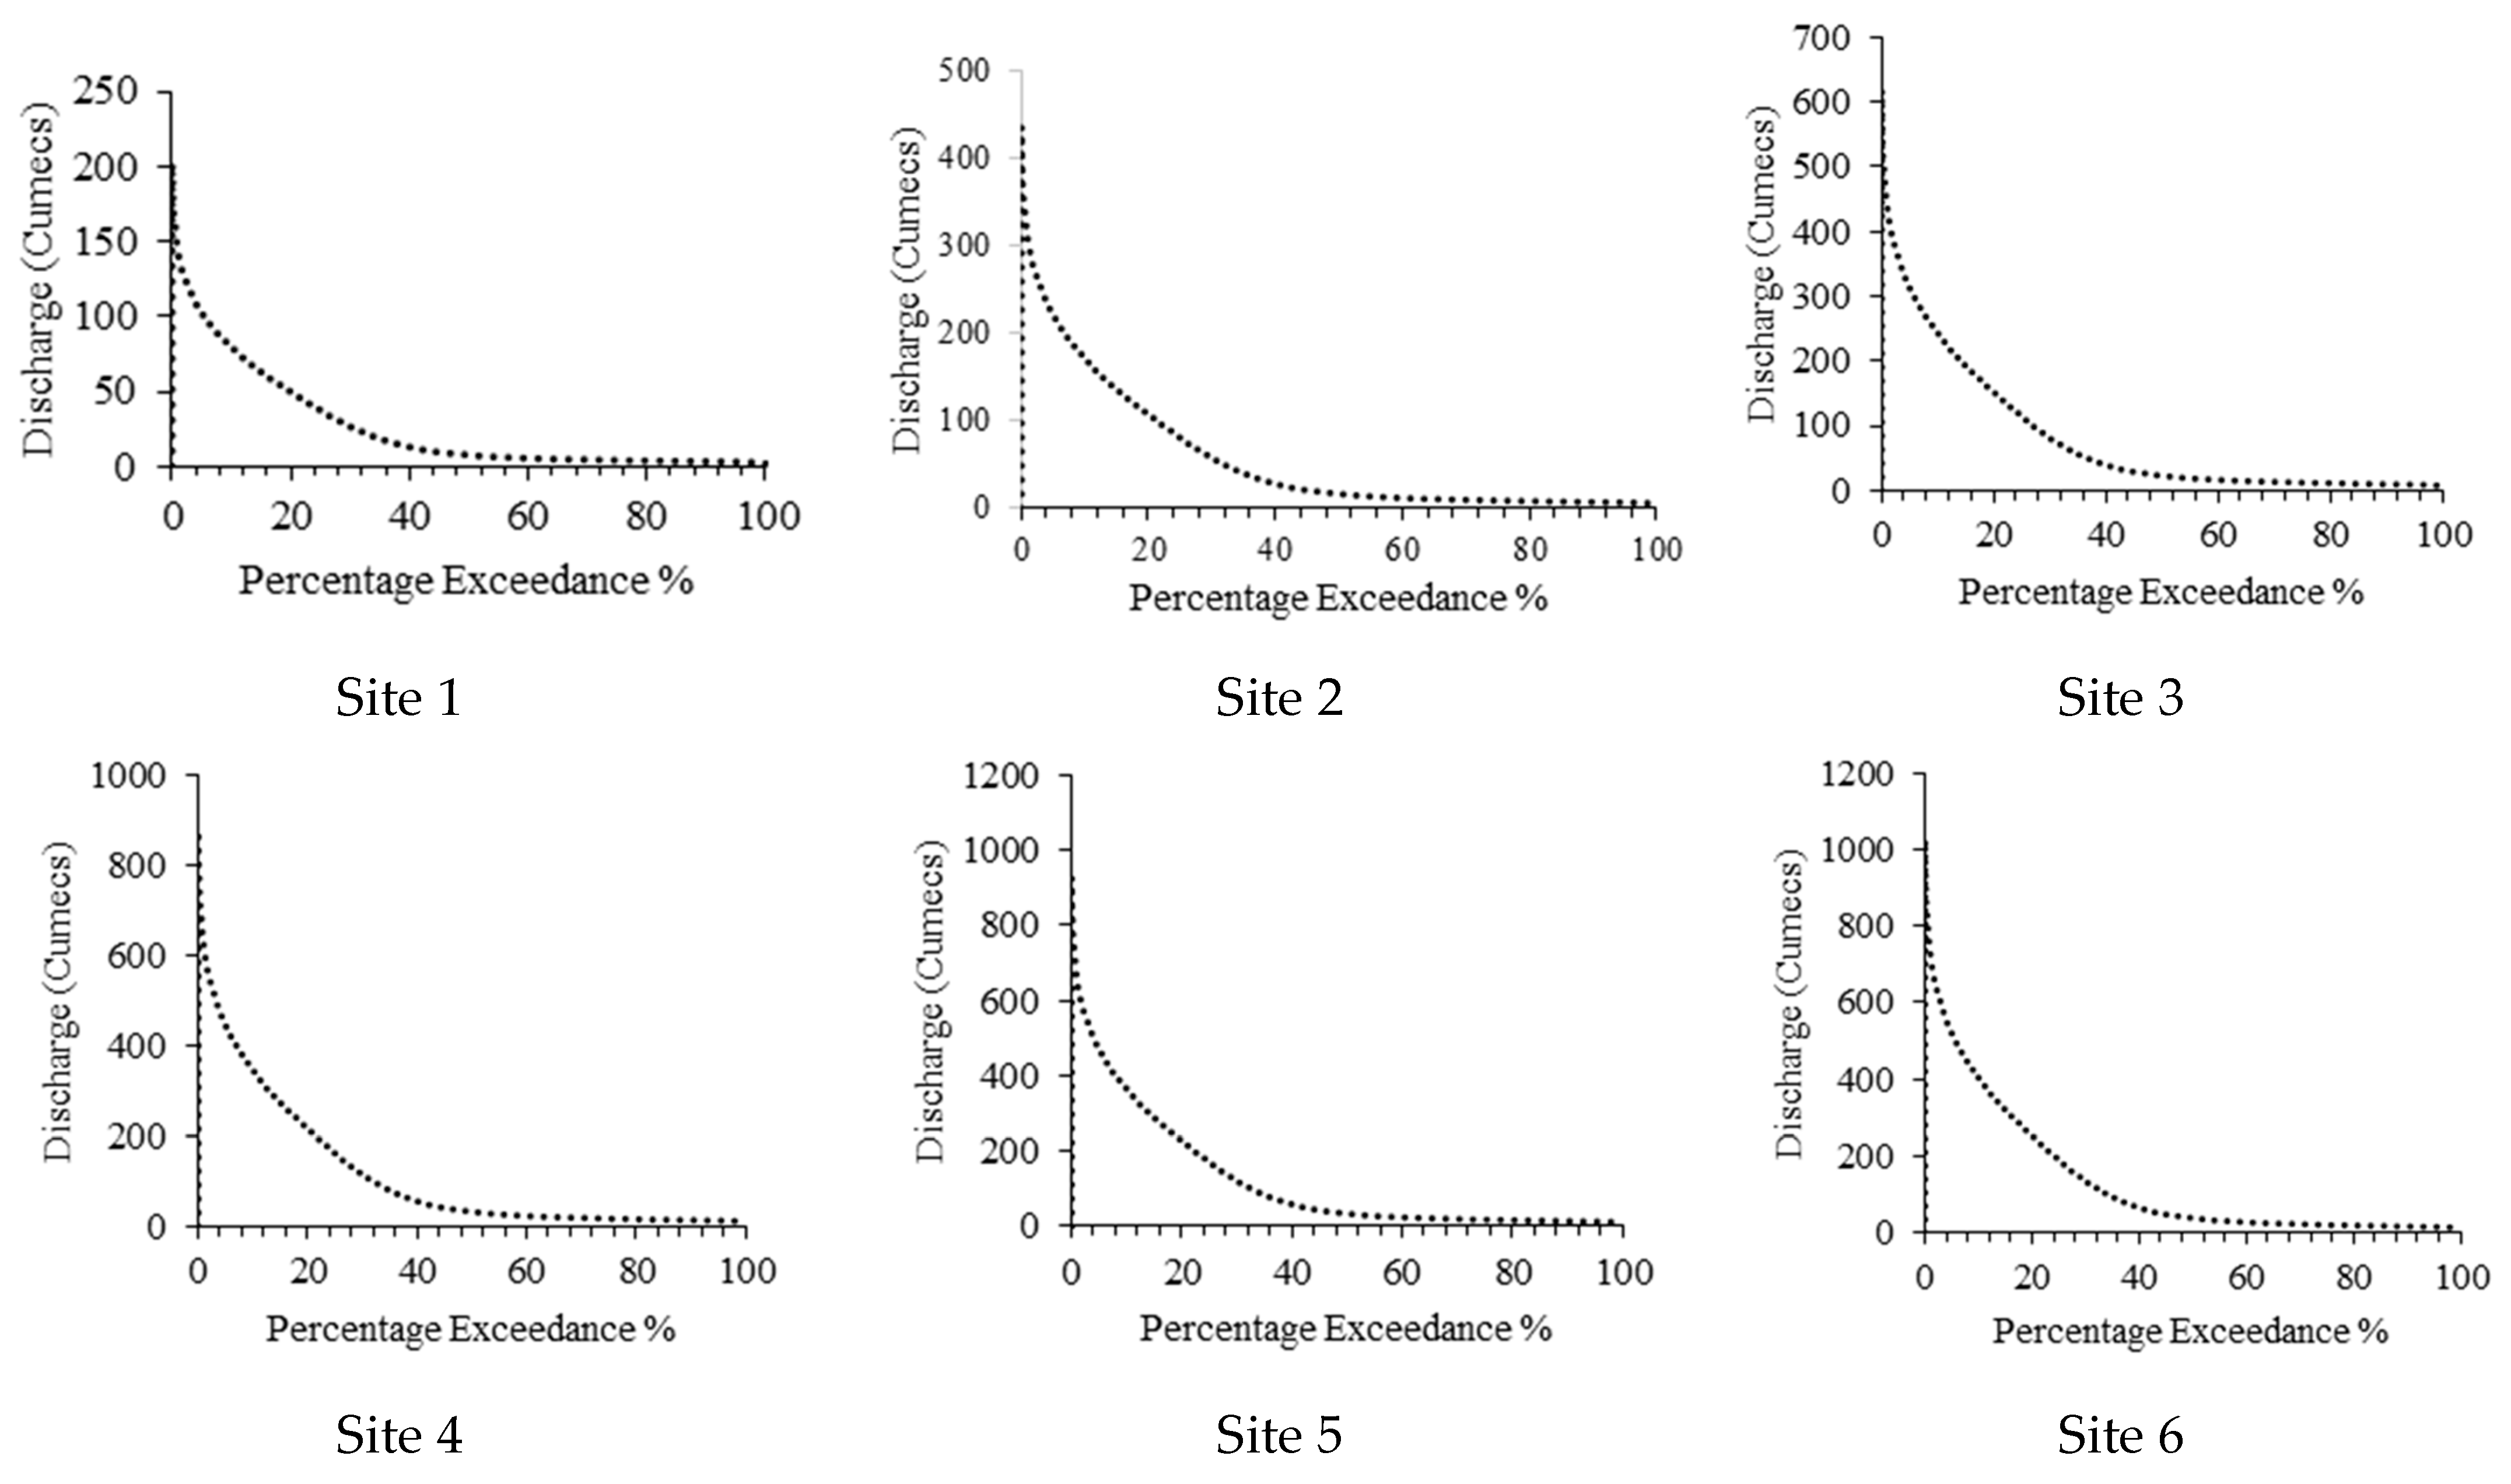
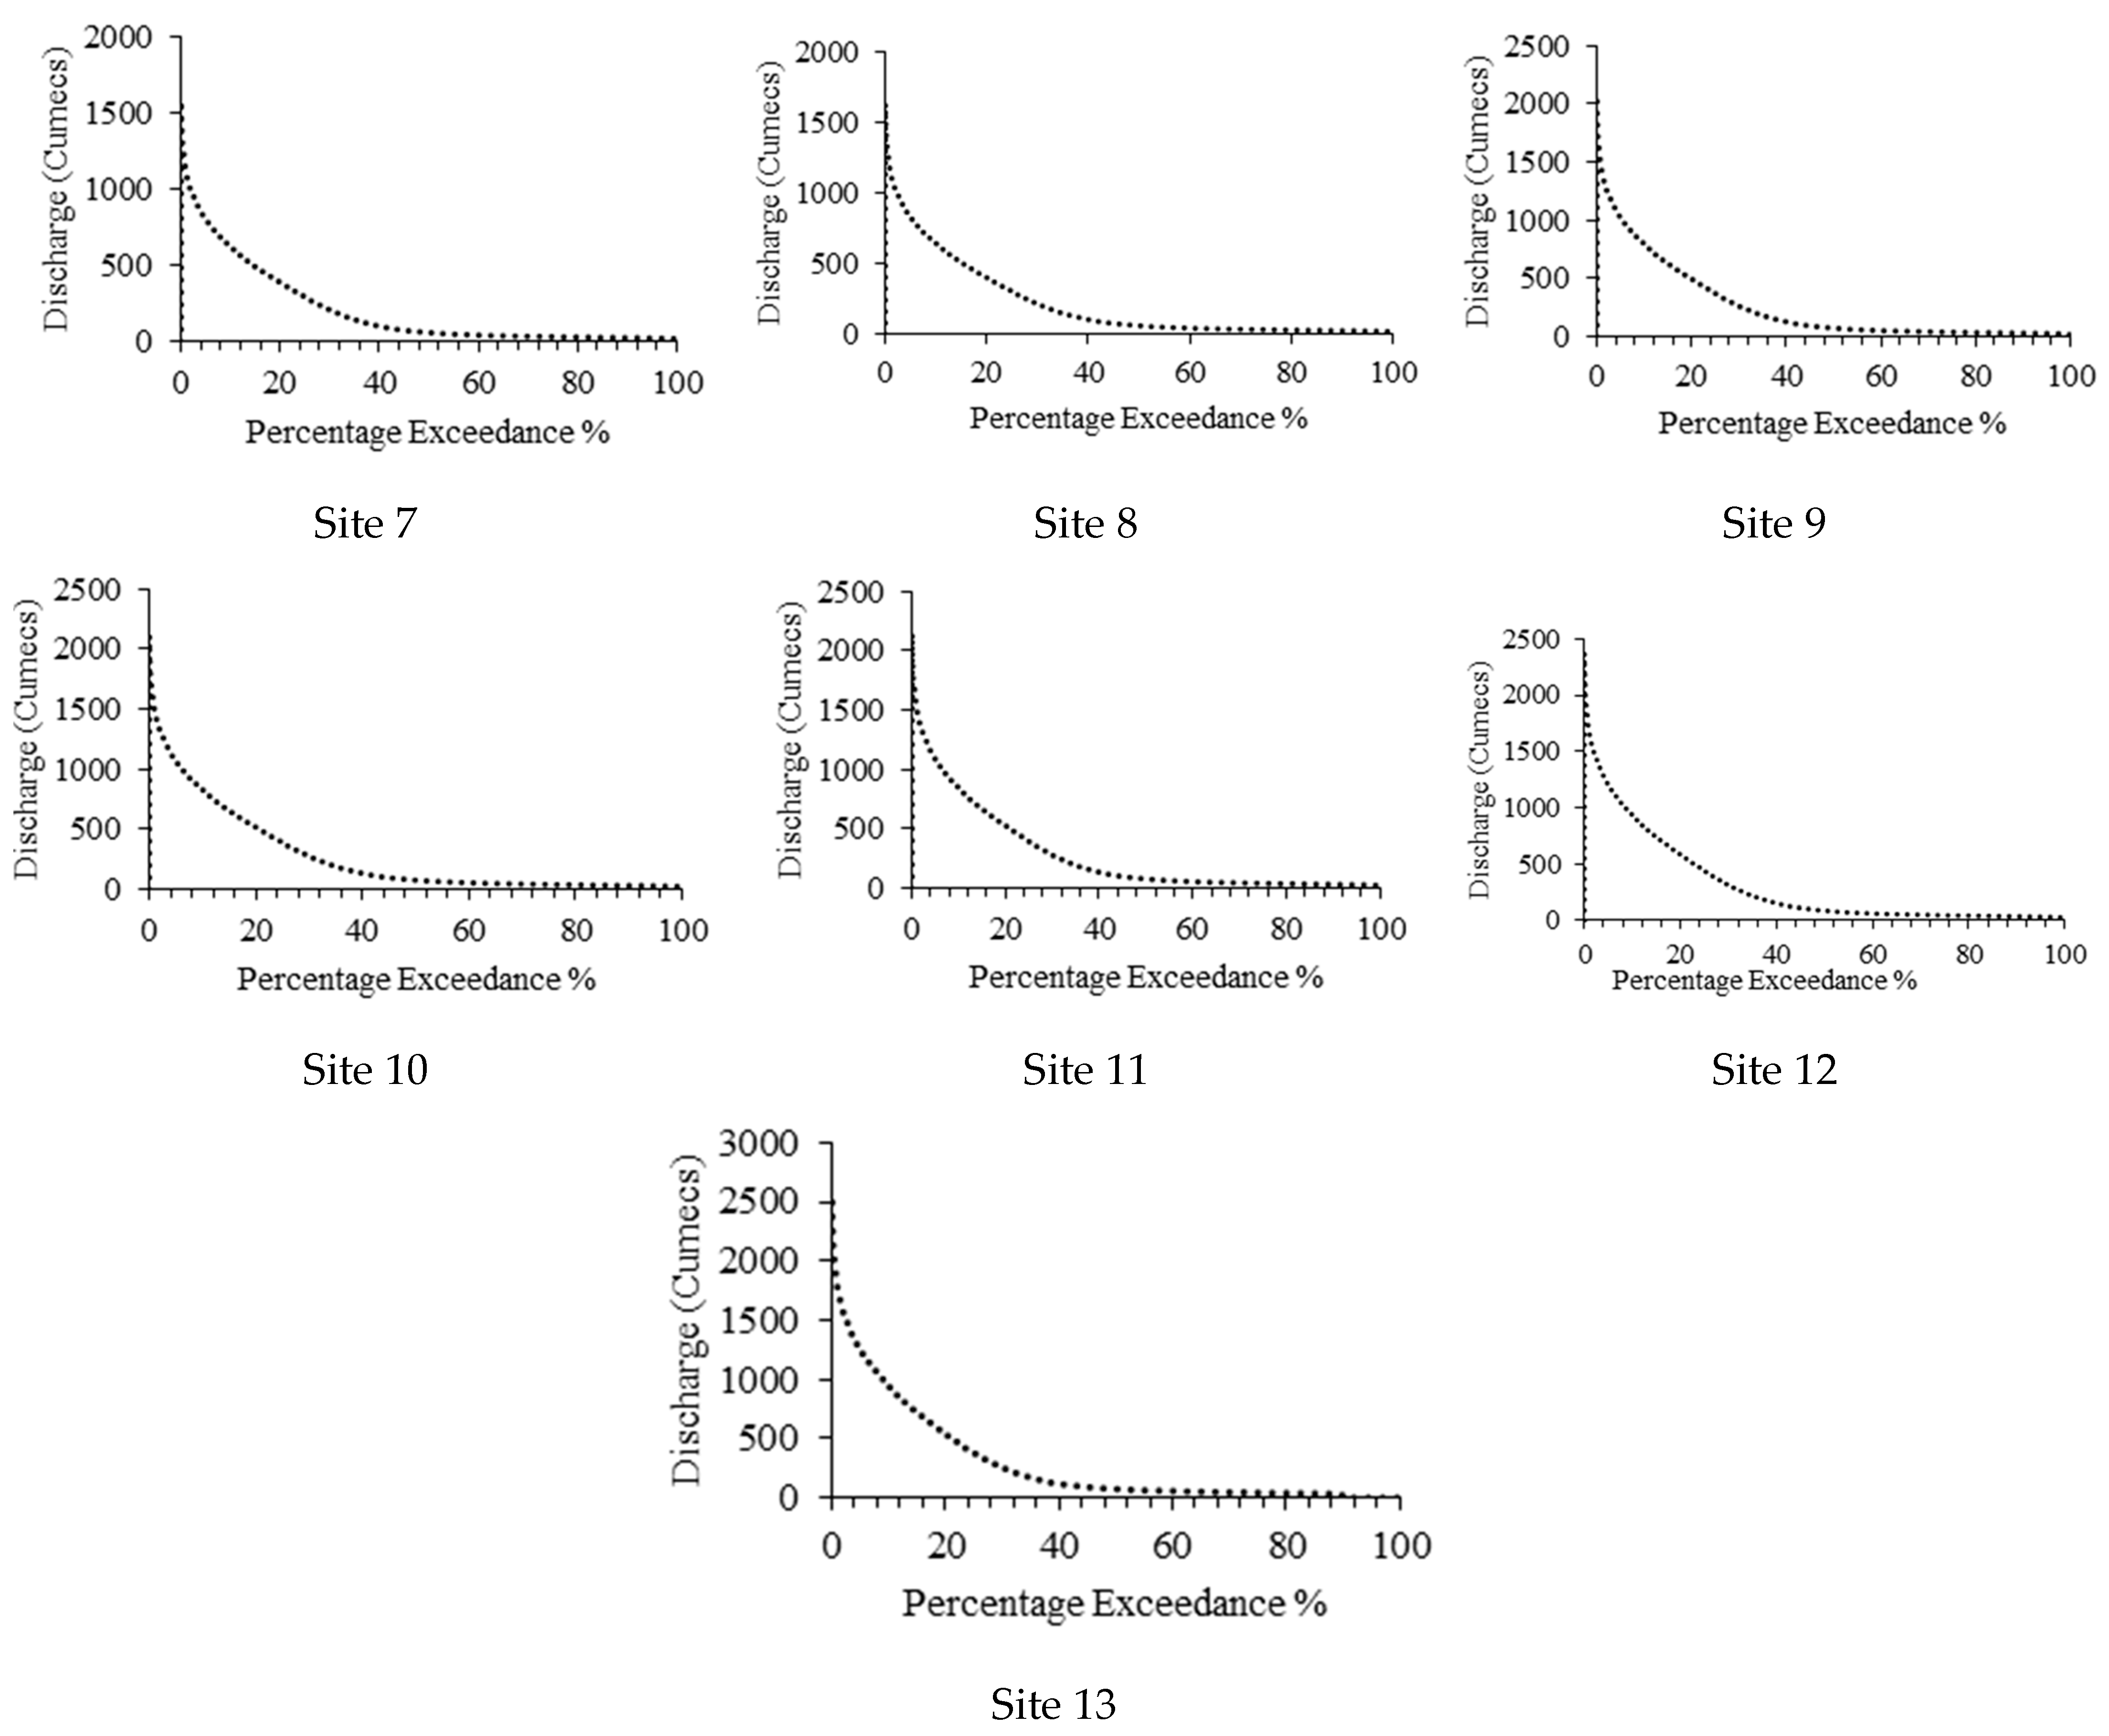
3.3. Estimation of Flow Duration Curve at Each Site

As the accumulation of flow increases from upstream to downstream, site 13 has the highest value of discharge, while site one (1) has the lowest value of discharge. Furthermore, the discharge values at each site were used to develop flow-duration curves, as shown in Figure 6.

3.4. Hydropower Potential

Calculated using Equation (6), the hydropower availability for all thirteen proposed sites is depicted in Table 4.

3.5. Selection of Suitable Sites Using MDM Method

The numerical values were assigned to constraint criteria, as shown in Table 5, based on expert opinions and field analysis. Table 5 also shows the complete decision matrix, having both location and constraint criteria in numerical form for each proposed site. This decision matrix was further normalized based on benefit and cost criteria using Equations (3) and (4).
After the decision matrix was obtained in a numerical valued form, it was normalized on the basis of the benefit and cost criteria. As shown in Table 6, for the benefit criteria, the largest value is 60.25 for site 13. Then, all values of power were divided by 60.25., i.e., for site 13, 60.25/60.25 = 1.0. Similarly, for site 1, 4.823/60.25 = 0.08005.
For the cost criteria, the smallest value is 3 in the case of the agriculture area, then for all values of this, criterion 3 was divided by all the values of the proposed sites., i.e., for site 13, agriculture area would be 3/5 = 0.6, and the least value, i.e., 3/3, would obtain a value of 1.0.
Furthermore, the relative weights were estimated based on Equation (6) as depicted in Table 7.
As indicated in Table 8, the relative weights were multiplied by each appropriate criteria for each site, and the sum of all criteria was used as the final score for the recommended sites.
Table 9 shows the final rankings of the proposed sites based on sum of all criteria weightages and Table 10 depicts the energy and plant factors for the proposed sites along with their hydropower potentials.

4. Discussion

Based on the analysis and final score in the LSA approach, proposed Site 13 (36 05′05″ N, 74 17′34″ E), Site 4 (36 37′02″ N, 74 51′10″ E), and Site 9 (36 18′28″ N, 74 39′57″ E) were concluded as the best locations among all proposed thirteen alternatives (Table 9).
Hydropower potential assessment of Hunza River basin resulted that this basin has huge potentials (Table 10) for development of hydropower. Moreover, analysis based on individual site resulted that the most suitable site, i.e., site 13 have 392.6 GWh energy potential, whereas site 4 have 159.3 and Site 9 has 117.3 GWh energy potential. On the other hand, site 5 has a comparatively high energy potential of 208.4 GWh but ranked 6 based on the MDM approach. It was mainly because of comparatively low benefit and high-cost constraints. Therefore, it was concluded that the only availability of significant favorable location criteria does not rank the site as the most suitable location, whereas other factors like constraint criteria also play a vital role in overall suitability. Hence, this study will provide an initial assessment and thorough analysis for the development of hydropower projects in the study area.

5. Conclusions

Hydropower is one of the clean, abundant, and renewable sources of energy that could help the country to meet the increasing energy demand and integrate intermittent renewables into the energy grid. Hunza River basin, situated in northern area Pakistan, was taken as the study area, and suitable hydropower locations were marked using GIS, Multi-Criteria Decision Making (MDM), and final score. Based on the location search algorithm and final scores, it is concluded that the Hunza River basin has an enormous potential for hydropower and that site 13, site 4, and site 9 could be considered as the three top probable sites among all alternatives, with potential hydropower availability estimations of 60.25 MW, 24.25 MW, and 18.01 MW, respectively.
It is important to note that the proposed methodology cannot replace fieldwork, but it can save time and give an accurate initial idea of potential sites. As a result, this study will help policymakers in the energy sector analyze current energy resources and locate areas with the potential for hydropower. Additionally, creating indices for those elements that could be used as constraint and location criteria will be necessary in the future to strengthen and improve the discriminating ability between searching spots, even in tiny regions. Therefore, results can be repeated in scenarios where sizable amounts of water and potential heads are present in Pakistan’s northern regions, including Azad Kashmir. This study could not cover the geological studies, tectonic movements, sliding and riverbed investigations in the study area. All the understudy sites were conceived with a dam and powerhouse at the toe without any headrace tunnel. Future work can be carried out covering other aspects of ascertainment.

Author Contributions

The first author, A.Q.B., performed all the calculations and prepared the graphs and tables by development of the analyses with input and guidance from D.S., M.W. and Y.D. M.A., F.u.H., A.M. and M.A.M. contributed to the discussion of results and shared the writing of the paper with the first author. Funding acquisition was conducted by D.S. and Y.D. All authors have read and agreed to the published version of the manuscript.

Funding

This research and APC was funded by international partnership of the Chinese Academy of Sciences (Grant No. 131C11KYSB20200022), and the Ministry of Science and Technology (Grant No. 2018FY100502).

Institutional Review Board Statement

Not applicable.

Informed Consent Statement

Not applicable.

Data Availability Statement

The data used to substantiate the findings of this research are accessible upon request from the corresponding author.

Acknowledgments

The authors would like to thank every person who has collaborated throughout this research work, and mainly the Water and Power Development Authority (WAPDA) Pakistan for providing the Discharge data. The complexities of this research work could not have been possible to achieve without their cooperation. The constructive contribution of WAPDA and the careful review and sincere suggestions by the anonymous referees are gratefully acknowledged. The authors would also like to thank Haseeb Akbar, Muhammad Kaleem Sarwar and Abid Sheikh (WAPDA) for their help and guidance in completion of the research.

Conflicts of Interest

The authors declare no conflict of interest.

References

  1. Bartle, A. Hydropower potential and development activities. Energy Policy 2002, 30, 1231–1239. [Google Scholar] [CrossRef]
  2. World Energy Council, World Energy Resources Hydropower. 2016. Available online: https://www.worldenergy.org/assets/images/imported/2016/10/World-Energy-Resources-Full-report-2016.10.03.pdf (accessed on 1 May 2023).
  3. UNCC. How Hydropower Can Help Climate Action. 2018. Available online: https://unfccc.int/news/how-hydropower-can-help-climate-action (accessed on 1 May 2023).
  4. Tahir, A.A.; Chevallier, P.; Arnaud, Y.; Neppel, L.; Ahmad, B. Modeling snowmelt-runoff under climate scenarios in the Hunza River basin, Karakoram Range, Northern Pakistan. J. Hydrol. 2011, 409, 104–117. [Google Scholar] [CrossRef]
  5. Mirjat, N.H.; Uqaili, M.A.; Harijan, K.; Das Valasai, G.; Shaikh, F.; Waris, M. A review of energy and power planning and policies of Pakistan. Renew. Sustain. Energy Rev. 2017, 79, 110–127. [Google Scholar] [CrossRef] [Green Version]
  6. Siddiqi, A.; Wescoat, J.L.; Humair, S.; Afridi, K. An empirical analysis of the hydropower portfolio in Pakistan. Energy Policy 2012, 50, 228–241. [Google Scholar] [CrossRef]
  7. Dudhani, S.; Sinha, A.; Inamdar, S. Assessment of small hydropower potential using remote sensing data for sustainable development in India. Energy Policy 2006, 34, 3195–3205. [Google Scholar] [CrossRef]
  8. Rojanamon, P.; Chaisomphob, T.; Bureekul, T. Application of geographical information system to site selection of small run-of-river hydropower project by considering engineering/economic/environmental criteria and social impact. Renew. Sustain. Energy Rev. 2009, 13, 2336–2348. [Google Scholar] [CrossRef]
  9. Kusre, B.; Baruah, D.; Bordoloi, P.; Patra, S. Assessment of hydropower potential using GIS and hydrological modeling technique in Kopili River basin in Assam (India). Appl. Energy 2010, 87, 298–309. [Google Scholar] [CrossRef]
  10. Larentis, D.G.; Collischonn, W.; Olivera, F.; Tucci, C.E. Gis-based procedures for hydropower potential spotting. Energy 2010, 35, 4237–4243. [Google Scholar] [CrossRef]
  11. Yi, C.-S.; Lee, J.-H.; Shim, M.-P. Site location analysis for small hydropower using geo-spatial information system. Renew. Energy 2010, 35, 852–861. [Google Scholar] [CrossRef]
  12. Cuya, D.G.P.; Brandimarte, L.; Popescu, I.; Alterach, J.; Peviani, M. A GIS-based assessment of maximum potential hydropower production in La Plata basin under global changes. Renew. Energy 2013, 50, 103–114. [Google Scholar] [CrossRef]
  13. Akbar, H.; Gheewala, S.H. Impact of Climate and Land Use Changes on flowrate in the Kunhar River Basin, Pakistan, for the Period (1992–2014). Arab. J. Geosci. 2021, 14, 707. [Google Scholar] [CrossRef]
  14. Alashan, S.; Şen, Z.; Toprak, Z.F. Hydroelectric Energy Potential of Turkey: A Refined Calculation Method. Arab. J. Sci. Eng. 2016, 41, 1511–1520. [Google Scholar] [CrossRef]
  15. Zaidi, A.Z.; Khan, M. Identifying high potential locations for run-of-the-river hydroelectric power plants using GIS and digital elevation models. Renew. Sustain. Energy Rev. 2018, 89, 106–116. [Google Scholar] [CrossRef]
  16. Bayazıt, Y.; Bakış, R.; Koç, C. An investigation of small-scale hydropower plants using the geographic information system. Renew. Sustain. Energy Rev. 2017, 67, 289–294. [Google Scholar] [CrossRef]
  17. Belmonte, S.; Núñez, V.; Viramonte, J.; Franco, J. Potential renewable energy resources of the Lerma Valley, Salta, Argentina for its strategic territorial planning. Renew. Sustain. Energy Rev. 2009, 13, 1475–1484. [Google Scholar] [CrossRef]
  18. Punys, P.; Dumbrauskas, A.; Kvaraciejus, A.; Vyciene, G. Tools for Small Hydropower Plant Resource Planning and Development: A Review of Technology and Applications. Energies 2011, 4, 1258–1277. [Google Scholar] [CrossRef] [Green Version]
  19. Tecle, A.; Fogel, M.; Duckstein, L. Multicriterion Selection of Wastewater Management Alternatives. J. Water Resour. Plan. Manag. 1988, 114, 383–398. [Google Scholar] [CrossRef]
  20. Weng, S.; Huang, G.; Li, Y. An integrated scenario-based multi-criteria decision support system for water resources management and planning—A case study in the Haihe River Basin. Expert Syst. Appl. 2010, 37, 8242–8254. [Google Scholar] [CrossRef]
  21. Atieh, M.; Gharabaghi, B.; Rudra, R. Entropy-based neural networks model for flow duration curves at ungauged sites. J. Hydrol. 2015, 529, 1007–1020. [Google Scholar] [CrossRef]
  22. Gazendam, E.; Gharabaghi, B.; McBean, E.; Whiteley, H.; Kostaschuk, R. Ranking of Waterways Susceptible to Adverse Stormwater Effects. Can. Water Resour. J. 2009, 34, 205–228. [Google Scholar] [CrossRef]
  23. Kodikara, P.; Perera, B.; Kularathna, M. Stakeholder preference elicitation and modelling in multi-criteria decision analysis—A case study on urban water supply. Eur. J. Oper. Res. 2010, 206, 209–220. [Google Scholar] [CrossRef]
  24. Noori, A.; Bonakdari, H.; Morovati, K.; Gharabaghi, B. The optimal dam site selection using a group decision-making method through fuzzy TOPSIS model. Environ. Syst. Decis. 2018, 38, 471–488. [Google Scholar] [CrossRef]
  25. Lai, V.; Huang, Y.F.; Koo, C.H.; Ahmed, A.N.; El-Shafie, A. A Review of Reservoir Operation Optimisations: From Traditional Models to Metaheuristic Algorithms. Arch. Comput. Methods Eng. 2022, 29, 3435–3457. [Google Scholar] [CrossRef] [PubMed]
  26. Sustainable Development Goals. 2022. Available online: https://www.un.org/sustainabledevelopment/energy/ (accessed on 1 May 2023).
  27. Jasso, A.T. Evaluation of Small Hydro Power Potential in Three River Basins of Mexico; Mexican Institute of Water Technology (IMTA): Jiutepec, Mexico, 2009; pp. 1–14. [Google Scholar]
  28. Wali, U.G. Estimating Hydropower Potential of an Ungauged Stream. Int. J. Emerg. Technol. Adv. Eng. 2013, 3, 592–600. [Google Scholar]
  29. Ajmal, M.; Kim, T.-W.; Ahn, J.-H. Stability assessment of the curve number methodology used to estimate excess rainfall in forest-dominated watersheds. Arab. J. Geosci. 2016, 9, 402. [Google Scholar] [CrossRef]
  30. Soulis, K.X.; Valiantzas, J.D.; Dercas, N.; Londra, P.A. Investigation of the direct runoff generation mechanism for the analysis of the SCS-CN method applicability to a partial area experimental watershed. Hydrol. Earth Syst. Sci. 2009, 13, 605–615. [Google Scholar] [CrossRef] [Green Version]
  31. Soulis, K.X.; Valiantzas, J.D. SCS-CN parameter determination using rainfall-runoff data in heterogeneous watersheds—The two-CN system approach. Hydrol. Earth Syst. Sci. 2012, 16, 1001–1015. [Google Scholar] [CrossRef] [Green Version]
  32. Gianfagna, C.C.; Johnson, C.E.; Chandler, D.G.; Hofmann, C. Watershed area ratio accurately predicts daily streamflow in nested catchments in the Catskills, New York. J. Hydrol. Reg. Stud. 2015, 4, 583–594. [Google Scholar] [CrossRef] [Green Version]
  33. Ergen, K.; Kentel, E. An integrated map correlation method and multiple-source sites drainage-area ratio method for estimating streamflows at ungauged catchments: A case study of the Western Black Sea Region, Turkey. J. Environ. Manag. 2016, 166, 309–320. [Google Scholar] [CrossRef]
  34. Farmer, W.H.; Vogel, R.M. Performance-weighted methods for estimating monthly streamflow at ungauged sites. J. Hydrol. 2013, 477, 240–250. [Google Scholar] [CrossRef]
  35. Shu, C.; Ouarda, T.B.M.J. Improved methods for daily streamflow estimates at ungauged sites. Water Resour. Res. 2012, 48, 1–15. [Google Scholar] [CrossRef] [Green Version]
  36. Roszkowska, E.; Białymstoku, U.W. Rank Ordering Criteria Weighting Methods—A Comparative Overview. Optimum. Econ. Stud. 2013, 5, 14–33. [Google Scholar] [CrossRef]
  37. Khan, M.; Zaidi, A.Z. Run-of-River Hydropower Potential of Kunhar River, Pakistan. Pak. J. Meteorol. 2015, 12, 25–32. [Google Scholar]
  38. Cai, X.; Ye, F.; Gholinia, F. Application of artificial neural network and Soil and Water Assessment Tools in evaluating power generation of small hydropower stations. Energy Rep. 2020, 6, 2106–2118. [Google Scholar] [CrossRef]
Figure 1. Flow chart of the adopted methodology.
Water 15 02929 g001
Figure 2. Study Area, i.e., Hunza River Basin.
Water 15 02929 g002
Figure 3. Proposed Alternatives/Sites in Hunza River Basin.
Water 15 02929 g003
Figure 4. The derived elevation profile of the Hunza river.
Water 15 02929 g004
Figure 5. Watershed delineation of Hunza River at all 13 proposed alternatives.
Water 15 02929 g005aWater 15 02929 g005bWater 15 02929 g005cWater 15 02929 g005d
Figure 6. Flow-duration curves for discharges at all 13 proposed alternatives/sites.
Water 15 02929 g006aWater 15 02929 g006b
Table 1. Criteria for selection of best alternative.
CriterionLocation CriteriaConstraint Criteria
(Power)(Environmental)
DefinitionHeadDischargeSite
Access
Agriculture AreaResidential AreaInteraction with other HPP *
Benefit or Cost aspectBenefitBenefitBenefitCostCostCost
Note(s): * HPP = Hydropower Project.
Table 2. Values have been arbitrarily assigned to the constraint criteria. (Benefit criteria and cost criteria).
Benefit CriteriaValuesCost Criteria
00
Very Low01Very High
Low03High
Average05Average
High07Low
Very High09Very Low
10
Table 3. Sites/alternatives in Hunza River basin along with their heads.
Site No.12345678910111213
Head
(m)
80.7975.2338.4194.5117.080.4846.340.9130.1821.029.8028.081.70
Table 4. Hydropower availability for all thirteen proposed sites.
Site No.Q50 (Cumecs)H (meters)g (m/s2)ηDensity (kg/m3)P (MW)
17.51280.799.810.81100004.82
216.21075.239.810.81100009.69
322.96738.419.810.81100007.01
432.56694.509.810.81100024.45
534.409117.09.810.81100031.99
638.12480.489.810.81100024.38
758.68746.349.810.81100021.61
860.6480.919.810.8110000.44
975.09130.189.810.81100018.00
1078.38321.09.810.81100013.08
1179.80429.809.810.81100018.90
1288.07928.09.810.81100019.60
1392.80581.709.810.81100060.25
Table 5. Decision matrix with numerical values assigned to intangible criteria (Cost-wise and benefit-wise).
Site
No.
Power (MW)Site
Access
Agriculture
Area
Residential
Area
Interaction
with Other HPP
104.825999
209.697999
307.015999
424.457339
531.997999
624.387999
721.615539
80.447539
918.007339
1013.087339
1118.905559
1219.607539
1360.257539
Table 6. Normalized decision matrix after using the numerical scale on intangible criteria (benefit and cost wise).
Site No.Power (MW)Site AccessAgriculture AreaResidential AreaInteraction with Other HPP
10.0801.00.330.331.0
20.1611.00.330.331.0
30.1161.00.330.331.0
40.4061.01.01.01.0
50.5311.00.330.331.0
60.4051.00.330.331.0
70.3591.00.601.01.0
80.0071.00.601.01.0
90.2991.01.01.01.0
100.2171.01.01.01.0
110.3141.00.600.601.0
120.3251.00.601.01.0
131.01.00.601.01.0
Table 7. Relative weights of all criteria by their preferences.
CriterionPreferenceRelative
Weight
Power10.333
Site Access20.267
Agriculture Area30.200
Residential Area40.133
Interaction with other HPP50.067
Table 8. Weighted decision matrix (normalized decision matrix * relative weights).
Site No.Results Obtained by Multiplying Criteria with Relative WeightsSum of All Criteria Weightage
PowerSite AccessAgriculture AreaResidential AreaInteraction with Other HPP
10.01730.26670.06670.04440.06670.4618
20.03480.26670.06670.04440.06670.4793
30.02510.26670.06670.04440.06670.4696
40.08770.26670.200.13330.06670.7544
50.11480.26670.06670.04440.06670.5593
60.08750.26670.06670.04440.06670.5319
70.07750.26670.1200.13330.06670.6642
80.00160.26670.1200.13330.06670.5883
90.06460.26670.200.13330.06670.7313
100.04690.26670.200.13330.06670.7136
110.06780.26670.1200.07990.06670.6012
120.07030.26670.1200.13330.06670.6570
130.21620.26670.1200.13330.06670.8029
Table 9. Ranking of each proposed site based on the final score.
Site No.LongitudeLatitudeSum of All Criteria Weightage
(from Table 8)
Final Rankings
174.95 E36.79 N0.461813
274.82 E36.74 N0.479311
374.81 E36.69 N0.469612
474.85 E36.61 N0.75442
574.86 E36.52 N0.55939
674.87 E36.51 N0.531910
774.90 E36.46 N0.66425
874.86 E36.37 N0.58838
974.66 E36.30 N0.73133
1074.61 E36.28 N0.71364
1174.35 E36.25 N0.60127
1274.35 E36.25 N0.65706
1374.29 E36.08 N0.80291
Table 10. Hydropower potential of the proposed sites in Hunza River basin.
Site No.12345678910111213
Power (MW)4.829.697.0124.4531.9924.3821.610.4418.0013.0818.9019.6060.25
Energy (GWh)31.4163.1345.66159.3208.4158.9140.802.85117.385.22123.1127.7392.6
Plant factor (%)74.3974.3774.3974.3974.3974.3974.3974.3974.3974.3974.3974.3974.39
Disclaimer/Publisher’s Note: The statements, opinions and data contained in all publications are solely those of the individual author(s) and contributor(s) and not of MDPI and/or the editor(s). MDPI and/or the editor(s) disclaim responsibility for any injury to people or property resulting from any ideas, methods, instructions or products referred to in the content.

