
Rapid Urbanization Has Changed the Driving Factors of Groundwater Chemical Evolution in the Large Groundwater Depression Funnel Area of Northern China

Abstract
:1. Introduction
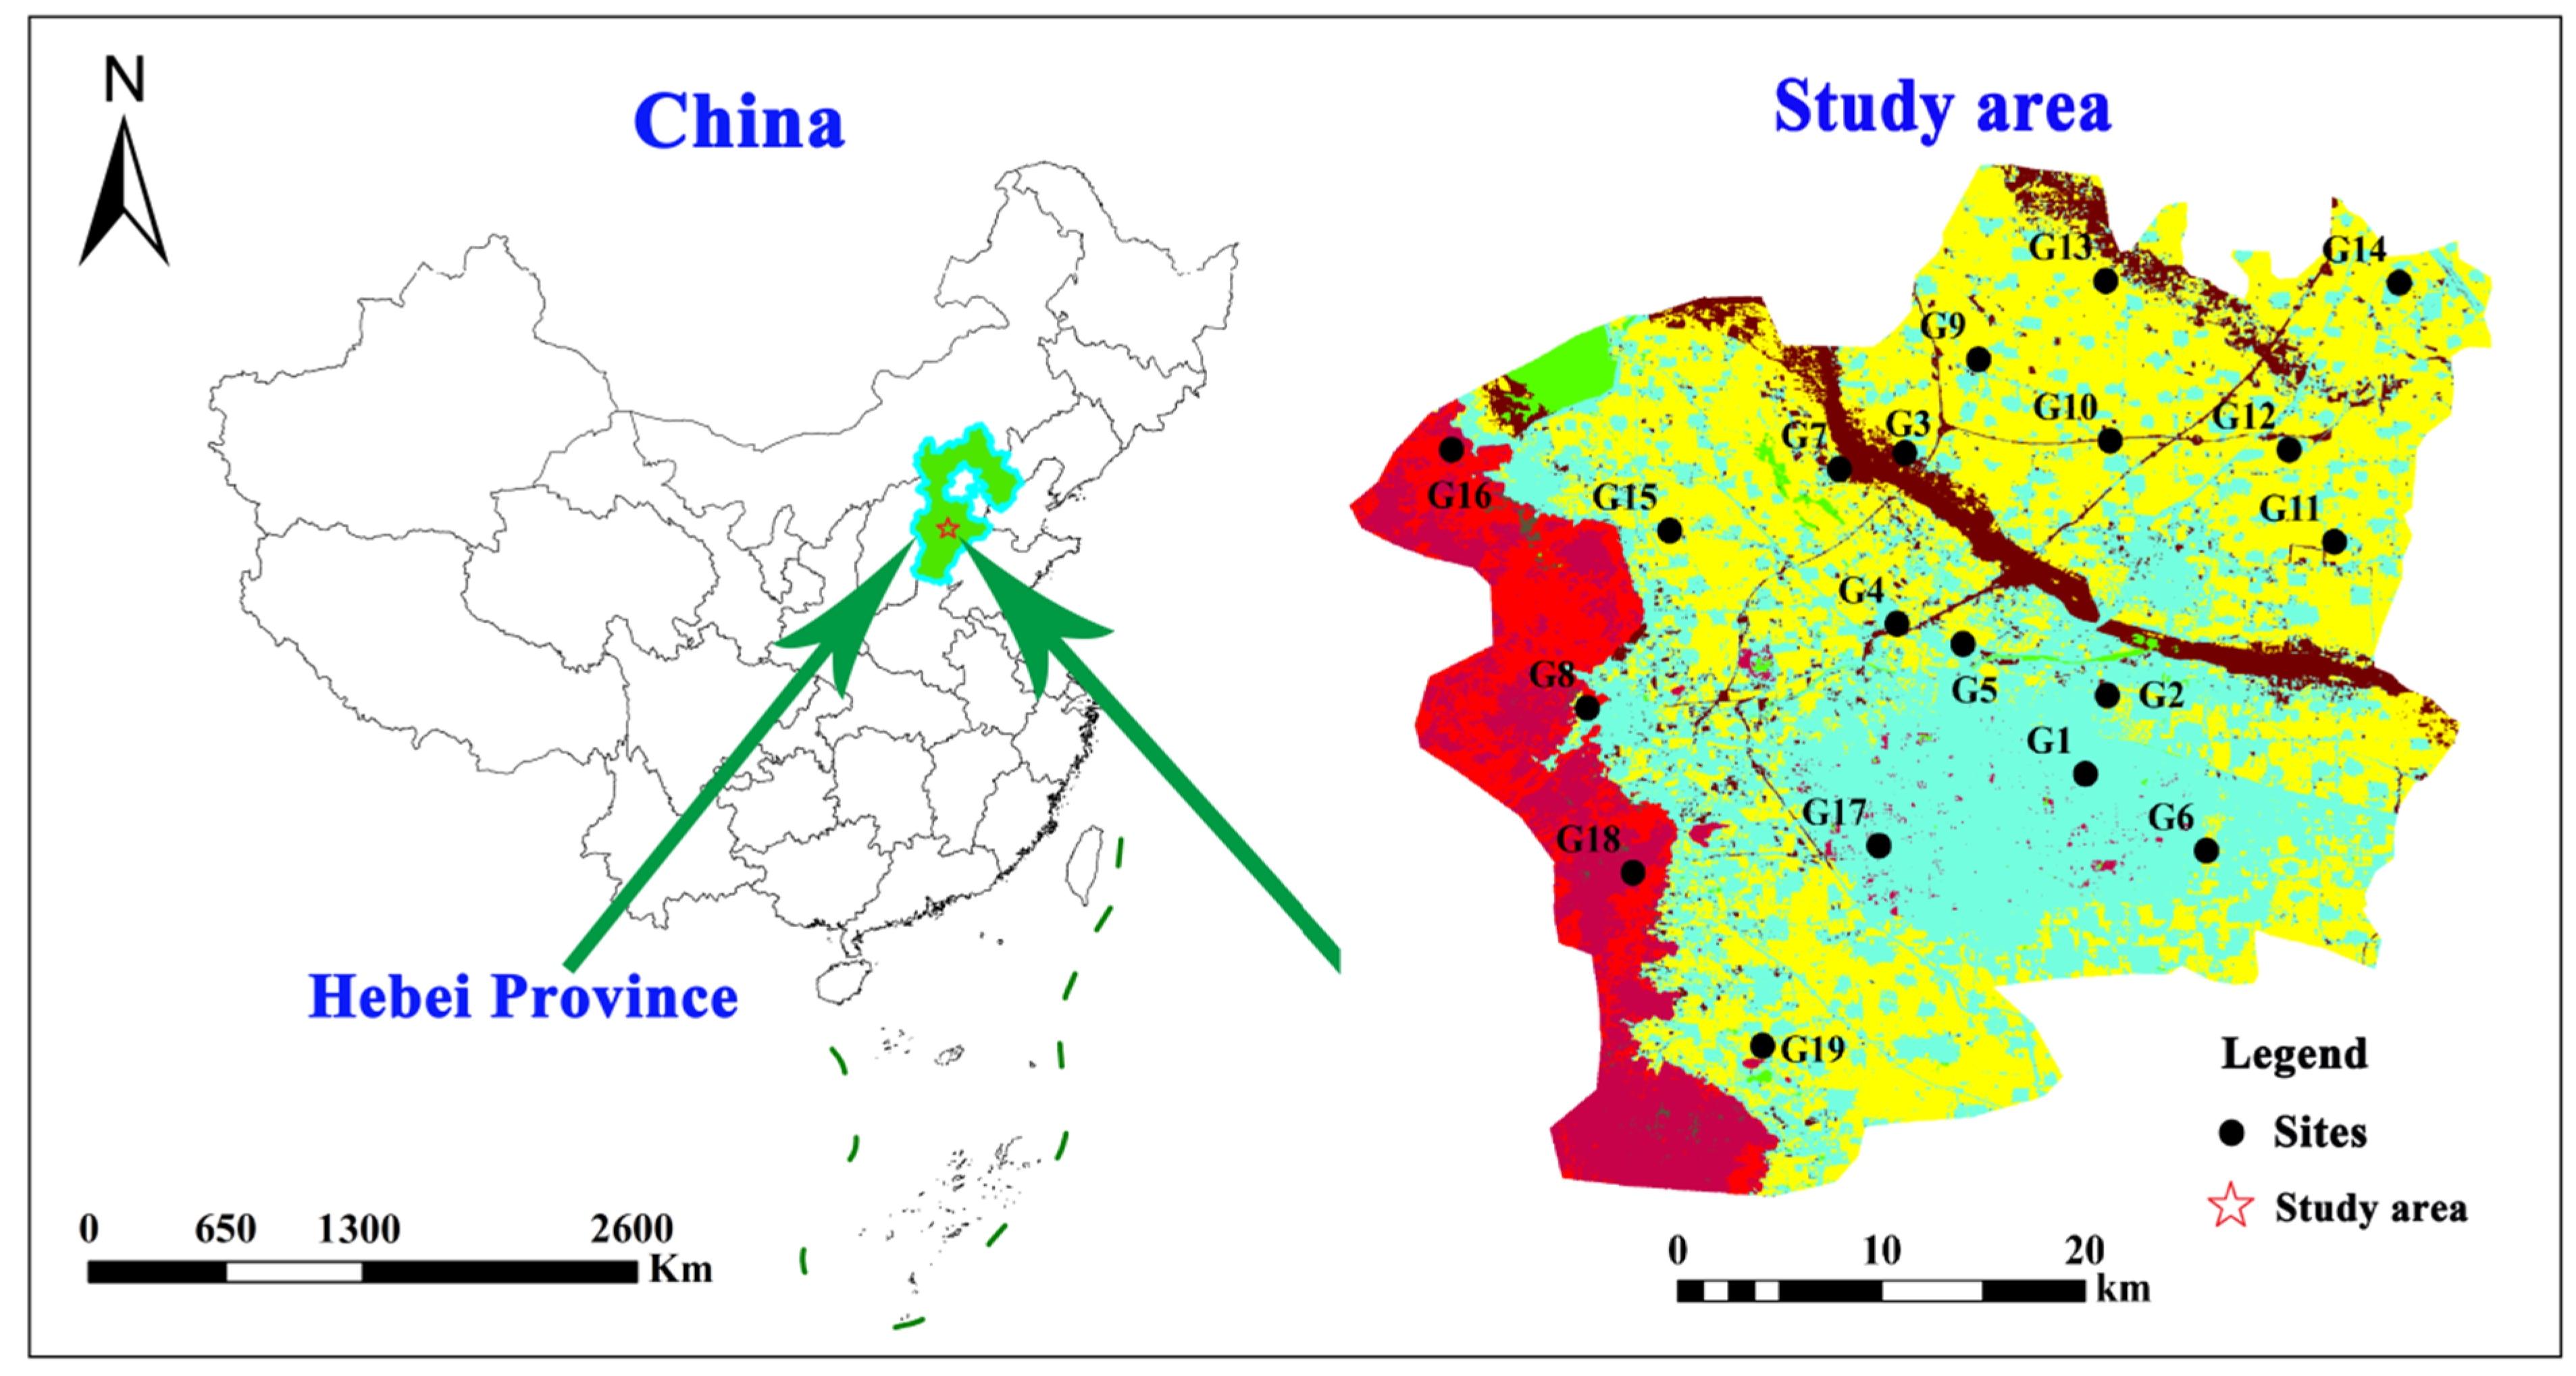
2. Study Area
2.1. General Setting
2.2. Geological and Hydrogeological Conditions
3. Materials and Methods
3.1. Data Sources
3.2. Data Analysis
4. Results and Discussion
4.1. Analysis of Groundwater Chemical Composition Characteristics
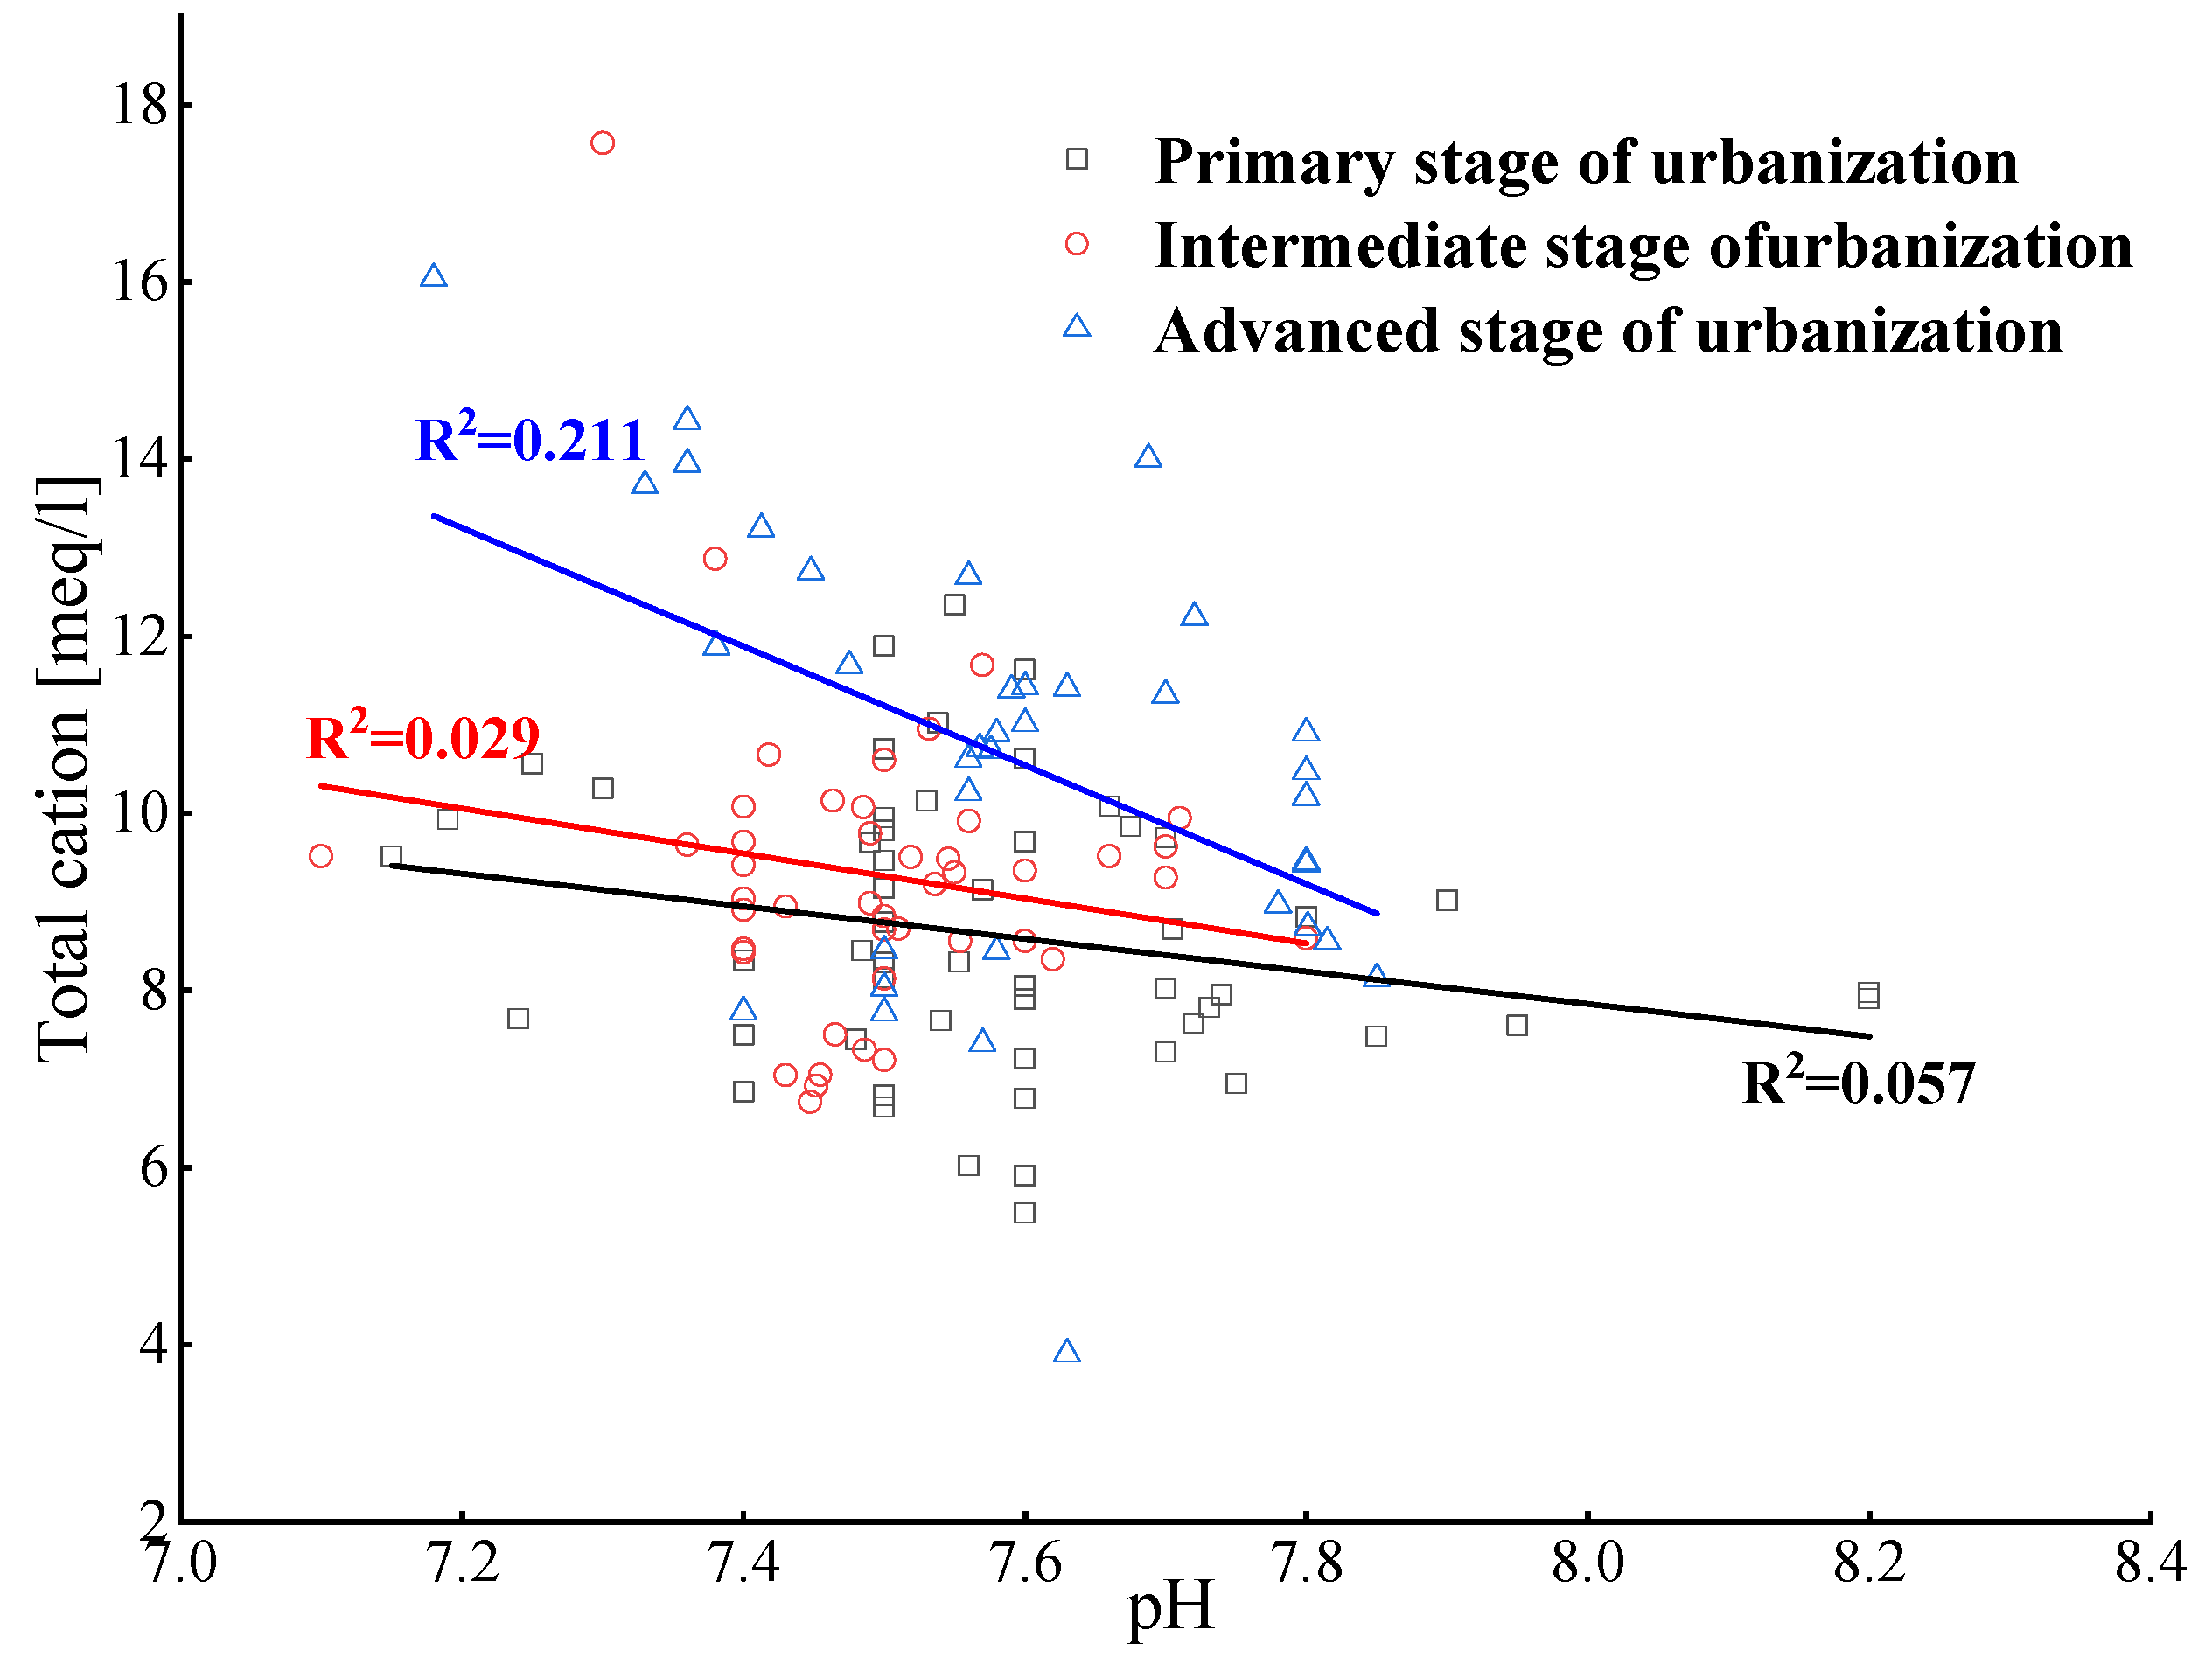
4.1.1. pH
4.1.2. Ion Characteristics Analysis
4.2. Hydrochemical Type Analysis
4.3. Factors Driving Hydrochemical Evolution
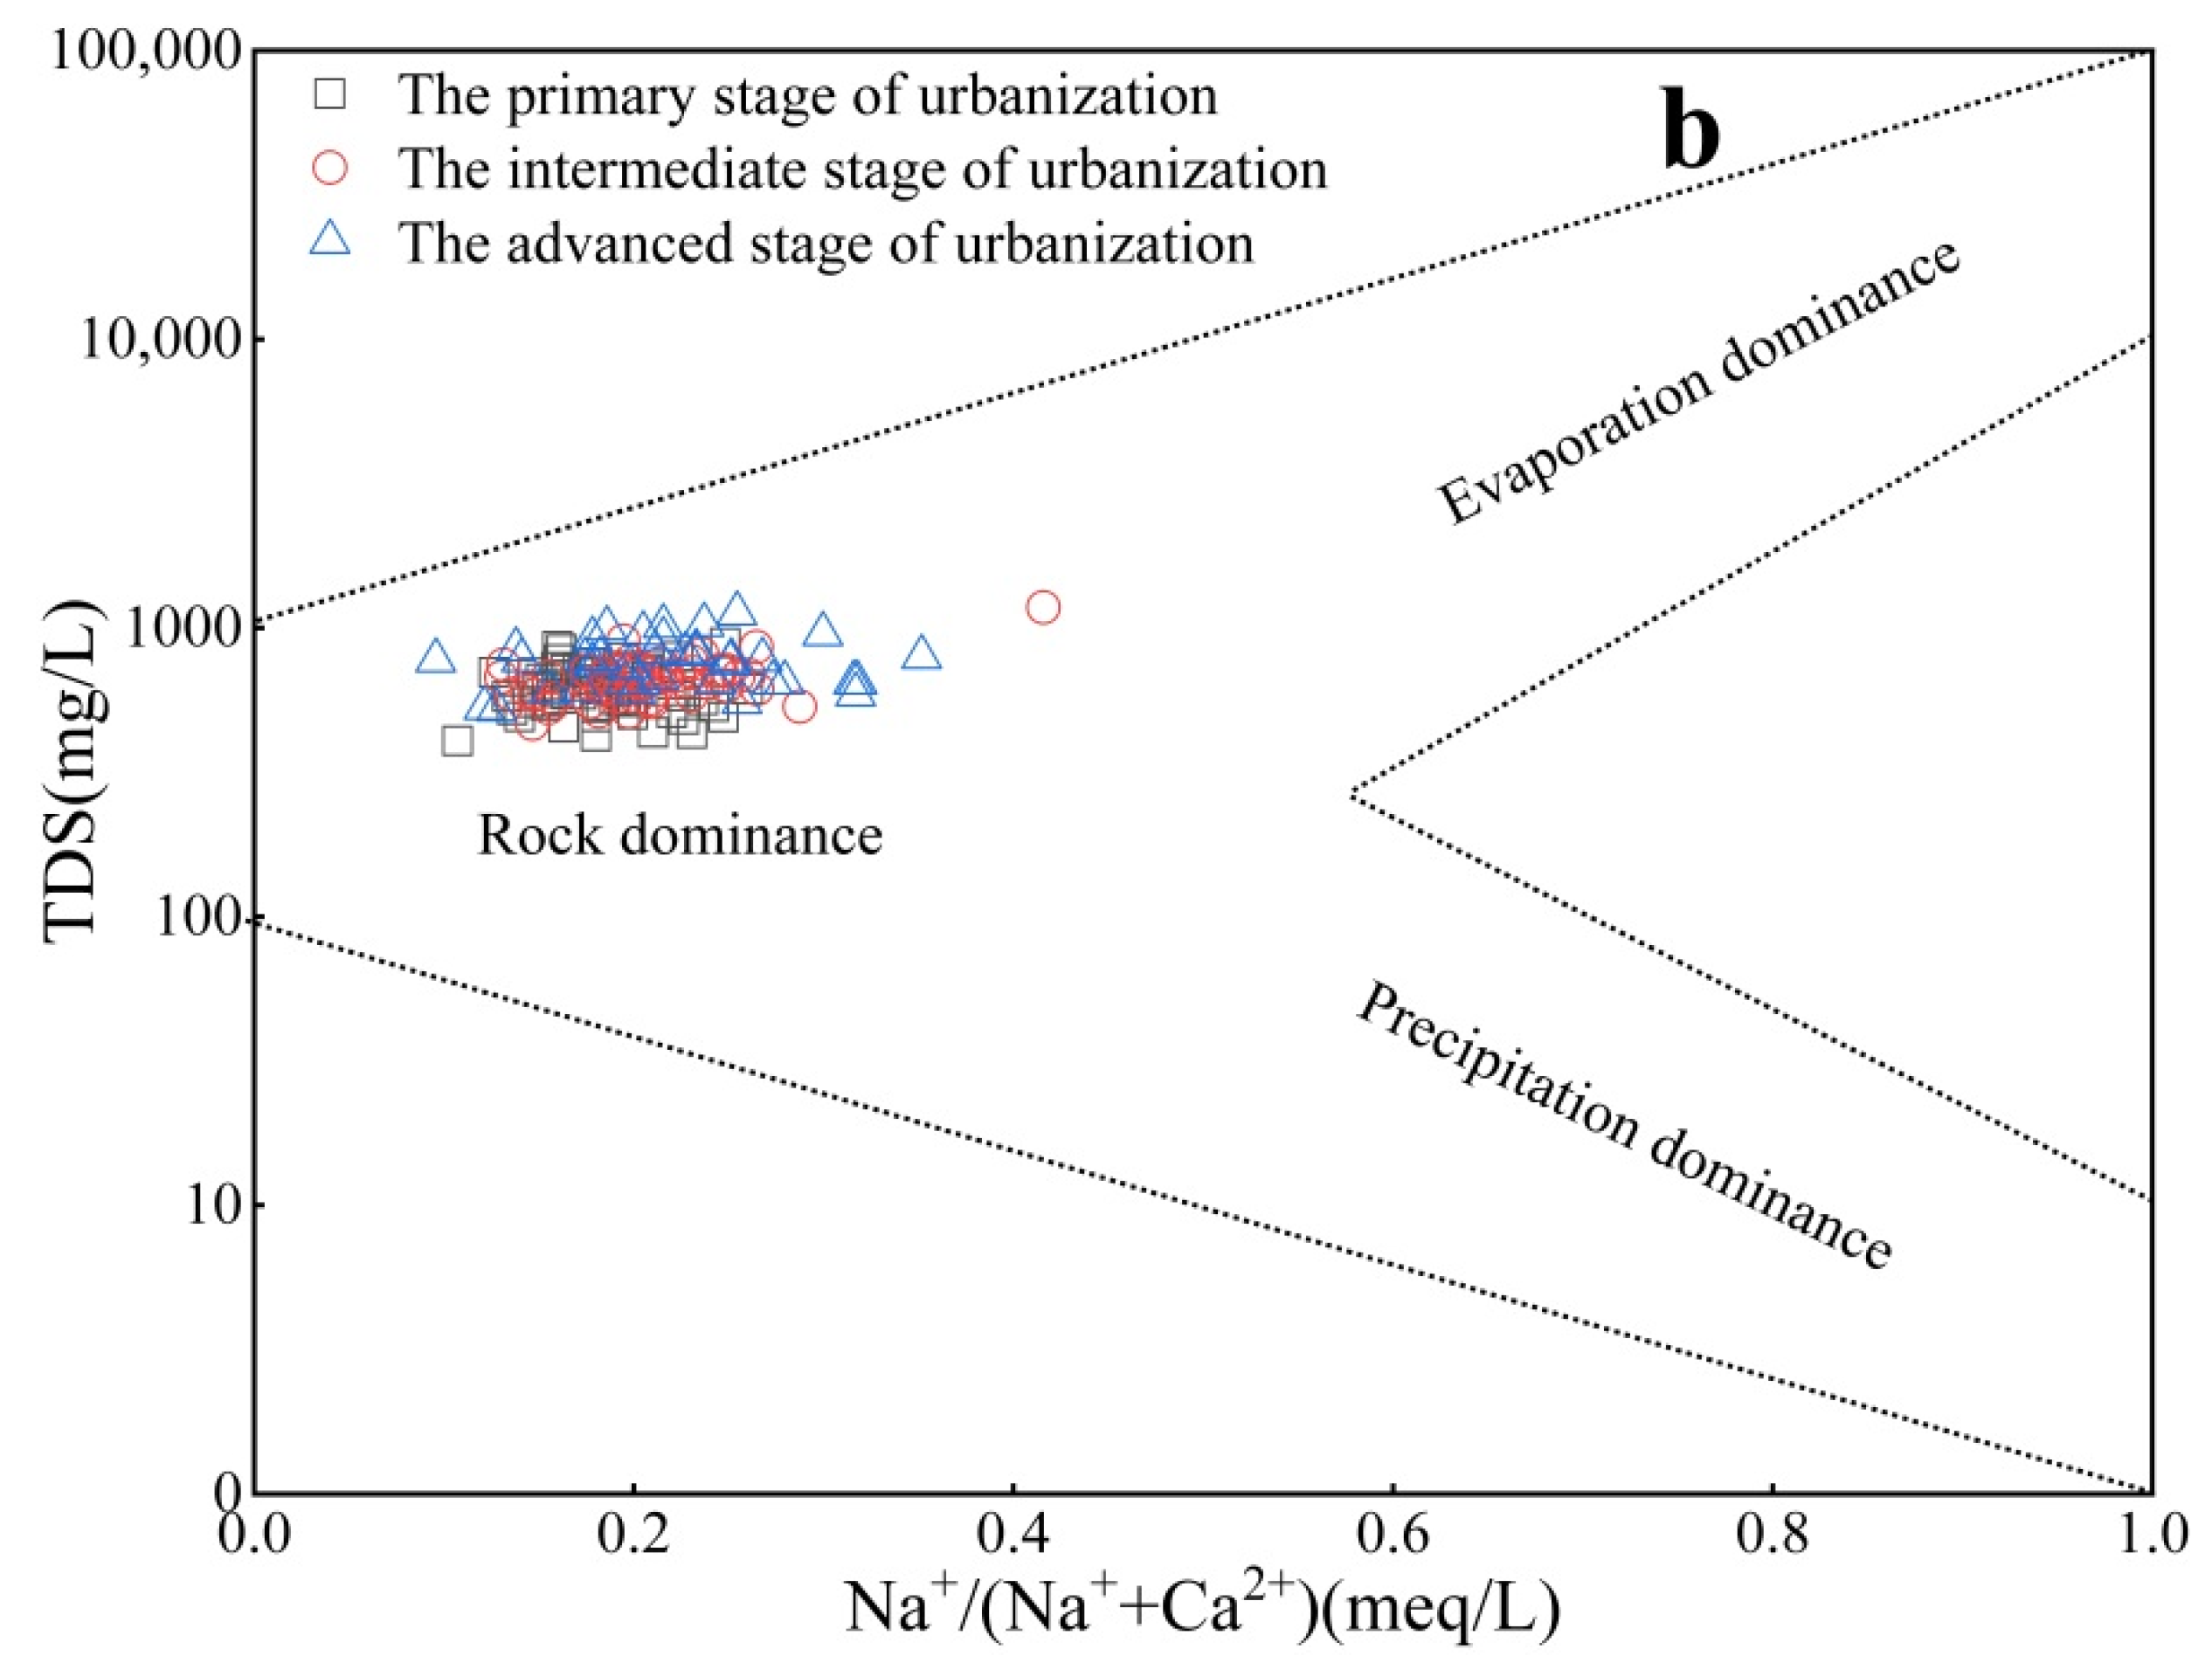
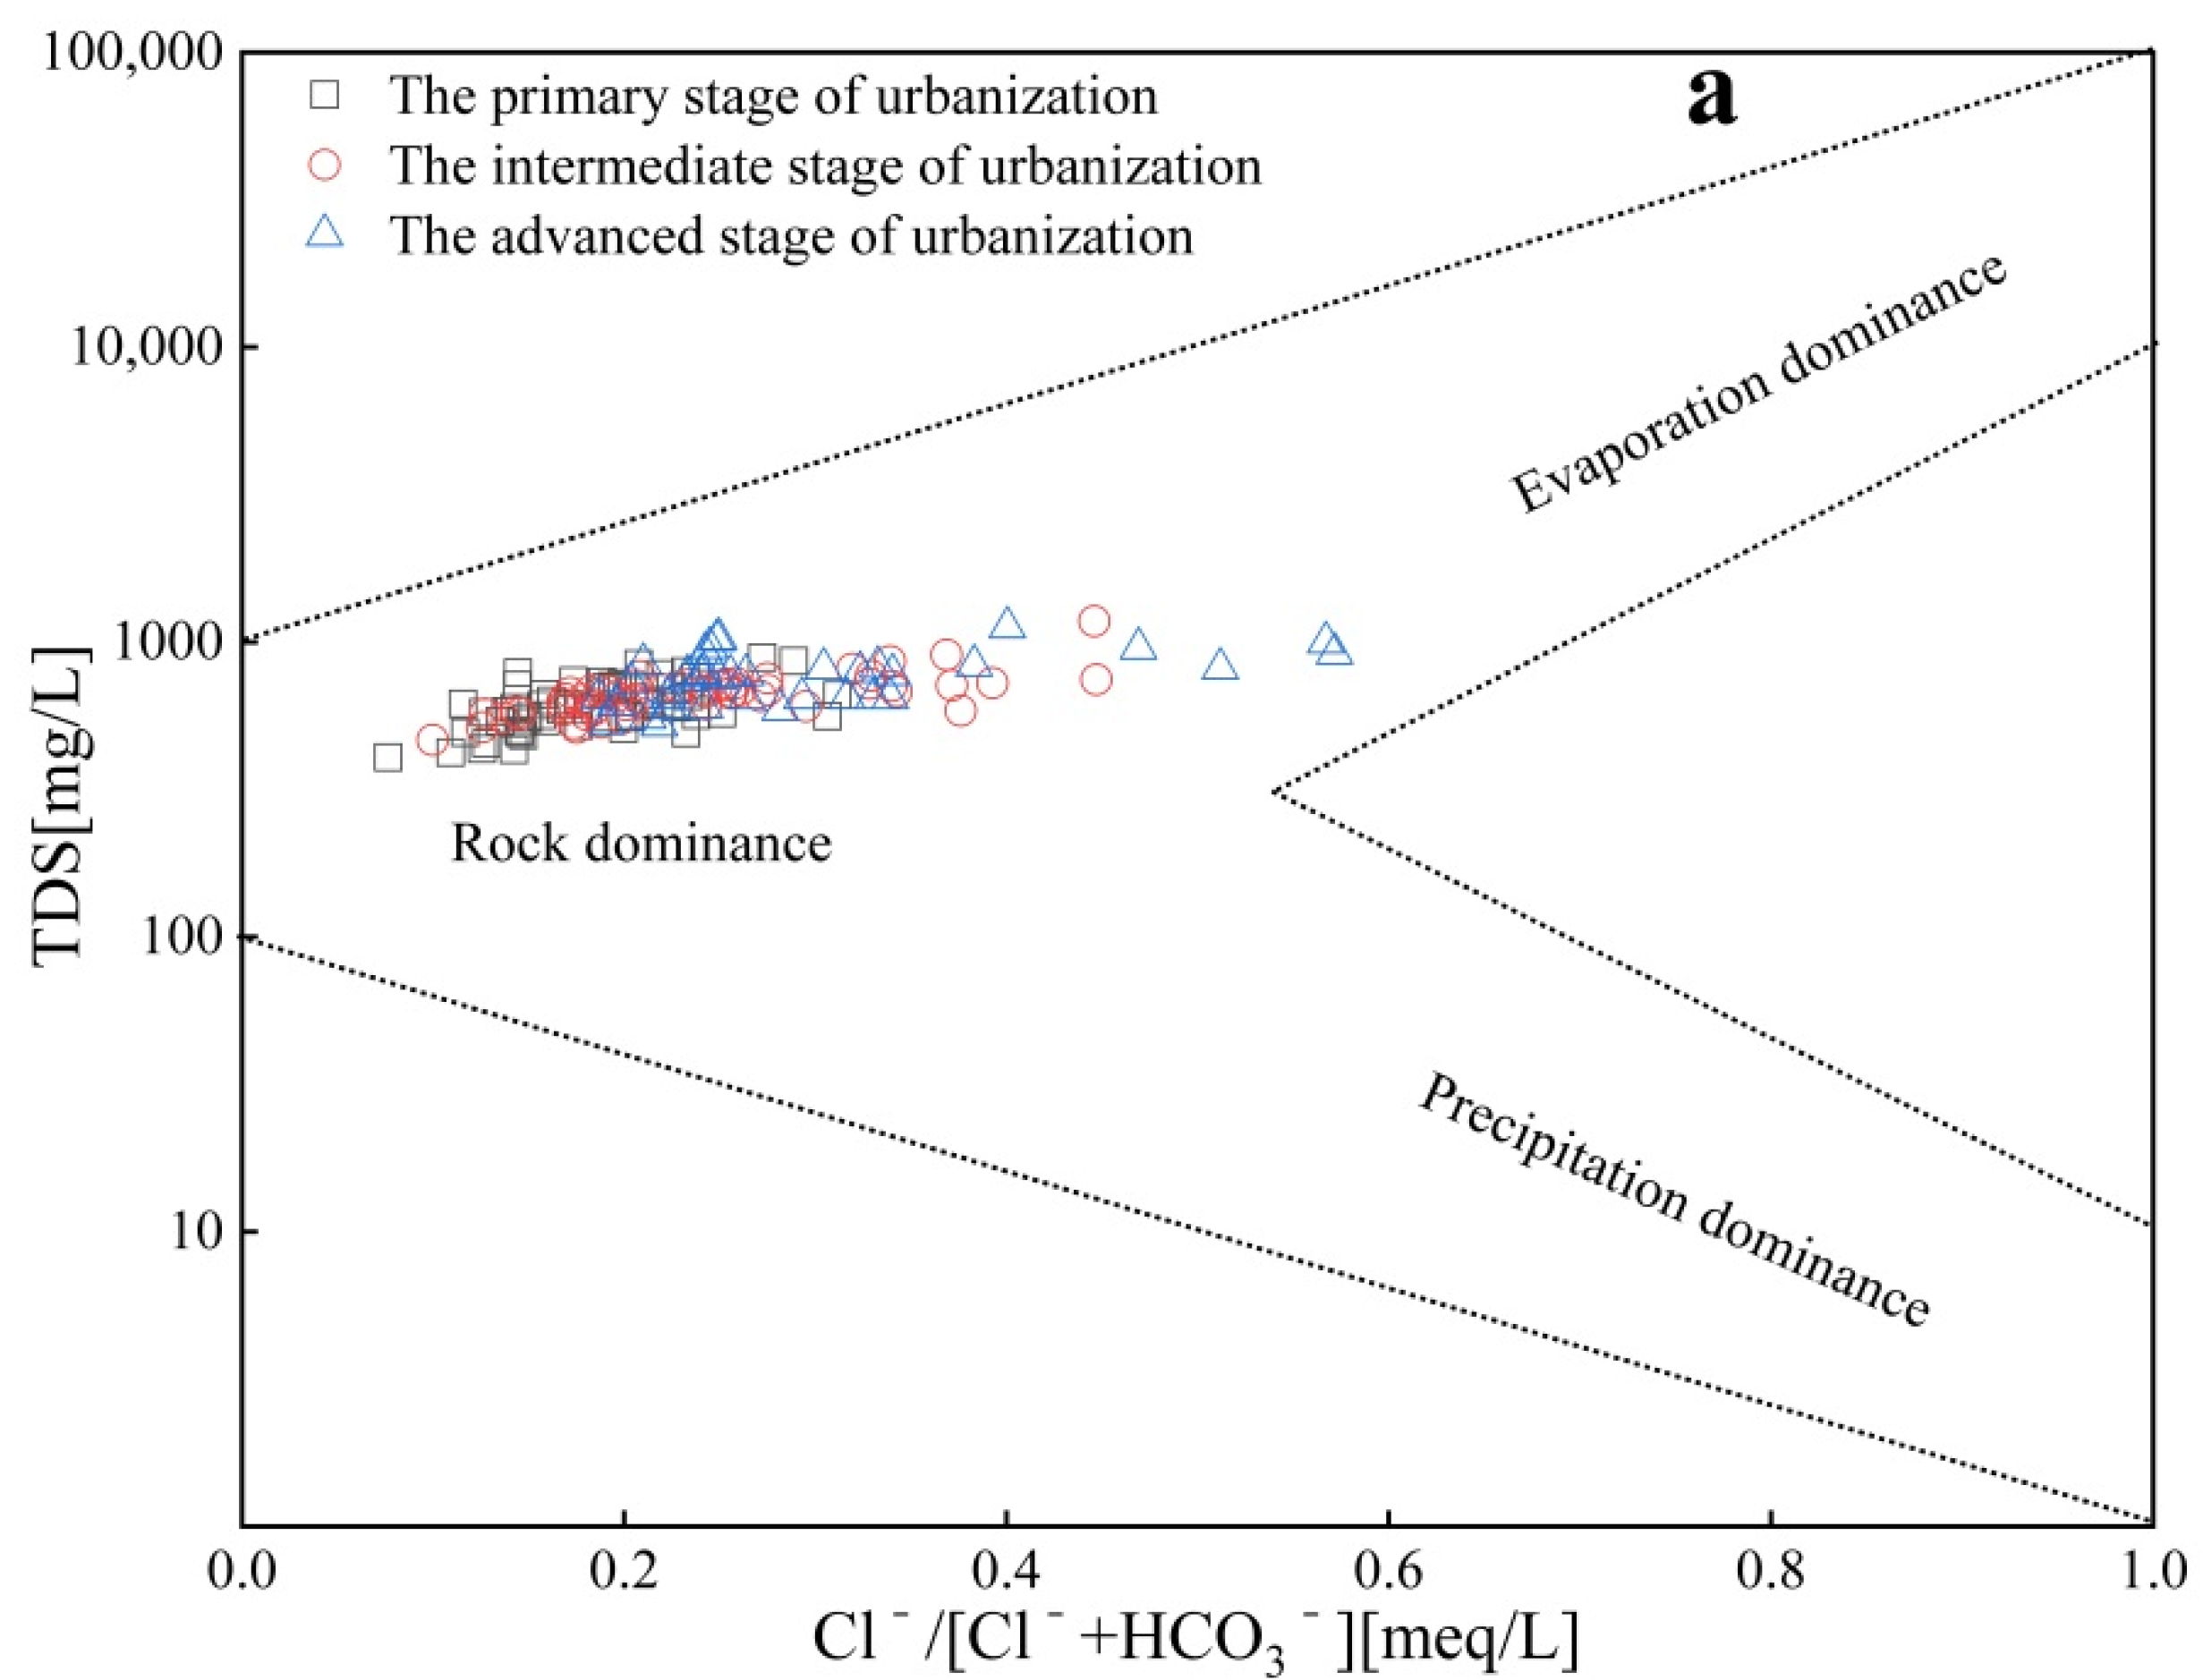
4.3.1. Analysis of Controlling Factors Based on Gibbs Diagram
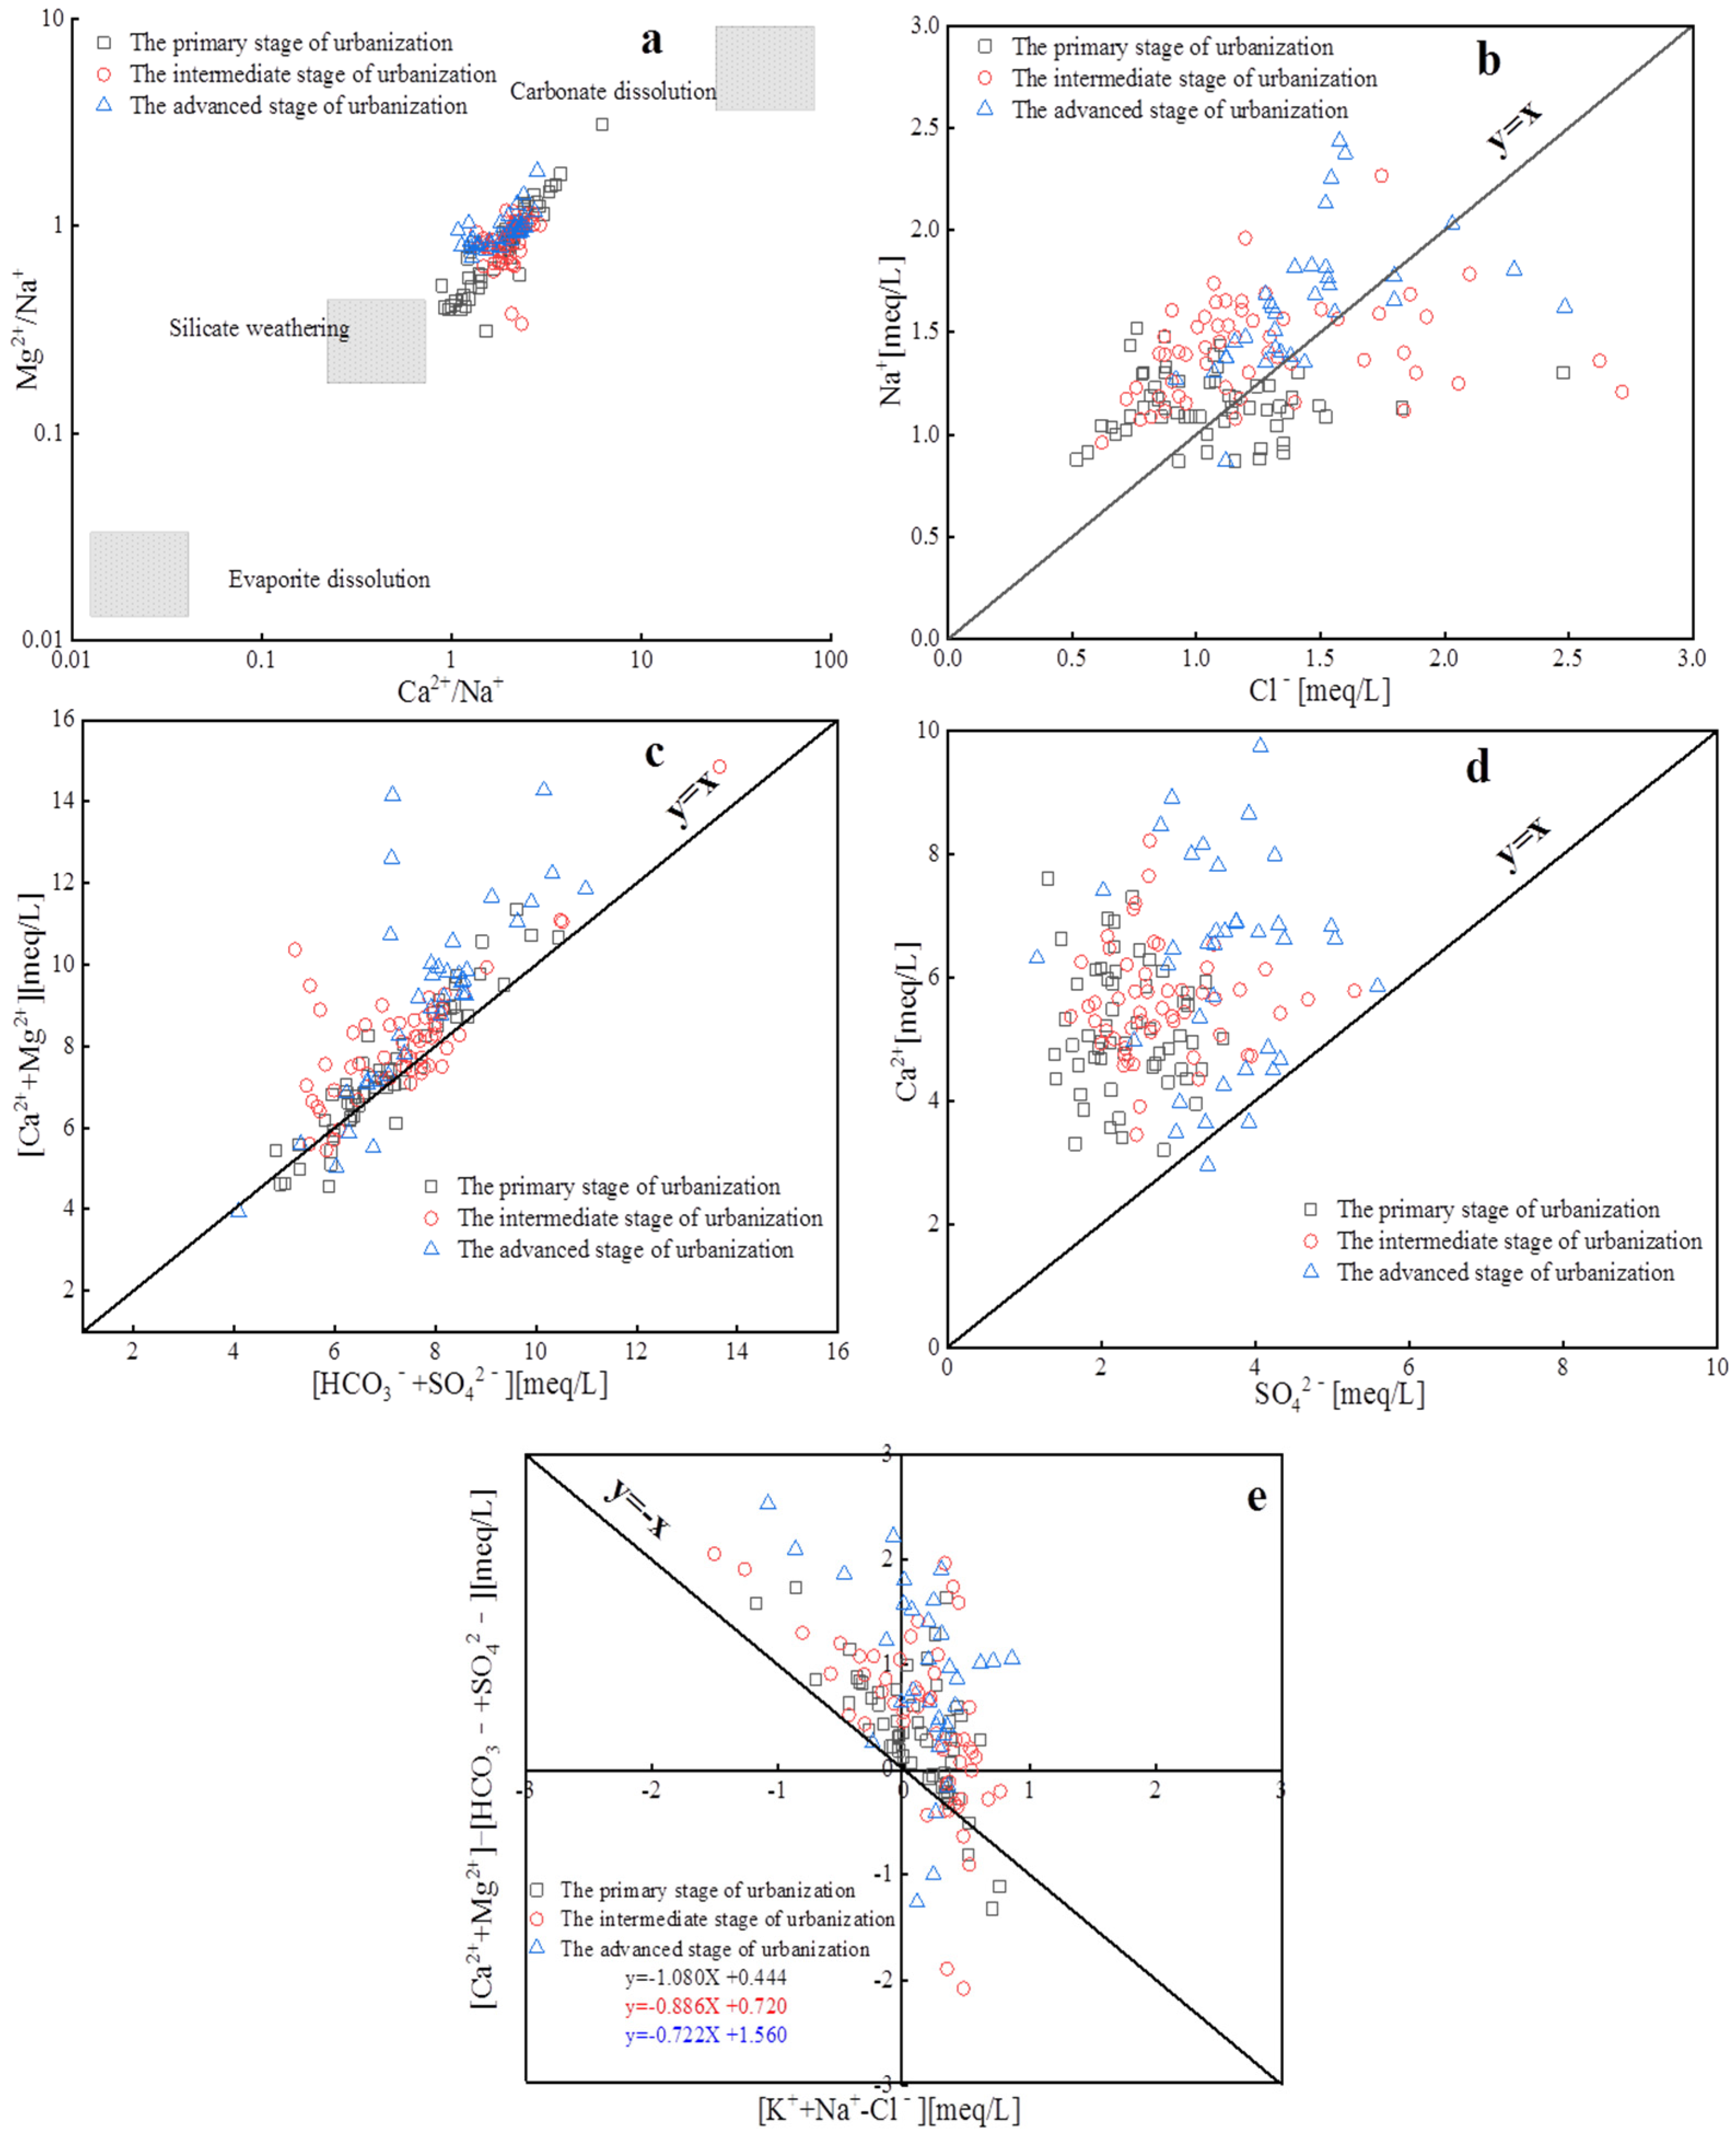
4.3.2. Water–Rock Interactions
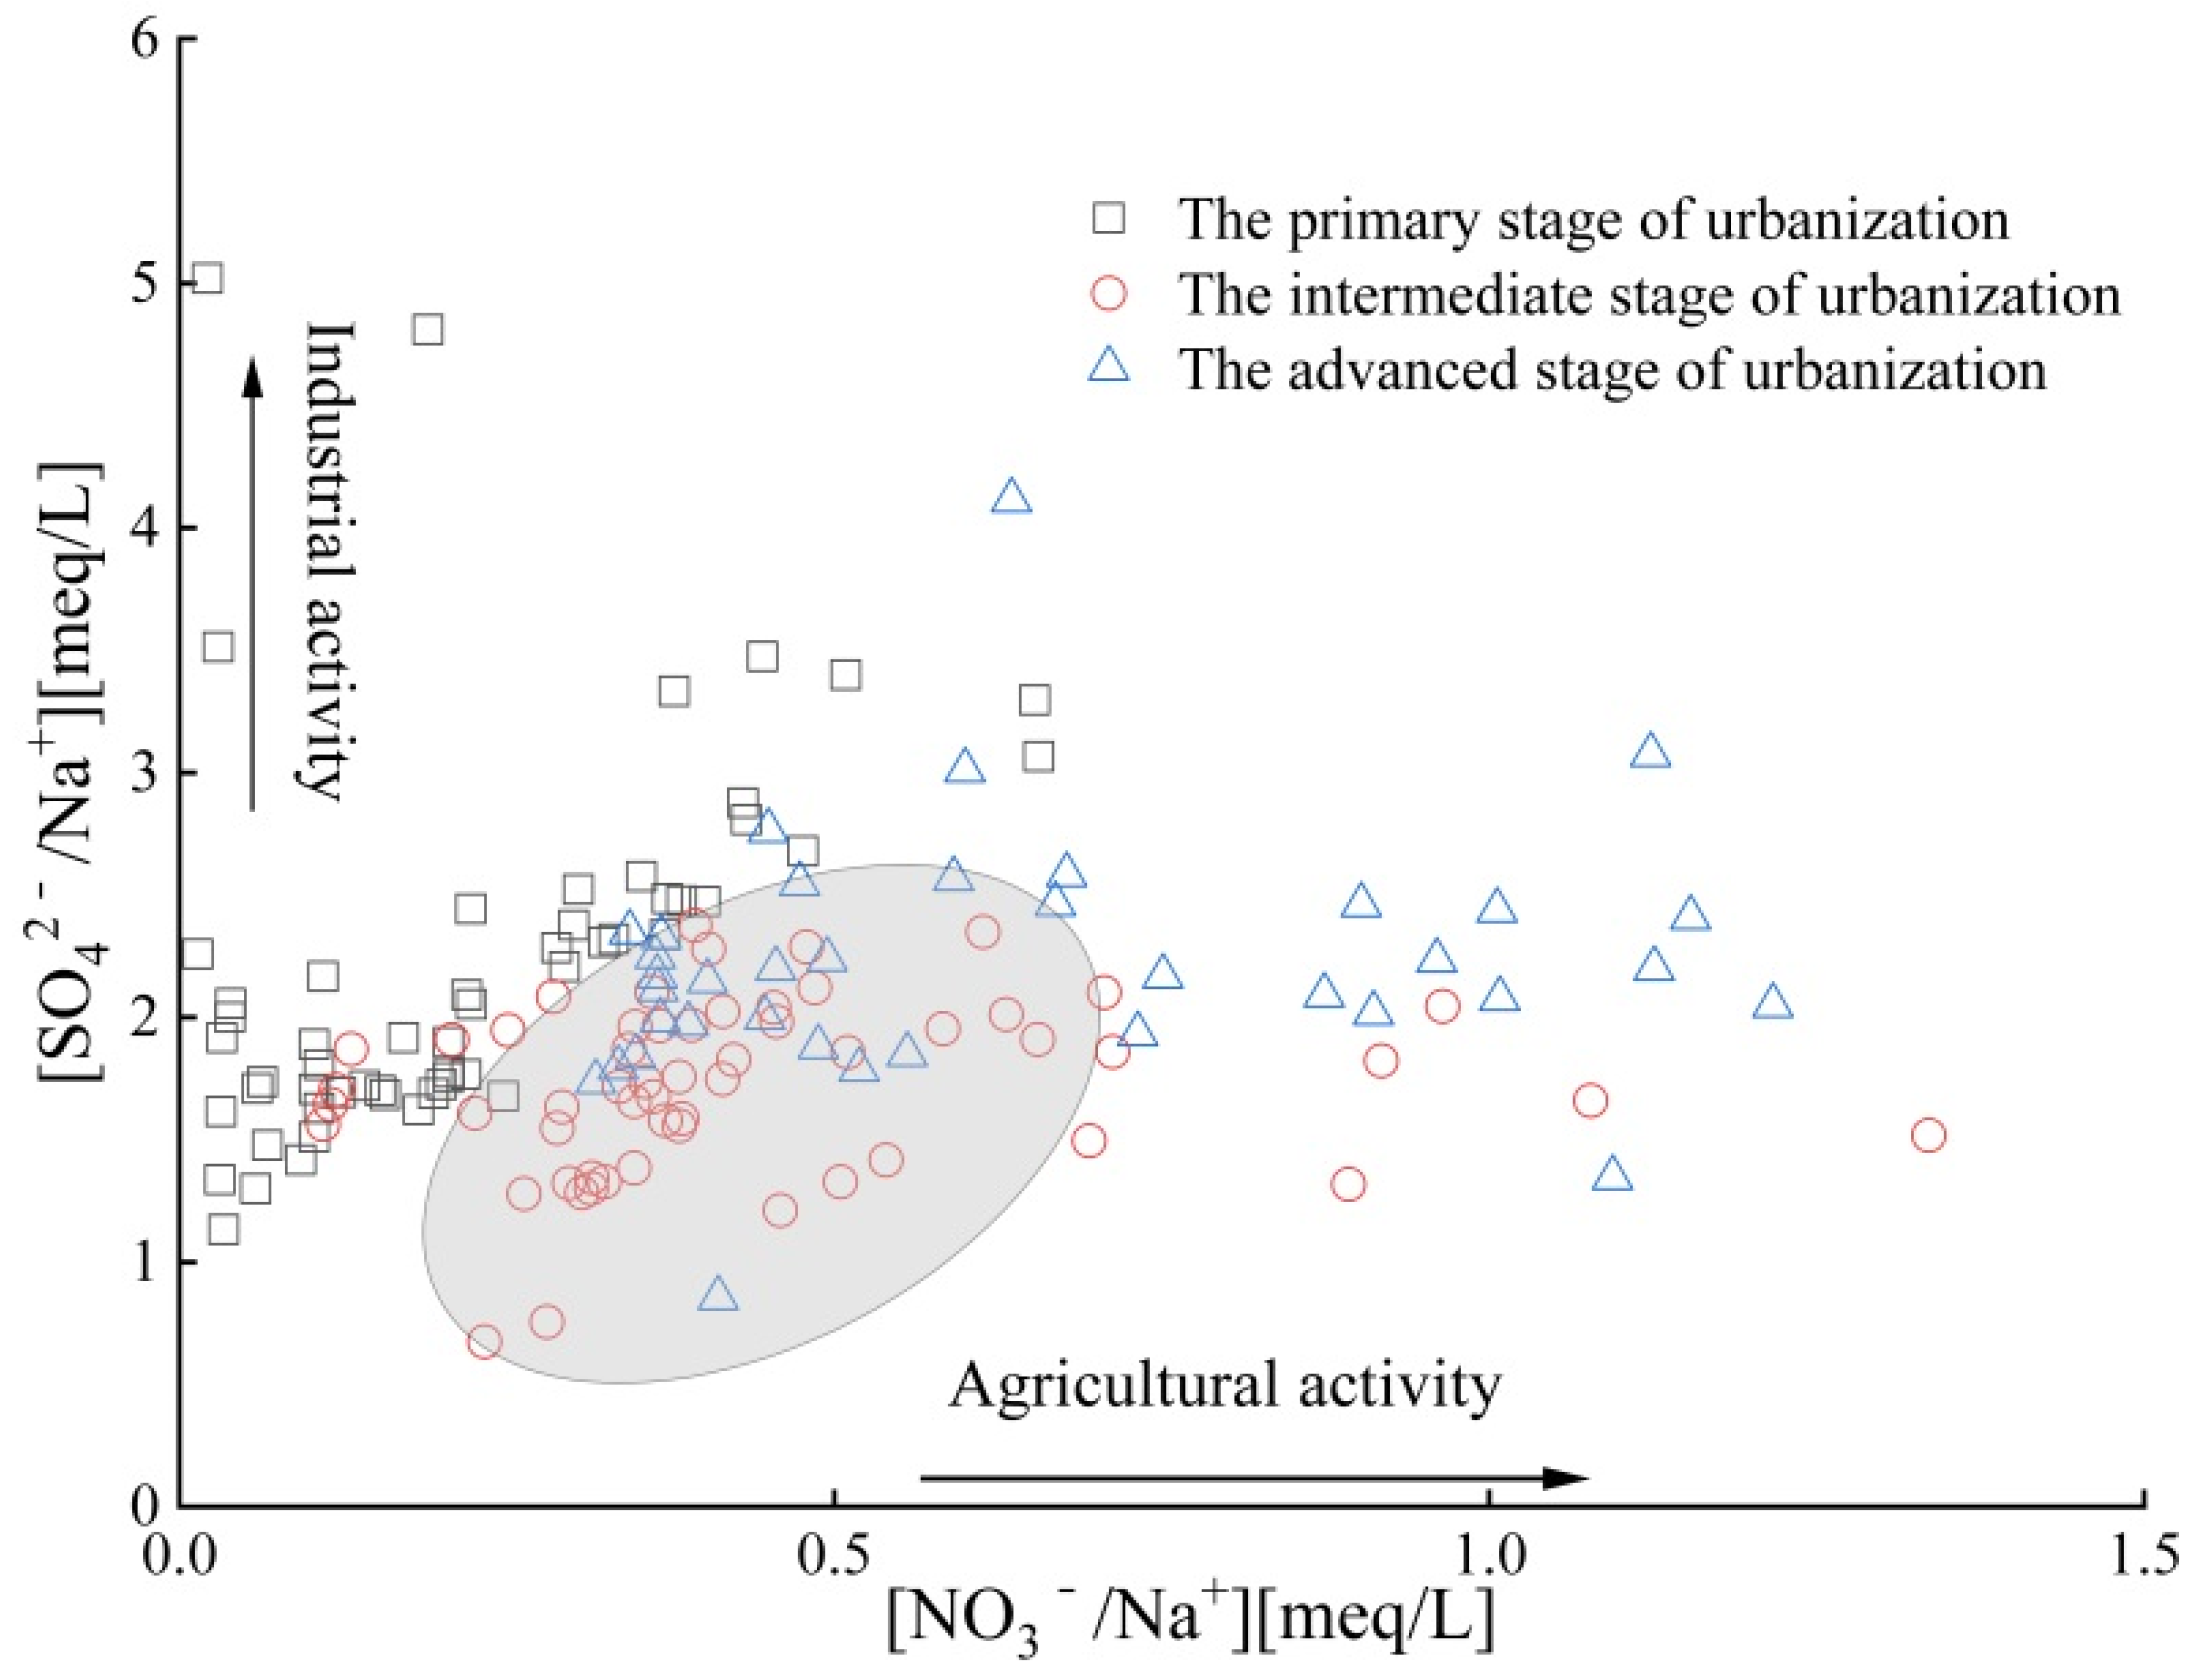
4.3.3. Impact of Human Activities on Groundwater Chemical Composition
4.4. Driving Mechanism for Temporal Evolution of Hydrochemistry
5. Conclusions
Supplementary Materials
Author Contributions
Funding
Data Availability Statement
Acknowledgments
Conflicts of Interest
References
- Li, P.; Karunanidhi, D.; Subramani, T.; Srinivasamoorthy, K. Sources and Consequences of Groundwater Contamination. Arch. Environ. Con. Tox. 2021, 80, 1–10. [Google Scholar]
- Pashaeifar, M.; Dehghanzadeh, R.; Ramazani, M.E.; Rafieyan, O.; Nejaei, A. Spatial and temporal assessment of groundwater quality and hydrogeochemical processes in Urmia Lake Basin, Iran. Water Supply 2021, 21, 4328–4342. [Google Scholar] [CrossRef]
- Peng, H.; Yang, W.; Ferrer, A.; Xiong, S.; Li, X.; Niu, G.; Lu, T. Hydrochemical characteristics and health risk assessment of groundwater in karst areas of southwest China: A case study of Bama, Guangxi. J. Clean. Prod. 2022, 341, 130872. [Google Scholar]
- Quinn, N.W.T.; Oster, J.D. Innovations in Sustainable Groundwater and Salinity Management in California’s San Joaquin Valley. Sustainability 2021, 13, 6658. [Google Scholar] [CrossRef]
- Saccò, M.; Blyth, A.; Douglas, G.; Humphreys, W.; Hose, G.; Davis, J.; Guzik, M.; Martínez, A.; Nez, A.; Eberhard, S.; et al. Stygofaunal diversity and ecological sustainability of coastal groundwater ecosystems in a changing climate: The Australian paradigm. Freshw. Biol. 2022, 67, 2007–2023. [Google Scholar]
- Qin, R.; Song, Q.; Hao, Y.; Wu, G. Groundwater level declines in Tianjin, North China: Climatic variations and human activities. Environ. Dev. Sustain. 2022, 25, 1899–1913. [Google Scholar] [CrossRef]
- Akakuru, O.; Eze, C.; Okeke, O.; Opara, A.I.; Usman, A.O.; Iheme, O.; Ibeneme, S.I.; Iwuoha, P.O. Hydrogeochemical evolution, water quality indices, irrigation suitability and pollution index of groundwater pig around Eastern Niger Delta, Nigeria. Int. J. Energy Res. 2022, 6, 389–411. [Google Scholar]
- Israr, M.; Nazneen, S.; Raza, A.; Ali, N.; Khan, S.A.; Khan, H.; Khan, S.; Ali, J. Assessment of municipal solid waste landfilling practices on the groundwater quality and associated health risks: A case study of mar-dan-pakistan. Arab. J. Geosci. 2022, 15, 1445. [Google Scholar]
- Kai, L.; Zhong, P.; Raza, A. Impact of rapid urbanization on water quality index in groundwater fed Gomati River, Lucknow, India. Curr. Sci. 2018, 3, 650–654. [Google Scholar]
- Liu, J.; Yang, H.; Gosling, S.N.; Kummu, M.; Flörke, M.; Pfister, S.; Hanasaki, N.; Wada, Y.; Zhang, X.; Zheng, C.; et al. Water scarcity assessments in the past, present, and future. Earth’s Future 2017, 5, 545–559. [Google Scholar] [CrossRef]
- Huang, G.; Sun, J.; Zhang, Y.; Chen, Z.; Liu, F. Impact of anthropogenic and natural processes on the evolution of groundwater chemistry in a rapidly urbanized coastal area, South China. Sci. Total Environ. 2013, 463, 209–221. [Google Scholar] [CrossRef]
- Olds, H.T.; Corsi, S.R.; Dila, D.K.; Halmo, K.M.; Bootsma, M.J.; McLellan, S.L. High levels of sewage contamina-tion released from urban areas after storm events: A quantitative survey with sewage specific bacterial indica-tors. PLoS Med. 2018, 15, e1002614. [Google Scholar]
- Barron, O.V.; Barr, A.D.; Donn, M.J. Evolution of nutrient export under urban development in areas affected by shallow watertable. Sci. Total Environ. 2013, 443, 491–504. [Google Scholar] [CrossRef]
- Zhang, Q.; Wang, H. Assessment of sources and transformation of nitrate in the alluvial-pluvial fan region of north China using a multi-isotope approach. J. Environ. Sci. 2020, 3, 9–22. [Google Scholar] [CrossRef]
- Rai, S.C.; Saha, A.K. Impact of urban sprawl on groundwater quality: A case study of Faridabad city, National Capital Region of Delhi. Arab. J. Geosci. 2015, 8, 8039–8045. [Google Scholar] [CrossRef]
- Villegas, P.; Paredes, V.; Betancur, T.; Ribeiro, L. Assessing the hydrochemistry of the urabá aquifer, colombia by principal component analysis. J. Geochem. Explor. 2013, 134, 120–129. [Google Scholar]
- Sinha, R.; Elango, L. Deterioration of groundwater quality: Implications and management. In Water Governance: Challenges and Prospects; Springer: Singapore, 2019; pp. 87–101. [Google Scholar]
- Huang, Z.; Pan, Y.; Gong, H.; Yeh, P.J.F.; Li, X.; Zhou, D.; Zhao, W. Subregional-scale groundwater depletion detected by GRACE for both shallow and deep aquifers in North China Plain. Geophys. Res. Lett. 2015, 42, 1791–1799. [Google Scholar] [CrossRef]
- Zheng, C.; Liu, J.; Cao, G.; Kendy, E.; Wang, H.; Jia, Y. Can China Cope with Its Water Crisis?—Perspectives from the North China Plain. Groundwater 2010, 48, 350–354. [Google Scholar] [CrossRef]
- Ren, C.; Zhang, Q.; Wang, H.; Wang, Y. Characteristics and source apportionment of polycyclic aromatic hy-drocarbons of groundwater in Hutuo river alluvial-pluvial fan, china, based on PMF model. Environ. Sci. Pollut. R. 2021, 28, 9647–9656. [Google Scholar]
- GB/T8538~2008; General Administration of Quality Supervision, Inspection and Quarantine of the People’s Republic of China, Methods for Examination of Drinking Natural Mineral Water. Standards Press of China: Beijing, China, 2008. (In Chinese)
- Zhang, Q.; Wang, X.; Wan, W.; Hou, P.Q.; Li, R.; Ouyang, Z. The Spatial-Temporal Pattern and Source Apportionment of Water Pollution in a Trans-Urban River. Pol. J. Environ. Stud. 2015, 24, 841–851. [Google Scholar]
- Zhang, Q.; Wang, H.; Wang, Y.; Yang, M.; Zhu, L. Groundwater quality assessment and pollution source apportionment in an intensely exploited region of northern China. Environ. Sci. Pollut. R. 2017, 24, 16639–16650. [Google Scholar]
- Chen, R.; Hu, Q.; Shen, W.; Guo, J.; Yang, L.; Yuan, Q.; Lu, X.; Wang, L. Identification of nitrate sources of groundwater and rivers in complex urban environments based on isotopic and hydro-chemical evidence. Sci. Total Environ. 2023, 871, 162026. [Google Scholar] [CrossRef] [PubMed]
- Yang, J.; Ye, M.; Tang, Z.; Tian, J.; Xiaoyu, S.; Yongzhen, P.; Honghua, L. Using cluster analysis for understand-ing spatial and temporal patterns and controlling factors of groundwater geochemistry in a regional aquifer. J. Hydrol. 2020, 583, 124594. [Google Scholar]
- World Health Organization. Guidelines for Drinking-Water Quality, 4th ed.; World Health Organization: Geneva, Switzerland, 2011. [Google Scholar]
- Fei, L.; Jza, B.; Jza, B.; Pza, B. Factors controlling groundwater chemical evolution with the impact of reduced exploitation. Catena 2022, 214, 106261. [Google Scholar]
- Mukate, S.; Bhoominathan, S.; Solanky, V. Assessment of human health risk arising due to fluoride and nitrate in groundwater: A case study of Bhokardan tehsil of Maharashtra. Hum. Ecol. Risk Assess. Int. J. 2022, 28, 594–620. [Google Scholar] [CrossRef]
- Hasan, M.S.U.; Rai, A.K. Groundwater quality assessment in the Lower Ganga Basin using entropy information theory and GIS. J. Clean. Prod. 2020, 274, 123077. [Google Scholar] [CrossRef]
- Tiwari, A.K.; Singh, A.K.; Singh, A.K.; Singh, M.P. Hydrogeochemical analysis and evaluation of surface water quality of Pratapgarh district, Uttarpradesh, India. Appl. Water Sci. 2017, 7, 1609–1623. [Google Scholar]
- Wang, Q.; Dong, S.; Wang, H.; Yang, J.; Yu, B. Hydrogeochemical processes and groundwater quality assessment for different aquifers in the Caojiatan coal mine of Ordos Basin, northwestern China. Environ. Earth Sci. 2020, 79, 199. [Google Scholar]
- Xiaohui, R.; Zhang, Z.; Yu, R.; Li, Y.; Li, Y.; Zhao, Y. Hydrochemical variations and driving mechanisms in a large linked river-irrigation-lake system. Environ. Res. 2023, 225, 115596. [Google Scholar]
- Li, Y.; Zhang, Z.; Fei, Y.; Chen, H.; Qian, Y.; Yu, D. Investigation of quality and pollution characteristics ofgroundwater in the Hutuo River alluvial plain, North Chinaplain. Environ. Earth Sci. 2016, 75, 581. [Google Scholar]
- Lü, X.; Liu, J.; Han, Z.; Zhu, L.; Chen, X. Effects of Yindaruqin irrigation project on groundwater chemical compositions in Qinwangchuan basin in Gansu Province Article. Trans. Chin. Soc. Agric. Eng. 2020, 36, 166–174. (In Chinese) [Google Scholar]
- Torres-Martínez, J.A.; Mora, A.; Knappett, P.S.K.; Ornelas-Soto, N.; Mahlknecht, J. Tracking nitrate and sulfate sources in groundwater of an urbanized valley using a multi-tracer approach combined with a Bayesian iso-tope mixing model. Water Res. 2020, 182, 115962. [Google Scholar] [PubMed]
- Panda, B.; Chidambaram, S.; Snow, D.; Malakar, A.; Singh, D.K.; Ramanathan, A.L. Source apportionment and health risk assessment of nitrate in foothill aquifers of Western Ghats, South India. Ecotoxicol. Environ. Saf. 2021, 229, 113075. [Google Scholar] [CrossRef] [PubMed]
- Zhang, Q.; Shu, W.; Li, F.; Li, M.; Zhou, J.; Tian, C.; Liu, S.; Ren, F.; Chen, G. Nitrate source apportionment and risk assessment: A study in the largest ion-adsorption rare earth mine in China. Environ. Pollut. 2022, 302, 119052. [Google Scholar] [CrossRef] [PubMed]
- Torres-Martínez, J.A.; Mora, A.; Mahlknecht, J.; Kaown, D.; Barceló, D. Determining nitrate and sulfate pollution sources and transformations in a coastal aquifer impacted by seawater intrusion—A multi-isotopic approach combined with self-organizing maps and a Bayesian mixing model. J. Hazard. Mater. 2021, 417, 126103. [Google Scholar] [CrossRef]
- Yu, B.; Lai, X. Carbonic Acid System of Groundwater and the Solubility of Calcite during Diagenesis. Acta Sed. Sin. 2010, 24, 627–635. (In Chinese) [Google Scholar]
- Zhou, B.; Wang, H.; Zhang, Q. Assessment of the Evolution of Groundwater Chemistry and Its Controlling Factors in the Huangshui River Basin of Northwestern China, Using Hydrochemistry and Multivariate Statistical Techniques. Int. J. Environ. Res. Public Health 2021, 18, 7551. [Google Scholar] [CrossRef]


| Parameters | Primary Stage of Urbanization | Intermediate Stage of Urbanization | Advanced Stage of Urbanization | ||||
|---|---|---|---|---|---|---|---|
| PC1 | PC2 | PC1 | PC2 | PC1 | PC2 | PC3 | |
| TDS | 0.985 | −0.089 | 0.957 | 0.106 | 0.272 | 0.708 | 0.511 |
| Ca2+ | 0.952 | −0.205 | 0.925 | −0.113 | 0.796 | 0.523 | 0.183 |
| Mg2+ | 0.922 | −0.102 | 0.062 | 0.806 | 0.980 | 0.032 | 0.086 |
| NO3− | 0.882 | −0.167 | 0.016 | 0.599 | 0.139 | 0.925 | 0.185 |
| TH | 0.868 | 0.011 | 0.870 | 0.013 | 0.834 | 0.331 | 0.227 |
| SO42− | 0.868 | 0.061 | 0.934 | −0.188 | −0.074 | 0.243 | 0.916 |
| HCO3− | 0.859 | −0.183 | −0.401 | 0.646 | 0.036 | 0.851 | 0.239 |
| Cl− | 0.612 | −0.003 | 0.801 | 0.179 | 0.963 | −0.052 | −0.196 |
| K+ + Na+ | −0.039 | 0.827 | 0.765 | 0.014 | 0.744 | −0.077 | 0.583 |
| pH | −0.082 | 0.704 | 0.209 | 0.793 | −0.045 | −0.787 | 0.138 |
| Eigenvalue | 6.23 | 1.20 | 4.84 | 2.15 | 4.95 | 2.48 | 1.27 |
| Contribution rate% | 62.3 | 12.0 | 48.4 | 21.5 | 49.5 | 24.8 | 12.6 |
| Cumulative contribution rate% | 62.3 | 74.4 | 48.4 | 69.9 | 49.5 | 74.3 | 86.9 |
Disclaimer/Publisher’s Note: The statements, opinions and data contained in all publications are solely those of the individual author(s) and contributor(s) and not of MDPI and/or the editor(s). MDPI and/or the editor(s) disclaim responsibility for any injury to people or property resulting from any ideas, methods, instructions or products referred to in the content. |
© 2023 by the authors. Licensee MDPI, Basel, Switzerland. This article is an open access article distributed under the terms and conditions of the Creative Commons Attribution (CC BY) license (https://creativecommons.org/licenses/by/4.0/).
Share and Cite
Wang, L.; Zhang, Q.; Wang, H. Rapid Urbanization Has Changed the Driving Factors of Groundwater Chemical Evolution in the Large Groundwater Depression Funnel Area of Northern China. Water 2023, 15, 2917. https://doi.org/10.3390/w15162917
Wang L, Zhang Q, Wang H. Rapid Urbanization Has Changed the Driving Factors of Groundwater Chemical Evolution in the Large Groundwater Depression Funnel Area of Northern China. Water. 2023; 15(16):2917. https://doi.org/10.3390/w15162917
Chicago/Turabian StyleWang, Long, Qianqian Zhang, and Huiwei Wang. 2023. "Rapid Urbanization Has Changed the Driving Factors of Groundwater Chemical Evolution in the Large Groundwater Depression Funnel Area of Northern China" Water 15, no. 16: 2917. https://doi.org/10.3390/w15162917
APA StyleWang, L., Zhang, Q., & Wang, H. (2023). Rapid Urbanization Has Changed the Driving Factors of Groundwater Chemical Evolution in the Large Groundwater Depression Funnel Area of Northern China. Water, 15(16), 2917. https://doi.org/10.3390/w15162917