Article

Integration of Geological, Geochemical Modelling and Hydrodynamic Condition for Understanding the Geometry and Flow Pattern of the Aquifer System, Southern Nyírség–Hajdúság, Hungary

1
Institute of Environmental Management, Faculty of Earth Science and Engineering, University of Miskolc, Egyetemváros Street, 3515 Miskolc, Hungary
2
Geology Department, Faculty of Science, Beni-Suef University, Salah Salem Street, Beni-Suef 65211, Egypt
3
Geological Directorate, Supervisory Authority for Regulatory Affairs, Stefánia Street, 1123 Budapest, Hungary
4
Department of Mineralogy, Geochemistry and Petrology, University of Szeged, Egyetem Street 2, 6722 Szeged, Hungary
5
Debreceni Vizmű Zrt., Hatvan útca 12–14, 4025 Debrecen, Hungary
6
Department of Mineralogy and Geology, University of Debrecen, Egyetem tér 1, 4032 Debrecen, Hungary
*
Author to whom correspondence should be addressed.
Water 2023, 15(16), 2888; https://doi.org/10.3390/w15162888
Submission received: 14 July 2023 / Revised: 1 August 2023 / Accepted: 8 August 2023 / Published: 10 August 2023
(This article belongs to the Section Hydrogeology)

Abstract

:
Geological heterogeneity impacts groundwater flow patterns, necessitating a detailed hydrogeological framework for conceptualization process of aquifer systems. This research developed a new conceptual model of detailed geologic geometry by integrating 133 well-logs, 366 hydrodynamic data and 118 water samples. As new results, systematic 3D log correlation detected four distinct hydrostratigraphic units in the Southern Nyírség–Hajdúság Groundwater Body (East Hungary). The primary aquifer was identified as an incised valley 10–13 km wide and a NE–SW strike. Logan’s approach estimated the average hydraulic conductivity of the Incised Valley Unit (IVU) at 11 m/d, higher than the other three aquifers (3.2 m/d to 4.6 m/d). The average specific capacity of wells screening the IVU is 315.6 m3/d/m, in contrast with the remaining aquifers ranging from 31.6 m3/d/m to 92 m3/d/m. Pressure–depth profiles, dynamic pressure increment and hydraulic head maps revealed recharge–discharge zones and hydraulic windows between hydrostratigraphic units. The elongated pattern on the hydraulic head map at the depth of the IVU showed the existence of a preferential path along its axis within the mapped borders of the IVU. Hydrochemical analysis revealed Ca-Mg-HCO3 water type within the primary aquifer and Na-HCO3 water type in the laterally connected aquifer. The saturation index values indicated a transition from undersaturated to supersaturated state inside the main aquifer for calcite and dolomite minerals. The correlation matrix and PCA results demonstrated that the carbonate weathering process is the main factor controlling the groundwater chemistry. This integrated approach holds significance for future applications of the regional conceptual model in water management planning, sustainable aquifer development and contaminant transport modelling. It provides essential contributions to informed decision-making and the formulation of effective strategies, ensuring the long-term availability and utilization of groundwater resources.

1. Introduction

Geological heterogeneity is recognized as a major factor influencing groundwater flow patterns [1]. Its spatial distribution determines the presence of preferential flow paths and governs the flow and transport mechanisms within subsurface flow systems [2,3]. Thus, considerable attention has been given recently to investigating the variations arising from stratigraphically controlled properties and tectonic structures of the rock frameworks [4,5,6], in particular, hydraulic conductivity, storage and porosity of aquifer systems [7].
The interest in geological geometry arises as the variations of the aforementioned properties affect various aspects of numerical modeling, including model calibration [8], recharge estimation [9] and contaminant plume dispersion [10], consequently affecting the sustainability management plans [11] and hydraulic understanding of the aquifer system. Therefore, the detailed characterization of the geological geometry of the hydrogeological framework (Conceptual Physical Structure) has become a crucial problem to be solved to develop accurate conceptual models [12].
The precise and detailed three-dimensional prediction of the geological geometries relies on consistent interpretations of primary data and is supported by complementary data [13,14]. A widely used strategy is established on two- and three-dimensional seismic or electromagnetic surveys, supported by wireline log correlations, as shown in the research of Babad et. al. in the Hula Valley [15], and Mas et. al. in the Paris Basin [16], which describe the cases of deep aquifers. In the case of shallow aquifers, this methodology was presented in the studies performed by Bayer et. al. in a fluvio-glacial aquifer [6], or by Enemark et. al. in Egebjerg study site [17].
However, the problem emerges in cases related to regional-scale groundwater bodies for porous media that extend to depths between 200 and 300 hundred meters. In this situation, the implementation of two- and three-dimensional geophysical investigations is not cost-effective, especially to the limited budgets of groundwater investigations. In such cases, pursuing a detailed three-dimensional geological description based on wireline log correlation [13], complemented by available hydrogeological information, has emerged as a viable methodology.
The accurate modelling of geological geometries enables the construction of a more precise and complete conceptual model that captures the complex interactions between geological heterogeneity and groundwater flow [18,19,20]. To illustrate, the horizontal trends of the apparent hydraulic conductivity are in correlation with the spatial distribution of geological formations, as it is closely linked to the grain size and effective porosity of the rocks [21]. Additionally, the specific capacity of the wells serves as an effective qualitative indicator of the transmissivity of the investigated hydrostratigraphic units [22,23].
Another stage of hydrogeological conceptualization, wherein the geological geometry may have a relevant effect on the results, is the characterization of the hydrologic system (Conceptual Process Structure) [24,25]. The patterns of the flow and geochemical evolution represent a direct response to the geological geometry. The patterns of the flow can be analyzed in pressure–depth profile, dynamic pressure increment and the spatial distribution of the hydraulic head, revealing the vertical flow direction and the possible hydraulic connection between hydrostratigraphic units [26,27]. The geochemical evolution can be analyzed by geochemical modelling [28,29,30] and multivariable statistical analysis [31], which unveils the effects of water–rock interaction [32], ion exchange and effective infiltration processes over the geochemical composition of groundwater accordingly it goes migrating along the flow paths [33].
The Southern Nyírség–Hajdúság Groundwater Body is a complex aquifer system exploited since 1830 due to its favorable specific yield capacity [34]. In spite of plenty of wells, production and hydrogeochemical data of the study site, and in spite of the already published hydrogeological studies [23,35,36], there is a lack of a comprehensive regional conceptual model of necessary resolution that could address the precise definition of spatial continuity of aquifer layers, which is crucial for effective and sustainable water protection and management [37], according to the current increasing water demands.
This research aims to integrate an integration of geological, geochemical and hydrodynamic data: (1) to describe a 3D geological model based on log-correlation, (2) to enhance the reliability of the conceptual model by reducing the uncertainties of the hydrogeological framework, (3) to generate a complete and comprehensive conceptual model that represents the current consensus on the behavior of the groundwater system, (4) to describe effectively the correlation between the hydrologic system and the hydrogeological framework, (5) to explain the mineral saturation state and evolution of water along the flow paths, and (6) to apply principal component analysis and K-mean cluster analysis for determine the most contributing parameters in the groundwater chemistry and characterizing the chemical differences in the aquifers. The use of this integrated approach holds significance for future applications of the regional conceptual model in water management planning, sustainable development of the aquifers and contaminant transport modeling.

2. Materials and Methods

2.1. Site Description

The study site covers 1945 km2 of the northeast region of the Great Hungarian Plain (Figure 1a), with 65.9% of the area belonging to the Southern Nyírség–Hajdúság Shallow Groundwater Body and 34.1% to the Northern Hortobágy–Nagykunság–Bihar Shallow Groundwater Body (Figure 1b). For simplicity, this paper will refer to the study site as the Southern Nyírség–Hajdúság Groundwater Body (Southern-NHGWB). The maps and observation points are referenced in the ‘EOV’ coordinate system, following the next corners XEOV = from 824,500 m to 887,500 m (63 km) and YEOV = from 216,000 m to 273,500 m (57.5 km).
The Southern-NHGWB is an undulating plain of a complex parallel drainage network. Topographic relief ranges from 80 m a.s.l. in the lowlands (Hajdúszovát and Pocsaj) to 170 m a.s.l. in the highlands (Nyírlugos), sloping from northeast to southwest [38]. It is bordered by the Berettyó and Hortobágy–Berettyó Rivers Basins to the north and west, the Hungary–Romania border to the east, and the East Main Canal of Hungary to the south [39] (Figure 1c). The study site has a temperate continental climate with mild winters and hot summers [38]. The average annual temperature is 10–11 °C, with fluctuations of around 23–24.5 °C. The prevailing wind direction is from NW to SE, the annual rainfall averages between 500 mm/y and 575 mm/y, and the potential evapotranspiration ranges from 600 mm/y to 700 mm/y [40].
Tectonically, Bouguer anomaly and seismic data [41] reveal a complex structure of the Nyírség Region, dominated by a local sub-basin in the north, and touched by the Derecske Trough southward, while an inner elevated range of NE–SW direction can also be detected. Based on Quaternary isopach data, these structural elements have been active since the start of the Quaternary period [41] determining the spatial distribution of facies and unconformity surfaces in the Quaternary sedimentary succession. In the Miocene, consumption of the subductible European lithosphere was still in progress and the Pannonian basin was dominated by tectonic extension. During the Middle Miocene [42] and especially in the Late Miocene, the Derecske Trough served as an important local depositional center of the Pannonian Basin, where more than 4000 m thick sedimentary succession accumulated in the Lake Pannon [43,44]. The shelf margin prograded in the Tiszántúl from NE to SW [44,45]. In the Late Pliocene, the subduction at the eastern margin of the Pannonian basin was completed, and the lithosphere underlying the Pannonian basin became locked in a stable continental frame. This region is thus prevailed by lithosphere folding due to horizontal compressional intraplate stress that is caused by the overall Europe/Africa convergence [44].
Figure 1. (a) Location of the Southern-NHGWB at NE of Hungary. (b) Shallow groundwater bodies of the National General Directorate of Water Affairs [45]. (c) Topography, morphology and towns of the study site.
Water 15 02888 g001
Geologically, the investigated depth reaches the Late Miocene sediments of the Great Hungarian Plain stratigraphic succession. The sequence begins with the Újfalu Sandstone Unit, which consists of alternating delta front and delta plain deposits of sandstone, siltstone and clay marl. Overlying is the Zagyva Unit, characterized by fluvial and lacustrine sediments of medium to fine sand, silt, clay and clay marl. This unit contains coalified plant remnants and frequent lignite strips. Within the Zagyva Unit, the Nagyalföld Variegated Clay layer is observed, representing a typical sequence of variegated clay interbedded with lignite and pebbly sand beds [46] (Figure 2).
At the top are the Quaternary fluvial fan deposits [47,48], which have been reworked by Late Pleistocene and Holocene aeolian processes [49]. The fluvial fan is bordered by alluvial plains to the east, northeast and northwest, exhibiting sharp contacts due to lateral erosion. To the west, it is connected to a relatively elevated loess plateau, while the southern part is covered by young alluvial plains. Numerous investigations suggest that the thick Quaternary fluvial succession (250–300 m) in the region primarily accumulated in response to a drainage pattern influenced by the approximately northeast–southwest flow directions of the Tisza–Szamos system, somewhat parallel to the pre-Quaternary progradation [50]. Concerning the geological age of the stratigraphic units, in the lack of cores and direct laboratory data, there is not direct evidence, so the ages are derived from regional log correlations [51].
Hydrogeologically, the area is characterized as a gravity-driven unconfined zone [27]. Regional groundwater flow in the area generally occurs from northeast to southwest, accompanied by local and intermediate aquifer systems [26]. The recharge rate is primarily determined by the effective infiltration of precipitation, which ranges from 0 to 45 mm/year based on the average infiltration map provided by the National Adaptation Geoinformation System (NATéR) Project [52]. The water table is expected to reach an elevation of 155 m a.s.l. at Nyírlugos and Nyírbéltek, corresponding with the higher central surface of the Nyírség Region. Meanwhile, values of 80 m a.s.l. can be found in topographic lowlands along Hajdúszovát and Hajdúszoboszló [53].

2.2. Database

The research was based on a multi-source database collected by various institutions between 1969 and 1975. A total of 507 production wells are documented. Among them, 133 wells from the National Geological and Geophysical Database of Wells (New Urbancsek Database) provided resistivity (R), self-potential (SP), natural gamma (GR) and geological log data for mapping the aquifer system in the subsurface. A total of 367 wells offered datasets for calculating the hydraulic behavior of stratigraphic units, including variables such as pumping rates (Q), drawdown (s) and screen section locations. The hydraulic system was characterized using data from 365 wells. Furthermore, 118 wells from the National Hydrogeochemical Database (NHD) were used to evaluate the chemical characteristics and water type. Table 1 provides a summary of the database composition.

2.3. Methods

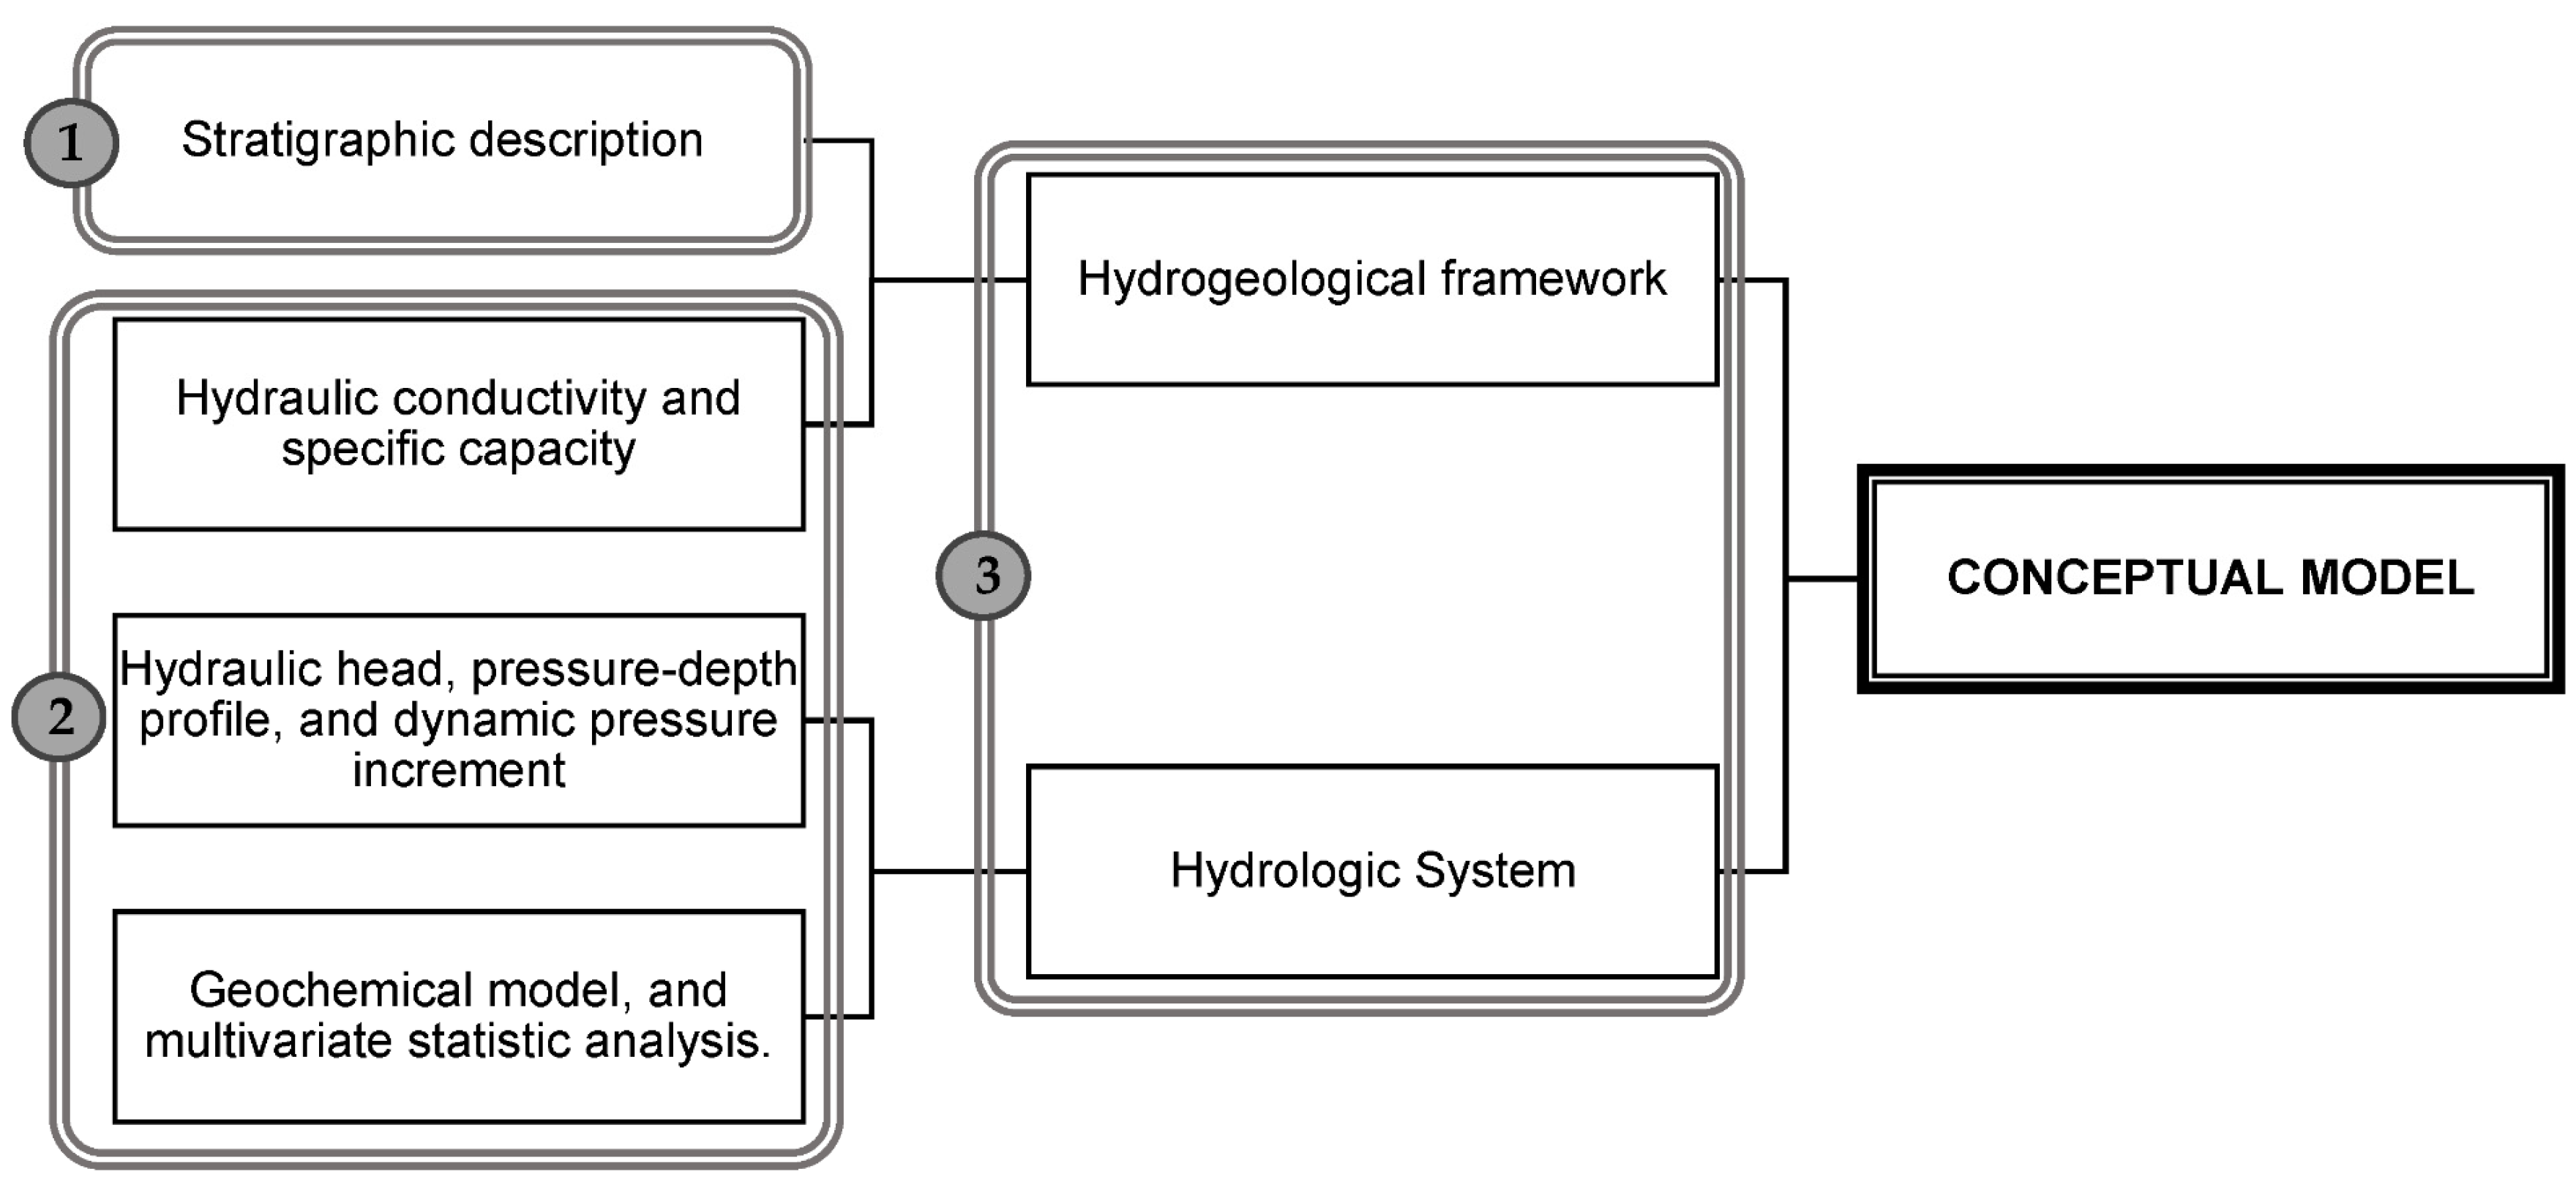
The employed workflow used for the comprehensive conceptualization of the groundwater system of the Southern-NHGWB (Figure 3) consisted of three stages to characterize the two main components of the conceptual model.
Stage 1 involved defining the geometry of the rock framework using systematic log correlation. The objective was to establish a clear understanding of the spatial arrangement and configuration of the geological formations within the study area. This step provided a fundamental basis for subsequent analyses.
In Stage 2, the available hydrogeologic datasets were analyzed. Various parameters were examined, including hydraulic conductivity, specific capacity, flow patterns and the geochemical model. The purpose was to gain insights into the hydraulic and geochemical behavior of the groundwater system.
Stage 3 focused on the comparison between the analyzed hydrogeological variables and the stratigraphic geometry. This step aimed to assess the relationships between the geological framework and the hydrogeological properties. The overall process is summarized in Figure 3, and a detailed theoretical explanation of each step is provided below.

2.3.1. Systematic Well-Log Correlation

Systematic log correlation is used to identify the boundaries of stratigraphic units. This is achieved by analyzing conventional geoelectric and radiometric logs to create log correlation sections. The logs are plotted equidistantly using GeoPlot developed for Smart Sketch, with the left track displaying spontaneous potential (SP) or gamma ray (GR), and the right track displaying electric resistivity (R). The space between the logs is filled with the lithology observed in cuttings during drilling.
The criteria used to analyze the curves include log values, log shape, stacking patterns and vertical dimensions, along with lithologic descriptions [13]. Subsequently, the stratigraphic surfaces were created by interpolation of the acquired well-tops using the geometric convergence algorithm [54] to generate the stratigraphic surfaces. Finally, the surfaces are assigned to a 3D finite-element mesh to represent the geologic geometry using GMS 10.7 [55].

2.3.2. Hydraulic Conductivity and Specific Capacity

The estimation of hydraulic conductivity (kh) was conducted using the method proposed by Logan [56], which required the pumping rate (Q), the drawdown (s) and the aquifer thickness (m). Equation (1) was employed for unconfined aquifers, while Equation (2) was applied for confined aquifers:
k h = 2.43 Q s   ( 2 m s )
k h = 1.22 Q s . m ,  
The specific capacity (SC) of wells was calculated by determining the head losses as a function of pumping rates and time [57,58] using Equation (3):
SC = Q s ,
where SC is the specific capacity in m3/d/m, Q is the pumping rate in m3/d and s is the drawdown in the pumped well in meters. For the calculation, it was assumed that the subsurface flow and the well system are connected, water leaving the groundwater system is equal to water entering the well [59], and that any factor affecting the drawdown will also affect the specific capacity value for a given pumping rate (Q) [57].
Box plots created in Excel were used to statistically present the datasets, and the spatial distribution of the hydraulic conductivity was generated by Kriging Interpolation Method [60] performed in Surfer 25.1.229.

2.3.3. Hydraulic Head and Pressure Conditions

Darcy demonstrated that groundwater always flows from areas of high potential energy to areas of low potential energy [26]. Therefore, the hydraulic head (h) distribution maps were generated by the Kriging Interpolation Method [60] performed in Surfer 25.1.229 to indicate the direction of groundwater flow in the subsurface environment [26,27].
The pore pressure (p) was calculated using Equation (4), which is derived from Bernoulli’s Law [61].
p = ρ g φ
where ρ is the water density in kg/m3, g is the gravity in m/s2 and φ is the pressure head in meters calculated with Equation (5) [21,26]:
φ = h z ,
where h is the hydraulic head and z is the elevation head at the given observation point P in meters.
The nominal and dynamic pore pressure (pst and pdyn) was calculated [31] at each point Pxz; based on that, the static pressure head (φst) is the depth below the water table, while the dynamic pressure head (φ(xz)dyn) is the difference in elevation between the point of measurement zxz, and the point of intersection of the water table with the passing hydraulic head contour.
The dynamic pressure increment (∆p) was calculated as the difference between nominal and dynamic pressure and used as an indicator of the vertical flow direction from the water table. A positive increment (+∆p) suggests an upward flow, whereas a negative increment (−∆p) suggests a downward flow [26,62].

2.3.4. Geochemical Modelling

The analytical accuracy of the measurements of cations and anions in the water samples was obtained from the ionic balance error (IBE) within a limit of ±5% [63]. It was computed in milliequivalents per liter (mEq/L) as follows in Equation (6):
IBE = [ ( TC TA ) / ( TC + TA ) ] × 100 ,
where TC is the sum of the total cations and TA is the sum of the total anions.
Hydrochemical facies were defined with a Piper plot [64]. The Total Dissolved Solids (TDS) values were calculated to present the general chemical characteristics of the groundwater. The ratio of major ions was investigated to approximate the water–rock interaction processes, including mineral weathering and ion exchange. The Ca2++Mg2+/HCO3− +SO42− ratio was calculated in mEq/L. Values smaller than 1 refer to silicate weathering or ion exchange (Equation (7); meanwhile, values greater than 1 indicate carbonate weathering or reverse ion exchange (Equation (8) [65].
2 Na + + 2 CaX 2 Ca 2 + + 2 NaX ,
Ca 2 + + 2 NaX 2 Na + + CaX 2 ,  
The mineral saturation in the groundwater of the aquifer system was determined by calculating the Saturation Index (SI) [66] for calcite, dolomite, aragonite, gypsum and halite using PHREEQC [29] according to Equation (9):
SI = log IAP K sp ,
where IAP refers to the ion activity product, and Ksp is the solubility product at a given temperature. If the value of the saturation index equals zero, the water is in a chemical equilibrium state with the mineral. A positive value of SI indicated that the groundwater is oversaturated, while a negative value refers to it being undersaturated concerning the mineral species. The spatial distribution maps of the analyzed geochemical variables were plotted by interpolation of the data using the Kriging Method [60] performed in Surfer 25.1.229.

2.3.5. Multivariate Geostatistical Analysis

The two-dimensional relationships between the physicochemical parameters were analyzed by Spearman’s correlation matrix [67]. Meanwhile, Principal Component Analysis (PCA) was used as a preprocessing step before clustering performance to minimize information loss, reduce the dimensionality and decrease the noise of the large datasets [31,68]. Only components with eigenvalues greater than 1 were selected for varimax rotation and subsequent interpretation [69]. Then, the K-means clustering algorithm [70] was implemented for the exploration of hydrogeochemical patterns based on geochemical similarities. Mathematically, it is expressed by Equation (10):
J = j = 1 k i = i n || x i ( j ) c j || 2 ,  
where J represents the objective criterion; xi denotes the analyzed objects for I = 1, …, n; and cj represents the cluster centroid indexed by j = 1, …, k, where k is the optimal number of clusters. The optimum number of clusters (k) was determined by the Elbow curve method [70]. The multivariate statistical analysis of the data was performed using Python.

3. Results and Discussion

3.1. The Geometry of the Groundwater Body and Its Hydrostratigraphic Units

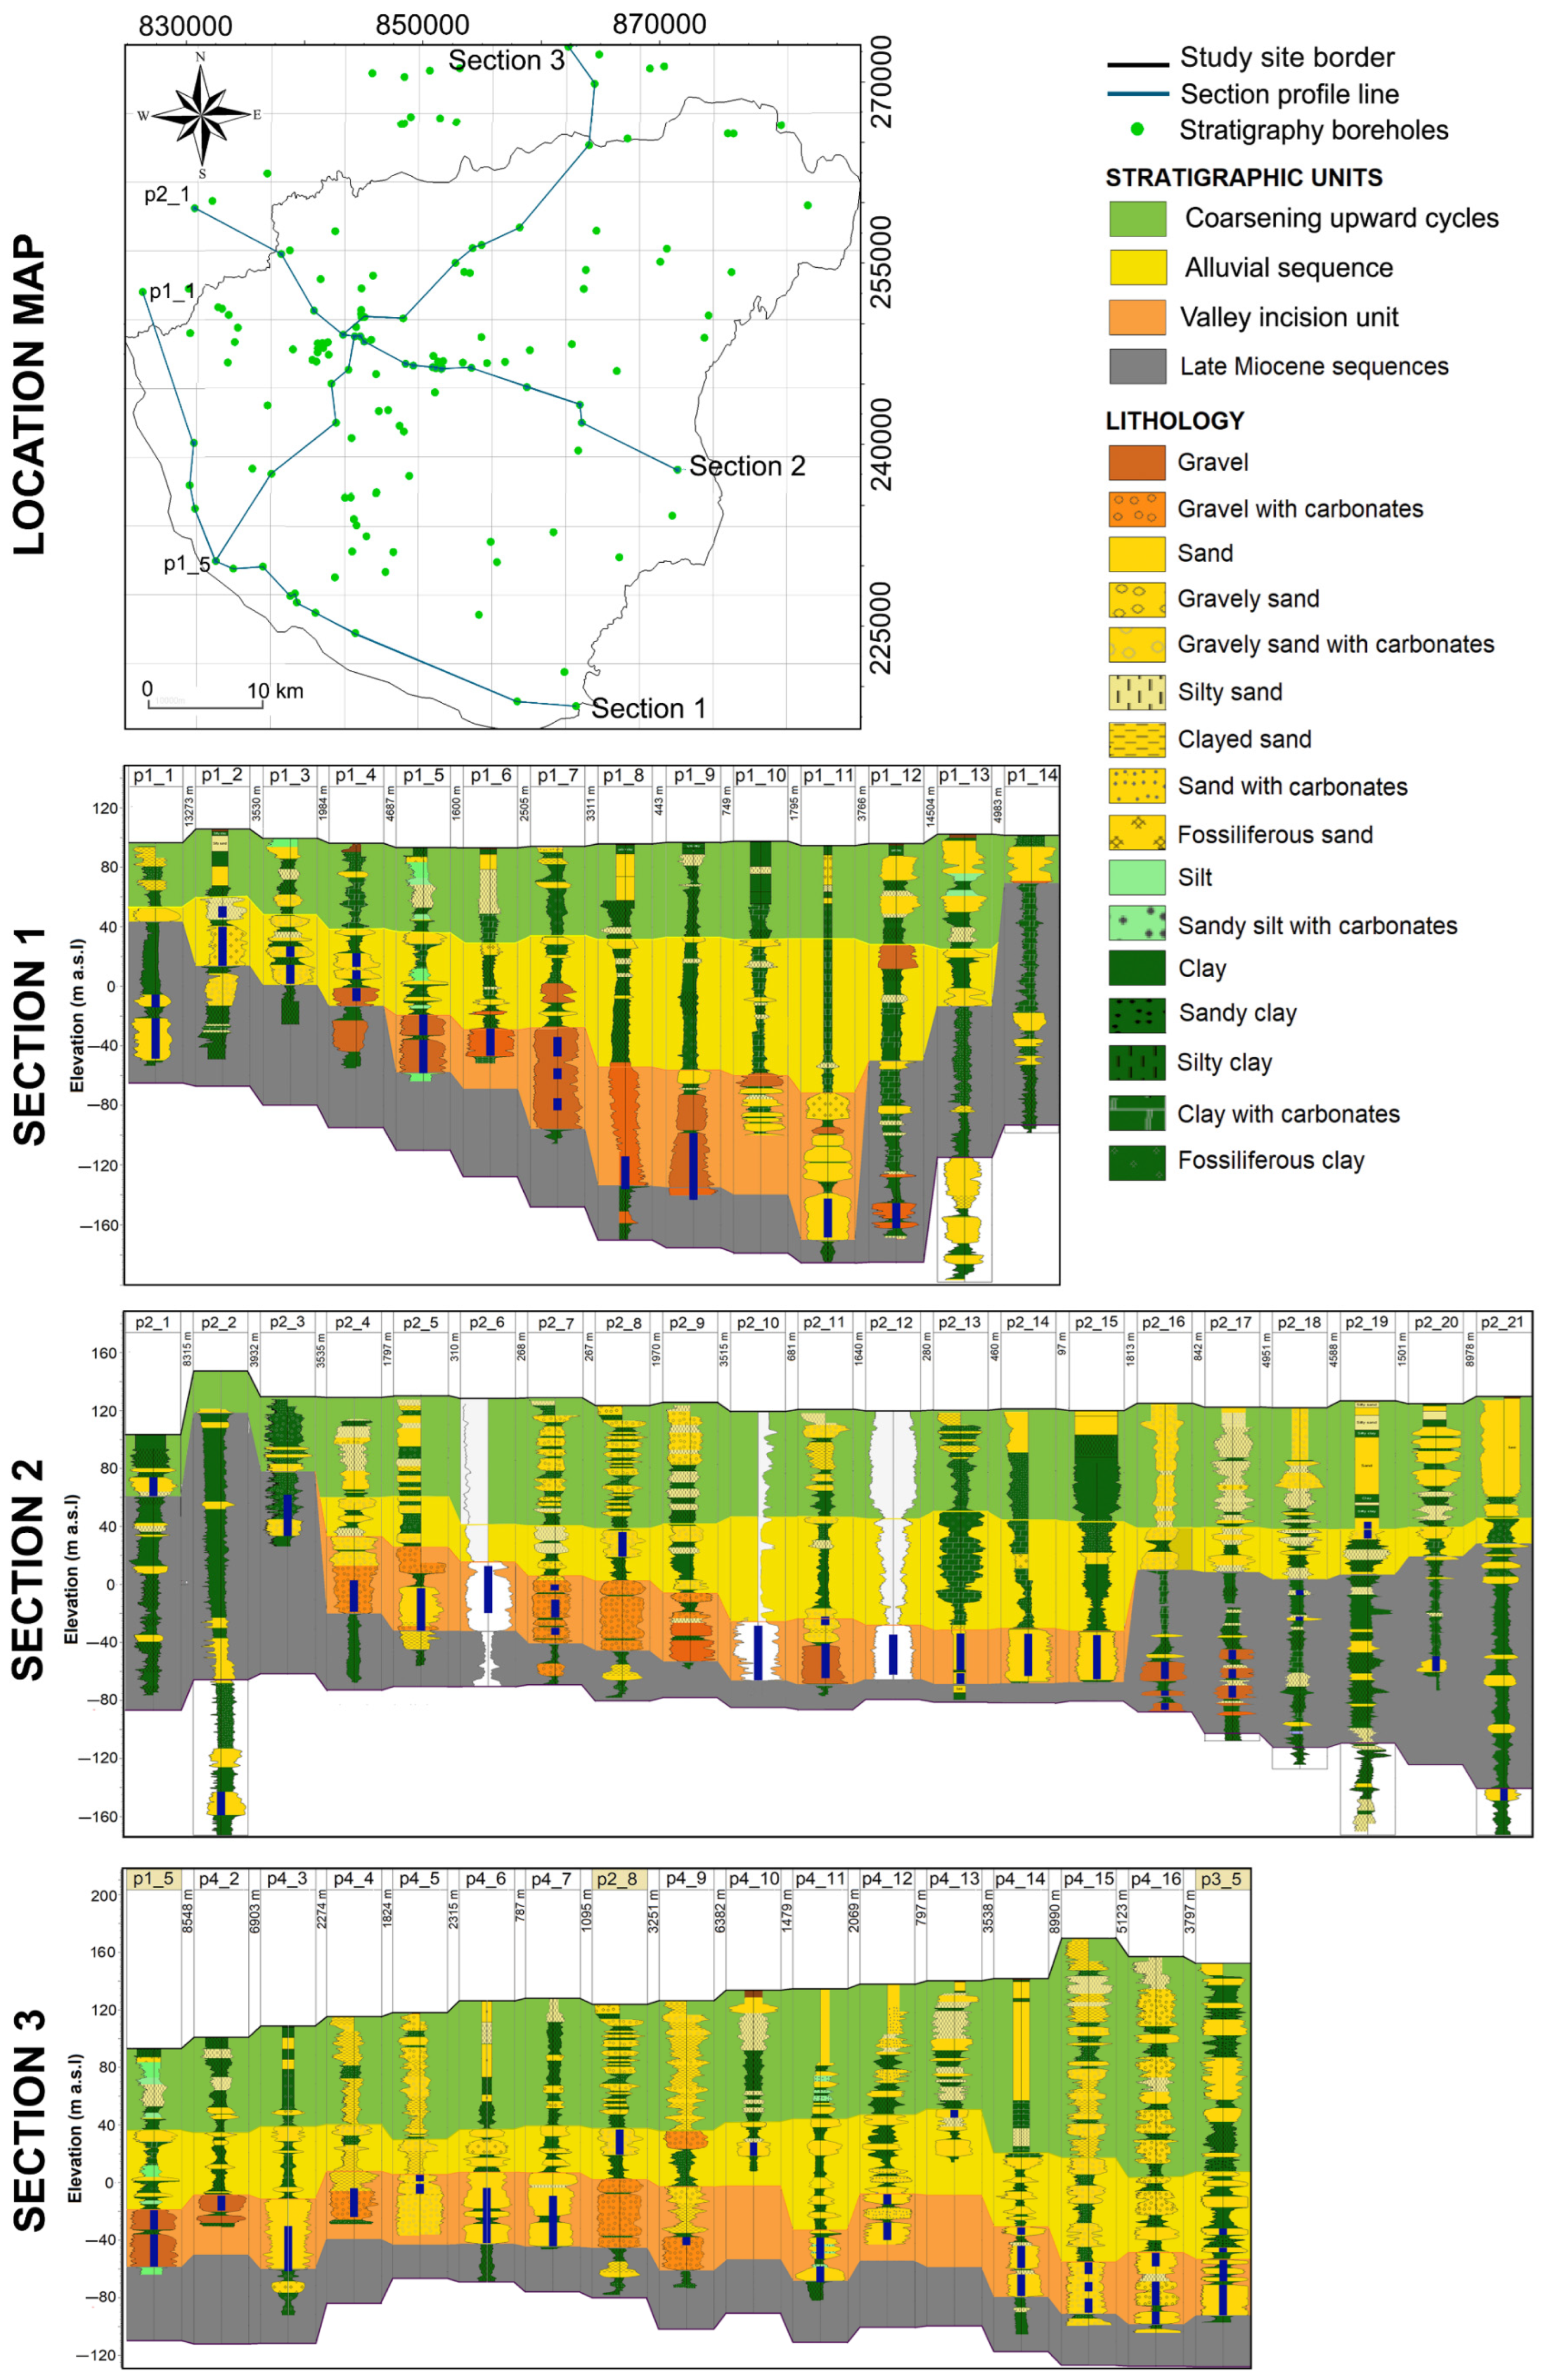
The Southern-NHGWB stratigraphic model included the three-dimensional geological description of an approximately 280 m deep section of Quaternary and Late Miocene sedimentary deposits at the study site. A total of 18 cross-sections were created for stratigraphic correlation, ensuring the interconnection between the 133 well-log data points. To illustrate, three cross-sections are depicted in Figure 4.
This investigation identified evidence of four stratigraphic units based on changes in the grain size, erosional basal contact, sedimentary structure and bedding thickness values. The description of them was constructed from the available from wire-line log records.
The Late Miocene Unit (LMU) is the lowermost hydrostratigraphic unit and basal boundary of the flow domain, with a modeled thickness ranging from 10 m to 240 m as shown in Figure 4. The top surface is located within the Late Miocene sediments of the Zagyva Unit; however, the total depth of the LMU is not represented by the interpreted data. The coarse deposits fine upward from medium sand to silty sand with a thickness of 15–26 m. The fine deposits have an aggradation character of mixed silty and clay with a thickness greater than 50 m. According to the well logs, the hydrostratigraphic unit comprised 42% coarse-grained (sand and silty sand) and 58% fine-grained (silty clay) materials.
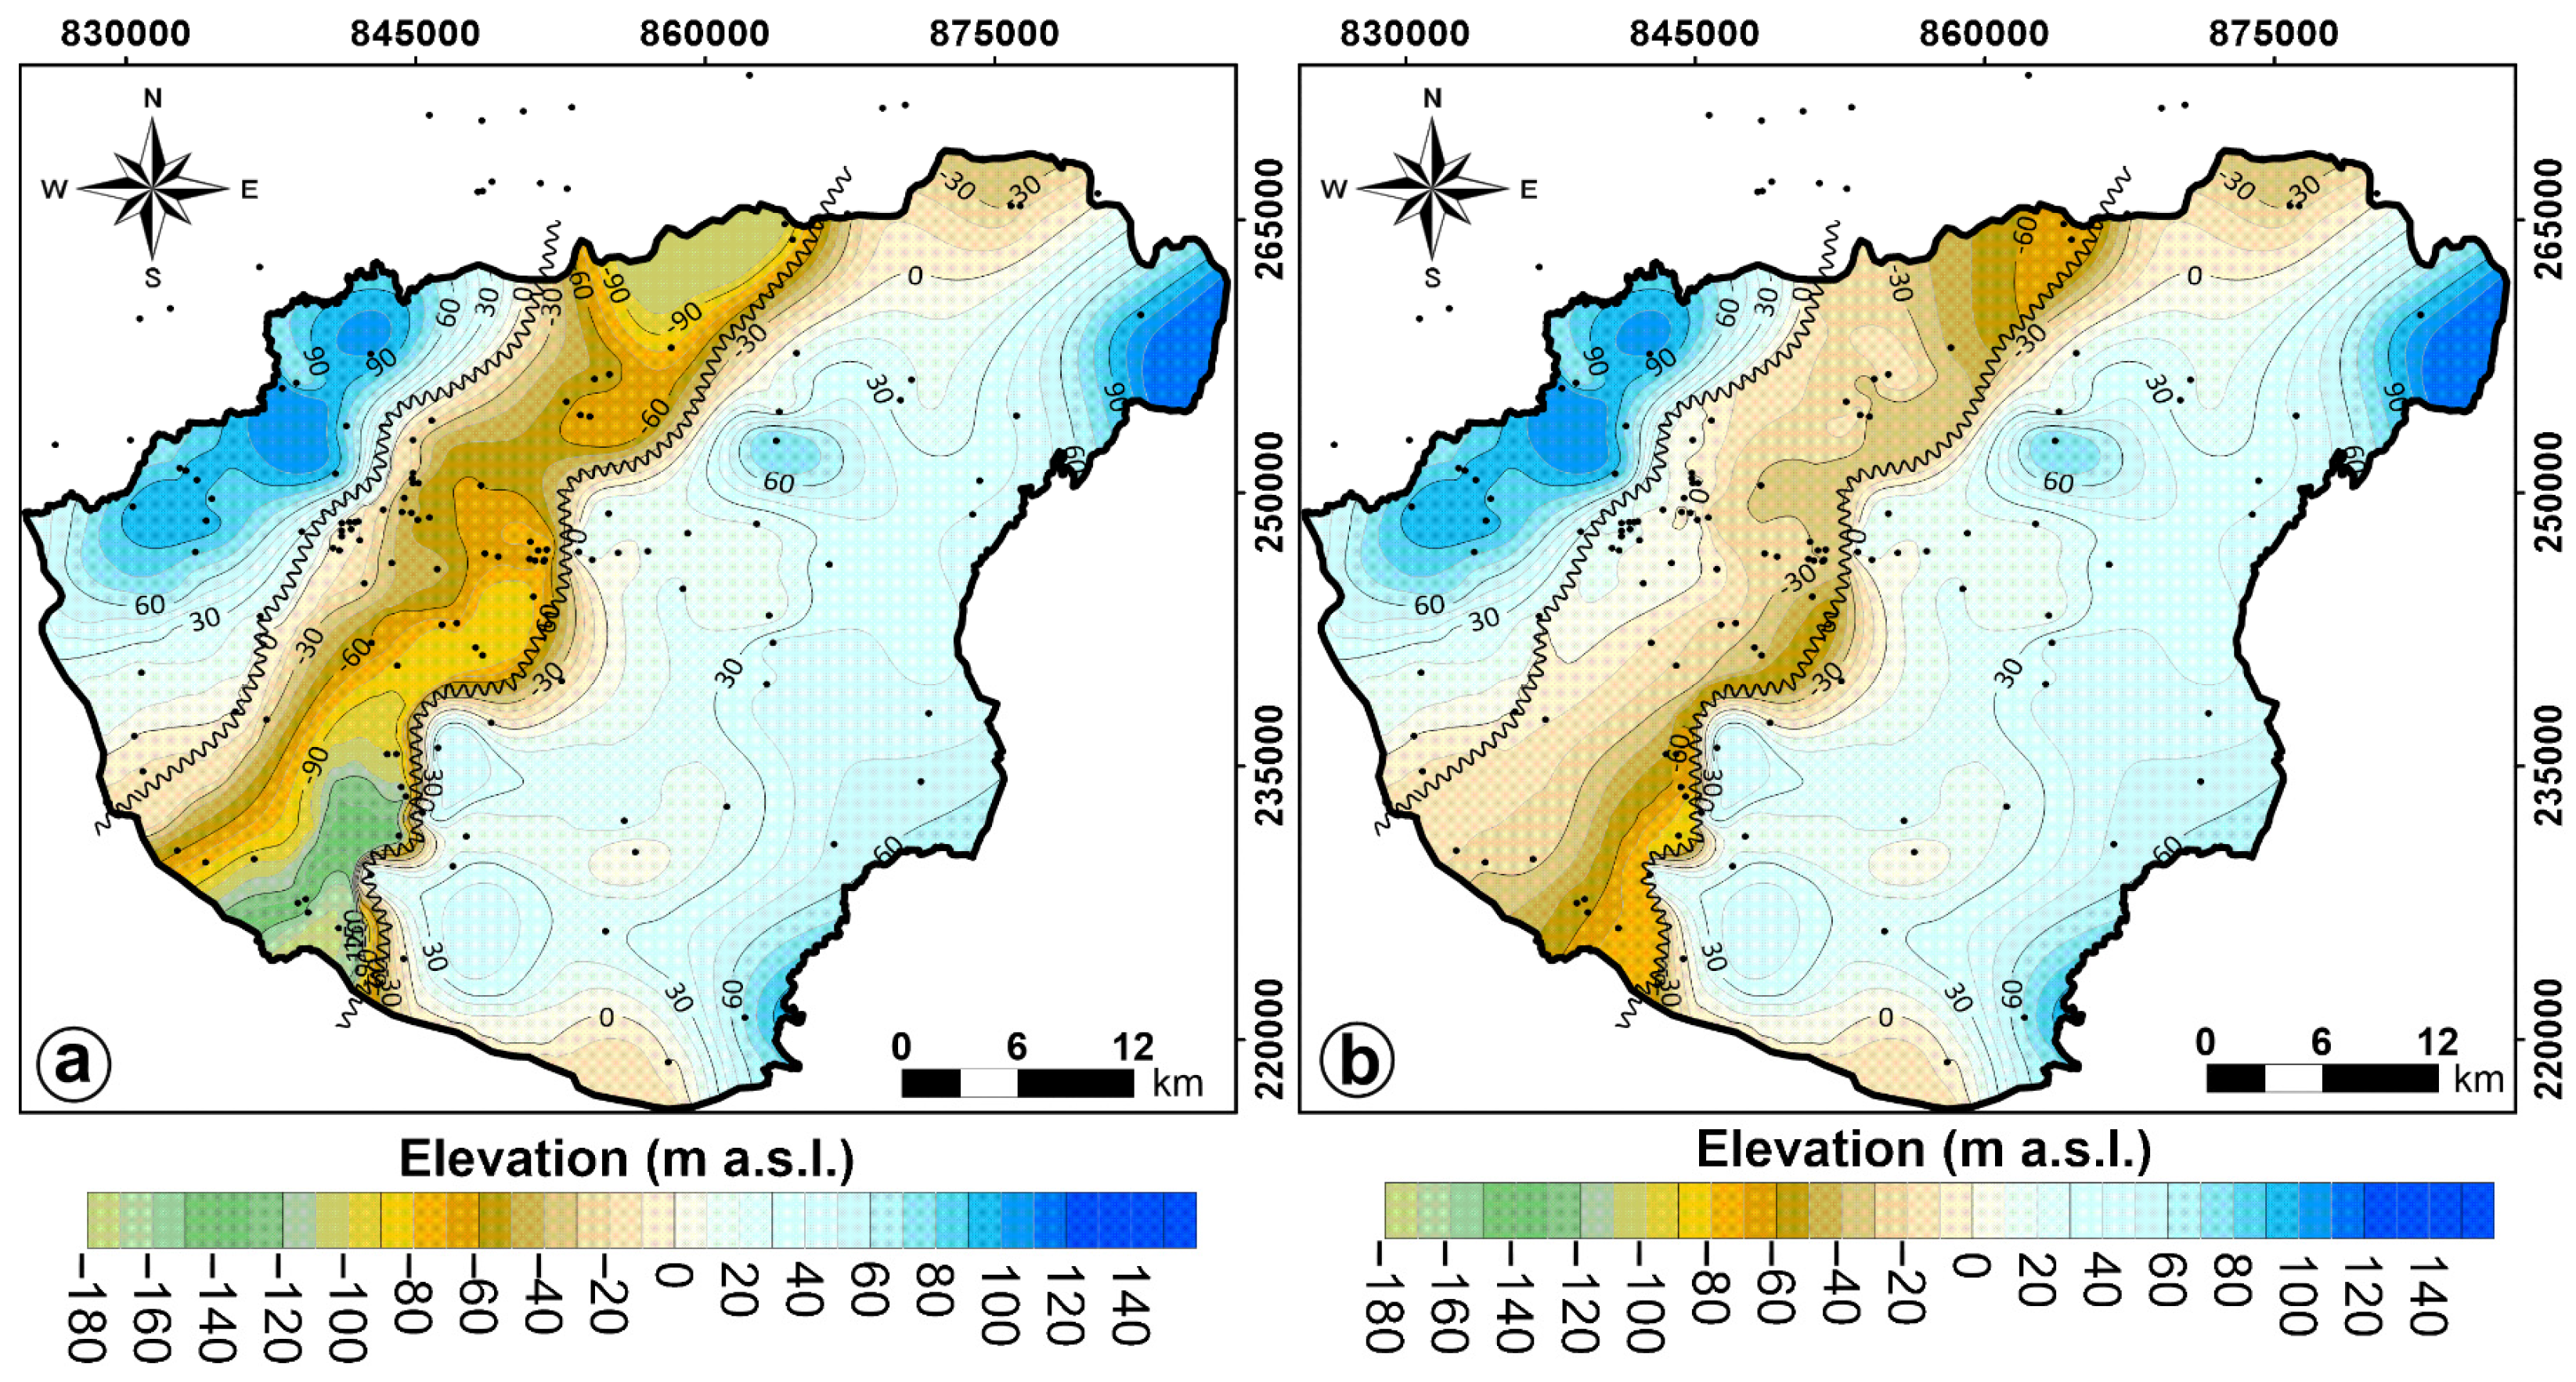
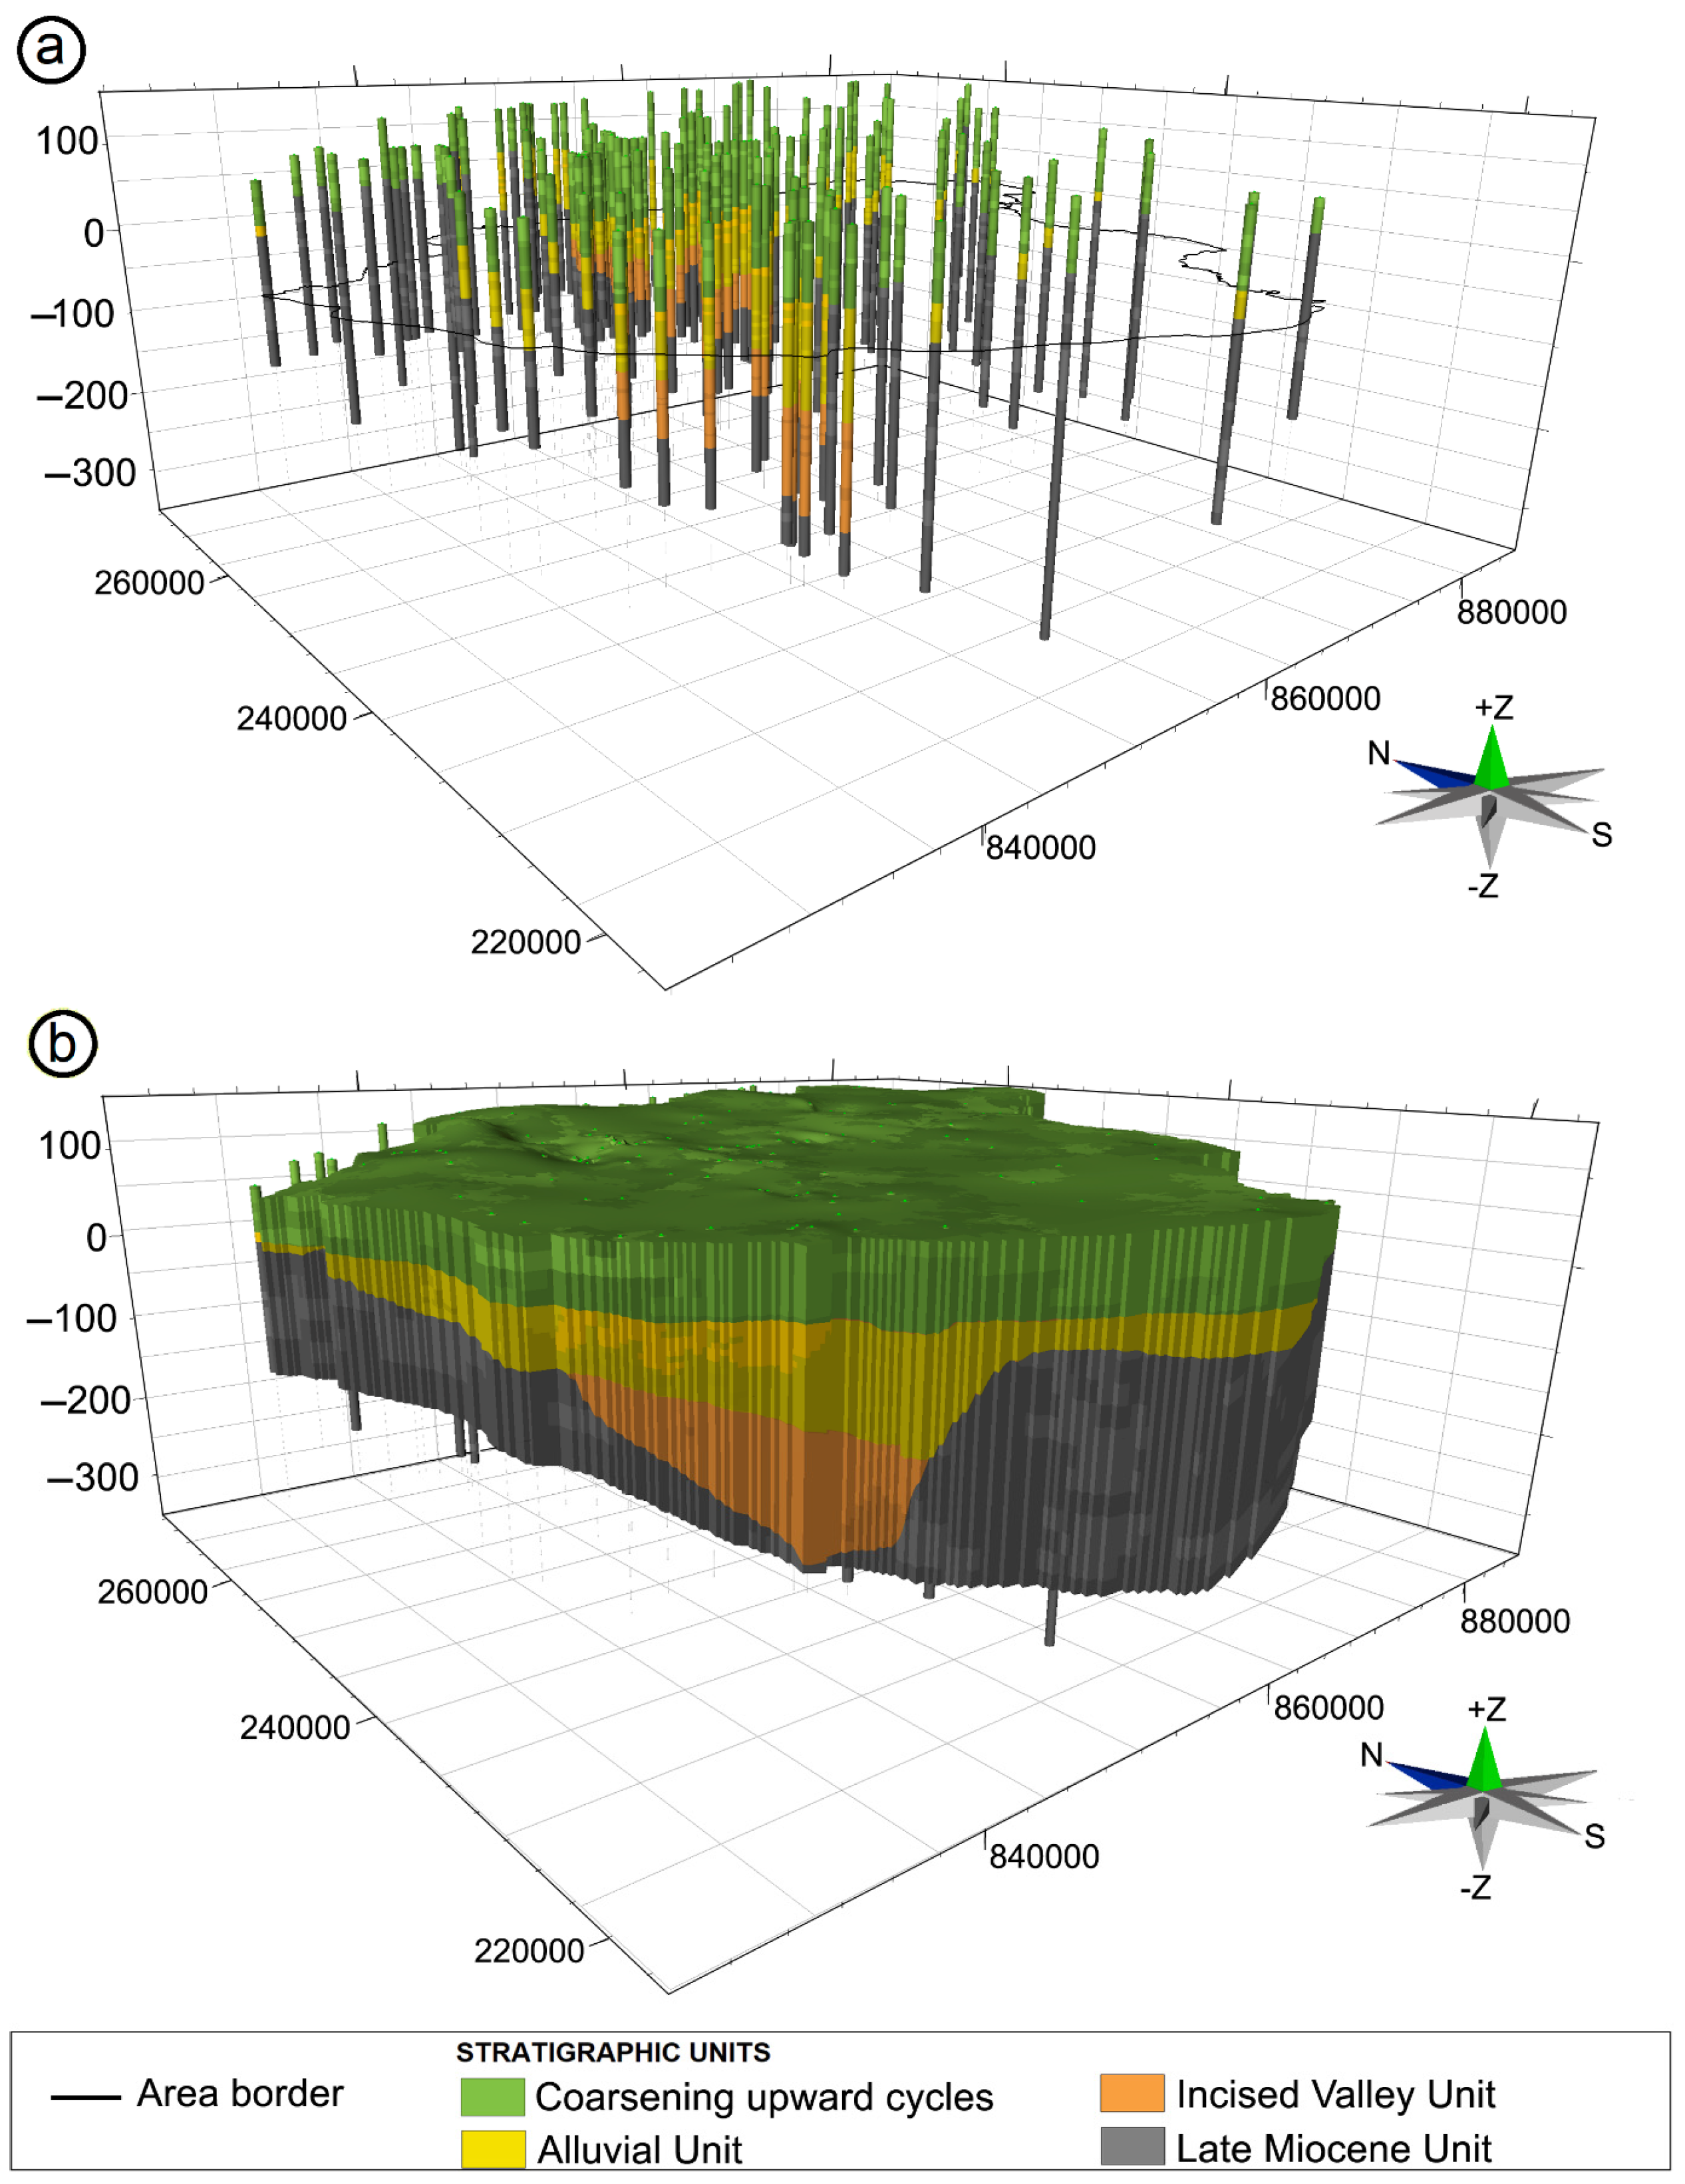
The Incised Valley Unit (IVU) is the major aquifer in the region with a thickness ranging from 20 m to 85 m as shown in Figure 4, Figure 5 and Figure 6. According to the regional correlations [51], its age is Lower Pleistocene ( ~ 2.5–1.9 Ma). Its isopach data revealed a coarse sand body of 10 km to 13 km wide, elongated shape striking NNE–SSW and deposited in stratigraphic discontinuity over the Late Miocene sediments (Figure 5). The results of the stratigraphic interpretation made clear that coarse sediments of this unit fill up an incised valley eroding the LMU (Figure 5 and Figure 6), characterized by channel deposits of vertically stacked shapes, which are typical for channel complexes of anastomosing watercourses or translational meander development [71]. According to well-logs, it is dominated by 98% of coarse-grained sediments (coarse sand and gravel), and with almost complete absence of fine-grained sediments (clay).
The Alluvial Unit (AU) is a regional non-continuous extended semi-permeable aquifer with a thickness of 15 m to 100 m as shown in Figure 4 and Figure 6. According to the regional correlations [51], its age is Lower Pleistocene ( ~ 1.9–1.2 Ma). The boundary surface between the AU and the IVU was consistently picked in the logs at the first occurrence of several-meters-thick overbank deposits above the relatively flat top of the multiple channel complex series as seen in Figure 4. The AU is characterized by a general occurrence of overbank deposits that make up to 47% of the unit volume. The single channel complexes, wherein the sand bodies exhibit fining upward porosity characteristic feature of meandering systems, account for up to 53% of the sediments.
The Coarsening Upward Unit (CUU) is an extensive hydrostratigraphic unit of thickness from 36 m up to 120 m and contains relatively highly permeable sand lenses as shown in Figure 4. According to the regional correlations [51], its base corresponds to the Mid Pleistocene Transition ( ~ 1.2 Ma) and extends still today; however, perhaps with a few high frequency unconformities. The findings of this research showed that 50% of the sediments are reported as coarse-grained (sand and fine sand) and 50% are described as fine-grained sediments (silt and clay). The CUU is the unconfined semi-permeable top aquifer layer of the system.
The above findings indicated that the Southern-NHGWB is a regional cross-formational porous aquifer system, extending from the Late Miocene to the quaternary land surface sediments (Figure 6). The lithologic and stratigraphic considerations suggested that the LMU, AU and CUU differ from the IVU due to the general occurrence of fine-grained sediments (Figure 4). The vertically stacked character of the logs along the multiples channel complexes in the IVU presented in Figure 4 implies low anisotropy and high rate of facies continuity.
Conversely, the overlying and underlying hydrostratigraphic units (Figure 5b) are characterized by higher anisotropy and limited continuity of thinner coarse-sediment bodies, the fining upward stacked occurrence, which is caused by inclined heterolytic complexes consisting of couplets of clay intercalations and fine sand layers [72].
These results surpassed previous geological and hydrogeological interpretation reports, revealing a significant geological heterogeneity of particular interest when models are expanded from regional to local scales. It is worth noting that the stratigraphic discontinuity between the IVU and LMU can be mistaken for other types of linear mathematical unconformities, as demonstrated by Szany [36]. In line with the same study, the vertical compartmentalization of the Quaternary aquifer system was confirmed, occurring not only at the local scale, but also at the regional scale, diverging from the representation of the Quaternary aquifer as a single hydrostratigraphic unit in the region, as was proposed by Marton [35]. Naturally, this study has minor limitations, including the horizontal uncertainty associated with the well-log correlation technique. However, it is important to emphasize that the evidence presented here relies on the correlation of the observed geometry with the patterns of hydrogeological variables analyzed below.

3.2. Hydraulic Parameters

The estimation of hydraulic conductivity and specific capacity was performed using data from 300 wells, classified based on the location of their screens. Specifically, there were 70 wells screened in the CUU, 45 in the AU, 105 in the IVU and 80 in the LMU.
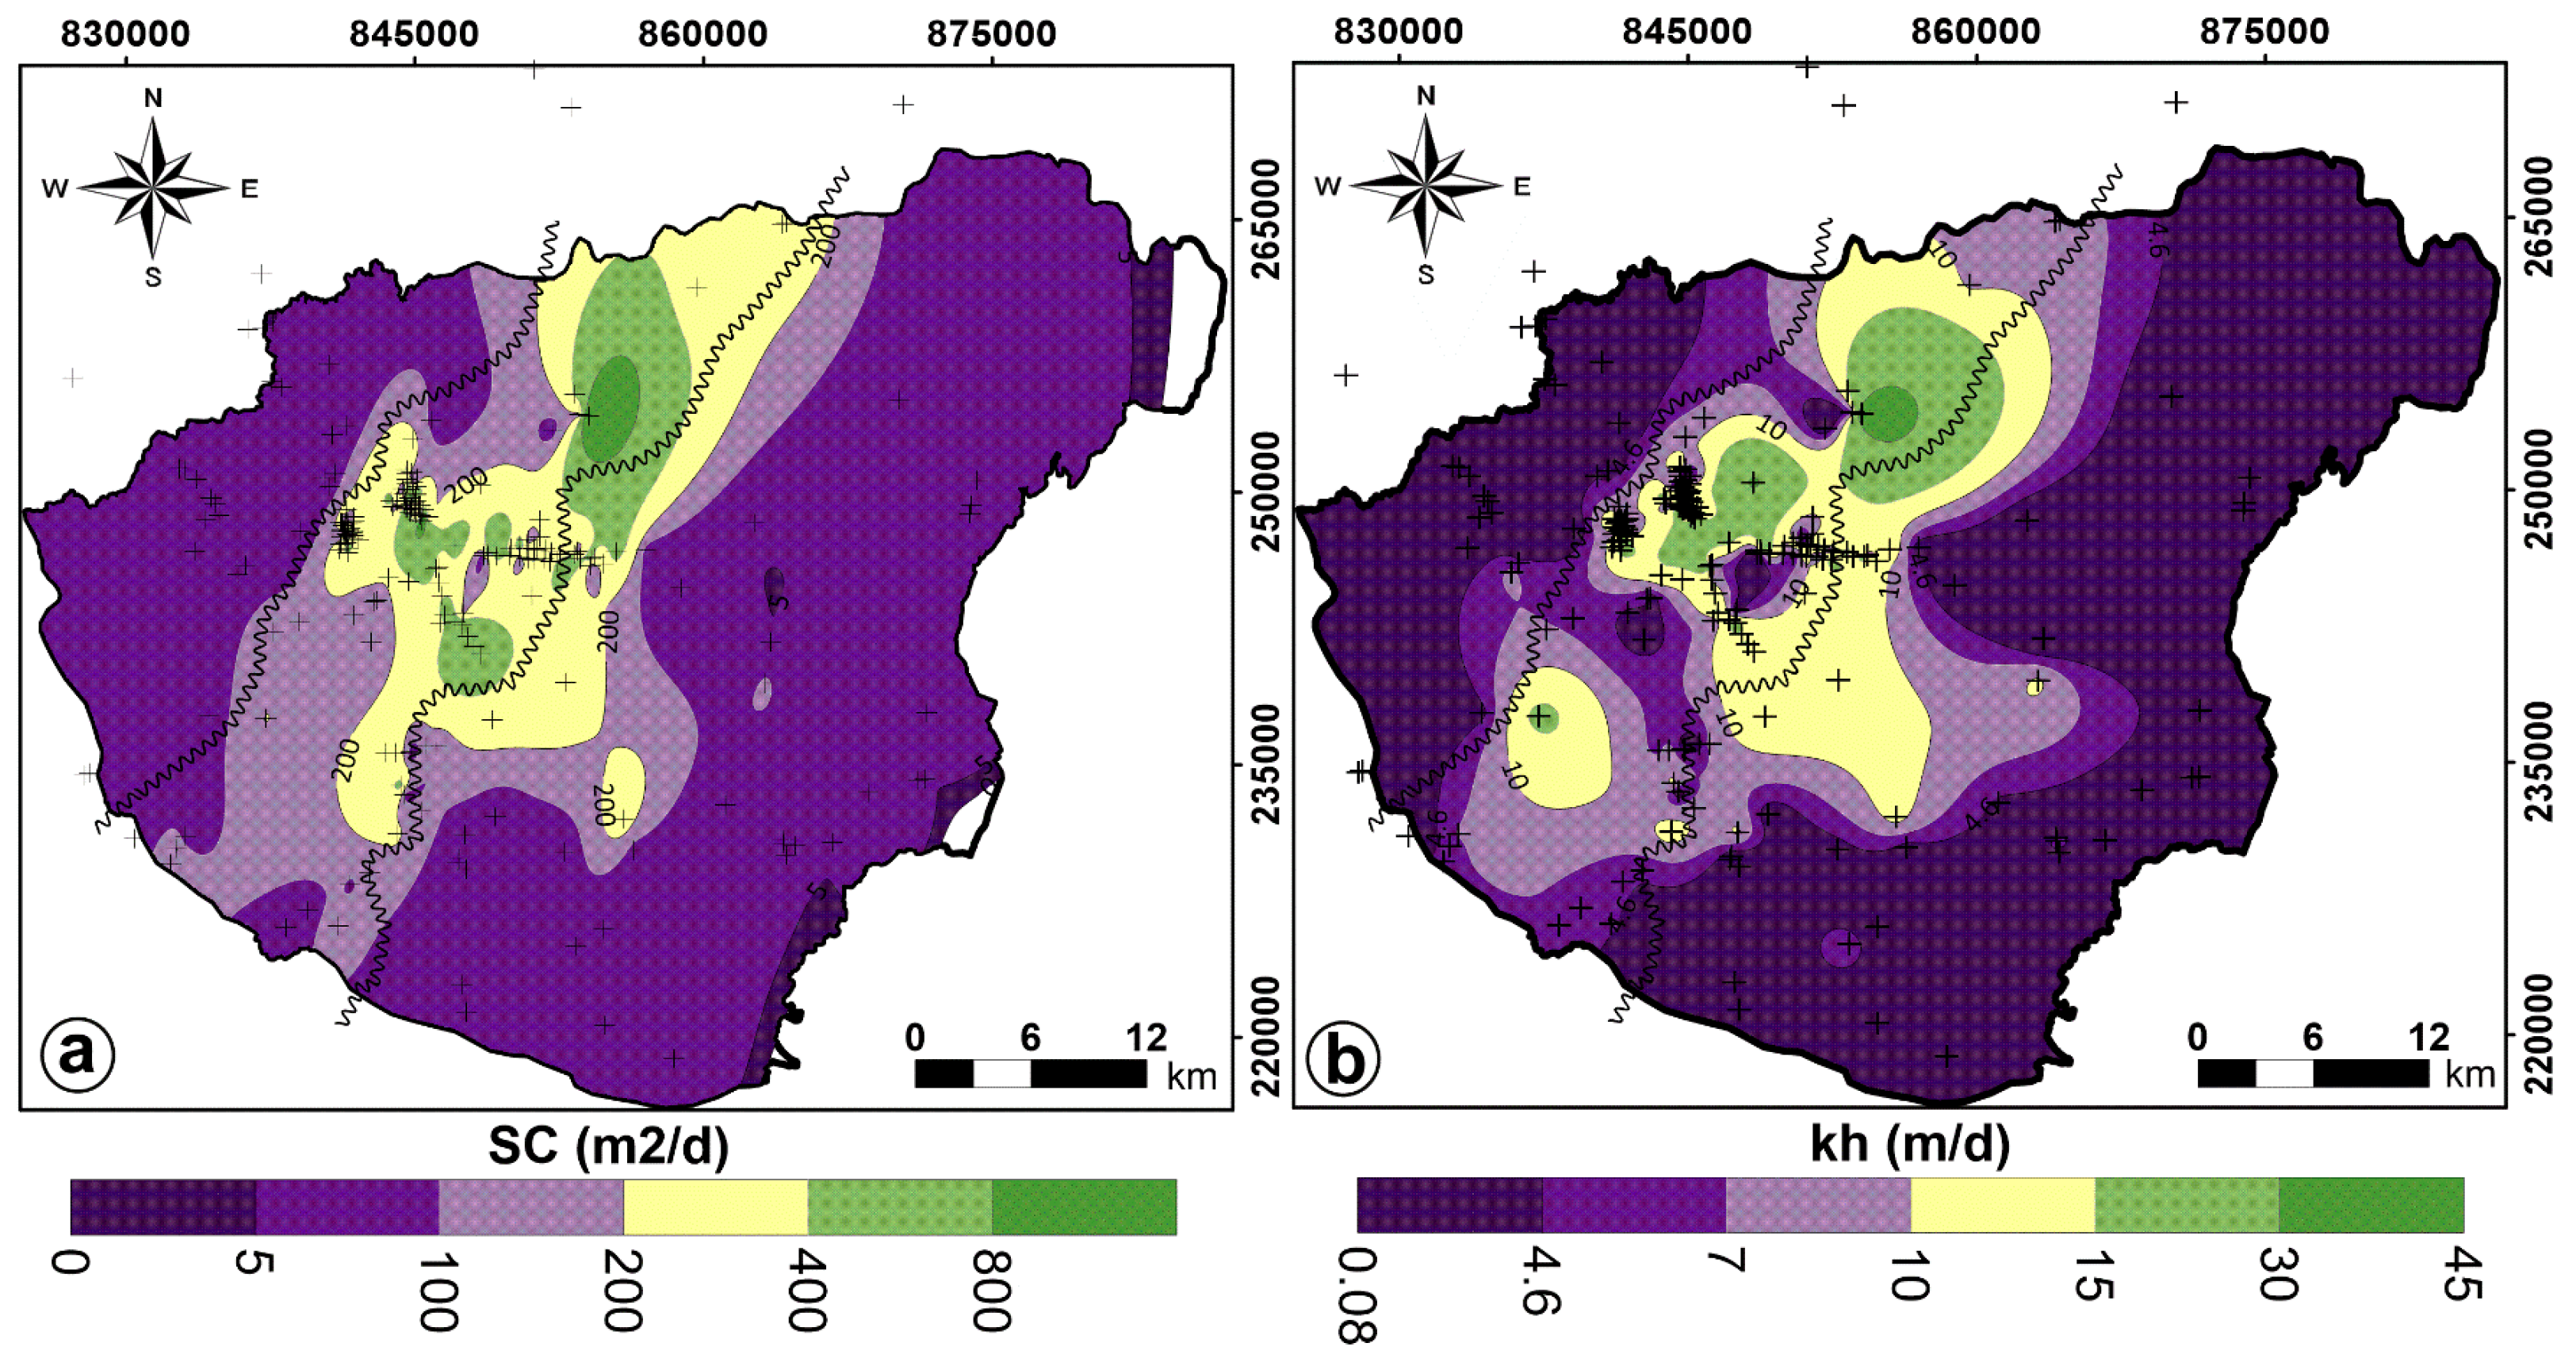
The range of the estimated apparent horizontal hydraulic conductivity (kh) values for the coarse-grained lithologies in the study domain ranged from 0.1 to 43 m/d, as shown in Figure 7a. Wells that screen the IVU had an average value of 11 m/d, and exhibited a nearly normal distribution of the data. On the other hand, the LMU, AU and CUU exhibited average values of 4.6 m/d, 4.1 m/d and 3.2 m/d, respectively. The data for all three semi-permeable aquifers had a unimodal right-skewed distribution.
The specific capacity values across the region range from 1.34 to 790 m3/d/m, as depicted in Figure 7b. The wells screening the IVU exhibit an average specific capacity of 315.6 m3/d/m. In contrast, the average specific capacity of wells in the LMU, AU and CUU was 92 m3/d/m, 53.8 m3/d/m and 31.6 m3/d/m, respectively. The distributions of all datasets are unimodal and right-skewed.
The estimation of the apparent horizontal hydraulic conductivity (kh) reveals that the IVU is one order higher flux conductive than the surrounding hydrostratigraphic units, and the normal distribution of the dataset aligned with the previous observation related to sediment homogeneity, porosity, and grain size in the IVU. Furthermore, the specific capacity of wells screened in the IVU is 3.5 to 10 times higher than those in the other semi-permeable aquifers, suggesting superior transmissivity, and, consequently, higher Darcy’s velocity.
Examining the spatial distribution pattern of the apparent hydraulic conductivity and specific capacity (Figure 8) at the main aquifer depth, it corresponds with the geometry of the main aquifer. Additionally, the proposed geometry aligns with the research conducted by Marton and Szany [23] in Eastern Hungary regarding aquifer transmissivity at this depth. These findings provide strong evidence that the defined IVU functions as the main aquifer in the system, characterized by higher hydraulic parameters compared to the remaining semi-permeable aquifers.

3.3. Hydrodynamic Conditions

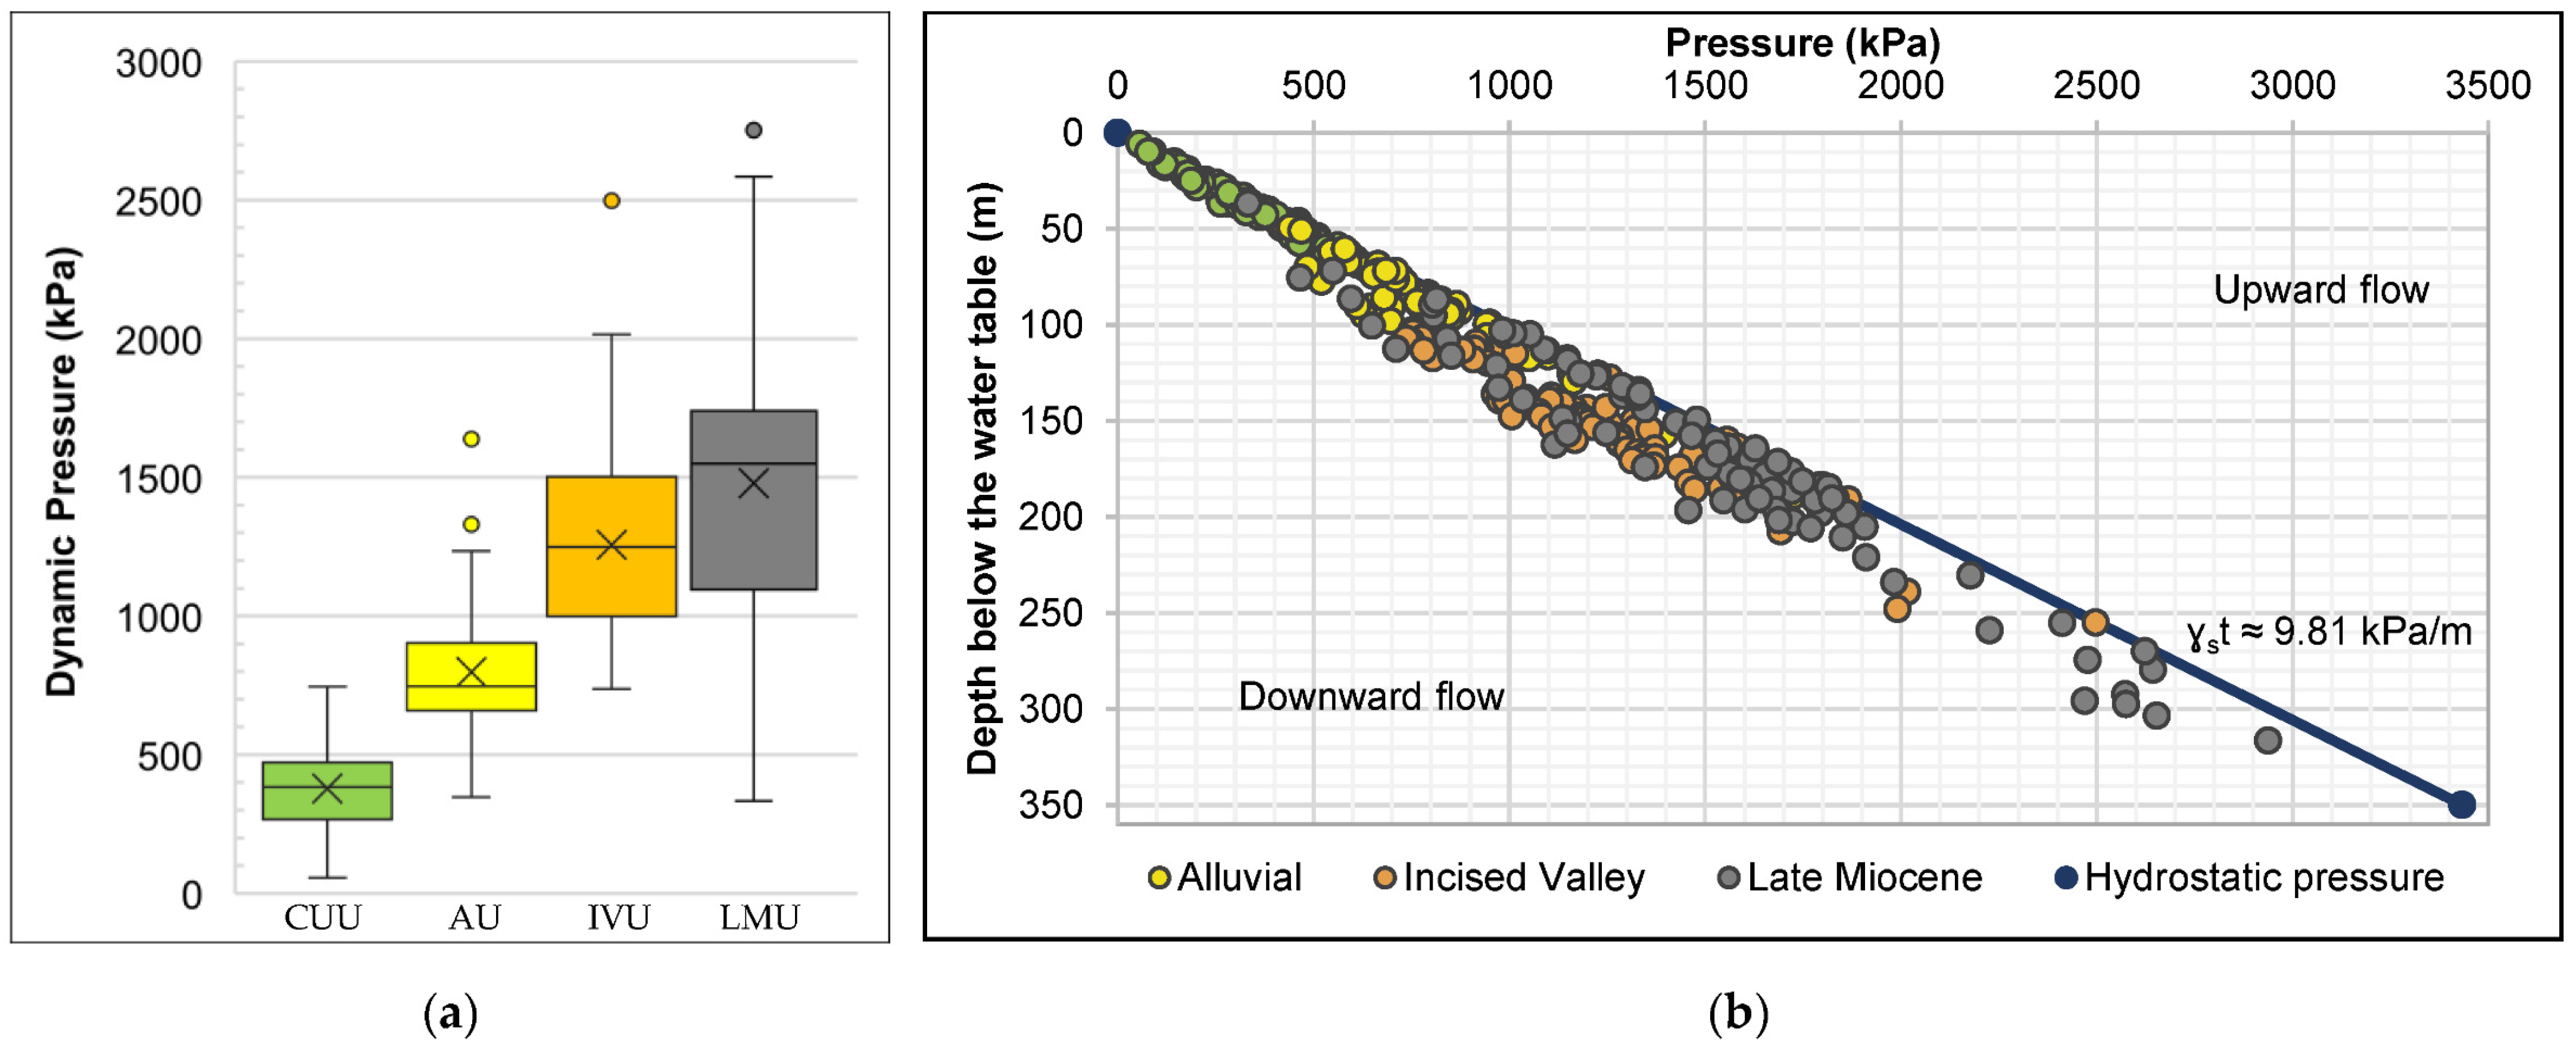
The dynamic pressure (pdy) was calculated using hydraulic head data from 366 wells. The samples were categorized based on the location of their screens, with 115 wells screened in the CUU, 50 in the AU, 111 in the IVU and 90 in the LMU. The distribution and skewness of the data was presented in the box plot of Figure 9a. The pressure–depth profile (p(d)), illustrated in Figure 9b for all samples, assessed the vertical flow component within the aquifer system. The hydrostatic pressure, represented with an average pressure gradient of ɣst ≈ 9.81 kPa/m, served as the reference, reflecting the water table and the upper hydraulic limit of the system.
The average pressure gradient (ɣdy) was calculated from the slope of the linear tendency line of the dynamic pressure distribution (pdy) in each hydrostratigraphic unit. The average pressure gradient (ɣdy) exhibited values of 9.48 kPa/m for the CUU, 9.66 kPa/m for the AU, 9.15 kPa/m for the IVU and 9.19 kPa/m for the LMU. When comparing these results with the hydrostatic pressure gradient (ɣst = 9.81 kPa/m) [26,27], it became evident that the aquifer system generally experienced under-hydrostatic pressure conditions (ɣdy < ɣst). These findings followed the reported results of Marton [35], and Tóth and Almasi [27], referring the general hydraulic conditions of Nyírseg Region.
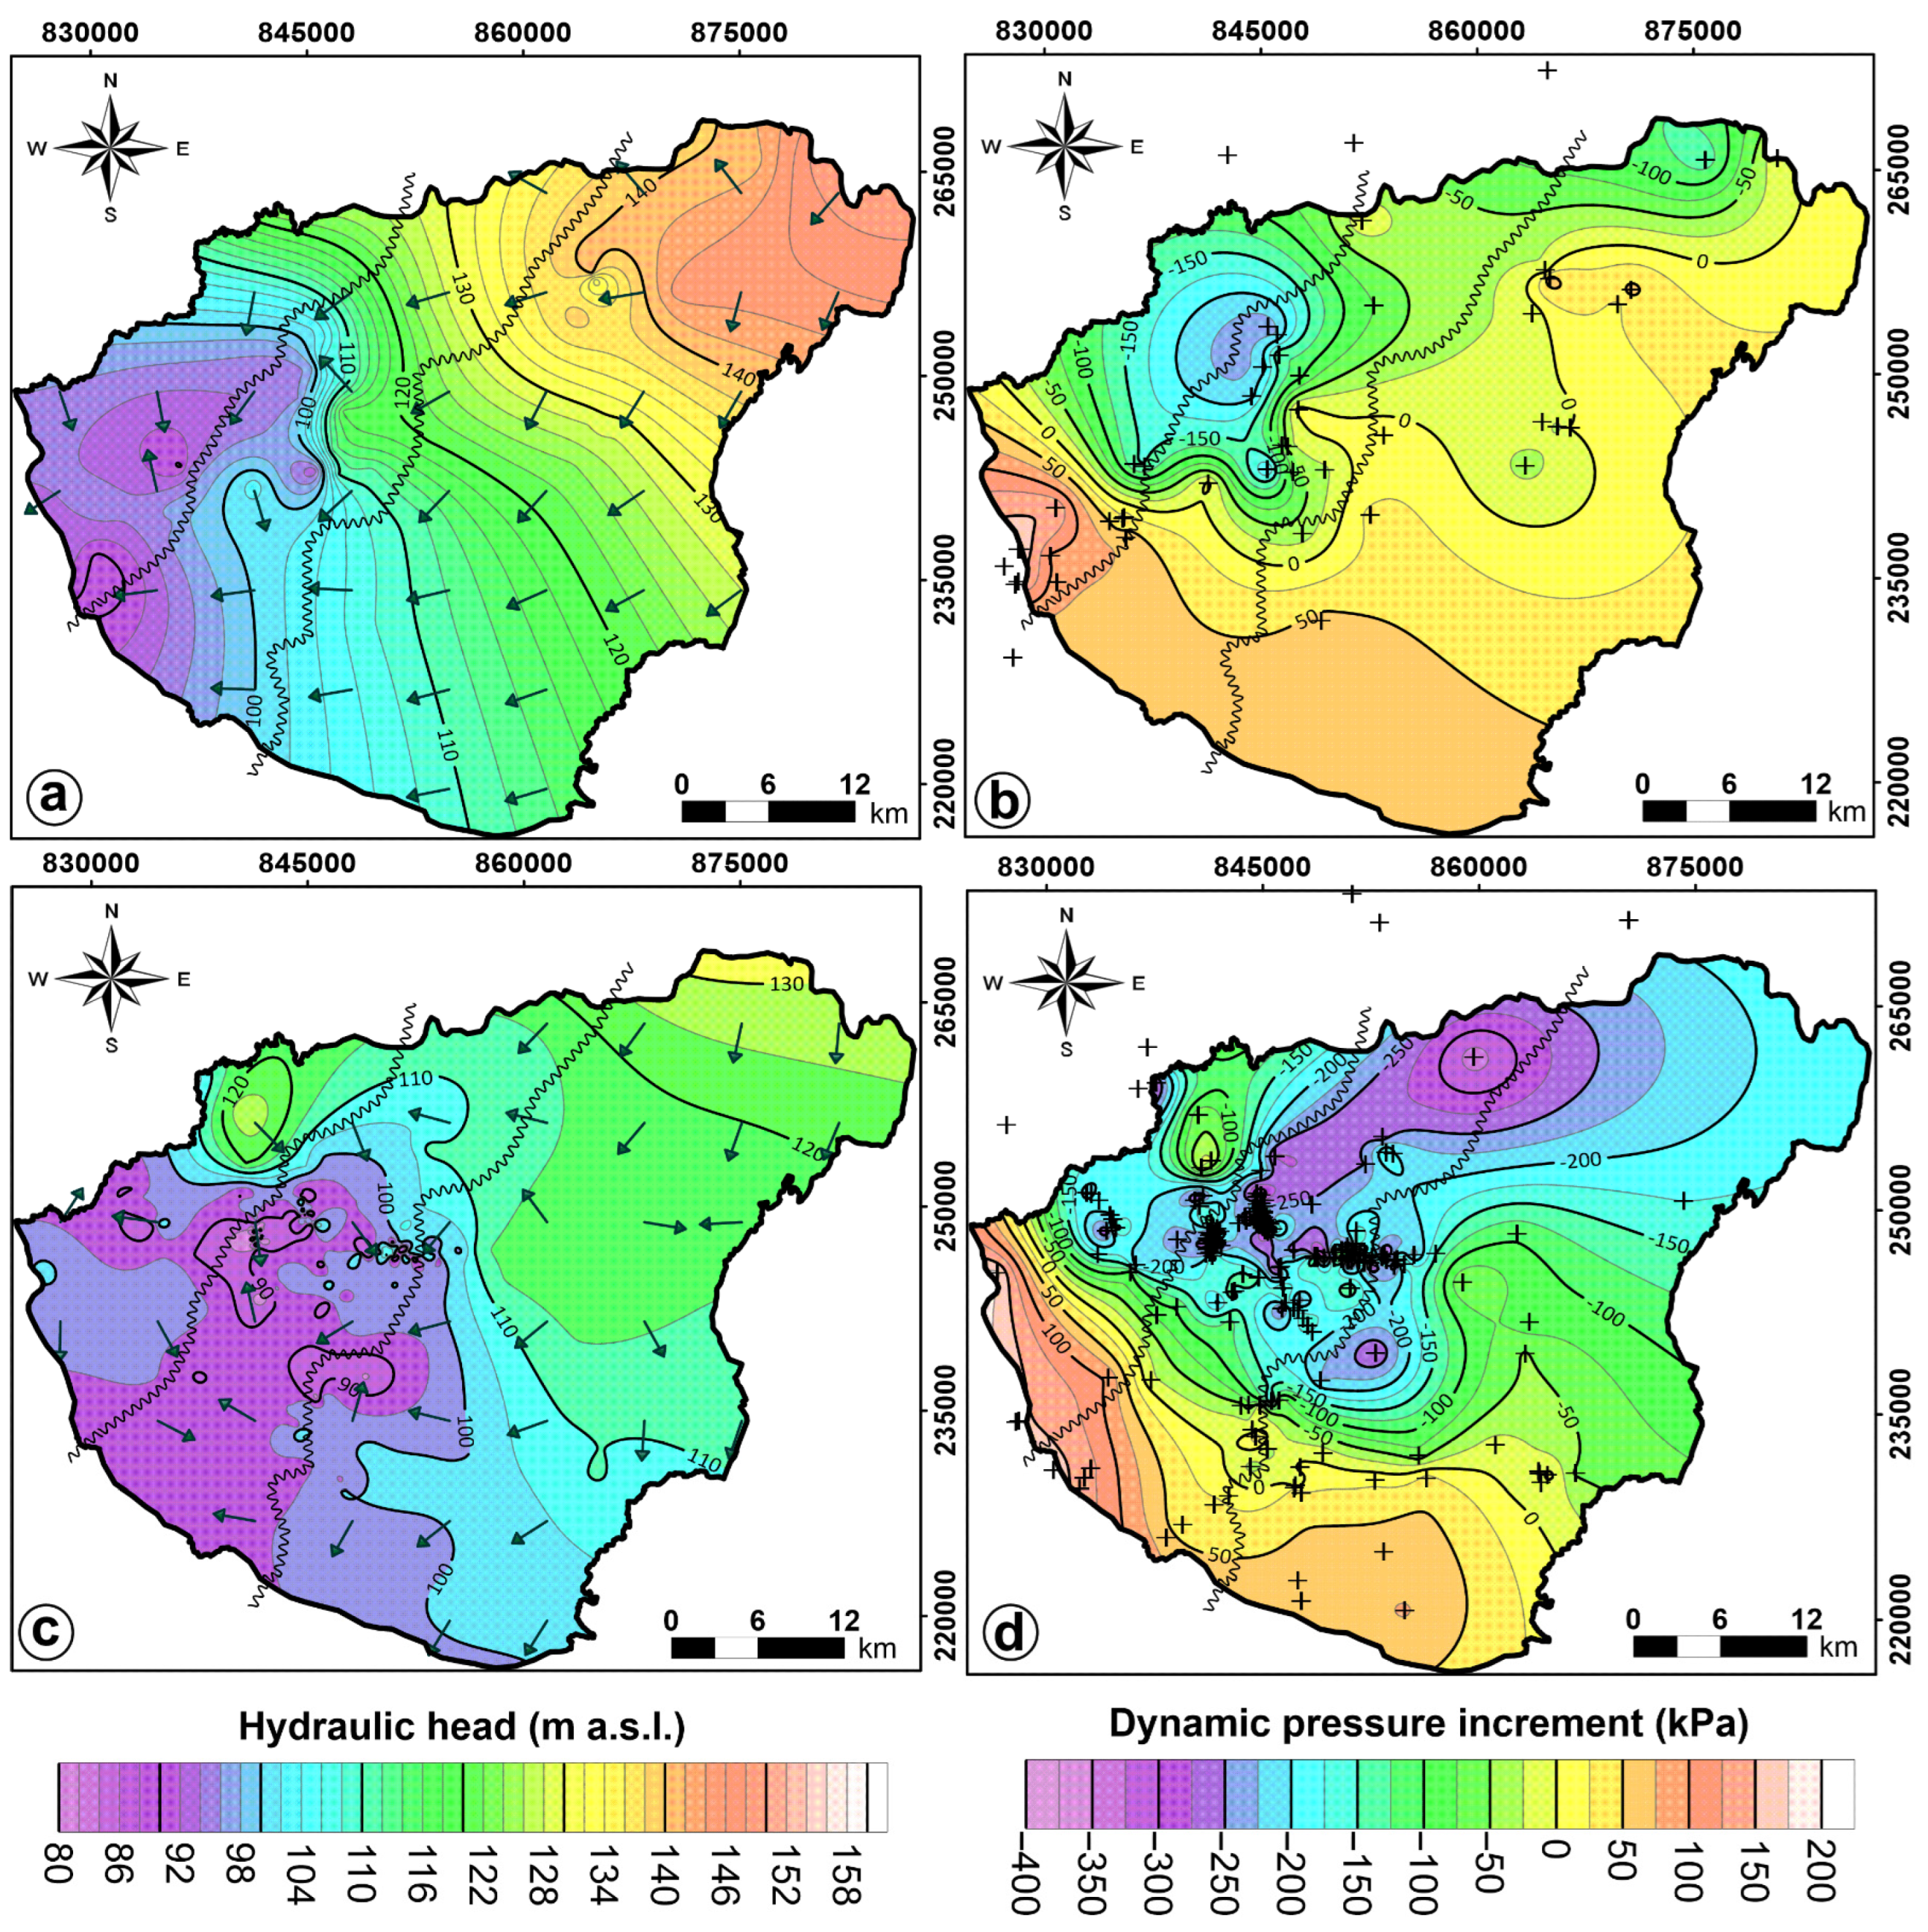
However, it was possible to identify that each hydrostratigraphic unit exhibited upward flow as well as horizontal flow directions in specific locations. Therefore, dynamic pressure increments (Δp) maps (Figure 10b,d) were generated to provide a comprehensive analysis of pressure variations between layers. These figures accurately illustrate the locations of the downward flow regime (−Δp), representing recharge areas, and the upward flow regime (+Δp), representing discharge areas within the hydrostratigraphic units. The 0 kPa/m demarcates the boundary between these areas.
The high production rates of the IVU, reported on the specific capacity data above, have noticeable effects on pressure, evidenced by its lower average dynamic pressure gradient (ɣdy), as shown in Figure 9. Additionally, the dynamic pressure maps indicated that these effects extend vertically up to the upper hydrostratigraphic unit (Figure 10b) and laterally into the LMU (Figure 10b,d), showing evidence for a hydraulic window in the central part of the study site, at the water extraction activities of the Debrecen Waterworks Sites. The finding of hydraulic interactions between layers could have significant effect on the chemical characteristics of the groundwater of the aquifer system with some differences and similarities.
Three potential maps were generated to analyze the horizontal water flow pattern within the hydrostratigraphic units. The potential map of the CUU illustrates the upper hydraulic boundary of the groundwater body in the study area, as depicted in Figure 10. Higher hydraulic heads were observed between Nyírlugos and Nyírgelse in the northeastern part of the region, while lower hydraulic heads were observed in the southwest around Hajdúszoboszló. The results reveal a regional flow direction from northeast to southwest, as depicted in Figure 11. Overall, these findings followed the findings reported by the research of Marton [35], and Tóth and Almasi [27].
In the potential map of the AU shown in Figure 10a, higher hydraulic heads were observed between Bocskaikert and Penészlek, passing through Nyíradony in the northeastern part of the region. Conversely, lower hydraulic heads were observed at two specific locations. The first location is in the west-central region, where the Debrecen Waterwork Sites operate, and the second location is in a depression between Hajdúszoboszló and Hajdúsovát.
Based on the stratigraphic interpretation presented in Figure 4 and Figure 6, the LMU and IVU exhibit similar depths at the Pxy points. Additionally, the pressure–depth plot in Figure 9, along with the dynamic pressure increment map (Figure 10d), provides evidence of the lateral hydraulic connection between the LMU and IVU. Consequently, a unified piezometric map was generated for both hydrostratigraphic units. Higher hydraulic head values were observed in the northwest, near Józsa, while lower values were sampled in the west-central part, where the city of Debrecen and its waterworks sites are situated (Figure 10b). It is noteworthy that water production in Debrecen impacts the distribution of hydraulic heads. The observed pattern suggests a greater influence along the NE–SW axis compared to the NW–SE axis (Figure 8c), indicating higher Darcy velocities within the IVU.
The hydraulic head maps plotted for the hydrostratigraphic units in the Southern NHGWB exhibit characteristics of a gravity-driven flow regime in a regionally unconfined system [27,35]. The flow regime shows a downward flow direction in the hilly area of the northeast and an upward flow direction in the lowlands near the East Main Canal. However, the high production rates from the IVU create a local hydraulic disturbance in the regional head distribution. This disturbance influences the hydraulic head distribution of the AU, resulting in a radial depression cone geometry (Figure 10a). On the other hand, the head distribution of the Incised Valley Unit and Late Miocene Unit is disrupted by a pronounced ellipsoidal depression cone geometry (Figure 10b). The regional horizontal flow direction presented in this research aligns with the one depicted by Marton [35]; however, the vertical interpretation of the flow is presented as conforming to the newly proposed hydrostratigraphic framework of the conceptual model.

3.4. Geochemical Evidence of the Hydraulic Effects of the IVU

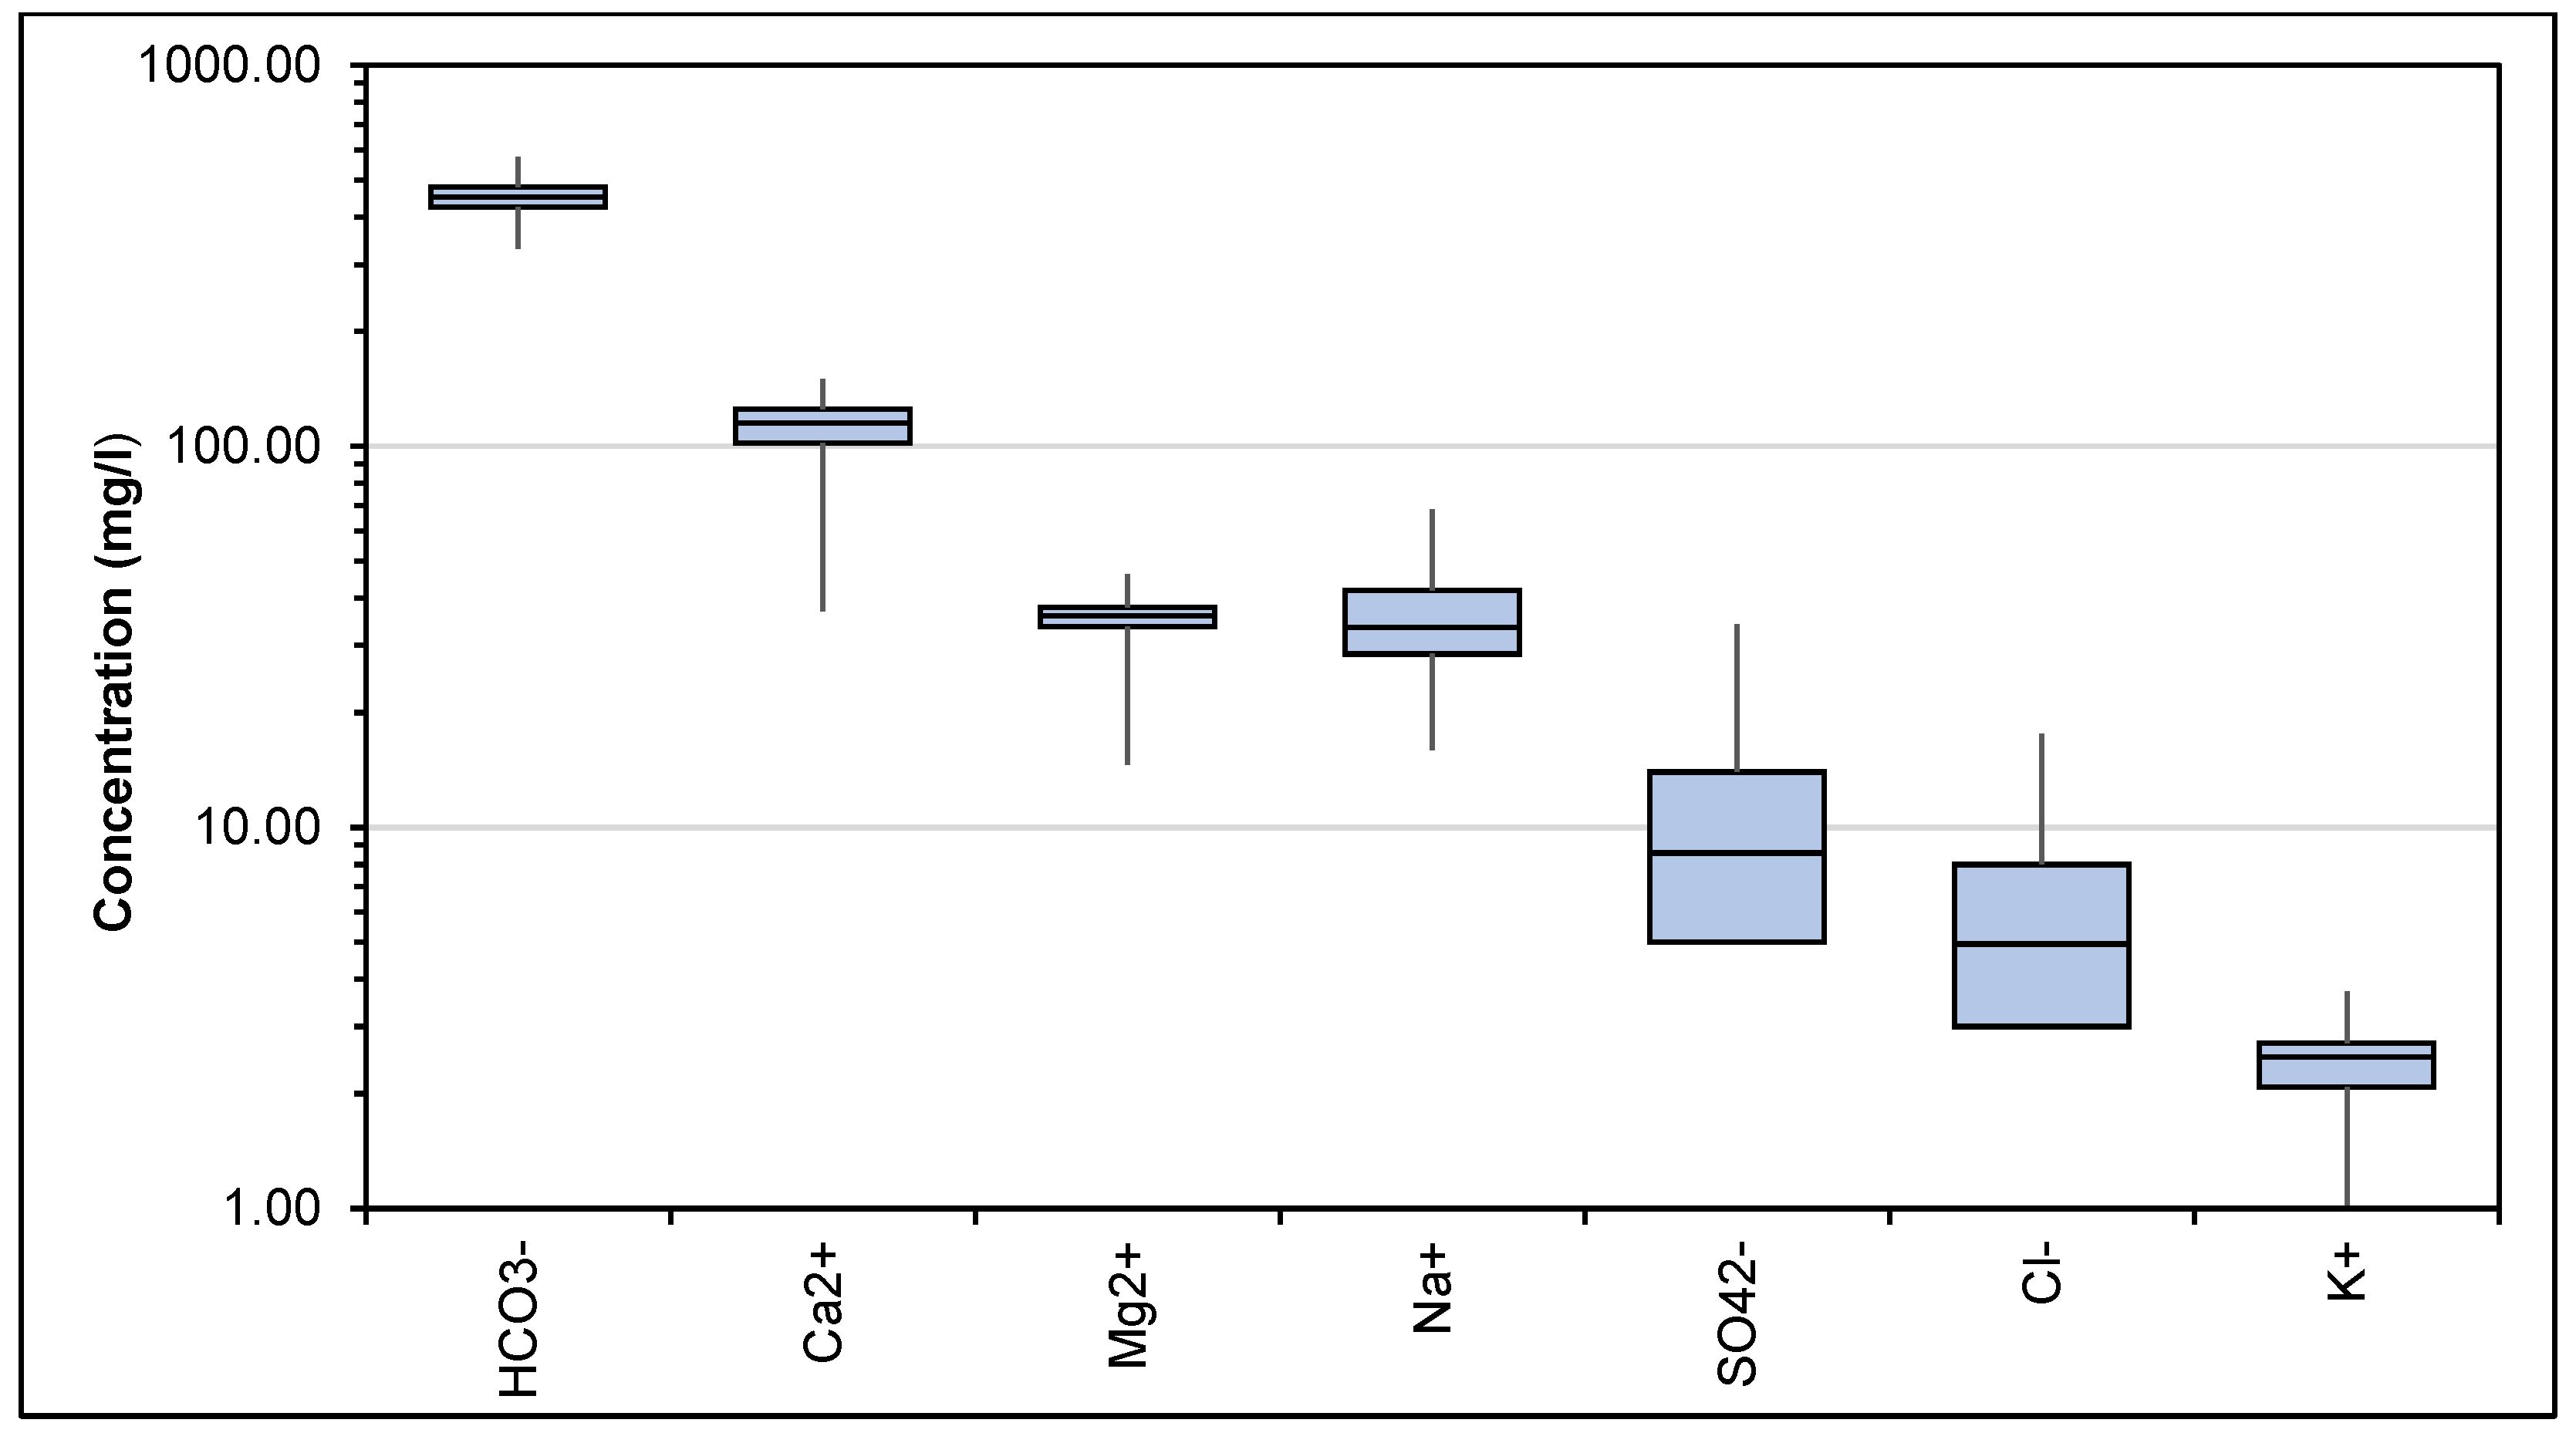
Water samples were collected from 118 wells with depth ranges from 56 m to 300 m below the ground surface covering the entire study area. The physical and chemical parameters were measured, including hydrogen potential (pH), temperature (T), electric conductivity (EC), total dissolved solids (TDS), and Na, Ca, Mg, K, Cl, SO4, HCO3, CO3 and NO3 ions. The minimum, maximum, average and standard deviation values were reported in Table 2, and the main ions statistic was plotted in Figure 12.
The physicochemical parameters were used as input data to detect the geochemical evolution, water type and geochemical modelling of the groundwater with flow path, to determine the difference in the chemistry of water inside and outside the IVU. Piper diagram, ionic ratio and saturation index were used for the evaluation. It was noted from the average value that the cations were arranged in this order Ca2+ > Na+ > Mg2+ > K+ and the anions followed this order HCO3 > SO42− > Cl > NO3.
The collected water samples were classified into three hydrogeochemical facies, as shown in Figure 13a. Na-HCO3 facies (Type 1) represents the samples outside of the Incised Valley, while the Ca-Mg-HCO3 facies (Type 2) includes the water samples of the IVU. This apparent spatial differentiation of facies Type 1 and 2 indicated the effects of valley-fill hydraulic performance, identified based on the hydrogeochemical facies of the enclosed pore water.
The Na-HCO3 facies was associated with advanced silicate weathering or ion exchange in the pore system of the Late Miocene formations, while the Ca-Mg-HCO3 character can be attributed to carbonate weathering or reverse ion exchange [73]. A mixed Na-Ca-HCO3 facies (Type 3) was observed in three samples; however, only one of them is located close to the bounding surface of the incised valley, approximately 2.5 km northwest of Hajdúbagos (Figure 13b). This facies indicated the mixing of two facies and suggested variable vertical flow intensity.
Exceptions included four samples showing Ca-Mg-HCO3 facies in the center of the study area near the lateral bounding surface of the incised valley, but out of it (the rectangle in Figure 13b). This could be explained as a result of the over-exploitation of water by Debrecen Waterworks activities that shifts the water mixing zone into the main aquifer since the hydraulic conductivity of the IVU is higher than the surrounding units (Figure 13b), and demonstrated before by the hydraulic conditions of the system (Figure 10). Another exception was located in the southern part of the study area between Hajdúbagos and Létavértes. It was represented by six samples, the groundwater shows Ca-Mg-HCO3 facies due to the local effect of the higher carbonate content of sediments in this region, as reported in the lithological logs.
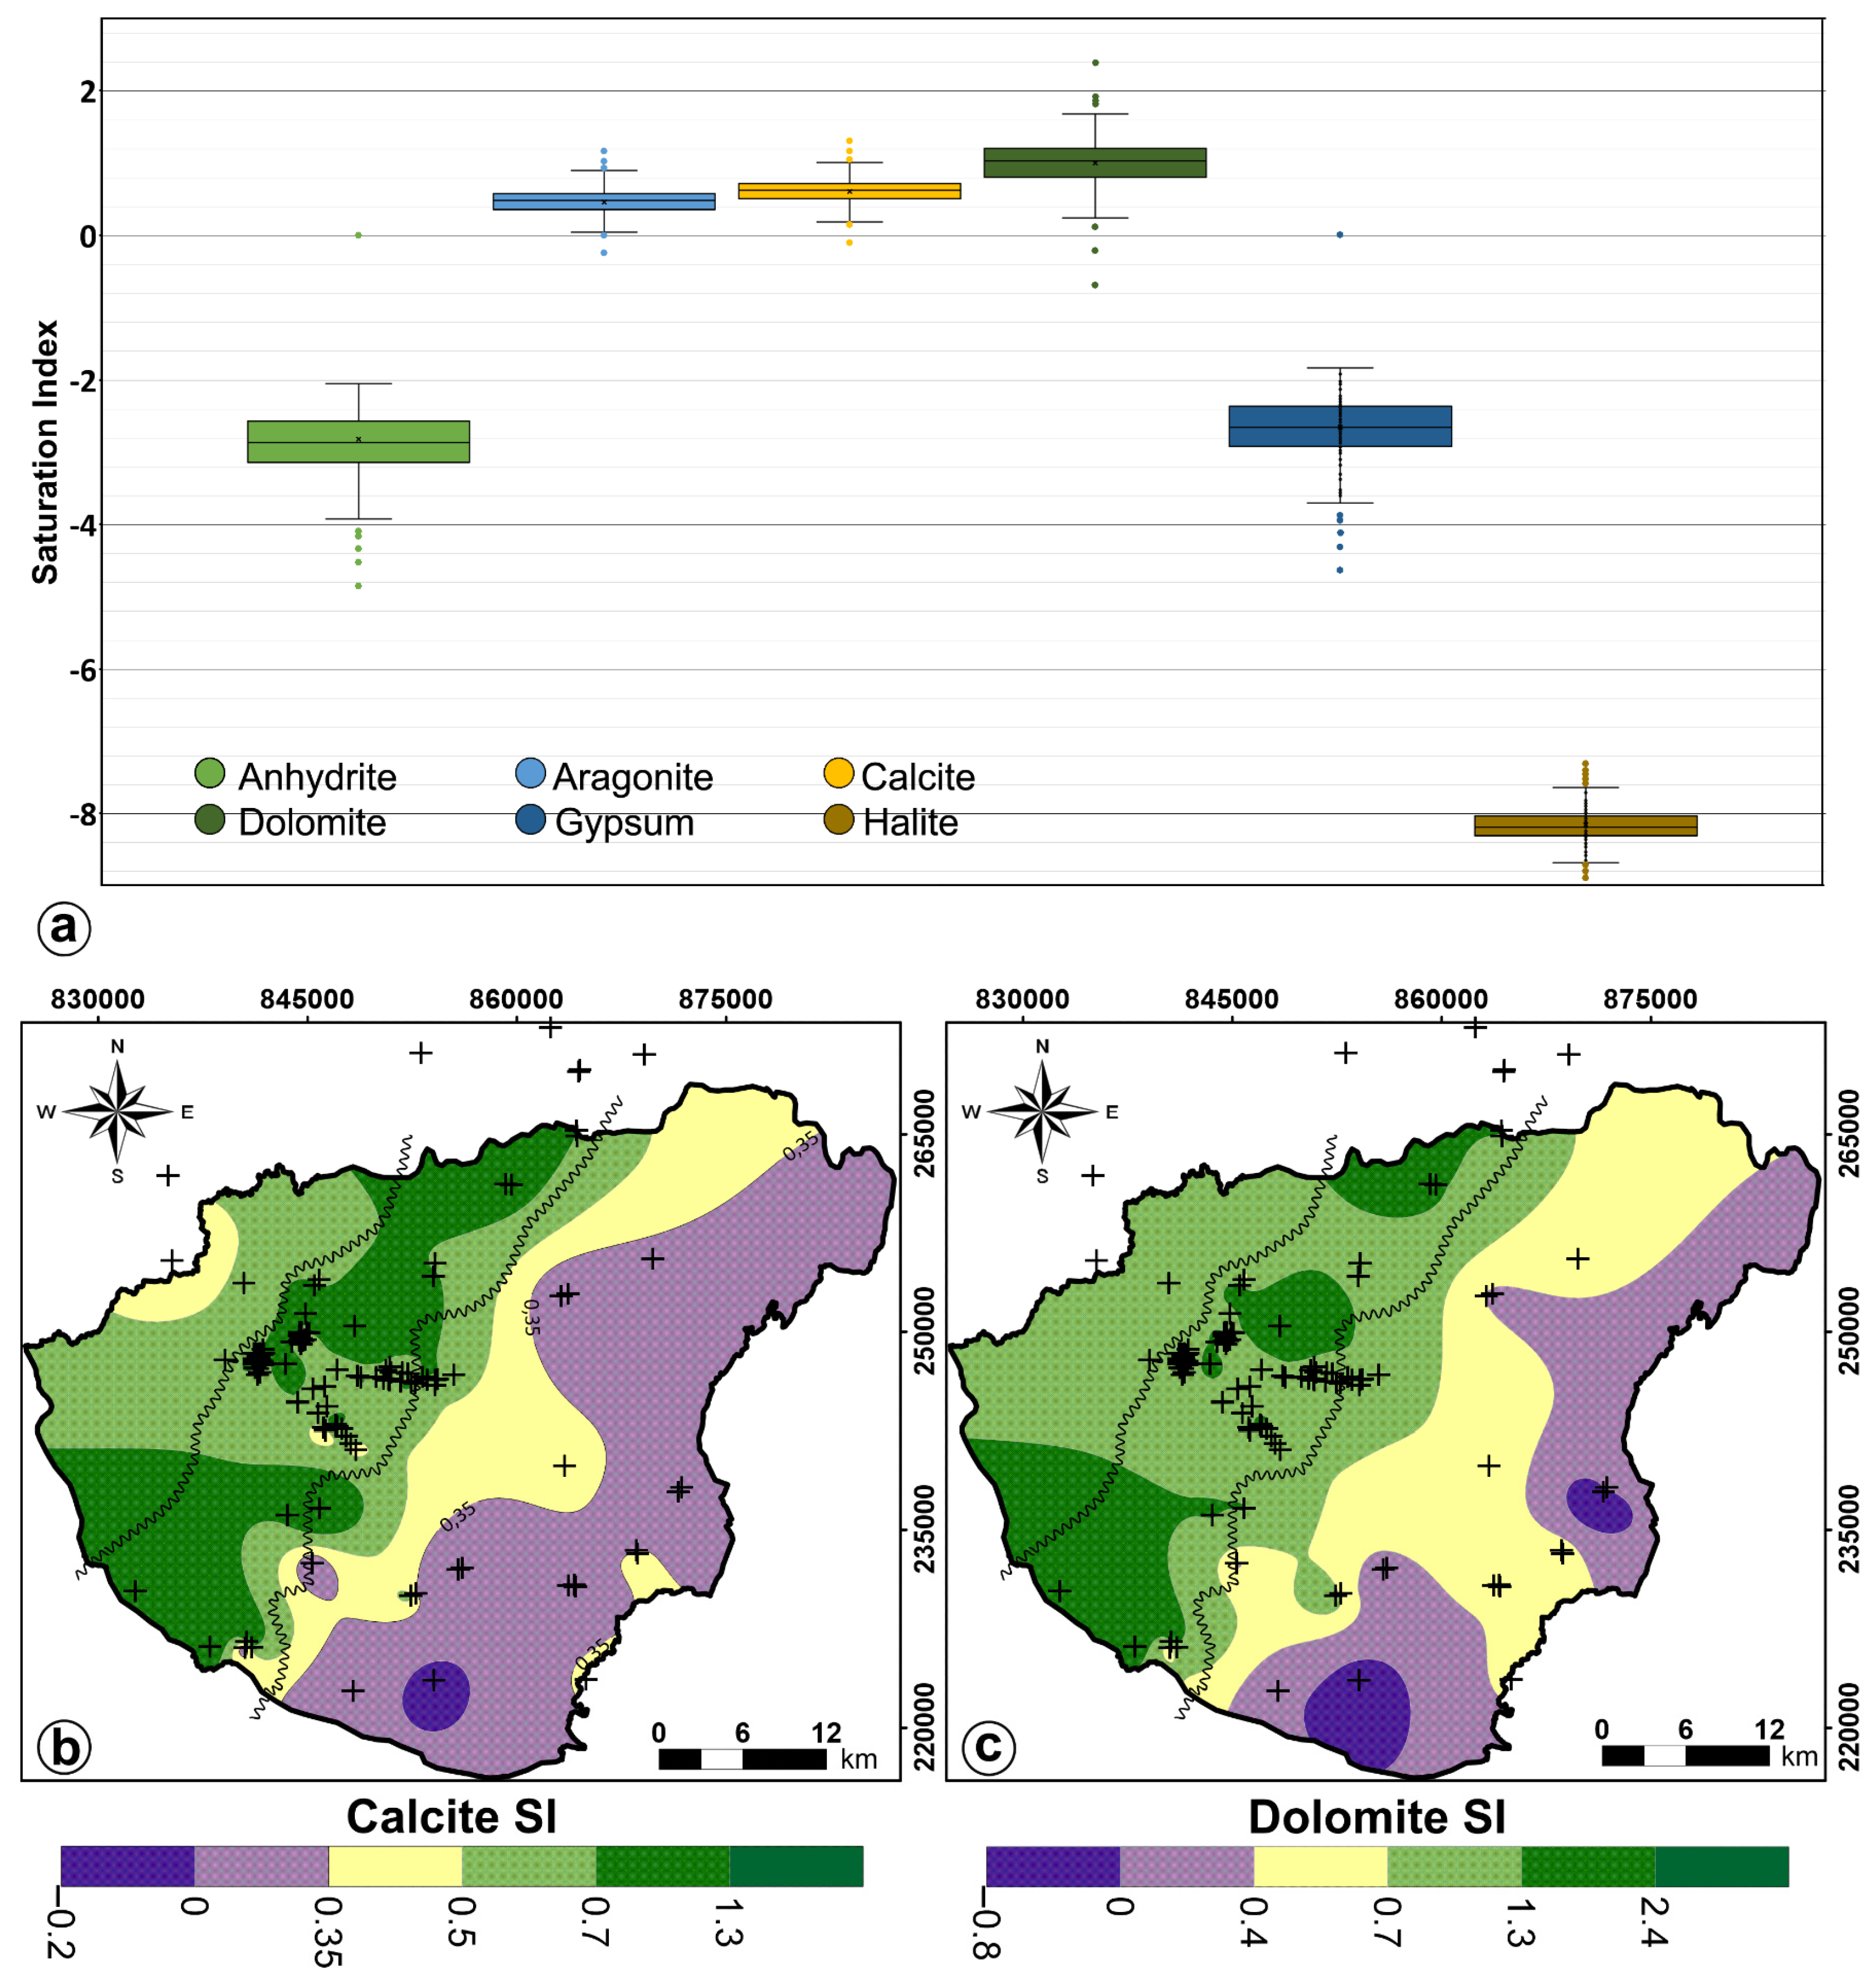
The geochemical model, using database including pH, temperature, EC, TDS and Na, Ca, Mg, K, Cl, SO4, HCO3, CO3 and NO3 ions (Table 2) as input for PHREEQC, was performed to calculate the saturation index (SI) of calcite, aragonite, dolomite, halite, gypsum and anhydrite minerals in the groundwater. The analysis aims to detect the change in the saturation index inside and outside the valley along the flowpaths. The minimum and maximum value of the SI for the minerals, shown in Figure 14a, indicated that all the water samples were undersaturated concerning halite, gypsum and anhydrite, showing the ability of water to dissolve more from these minerals all over the model domain.
The spatial distribution of saturation index (SI) values of calcite and dolomite (Figure 14b,c) also revealed a reliable differentiation inside and outside the main aquifer. The majority of the water samples within the IVU were oversaturated regarding calcite and dolomite. The values range from 0.5 to 1.2 and from 0.7 to 2.1, respectively. This suggested the ability of water to precipitate these minerals within the available pore space, decreasing the HCO3 ion due to precipitation of carbonate minerals, and increasing the Ca2+ + Mg2+ (Figure 15d), indicating another source of Ca and Mg ions rather than carbonate dissolution, such as silicate minerals. Outside the valley, in the Late Miocene sedimentary formations, the SI values concerning calcite and dolomite are relatively low, ranging from −0.2 to 0.5 and from −0.7 to 0.7, respectively. The negative value of the SI in the majority of the water samples from the LMU indicated the ability of water to dissolve more calcite and dolomite approaching to the valley; it begins to reach saturation with these minerals.
The under-saturation in the LMU may be the result of the non-carbonate origin of the waters or the advanced cation exchange. The outlying saturation index (SI) values outside the IVU between Hajdúbagos and Létavértes, showing high oversaturation, can be attributed to the higher carbonate content of the matrix, as previously mentioned. However, since the carbonate content of the valley-fill sediments does not differ from or is even lower than that of the pre-Quaternary formations, the most probable sources of dissolved carbonate in the groundwater are the bio-carbonate minerals (such as gastropod shells, rhizoids and rhizoliths) present in the Quaternary layers between central Nyírség, which is the recharge area of the system. The direct recharge of the semi-confined aquifer has the potential to increase the saturation index (SI) from under-saturation to neutrality or even oversaturation, if we considered the joint interpretation of the flow pattern shown in Figure 10.
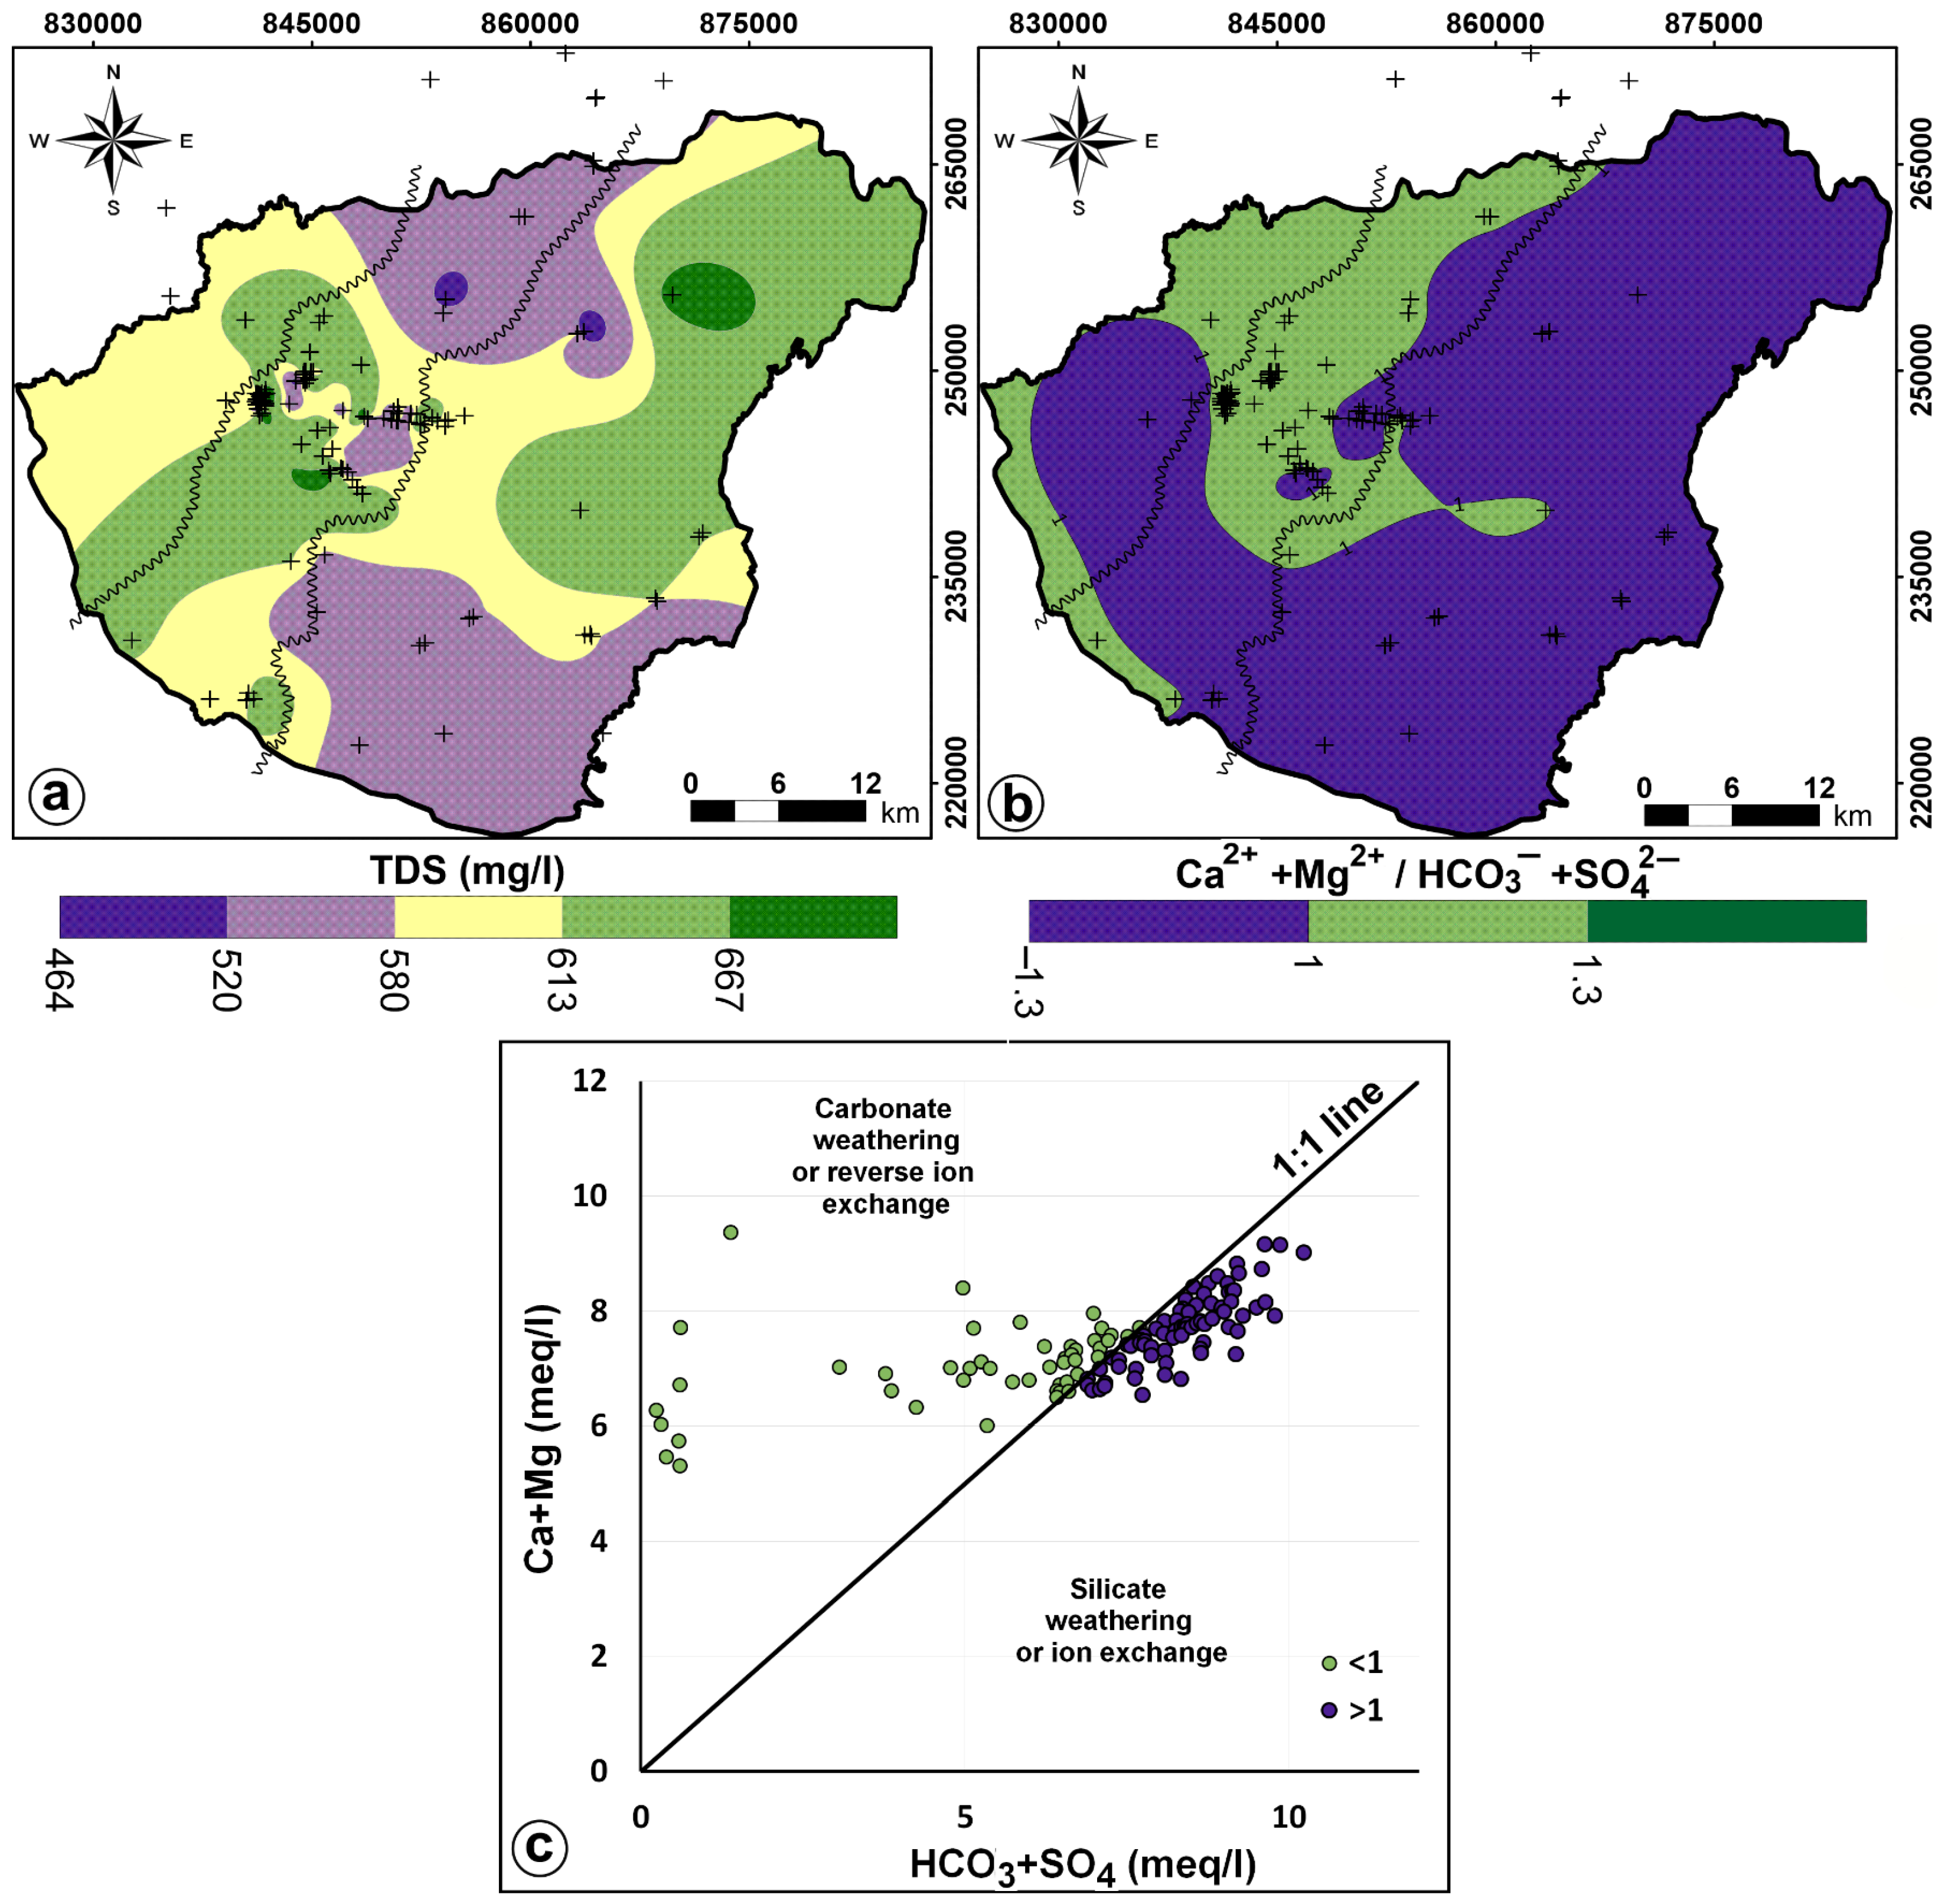
The spatial distribution of TDS values (Figure 15a) partially differs from that of hydrogeochemical facies and saturation index values. It exhibits a dominant NE–SW trend and a subdominant SE–NW trend in the study area, following the regional flow system where the main recharge zones are located towards the central Nyírség to the north and at the Pocsaj–Létavértes area to the south-east (Figure 11). However, the regional trend appears to be influenced by the Debrecen Waterwork Sites.
From the pressure–depth profile and the distribution map of the pressure increments (Figure 9 and Figure 10), it was observed the vertical drawdown movement of water from the upper layers to the IVU. The increased quantity of water from the upper layer due to rainfall can lead to dilution and decrease the salinity (TDS) of the groundwater in the Debrecen location, at the central part of the study area. Hydraulic conductivity also plays a role in the salinity of groundwater as it reflects the residence time of water in contact with rocks. The hydraulic conductivity map (Figure 15b) shows that the central part of the valley has the highest hydraulic conductivity, indicating a shorter residence time of water–rock interaction.
The ionic ratio between cations and anions was represented on a distribution map (Figure 15b) and scatter plot (Figure 15c) to determine the type of water–rock interaction or weathering type inside and outside the main aquifer. When considering the ratio of Ca2+ + Mg2+/HCO3 + SO42−, the effect of the incised valley became more evident, as the values are less than 1 in all the water samples outside the incised valley. This reflects silicate weathering or ion exchange. However, within the incised valley, most of the water samples have a ratio greater than 1, indicating carbonate weathering or reverse ion exchange.
It should be emphasized that the spatial occurrence of the ratio > 1 within the valley coincides with the TDS pattern. This coincidence confirms that the source of Ca2+ and HCO3 in the water of the incised valley is not the carbonate content of the valley-fill sediments itself, but the carbonate dissolved along the flow path between the recharge area at central Nyírség and the Debrecen Waterworks Site by enhancement of recharge rate because the water extraction activities in situ.
Table 3 presents the chemical parameters obtained from Spearman’s correlation matrix. The analysis revealed a highly significant positive correlation between various elements. Specifically, there was a correlation coefficient of 0.74 between Ca2+ and Mg2+, 0.6 between Ca2+ and HCO3, 0.5 between Cl and EC and 0.6 between HCO3 and EC. These strong-to-intermediate correlations indicate the significant contribution of these elements to mineralization processes and groundwater salinity.
There are different methods and diagrams that can be used to detect the main parameters or ions that have the greatest contribution to the groundwater salinity, such as TIS salinity [72] and correlation matrix [29]. In the current study the correlation matrix was used, and showed that HCO3, Cl and Ca2+ are the main ions responsible for increasing the salinity of the groundwater which appear in the high correlation with EC. The PCA could also confirm the same point where the HCO3, Cl and EC significance value in the PC2 reflecting salinity and mineralization process.
The robust correlation of 0.74 between Ca2+ and Mg2+ confirmed the dissolution of dolomite CaMg(CO3)2 and calcite (CaCO3), which are carbonate minerals interspersed within the aquifer. Furthermore, the significant correlation of 0.6 between HCO3 with EC revealed that HCO3 is the main contributing element to the groundwater salinity. It dissolves in water through the dissociation of carbonate minerals, including calcite and dolomite. Interestingly, the strong negative correlation between Na+ and Cl suggested that the source of Na+ in the groundwater is primarily silicate minerals rather than halite minerals.
The PCA outcomes showed that two components reported for 64.37% of the total variance. Mainly, carbonate weathering (PC1) and silicate weathering (PC2) were identified as the primary factors influencing groundwater chemistry. Figure 16a illustrates the PCA results.
The first component (PC1) accounted for 43.36% of the total variance and involved the following main ions: Mg2+ (0.86), Ca2+ (0.84) and K+ (0.57), all of which displayed strong relationships with each other (as shown in Figure 16). The significant variables (Mg2+, Ca2+ and K+) within PC1 verified that the carbonate weathering process is the main factor controlling the groundwater chemistry and emphasizes the consequence of the mineralization process. Natural processes such as cation exchange, and calcite and dolomite dissolution occur, and are increased.
The second component (PC2) accounted for 21.01% of the total variance and comprised Cl (0.76), HCO3 (0.70), SO42− (0.47) and EC (0.86), all of which exhibited strong positive correlations among themselves in the same direction (as indicated in Table 3). The main variables (Cl, HCO3, SO42− and EC) within PC2 demonstrated a significant increase associated with salinity (as shown in Figure 16b).
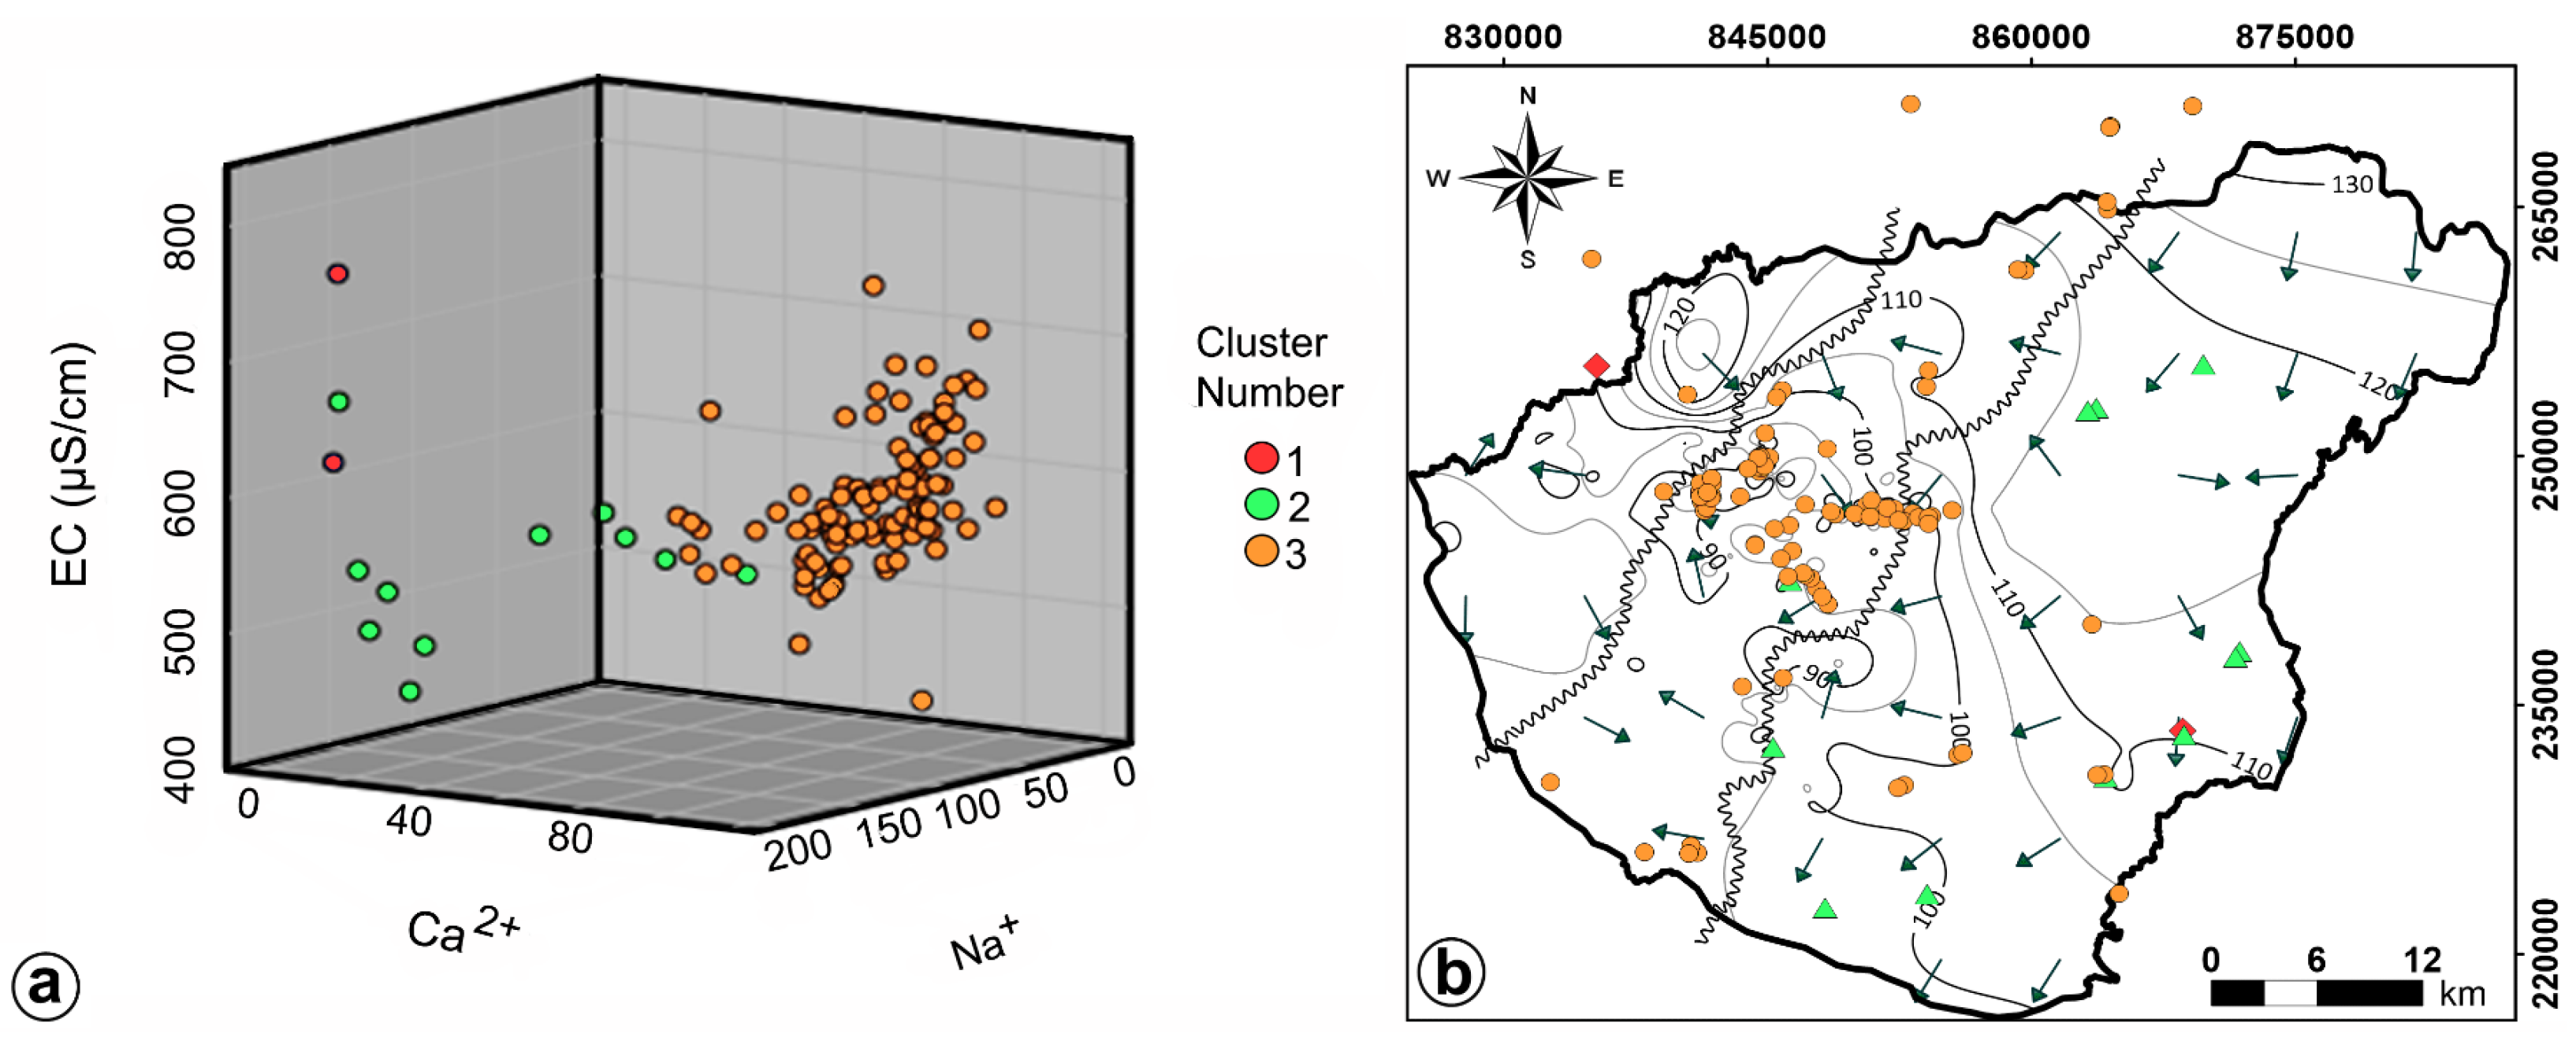
The hydrogeochemical dataset experienced PCA as a preprocessing step to improve the quality of cluster cohesion, followed by the application of K-means clustering (Figure 17). The Elbow curve analysis indicated that the wells could be grouped into three clusters. The first class (cluster 1) consisted of 105 wells predominantly located within the valley, characterized by high intercalations of carbonate minerals and a significant carbonate weathering process. This process leads to the depletion of Na+ and K+ ions, which are replaced by Ca2+ and Mg2+. The variables highly associated with PC1 (Mg2+ and Ca2+) play a significant role in controlling the water chemistry within this cluster. The water type for cluster 1 is identified as Ca-Mg-HCO3.

4. Conclusions

The integrated analysis of geological, hydrogeological and geochemical data was applied for the conceptualization of the groundwater system of the Southern Nyírség–Hajdúság Groundwater Body in East-Hungary. It unveiled a stratigraphic unconformity that had not been explored before. The high-resolution log correlation successfully revealed the existence of four hydrostratigraphic units, wherein the primary aquifer happened to be an incised paleo-valley of 10 to 13 km wide and NE–SW axis, and filled up with coarse grain size sediments. It had been unconformably deposited in the eroded surface of the Late Miocene Units and buried under an alluvial stratigraphic sequence and a series of coarsening-upward sediments of undefined sedimentary environment.
Despite the limited availability of 2D geophysical data, the presented 3D stratigraphic interpretation represents a significant improvement in understanding the hydrogeological framework of the Southern Nyírség–Hajdúság Groundwater Body. The geometry was demonstrated by its positive correlation with the spatial distribution of hydraulic conductivity values and specific capacity, horizontal and vertical flow patterns, and the geochemical evolution of the water.
The estimation of the apparent hydraulic conductivity aligned consistently with the reported grain size information of each identified hydrostratigraphic unit. It indicated the coarser grain size of the Incised Valley Unit in comparison with the surrounding units and also represented in its higher average capacity of the water production wells. The spatial distribution of the hydraulic conductivity shows conformity with the geometry of the paleo-valley; the abrupt change in hydraulic conductivity values happened at the border of the geometry presented as the Incised Valley Unit.
The observed fluid potential patterns showed: (1) a semiconfined aquifer system due to the evident hydraulic windows connecting the different hydrostratigraphic units, (2) a gravity drive flow represented in the similarity of water table and topography, wherein recharge occurs on the highlands, whereas discharge happens on the lowlands, and (3) regionally dominated by under-pressure conditions (downward flow direction) system depicted form the fact that average pressure gradient of the hydrostratigraphic units is lower than hydrostatic pressure gradient.
The regional flow direction was described to be from NW to SE. Nevertheless, two main perturbations of the potential field were notable: (1) the higher hydraulic conductivity avenue of the Incised Valley Unit manifested in an elongate perturbation that follows the same strike direction of the paleo-valley, and (2) the effects of the hydraulic windows (IVU-AU vertical and IVU-LMU horizontal) shown in the depression of the dynamic pressure increment and hydraulic head at the center of the study area, at the Debrecen Waterworks Sites.
The conducted geochemical analysis concluded that the main aquifer is characterized by a Ca-Mg-HCO3 water type, whereas the lateral surrounding aquifer exhibit Na-HCO3 water type. Additionally, the saturation index values indicated a transition from undersaturated to supersaturated states for calcite and dolomite minerals along the geometry of the IVU. These findings were further supported by the PCA and K-mean cluster analysis, which demonstrated that carbonate weathering, ion exchange and silicate weathering processes play a significant role in controlling the groundwater chemistry within the aquifer system at the depth of the Incised Valley. These findings were in agreement with the fact that the heterogeneity introduced by the main aquifer significantly impacts the flow pattern, and the higher velocities of flows occur within the IVU.
The observed agreement between these findings and the understanding that heterogeneity introduced by the main aquifer has a substantial impact on the flow pattern further strengthens the results. Specifically, it suggests that flows within the IVU occur at higher velocities compared to other areas of the aquifer system, which enhances the contaminant transport, and, consequently, increases the vulnerability of the aquifer.
The obtained results offer valuable and substantial insights into the regional-scale hydrogeological interpretation of the area. These findings hold great promise in advancing sustainable groundwater management practices in the region, especially considering the ongoing escalation in water demands from the local community, agricultural activities and industrial sectors. The reported results provide essential contributions towards informed decision-making and the formulation of effective strategies aimed at securing the long-term availability and optimizing the utilization of groundwater resources in the area.

Author Contributions

Conceptualization, Y.G.F., P.Ú., P.T. and Z.P.; methodology, Y.G.F., M.H.E. and Z.P.; software, Y.G.F. and M.H.E.; validation, Z.P., P.S., T.S., J.S. and B.K.; formal analysis, Y.G.F., M.H.E., Z.P., T.S. and P.S.; investigation, Y.G.F. and Z.P.; resources, Z.P., T.S. and T.F.; data curation, Y.G.F., M.H.E., G.M. and R.W.M.; writing—original draft preparation, Y.G.F.; writing—review and editing, Y.G.F., M.H.E., Z.P. and P.S.; visualization, Y.G.F.; supervision, P.S. and Z.P.; project administration, P.S. and Z.P.; funding acquisition, P.S. All authors have read and agreed to the published version of the manuscript.

Funding

The research was funded by the Sustainable Development and Technologies National Programme of the Hungarian Academy of Sciences (FFT NP FTA).

Data Availability Statement

Restrictions apply to the availability of these data. Data were obtained from Supervisory Authority for Regulatory Affairs (SARA) and are available from the authors with the permission of SARA.

Conflicts of Interest

The authors declare no conflict of interest. The funders had no role in the design of the study; in the collection, analyses or interpretation of data; in the writing of the manuscript; or in the decision to publish the results.

References

  1. Eaton, T.T. On the Importance of Geological Heterogeneity for Flow Simulation. Sediment. Geol. 2006, 184, 187–201. [Google Scholar] [CrossRef]
  2. Maliva, R.G. Aquifer Characterization.Schlumberger Methods in Water Resources Evaluation Series No. 4; Springer Nature: Fort Myers, FL, USA, 2016; ISBN 9783319321363. [Google Scholar] [CrossRef]
  3. Kawo, N.S.; Korus, J.; Gulbrandsen, M.L. Multiple-Point Statistical Modeling of Three-Dimensional Glacial Aquifer Heterogeneity for Improved Groundwater Management. Hydrogeol. J. 2023, 1–22. [Google Scholar] [CrossRef]
  4. Cardenas, M.B.; Zlotnik, V.A. Three-Dimensional Model of Modern Channel Bend Deposits. Water Resour. Res. 2003, 39, 1–13. [Google Scholar] [CrossRef] [Green Version]
  5. Anderson, M.P.; Aiken, J.S.; Webb, E.K.; Mickelson, D.M. Sedimentology and Hydrogeology of Two Braided Stream Deposits. Sediment. Geol. 1999, 129, 187–199. [Google Scholar] [CrossRef]
  6. Comunian, A.; Renard, P.; Straubhaar, J.; Bayer, P. Three-Dimensional High Resolution Fluvio-Glacial Aquifer Analog—Part 2: Geostatistical Modeling. J. Hydrol. 2011, 405, 10–23. [Google Scholar] [CrossRef] [Green Version]
  7. Hamdi, M.; Goïta, K. Estimation of Aquifer Storativity Using 3D Geological Modeling and the Spatial Random Bagging Simulation Method: The Saskatchewan River Basin Case Study (Central Canada). Water 2023, 15, 1156. [Google Scholar] [CrossRef]
  8. van Dijk, W.M.; Densmore, A.L.; Jackson, C.R.; Mackay, J.D.; Joshi, S.K.; Sinha, R.; Shekhar, S.; Gupta, S. Spatial Variation of Groundwater Response to Multiple Drivers in a Depleting Alluvial Aquifer System, Northwestern India. Prog. Phys. Geogr. Earth Environ. 2020, 44, 94–119. [Google Scholar] [CrossRef] [Green Version]
  9. McCord, J.T.; Gotway, C.A.; Conrad, S.H. Impact of Geologic Heterogeneity on Recharge Estimation Using Environmental Tracers: Numerical Modeling Investigation. Water Resour. Res. 1997, 33, 1229–1240. [Google Scholar] [CrossRef]
  10. Guo, Z.; Fogg, G.E.; Brusseau, M.L.; LaBolle, E.M.; Lopez, J. Modeling Groundwater Contaminant Transport in the Presence of Large Heterogeneity: A Case Study Comparing MT3D and RWhet. Hydrogeol. J. 2019, 27, 1363–1371. [Google Scholar] [CrossRef]
  11. Joshi, S.K.; Gupta, S.; Sinha, R.; Densmore, A.L.; Rai, S.P.; Shekhar, S.; Mason, P.J.; van Dijk, W. Strongly Heterogeneous Patterns of Groundwater Depletion in Northwestern India. J. Hydrol. 2021, 598, 126492. [Google Scholar] [CrossRef]
  12. Enemark, T.; Peeters, L.J.M.; Mallants, D.; Batelaan, O. Hydrogeological Conceptual Model Building and Testing: A Review. J. Hydrol. 2019, 569, 310–329. [Google Scholar] [CrossRef]
  13. Torrado, L.; Carvajal-Arenas, L.C.; Mann, P.; Bhattacharya, J. Integrated Seismic and Well-Log Analysis for the Exploration of Stratigraphic Traps in the Carbonera Formation, Llanos Foreland Basin of Colombia. J. S. Am. Earth Sci. 2020, 104, 102607. [Google Scholar] [CrossRef]
  14. Buday, T.; Püspöki, Z. B05 Facies Variations Detected by Well Log Correlation in a Geothermal Reservoir (Újfalu Formation) around Debrecen, Hungary. In Proceedings of the 6th Congress of Balkan Geophysical Society, Budapest, Hungary, 3–6 October 2011; European Association of Geoscientist and Engineers: Budapest, Hungary, 2011. [Google Scholar]
  15. Babad, A.; Burg, A.; Adar, E.M. Conceptual Hydrological Approach to a Geologically Complex Basin with Scarce Data: The Hula Valley, Middle East. Hydrogeol. J. 2019, 28, 703–722. [Google Scholar]
  16. Mas, P.; Calcagno, P.; Caritg-Monnot, S.; Beccaletto, L.; Capar, L.; Hamm, V. A 3D Geomodel of the Deep Aquifers in the Orléans Area of the Southern Paris Basin (France). Sci. Data 2022, 9, 781. [Google Scholar] [CrossRef]
  17. Enemark, T.; Andersen, L.T.; Høyer, A.S.; Jensen, K.H.; Kidmose, J.; Sandersen, P.B.E.; Sonnenborg, T.O. The Influence of Layer and Voxel Geological Modelling Strategy on Groundwater Modelling Results. Hydrogeol. J. 2022, 30, 617–635. [Google Scholar] [CrossRef]
  18. Déri-Takács, J.; Rostron, B.; Mendoza, C.; Mádl-Szőnyi, J. Hydrogeochemical Characteristics Refine the Conceptual Model of Groundwater Flow in Wood Buffalo National Park, Canada. Water 2022, 14, 965. [Google Scholar] [CrossRef]
  19. Ross, M.; Parent, M.; Lefebvre, R. 3D Geologic Framework Models for Regional Hydrogeology and Land-Use Management: A Case Study from a Quaternary Basin of Southwestern Quebec, Canada. Hydrogeol. J. 2005, 13, 690–707. [Google Scholar] [CrossRef]
  20. Ritzi, R.W.; Dominic, D.F.; Brown, N.R.; Kausch, K.W.; McAlenney, P.J.; Basial, M.J. Hydrofacies Distribution and Correlation in the Miami Valley Aquifer System. Water Resour. Res. 1995, 31, 3271–3281. [Google Scholar] [CrossRef]
  21. Fetter, C.W., Jr. Applied Hydrogeology, 4th ed.; Pearson: London, UK, 2014; ISBN 1-292-02290-6. [Google Scholar]
  22. Runkel, A.C.; Tipping, R.G.; Alexander, E.C.; Alexander, S.C. Hydrostratigraphic Characterization of Intergranular and Secondary Porosity in Part of the Cambrian Sandstone Aquifer System of the Cratonic Interior of North America: Improving Predictability of Hydrogeologic Properties. Sediment. Geol. 2006, 184, 281–304. [Google Scholar] [CrossRef]
  23. Marton, L.; Szanyi, J. Kelet-Magyarországi Pleisztocén Üledékek Geostatisztikai Vizsgálata. 1. A Transzmisszivitás Térképezése. Hidológiai Közlöny 1997, 77, 233–248. [Google Scholar]
  24. Anderson, M.P.; Woessner, W.W.; Hunt, R.J. Applied Groundwater Modeling. Simulation of Flow and Advective Transport, 2nd ed.; Elservier: London, UK, 2015; ISBN 9780120581030. [Google Scholar]
  25. Gupta, H.V.; Clark, M.P.; Vrugt, J.A.; Abramowitz, G.; Ye, M. Towards a Comprehensive Assessment of Model Structural Adequacy. Water Resour. Res. 2012, 48. [Google Scholar] [CrossRef] [Green Version]
  26. Tóth, J. Gravitational Systems of Groundwater Flow. Theory, Evaluation, Utilization, 1st ed.; Cambridge University Press: Cambridge, UK, 2009; ISBN 9780521886383. [Google Scholar]
  27. Tóth, J.; Almasi, I. Interpretation of Observed Fluid Potential Patterns in a Deep Sedimentary Basin under Tectonic Compression: Hungarian Great Plain, Pannonian Basin. Geofluids 2001, 1, 11–36. [Google Scholar] [CrossRef]
  28. Moya, C.E.; Raiber, M.; Taulis, M.; Cox, M.E. Hydrochemical Evolution and Groundwater Flow Processes in the Galilee and Eromanga Basins, Great Artesian Basin, Australia: A Multivariate Statistical Approach. Sci. Total Environ. 2015, 508, 411–426. [Google Scholar] [CrossRef] [PubMed]
  29. Parkhurst, D.L.; Appelo, C.A.J. Description of Input and Examples for PHREEQC Version 3—A Computer Program for Speciation, Batch-Reaction, One-Dimensional Transport, and Inverse Geochemical Calculations. US Geol. Surv. Tech. Methods 2013, 6, 497. [Google Scholar]
  30. Fuoco, I.; Figoli, A.; Criscuoli, A.; Brozzo, G.; De Rosa, R.; Gabriele, B.; Apollaro, C. Geochemical Modeling of Chromium Release in Natural Waters and Treatment by RO/NF Membrane Processes. Chemosphere 2020, 254, 126696. [Google Scholar] [CrossRef] [PubMed]
  31. Adadzi, P.; Allwright, A.; Fourie, F. Multivariate and Geostatistical Analyses of Groundwater Quality for Acid Rock Drainage at Waste Rock and Tailings Storage Site. J. Ecol. Eng. 2022, 23, 203–216. [Google Scholar] [CrossRef]
  32. El-Anwar, E.A.A.; Salman, S.A. Hydrochemical Modeling of Groundwater Quality from Sinai, Eastern and Western Deserts, Egypt. Model. Earth Syst. Environ. 2022, 8, 4427–4439. [Google Scholar] [CrossRef]
  33. Ibrahim, R.G.M.; Korany, E.A.; Tempel, R.N.; Gomaa, M.A. Processes of Water–Rock Interactions and Their Impacts upon the Groundwater Composition in Assiut Area, Egypt: Applications of Hydrogeochemical and Multivariate Analysis. J. Afr. Earth Sci. 2019, 149, 72–83. [Google Scholar] [CrossRef]
  34. Debreceni Vizmű Zrt. The History of Debrecen Water Works. Available online: https://www-debreceni--vizmu-hu.translate.goog/cegunkrol/cegtortenet?_x_tr_sl=hu&_x_tr_tl=en&_x_tr_hl=es-419&_x_tr_pto=wapp (accessed on 16 May 2023).
  35. Marton, L. Izotóphidrológiai Modellek És Számítási Eljárások a Felszín Alatti Vizek Mozgásának Tanulmányozásához. Hidrológiai Közlöny 1982, 62, 525–572. [Google Scholar]
  36. Szanyi, J. Felszín Alatti Víytermelés Környezeti Hatásai Dél-Nyírség Péeldáján, Szegedi Tudományegyetem. 2004. Available online: https://doktori.bibl.u-szeged.hu/id/eprint/335/ (accessed on 10 May 2023).
  37. Debreceni Vizmű Zrt. Documentumtár-Water Managment Legislation. Available online: https://www.debreceni-vizmu.hu/dokumentumtar (accessed on 29 March 2022).
  38. Vkki, V.; és, K.K.I. Vízgyűjtő-Gazdálkodási terv. Tisza Részvízgyűjtő; Budapest, Hungary. 2010. Available online: https://geoportal.vizugy.hu/vizgyujtogazd01/ (accessed on 10 May 2023).
  39. ESRI Magyarország Kft. Víztestek a Vízgyűjtőkön. Available online: http://geoportal.vizugy.hu/vizgyujtogazd01/ (accessed on 19 April 2022).
  40. NATéR NATÉR Portál. Available online: https://map.mbfsz.gov.hu/nater/ (accessed on 10 May 2023).
  41. Haas, J.; Budai, T.; Csontos, L.; Fodor, L.; Konrád, G.; Koroknai, B. Geology of the Pre-Cenozoic Basement of Hungary. Explanatory Notes for “Pre-Cenozoic Geological Map of Hungary” (1:500,000); Piros, O., Ed.; Geological and Geophysical Institute of Hungary: Budapest, Hungary, 2014; ISBN 9789636712990. [Google Scholar]
  42. Haas, J.; Budai, T.; Csontos, L.; Fodor, L.; Konrád, G.; Koroknai, B. Magyarország Pre-Kainozoos Földtani Térképe. Available online: https://map.mbfsz.gov.hu/preterc500/ (accessed on 10 May 2023).
  43. Juhász, G.; Pogácsás, G.; Magyar, I.; Vakarcs, G. Integrált-Sztratigráfiai és Fejlődéstörténeti Vizsgálatok az Alföld Pannóniai s.l. Rétegsorában. Földtani Közlöny 2006, 136, 51–86. [Google Scholar]
  44. Csato, I.; Tóth, S.; Catuneanu, O.; Granjeon, D. A Sequence Stratigraphic Model for the Upper Miocene–Pliocene Basin Fill of the Pannonian Basin, Eastern Hungary. Mar. Pet. Geol. 2015, 66, 117–134. [Google Scholar] [CrossRef]
  45. Magyar, I.; Radivojević, D.; Sztanó, O.; Synak, R.; Ujszászi, K.; Pócsik, M. Progradation of the Paleo-Danube Shelfmargin across the Pannonian Basin during the Late Miocene and Early Pliocene. Glob. Planet. Chang. 2013, 103, 168–173. [Google Scholar] [CrossRef]
  46. Császár, G.; Loránd, A.; Jaskó, T.; Dezső, S. (Eds.) Lithostratigraphic Units of Hungary. Charts and Short Descriptions; PR Press Kft.: Budapest, Hungary, 1997; ISBN 9636711909. [Google Scholar]
  47. Borsy, Z. Hordalékkúpok Fejlődése Az Alföldön; Scientific Publications in the BGYTF: Budapest, Hungary, 1982; Volume 37. [Google Scholar]
  48. Borsy, Z. Evolution of the Alluvial Fans of the Alföld. In Alluvial Fans: A Field Approach; Rachocki, A., Church, M., Eds.; John Wiley & Sons Inc.: New York, NY, USA, 1990; pp. 229–246. [Google Scholar]
  49. Lóki, J.; Hertelendi, E.; Borsy, Z. New Dating of Blown Sand Movement in the Nyírség. Acta Geogr. Geol. Meteorol. Debrecina 1994, 32, 67–79. [Google Scholar]
  50. Gábris, G.; Nádor, A. Long-Term Fluvial Archives in Hungary: Response of the Danube and Tisza Rivers to Tectonic Movements and Climatic Changes during the Quaternary: A Review and New Synthesis. Quat. Sci. Rev. 2007, 26, 2758–2782. [Google Scholar] [CrossRef]
  51. Püspöki, Z.; Demeter, G.; Tóth-Makk, Á.; Kozák, M.; Dávid, Á.; Virág, M.; Kovács-Pálffy, P.; Kónya, P.; Gyuricza, G.; Kiss, J.; et al. Tectonically Controlled Quaternary Intracontinental Fluvial Sequence Development in the Nyírség-Pannonian Basin, Hungary. Sediment. Geol. 2013, 283, 34–56. [Google Scholar] [CrossRef]
  52. Kun, E. The 30-Year Average of the Infiltration Values Calculated on the Basis of the CARPATCLIM-HU Measured Climate Parameters for the 1975–2004 of Climate Period 1; Budapest, Hungary. 2016. Available online: https://map.mbfsz.gov.hu/nater/ (accessed on 19 April 2023).
  53. Kun, E. 30-Year Average of Groundwater Levels Calculated in a National 3D Flow Model Based on the CARPATCLIM-HU Database for the Period 1975–2004; Budapest, Hungary. 2016. Available online: https://map.mbfsz.gov.hu/nater/ (accessed on 19 April 2023).
  54. Maekawa, T.; Matsumoto, Y.; Namiki, K. Interpolation by Geometric Algorithm. Comput.-Aided Des. 2007, 39, 313–323. [Google Scholar] [CrossRef]
  55. Aquaveo Stratigraphy Modeling—Horizons, TINs, and Meshes. Available online: https://s3.amazonaws.com/gmstutorials-10.7.aquaveo.com/StratigraphyModeling-HorizonsTINsAndMeshes.pdf (accessed on 1 January 2023).
  56. Logan, J. Estimating Transmissibility from Routine Production Tests of Water Wells. Groundwater 1964, 2, 35–37. [Google Scholar] [CrossRef]
  57. Risser, D. Factors Affecting Specific-Capacity Tests and Their Application—A Study of Six Low-Yielding Wells in Fractured-Bedrock Aquifers in Pennsylvania; U.S. Geological Survey: Reston, VA, USA, 2010. [Google Scholar]
  58. Lohman, S.W. Groundwater Hydraulics, 2nd ed.; Superintendent of Documents; U.S. Government Printing Office: Washington, DC, USA, 1979; ISBN 0444998209. [Google Scholar]
  59. Cheng, H.P. Computing Flow through Well Screens Using an Embedded Well Technique. Available online: https://apps.dtic.mil/sti/pdfs/ADA623142.pdf (accessed on 1 January 2023).
  60. Oliver, M.A.; Webster, R. Basic Steps in Geostatistics: The Variogram and Kriging; Springer International Publishing: New York, NY, USA, 2015; ISBN 9783319158648. [Google Scholar]
  61. Mikhailov, G.K. Daniel Bernoulli, Hydrodynamica (1738). In Landmark Writings in Western Mathematics 1640–1940; Grattan-Guinness, I., Cooke, R., Corry, L., Crépel, P., Guicciardin, N., Eds.; Elsevier: Amsterdam, The Netherlands, 2005; pp. 131–142. ISBN 9780444508713. [Google Scholar]
  62. Fogg, G.E.; Kreitler, C.W. Ground-Water Hydrology around Salt Domes in the East Texas Basin: A Practical Approach to the Contaminat Trasport Problem. Bull. Assoc. Eng. Geol. 1981, 18, 387–411. [Google Scholar]
  63. Zhang, B.; Zhao, D.; Zhou, P.; Qu, S.; Liao, F.; Guangcai, W. Hydrochemical Characteristics of Groundwater and Dominant Water—Rock Interactions in the Delingha. Water 2020, 12, 836. [Google Scholar] [CrossRef] [Green Version]
  64. Piper, A.M. A Graphic Procedure in the Geochemical Interpretation of Water-Analyses. Eos Trans. Am. Geophys. Union 1944, 25, 914–928. [Google Scholar] [CrossRef]
  65. Rajmohan, N.; Elango, L. Identification and Evolution of Hydrogeochemical Processes in the Groundwater Environment in an Area of the Palar and Cheyyar River Basins, Southern India. Environ. Geol. 2004, 46, 47–61. [Google Scholar] [CrossRef]
  66. Appelo, C.A.J.; Postma, D. Groundwater, Geochemistry and Pollution, 1st ed.; Cambridge University Press: Rotterdam, The Netherlands, 1993; ISBN 9789054101062. [Google Scholar]
  67. Spearman Rank Correlation Coefficient. In The Concise Encyclopedia of Statistics; Springer: New York, NY, USA, 2008; pp. 502–505. ISBN 978-0-387-32833-1.
  68. Iqbal, J.; Su, C.; Rashid, A.; Yang, N.; Baloch, M.Y.J.; Talpur, S.A.; Ullah, Z.; Rahman, G.; Rahman, N.U.; Earjh; et al. Hydrogeochemical Assessment of Groundwater and Suitability Analysis for Domestic and Agricultural Utility in Southern Punjab, Pakistan. Water 2021, 13, 3589. [Google Scholar] [CrossRef]
  69. Patil, V.H.; Singh, S.N.; Mishra, S.; Donavan, D.T. Efficient Theory Development and Factor Retention Criteria: Abandon the ‘Eigenvalue Greater than One’ Criterion. J. Bus. Res. 2008, 61, 162–170. [Google Scholar] [CrossRef]
  70. Szabó, N.P.; Braun, B.A.; Abdelrahman, M.M.G.; Dobróka, M. Improved Well Logs Clustering Algorithm for Shale Gas Identification and Formation Evaluation. Acta Geod. Geophys. 2021, 56, 711–729. [Google Scholar] [CrossRef]
  71. Bridge, J.S. Rivers and Floodplains: Forms, Processes, and Sedimentary Record; John Wiley & Sons Inc.: Hoboken, NJ, USA, 2003; ISBN 978-0-632-06489-2. [Google Scholar]
  72. Miall, A.D. The Geology of Fluvial Deposits. In Sedimentary Facies, Basin Analysis, and Petroleum Geology, 4th ed.; Springer: Berlin/Heidelberg, Germany, 2006; ISBN 3540591869. [Google Scholar]
  73. Al-Mashreki, M.H.; Eid, M.H.; Saeed, O.; Székács, A.; Szűcs, P.; Gad, M.; Abukhadra, M.R.; AlHammadi, A.A.; Alrakhami, M.S.; Alshabibi, M.A.; et al. Integration of Geochemical Modeling, Multivariate Analysis, and Irrigation Indices for Assessing Groundwater Quality in the Al-Jawf Basin, Yemen. Water 2023, 15, 1496. [Google Scholar] [CrossRef]
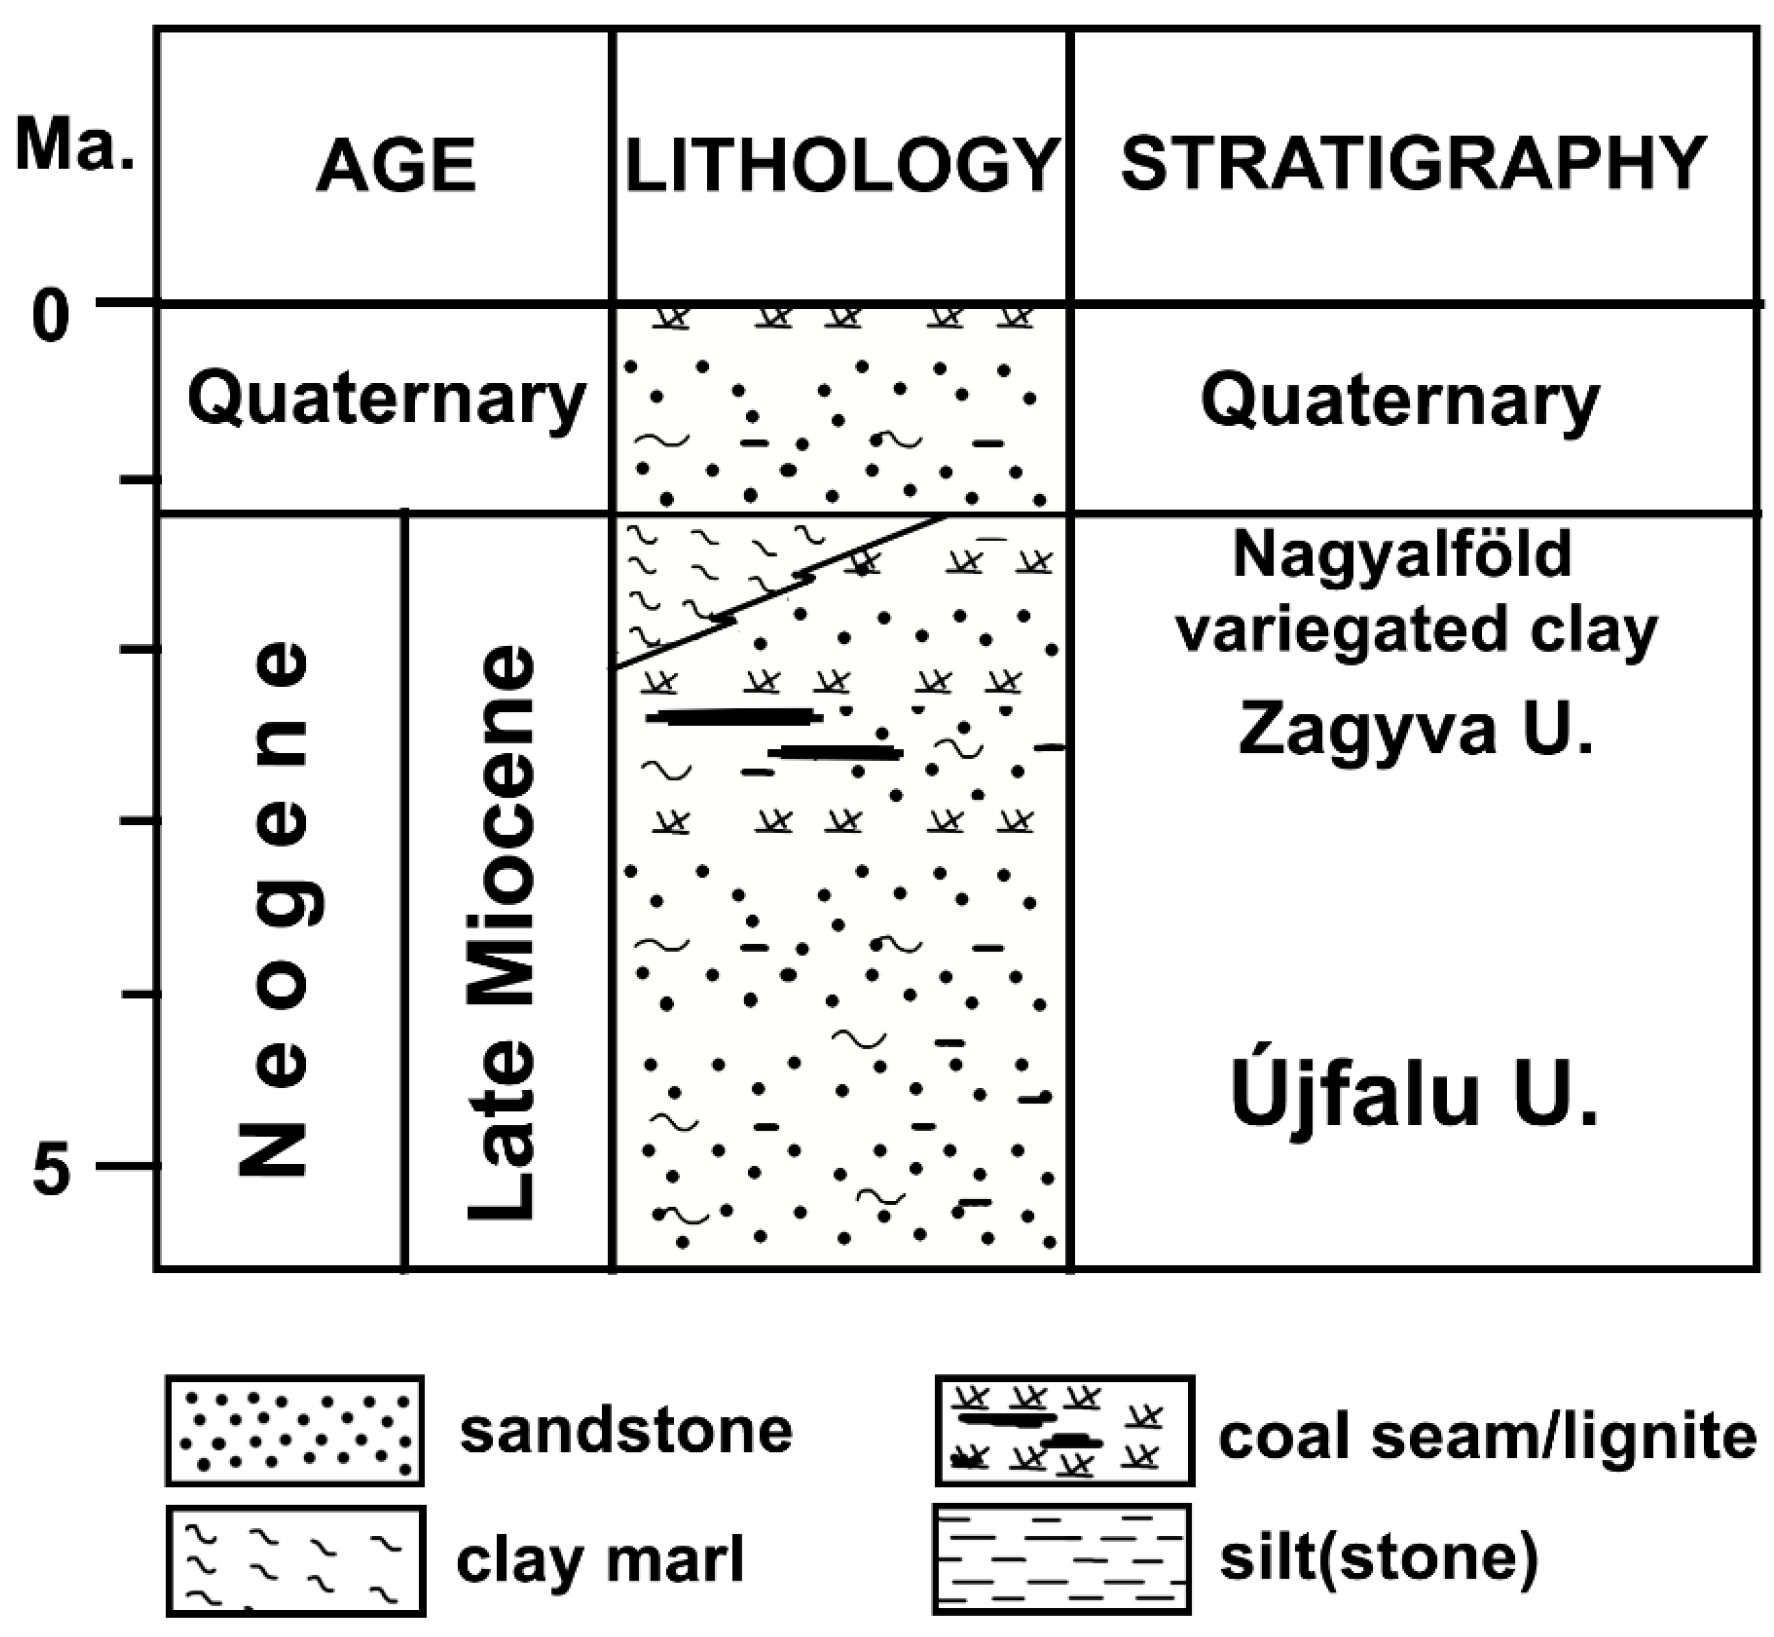
Figure 2. Hungarian lithostratigraphy units in the Great Plain of Hungary [27].
Water 15 02888 g002
Figure 3. Three stages of the workflow implemented in the conceptualization of the Southern-NHGWB.
Water 15 02888 g003
Figure 4. Location map displays stratigraphic data points and cross-section sets: Section 1 (Balmazújváros to Pocsaj), Section 2 (Józsa, Debrecen and Álmosd), and Section 3 (Hajdúszovát, Debrecen, Hajdúsámson and Nyíradony) with logs plotted equidistantly.
Water 15 02888 g004
Figure 5. (a) Contour lines representing the top surface of the Late Miocene Unit. (b) Contour lines represent the top surface of the Incised Valley Unit, which is enclosed within the Late Miocene Unit. The contact border between these two stratigraphic units is indicated by the black line.
Water 15 02888 g005
Figure 6. (a) Three-dimensional distribution of the lithological investigation points. (b) Three-dimensional visualization of the four interpreted stratigraphic units of the Southern-NHGWB.
Water 15 02888 g006
Figure 7. Range and distribution of (a) horizontal hydraulic conductivity (kh) (b) and specific capacity (SC) for each stratigraphic unit in the study area. The box plot presents the minimum, maximum, median, mean and quartile ranges for each hydrostratigraphic unit.
Water 15 02888 g007
Figure 8. Spatial distribution maps of (a) specific capacity (SC) and (b) horizontal hydraulic conductivity (kh) in the study area at the Incised Valley Unit depth.
Water 15 02888 g008
Figure 9. (a) Range and distribution of dynamic pressure (pdy) for each stratigraphic unit in the study area. The box plot presents the minimum, maximum, median, mean and quartile ranges. (b) Pressure–depth profile. The plotting uses hydrostatic pressure (ɣst) as a reference.
Water 15 02888 g009
Figure 10. (a) Piezometric map of the AU. (b) Dynamic pressure increments map of the AU. (c) Combined piezometric map of the IVU and LMU. (d) Combine dynamic pressure increments map of the IVU and LMU. The arrows show the flow direction, and the points are the distribution of the total head measurement. The black undulated line represents the contact between IVU and LMU.
Water 15 02888 g010
Figure 11. The water table of the system in average recharge conditions. The water table is indicated by a contour map with lines of equal elevation. The arrows on the map indicate the direction of groundwater flow, while the cross represents the locations where measurements of the total head were taken.
Water 15 02888 g011
Figure 12. Box plot of the main ions in the water samples. The figure presents the minimum, maximum, median, mean and quartile ranges.
Water 15 02888 g012
Figure 13. (a) Piper diagram and water type of the groundwater. (b) Spatial distribution of the geochemical sampling points colored according to the hydrostratigraphic units to which it belongs.
Water 15 02888 g013
Figure 14. (a) Range and distribution of mineral Saturation Index. The box plot presents the minimum, maximum, median and quartile ranges for each considered mineral. (b) Spatial correlation of Calcite Saturation Index. (c) Spatial correlation of Dolomite Saturation Index.
Water 15 02888 g014
Figure 15. (a) Spatial correlation of TDS. (b) Spatial correlation of ions ratio. (c) Scatter plot of water–rock iteration ratio.
Water 15 02888 g015
Figure 16. (a) The PCA results of the physicochemical parameters. (b) The two main components were obtained from PCA.
Water 15 02888 g016
Figure 17. (a) Three main clusters were obtained from k-mean based on PCA. (b) Distribution map of the three main clusters of k-means. The second class (clusters 2 and 3) comprised 13 wells located outside the valley. These wells were associated with the significant variables of PC2 (HCO3, Cl, SO42− and EC). The water type for clusters 2 and 3 is Na-HCO3, the initial stage of the geochemical evolution of groundwater through the precipitation process. As the groundwater flow direction shifts from the eastern part of the study area to the central part (inside the valley), the water type transitions to Ca-Mg-HCO3 due to water–rock interaction and replacement of Na+ and K+ with Ca2+ and Mg2+. Few samples outside the valley belong to Class 1. This can be attributed to the vertical flow of groundwater through different stratigraphic layers, where these samples are located in a zone where the water pressure changes from over hydrostatic pressure to under hydrostatic pressure.
Water 15 02888 g017
Table 1. Gathered multi-source data types of Southern-NHGWB.
Data TypeSamplesSourceInstitution
Geological and geophysicalGeologic log130New Urbancsek Data BaseSARA 1
Geophysical logs133
HydrodynamicHydraulic head366Hungarian deep-drilled wells index.
New Urbancsek Data Base.
SARA 1
ME 2
Well diameter466
Screen sections and production rate369
GeochemicalWater samples118National Geochemical DatabaseSARA 1
Note(s): 1 Supervisory Authority for Regulatory Affairs. 2 University of Miskolc, Environmental Management Institute Library.
Table 2. Summary statistics of the dataset used for the geochemical characterization.
pHT (°C)Ec (Ω.m)Na+K+Mg2+Ca2+ClSO42−HCO3CO3NO3TDS
Max8.824.6767.0193.06.529.8106.331.455.0570.00.090.41304.0
Min7.210.7430.016.00.50.12.92.00.0320.00.00.0290.0
Mean7.718.2576.945.52.220.175.07.710.7439.80.01.2614.5
Media7.618.0566.533.42.221.481.17.08.6440.00.00.0604.0
St. Deviation0.32.356.533.81.06.124.44.09.041.90.08.599.2
Note(s): The concentration is expressed in mg/L.
Table 3. Correlation matrix between physicochemical parameters.
Na+K+Mg2+Ca2+ClSO42−HCO3Ec (Ω.m)
Na+1−0.38−0.82−0.88−0.04−0.17−0.3−0.01
K+ 10.310.37−0.010.020.130.05
Mg2+ 10.740.070.220.440.21
Ca2+ 10.30.270.60.36
Cl 10.250.340.5
SO42− 10.160.27
HCO3 10.6
Ec (Ω.m) 1
Note(s): The concentration is expressed in mg/L.
Disclaimer/Publisher’s Note: The statements, opinions and data contained in all publications are solely those of the individual author(s) and contributor(s) and not of MDPI and/or the editor(s). MDPI and/or the editor(s) disclaim responsibility for any injury to people or property resulting from any ideas, methods, instructions or products referred to in the content.