Article

Diagnosis of Groundwater Quality in North Assiut Province, Egypt, for Drinking and Irrigation Uses by Applying Multivariate Statistics and Hydrochemical Methods

1
Geology Department, Faculty of Science, Minia University, Minia 61519, Egypt
2
Egyptian Petroleum Sector, Petrotrade Co., 1 Anwar Al Moftty St.-Abbas El Akkad St.-Nasr City, Cairo, Egypt
3
Laboratory of Geoenvironmental Science and Environmental Quality Assurance, Department of Civil Engineering, School of Engineering, University of West Attica, 250 Thivon & P. Ralli Str., 12241 Athens, Greece
4
Department of Civil Engineering, University of Bristol, Bristol BS8 1TR, UK
5
Geology and Geophysics Department, College of Science, King Saud University, Riyadh 11451, Saudi Arabia
*
Authors to whom correspondence should be addressed.
Water 2023, 15(15), 2812; https://doi.org/10.3390/w15152812
Submission received: 4 July 2023 / Revised: 26 July 2023 / Accepted: 1 August 2023 / Published: 3 August 2023

Abstract

:
Globally, groundwater is a valuable natural resource that may be relied upon for irrigation and drinking needs. The main purpose of this study is to investigate the groundwater geochemistry in the West of El Qusiya, Assuit, Egypt. Groundwater suitability for irrigation has been estimated with some methods, for instance, electrical conductivity (EC), sodium adsorption ratio (SAR), residual sodium carbonate (RSC), Killey ratio (KR), magnesium hazard (MH), permeability index (PI), Piper trilinear diagram, and USSL diagram. The Piper diagram shows that the sodium and potassium (Na+K) kind dominates the water chemistry, followed by the mixed type. The principal coordinate analysis (PCoA), cluster analysis (CA), principal component analysis (PCA), and Pearson correlation matrix analysis (PCMA) statistical methods reveal that the physicochemical parameters of water collected from the Eocene and Pleistocene aquifers are produced from mixed origins. The geogenic origin reflects the lithologic impact of aquifers matrix and water interactions, in addition to anthropogenic sources caused by infiltration of secondary salts initiated due to fertilizers and agriculture water. These factors are the controller for groundwater’s ionic (Na+, Ca2+, Mg2+, K+, Cl, SO42−, and HCO3) variation in the area studied. Based on SAR, KR, and PI results, groundwater is acceptable for irrigation. Consistent with RSC, MH, and Na% results, approximately 50% of the groundwater samples are unsuitable for irrigation use.

1. Introduction

Worldwide, approximately two-thirds of the world’s residents use groundwater resources, which provide fresh water for different domestic purposes [1,2]. The world’s groundwater supply is under extreme strain due to increased demand, with over 65% of it being utilized for drinking, 20% for irrigation, and 15% for industrial uses [3]. Water has been utilized for various purposes because of its distinct physical and chemical characteristics. Research has been conducted globally to evaluate groundwater appropriateness for drinking and irrigation [4,5,6,7,8,9,10,11,12]. Groundwater research has assumed a prominent role in semi-arid regions to promote the sustainable development and management of water resources [2]. Several natural and anthropogenic factors affect the quality of groundwater, like geology, topography, structures, evaporation or precipitation rates, interactions between water and rock, weathering, industrial effluents, fertilizers, and other factors [13]. Groundwater quality has been affected by overexploitation of groundwater for human use, pesticide contamination, intensive application of fertilizers, and industrial waste disposal [14]. Geological, geochemical, climate, and anthropogenic factors influence groundwater quality. The concentration of these parameters influences its suitability for human consumption, irrigation, and industrial usage. Therefore, it is essential to evaluate groundwater quality to define its suitability for different purposes [15]. Studying water suitability for different applications requires an in-depth study of hydrochemical properties and groundwater quality [16]. The World Health Organization [17] and permissible Egyptian limits [18] provide the permitted bounds of different ions for drinking water. The elevated concentrations of these ions could be harmful and deteriorate groundwater quality, which hinders the appropriateness of irrigation and drinking. But, providing quality assessments and determining if a groundwater resource is suitable for different applications is one of the biggest challenges facing groundwater experts [13]. The lithological and geochemical compositions of the rocks, human activities, and weathering processes of rocks, sediments, and soils all affect the groundwater quality [19,20]. Because of the recent rapid industrialization and population growth, there has been an enormous rising in freshwater demand [21,22,23,24]. Consequently, many investigators concentrated on the groundwater quality in various areas.
The Mediterranean region’s groundwater resources have recently emerged as an important factor in the drinking water and economic sectors. The groundwater resources of Mediterranean countries are susceptible to contamination by major and trace elements due to agricultural practices and the accompanying anthropogenic activities in cultivated areas of these countries [25,26]. Due to the growing population and development of agricultural operations, there has been an enormous demand for freshwater in recent years [27].
In Egypt, groundwater is a vital source for various purposes (irrigation, drinking, and industry). This work evaluates the groundwater vulnerability and its susceptibility to pollution using GIS incorporating statistical techniques. Considerate groundwater quality as well aids in the development of scientifically comprehensive corrective actions in the area under investigation (El Qusiya). Finally, this study presents an up-to-date assessment of the groundwater quality in thearea studied.

2. Materials and Methods

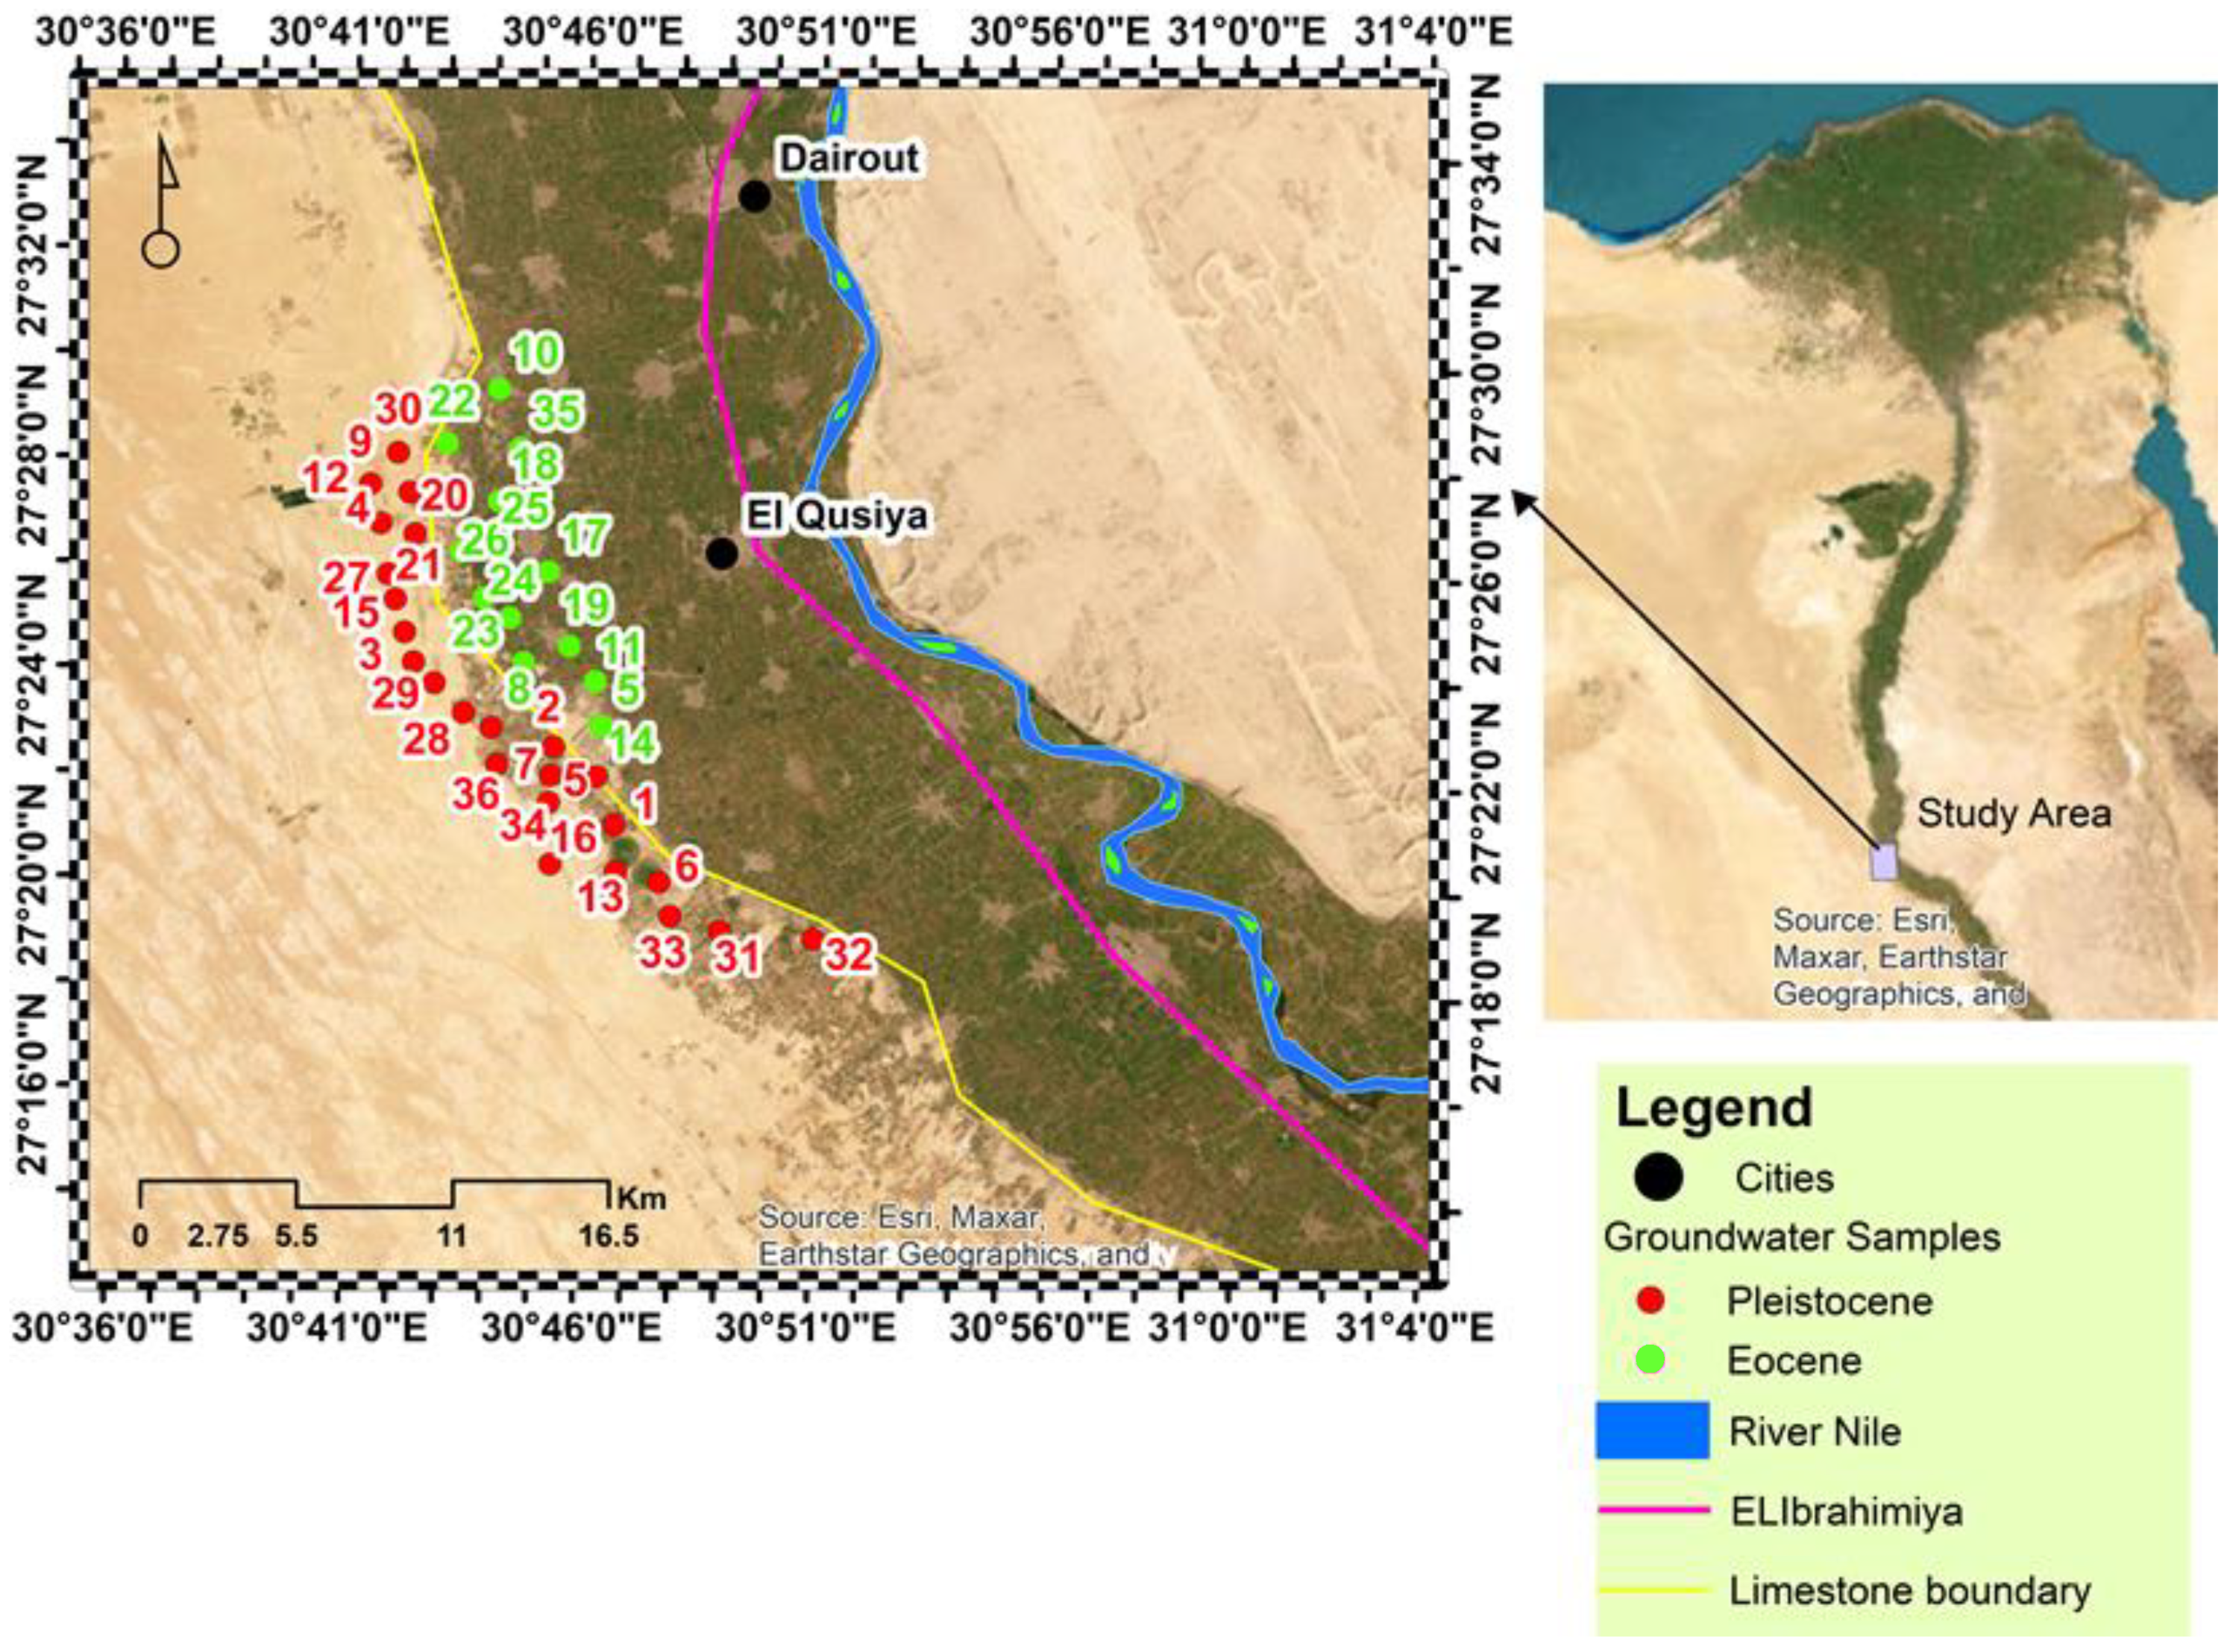
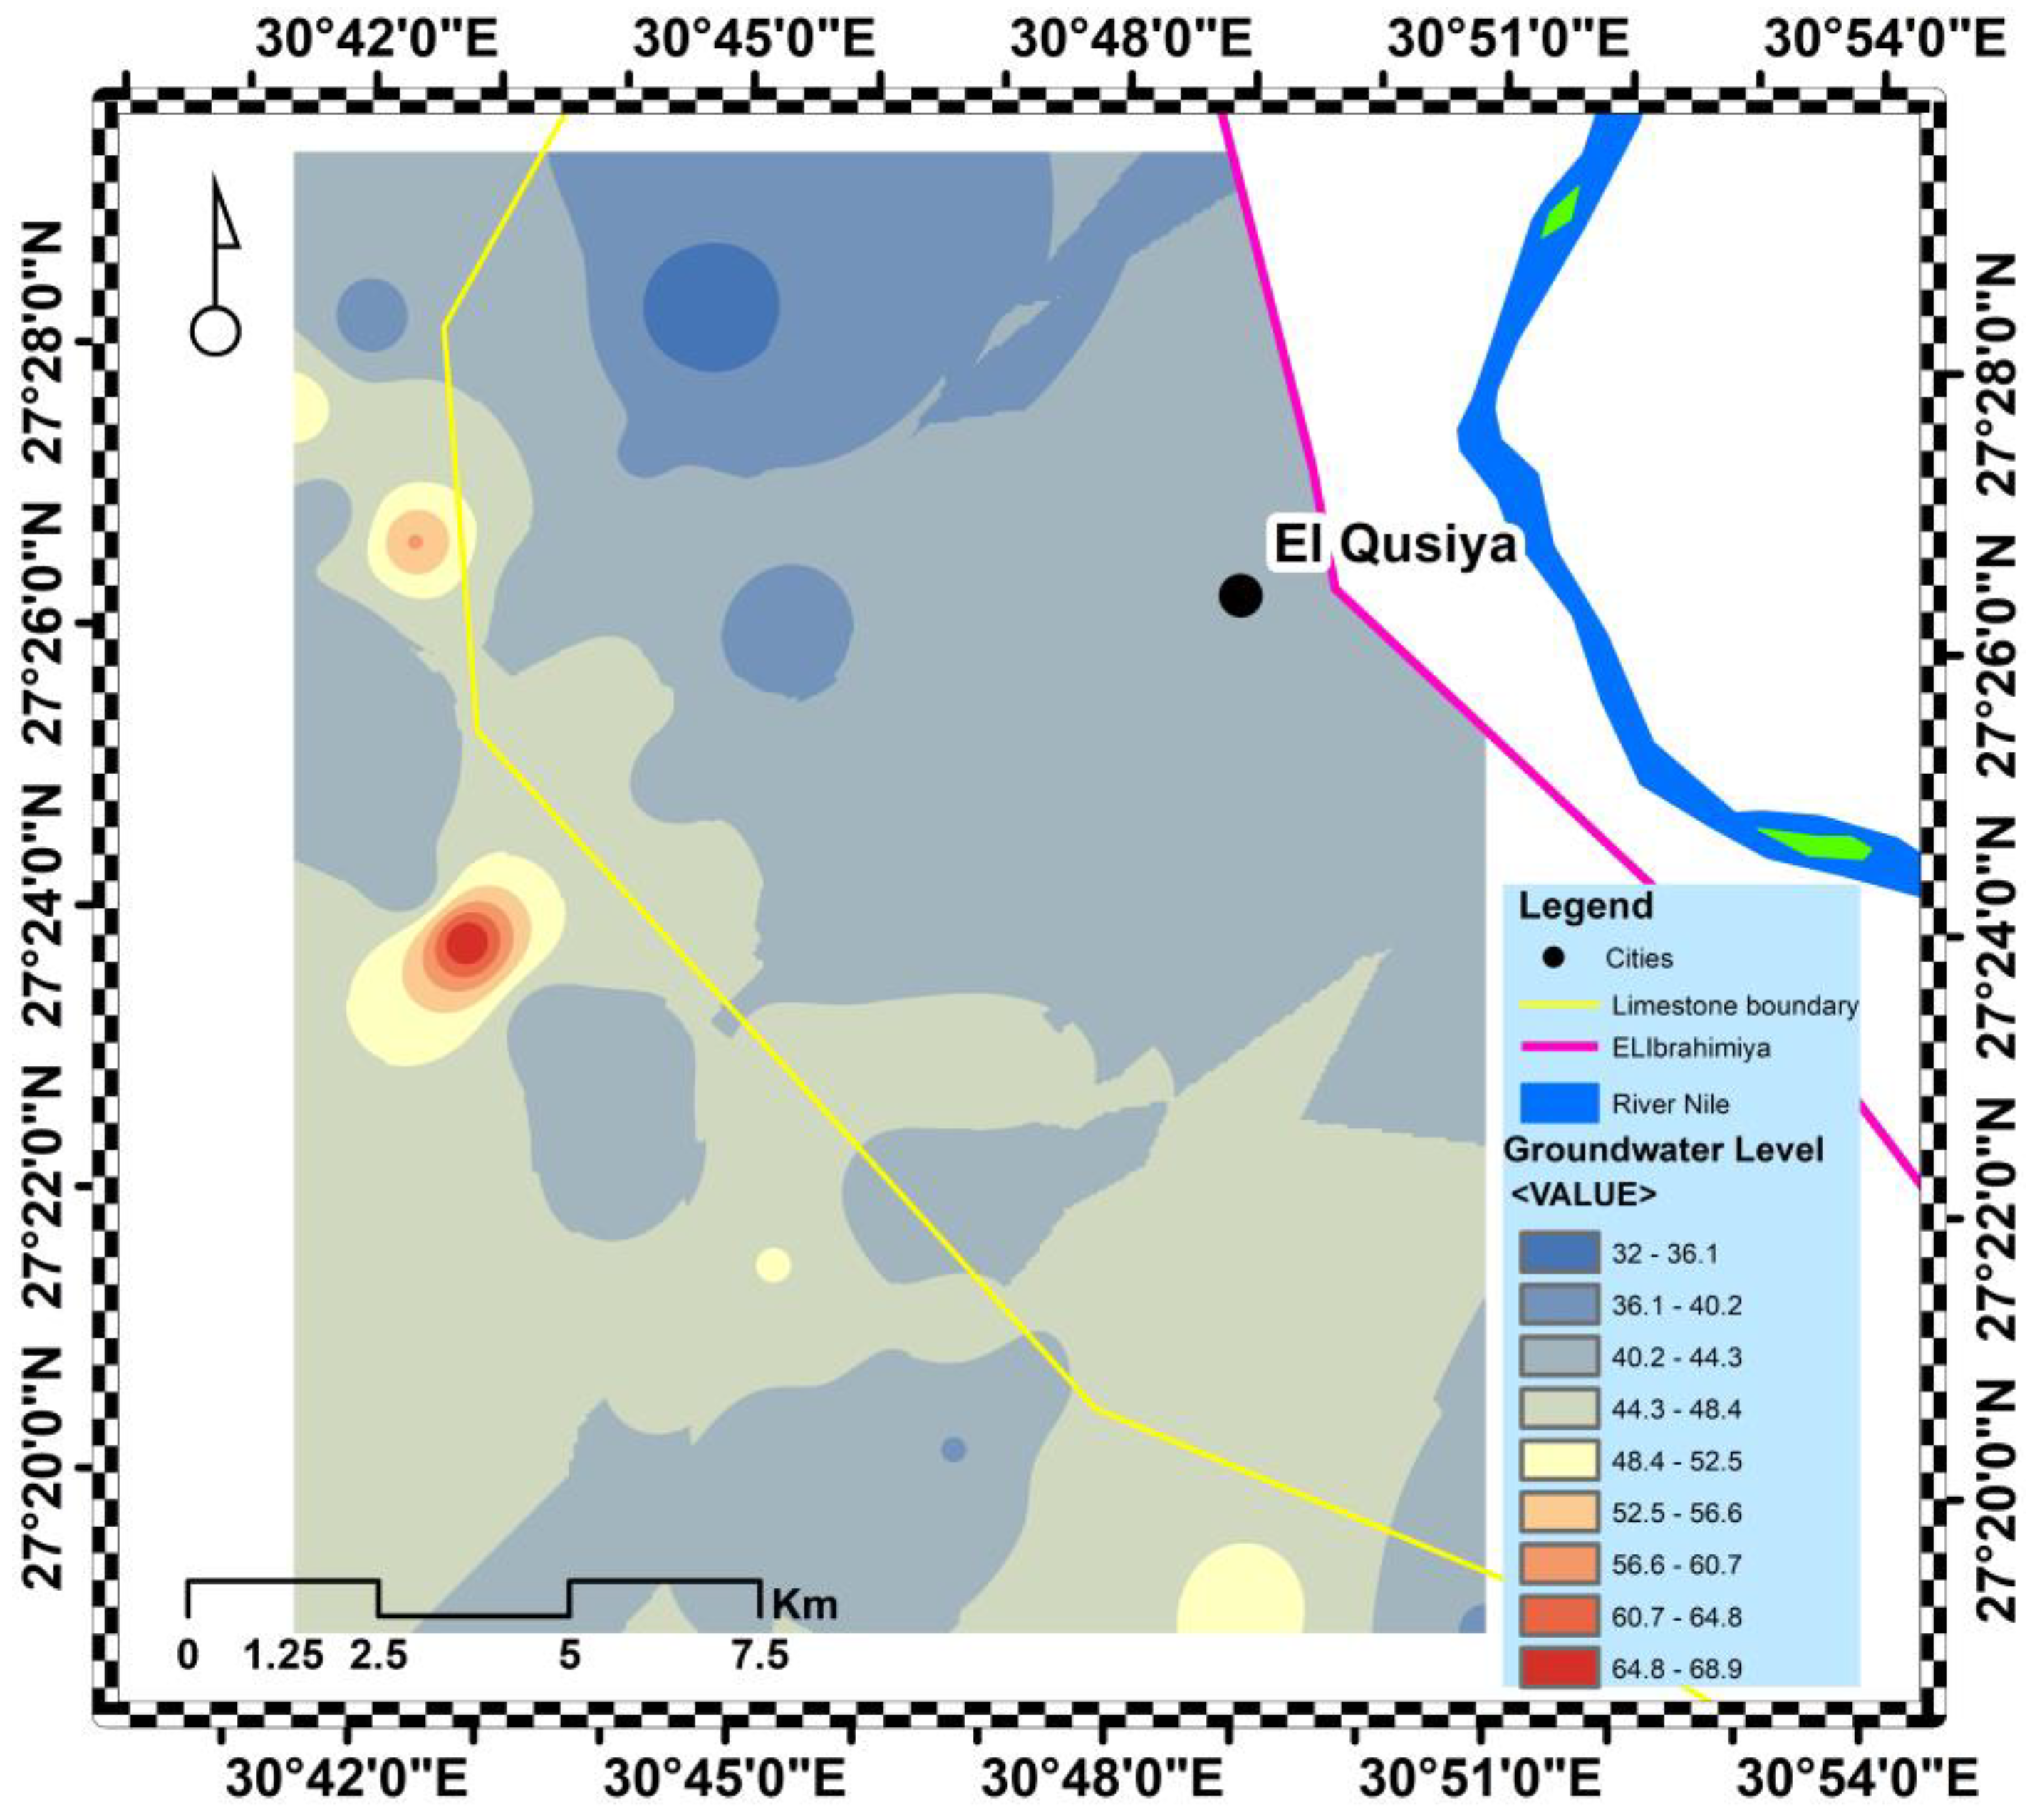
2.1. Geological and Hydrogeological Situation of the Study Area

The study area (El Qusiya) lies between latitudes 26°50′ and 27°40′ N and longitudes 30°40′ and 31°32′ E (Figure 1). Many researchers [28,29,30] conducted various geological and geophysical studies in many regions worldwide. The sedimentary strata emerging in the study region date from the Lower Eocene to the Quaternary. The plateau bordering the Nile Valley, which comprises a significant portion of the research region, represents the Lower Eocene carbonate rocks. The Nile Valley’s subsoil is composed of Lower Eocene rock. Deposits from the Pliocene and Quaternary are present throughout the Nile Gorge. The Pliocene layers, which are unconformable and overlay the Eocene carbonate, consist of clay with occasional sand interbeds. Sand and gravel comprise the Quaternary deposits, typically covered in silty-clay layers.
Pleistocene and Eocene limestone rock units were identified as water-bearing horizons based on the stratigraphical sequence and the area’s dug well information. The primary water-bearing formation in the district is the Pleistocene aquifer, which is widely distributed. It is primarily composed of sand, gravel, and clay intercalations. The Pliocene clays and the fractured Eocene limestone that comprise the aquifer’s base serve as its foundation. The fractured Eocene limestone aquifer occupies the western part of the region. The aquifer consists of hard, snow-white, severely fractured limestone intercalated with shale and marl. The area was impacted by hydraulic linking with the recent aquifers and the Eocene aquifer through the structural form. Except for the neighboring Bahr Yusef aquifer, where the groundwater is discovered under semi-confined conditions and covered by semi-permeable Holocene silt, the Pleistocene aquifer’s groundwater occurs in unconfined settings throughout the studied region.
In contrast, the fractured Eocene aquifer’s groundwater arises in an open environment covered by permeable layers. Due to the irrigation system of the reclaimed and nearby former farmed lands, the Pleistocene aquifer is recharged by irrigation return flow. The Eocene aquifer in the west may recharge from the percolation of irrigation water, and the younger aquifers south of the region, the Eocene aquifer, is refilled. Both aquifers are discharged from the production wells, which are employed to irrigate the reclamation projects. The ground elevation of the study area ranged from 43 to 83 m above sea level. The depth to water of the Pleistocene aquifer ranges from 2 to 43 m, while in the Eocene, the aquifer varies between 5 and 30 m. Figure 2 shows the water table map of the study area.

2.2. Sampling and Analytical Processes

In May 2022, groundwater samples were collected from 36 monitoring sites used for irrigation and drinking (12 from the Pleistocene and 24 from the Eocene aquifer). Deionized water was used to rinse one-liter plastic bottles first, then distilled water. After pumping out water for around 30 min to discharge stagnant water from the well, water samples were collected, transported, and stored at 4 °C until analyzed in the Agricultural Governorate, Minia, Egypt, using the industry-recommended standard techniques [31]. The groundwater samples were examined for several hydrochemical parameters, including pH, electrical conductivity (EC), total dissolved solids (TDS), total hardness (TH), and major cations and anions. The pH was determined according to ASTM D-1293 using an Eu-tech cyberscan-pH 310 m with a combined glass electrode, EC, and TDS measured using a WPA CM 35 Conductivity Meter. EC, TDS, and pH of water samples were measured in situ as soon as they had been collected. The titrimetric method was used to determine Ca2+ and Mg2+ using regular EDTA. HCO3 was measured using a titration method, while Cl was determined using AgNO3 titration. Sodium and K+ were measured using the Flame-photometer (model FP 910), and SO42− was measured by colorimetry with a UV–Visible spectrophotometer. The groundwater chemical analysis results were plotted on the Piper diagram using Aqua-Chem software (Aqua-Chem v4.0) to identify the types of water samples. Electrical conductivity (EC), sodium adsorption ratio (SAR), residual sodium carbonate (RSC), sodium percent (Na%), Kelly’s ratio (KR), sodium percent (% Na), magnesium ratio (MH), permeability index (PI), and United States Salinity Laboratory (USSL) diagram were applied to evaluate the suitability of water for agricultural use (Table 1). Microsoft® Excel was used to prepare and process the data. Arc-GIS 10.2 was utilized to generate spatial distribution maps of the principal ions and other groundwater quality indicators.

2.3. Statistical Investigation

The statistical PAST program [32] was applied to identify principal coordinate analysis (PCoA) and cluster analysis (CA). IBM® SPSS v.26 was utilized to generate principal component analysis (PCA) and Pearson correlation matrix analysis (PCMA) [33,34].
Table 1. Calculating equations for irrigation quality parameters.
ItemsEquationsReferences
THTH = 2.497 Ca2+ + 4.115Mg2+ ions in meg/L[35]
SAR SAR = Na / ( Ca + Mg ) / 2 all ions in meq/L[36]
Na (%) Na   % = ( Na + K ) ( Ca + Mg + Na + K ) × 100   all ions in meq/L[37]
RSC RSC = ( HC O 3 + C O 3 ) ( C a + + + M g + + ) all ions in meq/L[35]
MH MH = Mg ( Ca + Mg ) × 100 all ions in meq/L[38]
SSP((Na+ + K+)/(K+ + Na+ + Ca2+ +Mg2+)) ×100 all ions in meq/L[39]
PI(Na+ + √HCO3)/(Ca2+ + Mg2+ + Na+) ×100 all ions in meq/L[40]
Kelly’s Ratio KR = Na ( Ca + Mg ) all ions in meq/L[41]

3. Results

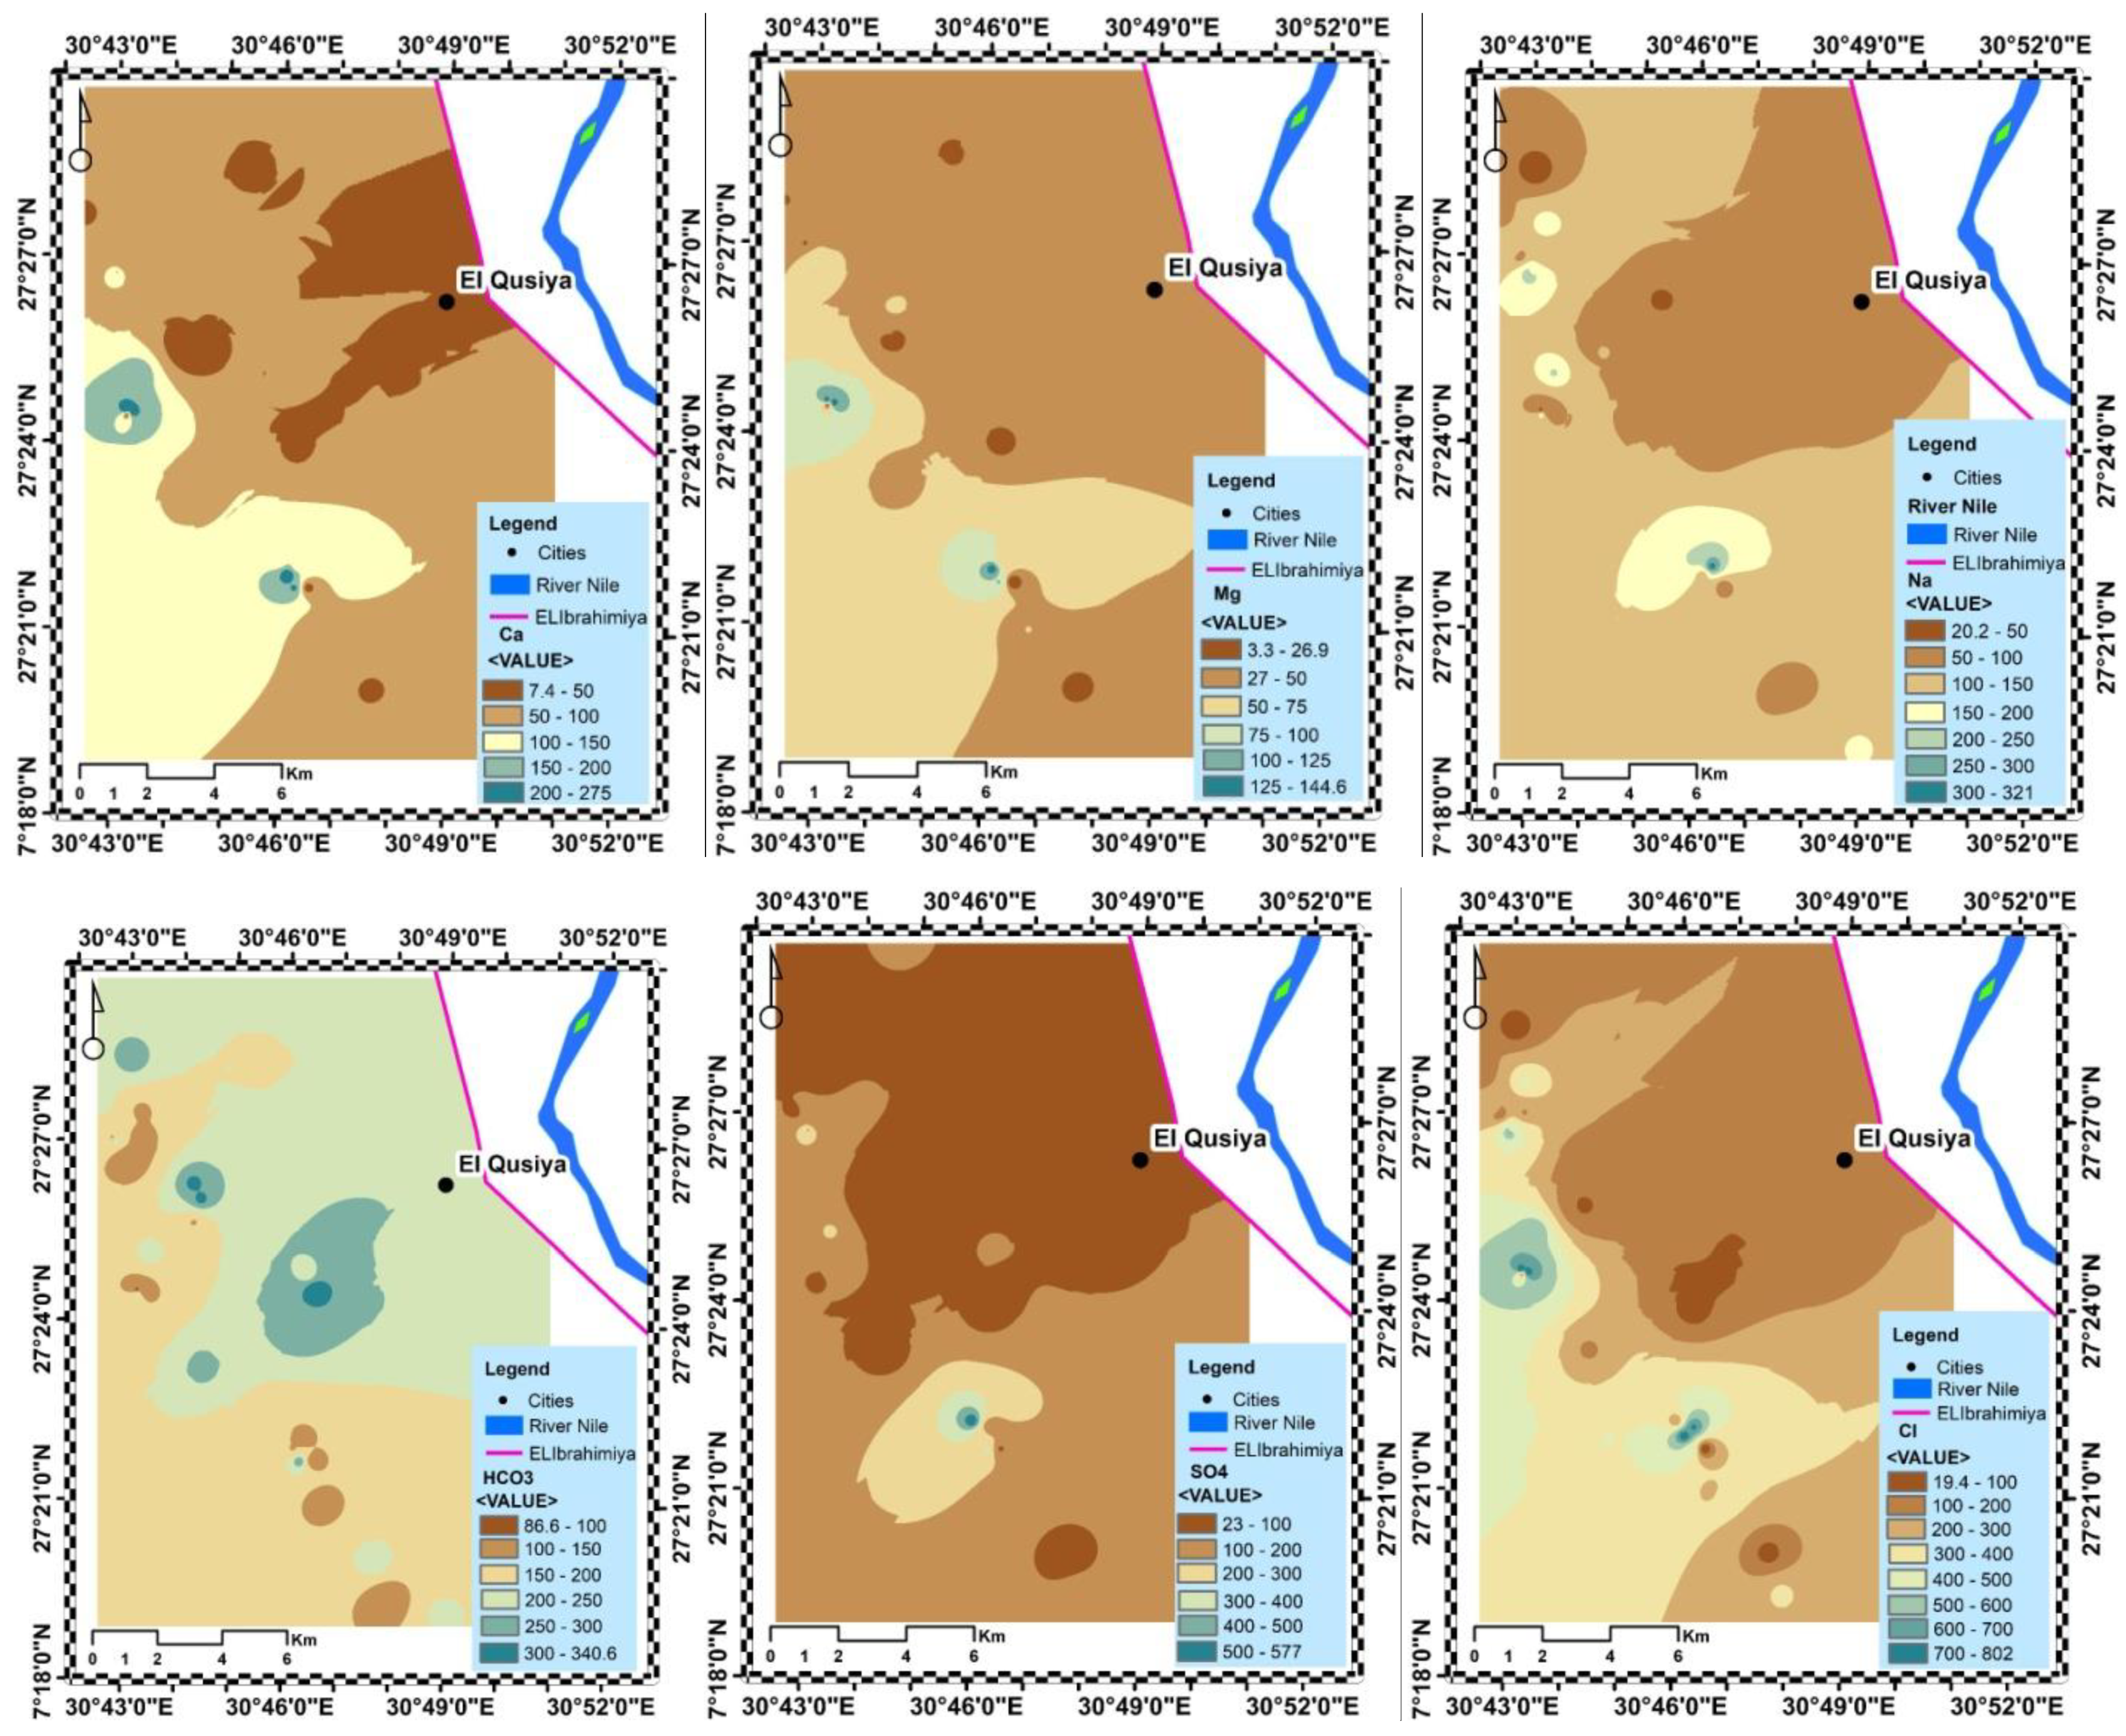
3.1. Hydrochemical Features

Table 2 summarizes the descriptive statistics values of the Pleistocene aquifer physicochemical parameters for the study area. The water samples of the Pleistocene aquifer are warm, with a temperature (T) ranging from 24.9 to 30.6 °C with a mean value of 27.93 ± 1.37 °C. The electrical conductivity (EC) range of 860–1330 μS cm−1 with a mean value of 1049.75 ± 176.51 μS cm−1. EC values revealed that the Pleistocene aquifer samples present high ionic strength. The total dissolved solids (TDS) range is 550–851 mg L−1, with a mean value of 671.67 ± 112.97 mg L−1. The groundwater samples are slightly alkaline to alkaline, with pH fluctuating from 7.2 to 8.6 with a mean value of 8.02 ± 0.42.
The dissolved cations Ca2+, Mg2+, Na+, and K+ concentration ranging from 8 to 82.8 mg L−1, 22 to 63 mg L−1, 18 to 144 mg L−1, and 0.3 to 3.6 mg L−1 with the mean values of 52.23 ± 21.24 mg L−1, 36.35 ± 11.21 mg L−1, 80.58 ± 34.68 mg L−1, and 1.83 ± 0.98 mg L−1, respectively. The concentration of dissolved anions HCO3, SO42−, and Cl ranged from 196 to 338 mg L−1, from 33 to 116 mg L−1, and from 42.6 to 216 mg L−1 with the mean concentration of 270.84 ± 45.93 mg L−1, 67.92 ± 26.03 mg L−1, and 116.71 ± 47.79 mg L−1, respectively.
The primary dominance of major cations of the groundwater are Na+ > Ca2+ > Mg2+ > K+, whereas the dominant anions are in the order of HCO3 > Cl > SO42−.
Table 3 tabulates the descriptive statistics values of the physicochemical parameters of the water sampled from the Eocene aquifer. The water temperature of the Eocene aquifer ranges from 26.8 to 30.5 °C with a mean value of 28.48 ± 1.10 °C. EC values vary significantly, with 520–3240 μS cm−1 ranges and a mean value of 1767.58 ± 859.78 μS cm−1. The EC values in Eocene water display high ionic strength. The TDS widely fluctuated from 333 to 2074 mg L−1, with a mean value of 1131.29 ± 550.25 mg L−1. The water samples fluctuate from slightly alkaline to alkaline, with pH extending from 7.1 to 8.6 with a mean value of 7.81 ± 0.38.
The dissolved cations Ca2+, Mg2+, Na+, and K+ concentration range from 12 to 254 mg L−1, 4.43 to 143 mg L−1, 56 to 385 mg L−1, and 0.3 to 4.2 mg L−1 with mean values of 100.33 ± 68.88 mg L−1, 54.19 ± 37.77 mg L−1, 163.75 ± 86.64 mg L−1, and 2.31 ± 1.15 mg L−1, respectively. The dissolved anions HCO3, Cl, and SO42− concentrations ranges from 104 to 348 mg L−1, from 24 to 620 mg L−1, and from 14.2 to 896.4 mg L−1 with the mean concentration of 210.51 ± 65.91 mg L−1, 153.29 ± 133.72 mg L−1, and 353.29 ± 281.01 mg L−1, respectively.
The major cations in the groundwater are Na+ > Ca2+ > Mg2+ > K+, while the dominant anions are in the order of Cl > SO42− > HCO3.
As reported by Tariq et al. [42] and Ledesma-Ruiz et al. [43], the standard deviations of the examined physicochemical parameters are lower than the mean in both Eocene and Pleistocene aquifers, indicating that the geochemistry of the examined groundwater is homogeneous. Moreover, the controlling order of evaluated ions in both aquifers reveals the role of carbonate mineral dissolution in the study area. Holand [44] stated that 74 ± 10% of Ca2+ and 40 ± 20% of Mg2+ in groundwater were caused by carbonate minerals dissolution. The pH range in water of both Eocene and Pleistocene aquifers tends to be alkaline [45], indicating that the more alkaline water typically meets groundwater rich in dissolved elements.

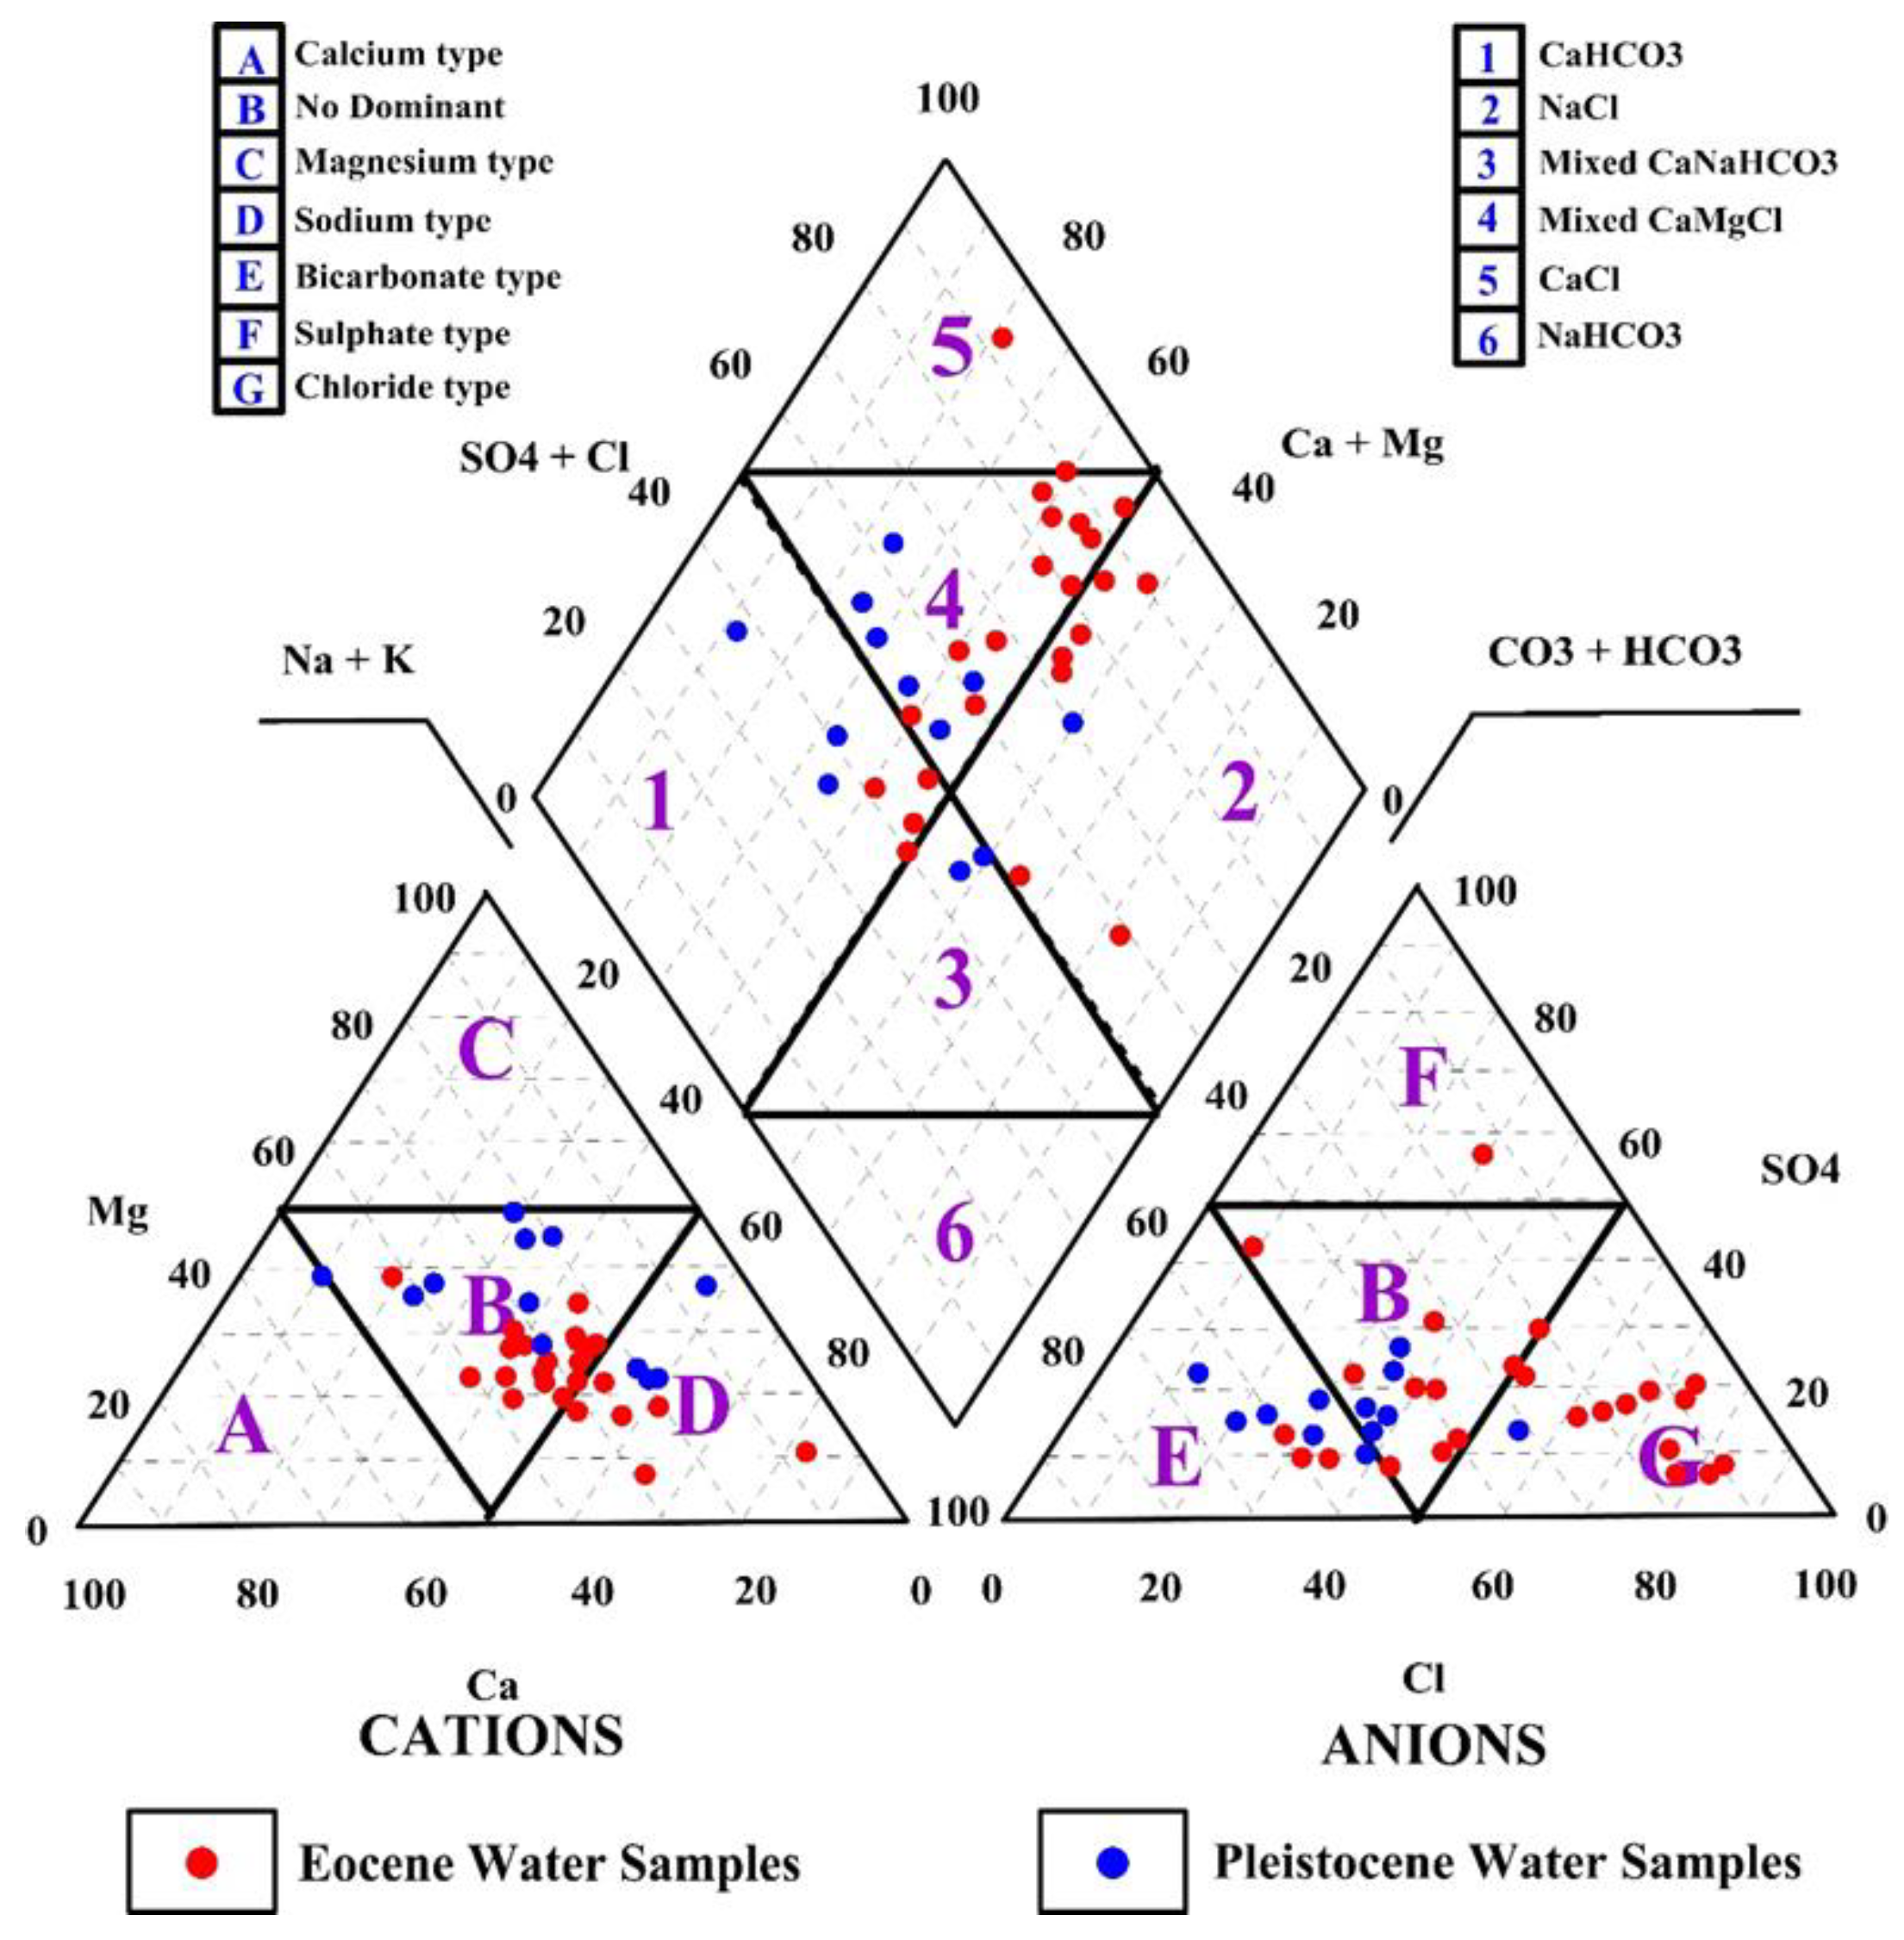
3.2. Groundwater Types

According to the fundamental geochemical characteristics of the fundamental ionic concentrations, Piper’s trilinear diagram [46] is an efficient visual technique to categorize groundwater (Figure 3). Additionally, pinpointing the precise geochemical characteristics and chemical interactions in groundwater is helpful [46]. Based on the Piper diagram, the area’s groundwater is primarily divided into six categories: Ca2+-HCO3, Na+-Cl, mixed Ca2+-Na+-HCO3, mixed Ca2+-Mg2+-HCO3, Ca2+-Cl, and Na+-HCO3 are listed in order from first to last. The current analysis demonstrates that the common Pleistocene and Eocene water samples are of the calcium–magnesium–chloride (Ca2+-Mg2+-Cl) and calcium–bicarbonate (Ca2+-HCO3) kinds, with a small amount of Na+-Cl water categories. In addition, the Piper diagram suggests that Na+ is dominant in groundwater because of the dissolution of limestone. Furthermore, HCO3 and Cl are the dominant anions in groundwater of the study area.

3.3. Groundwater Constituents Origins and Regulatory Factors

Bartlett’s sphericity and Kaiser–Meyer–Olkin (KMO) were applied to recognize the dataset fittingness for the PCA technique. The KMO statistical value equaled 0.473; it does not fit the PCA requirement. The authors of [47] indicated that the PCA necessitates KMO sampling adequacy to be more than 0.50 for the variables set, and the factor higher than the loading value of 0.50 is significant. After anti-image matrices, HCO3 reveals the lowest value (0.055) of the separate variables and lesser than 0.50 as the KMO sampling adequacy value. Comparable to Aliyu et al. [48], HCO3 was eliminated, and the PCA was rerun. The overall KMO value is increasing to 0.591 at Bartlett’s sphericity (χ2) test of zero (gets along with p(Sig.) < 0.0001) for the Eocene aquifer samples. These values approve that the data are sufficient for PCA utilization [49,50,51]. Table 4 shows three significant components for the Eocene aquifer data (eigenvalues > 1), representing 84.118% of the variance, as revealed in Figure 4.
Table 5 reveals that PC1 is the greatest significance, with 59.070% of the variance; it displays positive loading with EC, TDS, Ca2+, Mg2+, Na+, SO42−, and Cl. This group possibly initiates from the aquifer matrix through the water–rock interactions. In contrast, Cl and SO42− ions are commonly linked to sedimentary rocks [52]. Additionally, the Cl and SO42− concentrations in groundwater are usually a pollution indicator [53,54]. Cl and SO42− loading rising confirms the effects of fertilizers and stagnant water (drains, ponds, and septic tanks). In line with Rahman et al. [55], the geochemical alteration from irrigation activities runoff and sediments leaching may have originated. Na+, Mg2+, and Ca2+ in groundwater are natural ingredients as these cations are introduced to water from rocks, in addition to sources related to landfill leachate [56].
According to Aliyu et al. [48], the breakdown of inorganic materials in water cause ions loading. Bodrud-Doza et al. [57] reported that TDS and EC can be attributed to the geological weathering settings and geogenic effect, leading to groundwater hydrogeochemical evolution owing to elevated ionic concentration. In addition, it may result from exhaustive anthropogenic actions with cations and anions exchange. Hydro-geochemically, the elevated input from cations and anions causes the EC high positive loading, indicating an intensive ion exchange caused by water–sediment interaction. Hence, the weathering process of the aquifer matrix, which causes the ions input is the main factor controlling the EC and TDS values. The PC2 accounted for 13.546% of the variance and showed high positive loading for temperature (T) and negative loading for pH. The temperature shows strong positive loading, which characterizes the variations in groundwater temperature (no thermal pollution), as reported by Ustaoğlu and Tepe [50]. The pH loading characterizes the minerals’ dissolution from the aquifer matrix weathering. The PC3 contributes 11.503% of the overall variance and shows positive loading for pH and K+, which can be attributed to the geochemical alteration of irrigation water and leaching after sediment dissolution. At the same time, K+ loading can be related to farming activities and indicate the presence of agricultural and wastewater infiltration. Nevertheless, pH reflects intensive aquifer matrix weathering and the mainly alkaline water nature.

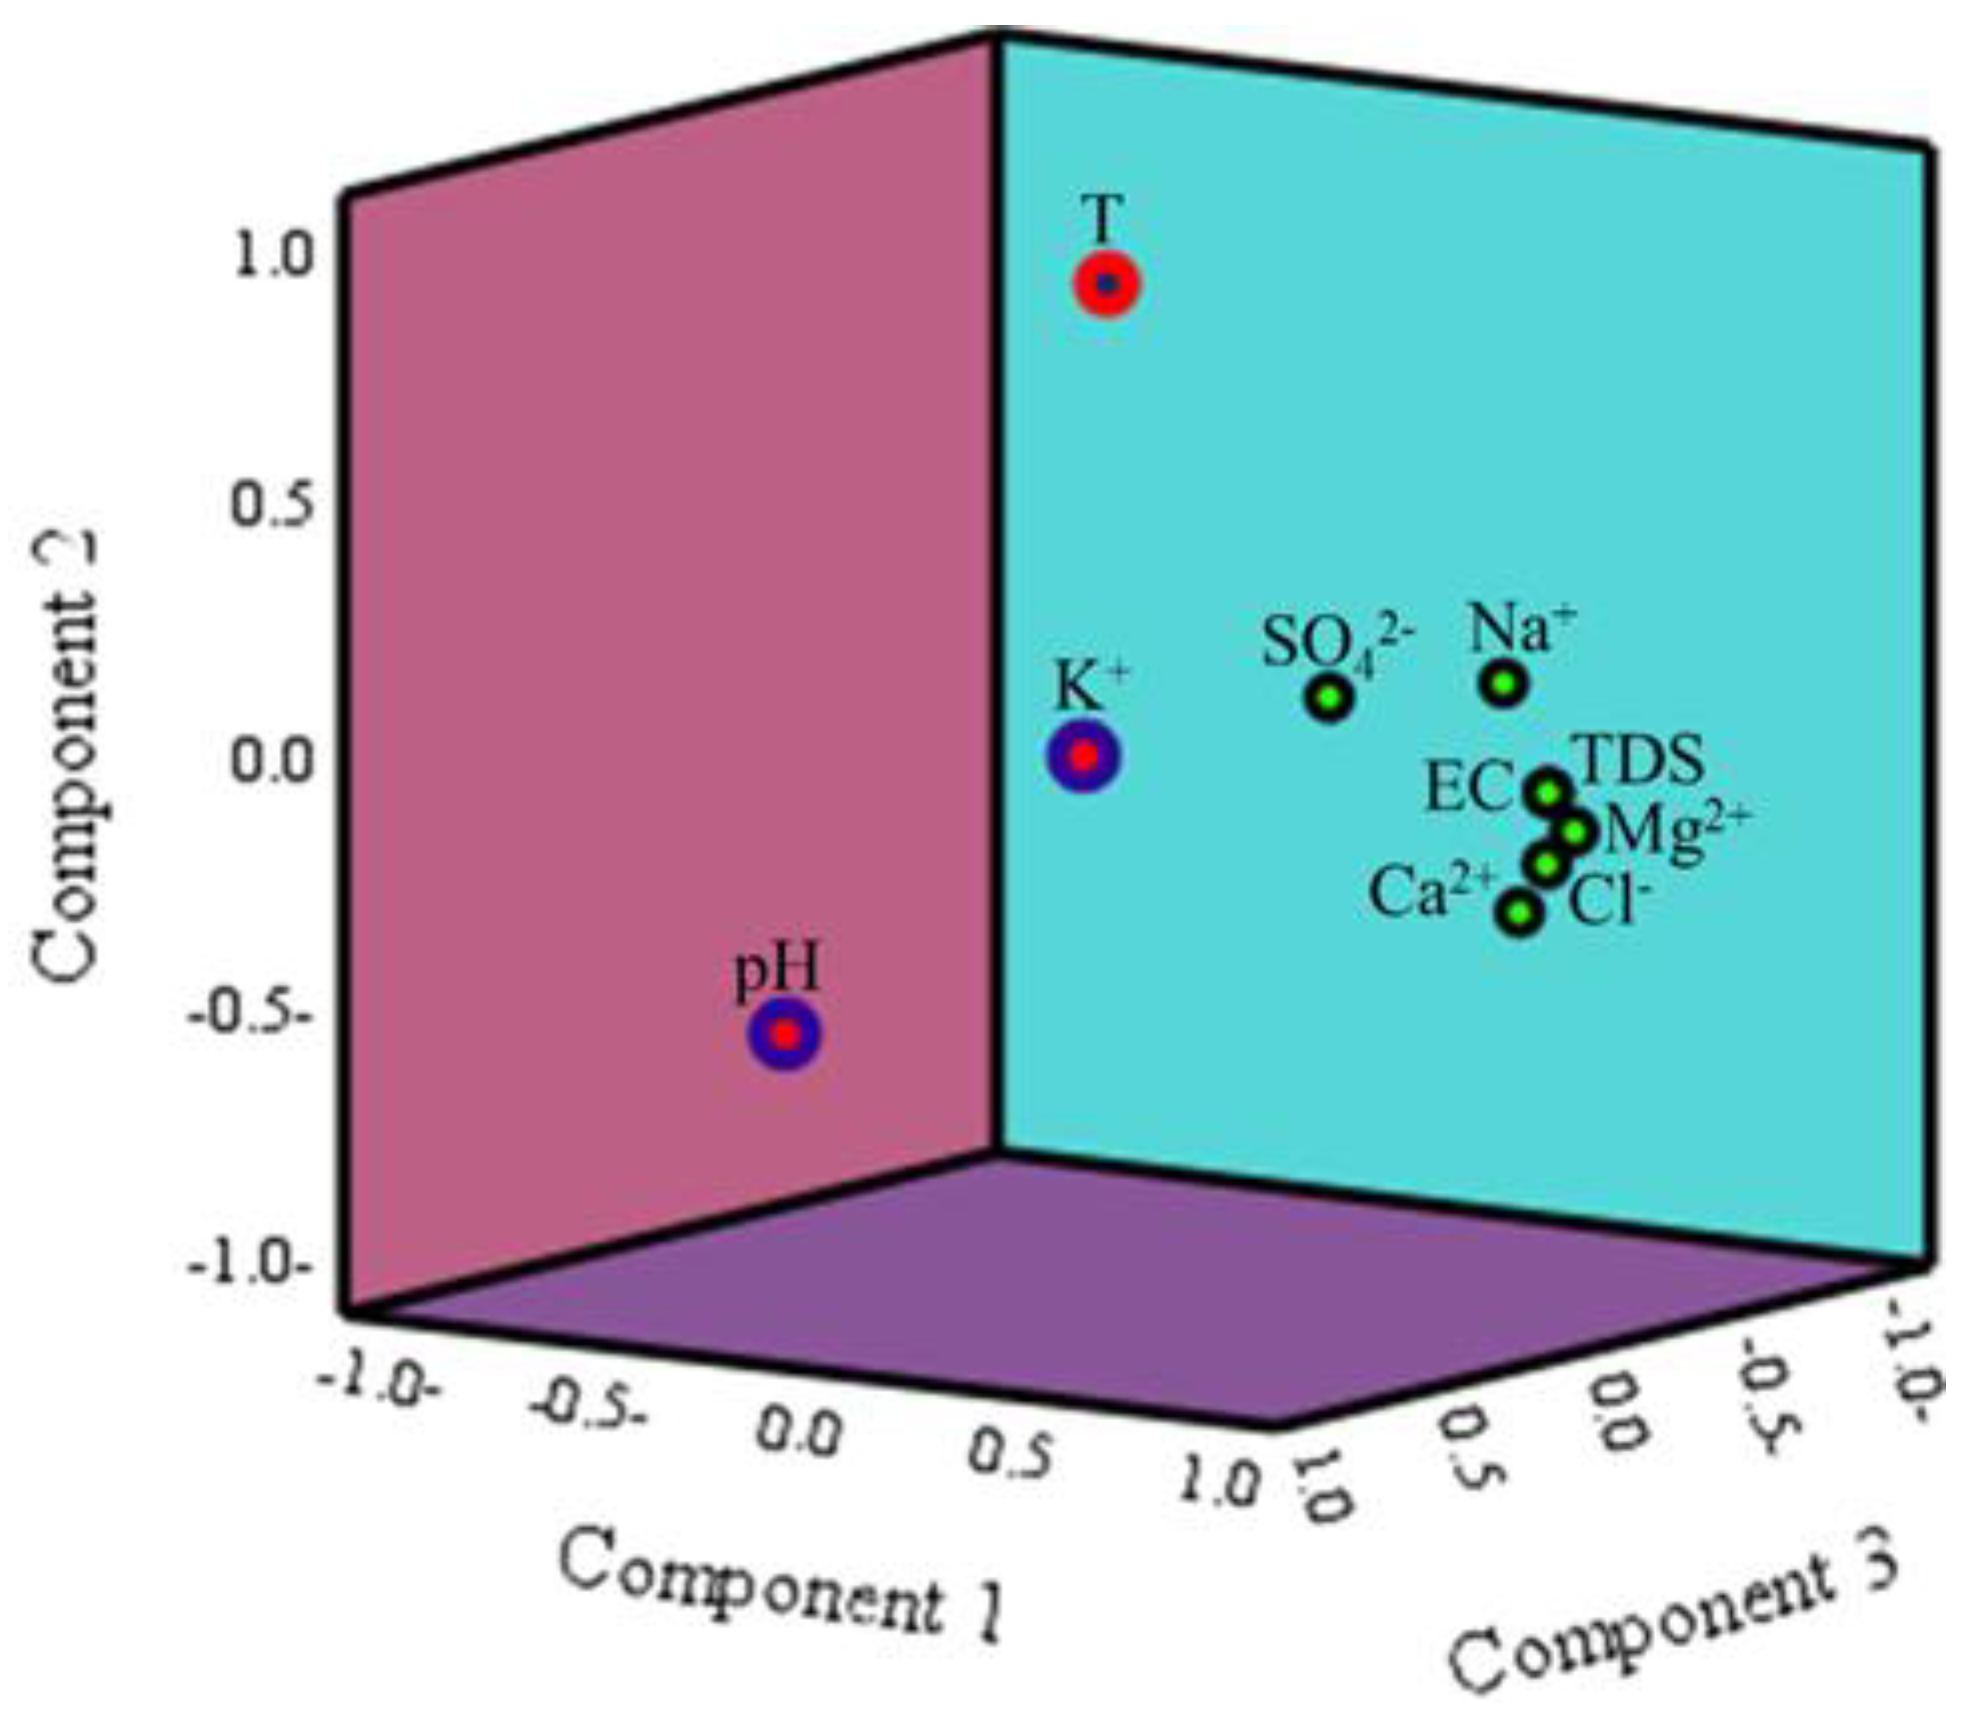
3.4. Pleistocene Aquifer Quality Controlling Factors

The KMO statistic value is insignificant, and the Pleistocene aquifer dataset does not fit the PCA requirement. To explain the relationship of dissolved elements in the Pleistocene aquifer, the dataset is susceptible to the PCoA, which keeps the dataset difference even though reducing the dimensionality [58]. As reported by Liu et al. [47], the factors with eigenvalues greater than or equal to one are significant. Therefore, three significant coordinates are obtained for the Pleistocene aquifer datasets related to eigenvalues of more than 1, as demonstrated in Table 6. Coordinate 1 with an eigenvalue of 2.337, which represents 36.852%. Coordinate 2, through an eigenvalue of 1.344, represents 21.184%, and coordinate 3, with an eigenvalue of 1.128, represents 17.782%. Figure 5 displays three groups obtained from the coordinate 1 and coordinate 2 effects, representing 58.036%. The first group includes Na+ and Cl. These ions result from different possible groundwater sources. The aquifer matrix represents the natural source due to water–rock interactions and anthropogenic origin due to pollution plumes. The second group contains EC, TDS, Mg2+, Ca2+, K+, SO42−, and T, suggesting that the dissolution and weathering of the Pleistocene aquifer parent material is the primary source of these ions and occur in warm conditions. The third group contains pH and HCO3, which explains the intensive weathering of carbonate deposits controlling the alkaline pH; it may also indicate contamination phenomena.

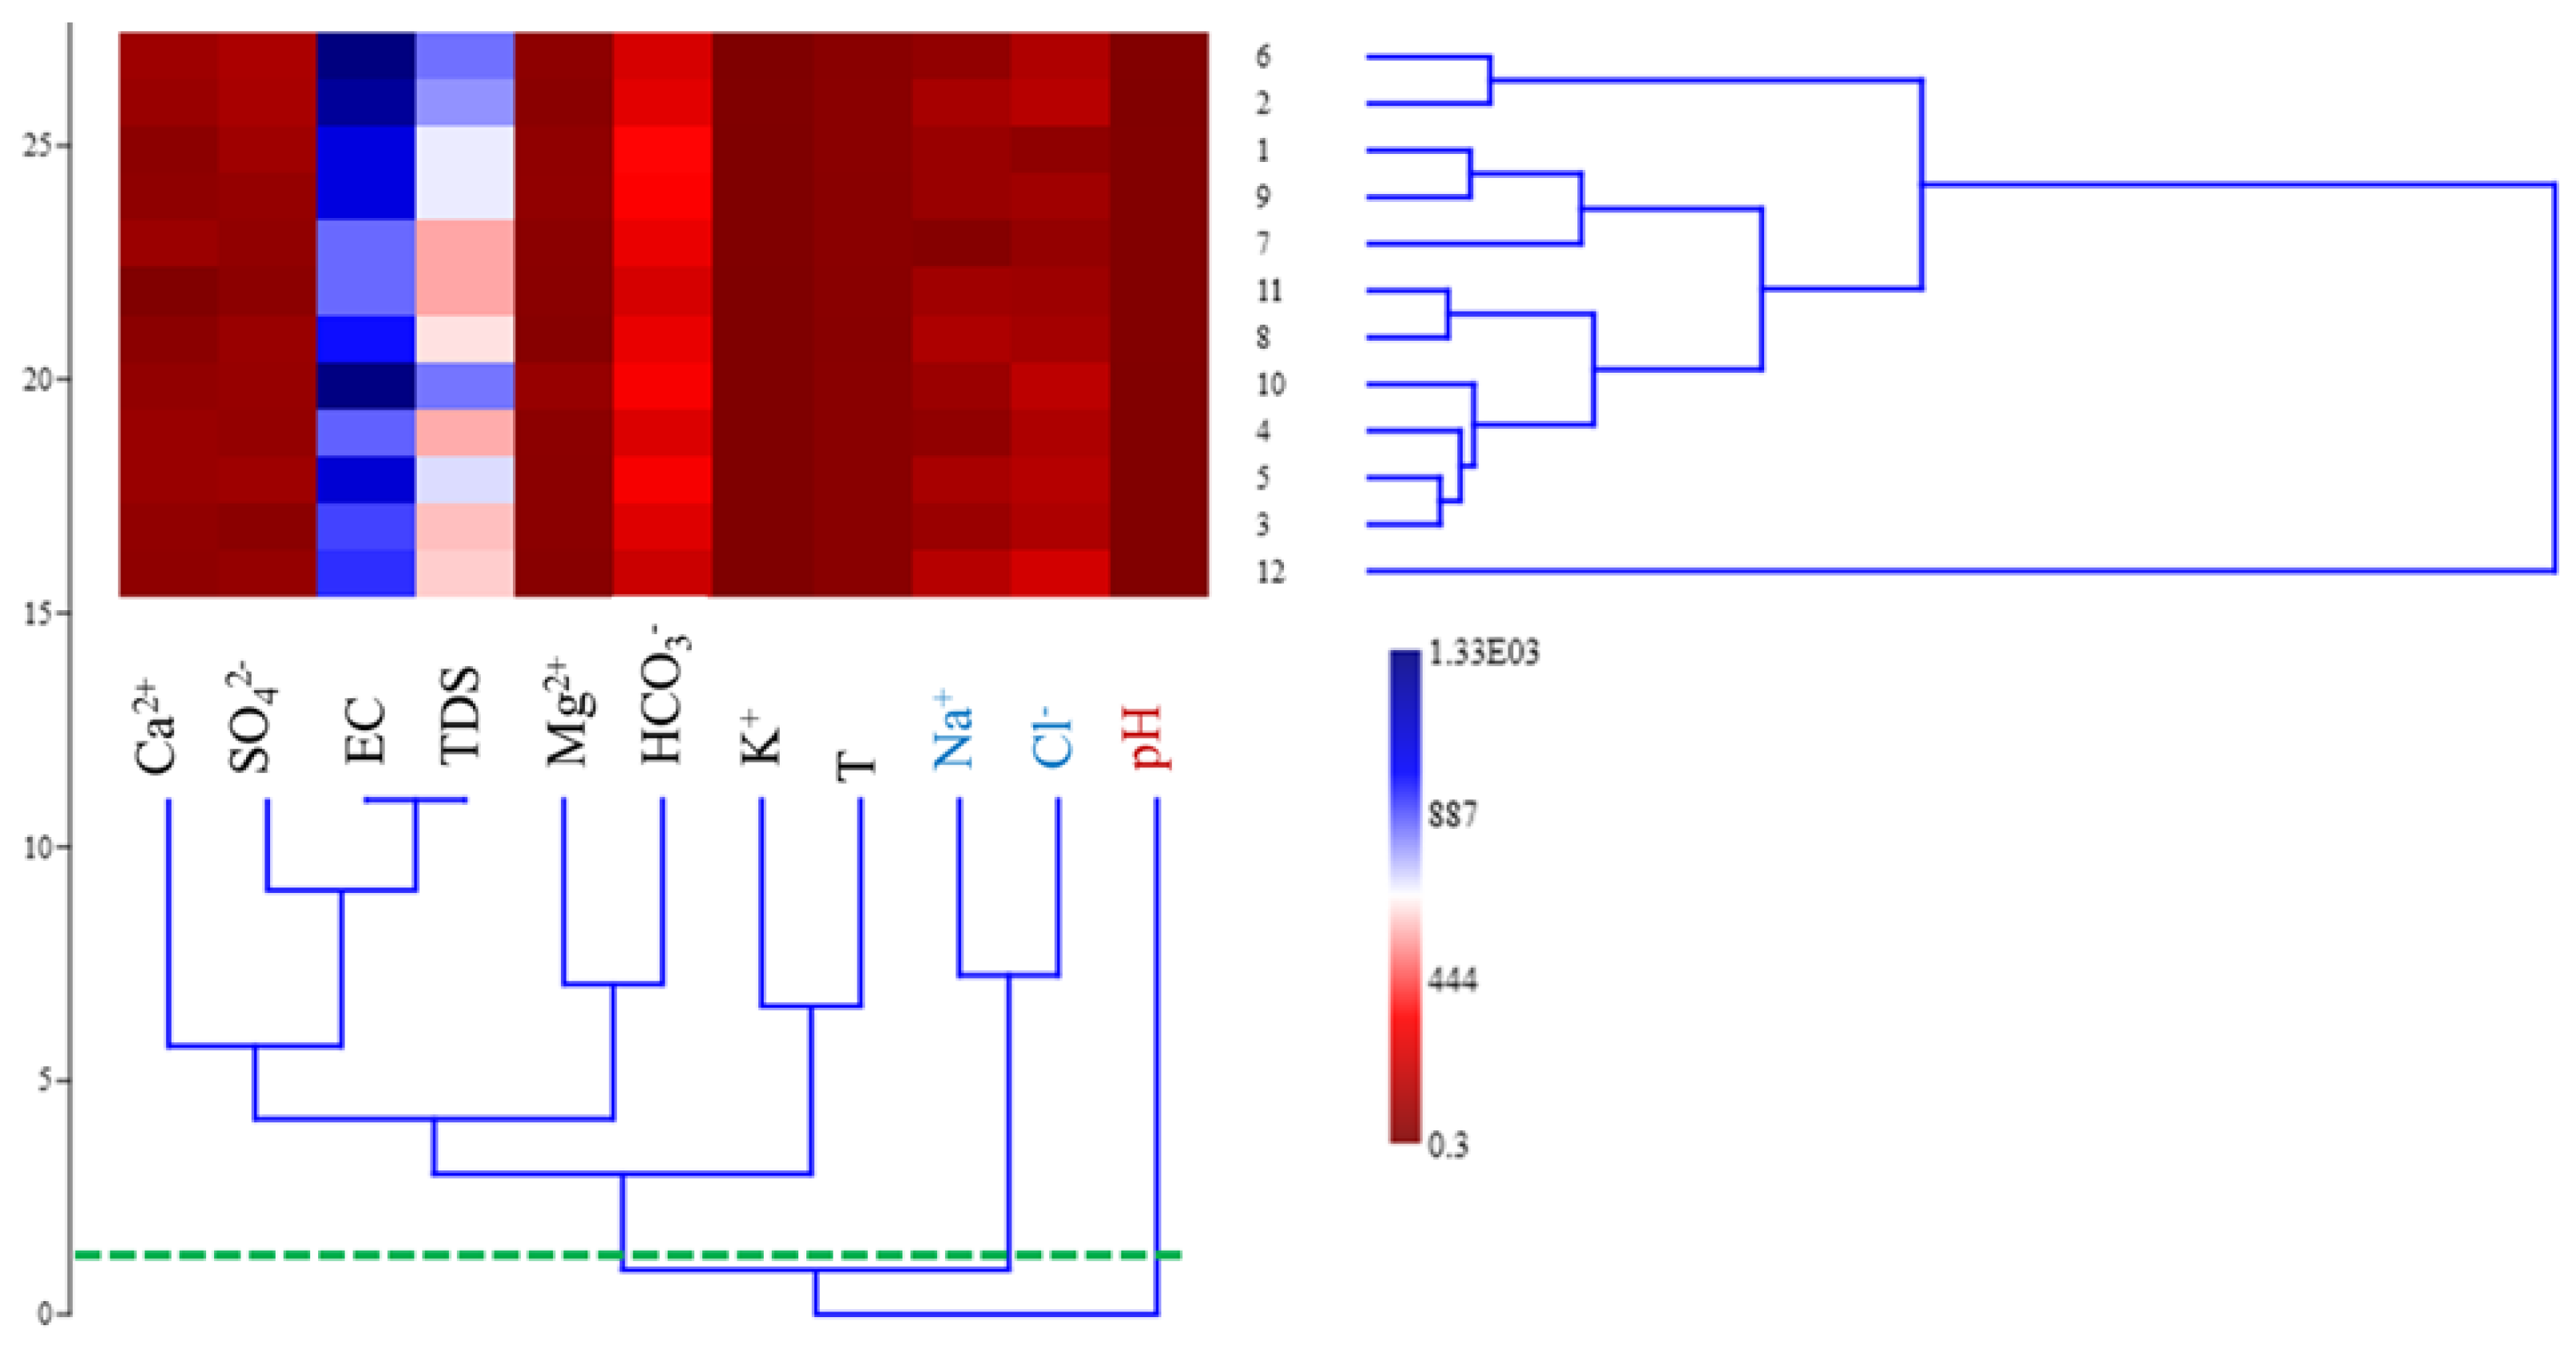
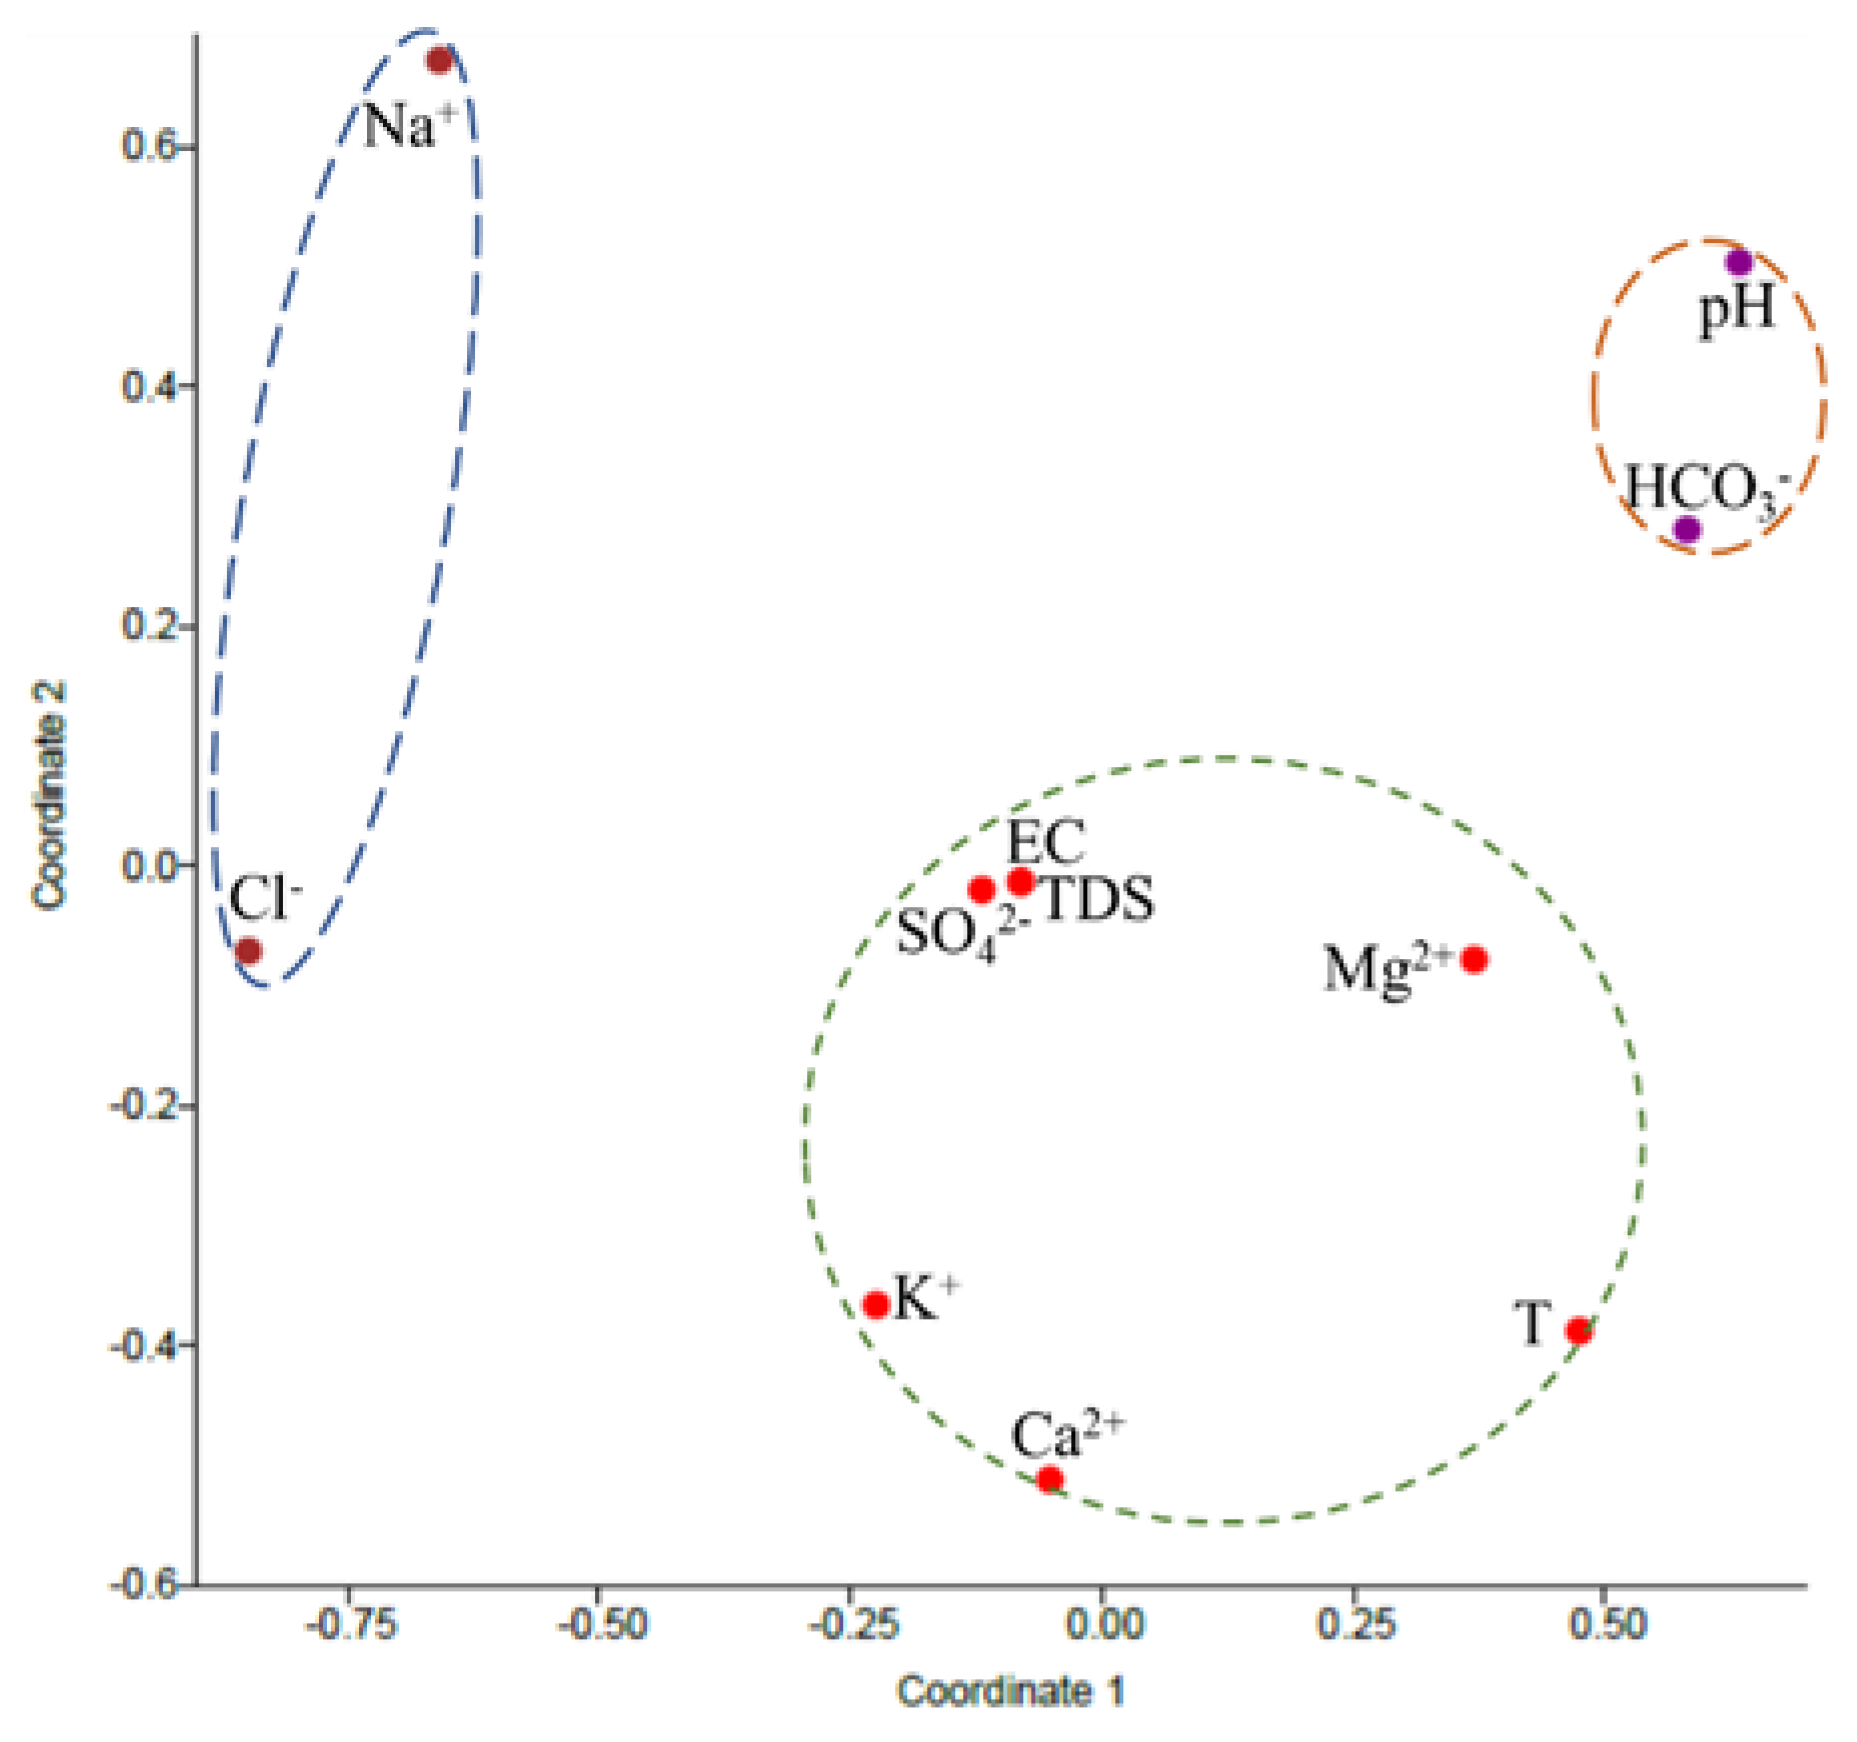
3.5. Eocene Water Hierarchical Cluster Analysis (HCA)

The HCA technique identifies two essential clusters for Eocene water quality parameters and generates a dendrogram (tree diagram); the main physicochemical clusters are shown in Figure 6. Cluster 1 includes pH and HCO3, as water–rock interactions and aquifer matrix dissolution occur, carbonate weathering controls pH, making the Eocene water alkaline. Cluster 2 consists of EC, TDS, Ca2+, Mg2+, Cl, Na+, SO42−, K+, and T. In line with Li et al. [59], geogenic processes and the infiltration of irrigation water formed this collection. Water temperature may originate from environmental processes like soil/sediment conduction.

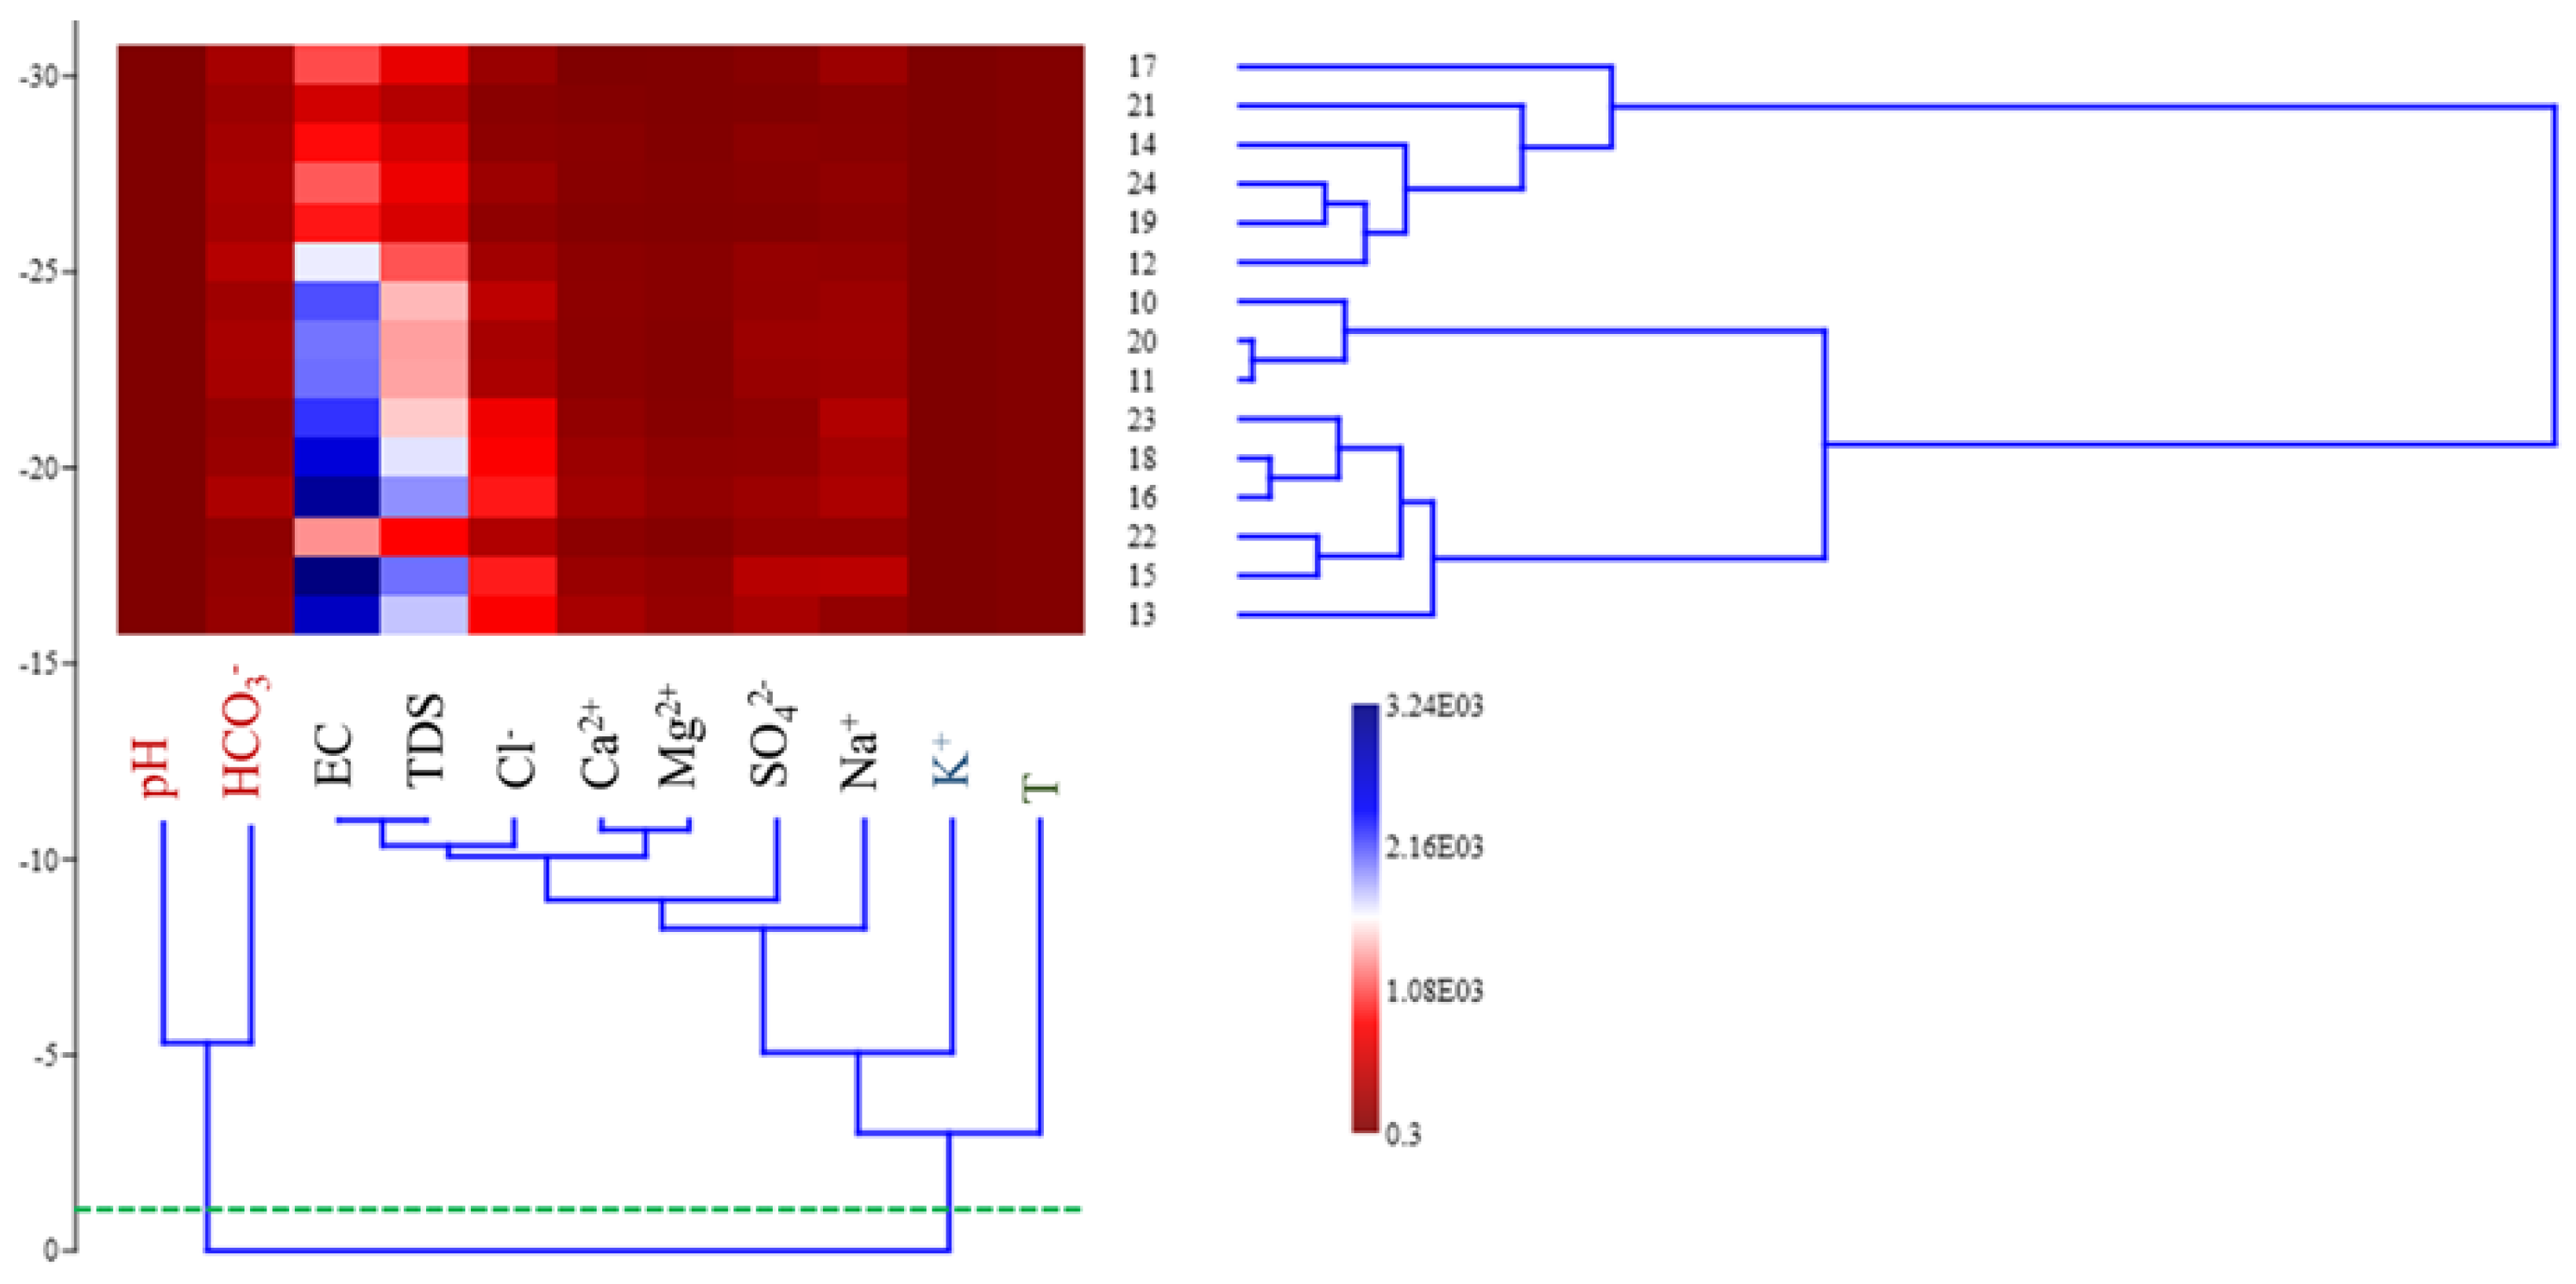
3.6. Pleistocene Water Hierarchical Cluster Analysis (HCA)

The dendrogram of the HCA recognizes three significant physicochemical clusters for the Pleistocene groundwater, as revealed in Figure 7. Cluster 1 contains Ca2+, SO42−, EC, TDS, Mg2+, HCO3, K+, and T, which may result from water–rock interactions. Because of aquifer matrix dissolution, particularly carbonates weathering and/or agricultural activities under warm water conditions. Cluster 2 includes Na+ and Cl; this group is possibly produced from mixed origins, mainly weathering/dissolution due to water–rock interactions under the alkaline status and infiltration of irrigation water. Cluster 3 involves pH; the variations in pH settings in aquatic environments significantly affect the fluctuation of dissolved constituents. Mora et al. [58] stated that the redox state controls the levels of many water elements. Consequently, as pH increases, the oxidation process decreases and vice versa, which controls the ions concentration in groundwater.

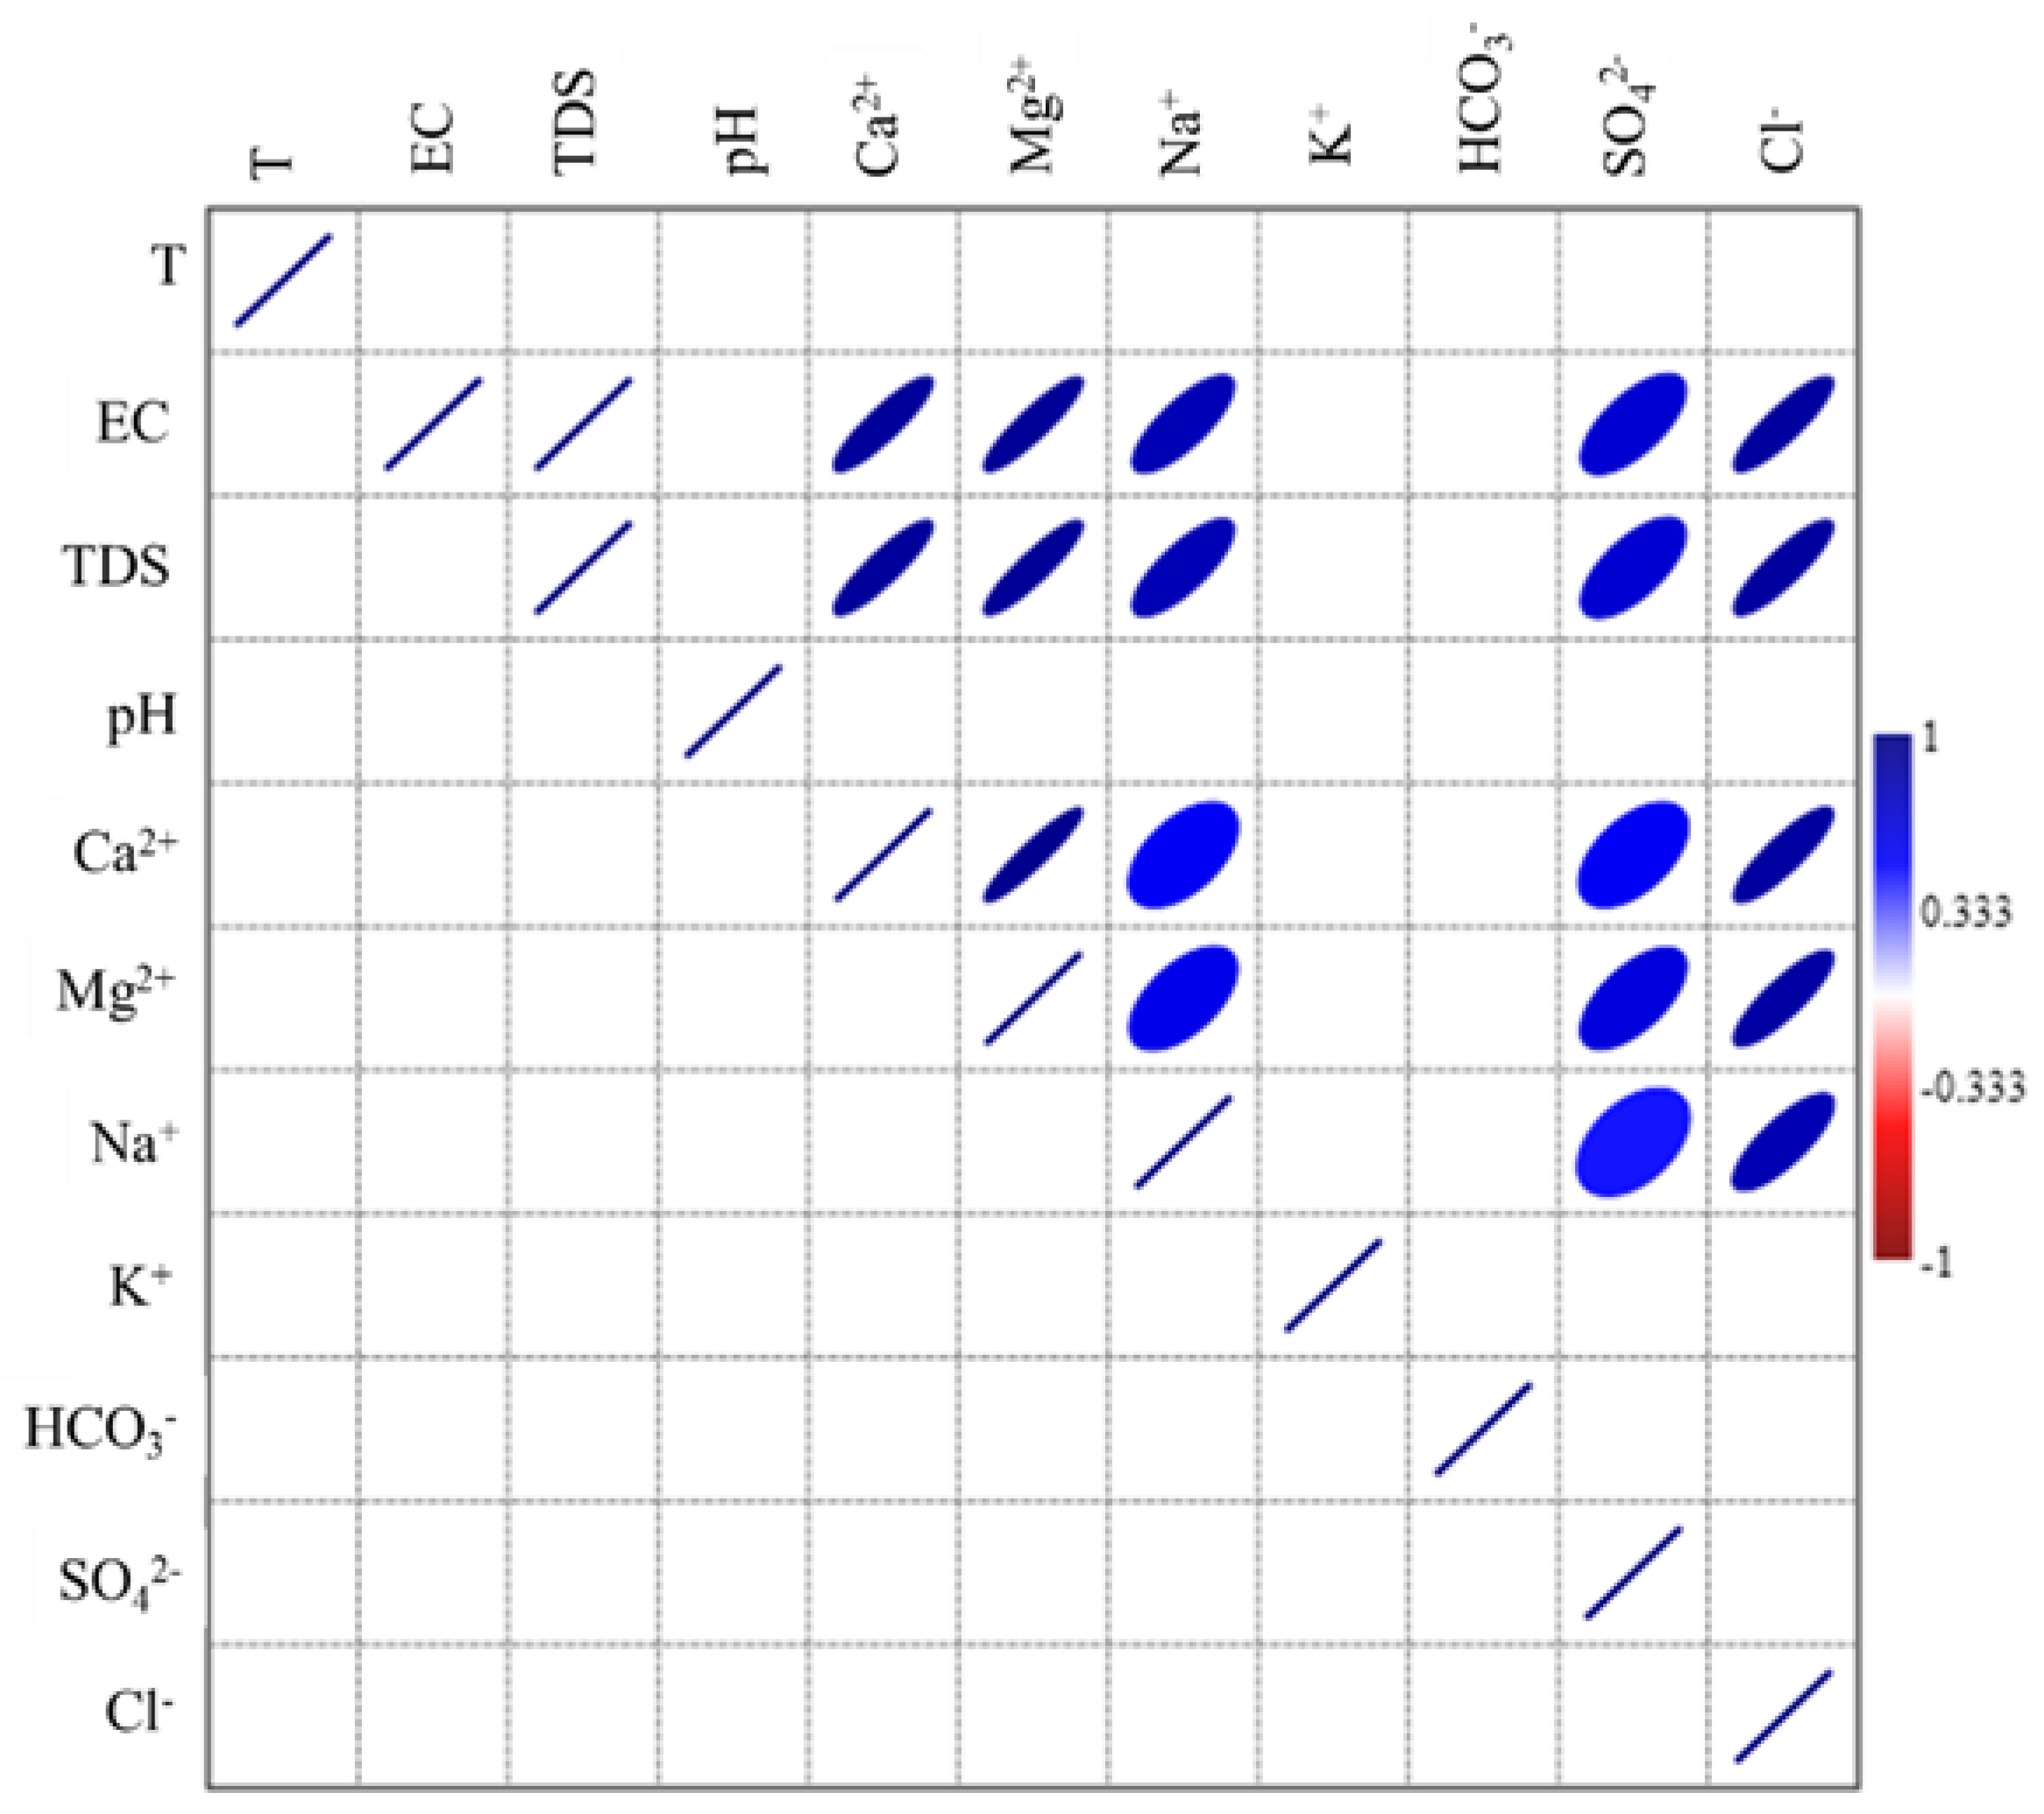
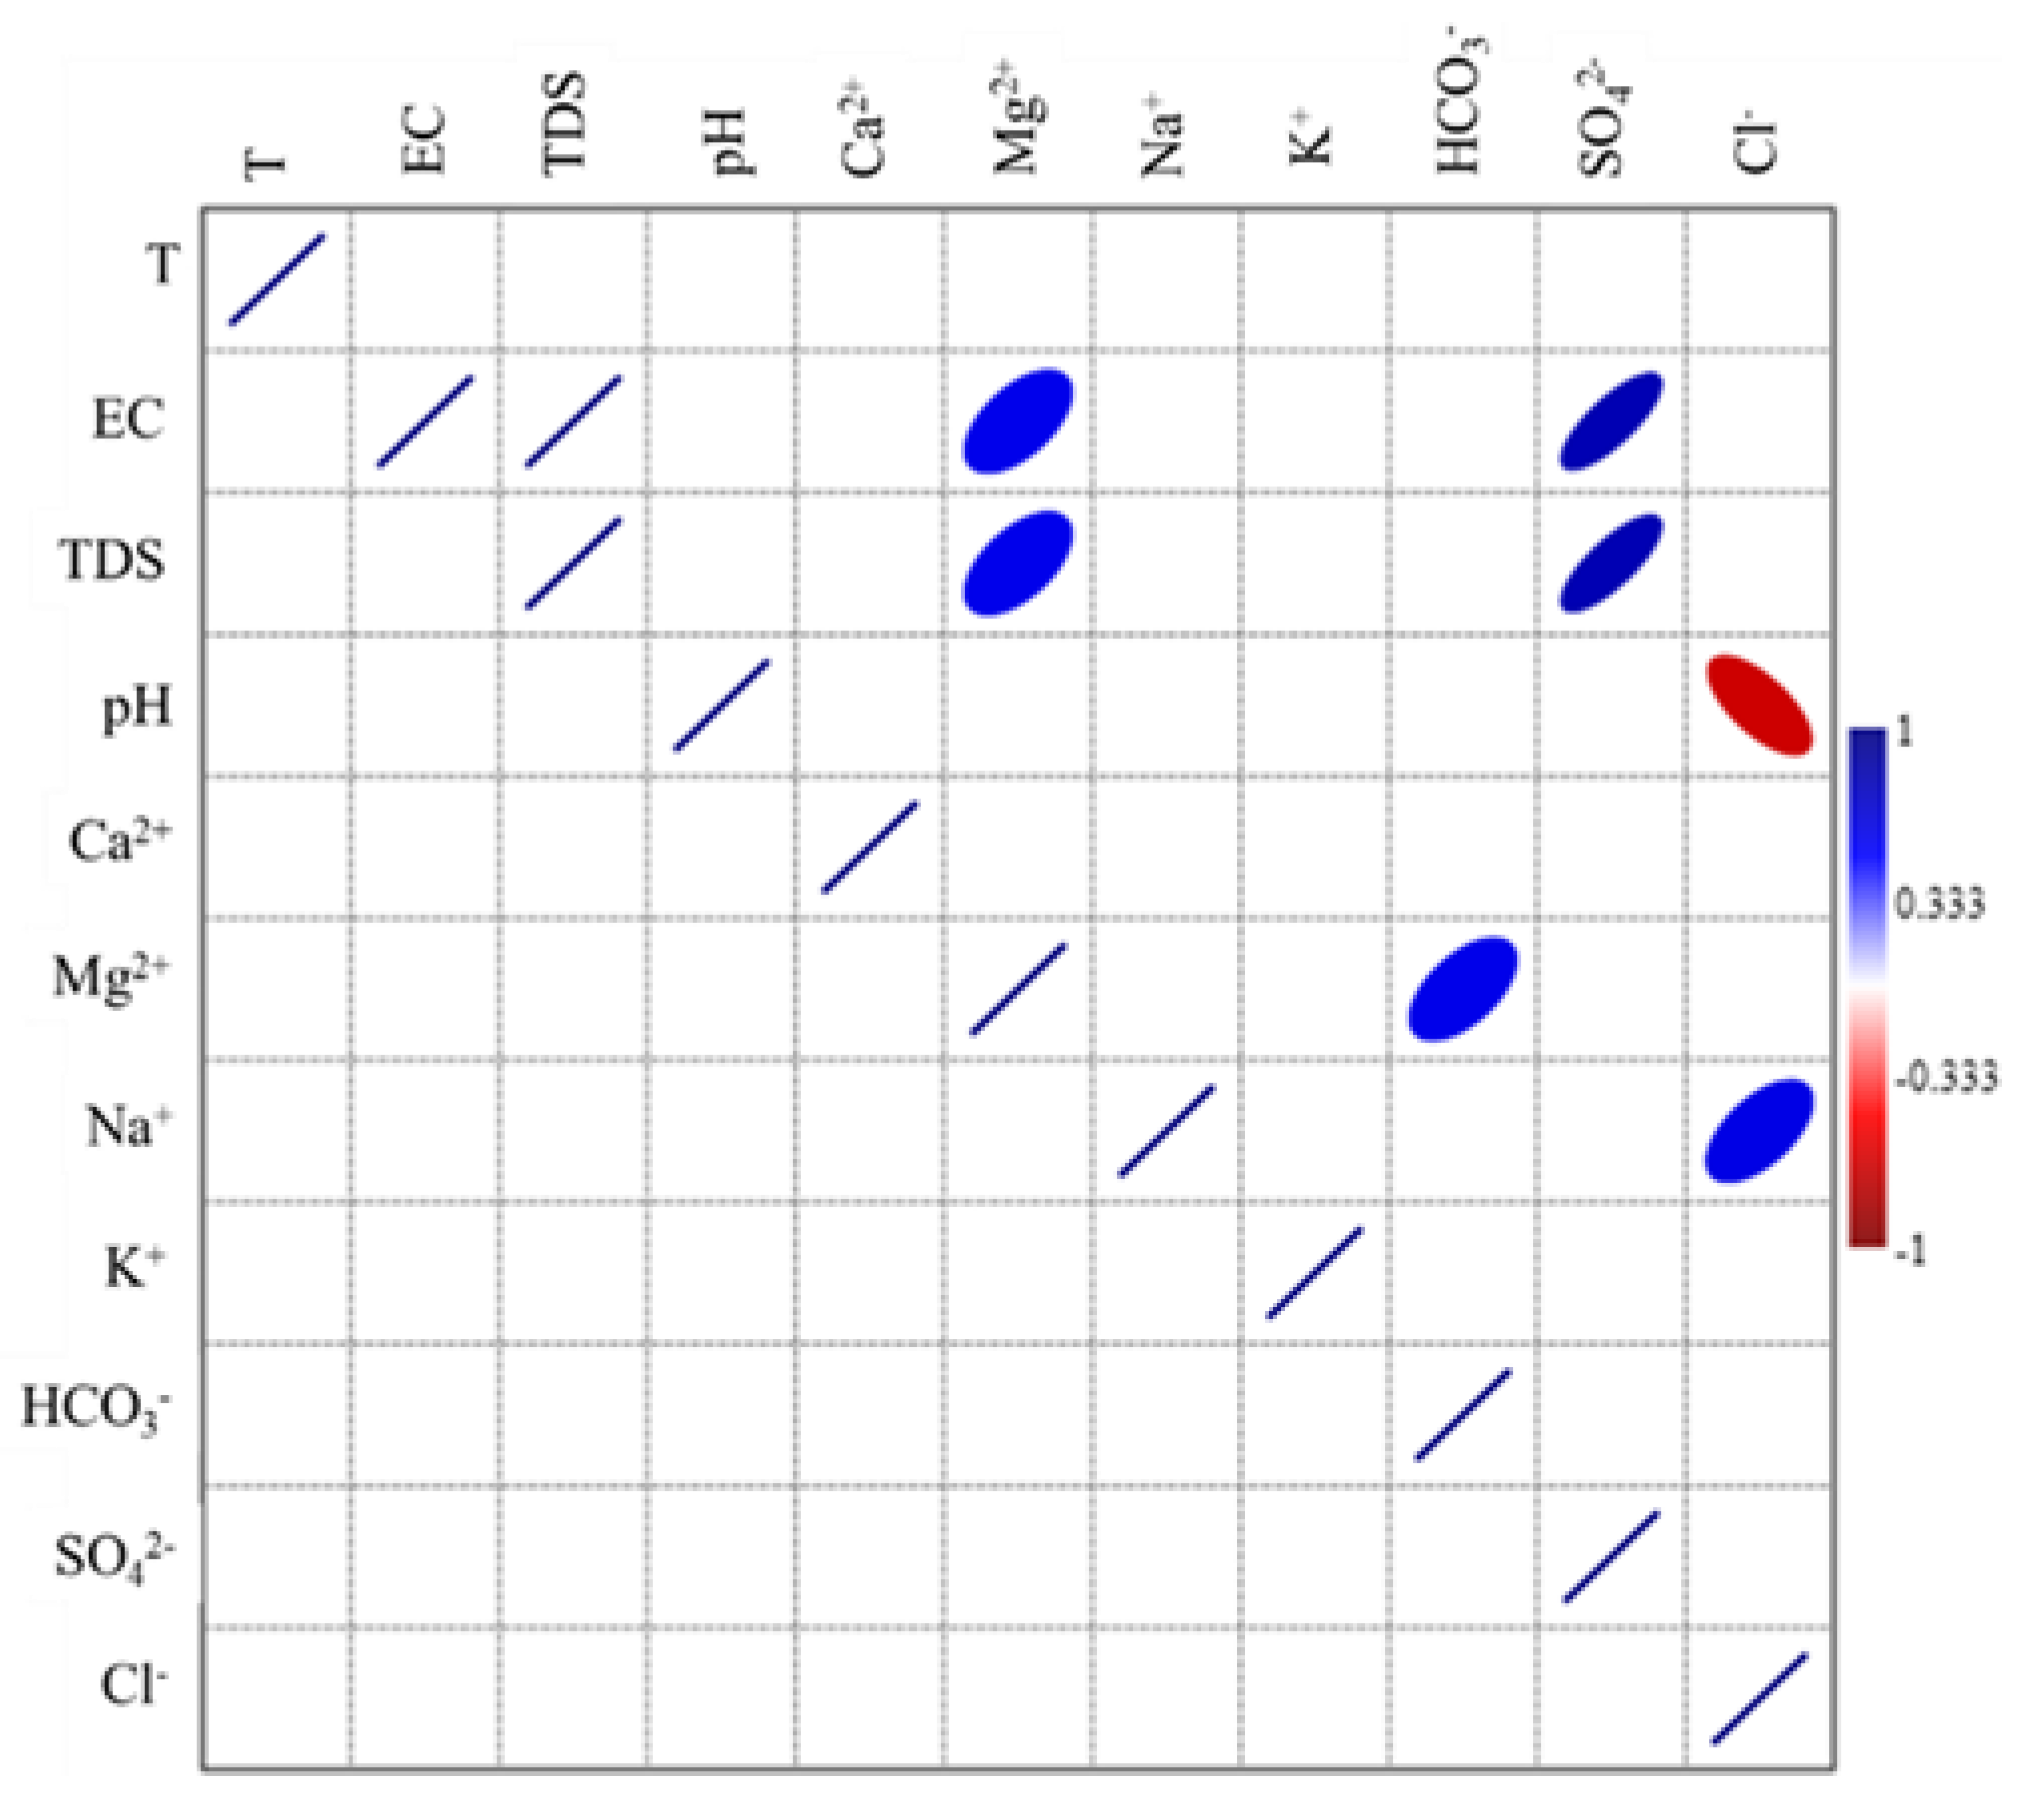
3.7. Correlation Analysis

PCMA was applied to investigate the physicochemical parameters associations pattern in the aquifers of the study area. Table 7 and Table 8 tabulate the correlation coefficient (r) for the Eocene and Pleistocene aquifers, respectively. Strong (p < 0.01) and significant (p < 0.05) correlations were noticed in both aquifers. The linear relationships among each pair of groundwater constituents in terms of the significant correlation coefficient are presented in Figure 8 and Figure 9 for the Eocene and Pleistocene aquifers, respectively.
For the Eocene water, the EC displays equivalent liner correlation with TDS (r = 1) and strong positive correlation with Ca2+ (r = 0.893), Mg2+ (r = 0.907), Na+ (r = 0.788), SO42− (r = 0.677), and Cl (r = 0.877). TDS shows strong positive correlation with Ca2+ (r = 0.894), Mg2+ (r = 0.907), Na+ (r = 0.788), SO42− (r = 0.677), and Cl (r = 0.877). This indicated that ion concentrations in the Eocene water occurred due to rock weathering, which leads to ionic strength and increases salinity. Furthermore, EC positively correlated with cations and anions, the essential suppliers of EC value [43].
Moreover, the essential constituents of groundwater, such as Ca+2, show a positive correlation with Mg2+ (r = 0.935), Na+ (r = 0.538), SO42− (r = 0.538), and Cl (r = 0.870). Mg2+ shows positive correlation with Na+ (r = 0.582), SO42− (r = 0.635), and Cl (r = 0.857). Furthermore, Na+ positively correlates with SO42− (r = 0.459) and Cl (r = 0.798). These correlations reveal the aquifer lithologic dissolution and water–rock interaction effects. In contrast, the correlation between Ca2+, Mg2+, and Na+, besides SO42− and Cl, proved the occurrence of these cations as inorganic salts in sulfate and chloride forms. The major ions display positive correlations with each other; it possibly emphasizes that these ions may originate from similar sources and/or have a comparable distribution trend. Therefore, it specified that the water chemistry is affected by geological actions such as gypsum dissolution and/or weathering of halite, pyrite, and silicates. Moreover, groundwater’s ionic alteration and secondary salts may originate from wastewater infiltration, such as agricultural water, as declared by many researchers [10,13,33,34].
For the water samples from the Pleistocene aquifer, the EC shows an identical linear correlation with TDS (r = 1) and a positive correlation with Ca2+ (r = 0.577) and SO42− (r = 0.794). TDS shows a positive correlation with Mg2+ (r =0.578) and SO42− (r = 0.794). This indicated that these ion concentrations occurred as a result of rock weathering, while the negative correlation of pH with Cl (r = −0.694) specifies the weak dissociation capacity of the dissolved solids that contains chlorine. Moreover, the main constituents of groundwater, such as Mg2+, show a positive correlation with HCO3 (r = 0.580). As well, Na+ displays a positive correlation with Cl (r = 0.600). The obtained correlations expose the lithologic influence of the aquifer matrix dissolution and water–rock interactions. In line with Li et al. [59], the positive correlation between Mg2+ and HCO3 demonstrates that the chemistry of water is regulated by the carbonate dissolution input (dolomite and calcite). As revealed by [43] that the existing carbonates in the aquifer lithology might be dissolved and introduced to the groundwater throughout the movement, infiltration, and irrigation. Furthermore, the positive correlation between Na+ and Cl indicates the Na-Cl salt mineral [60]. The NaCl salts in water are related mainly to salt deicing in temperate/warm regions, sewage effluents, agricultural discharges, and urban wastewater [61]. Moreover, groundwater’s ionic alteration and secondary salts may originate from wastewater infiltration. This association proposes that the major ions may have the same sources and/or distribution trend.
The correlation results of the physicochemical parameters of the Eocene and Pleistocene aquifers indicated the mixed origin of the physicochemical parameters due to the lithologic impact of the aquifers matrix and water interactions (geogenic). In addition to the infiltration of secondary salts, they originated from fertilizers and agricultural water (anthropogenic). These influences control groundwater’s ionic alteration, as Snousy et al. [10] mentioned and many researchers [10,13,33,34].
Overall, in the Eocene aquifer, the inter-parameter relationships showed by PCMA supported HCA and PCA results. In the Pleistocene aquifer, PCMA supported the HCA and PCoA results.

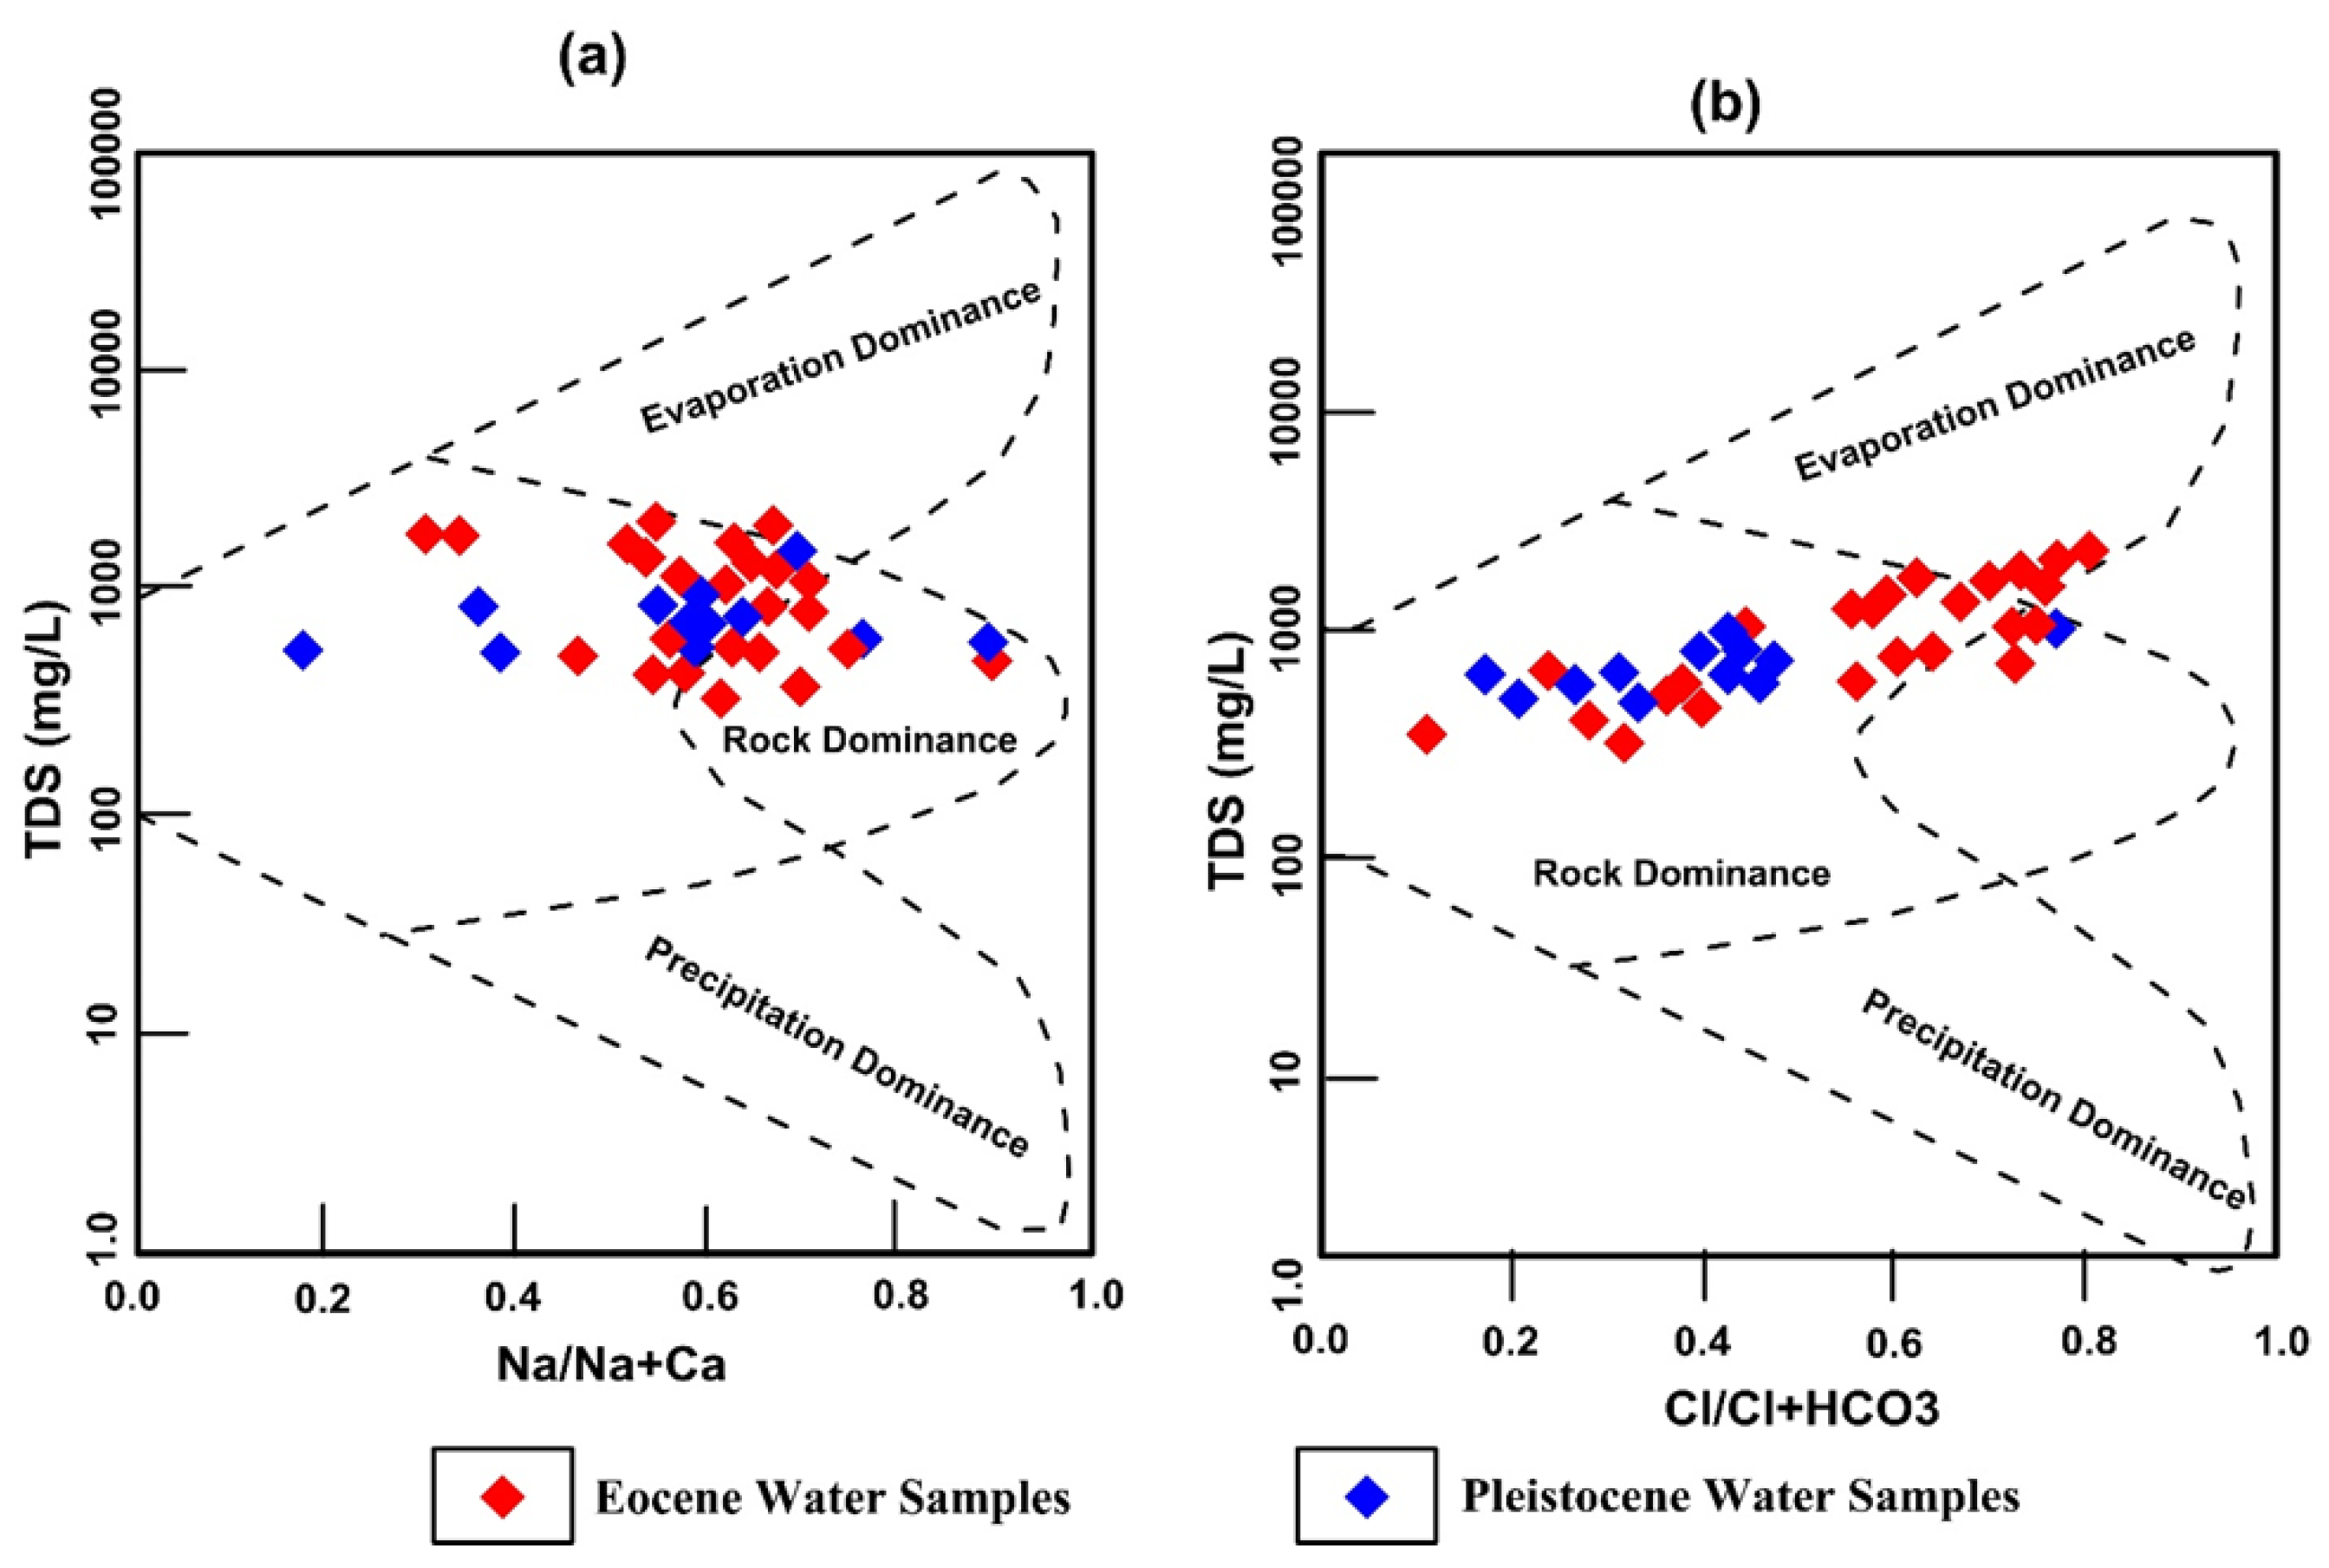
3.8. Groundwater Chemistry Evolution Mechanisms

Two semi-log diagrams, referred to as the Gibbs diagrams [62], analyzed the process through which natural water chemistry evolved. It is a well-established platform, whereas TDS graphs against both Cl/(Cl + HCO3) for anions and (Na+ + K+)/(Na+ + K+ + Ca2+) for cations established to reveal the geochemical interaction system of the various groundwater components. Three separate zones are shown by Gibbs [62] figure: the rock, precipitation, and evaporation dominance fields. According to the study’s findings, the common groundwater from the Pleistocene and Eocene periods is in the zone of rock dominance. Water–rock interactions gradually grew because of minerals that created rocks and were slightly oriented toward evaporation domination (Figure 10). This is anticipated given the rising rock–water interactions (rock domination), weathering of the hosted rocks, and chemical weathering of rock-forming minerals that lead to mineral dissolution.

3.9. Physicochemical Analysis for Drinking Water

Groundwater’s physical characteristics are influenced by its chemical composition, which depends on geochemical reactions as the water passes through aquifer minerals. Table 9 provides the physicochemical characteristics limits for irrigation and drinking. The pH scale, which determines whether a substance is acidic or basic, is a crucial indicator of water quality. The groundwater pH ranges from 7.2 to 8.6 for the Pleistocene and from 7.1 to 8.6 for the Eocene, classifying the water of the aquifers as mildly alkaline water. Therefore, the Pleistocene and Eocene aquifers are suitable to drink following WHO criteria from Narsimha and Sudarshan [20] and allowable Egyptian limits from Narsimha and Sudarshan [21].
The groundwater of the study area is moderate to extremely saline. The EC varies from 860 to 1330 and 520 to 3240 μS/cm for the water sampled from Pleistocene and Eocene aquifers, respectively. Most of the Pleistocene and about 54% of the Eocene groundwater samples are acceptable for drinking. At the same time, about 46% of the Eocene water is unfit. The high salinity in the Eocene groundwater samples was initiated according to the dissolution of aquifer materials (limestone). The TH of the Pleistocene water samples varies from 139 to 389 mg/L; in Eocene, water samples range from 85 to 1046 mg/L. All the collected water samples from the Pleistocene aquifer and 67% of the Eocene aquifer samples are suitable for drinking. Figure 11 shows the collected groundwater samples’ electrical conductivity distribution, total dissolved salts, and hardness.
The Ca2+ concentration ranges from 8 to 82.2 mg/L and from 12 to 254 mg/L for the Pleistocene and Eocene groundwater samples, respectively. The Pleistocene water samples and 87.5% of the Eocene samples are acceptable for drinking. The Mg2+ in the groundwater varies between 22 and 63 mg/L and between 4.43 and 143 mg/L in the Pleistocene and Eocene aquifers, respectively. The values of parameters determined in water from the Pleistocene and Eocene aquifers are lower than the permissible limits of Egyptian and WHO guidelines, reflecting the suitability for drinking use. The Na+ in the Pleistocene water samples fluctuates from 18 to 144 mg/L and from 56 to 385 mg/L for the Eocene water. The Pleistocene water samples of about 75v% of the Eocene water are acceptable for drinking.
The sulfate content in the groundwater of the Pleistocene aquifer samples is diverse from 33 to 116 mg/L, whereas it fluctuated from 24 to 358 mg/L in the Eocene water samples. The high sulfate values in the Eocene samples are attributed to the extensive fertilizer use in the newly reclaimed land. All Pleistocene and Eocene groundwater is acceptable for drinking according to Egyptian and WHO guidelines (Table 9). The chloride ion differs from 42.24 to 216 mg/L of the Pleistocene water samples while in the range of 14.2 to 896 mg/L in the Eocene samples. The groundwater from the Pleistocene aquifer and 75% of the Eocene water samples are acceptable for drinking, whereas the remaining Eocene samples are unfit. Figure 12 illustrates the major ions distribution of the examined groundwater samples.

3.10. Groundwater Quality for Irrigation

In the area studied, groundwater is the principal water source for agricultural activities. The irrigation water quality can impact the nutrient requirements and lifetime of the plants [63]. The following indices have been applied to estimate the groundwater fittingness for irrigation use: EC, SAR, RSC, % Na, KR, MH, PI, and US salinity diagram.

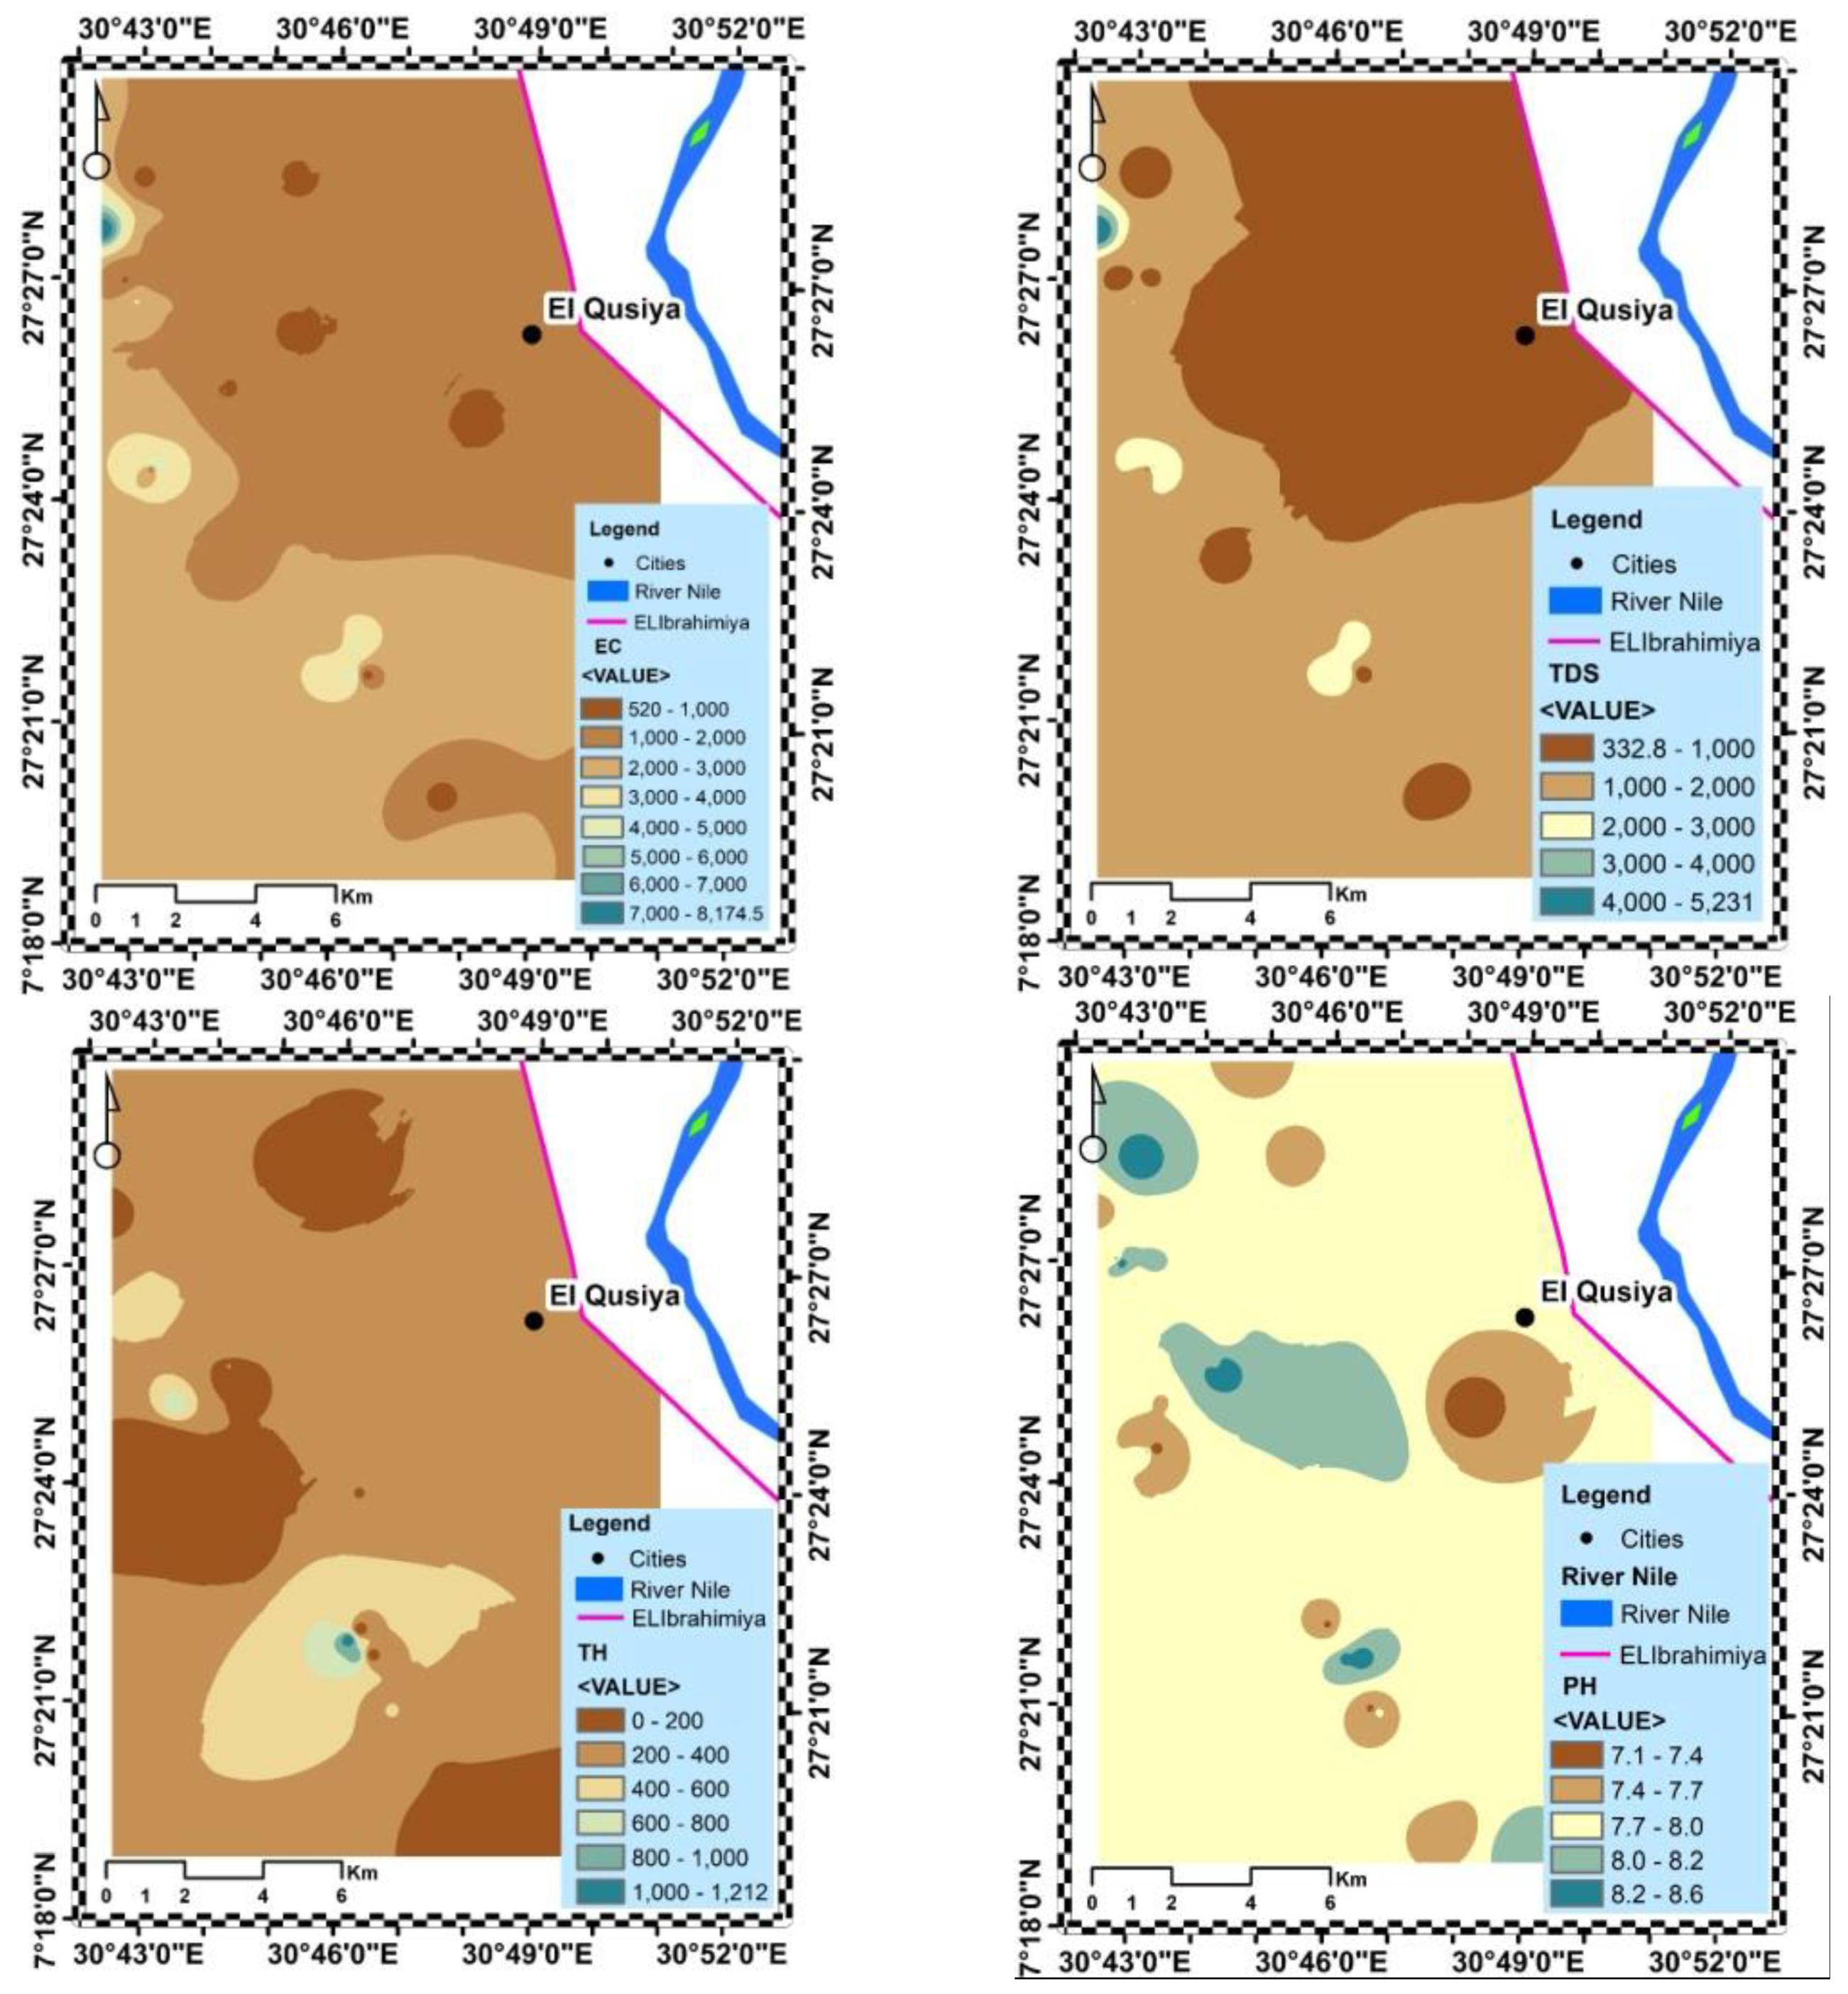
3.10.1. Electrical Conductivity (EC)

A practical approach for measuring the salinity risks irrigation poses to crops is electrical conductivity. About 33% of the Eocene groundwater samples had excessive EC, which makes them unsuitable for irrigation, consistent with the EC categorizing standards recommended by Wilcox [37] (Table 10). The Pleistocene water and about 54% of the Eocene water samples have high salinities, making them unsuitable for irrigation under normal conditions. It is still possible to use it infrequently in unique situations. A medium level of EC may be employed on soils with limited drainage but is present in just 12.5% of the Eocene samples.

3.10.2. Sodium Adsorption Ratio (SAR)

SAR examines the potential infiltration issues brought on by an imbalance in the sodium content of irrigation water. Because the soil structure is affected once Na+ substitutes the adsorbed Ca2+ and Mg2+, the consequence is compacted, impenetrable soil [64]. The Pleistocene and Eocene water have low SAR values and excellent irrigation water quality (Table 10).

3.10.3. Residual Sodium Carbonate (RSC)

RSC estimate assesses the risks of carbonate and bicarbonate that may affect the quality of agricultural water. If RSC values are below 1.25 meq/L, irrigation is most likely safe. It is not suited for irrigation if it is above 1.25 meq/L. RSC less than 1.25 is present in about 58% of the Pleistocene water samples and 21% of the Eocene water samples, making them acceptable for irrigation. The RSC of 42% of the Pleistocene samples and 79% of the Eocene samples is greater than 1.25, demonstrating that the water is unfit for irrigation (Table 10).

3.10.4. Sodium Percent (% Na)

According to sodium percent, only 8% of the Pleistocene and 4% of the Eocene samples showed Na% within excellent, 92% of the Pleistocene and 88% of the Eocene samples inside good and permissible limits, whereas 8% of the Pleistocene and 12% of the Eocene samples were unsuitable for irrigation purposes, according to Wilcox [37] classification (Table 10).

3.10.5. Kelly Ratio (KR)

The Kelly ratio, which compares sodium to calcium and magnesium, has also been used to determine the appropriateness of groundwater [41]. If Kelly’s ratio exceeds 1, there is too much sodium in the water. Therefore, the waters with Kelly’s ratio below 1 are appropriate for irrigation (Table 10). According to the calculated KR values for groundwater, 25% of the Pleistocene samples and 29% of the Eocene samples are unsuitable for irrigation because of KR values greater than one meq/L, while 71% of the Pleistocene and 75% of the Eocene have KR values of 1 meq/L; accordingly, the groundwater is suitable for irrigation.

3.10.6. Magnesium Hazard (MH)

Increased magnesium levels in irrigation water may impact soil quality, making it alkaline and lowering crop output. A total of 42% of the Pleistocene samples and 67% of the Eocene samples are acceptable for irrigation, whereas 58% of the Pleistocene samples and 33% of the Eocene samples are not (Table 10).

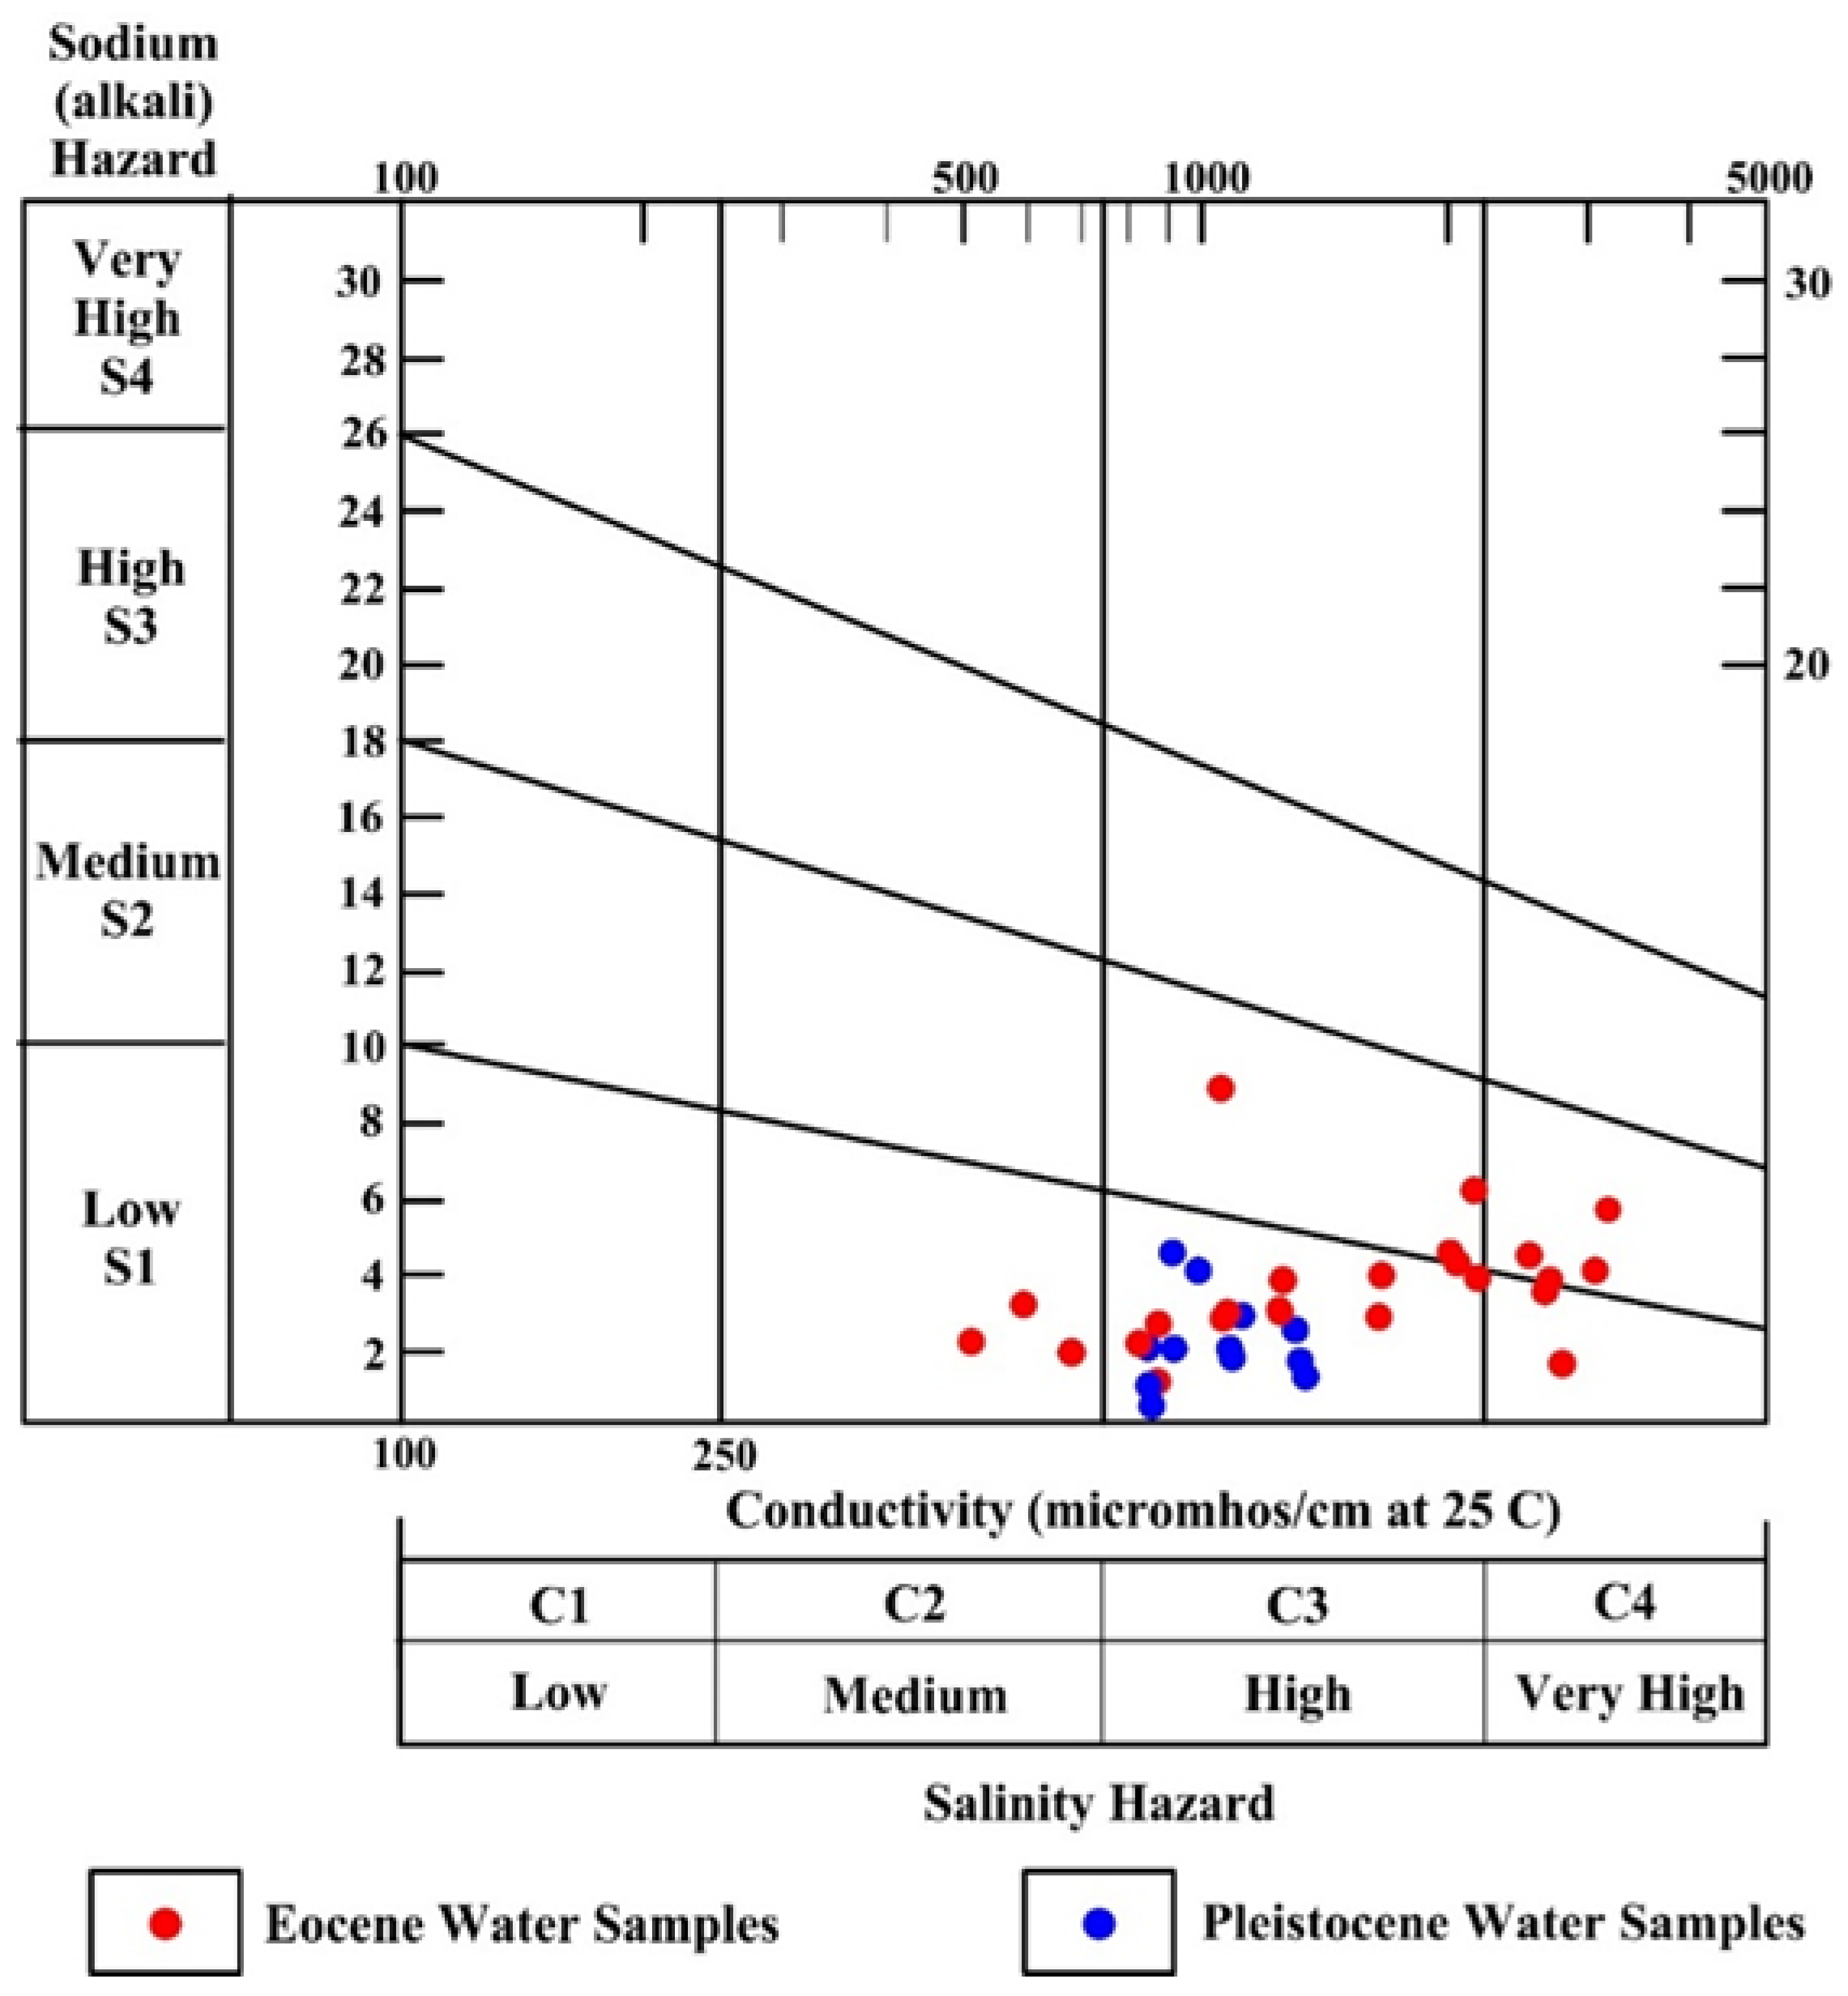
3.10.7. United States Salinity Laboratory (USSL) Diagram

The USSL diagram evaluates the groundwater’s suitability for irrigation, considering EC and SAR [65]. The USSL diagram shows that the Pleistocene water and almost 46% of the Eocene samples fit into the C3S1 class of irrigation water. In contrast, the residual samples fall into the C2S1, C3S2, C4S1, and C4S2 classes, signifying very high salinity but low alkalinity hazards (Figure 13). The suitability of this water for irrigation is limited, especially in soils with poor drainage, but it may be suitable for plants with strong salt tolerance [66].

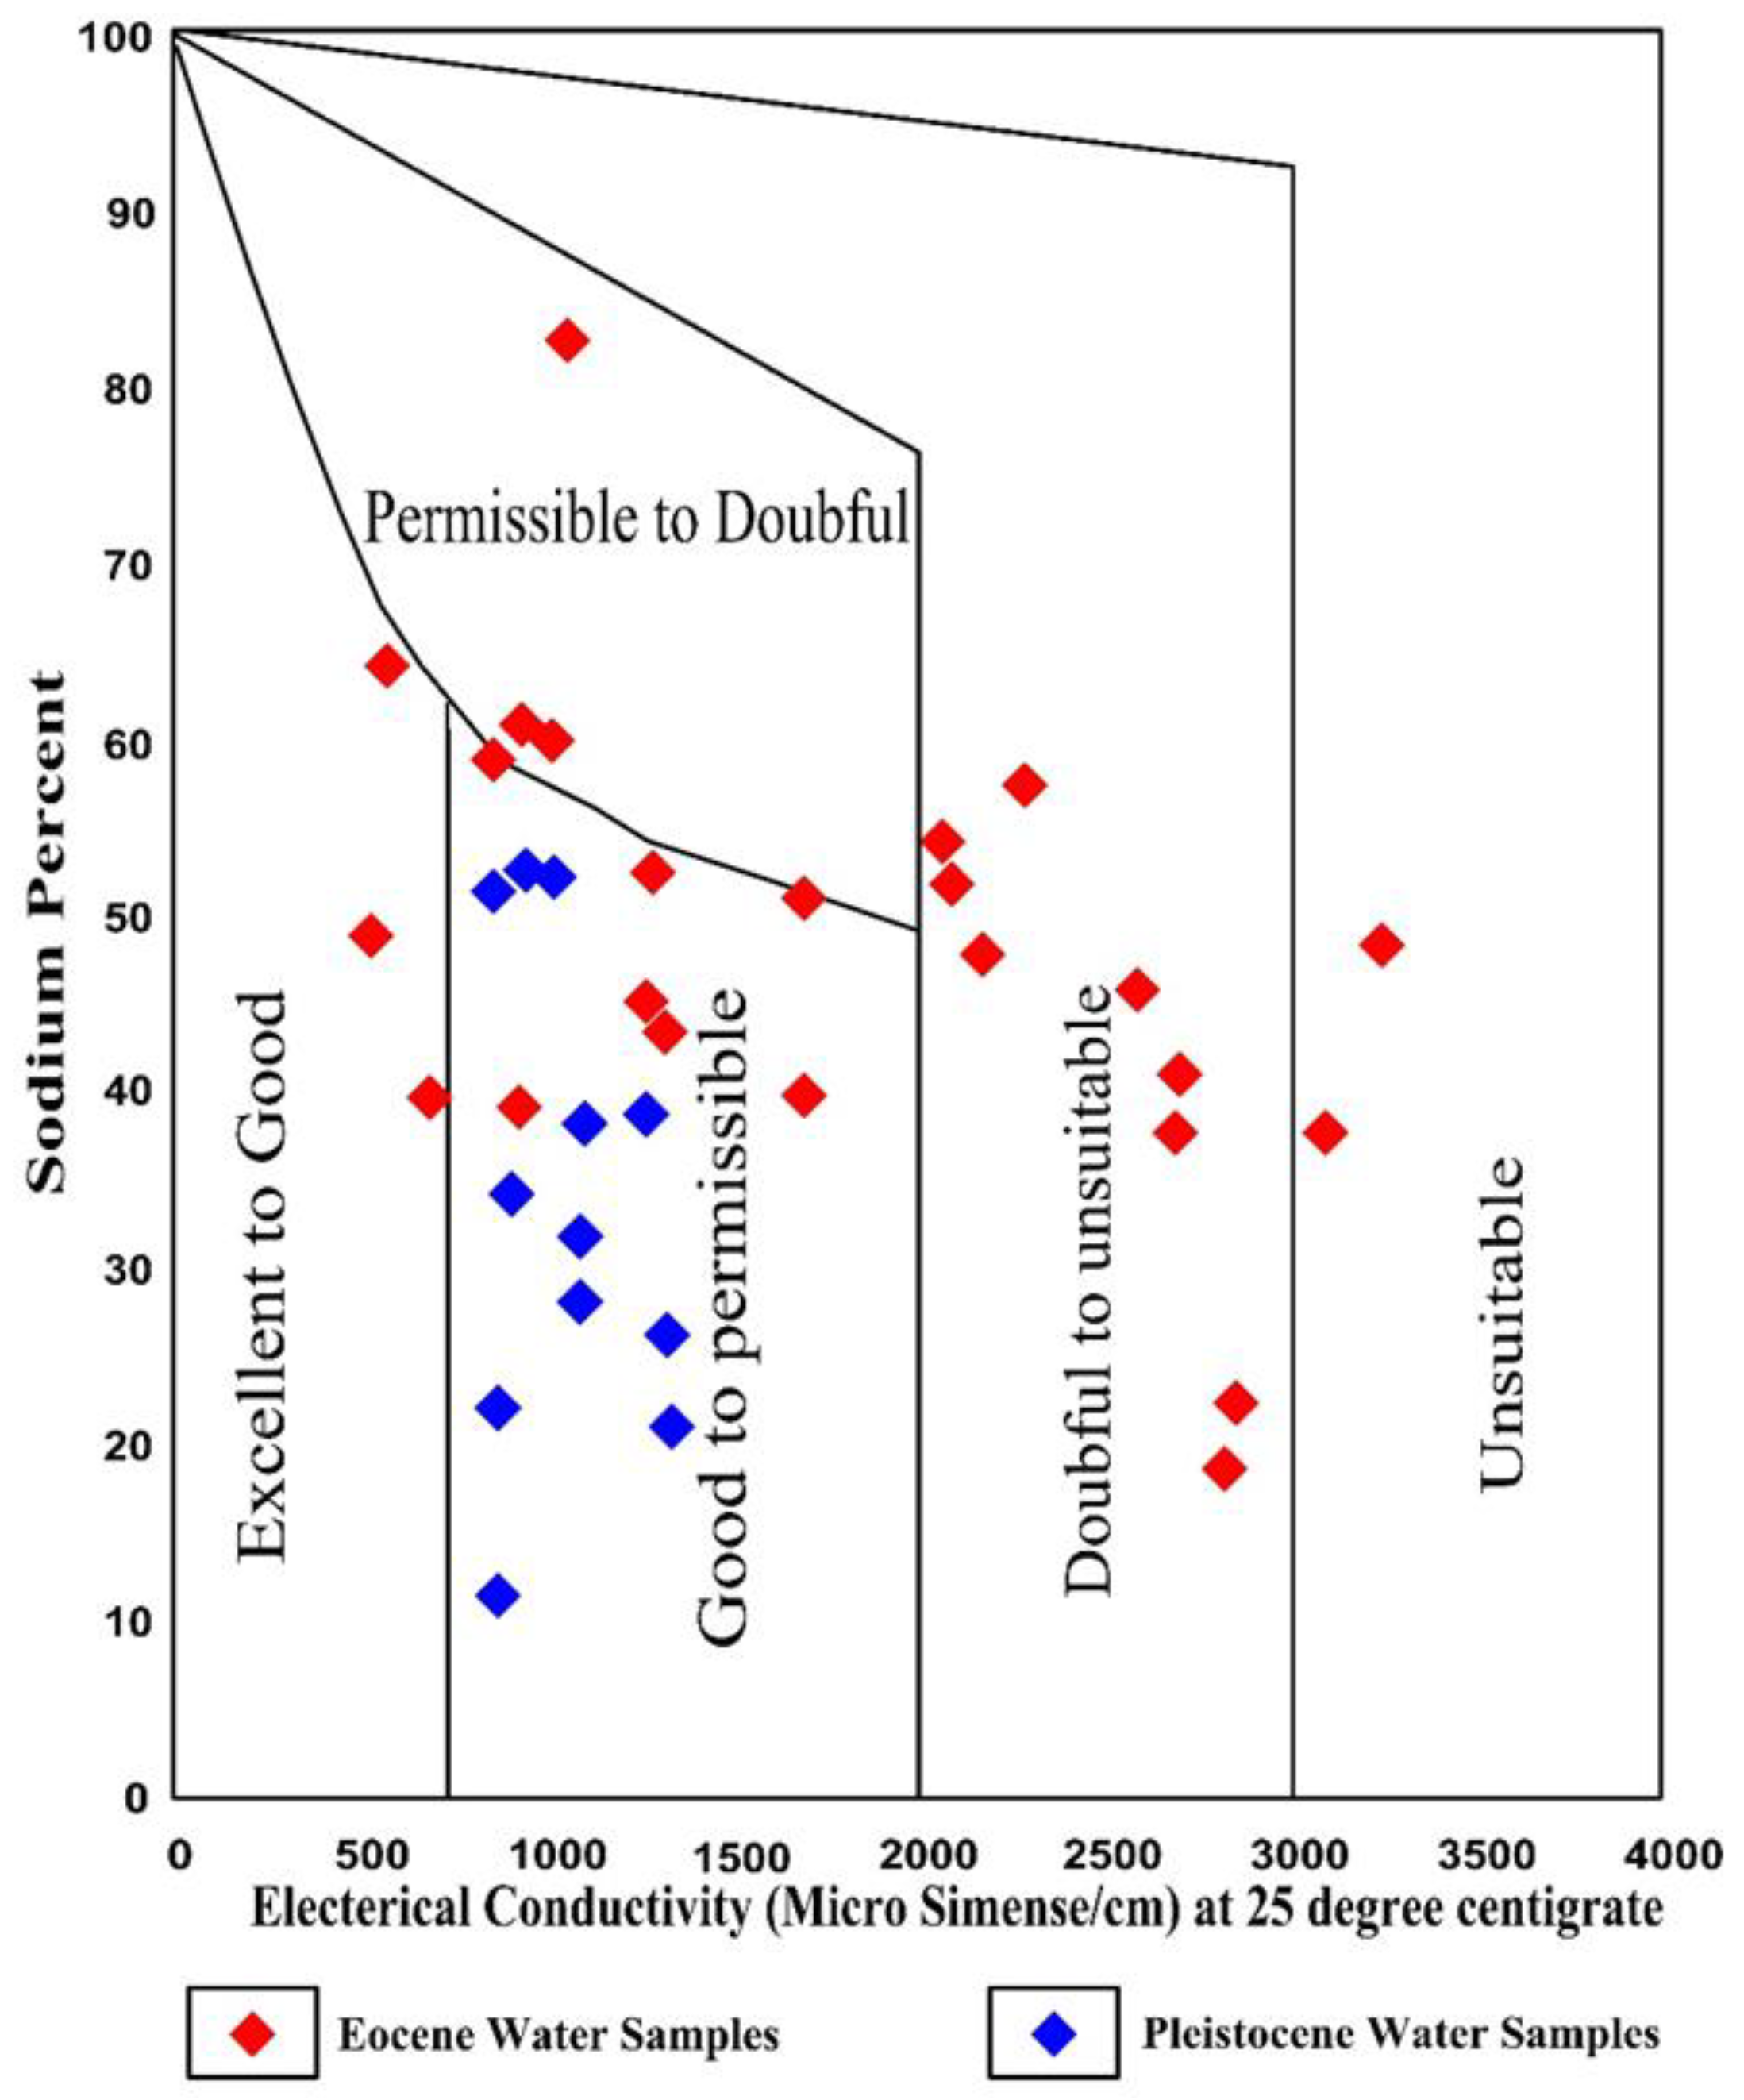
3.10.8. Wilcox Diagram

All the Pleistocene groundwater samples and 29% of the Eocene groundwater water samples fall within the “good” category of the Wilcox diagram (Figure 14). The remaining samples from the Eocene aquifer fell into one of four categories: 8.5% unsuitable, 12.5% excellent to good, 12.5% permitted to doubtful, and 37.5% doubtful to permissible (Figure 14).

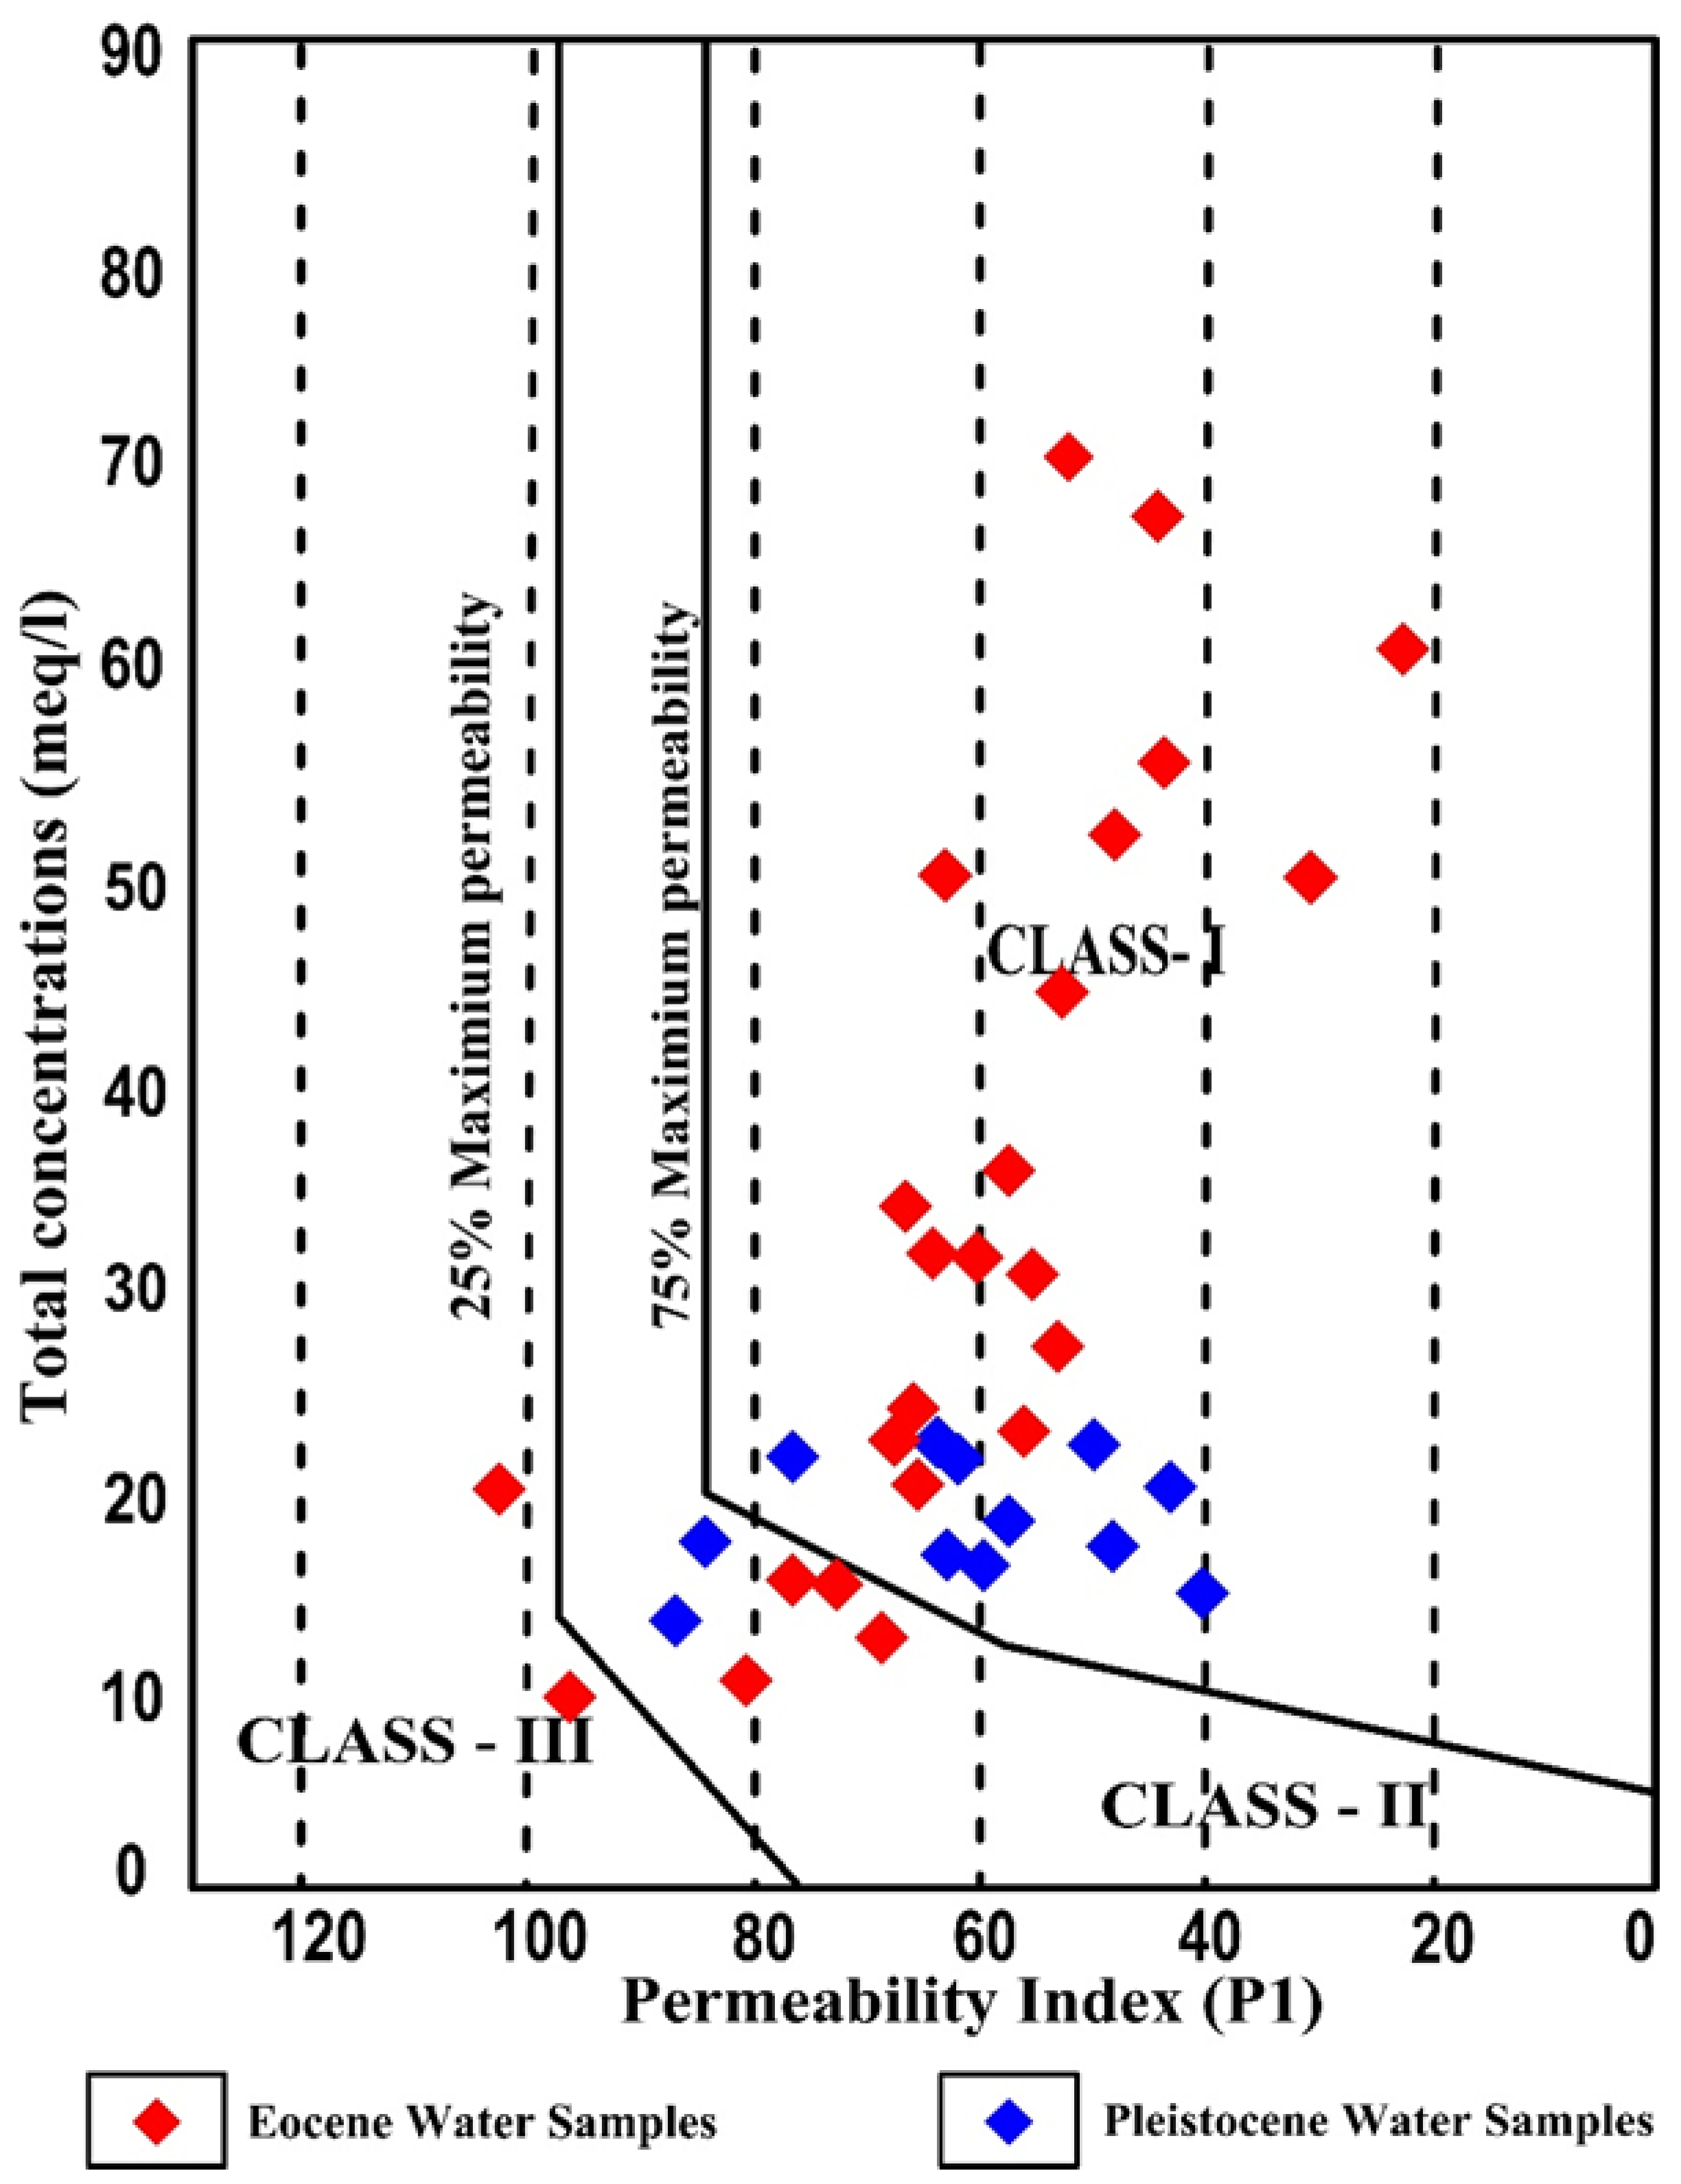
3.10.9. Permeability Index (PI)

Based on PI, Nagaraju et al. [67] divided water quality into Classes I, II, and III. Class III (up to 25% permeability) water is inappropriate for irrigation, while Classes I and II (>75% and 25–75%, respectively) suggest adequate water quality for irrigation applications. The Pleistocene and Eocene groundwater samples were classified as having excellent to good permeability based on the PI values and fell into Classes I and II [40]. These show that, except for two samples from the Eocene aquifer, the majority of groundwater samples are acceptable for irrigation use (Figure 15).

4. Conclusions

Due to the importance of groundwater in the study area and its reliance on it as a main source for various purposes, the most important aquifers have been studied. The Pleistocene and Eocene limestone aquifers have been identified in the study area. The Pleistocene and Eocene groundwater was found as unconfined in nature. Irrigation return flows refill the Pleistocene aquifer, which the fractured limestone aquifer toward the west may refill. The Eocene aquifer is refilled during the percolation of irrigation water and from the younger aquifers south of the region. Both aquifers are discharged from the production wells that are employed for the irrigation of the reclamation projects.
The dominance of major cations in the water of the Pleistocene aquifer is in the order of Na+ > Ca2+ > Mg2+ > K+, whereas the dominance anions are HCO3 > Cl > SO42−. For the Eocene aquifer, the major cations are in the order of Na+ > Ca2+ >Mg2+ > K+, whereas the dominant anions are Cl > SO42− > HCO3. PCoA, CA, PCA, and PCMA statistical methods suggest that the geochemical alteration in the Pleistocene and Eocene aquifers originate from water–rock interactions of the aquifer matrix and intensive aquifer matrix weathering. Another factor affecting elements variation in the water of the studied aquifers is various anthropogenic activities that initiate secondary salts.
The groundwater of the Pleistocene and Eocene samples comprises mainly of calcium–magnesium–chloride (Ca2+-Mg2+-Cl) and calcium–bicarbonate (Ca2+-HCO3) type, and few samples fall into the Na+-Cl water type. Gibbs diagram results indicate that most of the Pleistocene and Eocene groundwater fall in the rock-dominance region.
Based on pH, all the collected water samples (Pleistocene and Eocene aquifers) are suitable for drinking. In contrast, the salinity of groundwater is moderate to highly saline, which reflects that most of the Pleistocene water and around 54% of the Eocene water are acceptable for drinking, while nearly 46% are unfit.
According to SAR, KR, and PI, most of the examined samples are acceptable for irrigation; regarding RSC, MH, and Na%, approximately half of the studied groundwater is unfit for irrigation. The samples’ salinity is high, which reflects their unsuitability for irrigation.

Author Contributions

Conceptualization, E.I., E.E. and M.G.S.; methodology, E.I., M.G.S., M.S.A., A.A. and E.E.; validation, E.I., M.G.S., M.S.A. and E.E.; data curation, E.I. and M.G.S.; writing—review and editing, E.I., M.G.S., E.E., M.S.A., D.E.A. and A.A.; visualization, E.I., M.G.S., E.E., D.E.A. and A.A.; supervision, E.I. and M.G.S. All authors have read and agreed to the published version of the manuscript.

Funding

This work is funded by the Researchers Supporting Project number (RSP2023R455), King Saud University, Riyadh, Saudi Arabia.

Data Availability Statement

This article has no associated data, and all the data used in this study are present in the article.

Acknowledgments

This work is funded by the Researchers Supporting Project number (RSP2023R455), King Saud University, Riyadh, Saudi Arabia.

Conflicts of Interest

The authors declared no conflict of interest.

References

  1. Li, P.; Qian, H.; Wu, J. Conjunctive use of groundwater and surface water to reduce soil salinization in the Yinchuan Plain, North-West China. Int. J. Water Resour. Dev. 2018, 34, 337–353. [Google Scholar] [CrossRef]
  2. Adimalla, N.; Li, P.; Venkatayogi, S. Hydrogeochemical Evaluation of Groundwater Quality for Drinking and Irrigation Purposes and Integrated Interpretation with Water Quality Index Studies. Environ. Process. 2018, 5, 363–383. [Google Scholar] [CrossRef]
  3. Salehi, S.; Chizari, M.; Sadighi, H.; Bijani, M. Assessment of agricultural groundwater users in Iran: A cultural environmental bias. Hydrogeol. J. 2018, 26, 285–295. [Google Scholar] [CrossRef]
  4. Ismail, E.; El-Sayed, E.; Sakr, S.; Youssef, E. Characteristic of groundwater potentialities in West Nile Valley South, Minia Governorate, Egypt. Arab. J. Geosci. 2017, 10, 521. [Google Scholar] [CrossRef]
  5. Ismail, E.; Zaki, I.; Rapantova, N.; Licbinska, M.; Sharawi, H. Hydrogeochemical characteristics of the groundwater in the quaternary aquifer of western fringes of El-Minia Governorate, Egypt using an integration of geochemical modeling and geo-statistical techniques. Desalination Water Treat. 2020, 189, 134–151. [Google Scholar] [CrossRef]
  6. Ismail, E.; El-Rawy, M. Assessment of groundwater quality in West Sohag, Egypt. Desalination Water Treat. 2018, 123, 101–108. [Google Scholar] [CrossRef]
  7. Snousy, M.G.; Ismail, E.; Zaki, R. Trace element occurrence and distribution problems in the irrigation water at El-Minia district, north upper Egypt. Arab J. Geosci. 2019, 12, 582. [Google Scholar] [CrossRef]
  8. Abdelhalim, A.; Sefelnasr, A.; Ismail, E. Numerical modeling technique for groundwater management in Samalut city, Minia Governorate, Egypt. Arab. J. Geosci. 2019, 12, 124. [Google Scholar] [CrossRef]
  9. Abdelhalim, A.; Sefelnasr, A.; Ismail, E. Response of the interaction between surface water and groundwater to climate change and proposed megastructure. J. Afri. Earth Sci. 2020, 162, 103723. [Google Scholar] [CrossRef]
  10. Snousy, M.G.; Wu, J.; Su, F.; Abdelhalim, A.; Ismail, E. Groundwater Quality and Its Regulating Geochemical Processes in Assiut Province, Egypt. Expo. Health 2022, 14, 305–323. [Google Scholar] [CrossRef]
  11. Abotalib, Z.A.; Essam, H.; Mohammed, B.; Esam, I.; Ahmed, G.; Mohamed, A. Groundwater mounding: A diagnostic feature for mapping aquifer connectivity in hyper-arid deserts. Sci. Total Environ. 2021, 801, 149760. [Google Scholar] [CrossRef] [PubMed]
  12. Abotalib, A.Z.; Abdelhady, A.A.; Heggy, E.; Salem, S.G.; Ismail, E.; Ali, A.; Khalil, M.M. Irreversible and large-scale heavy metal pollution arising from increased damming and untreated water reuse in the Nile Delta. Earths Future 2023, 11, e2022EF002987. [Google Scholar] [CrossRef]
  13. Adimalla, N.; Sudarshan, V. Geochemical characterization and evaluation of groundwater suitability for domestic and agricultural utility in the semi-arid region of Basara, Telangana State, South India. Appl. Water Sci. 2018, 8, 44. [Google Scholar] [CrossRef] [Green Version]
  14. Sheikh, M.A.; Azad, C.; Mukherjee, S.; Rina, K. An assessment of groundwater salinization in Haryana state in India using hydrochemical tools in association with GIS. Environ. Earth Sci. 2017, 76, 465. [Google Scholar] [CrossRef]
  15. Venkateswaran, S.; Vijay Prabhu, M.; Mohammed Rafi, M.; Vallel, L.K. Assessment of groundwater quality for irrigational use in Cumbum Valley, Madurai District, Tamil Nadu, India. Nat. Environ. Poll. Tech. 2011, 10, 207–212. [Google Scholar]
  16. Li, P.; Tian, R.; Xue, C.; Wu, J. Progress, opportunities, and key fields for groundwater quality research under the impacts of human activities in China with a special focus on western China. Environ. Sci. Pollut. Res. 2017, 24, 13224–13234. [Google Scholar] [CrossRef]
  17. WHO. Guidelines for Drinking-Water Quality: The Fourth Edition Incorporating the First Addendum; World Health Organization: Geneva, Switzerland, 2017; Licence: CC BY-NC-SA 3.0 IGO. [Google Scholar]
  18. Egypt Drinking Water Standards. EHCW (Egyptian Higher Committee of Water), Egyptian Standards for Drinking and Domestic Water According to the Act 27/1978 in Regulation of the Public Water Supplies; Egyptian Governmental Press: Cairo, Egypt, 2007.
  19. Adimalla, N.; Li, P.; Qian, H. Evaluation of groundwater contamination for fluoride and nitrate in the semi-arid region of Nirmal Province, South India: A special emphasis on human health risk assessment (HHRA). Hum. Ecol. Risk Assess 2018, 25, 1107–1124. [Google Scholar] [CrossRef]
  20. Narsimha, A.; Sudarshan, V. Hydrogeochemistry of groundwater in Basara area, Adilabad district, Andhra Pradesh, India. J. Appl. Geochem. 2013, 15, 224–237. [Google Scholar]
  21. Narsimha, A.; Sudarshan, V. Contamination of fluoride in groundwater and its effect on human health: A case study in hard rock aquifers of Siddipet, Telangana State, India. Appl. Water Sci. 2017, 7, 2501–2512. [Google Scholar] [CrossRef] [Green Version]
  22. Li, P.; Wu, J.; Qian, H. Groundwater quality assessment based on rough sets attribute reduction and TOPSIS method in a semi-arid area, China. Environ. Monit Assess. 2012, 184, 4841–4854. [Google Scholar] [CrossRef]
  23. Li, P.; Qian, H. Water resources research to support a sustainable China. Int. J. Water Resour. Dev. 2018, 34, 327–336. [Google Scholar] [CrossRef] [Green Version]
  24. Adimalla, N.; Li, P. Occurrence, health risks, and geochemical mechanisms of fluoride and nitrate in groundwater of the rock dominant semi-arid region, Telangana State, India. Hum. Ecol. Risk Assess. 2018, 25, 14803–14853. [Google Scholar]
  25. Alexakis, D.E. Applying Factor Analysis and the CCME Water Quality Index for Assessing Groundwater Quality of an Aegean Island (Rhodes, Greece). Geosciences 2022, 12, 384. [Google Scholar] [CrossRef]
  26. Alexakis, D.; Kiskira, K.; Gamvroula, D.; Emmanouil, C.; Psomopoulos, C. Evaluating toxic element contamination sources in groundwater bodies of two Mediterranean sites. Environ. Sci. Pollut. Res. 2021, 28, 34400–34409. [Google Scholar] [CrossRef] [PubMed]
  27. Raju, N.J. Hydrogeochemical parameters for assessment of groundwater quality in the upper Gunjanaeru River basin, Cuddapah District, Andhra Pradesh, South India. Environ. Geol. 2007, 52, 1067–1074. [Google Scholar] [CrossRef]
  28. Said, R. The Geology of Egypt; Balkema Publisher: Rotterdam, The Netherlands, 1990; 734p. [Google Scholar]
  29. Abd El-Monaim, A.E. Geoelectrical and Hydrogeologic Studies on the Quaternary Aquifer in the Nile Valley in Assiut and Sohag Governorates, Egypt. Ph.D. Thesis, Dept. of Geophysics, Faculty of Science, Ain shams University: Cairo, Egypt, 1994. [Google Scholar]
  30. El Tahlawi, M.R.; Farrag, A.A.; Ahmed, S.S. Groundwater of Egypt: “An environmental overview”. Environ. Geol. 2008, 55, 639–652. [Google Scholar]
  31. APHA American Public Health Association. Standard Methods for the Examination of Water and Wastewater; Eaton, A.D., Clesceri, L.S., Greenberg, A.E., Eds.; APHA, AWWA, WPCF: New York, NY, USA, 2005. [Google Scholar]
  32. Hammer, O.; Harper, D.A.T.; Ryan, P.D. PAST Paleontological statistics software package for education and data analysis. Palaeontol. Electron. 2001, 4, 9. [Google Scholar]
  33. Snousy, M.G.; Morsi, M.S.; Elewa, A.M.; Ahmed, S.A.E.-F.; El-Sayed, E. Groundwater vulnerability and trace element dispersion in the Quaternary aquifers along middle Upper Egypt. Environ. Monit. Assess. 2020, 192, 174. [Google Scholar] [CrossRef]
  34. Snousy, M.G.; Li, P.; Ismail, E. Trace elements speciation and sources characterization in the main watercourses, middle-upper Egypt. Hum. Ecol. Risk Assess. 2021, 27, 1764–1785. [Google Scholar] [CrossRef]
  35. Todd, D.K. Groundwater Hydrology, 2nd ed.; John Wiley & Sons: New York, NY, USA, 1980. [Google Scholar]
  36. Richards, L.A. Diagnosis and Improvement of Saline and Alkaline Soils; US Department of Agricultural Handbook, No. 60; US Govt. Print Office: Washington, DC, USA, 1947; Volume 160, p. 1954.
  37. Wilcox, L.V. Classification and Use of Irrigation Waters. US Department of Agriculture, Circular 969: Washington, DC, USA, 1955. [Google Scholar]
  38. Paliwal, K.V. Irrigation with Saline Water; Monogram No. 2(new series); IARI: New Delhi, India, 1972; p. 198. [Google Scholar]
  39. Joshi, D.M.; Kumar, A.; Agarwal, N. Assessment of the irrigation water quality of River Ganga in Haridwar District India. J. Chem. 2009, 2, 285–292. [Google Scholar]
  40. Domenico, P.A.; Schwartz, F.W. Physical and Chemical Hydrogeology; Wiley: New York, NY, USA, 1990; pp. 410–420. [Google Scholar]
  41. Kelly, W.P. Use of Saline Irrigation Water. Soil Sci. 1963, 95, 355–391. [Google Scholar] [CrossRef]
  42. Tariq, S.R.; Shah, M.H.; Shaheen, N.; Jaffar, M.; Khalique, A. Statistical source identification of metals in groundwater exposed to industrial contamination. Environ. Monit. Assess. 2008, 138, 159–165. [Google Scholar] [CrossRef]
  43. Ledesma-Ruiz, R.; Pastén-Zapata, E.; Parra, R.; Harter, T.; Mahlknecht, J. Investigation of the geochemical evolution of groundwater under agricultural land: A case study in northeastern Mexico. J. Hydrol. 2015, 521, 410–423. [Google Scholar] [CrossRef] [Green Version]
  44. Holland, H.D. The Chemistry of the Atmosphere and Oceans; Wiley: New York, NY, USA, 1978; p. 35. [Google Scholar]
  45. Mollema, P.N.; Antonellini, M. Water and (bio)chemical cycling in gravel pit lakes: A review and outlook. Earth-Sci. Rev. 2016, 159, 247–270. [Google Scholar] [CrossRef]
  46. Piper, A.M. A Graphic Procedure in the Geochemical Interpretation and Analysis of Water Samples; United States Geological Survey; Water Supply Paper; 1953; p. 1454. [Google Scholar] [CrossRef]
  47. Liu, C.-W.; Lin, K.-H.; Kuo, Y.-M. Application of factor analysis in the assessment of groundwater quality in a blackfoot disease area in Taiwan. Sci. Total Environ. 2003, 313, 77–89. [Google Scholar] [CrossRef]
  48. Aliyu, A.G.; Jamil, N.R.B.; Adam, M.B.; Zulkeflee, Z. Spatial and seasonal changes in monitoring water quality of Savanna River system. Arab. J. Geosci. 2020, 13, 55. [Google Scholar] [CrossRef]
  49. Aguirre, B.P.; Masachessi, G.; Ferreyra, L.J.; Biganzoli, P.; Grumelli, Y.; Panero, M.D.; Wassaf, M.M.; Pisano, M.B.; Welter, A.; Mangeaud, A.; et al. Searching variables to assess recreational water quality: The presence of infectious human enterovirus and its correlation with the main variables of water pollution by multivariate statistical approach in Córdoba, Argentina. Environ. Sci. Pollut. Res. 2019, 26, 6586–6601. [Google Scholar] [CrossRef]
  50. Ustaoğlu, F.; Tepe, Y. Water quality and sediment contamination assessment of Pazarsuyu Stream, Turkey using multivariate statistical methods and pollution indicators. Int. Soil Water Conserv. Res. 2019, 7, 47–56. [Google Scholar] [CrossRef]
  51. Long, J.; Luo, K. Elements in surface and well water from the central North China Plain: Enrichment patterns, origins, and health risk assessment. Environ. Pollut. 2020, 258, 113725. [Google Scholar] [CrossRef]
  52. Battistel, M.; Hurwitz, S.; Evans, W.C.; Barbieri, M. The chemistry and isotopic composition of waters in the low-enthalpy geothermal system of Cimino-Vico Volcanic District, Italy. J. Volcanol. Geotherm. Res. 2016, 328, 222–229. [Google Scholar] [CrossRef] [Green Version]
  53. Srivastava, S.K.; Ramanathan, A.L. Geochemical assessment of groundwater quality in vicinity of Bhalswa landfill, Delhi, India, using graphical and multivariate statistical methods. Environ. Geol. 2008, 53, 1509–1528. [Google Scholar] [CrossRef]
  54. Chetelat, B.; Gaillardet, J. Boron Isotopes in the Seine River, France: A Probe of Anthropogenic Contamination. Environ. Sci. Technol. 2005, 39, 2486–2493. [Google Scholar] [CrossRef]
  55. Rahman, M.S.; Whalen, M.; Gagnon, G.A. Adsorption of dissolved organic matter (DOM) onto the synthetic iron pipe corrosion scales (goethite and magnetite): Effect of pH. Chem. Eng. J. 2013, 234, 149–157. [Google Scholar] [CrossRef]
  56. Nigro, A.; Sappa, G.; Barbieri, M. Application of boron and tritium isotopes for tracing landfill contamination in groundwater. J. Geochem. Explor. 2017, 172, 101–108. [Google Scholar] [CrossRef]
  57. Doza, B.; Islam, A.T.; Ahmed, F.; Das, S.; Saha, N.; Rahman, M.S. Characterization of groundwater quality using water evaluation indices, multivariate statistics and geostatistics in central Bangladesh. Water Sci. 2016, 30, 19–40. [Google Scholar] [CrossRef] [Green Version]
  58. Mora, A.; Mahlknecht, J.; Baquero, J.C.; Laraque, A.; Alfonso, J.A.; Pisapia, D.; Balza, L. Dynamics of dissolved major (Na, K, Ca, Mg, and Si) and trace (Al, Fe, Mn, Zn, Cu, and Cr) elements along the lower Orinoco River. Hydrol. Process. 2017, 31, 597–611. [Google Scholar] [CrossRef] [Green Version]
  59. Li, P.; He, X.; Guo, W. Spatial groundwater quality and potential health risks due to nitrate ingestion through drinking water: A case study in Yan’an City on the Loess Plateau of northwest China. Hum. Ecol. Risk Assess. Int. J. 2019, 25, 11–31. [Google Scholar] [CrossRef]
  60. Patel, M.P.; Gami, B.; Patel, A.; Patel, P.; Patel, B. Climatic and anthropogenic impact on groundwater quality of agriculture dominated areas of southern and central Gujarat, India. Groundw. Sustain. Dev. 2020, 10, 100306. [Google Scholar] [CrossRef]
  61. Aminiyan, M.M.; Aitkenhead-Peterson, J.; Aminiyan, F.M. Evaluation of multiple water quality indices for drinking and irrigation purposes for the Karoon river, Iran. Environ. Geochem. Health 2018, 40, 2707–2728. [Google Scholar] [CrossRef]
  62. Gibbs, R.J. Mechanisms Controlling World Water Chemistry. Science 1970, 170, 1088–1090. [Google Scholar] [CrossRef]
  63. Benjamin, J.; Nielsen, D.; Vigil, M. Quantifying effects of soil conditions on plant growth and crop production. Geoderma 2003, 116, 137–148. [Google Scholar] [CrossRef]
  64. Arveti, N.; Sarma, M.R.S.; Aitkenhead-Peterson, J.A.; Sunil, K. Fluoride incidence in groundwater: A case study from Talupula, Andhra Pradesh, India. Environ. Monit. Assess 2011, 172, 427–443. [Google Scholar] [CrossRef] [PubMed]
  65. USSL (US Salinity Laboratory). Diagnosis and Improvement of Saline and Alkaline Soils; Agriculture Handbook No. 60 USDA; 1954; p. 160. [Google Scholar]
  66. Kumar, S.A. Hydrochemistry and quality assessment of groundwater in Naini industrial area, Allahabad District, Uttar Pradesh. J. Geol. Soc. India 2000, 55, 77–89. [Google Scholar]
  67. Nagaraju, A.; Suresh, S.; Killham, K.; Hudson-Edwards, K. Hydro-geochemistry of waters of Mangampeta Barite Mining Area, Cuddapah Basin, Andhra Pradesh, India. Turk. J. Eng. Env. Sci. 2006, 30, 203–219. [Google Scholar]
Figure 1. Location map showing the study area and groundwater sampling sites.
Water 15 02812 g001
Figure 2. Groundwater level in the aquifers of the study area.
Water 15 02812 g002
Figure 3. Piper’s diagram of the groundwater samples of the study area.
Water 15 02812 g003
Figure 4. Eocene aquifer PCA (PC1, PC2, and PC3) plot.
Water 15 02812 g004
Figure 5. PCoA plot, coordinate 1 (36.852%) vs. coordinate 2 (21.184%).
Water 15 02812 g005
Figure 6. Dendrogram with imaginary horizontal line (phenon line) displays the clustering attitude of the Eocene water.
Water 15 02812 g006
Figure 7. Dendrogram with imaginary horizontal line (phenon line) presents Pleistocene water clustering behavior.
Water 15 02812 g007
Figure 8. The intra-relationship pattern between parameters of the Eocene aquifer.
Water 15 02812 g008
Figure 9. The intra-relationship pattern between Pleistocene water parameters.
Water 15 02812 g009
Figure 10. Gibbs diagram of the groundwater samples (a) (cations). (b) (anions).
Water 15 02812 g010
Figure 11. Zonation maps of EC, TDS, TH, and pH in the area studied.
Water 15 02812 g011
Figure 12. Zonation maps of major ions in the study area.
Water 15 02812 g012
Figure 13. USSL diagram for the examined samples.
Water 15 02812 g013
Figure 14. Wilcox diagram for the physicochemical parameters of groundwater samples of the study area.
Water 15 02812 g014
Figure 15. PI diagram of the groundwater samples.
Water 15 02812 g015
Table 2. Descriptive statistics of physicochemical parameters (in mg/L) and EC (in µS/cm) in groundwater of the Pleistocene aquifer in the area studied (n = 12).
ParameterMinimumMaximumMeanStd. Deviation
T °C24.930.627.931.37
EC86013301049.75176.51
TDS550851671.67112.97
pH7.28.68.020.42
Ca2+882.852.2321.24
Mg2+226336.3511.21
Na+1814480.5834.68
K+0.33.61.830.98
HCO3196338270.8445.93
SO42−3311667.9226.03
Cl42.6216116.7147.79
Table 3. Descriptive statistics of physicochemical parameters (in mg/L) and EC (in µS/cm) in groundwater of the Eocene aquifer in the area studied (n = 24).
ParameterMinimumMaximumMeanStd. Deviation
T °C26.830.528.481.10
EC52032401767.58859.78
TDS33320741131.29550.25
pH7.18.67.810.38
Ca2+12254100.3368.88
Mg2+4.4314354.1937.77
Na+56385163.7586.64
K+0.34.22.311.15
HCO3104348210.5165.91
SO42−24620153.29133.72
Cl14.2896.4353.29281.01
Table 4. The main PCA results for the parameters determined in the water of the Eocene aquifer.
ComponentInitial Eigenvalues
Total% of VarianceCumulative %
15.90759.07059.070
21.35513.54672.616
31.15011.50384.118
Table 5. The main 3 principal components matrix extracted for the parameters of the Eocene aquifer samples.
ParameterPC 1PC 2PC 3
T °C0.0680.9220.199
EC0.985−0.0230.009
TDS0.985−0.0230.009
pH−0.412−0.5570.608
Ca2+0.908−0.270−0.004
Mg2+0.930−0.181−0.064
Na+0.7980.159−0.106
K+0.4110.1020.770
SO42−0.6790.1800.317
Cl0.914−0.135−0.180
Table 6. Results of main principal coordinate analyses for the parameters of Pleistocene aquifer samples.
CoordinateInitial Eigenvalues
Total% of VarianceCumulative %
12.33736.85236.852
21.34421.18458.036
31.12817.78275.818
Table 7. Pearson correlation coefficient of physicochemical parameters in the Eocene water.
T °CECTDSpHCa2+Mg2+Na+K+HCO3SO42−Cl
T °C10.0620.063−0.339−0.134−0.0840.1290.212−0.2450.212−0.070
EC 11.000 **−0.3530.893 **0.907 **0.788**0.3680.0190.677 **0.877 **
TDS 1−0.3530.894 **0.907 **0.788**0.3690.0190.677 **0.877 **
pH 1−0.249−0.339−0.3970.1110.227−0.182−0.403
Ca2+ 10.935 **0.538 **0.3440.0070.538 **0.870 **
Mg2+ 10.582 **0.280−0.0240.635 **0.857 **
Na+ 10.290−0.1750.459 *0.798 **
K+ 1−0.2820.3370.319
HCO3 1−0.062−0.209
SO42− 10.357
Cl 1
Notes: Digits are significant at 95% and 99% confidence levels, as denoted by * (95%) and ** (99%). * Correlation is significant at 0.05 (p < 0.05). ** Correlation is significant at 0.01 (p < 0.01).
Table 8. Pearson correlation coefficient matrix of physicochemical parameters in the Pleistocene water.
T °CECTDSpHCa2+Mg2+Na+K+HCO3SO42−Cl
T °C10.1630.162−0.0540.2050.404−0.5030.5300.3360.168−0.371
EC 11.000 **−0.1870.3970.577 *0.0610.0560.3130.794 **0.284
TDS 1−0.1880.3970.578 *0.0610.0560.3130.794 **0.285
pH 1−0.268−0.044−0.303−0.1740.218−0.034−0.694 *
Ca2+ 10.131−0.4060.4430.0100.5220.217
Mg2+ 1−0.411−0.2150.580 *0.136−0.054
Na+ 1−0.086−0.2300.1160.600 *
K+ 1−0.3330.3210.181
HCO3 10.124−0.464
SO42− 10.171
Cl 1
Notes: Digits are significant at 95% and 99% confidence levels, as denoted by * (95%) and ** (99%). * Correlation is significant at 0.05 (p < 0.05). ** Correlation is significant at 0.01 (p < 0.01).
Table 9. Range values of physicochemical parameters determined in water from the study area compared with criteria provided by the literature.
Physicochemical ParameterPleistocene
Samples Range
Eocene Samples RangeEgyptian Permissible Limit (mg/L)World Health
Organization
Guidelines (mg/L)
pH7.2–8.67.1–8.66.5–8.56.5–9.2
EC820–1270500–30952000500–1500
TDS550–851333–207412001000
Hardness (TH)139–38985–1046500--
Calcium8–8212–254200--
Magnesium22–634–143150--
Sodium18–14456–385--200
Sulfates33–11624–358250–400400
Chloride42–21614–896500250
Table 10. Groundwater appropriateness index for irrigation purposes.
Classification PatternCategoriesRangesPleistocene Aquifer (%)Eocene Aquifer (%)
EC
(m.mohs/cm) at 25°
Low<250----
Medium251–750--12.5
High751–225010054
Very high>2250--33.5
Sodium absorption
ratio (SAR)
Excellent0–10100100
Good10–18---
Fair18–26---
Poor>26--
Percent sodium
(% Na)
Excellent<2084
Good20–405025.5
Permissible40–604262.5
Doubtful60–80--4
Unsuitable>80--4
Residual sodium
carbonate (RSC)
Good quality used for all soils<1.255821
Water of medium quality is used in case of good drainage1.25–2.52512.5
Unsuitable water>2.51766.5
Kelley’s ratioGood quality water<17571
Unsuitable water>12529
Magnesium
hazard (MH)
Suitable water<504267
Unsuitable water>505833
Permeability index (PI)Good water quality for irrigation>752517
25–757579
Unsuitable<25--4
Disclaimer/Publisher’s Note: The statements, opinions and data contained in all publications are solely those of the individual author(s) and contributor(s) and not of MDPI and/or the editor(s). MDPI and/or the editor(s) disclaim responsibility for any injury to people or property resulting from any ideas, methods, instructions or products referred to in the content.

