Article

Gas Loss Mechanism in the High-Pressure Air Cushion Surge Chamber of Hydropower Station for Transient Process

1
Power China Chengdu Engineering Corporation Limited, Chengdu 610072, China
2
College of Energy and Electrical Engineering, Hohai University, Nanjing 210098, China
3
Huaneng Sichuan Energy Development Co., Ltd., Chengdu 610025, China
4
College of Water Conservancy and Hydropower Engineering, Hohai University, Nanjing 210098, China
5
Yangtze Institute for Conservation and Development, Nanjing 210098, China
*
Author to whom correspondence should be addressed.
Water 2023, 15(15), 2784; https://doi.org/10.3390/w15152784
Submission received: 7 July 2023 / Revised: 27 July 2023 / Accepted: 28 July 2023 / Published: 1 August 2023
(This article belongs to the Section Water-Energy Nexus)

Abstract

:
Water–air interaction (mixing of gas and water and gas dissolution into water) is one of the main reasons for gas loss in air cushion surge chambers. With the increase of water head in hydraulic power generation systems, the heat and mass transfer process at the water–air interface under high-pressure conditions intensifies, and the water–air interaction is further strengthened. If some gas is mixed/dissolved in water and enters downstream pipelines, it will affect the safety of the unit. At present, there has been no theoretical or systematic research on gas loss and related water gas two-phase flow in air cushion surge chambers under high-pressure conditions. Therefore, this article established an air loss model for an air cushion surge chamber based on the VOF model and gas–liquid mass transfer theory. We analyzed the mechanism of gas loss in the gas chamber through simulation and quantitatively expressed the gas loss. The results indicate that during a typical large fluctuation process, the gas–liquid mass transfer process at the water–air interface, air mass, and vortex is very strong, with a pressure chamber of approximately 923.89 m3. The gas dissolved in water enters the water diversion system, with a length of 28.75 m3. High pressure gas enters the water diversion system in the form of air masses. When considering the water inlet on the right side of the air chamber, the total gas loss in the air chamber is slightly lower (854.18 m3) and no mixed air mass was detected entering the connecting pipe.

1. Introduction

Air cushion surge chambers [1,2,3] have unique advantages for the selection of the layout mode of water diversion systems, the reduction of construction difficulty, the protection of surface ecological environment and other aspects, but their operation mechanism in the hydraulic transition process of a water diversion system is very complex, involving three-dimensional dynamic characteristics of water and air interaction. At present, the problem of gas loss in air cushion surge chambers has attracted much attention, mainly in two ways: one is air leakage through cracks on the side wall of the air chamber (surrounding rock); the other is air dissolution in water, namely mass transfer by water and gas, which can be ignored when the gas pressure and temperature are not high [4]. As the air cushion surge chamber is in a state of high pressure for a long time, the interaction between water and air is intensified, and the gas in the gas chamber may dissolve in water during the operation of the surge chamber, whether it has an impact on the simulation analysis of the transition process—especially the value of multi-party index m [5]—and whether it will have an adverse impact on the hydraulic unit as the water enters the pressure pipeline and hydraulic mechanical system [6]. It is necessary to conduct a quantitative analysis on the relevant mechanism of gas loss, which has not been studied at present.
In the CFD simulation of the air cushion surge chamber, Xia Linsheng et al. [7] established and verified the two-phase flow model of the corridor type air cushion surge chamber. Deng et al. [8] used the VOF method to simulate the flow in a long corridor type air cushion surge chamber, analyzed its characteristics, and proposed measures to eliminate the harmful gas entrainment of vertical vortex. Ding Ning et al. [9] simulated the surge process in the voltage regulator room under the load dumping condition of a power station based on the three-dimensional VOF method, and the calculated results were in good agreement with the test data. CAI Fang et al. [10] elaborated and analyzed the problem of the air trapping vertical vortex in the long corridor air cushion surge chamber based on the three-dimensional CFD model. Previous studies have proved that CFD is effective in simulating the flow regime of the surge chamber, but the problems of water–air mixing and phase dissolution were not considered in the simulation.
In a study of free-surface water–air mixing, Xu Weilin et al. [11] established a mathematical model of water–air two-phase turbulence and verified it based on the simulation of aerated flow in an open channel and an aerated jet in a water cushion pond. Based on the VOF model, Li Zhigao [12] simulated water–air mixing in open channel water flow and in front of a gate, and calculated the shape of the water–air interface, the distribution of water–air content, and the velocity field, pressure field, turbulent kinetic energy, and turbulent dissipation rate distribution of the flow field. Hohermuth et al. [13] used a uniformly aerated water flow to calibrate the mixing model, solved the mixed Reynolds mean N-S equation, and used different sub-grid air transport models to evaluate the effects of drag coefficient, correction model, and bubble diameter. Zhou Ling et al. [14,15,16] simulated the water–gas two-phase interaction in a pipeline containing trapped air mass by using a three-dimensional CFD method, and showed the dynamic change process through the water–gas two-phase distribution diagram.
With respect to mass transfer at the water–air interface, Cheng Xiangju et al. [17,18] established and verified the convection diffusion model of dissolved oxygen concentration in aerated water flow. Wang Huanran et al. [19] studied the static diffusion of high pressure dissolved gas in the pumped storage system without a dam and showed that the diffusion depth of gas in the static water body reached 0.5 m. Wei Wangru et al. [20] established a numerical model of air distribution concentration in cross section, considering the air–water structure in the flow of a self-aerated open channel in two different diffusion processes. B Daniel et al. [21] conducted a simulation study on a variety of stepped spillways and proposed the empirical relationship between model water and air mass transfer. Aiming at the heat transfer problem at the water–gas interface, Tan Sichao et al. [22] improved the interfacial mass transfer and volumetric mass transfer conversion methods in the VOF model, which can be widely used in the simulation of interfacial heat and mass transfer in multiphase flow. Based on the VOF model, Zhu Hairong [23,24] introduced the Level Set function to establish a coupled model, which can effectively simulate the transient distribution and dynamic changes of two-phase flow and significantly improve the accuracy of heat transfer calculations. Based on the two-phase flow model, Zhang Yumin [25] added a corresponding module into Fluent as the source term of evaporation and condensation in the mass transfer heat transfer equation, and accurately simulated the heat transfer phenomenon in the gas–liquid phase variation process in the thermosiphon.
At present, there is no quantitative analysis of the gas loss in the air cushion surge chamber, and especially no systematic research on water–air mixing or gas–liquid mass and heat transfer in the high-pressure water–air interface of the air cushion surge chamber. This paper mainly considered the heat and mass transfer process of the water–air interface under high pressure conditions and, combined with the VOF method, carried out a three-dimensional numerical simulation on the water–air mixing and gas dissolution/precipitation process in the typical transition process of the air cushion regulation chamber, as well as exploring the variation law of water soluble gas volume, the periodic change of gas with water flow into the water diversion system, and the air loss in the air chamber.

2. Water–Air Two-Phase Flow Model

2.1. VOF Model

The VOF model is applicable to the mixed flow of a variety of fluids. By introducing the fluid volume fraction function α in the grid cell, the sum of the volume fraction of all phases in each grid cell is 1, and the volume fraction of water phase in the air cushion regulator is α w , then: when α w = 0, the grid cell contains no water; when α w = 1, the grid cell contains only water; when 0 < α w < 1, the grid cell contains two kinds of fluids—water and gas.
The VOF model can be used to track and simulate the water–air interface in the air cushion regulating chamber. The actual gas is considered. The basic governing equation of the model is as follows:
Continuity equation:
t α w ρ + x i α w ρ u i = m aw m wa .
In the formula, α represents the volume fraction, ρ represents the density of gas–water mixture determined by Equation (3), u i and x i represent the velocity components and coordinate components in x, y, z and three directions, m aw represents the mass of material transfer from gas to water phases, and the volume fraction of gas phase α a will be constrained by the following formula:
α w + α a = 1 .
In a two-phase system, the average density of each cell is:
ρ = α w ρ w + 1 α w ρ a .
Momentum equation:
ρ u i t + ρ u i u j x j = p x i + τ ij x j + ρ g i ,
where ρ represents the average density of the unit, g i represents the gravitational volume force in the direction of i, p represents the static pressure strength, u i represents the velocity component of x i upward, and τ ij represents the stress tensor.

2.2. Heat Transfer Model

As shown in Figure 1, in the hydraulic transition process of the air cushion surge chamber, the water level of the air cushion surge chamber keeps changing, and the gas temperature in the gas chamber changes during the process of continuous compression and expansion. Temperature differences occur between the gas, liquid, and solid cofferdam, and the gas in the gas chamber carries out heat transfer behavior with the water body and solid cofferdam, respectively. The heat transfer process between the gas and the water body is as follows:
ρ c p T t + x i u i ρ c p T + p = x i T x i k eff w j h j , w J j , w .
In the formula, c p stands for isobaric specific heat, T stands for temperature, k eff stands for effective heat conduction coefficient, h j , q stands for enthalpy of gas in water phase, and J j , w stands for diffusion flux of gas in water phase.
The temperature of the air chamber cofferdam is regarded as constant, and a temperature gradient will be formed between the gas and the air chamber cofferdam in the process of compression and expansion. The heat transfer in the process is as follows:
ρ c p T t + x i u i ρ c p T + p = x i T x i k eff .

2.3. Mass Transfer Model

In the transition process, the state of the air cushion pressure regulating chamber constantly changes, and the water–gas two-phase dynamic mass transfer is carried out at the water–gas interface at any time, as shown in Figure 1. A solute penetration model was established in the model to represent the mass transfer process between gas and liquid, and air constantly dissolves into water or precipitates out of water with the change of the state of the air cushion regulating chamber. The diffusion process from the shallow layer to the deep layer after the air dissolves into the water body is fully considered.
Many researchers have carried out a large number of theoretical and experimental studies on the interphase mass transfer process. According to the different modes of solute transfer from gas phase to liquid phase, three classical mass transfer models have been proposed, including the double membrane (stagnant membrane) model, solute penetration model, and surface renewal model. Higbie proposed a solute permeability model based on the two-membrane theory. He believed that the gas solute gradually dissolves in the liquid phase when it contacts with the liquid phase, and the solute gradually penetrates from the phase boundary to the deep part of the liquid film until a stable concentration gradient is formed, which is more suitable for the water–gas miscibility phenomenon in the gas chamber than other models. The mass transfer coefficient of the solute penetration model is expressed as follows:
K L = 2 D AB π t c   .
In the equation, the permeability time t c can be estimated based on the isotropic turbulence theory. The ratio of the Kolmogorov minimum viscous vortex scale to turbulent pulsation velocity is approximately taken as the permeability time, which is called the vortex model method. The mass transfer coefficient can be expressed as:
K L = 2 D AB π t c ε ρ L μ L 1 4  
K La = K L a ,
where D AB represents the diffusion coefficient of solute A in solvent B, ε represents the turbulent kinetic energy dissipation rate, μ L represents the dynamic viscosity of the liquid phase, and a represents the specific surface area of the gas–liquid boundary.
When the gas solute enters the liquid, diffusion will occur, and the diffusion theory [9] and experiment in the liquid are not as perfect as that of the gas, so the empirical estimation should be used cautiously. When the diffusion group is divided into non-electrolytes with low relative molecular weight, its diffusion coefficient in dilute solution can be estimated as follows:
D AB = 7.4 × 10 8 a M B 0.5 T μ V A 0.6 .
In the formula, M B represents the molar mass of solvent B, V A represents the molecular volume of solute A at the normal boiling point, μ represents the viscosity of liquid, and a represents the association factor of solvent.
Mass transfer rate:
d C d t = K La C S C ,
where C S represents the saturation solubility in water and C represents the corresponding solubility in water at time t.

3. Example Simulation and Analysis

3.1. Surge Chamber Structure

In order to further consider the influence of flow structures such as surge wave in the air cushion surge chamber on the interaction between water and air, this paper studied and analyzed the air cushion surge chamber with two different structural forms (Figure 2). The Model 1 parameters are the actual air chamber parameters of the LZ power plant. The section of the air chamber and the water supply tunnel of the two models are city gate type, the width of the bottom section of the air chamber is 16 m, the height of the vertical part is 16 m, and the radius of the dome is 8 m. The total length of the air chamber is 215 m. The bottom width of the water supply tunnel section is 5 m, the height of the vertical part is 2.5 m, and the radius of the dome is 2.5 m. In Model 1 (Figure 2a), the water supply tunnel is connected to the bottom of the air chamber vertically through the connecting pipe, and the diameter of the connecting pipe is 5 m. The elevation difference between the bottom of the water delivery tunnel and the bottom of the air cushion surge chamber is 20 m, and the length of the water delivery tunnel is 43 m. In Model 2 (Figure 2b), the water delivery tunnel directly accesses the air chamber at a slope angle of 3° from the right side of the air chamber and the water delivery tunnel is 40 m long.

3.2. Hydraulic Boundary Conditions

The initial water level of the gas chamber of the surge chamber under a stable state was set at 4.5 m, the initial temperature under working condition was set at 278 K, and the gas content in the gas chamber under initial state was 0.094 kg/m3, which is the saturated gas content in the water body under standard atmospheric pressure. Unified pressure boundary conditions were adopted to link the boundary of the tunnel entrance. The pressure head was determined by the calculation results of the transition process of a one-dimensional hydraulic unit. The pressure change curve over time is shown in Figure 3, and the transition period is about 380 s. The pressure increases first, then decreases and then increases with time, and the difference between the maximum and minimum pressure is about 286 m.

3.3. Grid Sensitivity Analysis

The three-dimensional model of the air cushion surge chamber is shown in Figure 2, which can intuitively show the simulation model of the surge chamber. The generated model file was meshed with a Dodecahedron mesh combined with a Hexahedron mesh (FLUENT MESHING 2022R1), and the generated mesh file was calculated based on the FLUENT 2022R1 computing platform. The finite volume method was used to solve the three-dimensional flow field, the PISO algorithm was used for pressure velocity coupling, and the k-ε RNG model was used for the turbulence model and the SRK real gas equation of state was used for gas (air).
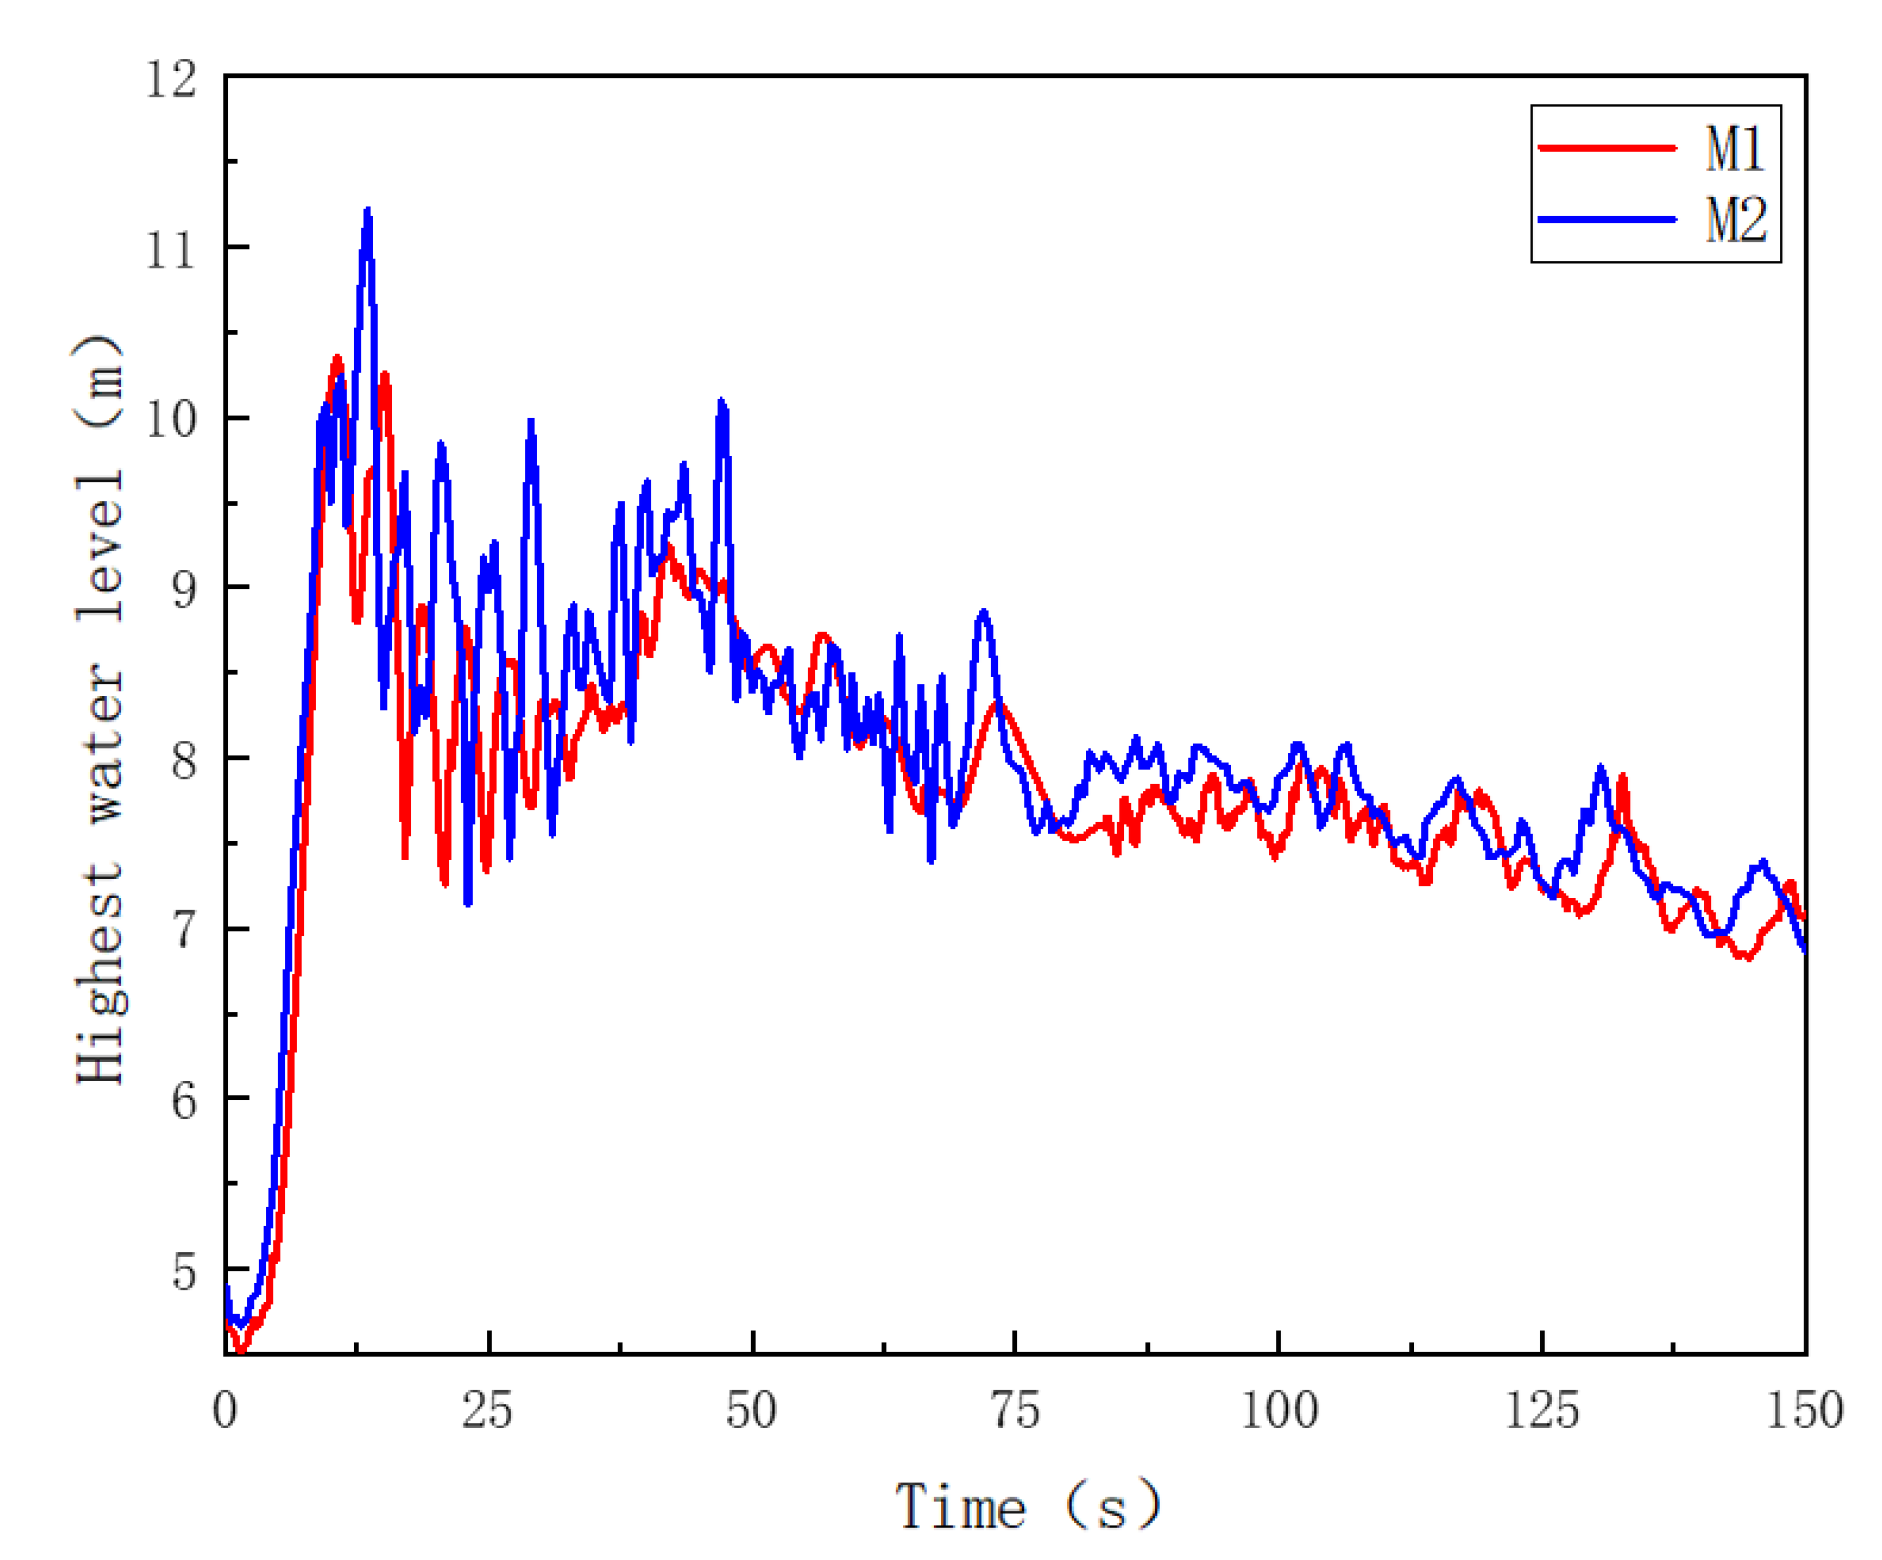
Based on Model 1, grid sensitivity was verified, and two sets of grids were divided according to the size of the internal grids: the total number of the first set of grids M1 was 210,196 and the total number of the second set of grids M2 was 693,642. A simple flow mode calculation was carried out for the M1 and M2 grids, respectively. The M1 and M2 models were different only in the number of grids, and other calculation settings were the same. Figure 4 shows the comparison of the highest water level curves of the liquid surface in the two sets of grids. It can be seen from the figure that the overall trend of the two grids’ maximum water level is the same, the data deviation is within 9%, and the data difference is mainly at the early gushing point. The establishment and mesh division of air cushion surge chamber Model 2 is the same as that of the M1 model, with 207,542 grids.

3.4. Analysis of Flow State Structure of Air Cushion Surge Chamber

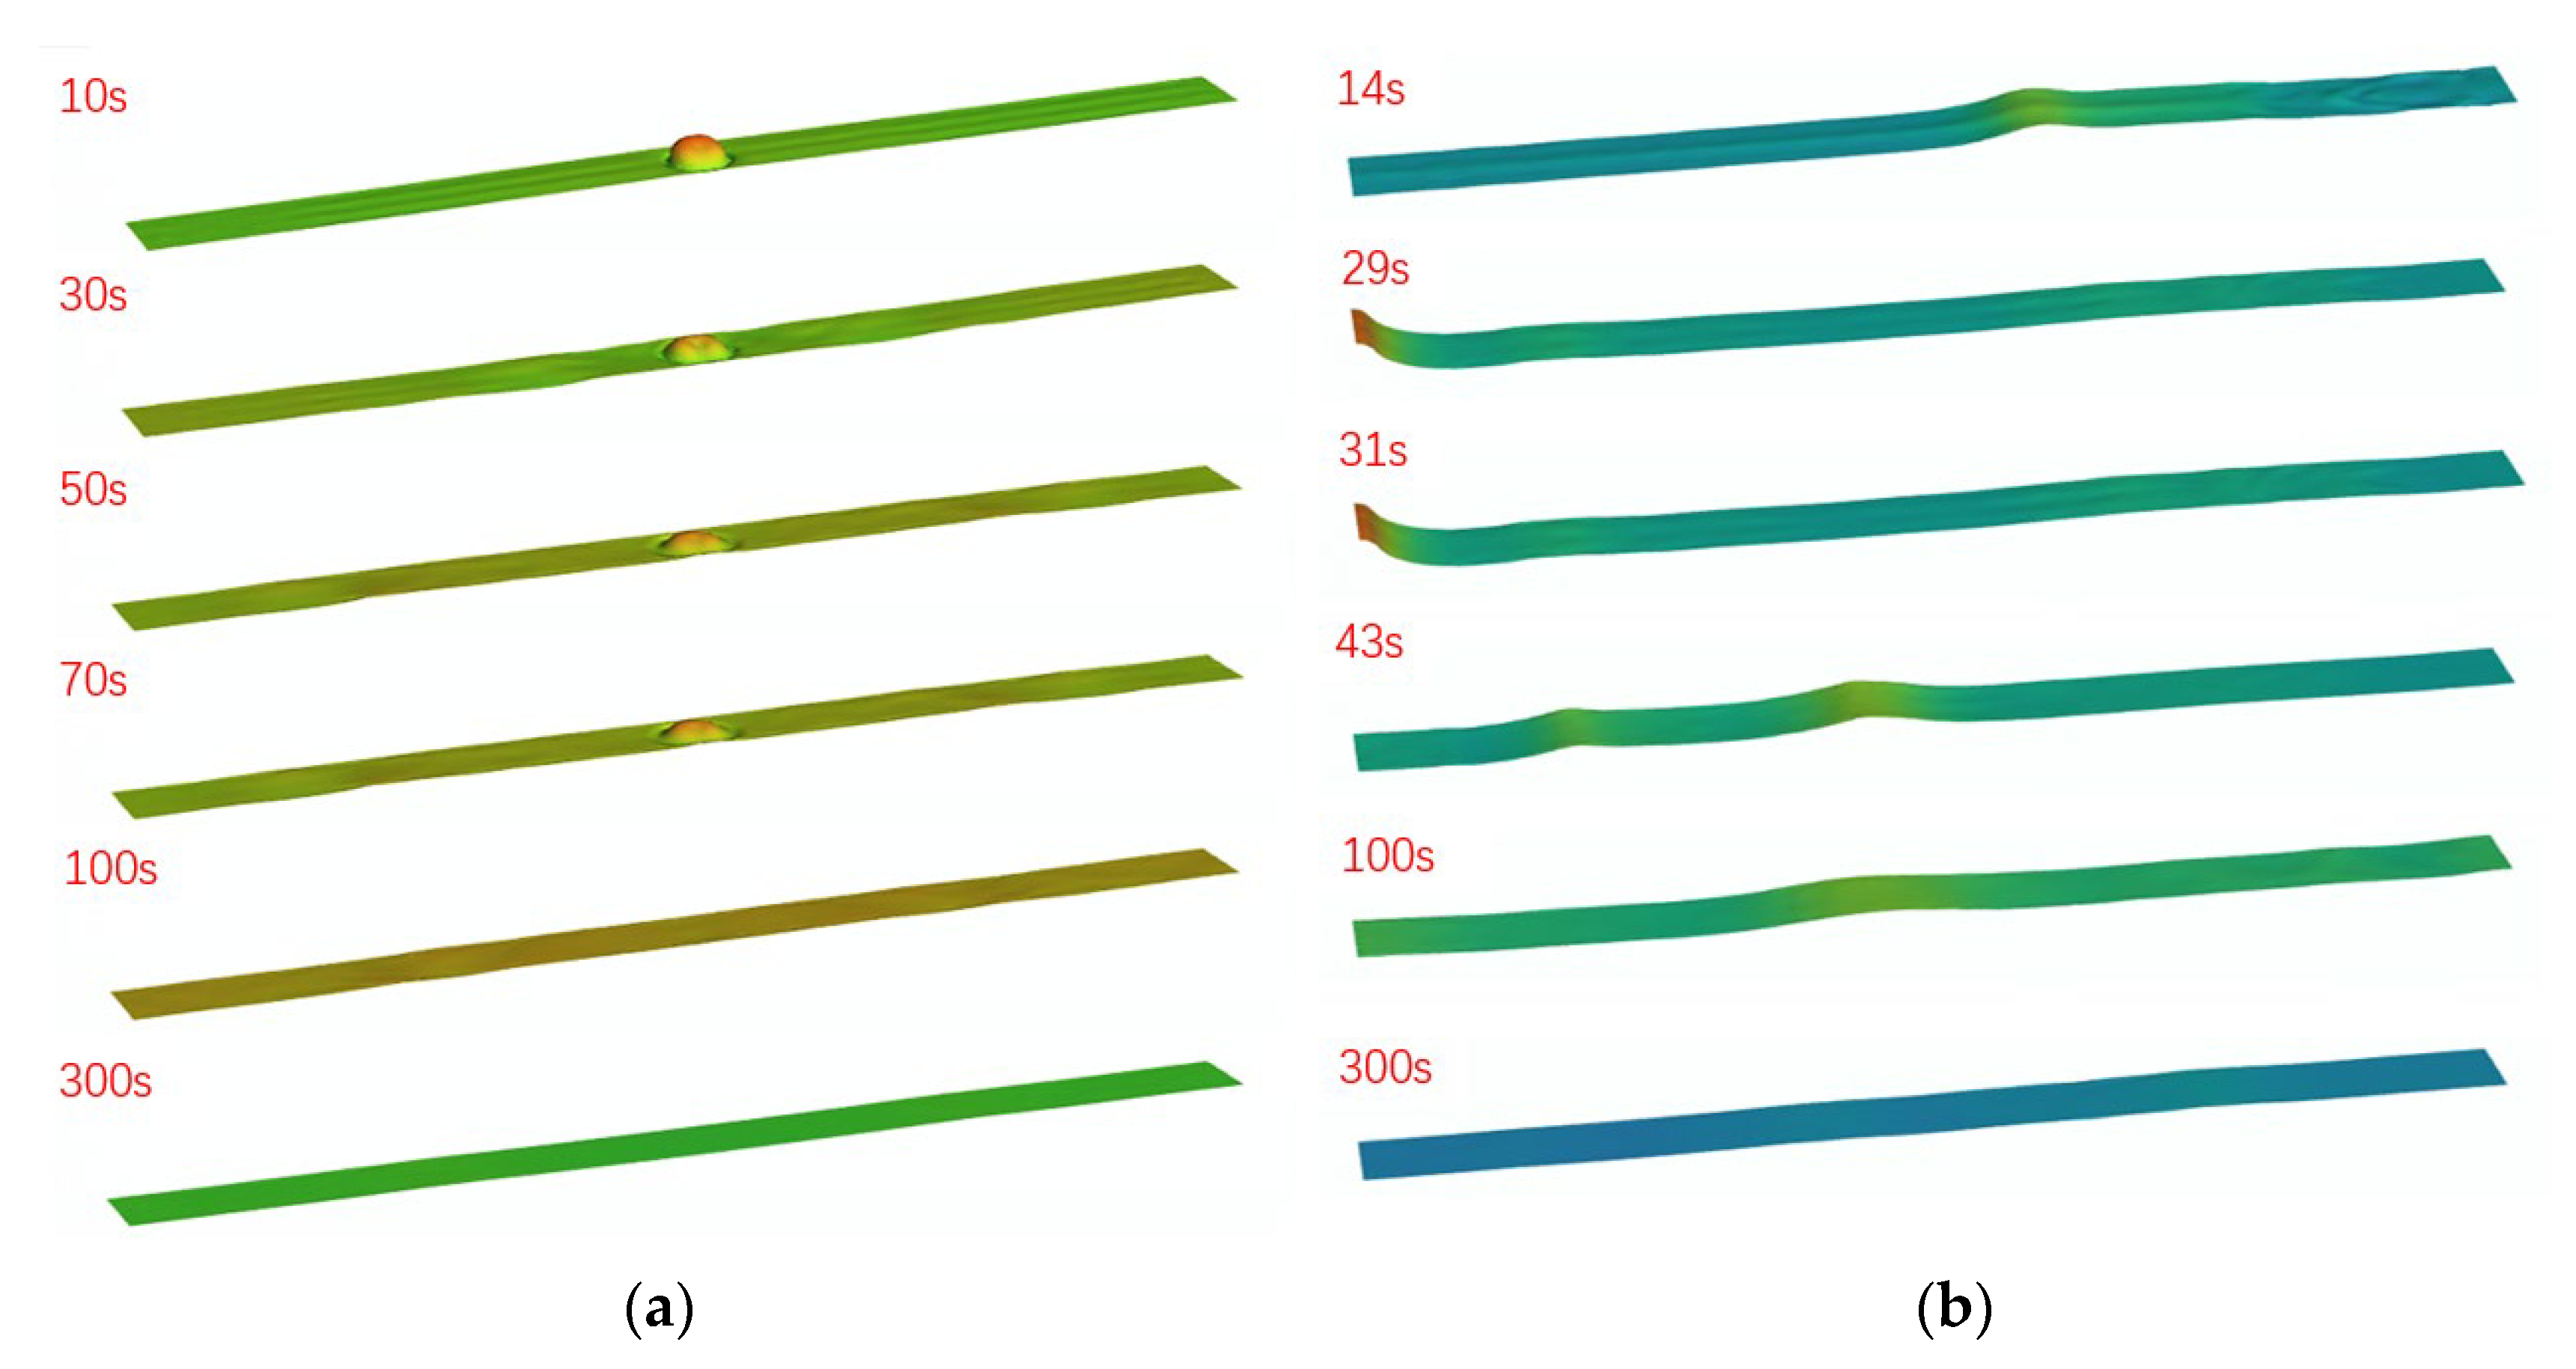
Figure 5 shows the dynamic changes of the gas–water interface in the gas chamber over time. Due to the different structure of the gas chamber, the flow pattern changes in the two models are quite different. For Model 1 (Figure 5a), over time, the overall water level in the air chamber first increases and then decreases, and a “bulge” appears in the middle of the air chamber and gradually disappears. At 10 s, a certain height of gushing occurs at the inlet of the surge chamber, and the resulting surge waves will also spread to both sides. In 30 s, it can be seen that the forward surge wave transmits to both sides, the gushing height drops, and the overall water level rises slowly. In 50 s, a surge wave spreads to the walls at both ends and produces a reverse surge wave, and the gushing height decreases further. In 70 s, the height of the gushing is close to the average water level and the location of the gushing can still be observed from the low water level ring around the gushing. Around 100 s, the pressure curve is at the highest position. At this time, the surge chamber continues to flood, but the water inlet can no longer be observed and only a slight surge wave is transmitted at the liquid level. At around 300 s, the pressure curve is at its lowest value. At this time, the surge chamber drains outwardly, but the position of water outlet cannot be distinguished and the surge wave basically disappears. For Model 2 (Figure 5b), over time, the overall liquid level of the gas chamber also increases and then decreases, and the liquid level peak starts from the right side of the gas chamber and propagates back and forth between the two walls until it disappears. Water first enters from the right side of the air chamber and a surge wave is generated from the entrance and transmitted to the left (Figure 5a—14 s~31 s). The surge bounces back after touching the left wall of the air chamber and transmits to the right (Figure 5a 43 s). The liquid level in the air chamber is in a state of constant fluctuation, and the middle of the surge wave is slightly higher than that on both sides. The overall height of the air room increases; at 100 s, the liquid level of the gas chamber tends to be stable but, compared with the liquid level at the same time in Model 1, the surge wave is still more obvious at this time. At 300 s, the average water level was close to the lowest value and the liquid level in the gas chamber was stable.
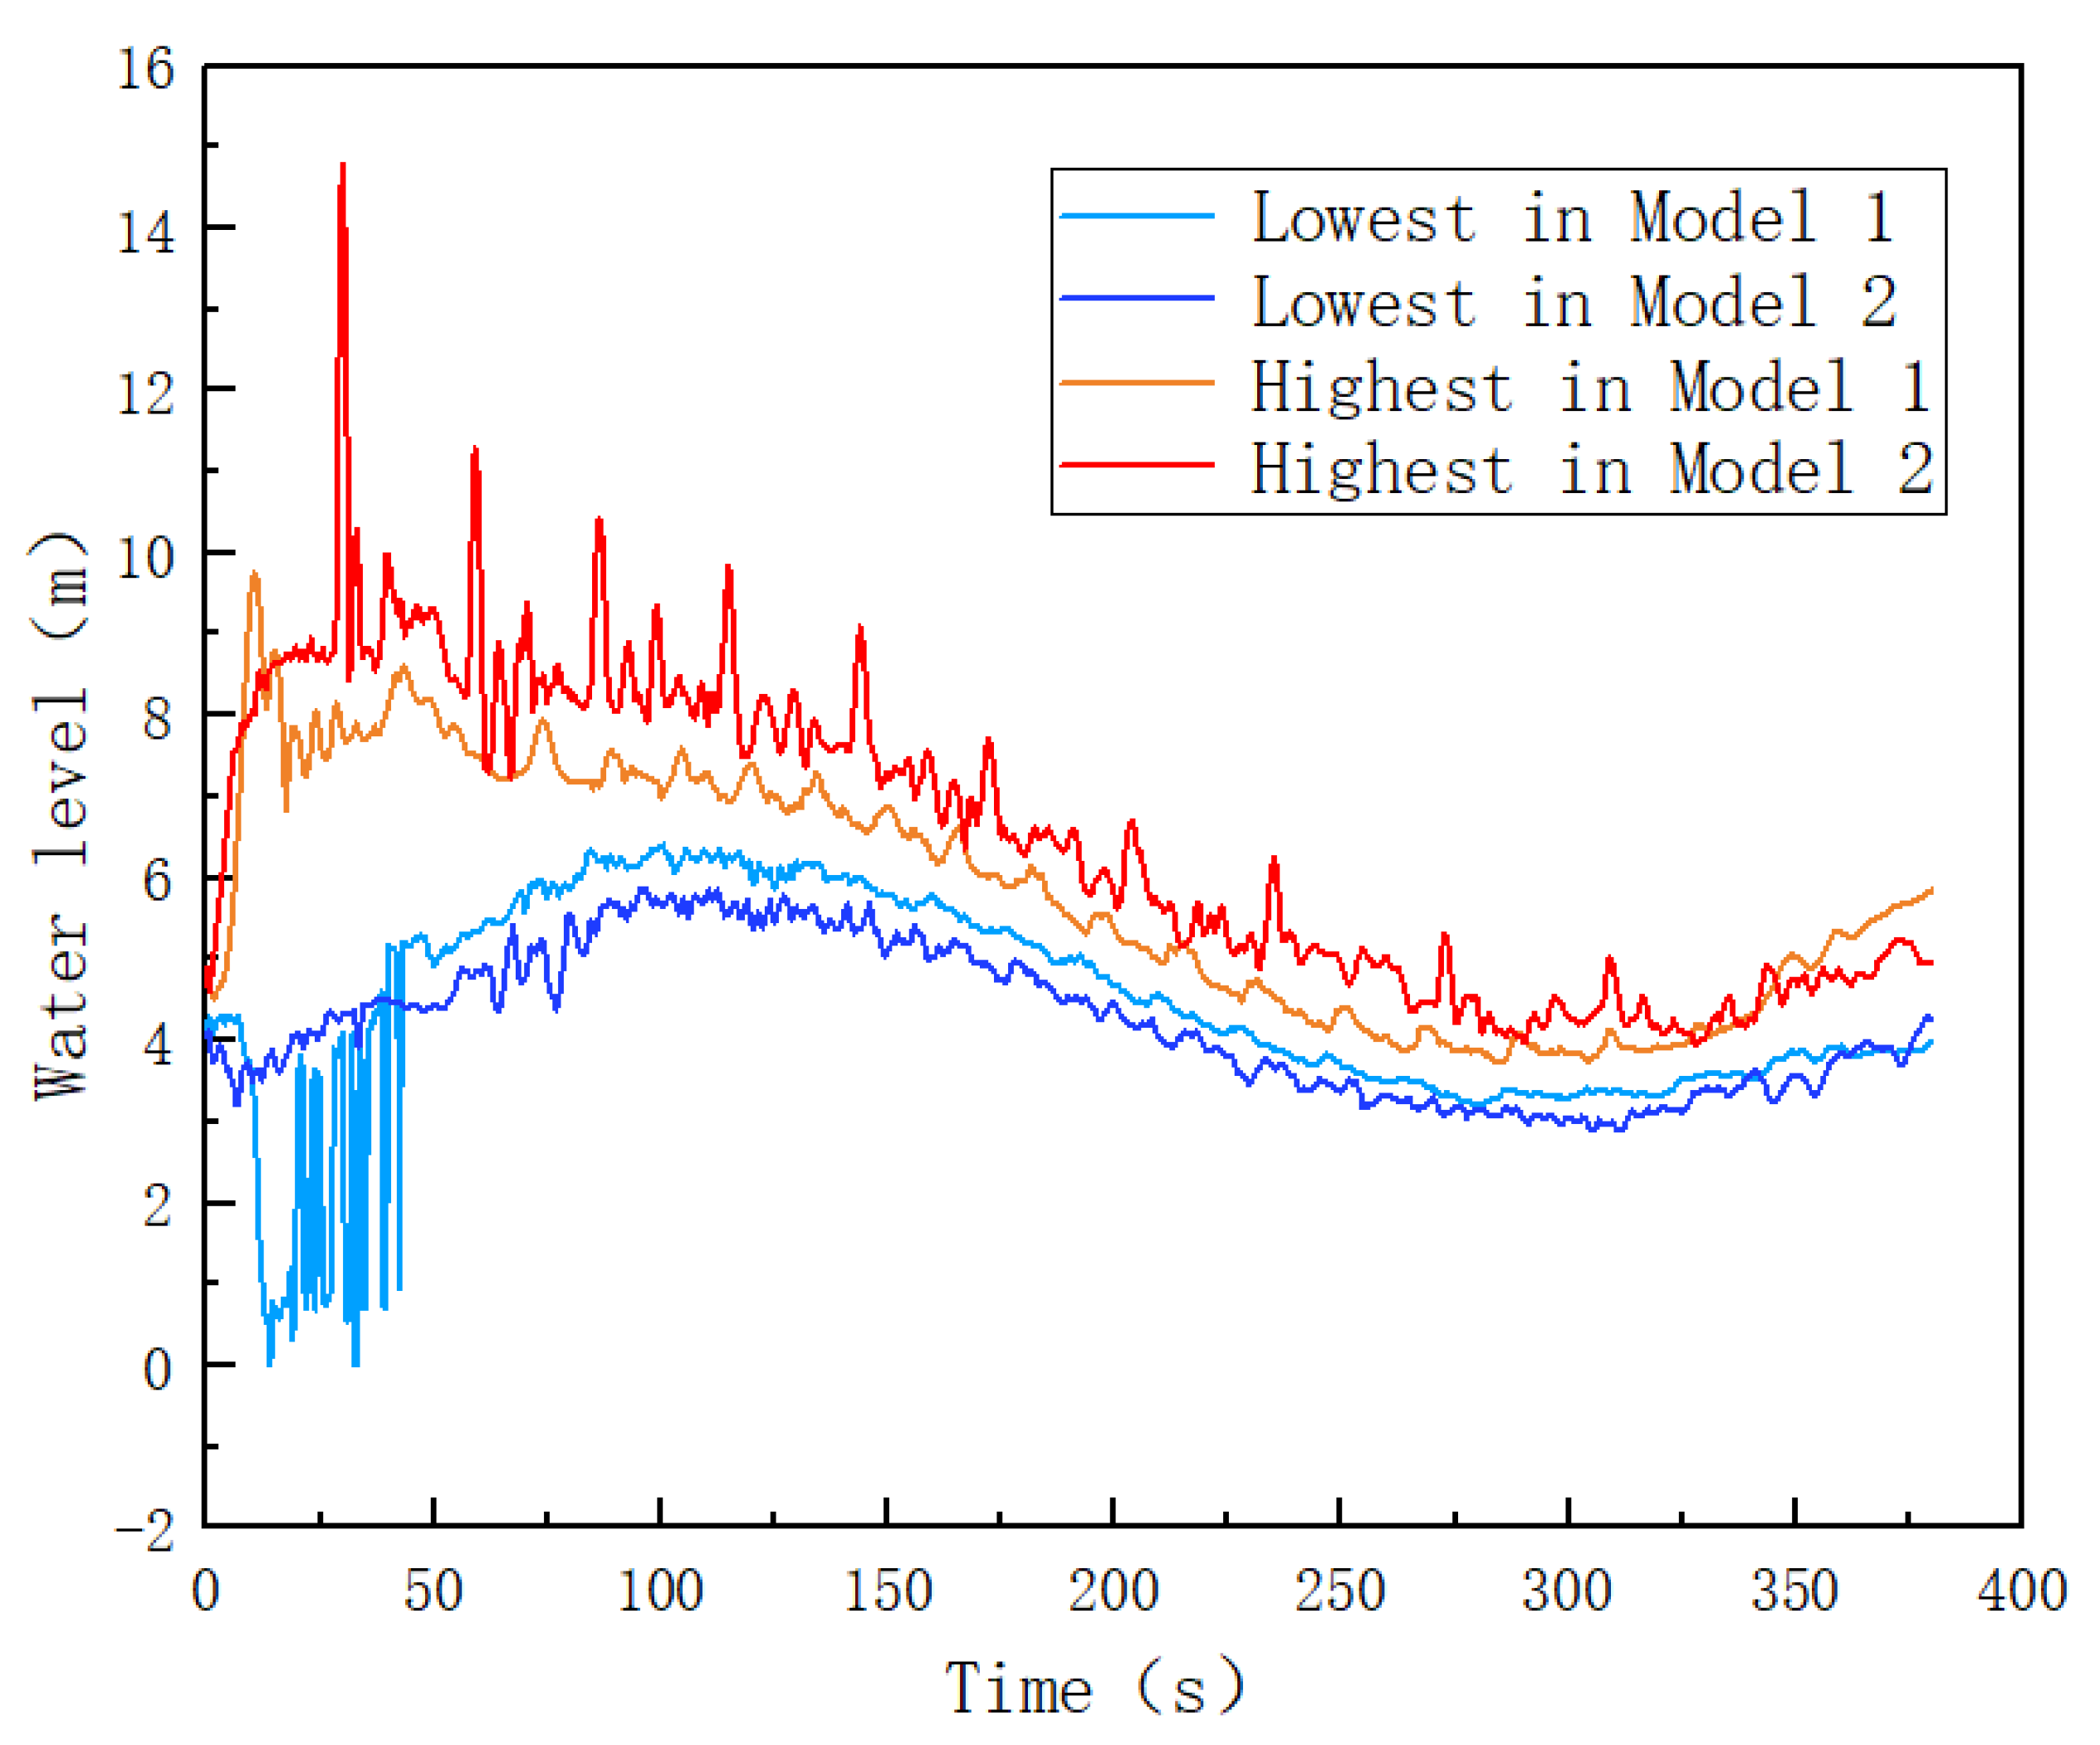
Figure 6 shows the monitoring curve of the highest and lowest water levels of the model liquid level. It can be seen from the figure that, within 0~75 s, the inlet of the connecting pipe will produce gushing above the water surface, and the maximum gushing height is about 9.755 m. Water carried aloft by the gusher will free fall, falling into the water and carrying large amounts of broken air below the water surface. As the statistical water level in the VOF method is judged by the coordinates of the gas–liquid phase interface, when a large number of bubbles are involved in the water bottom, the lowest coordinate value of the gas–liquid phase interface will be lower than the normal water surface, or even touch the bottom, which is the reason why the liquid level low curve of Model 1 in Figure 6 produces a large number of zero values in 0~75 s. In Model 2, water flow enters from the right side of the air chamber, and the entrance slope angle is relatively stable. Compared with Model 1, the water flow pattern is relatively gentle. There is no zero value in the lowest water level but, under the action of the surging wave, the highest water level is higher (14.776 m) and the highest water level is more volatile. From the overall trend, the water level curves of the two models are basically the same.
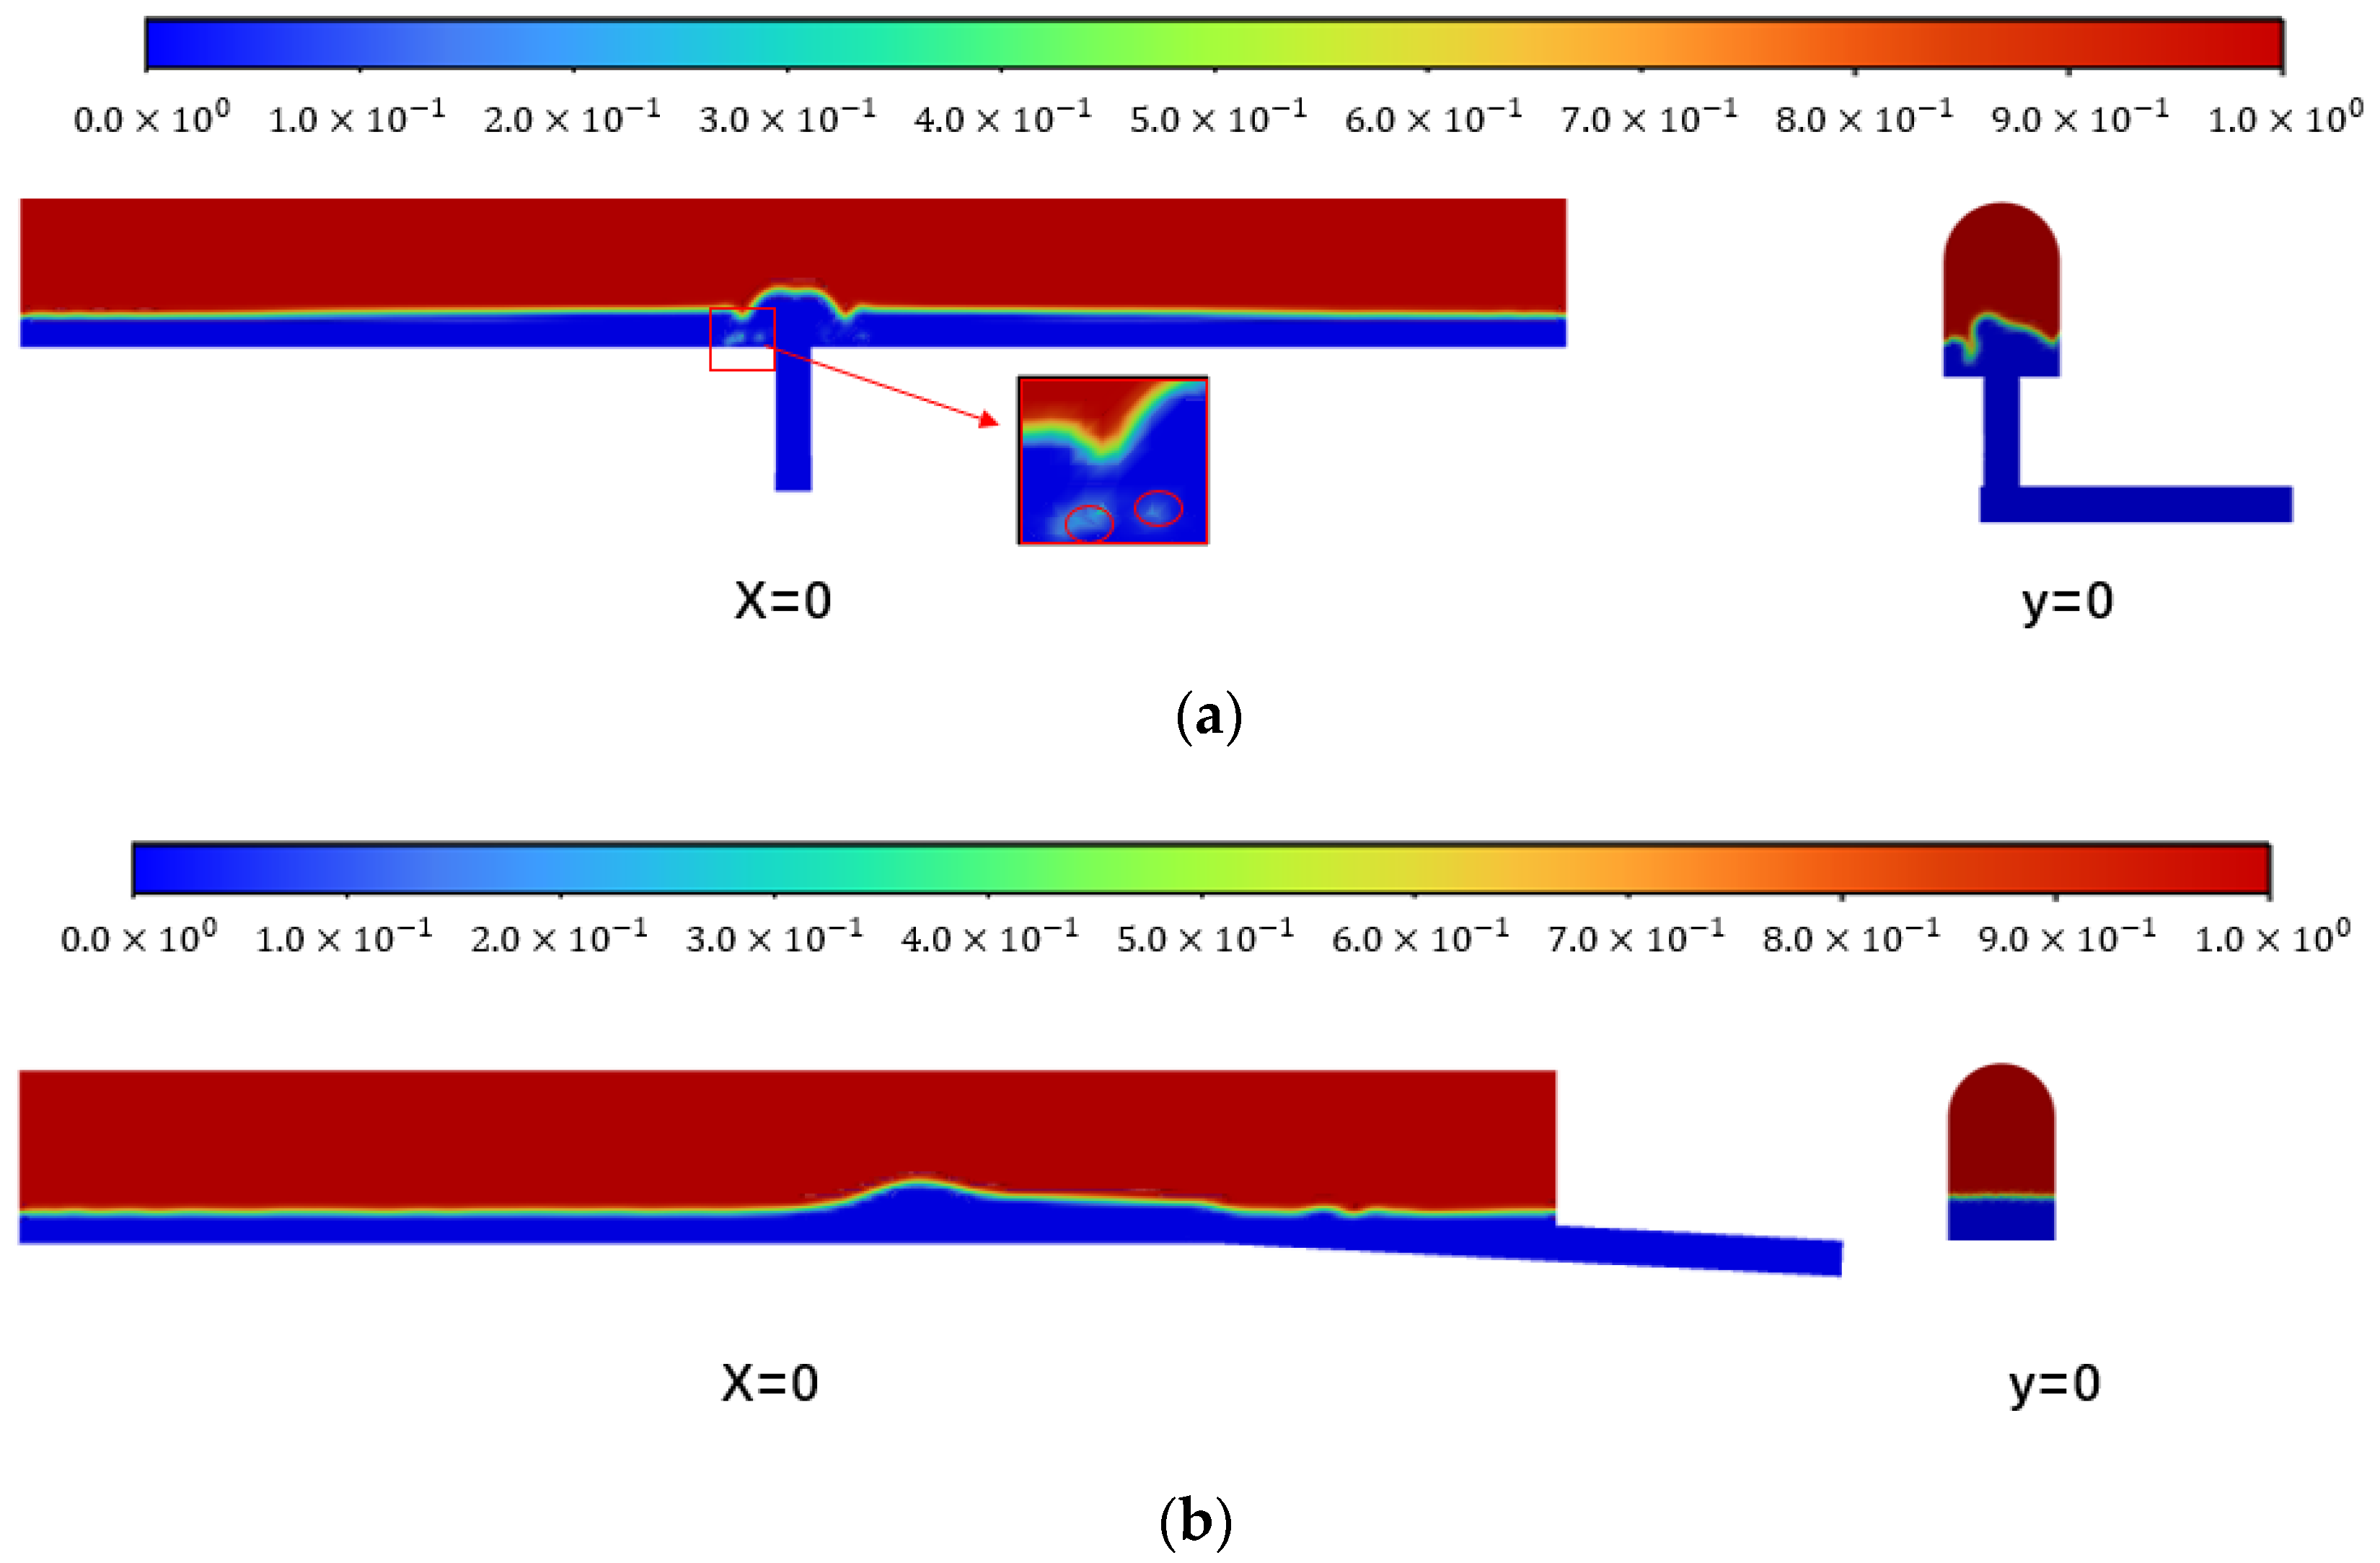
Figure 7 shows the gas–liquid two-phase distribution cloud maps of the two models at 14 s. From Figure 7a (x = 0), the position and shape of the jet can be clearly seen. At the water inlet on both sides of the jet, some gas can be seen being carried below the water surface, and subsequent surges propagate from the middle to the left and right sides, with overall symmetry. Additionally, some gas near the bottom of the water can be found, which also verifies the results of the lowest liquid level distribution in Figure 6. Due to the leftward velocity of the incoming flow, the ejection is skewed to the left (y = 0). Figure 7b (x = 0) shows the gas–liquid interface distribution of Model 2 at 14 s. Water flows into the surge chamber from the right entrance of the tunnel, and the resulting surge waves advance from right to left. The surge wave is transmitted to the left side of the gas chamber and collides with the wall surface. As a result, the mixing degree of gas and water on the left is much greater than that on the right, and a large amount of gas will be rolled into the water surface on the left. In the longitudinal section, the liquid level is slightly convex in the middle but stable overall (y = 0).

3.5. Heat and Mass Transfer in Air Cushion Surge Chamber

Figure 8 shows the changes between the temperature of the air chamber and the liquid surface, where T w . min / T w . ave / T w . max represent the lowest/average/highest temperature of the liquid surface and T a . ave represents the average temperature of the air chamber. In the inlet stage, the local maximum temperature of the water surface in Model 1 reaches 284.65 K. As the water flow in Model 2 is relatively gentle and heat transfer between gases is sufficient, its maximum temperature is slightly lower than that in Model 1 (281.86 K). In the drainage stage, the outflow velocity of the two models is relatively low, and the lowest temperature is about 275 K. During the transition process of one cycle, the average temperature change of the model liquid level is consistent with that of the inlet pressure, and the temperature difference is about 2.4 K. The average temperature curve of the two models is similar, and the change trend is consistent with that of the inlet pressure. In the inlet stage, the average maximum temperature of the air chamber reaches about 293.15 K (about 20 °C). In the drainage stage, the average minimum temperature of the air chamber is lower than 0 °C and reaches about 272 K (about −1 °C).
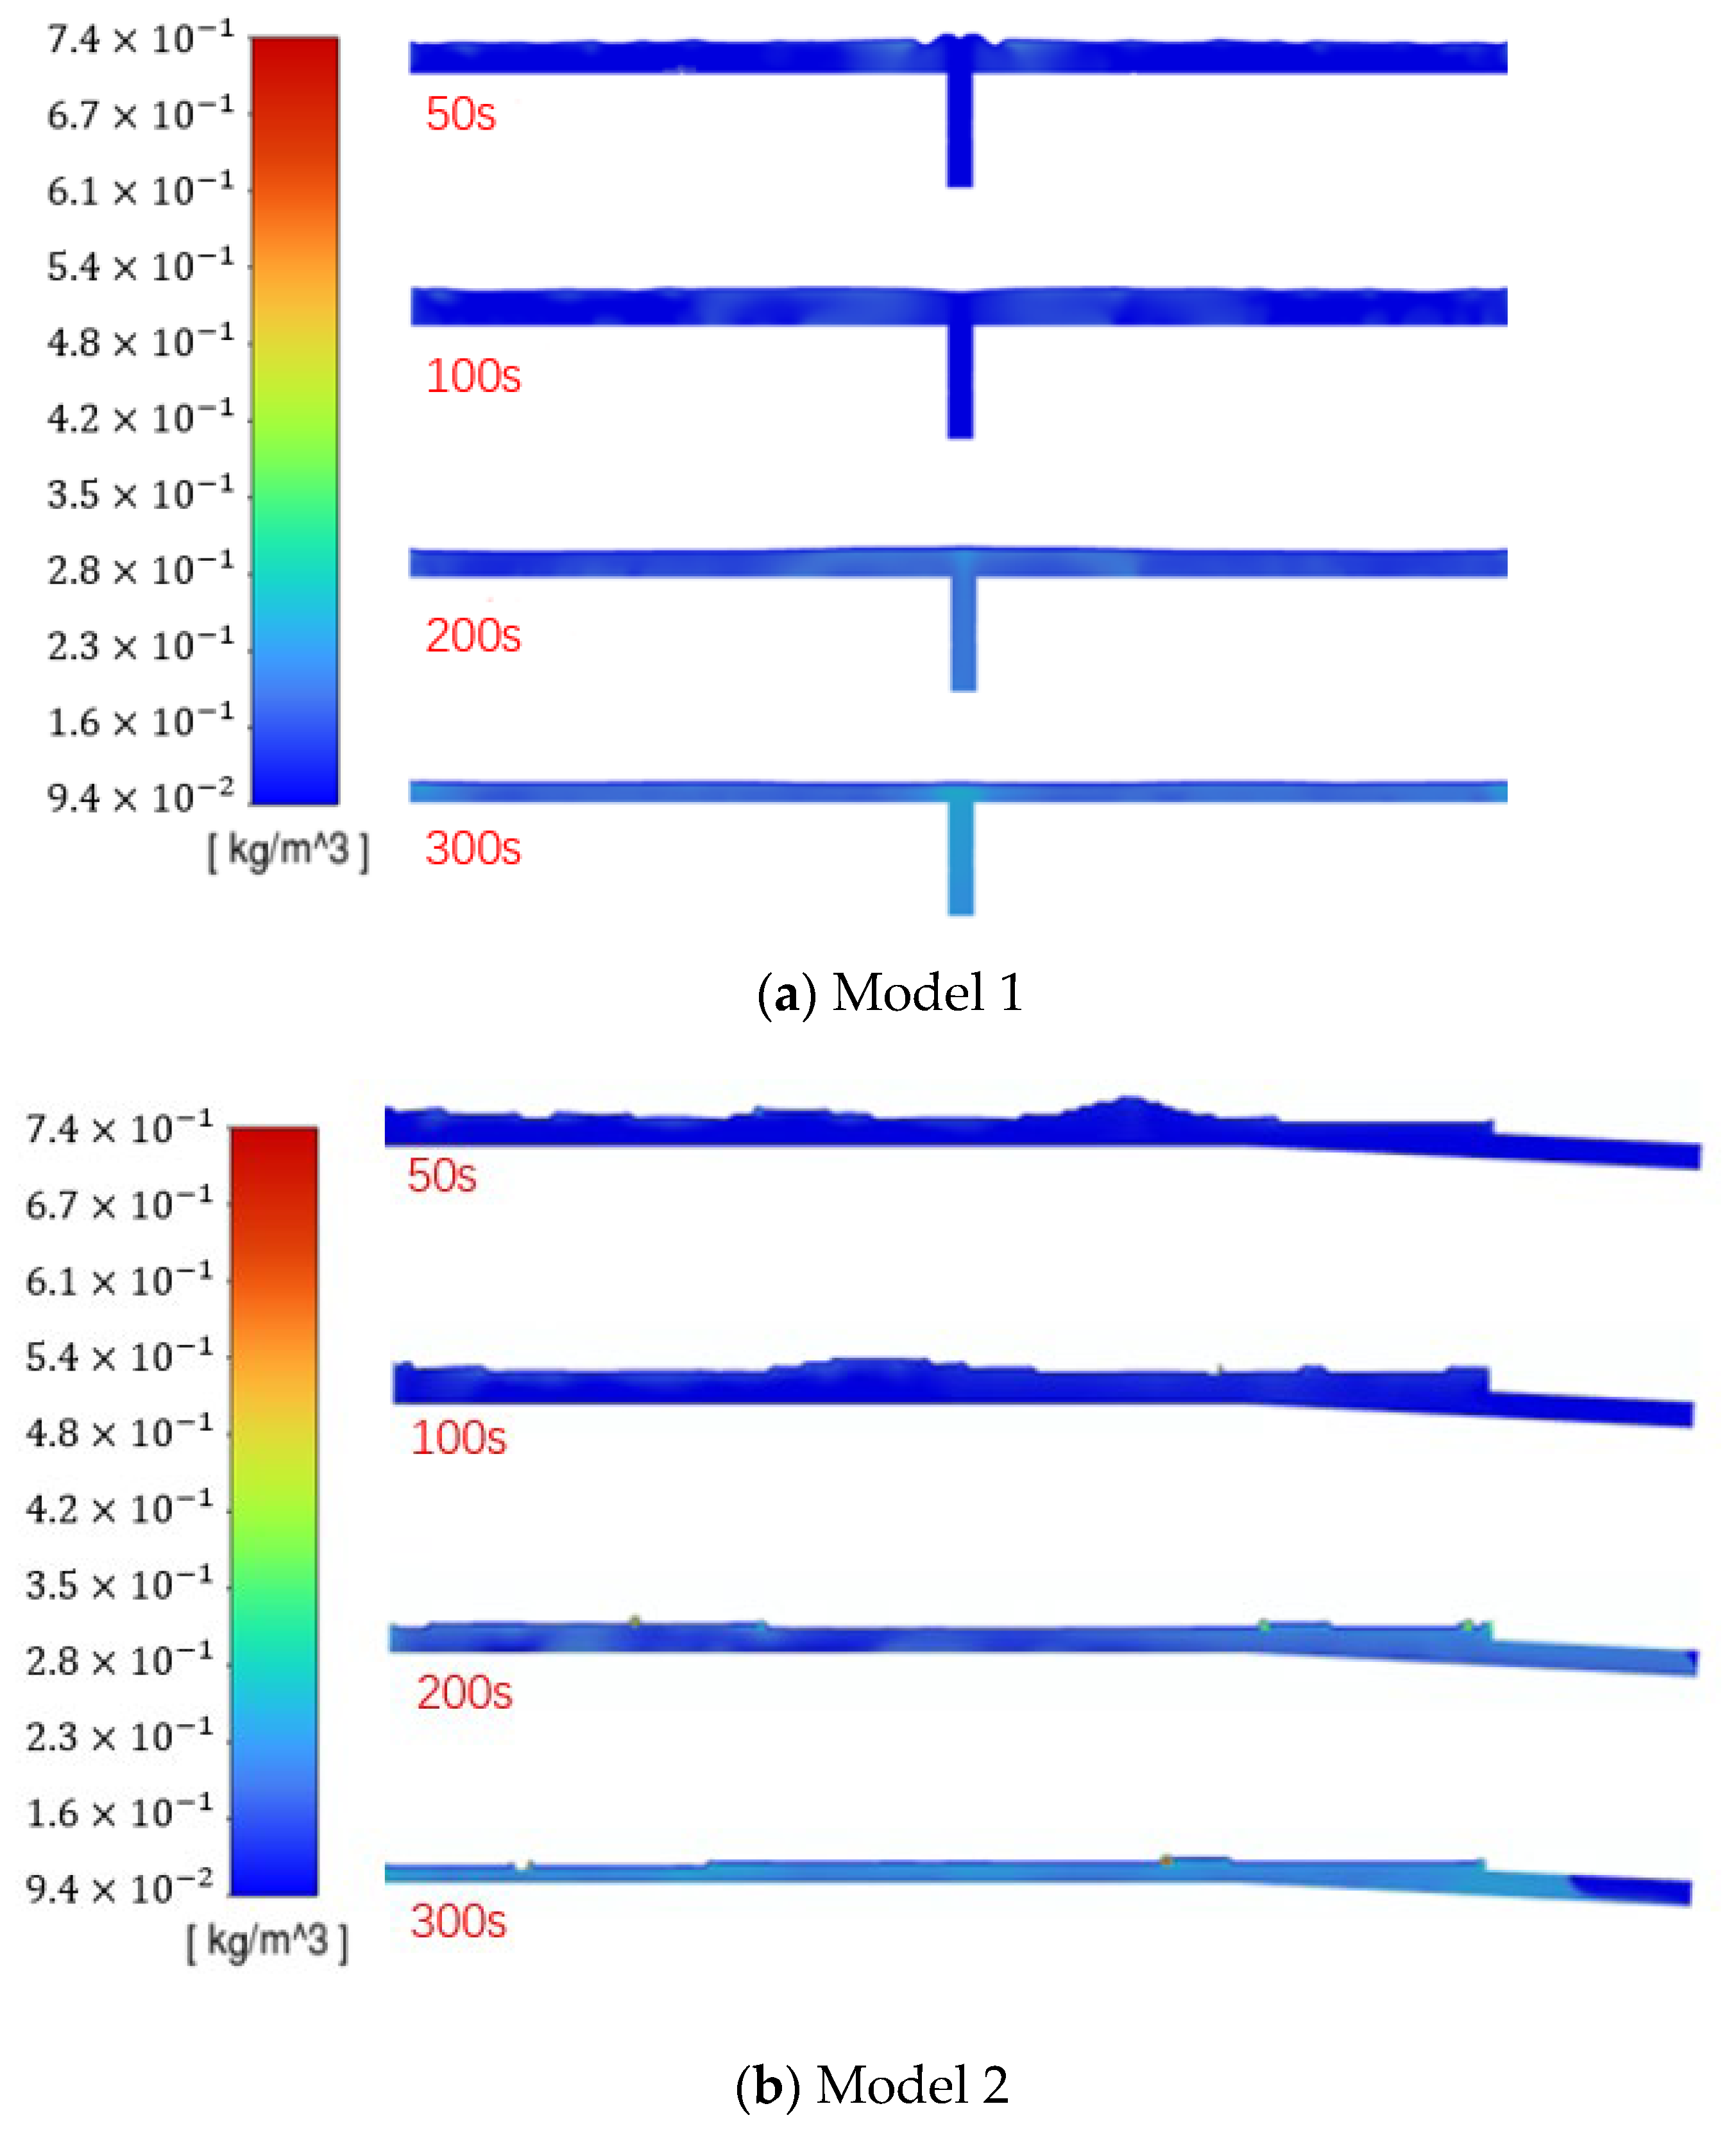
Figure 9 shows the dissolved gas content cloud map of the model water. Over time (50 s~300 s), it can be observed that the gas content in the water is gradually increasing, which is related to the surge wave forming in the pressure regulation room and the turbulence intensity of the interface water body. From the concentration cloud maps of 50 s and 100 s of Model 1, it can be found that, in the water inlet stage, the water body with high gas content moves to the left and right ends along with the movement of swell waves. The cloud images of 200 s and 300 s show the positions of high gas content water in the gas chamber at the drainage stage, and a large amount of high gas content water flows out of the surge chamber along the connecting tunnel and into the transmission pipe. In Model 2, the change in moisture content is similar to that in Model 1; the gas content in the water also increases over time. A large amount of high gas content water enters the water delivery system from the pipeline connected to the right side of the surge chamber.
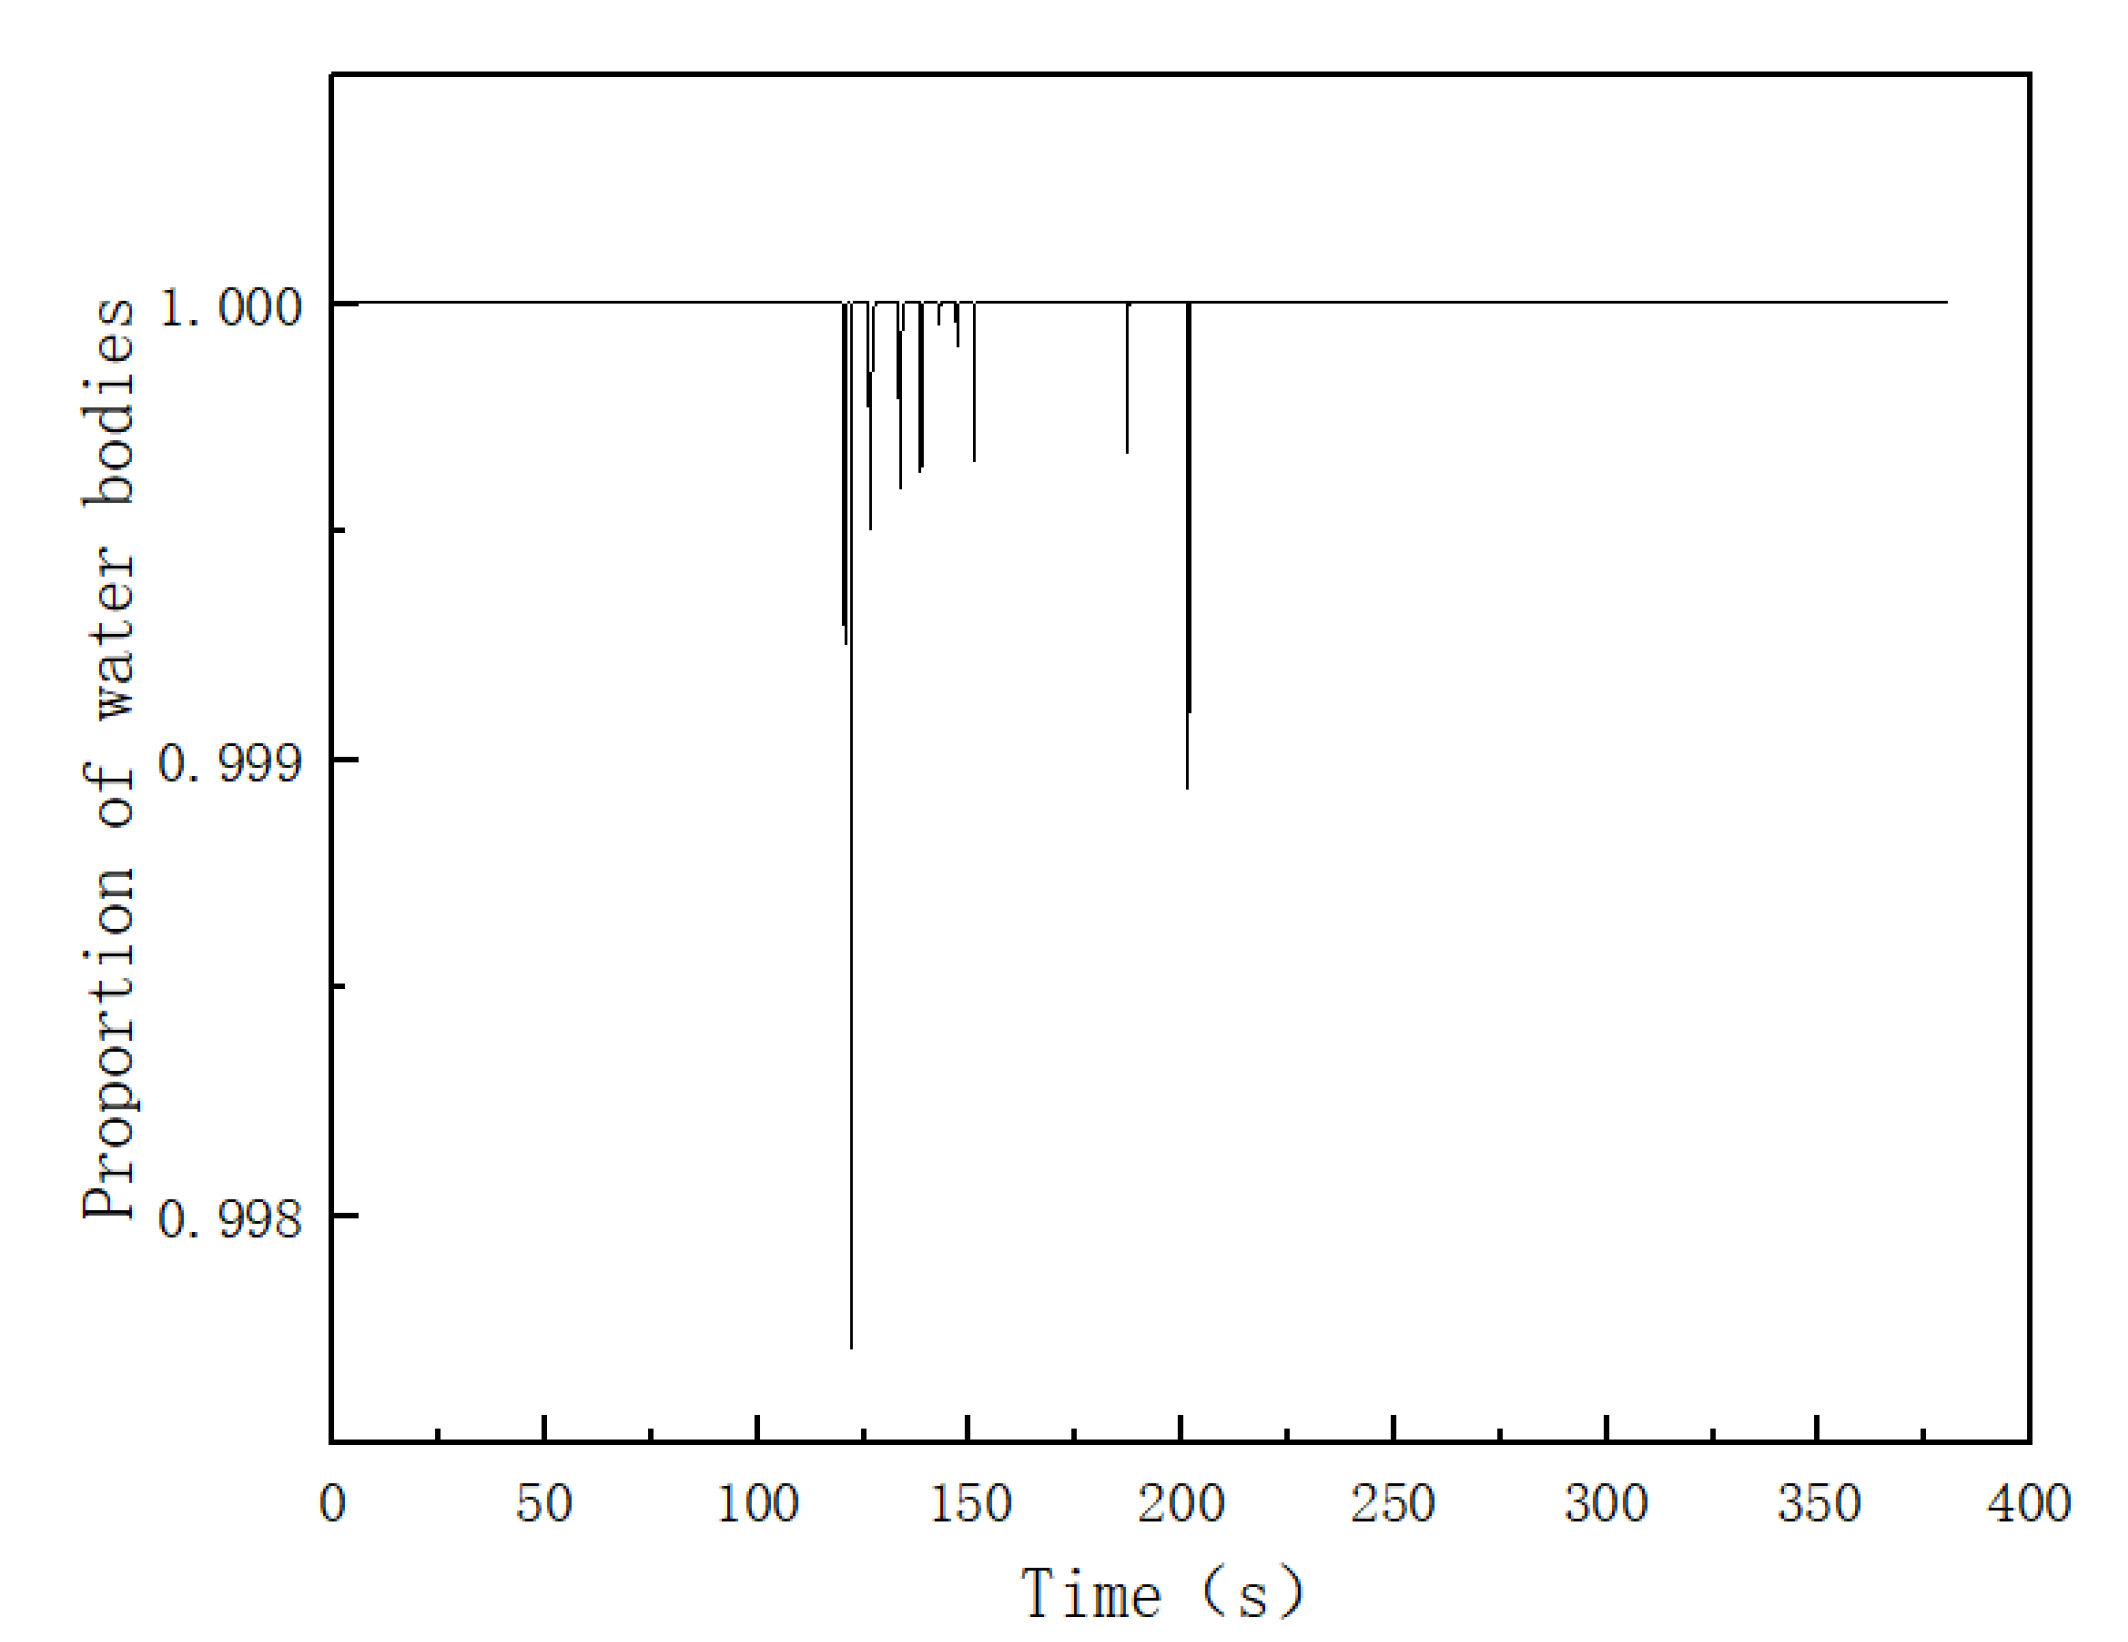
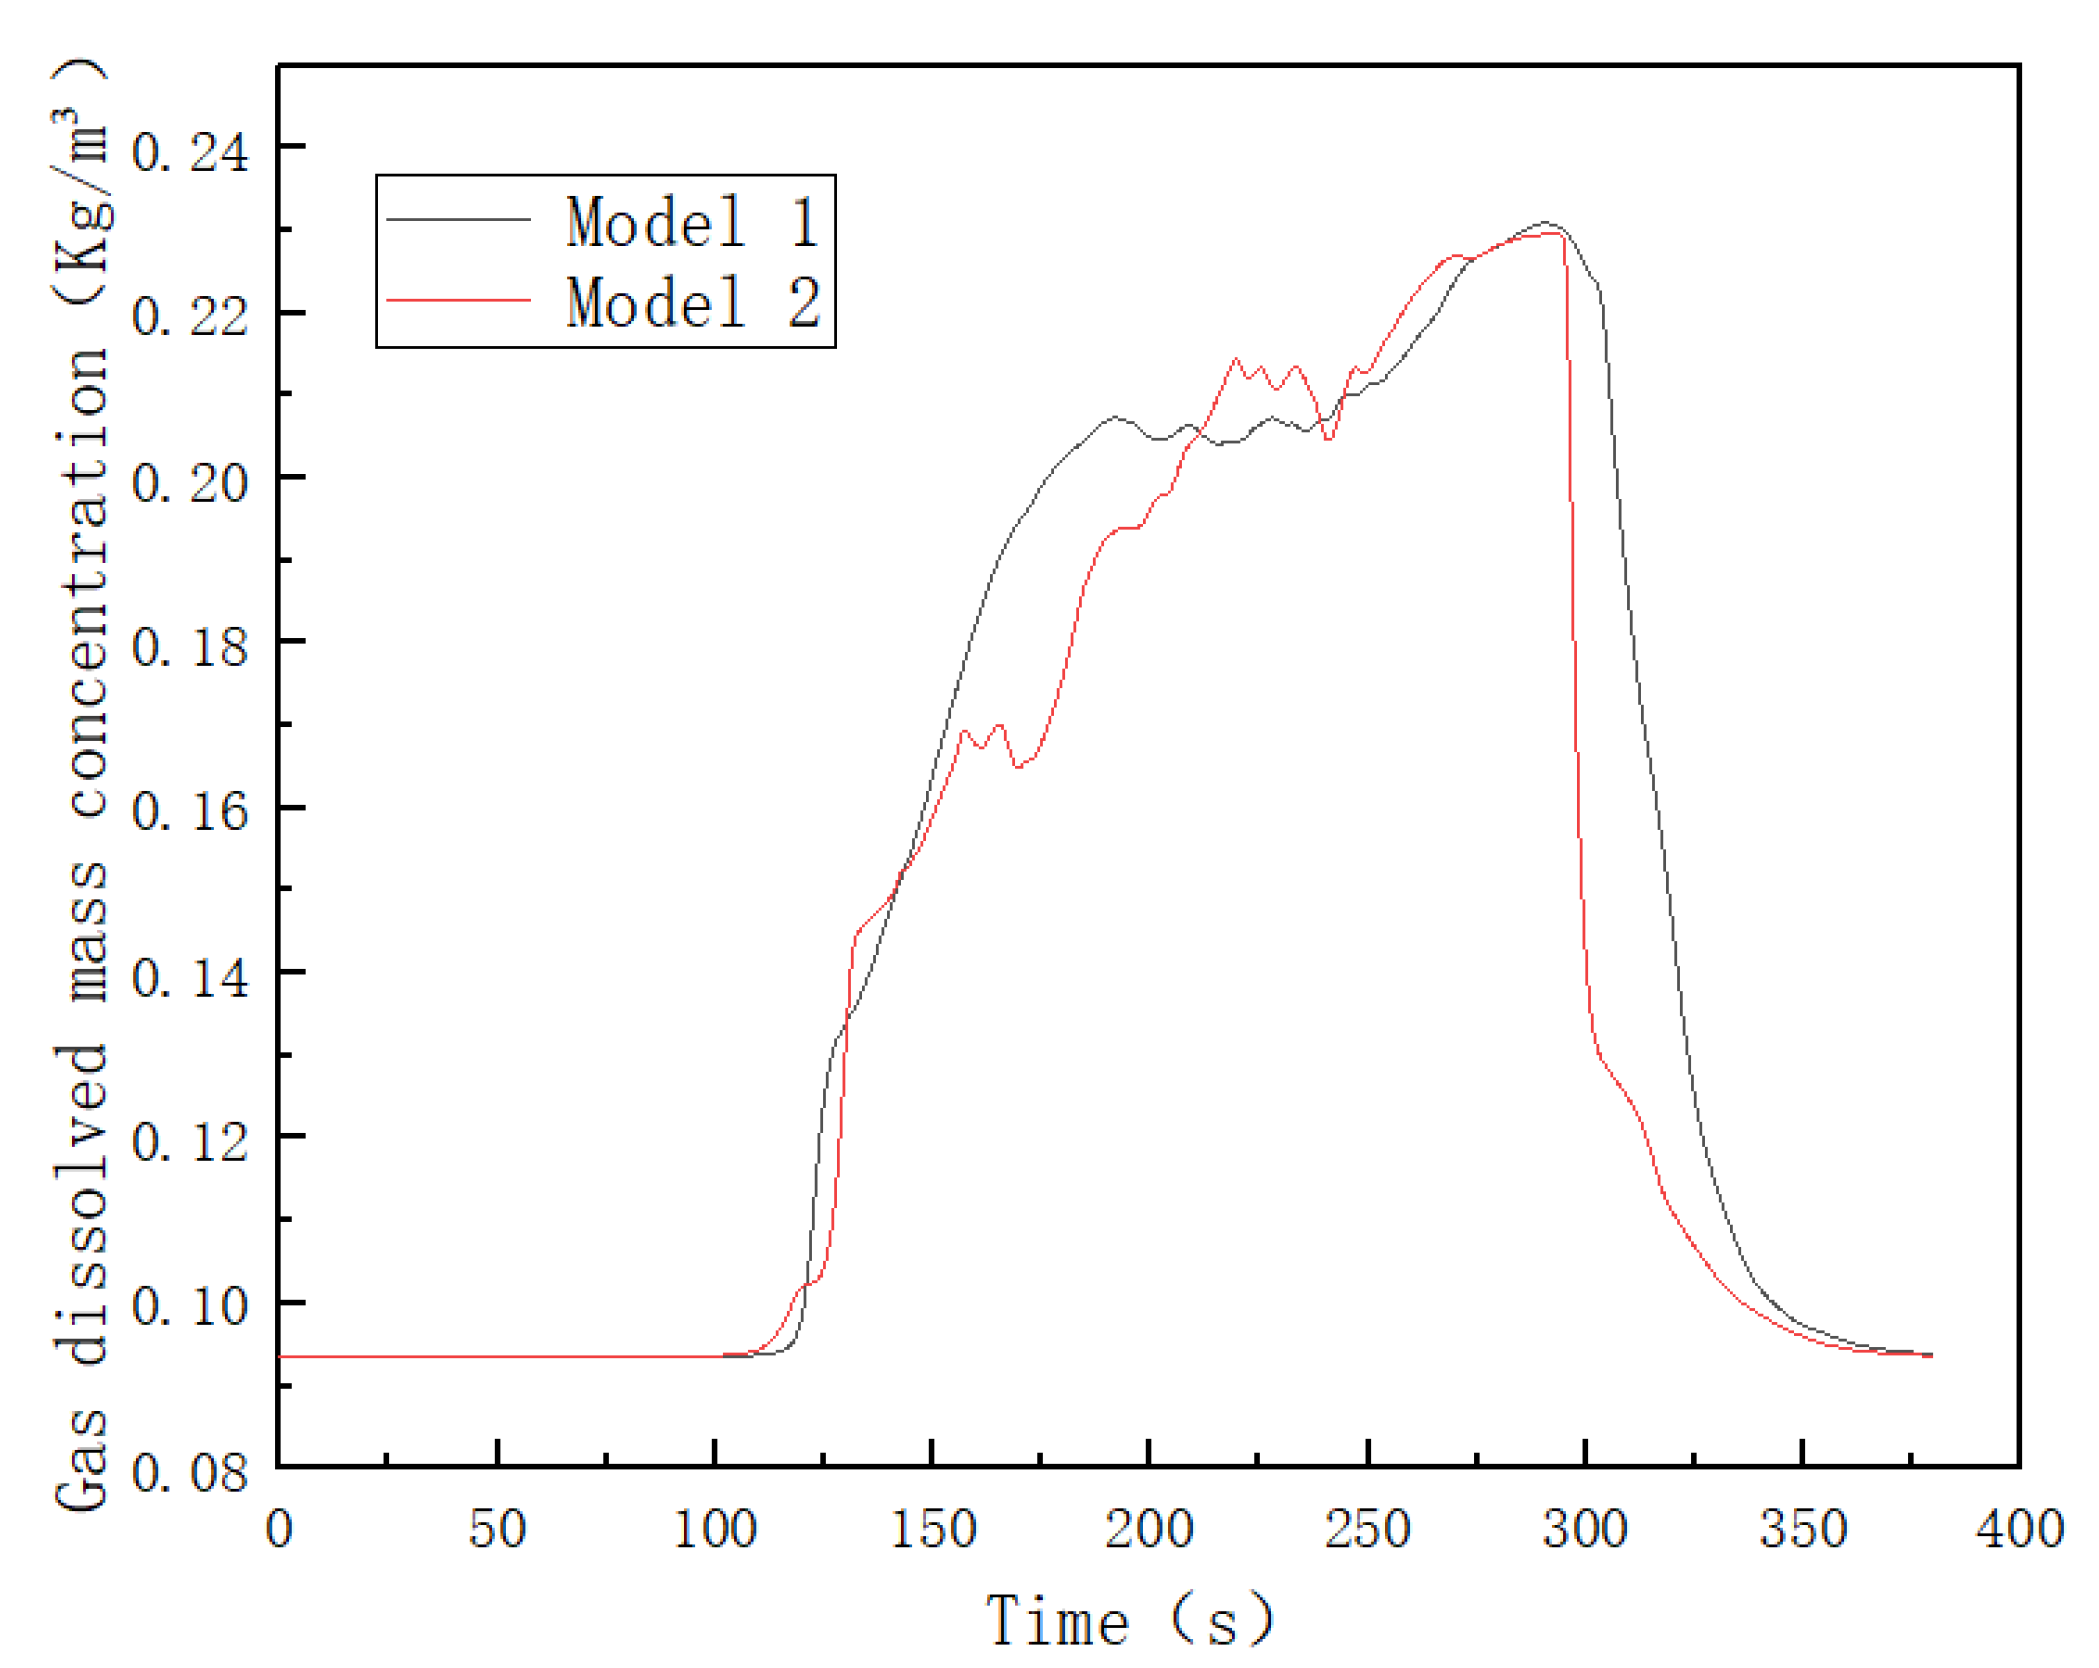
A large amount of gas enters the water delivery system in the form of bubble escape or dissolves into the water body. In order to quantitatively monitor the gas loss, the section at the entrance of the connecting pipe is taken as the monitoring section. The air mass escape can be monitored through the proportion of gas and liquid in the section (Figure 10), and the change of the gas dissolution mass concentration in the section can be monitored as well (Figure 11).
Figure 10 shows the escape of air mass, which intermittently passes through the monitoring section and is mainly concentrated in the early stage of water discharge. By integrating this part of the gas, it can be concluded that the air mass escape in the cushion surge chamber is 33.93 kg, and the corresponding gas volume under standard atmospheric pressure is 28.75 m3. However, in Model 2, due to relatively slow water fluctuation, the air mass dissolved into the water before escaping from the air cushion surge chamber, and no air mass escape was detected at the entrance section. Figure 11 shows the variation of gas dissolution mass concentration in water at the monitoring section. When the effluent flows through the monitoring section, it can be seen that the gas dissolution volume increases significantly. According to the difference of gas dissolution amount in and out of water flow, it can be calculated that 1090.35 kg (923.89 m3) gas is dissolved into water and into the water supply pipe in Model 1, while 1008.08 kg (854.18 m3) gas is dissolved into water and into the water supply pipe in Model 2.
There are differences in water flow fluctuation forms in pressure regulating rooms with different structures. Surge waves and water crushing and falling easily bring air mass into the water, which directly leads to air mass mixing and gas dissolution in the water significantly increasing, and then into the water delivery system. In addition, in the process of large fluctuations, the gas side of the gas–liquid interface appears in a transient condition below zero, which should be further considered if it is in a region of high cold and altitude. The above conclusions provide a theoretical reference for the design of a high pressure surge chamber.

4. Conclusions

A model of water and gas two-phase flow was established through two different types of air cushion surge chambers to simulate the working conditions. The following was found:
  • A large amount of gas will be rolled into the water in the process of hydraulic fluctuation. There will be gathered air mass, mass transfer through the formation of high gas content water, and the main gas–liquid mass transfer process generally occurs in the turbulent area.
  • The gas solubility decreases with the water depth, and the gas diffusion depth is limited in the steady state. But in the transition process, some air masses and a large amount of high gas content water enter the pipeline through the water outlet.
  • In this paper, a gas loss model in an air cushion surge chamber was established. In a set period of a transition process, the gas escape amount in the form of air mass is 33.93 kg in Model 1, and the corresponding gas volume under standard atmospheric pressure is 28.75 m3. The dissolved air volume of the model is 1090.35 kg (923.89 m3).
  • Considering different structures of air cushion surge chambers, Model 2 (water inlet on the right side of the air chamber) did not detect any air mass escaping, and the dissolved gas volume was 1008.08 kg (854.18 m 3). There was a lower gas loss volume compared to Model 1(water inlet in the middle of the air chamber).
The quantitative expression of dissolved gas loss in an air cushion regulator has guiding significance for the optimization of air replenishment measures in air cushion surge chambers. It lays a foundation for further research on the influence mechanism of water–gas miscibility in the transition process under high pressure and the influence of water entering the hydraulic mechanical system on the hydraulic unit. To further control the gas loss in the air cushion surge chamber, we will explore the influencing factors of air loss from various aspects, such as different pressure levels, different transition conditions, or different chamber design forms.

Author Contributions

Conceptualization, Y.X.; Methodology, P.W.; Investigation, P.D.; Formal analysis, Y.L.; Data curation, B.T.; Writing—original draft, X.L.; Project administration, Y.X. and L.Z.; Writing—review & editing, D.L. All authors have read and agreed to the published version of the manuscript.

Funding

This research received no external funding.

Data Availability Statement

Due to the confidential nature of the research data, the relevant data is not publicly available.

Conflicts of Interest

The authors declare no conflict of interest.

Nomenclatures

α w the volume fraction of water phase k e f f the effective heat conduction coefficient
α a the volume fraction of gas phase h j , q the enthalpy of gas in water phase
m a w the mass of material transfer from gas to water phase J j , w the diffusion flux of gas in water phase
m w a the mass of material transfer from water to gas phase D A B the diffusion coefficient of solute A in solvent B
u i the velocity components in x, y, z and three directions ε the turbulent kinetic energy dissipation rate
x i the coordinate components in x, y, z and three directions μ L the dynamic viscosity of the liquid phase
ρ the average density of each cell a the specific surface area of the gas-liquid boundary
g i the gravitational volume force in the direction of i M B the molar mass of solvent B
τ i j the stress tensor V A the molecular volume of solute A at the normal boiling point
p the static pressure strength C S the saturation solubility in water
c p the isobaric specific heat C the corresponding solubility in water at time t

References

  1. Yu, X. Air cushion surge chamber of underground hydropower station. Northeast. Water Resour. Hydropower 1990, 4, 40–47. [Google Scholar]
  2. Jin, J. Air cushion surge chamber for underground hydropower stations in Norway. Sichuan Water Power 1991, 1, 43–47. [Google Scholar]
  3. Godard, D.C.; Gerhott, H.; Turkel, T.; Bloch, E. Air cushion surge chamber for underground hydropower stations. Hydropower Stn. Des. 1990, 2, 74–78. [Google Scholar]
  4. Liu, D.; Zhang, J.; Suo, L. Research progress on air cushion surge chamber. Hydroelectr. Energy Sci. 2000, 4, 1–5. [Google Scholar]
  5. Zhan, J.; Suo, L.; Zheng, Y.; Liu, D. Research on the dynamic characteristics of gas in air cushion pressure regulating room. J. Hydroelectr. Eng. 2004, 4, 97–101. [Google Scholar]
  6. Wu, J. Research on cavitation and erosion problems in water conservancy and hydropower engineering. In Proceedings of the 18th National Symposium on Hydrodynamics, Beijing, China, 23–27 June 2004; p. 18. [Google Scholar]
  7. Xia, L.-S.; Cheng, Y.-G.; Zhou, D.-Q. 3-D simulation of transient flow patterns in a corridor-shaped air-cushion surge chamber based on computational fluid dynamics. J. Hydrodyn. 2013, 25, 249–257. [Google Scholar] [CrossRef]
  8. Deng, S.; Zhang, J.; Cheng, Y.; Wu, D. CFD analysis of flow pattern in a long corridor surge chamber and research on measures to eliminate suction vortices. J. Hydroelectr. Eng. 2009, 28, 130–136, 142. [Google Scholar]
  9. Ding, N.; Cai, F.; Gu, J.; Zhang, W. Research on the influence of upper chamber shape on surge tank surge wave based on 3D VOF method. J. Three Gorges Univ. 2017, 39, 7–10. [Google Scholar]
  10. Cai, F.; Cheng, Y.-G.; Xia, L.-S.; Jiang, Y. Mechanism of air-trapped vertical vortices in long-corridor-shaped surge tank of hydropower station and their elimination. J. Hydrodyn. 2017, 29, 845–853. [Google Scholar] [CrossRef]
  11. Xu, W.; Wang, W.; Tan, L.; Yang, Y. Numerical simulation of water air two-phase flow in hydraulic engineering. Res. Prog. Hydrodyn. Part A 2001, 2, 225–229. [Google Scholar]
  12. Li, Z. Numerical Simulation Study on Free Water Surface and Aeration in Hydraulic Engineering; Xi’an University of Technology: Xi’an, China, 2004. [Google Scholar]
  13. Hohermuth, B.; Schmocker, L.; Boes, R.M.; Vetsch, D.F. Numerical simulation of air entrainment in uniform chute flow. J. Hydraul. Res. 2020, 59, 378–391. [Google Scholar] [CrossRef]
  14. Liu, D.; Zhou, L.; Suo, L.; Wang, F. Simulation analysis of VOF model for the phenomenon of water flow impacting trapped air masses in pipelines. J. Comput. Mech. 2009, 26, 390–394. [Google Scholar]
  15. Ma, J.; Zhou, L.; Liu, D.; Wang, H.; Pan, T. Verification of CFD simulation method for impacting and detaining air masses in pipe water flow. Hydroelectr. Energy Sci. 2016, 34, 110–113. [Google Scholar]
  16. Lu, K.; Zhou, L.; Liu, J. Three dimensional numerical simulation of water flow impacting multiple trapped air masses. J. Drain. Irrig. Mach. Eng. 2021, 39, 264–269. [Google Scholar]
  17. Cheng, X.; Chen, Y.; Gao, Q.; Chen, Y. Analysis of supersaturated reaeration of three gorges reservoir dam body discharge. J. Hydroelectr. Eng. 2005, 6, 62–67. [Google Scholar]
  18. Cheng, X.; Chen, Y.; Chen, X. Numerical simulation of dissolved oxygen concentration in downstream water bodies of the Three Gorges Dam body discharge. Res. Prog. Hydrodyn. Part A 2009, 24, 761–767. [Google Scholar]
  19. Liu, M.; Hou, F.; Yan, K.; Ben, Y.; Wang, H.; Li, C. Research on high pressure dissolved gas problem in damless pumped storage system. J. Eng. Thermophys. 2020, 41, 609–614. [Google Scholar]
  20. Wei, W.-R.; Deng, J.; Zhang, F.-X.; Tian, Z. A numerical model for air concentration distribution in self-aerated open channel flows. J. Hydrodyn. 2015, 27, 394–402. [Google Scholar] [CrossRef]
  21. Bung, D.; Valero, D. Re-Aeration on stepped spillways with special consideration of entrained and entrapped air. Geosciences 2018, 8, 333. [Google Scholar] [CrossRef] [Green Version]
  22. Tan, S.; Zhao, F.; Li, S.; Gao, P. Conversion method between interface mass transfer and volume mass transfer in VOF model. J. Harbin Eng. Univ. 2015, 36, 317–321. [Google Scholar]
  23. Zhu, H. Study on Oscillating Flow and Heat Transfer Characteristics of Gas-Liquid Two Phase Flow; Beijing Institute of Technology: Beijing, China, 2015. [Google Scholar]
  24. Zhu, H.; Zhang, W.; Yuan, Y. The influence of improved VOF method on oscillatory flow and heat transfer calculation of gas-liquid two phase flow. J. Aerodyn. 2015, 30, 1040–1046. [Google Scholar]
  25. Zhang, Y. Mathematical Model and Numerical Simulation of Two-Phase Flow in Heat Pipes Based on CFD; South China University of Technology: Guangzhou, China, 2014. [Google Scholar]
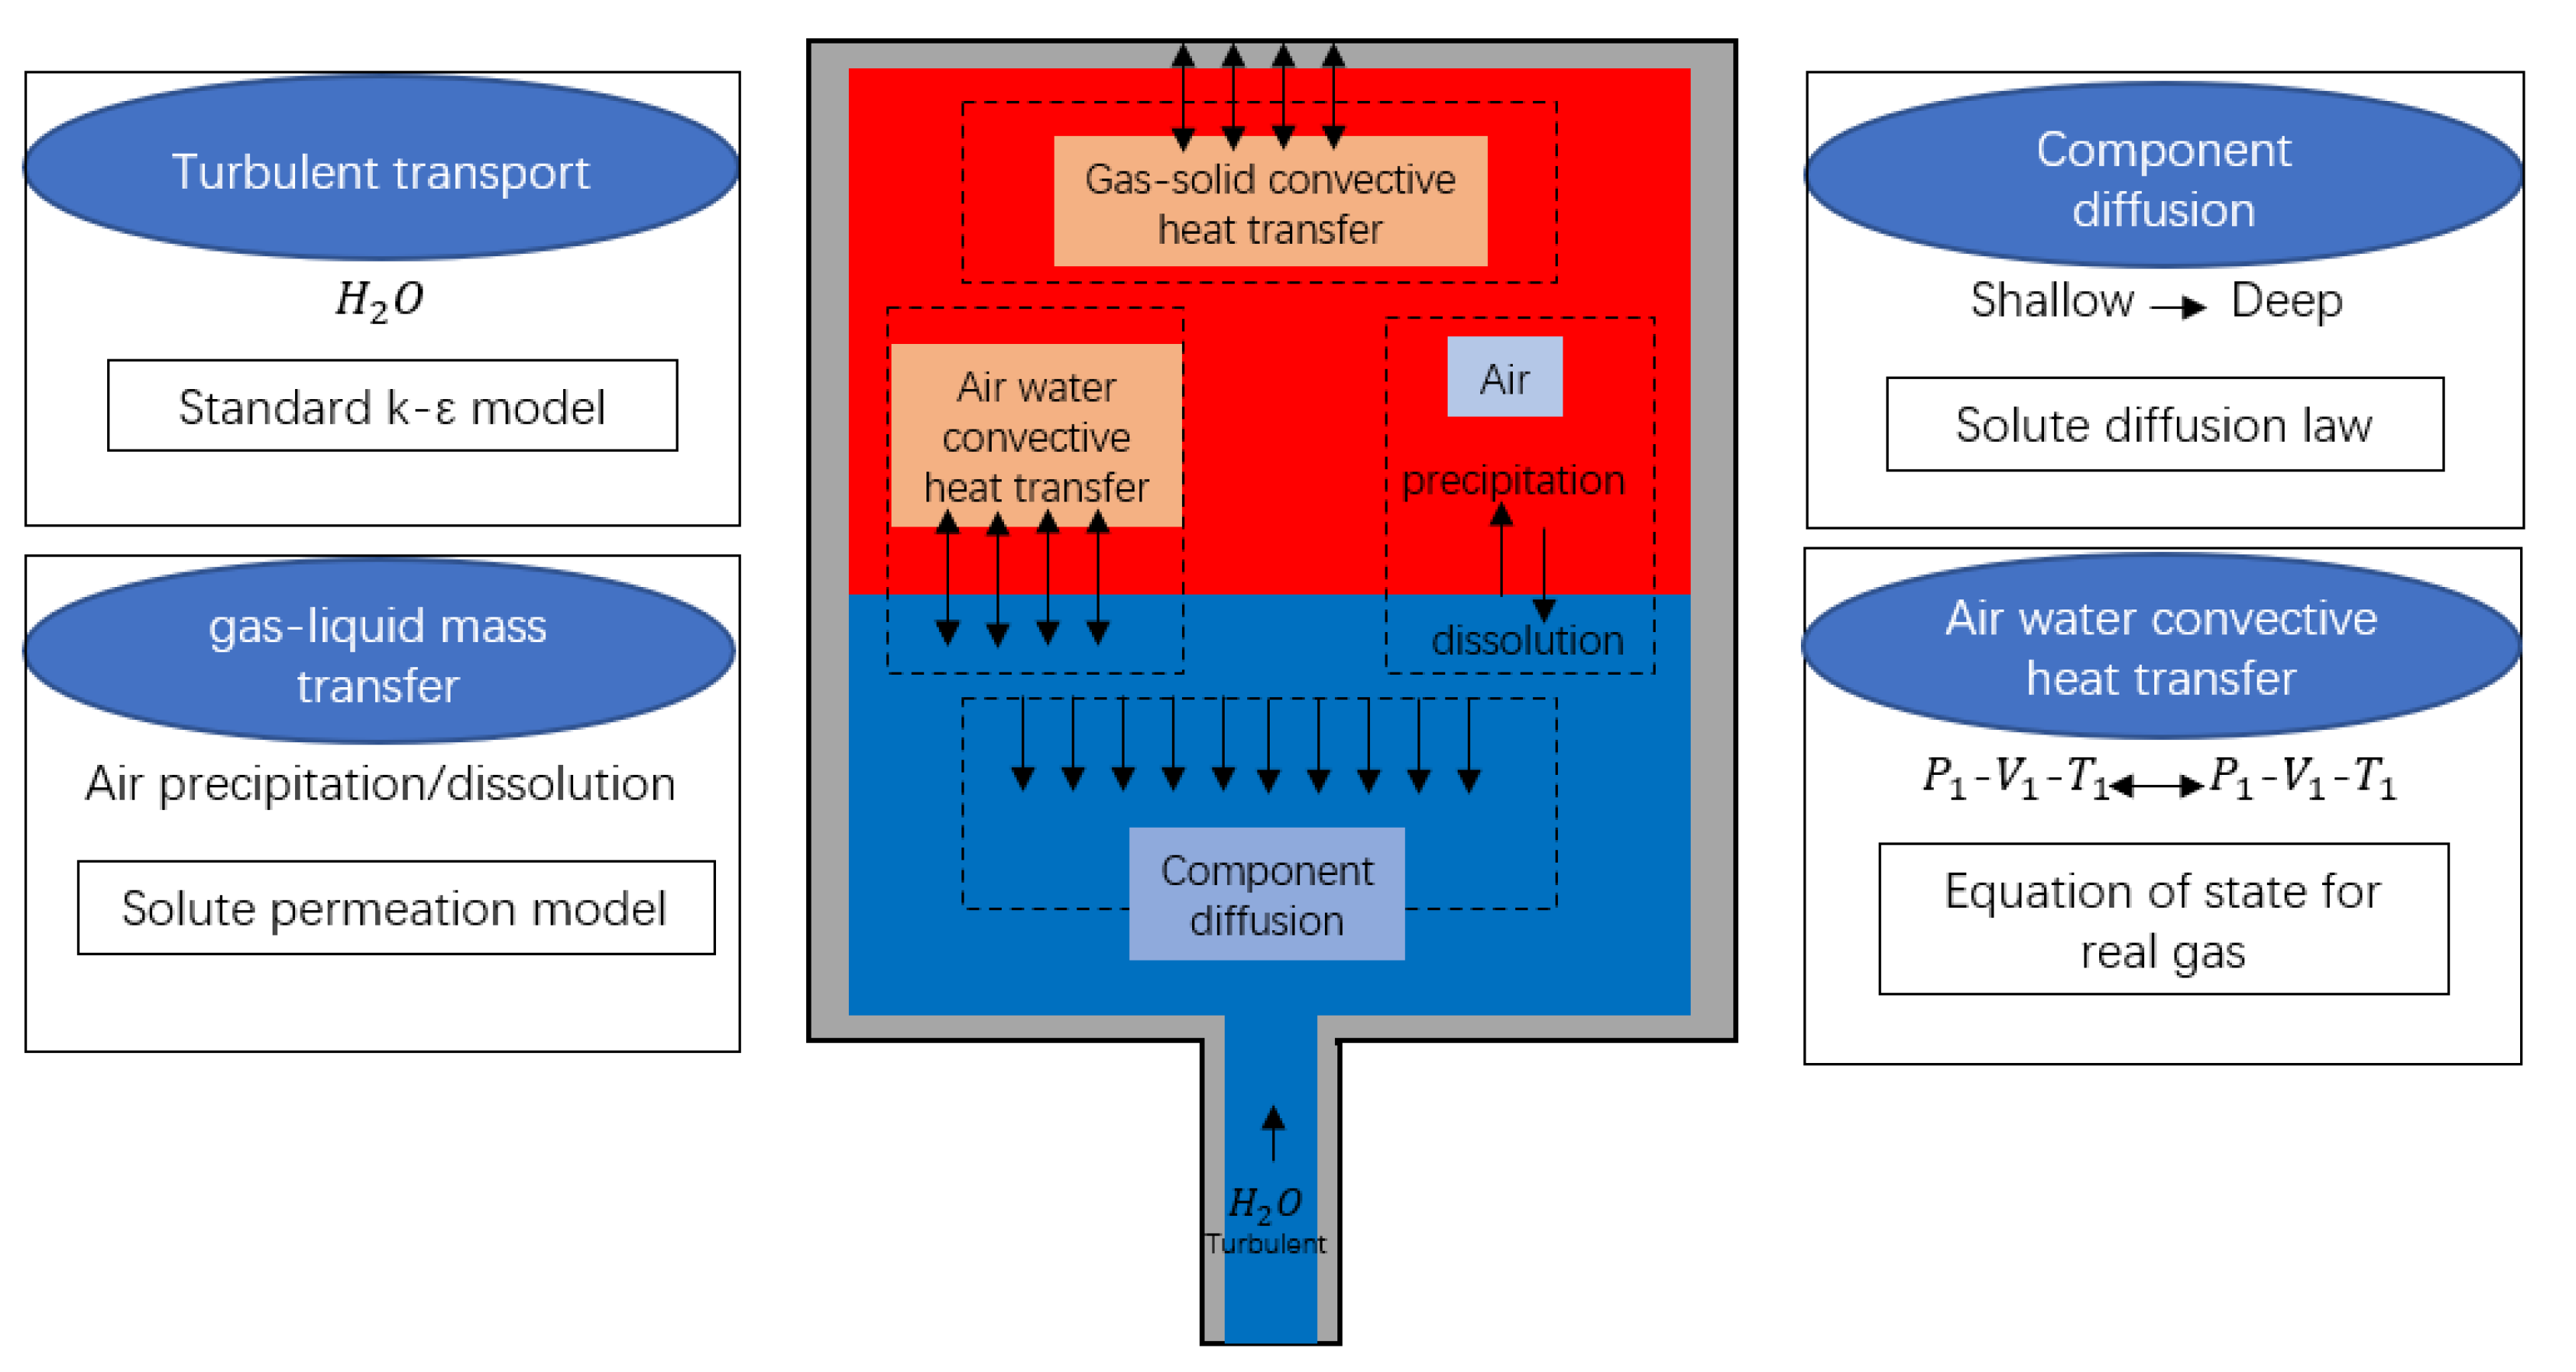
Figure 1. Heat and mass transfer model of air cushion surge chamber.
Water 15 02784 g001
Figure 2. Schematic diagram of air cushion surge chamber structure. (a) The air chamber inlet is located in the center of the bottom plate. (b) The air chamber inlet is located on the right side of the base plate.
Water 15 02784 g002aWater 15 02784 g002b
Figure 3. Pressure curve at the inlet of the surge chamber.
Water 15 02784 g003
Figure 4. Comparison of maximum water surface in M1 and M2 models.
Water 15 02784 g004
Figure 5. Air–water interface diagram in the air chamber. (a) Model1. (b) Model 2.
Water 15 02784 g005
Figure 6. Water level change curve.
Water 15 02784 g006
Figure 7. Cloud map of gas–liquid distribution at model (t = 14 s). (a) Cross and longitudinal section of Model 1. (b) Cross and longitudinal section of Model 2.
Water 15 02784 g007
Figure 8. Model temperature curve.
Water 15 02784 g008
Figure 9. Cloud chart of dissolved air content in water.
Water 15 02784 g009
Figure 10. Liquid proportion of Model 1 connection pipe cross-section.
Water 15 02784 g010
Figure 11. Mass concentration of dissolved gas in water.
Water 15 02784 g011
Disclaimer/Publisher’s Note: The statements, opinions and data contained in all publications are solely those of the individual author(s) and contributor(s) and not of MDPI and/or the editor(s). MDPI and/or the editor(s) disclaim responsibility for any injury to people or property resulting from any ideas, methods, instructions or products referred to in the content.