Article

Summer Chlorophyll-a Increase Induced by Upwelling off the Northeastern Coast of Hainan Island, South China Sea

1
College of Chemistry and Environmental Science, Guangdong Ocean University, Zhanjiang 524088, China
2
Cooperative Research Center for Offshore Marine Environmental Change, Guangdong Ocean University, Zhanjiang 524088, China
3
Southern Marine Science and Engineering Guangdong Laboratory (Zhuhai), Zhuhai 519082, China
4
College of Fisheries, Guangdong Ocean University, Zhanjiang 524088, China
*
Authors to whom correspondence should be addressed.
Water 2023, 15(15), 2770; https://doi.org/10.3390/w15152770
Submission received: 23 May 2023 / Revised: 21 June 2023 / Accepted: 26 July 2023 / Published: 31 July 2023
(This article belongs to the Section Oceans and Coastal Zones)

Abstract

:
There are generally high chlorophyll-a concentrations (Chl-a) where upwelling is prevalent. High Chl-a is often observed in upwelling areas of the northeastern coast of Hainan Island during the summer. Using the satellite remote sensing data, including sea surface temperature, sea surface wind and Chl-a data from 2009 to 2022, we analyze the spatial-temporal and inter-annual variation of Chl-a on the northeastern coast of Hainan Island. Then, the possible influence of environmental factors on Chl-a are further examined by using satellite data, as well as Ekman transport and Ekman pumping velocity derived from the wind products. Finally, the key factors affecting the changes of Chl-a are discussed by correlation analysis. The results show the significant interannual variation of Chl-a in the region, with the maximum of summer Chl-a during the prevalent period of upwelling. The correlation analyses reveal that there is a higher correlation coefficient between the summer Chl-a and the upwelling index (i.e., upwelling regional temperature anomaly), suggesting the role played by upwelling in the summer high Chl-a is more important than the other environmental factors. It is speculated that the summer Chl-a increase is not only influenced by wind-induced upwelling but also by the upwelling caused by tidal mixing, large-scale circulation, topographic changes, and typhoon events.

1. Introduction

Upwelling usually brings nutrients from the deep layer into the surface and supports the growth of phytoplankton and, in turn, higher chlorophyll-a concentration (Chl-a). Therefore, the coastal upwelling regions generally have higher primary productivity, and the occurrence or disappearance of upwelling can exert an important impact on local fishery production [1,2]. The coastal upwelling dynamics have been extensively studied. Dispersion of seawater caused by wind stress curl along the coast or in the open sea leads to the rise of bottom water and induces upwelling due to the Ekman pump [3,4]. In the Vietnam upwelling system, northeast of the Taiwan upwelling system [5], and near the Sabah coast upwelling system (or off of the northwest Borneo upwelling) [6], wind stress curl is the principal factor of these upwelling regions. In other upwelling systems, such as Southwestern Taiwan Strait upwelling [7], off of the Yangtze River Estuary upwelling [8], east of the peninsular Malaysia upwelling [9] and near the Sabah coast upwelling [6], upwelling induced by alongshore wind stresses better represents the dynamics of these above inshore regions. According to the classical Ekman transport theory, under the action of the winds parallel to the coast and the Coriolis force, the surface water is forced downward or transported offshore bringing deeper water to the surface layer due to the continuity of the water [4,10]. In addition, the interaction of large-scale coastal currents and topographic changes (i.e., cape, canyon, shelf break, widened shelf) can cause topographically induced upwelling, for example, upwelling on the west of Luzon Island [11,12], on the central east coast of Australia [13], and on the South Brazil Bight [14]. Meanwhile, in shallow water, such as southwest of Hainan [15,16], east of Zhejiang [17,18], and east of Guangdong [19], the nutrient-rich cold water rises to the surface layer by vertical mixing under the influence of tidal mixing. Other factors such as typhoons [20,21], river plumes [22,23], and eddies [24,25] can also induce, affect, or modulate upwelling. In summary, upwelling is caused by a combination of multiple factors.
There are two typical coastal upwelling systems in the northern South China Sea (NSCS), namely, the Yuedong coastal upwelling and the Qiongdong coastal upwelling [26,27]. The Qiongdong coastal upwelling is a seasonal coastal upwelling, which generally occurs in April, becomes strongest in June and July, persists until September [28], and has the longest duration and highest frequency of occurrences in the NSCS [27]. It is generally accepted that the Qiongdong coastal upwelling is driven by Ekman pumping and Ekman transport caused by wind stresses [29]. In recent years, to further improve the understanding of the main dynamical mechanisms of the Qiongdong coastal upwelling, this upwelling system has been classified into two parts: upwelling off the eastern coast of Hainan Island and upwelling off the northeastern coast of Hainan Island (UNEH) [30]. Different from upwelling off the eastern coast of Hainan Island, UNEH is not a typical wind-induced coastal upwelling region [31]. The large-scale circulation was also reported as an important factor affecting the processes of the UNEH [30,32]. Moreover, tidal and wind stress interaction enhances the vertical mixing of the whole water column in the coastal area northeast of Hainan Island [33]. In addition, the UNEH is also influenced by topographic changes [34,35], eddies [36], tropical cyclones [21,37,38], and ENSO [26,39,40].
Chl-a can represent phytoplankton biomass and primary productivity to a certain extent [41]. There are different factors, biotic and abiotic, that may drive high Chl-a [40]. Strong monsoons could enhance the seawater mixing, which brings the nutrients up to the upper layer and supports the growth of phytoplankton, thus increasing Chl-a. [11,12,42]. Additionally, coastal upwelling can also have the same effect. Strong western boundary currents interacting with eddies can also increase the primary productivity of the surface layer by inducing nutrients to be supplied upward to the euphotic zone [43]. In addition, land runoff, especially during weather events such as rainfall and typhoon, can increase nutrient input and greatly enhance Chl-a increase [44,45,46]. The distribution and abundance of zooplankton can also affect phytoplankton biomass. Recent studies in the NSCS indicate that the high Chl-a was located in coastal areas with strong upwelling. The maximum phytoplankton abundance was reached when the strongest intensity of Qiongdong coastal upwelling was reported east of Hainan Island [47]. In addition, it had been recently found that the Chl-a in the northeast coast of Hainan Island is generally higher than that in other areas east of Hainan Island. Upwelling areas usually have higher Chl-a and lower sea surface temperatures (SST) [48]. Meanwhile, high Chl-a is always accompanied by stronger offshore Ekman transport, which triggers coastal upwelling [49]. It is generally accepted that coastal upwelling caused by the southwest monsoon is the main mechanism for the summer high Chl-a in northeastern Hainan Island.
It is well known that upwelling can cause Chl-a to increase through the transport of nutrients from deeper layers to the shallower layers. In this study, we treat the upwelling influences on increase of Chl-a as one fact. There are generally different factors or processes causing upwelling, including Ekman pumping, Ekman transport, topographic changes, and tidal mixing. Therefore, we mainly discussed which factors may exert a more evident contribution in Chl-a, based on correlation analysis of different factors inducing upwelling and Chl-a. This study is helpful to improve our understanding of the possible mechanism of upwelling influence on the summer Chl-a increase.

2. Materials and Methods

2.1. Study Area

The study area is located in the northeastern parts of Hainan Island, approximately between 19.8° N to 20.5° N and from 110.6° E to 111.3° E (Figure 1, Box C). Under the control of the East Asian monsoon, the coastal currents in this study area flow northeastward along the shelf in summer and southwestward in winter [40,50]. The tide is strong, with irregular semidiurnal currents and tidal waves propagating from southeast to northwest [51]. The topography of this region is relatively complex, with a steeply sloping continental shelf and a dense distribution of isobaths roughly parallel to the coastline.

2.2. Satellite Data

The Chl-a data is derived from multiple satellite products, i.e., Sea-viewing Wide Field-of-view Sensor (SeaWiFS), Moderate Resolution Imaging Spectroradiometer (MODIS), Medium Resolution Imaging Spectrometer (MERIS), and Visible Infrared Imaging Radiometer Suite (VIIRS), with the Garver-Siegel-Maritorena (GSM) model acquired from the GlobColour database (https://hermes.acri.fr, accessed on 18 February 2023), which has been developed, validated, and distributed by ACRI-ST, France [52,53]. The spatial and temporal resolution of this product is 0.04° × 0.04°, monthly, respectively. The dataset covers the period from 2009 to 2022. Due to cloud cover or other causes, there is missing data for some months (e.g., January 2011, April 2014, March, April 2016).
The GSM model is a semi-analytical ocean colour model that merges global satellite ocean color data streams to produce a uniform data product. In order to test the validity of the GSM algorithm for coastal areas, we compared Chl-a from satellites and in situ observation (2 m layer) point to point. In situ data, derived from the work of Chen et al. [54], from a transect survey, contained seven stations on eastern and southeastern Hainan Island in August 2018. The satellite Chl-a data are produced by averaging Chl-a values for 2 pixels by 2 pixels near the in situ stations, based on the Chl-a data averaged for monthly GlobColour data of August 2018. The results (Figure 2) show a high correlation (R2 = 0.66035, p < 0.01) between in situ Chl-a and satellite Chl-a data, indicating the reliability of the satellite Chl-a data. In addition, previous studies have also used satellite Chl-a data processed by the GSM algorithm to compare with in situ observations, analyzing and verifying that this satellite Chl-a data is validated for the western South China Sea, the northwest coast of Luzon, and the southeast coast of Vietnam, respectively [55,56,57].
The SST data and the sea surface wind (SSW) data are obtained from the European Centre for Medium-Range Weather Forecasts (ECMWF) (https://cds.climate.copernicus.eu/, accessed on 19 February 2023) at 0.25° × 0.25° spatial resolution. The monthly products are used from 2009 to 2022. The SSW data used in this study contained the 10 m wind speed, 10 m u-component of wind and 10 m v-component of wind.

2.3. Methods

2.3.1. Ekman Pumping Velocity and Ekman Transport

In this study, we used the wind stress vector to calculate Ekman transport (ET) and Ekman pumping velocity (EPV). The wind stress calculation equation is
τ = C d ρ a | U 10 | U 10
where U 10 is the 10 m wind speed, ρ a is the air density close to the sea surface ( ρ a = 1.29 kg·m−3), and C d is the drag coefficient ( C d = 1.3 × 10 3 ).
The calculation formula of wind stress curl is
c u r l z = τ y x τ x y
where τ x is the zonal wind stress, τ y is the meridional wind stress.
EPV and ET are calculated as follows:
E P V = c u r l ( τ ρ w f )
E T = τ ρ w f cos ( α β )
where ρ w is seawater density ( ρ w = 1.025 × 10³ kg·m−3), f is the Coriolis parameter ( f = 2 ω sin φ ), α is the wind direction, β is the shoreline orientation.

2.3.2. Temperature Anomalies in the Upwelling Region

The upwelling region usually has a lower sea surface temperature and higher Chl-a. In this study, we selected an area without upwelling to represent the background field, which has the same latitude range, three longitude degrees apart from the upwelling center eastward, and the same area as the study area. The temperature anomaly in the upwelling region (ΔSST) is calculated using the difference between the mean SST of the study area ( S S T u p ) and the mean SST of the background field ( S S T ref ) (Equation (5)). The ΔSST can be regarded as the strength of the upwelling.
Δ S S T = S S T u p S S T ref

2.3.3. Correlation Analysis

Pearson correlation analysis is used to examine the interrelationships between Chl-a and environmental factors. The Pearson correlation coefficient is a test statistic that measures the statistical relationship or association between two consecutive independent variables [58]. The Pearson correlation coefficient is also known as the simple correlation coefficient. Note that the time series of Chl-a and environmental factors (ΔSST, EPV, and ET) is used to calculate the Pearson correlation coefficient, and only June to September of each year is used here as the time range for calculation.

3. Results

3.1. Distribution of Chl-a Northwest of Hainan Island

The time series of Chl-a averaged for the study area (i.e., Box C in Figure 1) from 2009 to 2022 (Figure 3) shows that there are evident interannual and seasonal variations in Chl-a in the study area, with two peaks in one year, respectively, June–July and November–December. The monthly mean Chl-a in February and March is the lowest among the 12 months. The Chl-a gradually increases from April, when the upwelling begins to appear from April. During the prevalent period of upwelling from June to August, the monthly mean Chl-a generally reaches the first peak of the whole year. Then, the high Chl-a gradually declines from August and reaches the second minimum in September–October. The other peak of Chl-a appears in the period of November, with the increase of northeasterly monsoon wind.
To investigate the whole process of the Chl-a from the peak to decay during upwelling, four months from June to September are selected to represent summer for facilitating the elaboration in this paper.
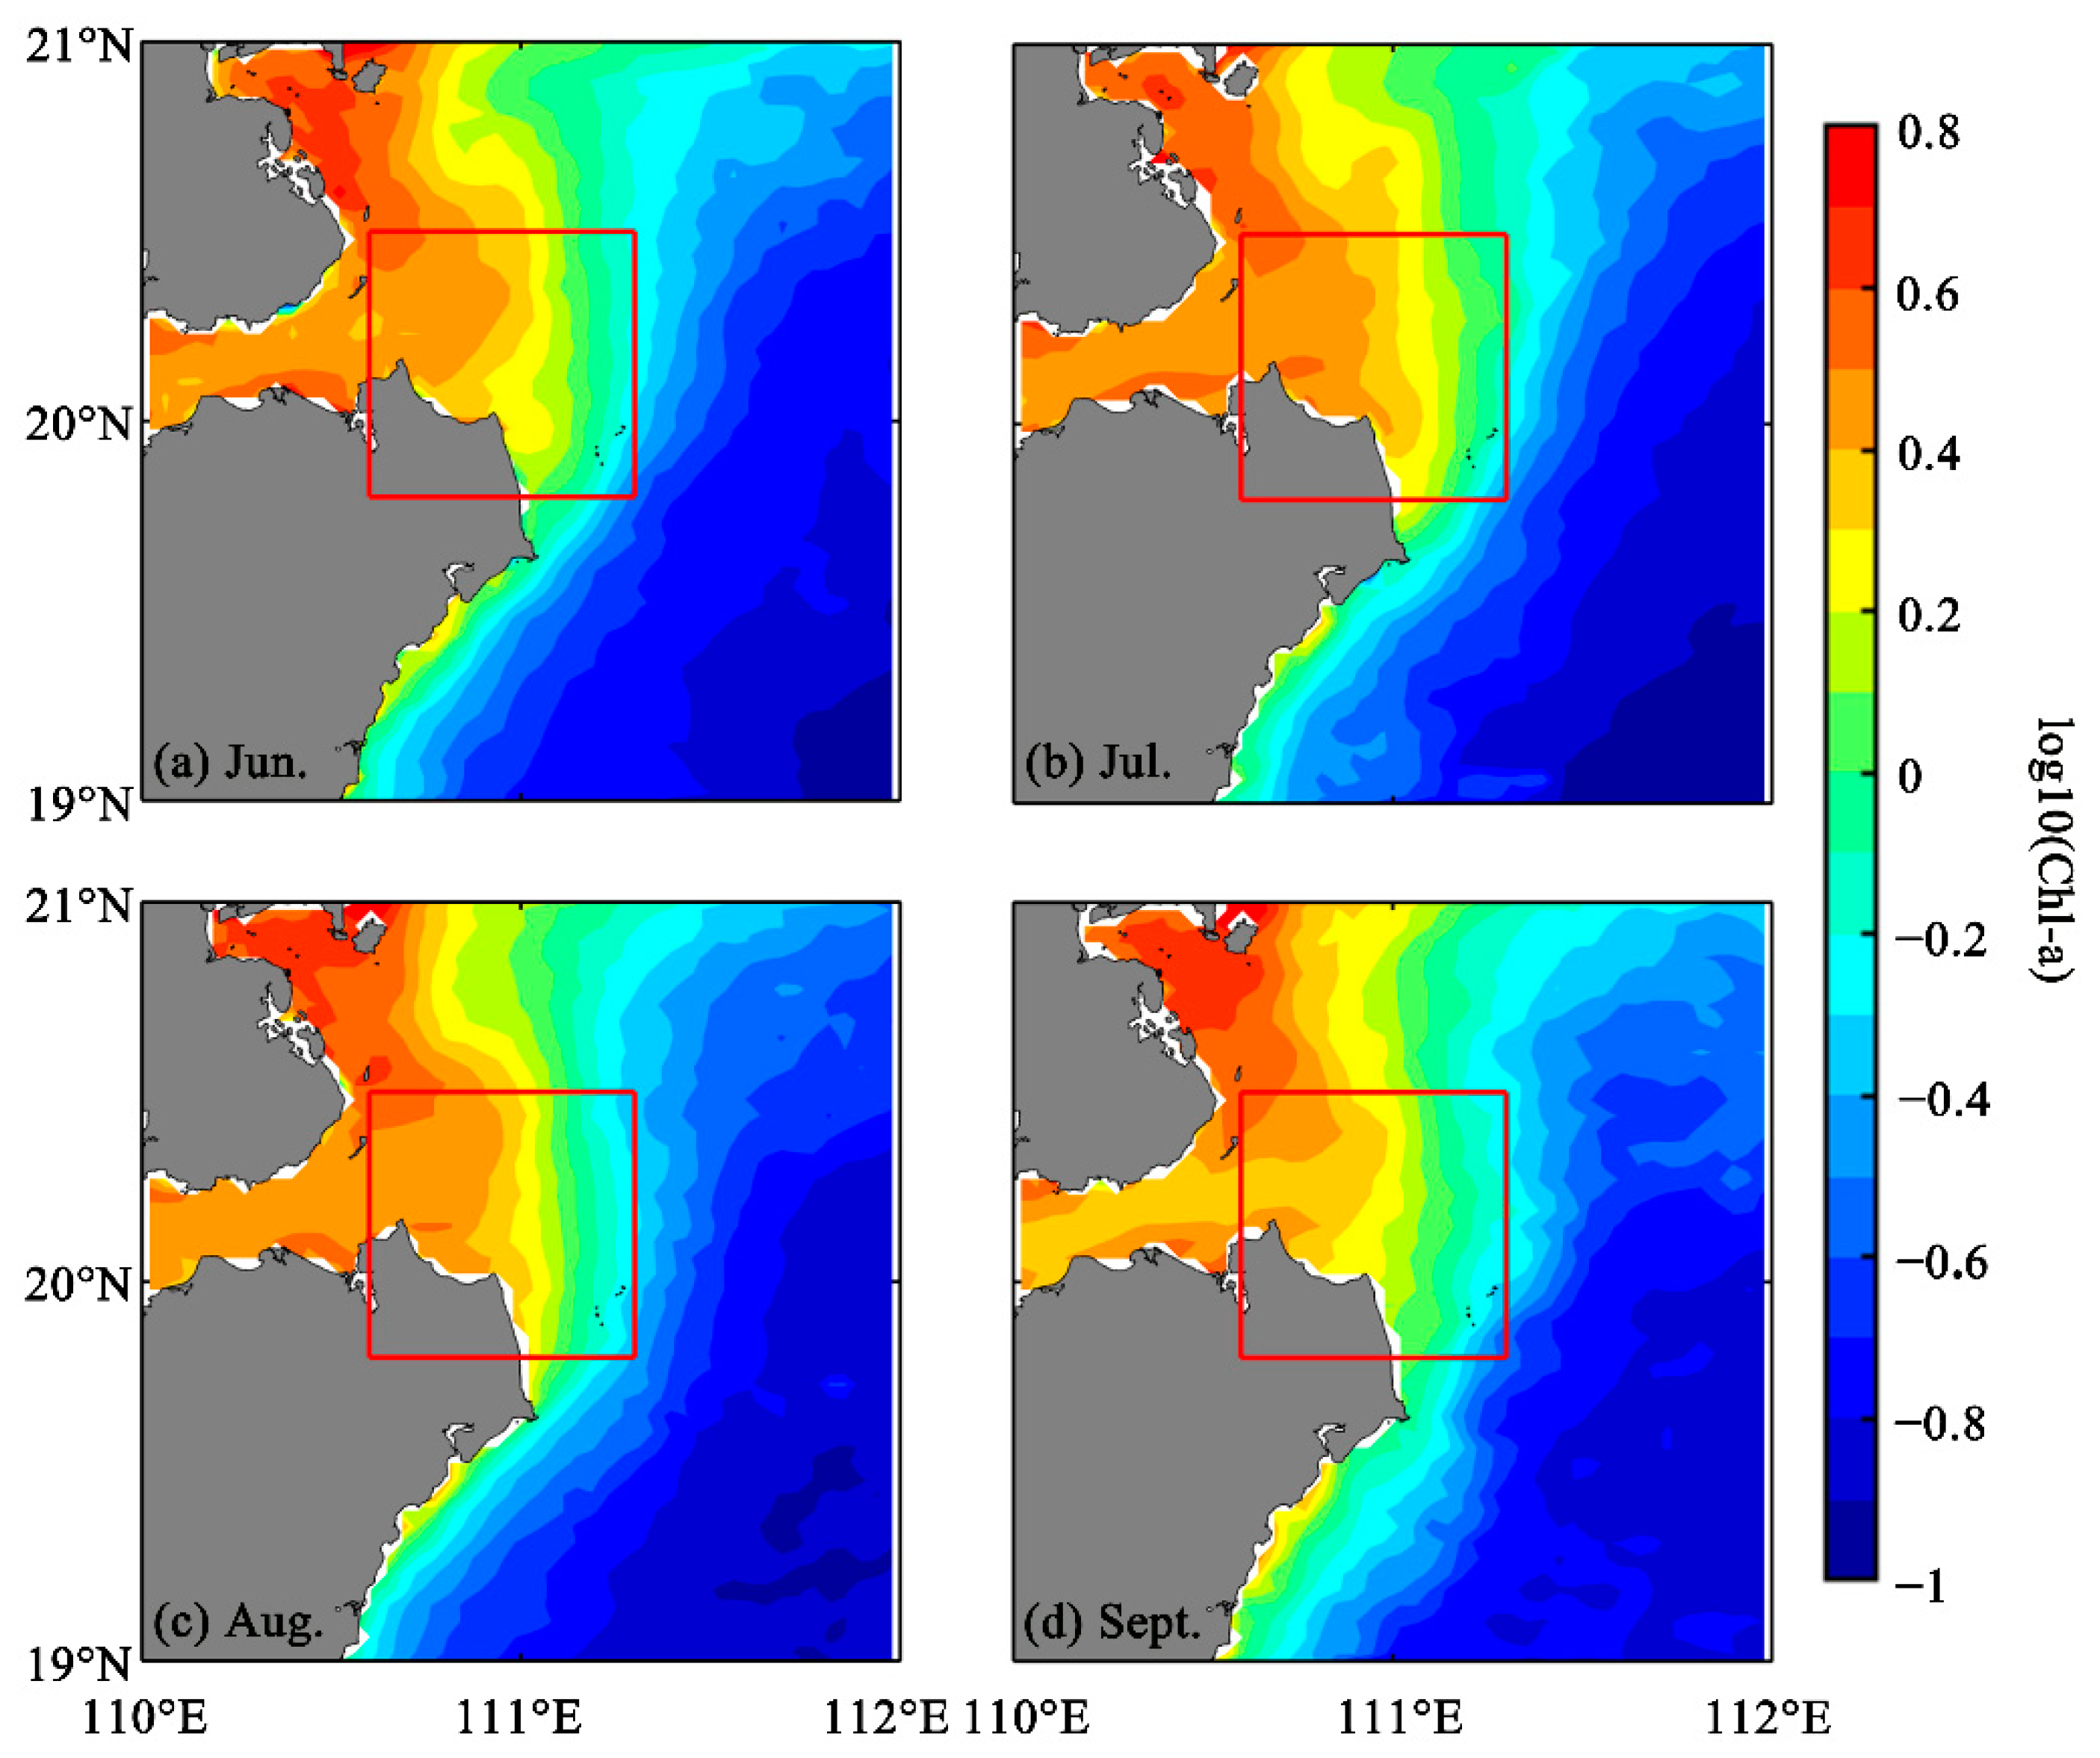
The climatology of Chl-a (Figure 4) showed that there were relatively high Chl-a (~2.80 mg·m−3) in coastal regions and relatively low Chl-a (~0.80 mg·m−3) in offshore regions. The high Chl-a is evident along the coast, especially near the northeastern coast of Hainan Island (i.e., red box area in Figure 4), where the highest Chl-a occurs in June–August and the high Chl-a shrinks and moves westward in September.

3.2. Satellite Observation of Environmental Variables

3.2.1. Sea Surface Temperature

The cool water center (i.e., the red triangle in Figure 5) can be observed northeast and east of Hainan Island and shows a very obvious temperature gradient. The lower SST patch in the northeast of Hainan Island is usually strongest in June–July; then the distribution of the low-temperature zone gradually decreased and the SST gradually increased, and then the cool water center is weakened toward the northwest coastline of Hainan in September.

3.2.2. EPV and ET Caused by Wind Stress

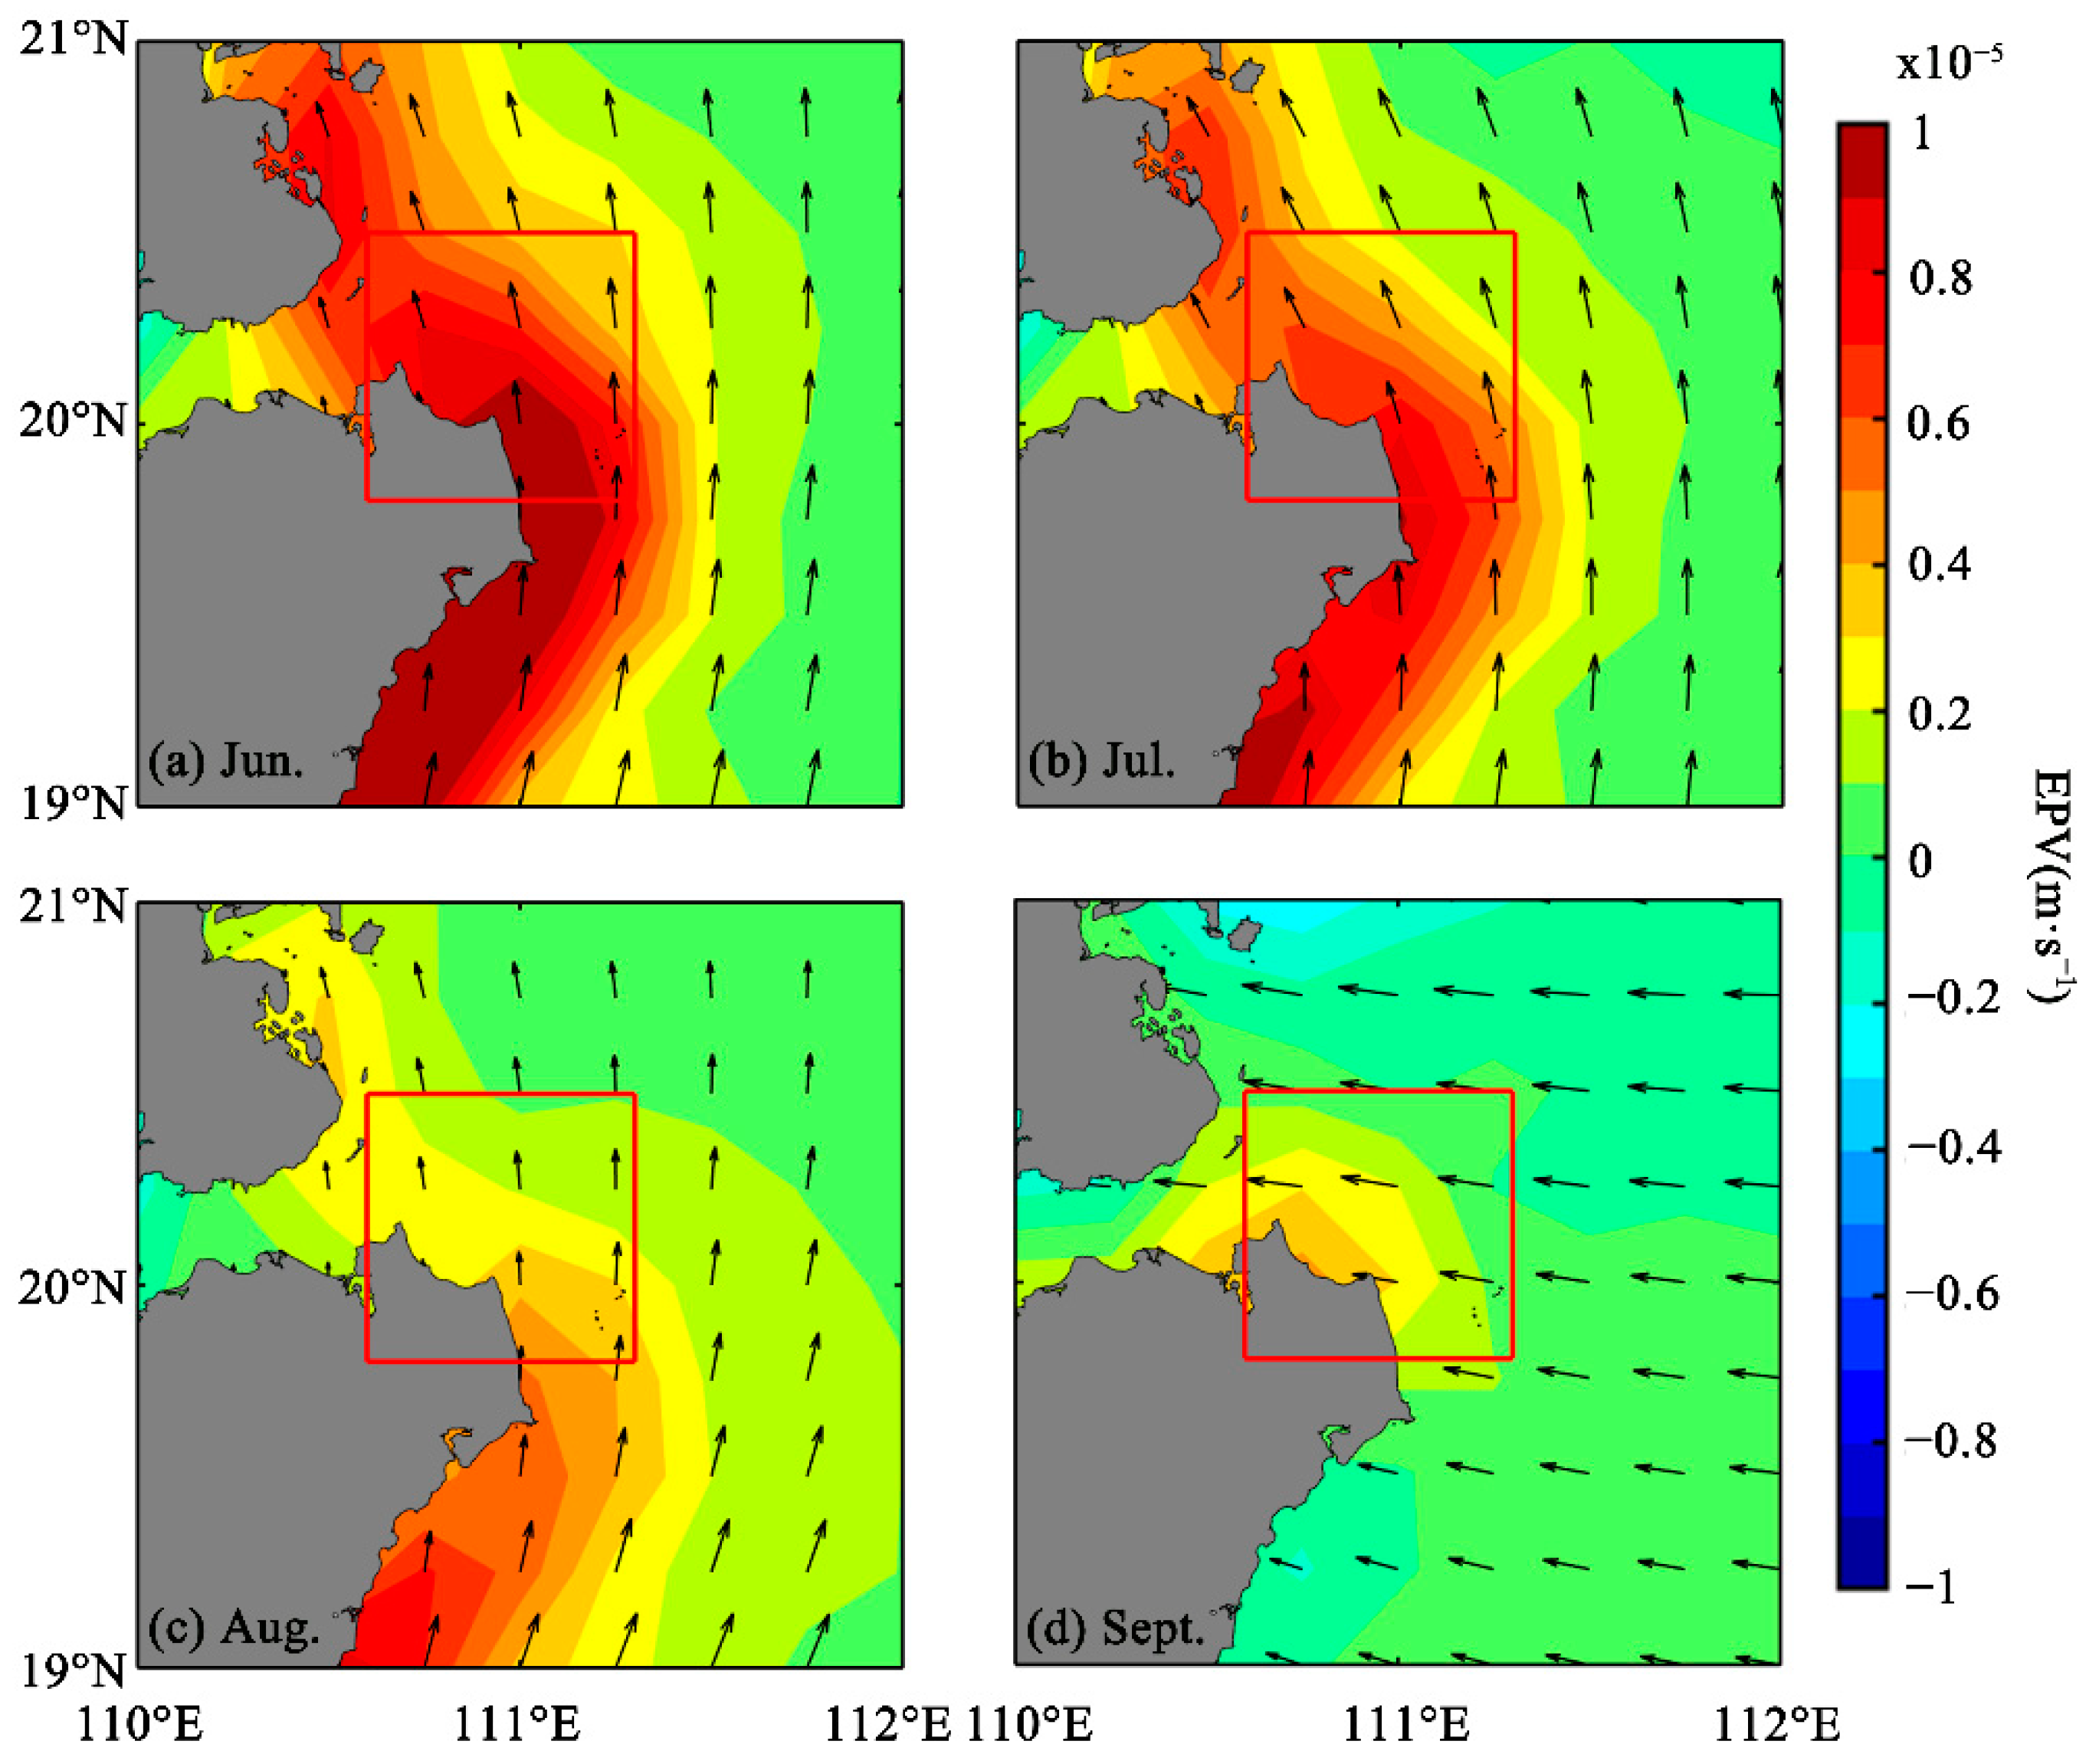
The ET and EPV induced by the local wind stress can upwell deeper nutrients to the shallow layers [16,38]. It generally exerts an important effect on the distribution of Chl-a. There are high EPV and ET that occur in the northeast of Hainan Island. In June, stronger EPV, generally greater than 0.5 × 10⁻⁵ m·s−1, occurs along the eastern coast of Hainan Island (Figure 6a) and is similar to the location of the lower SST (Figure 5). Subsequently, the intensity of EPV gradually weakens. Then, the winds shift to the east, and the EPV is the weakest and moves to the northwest in September.
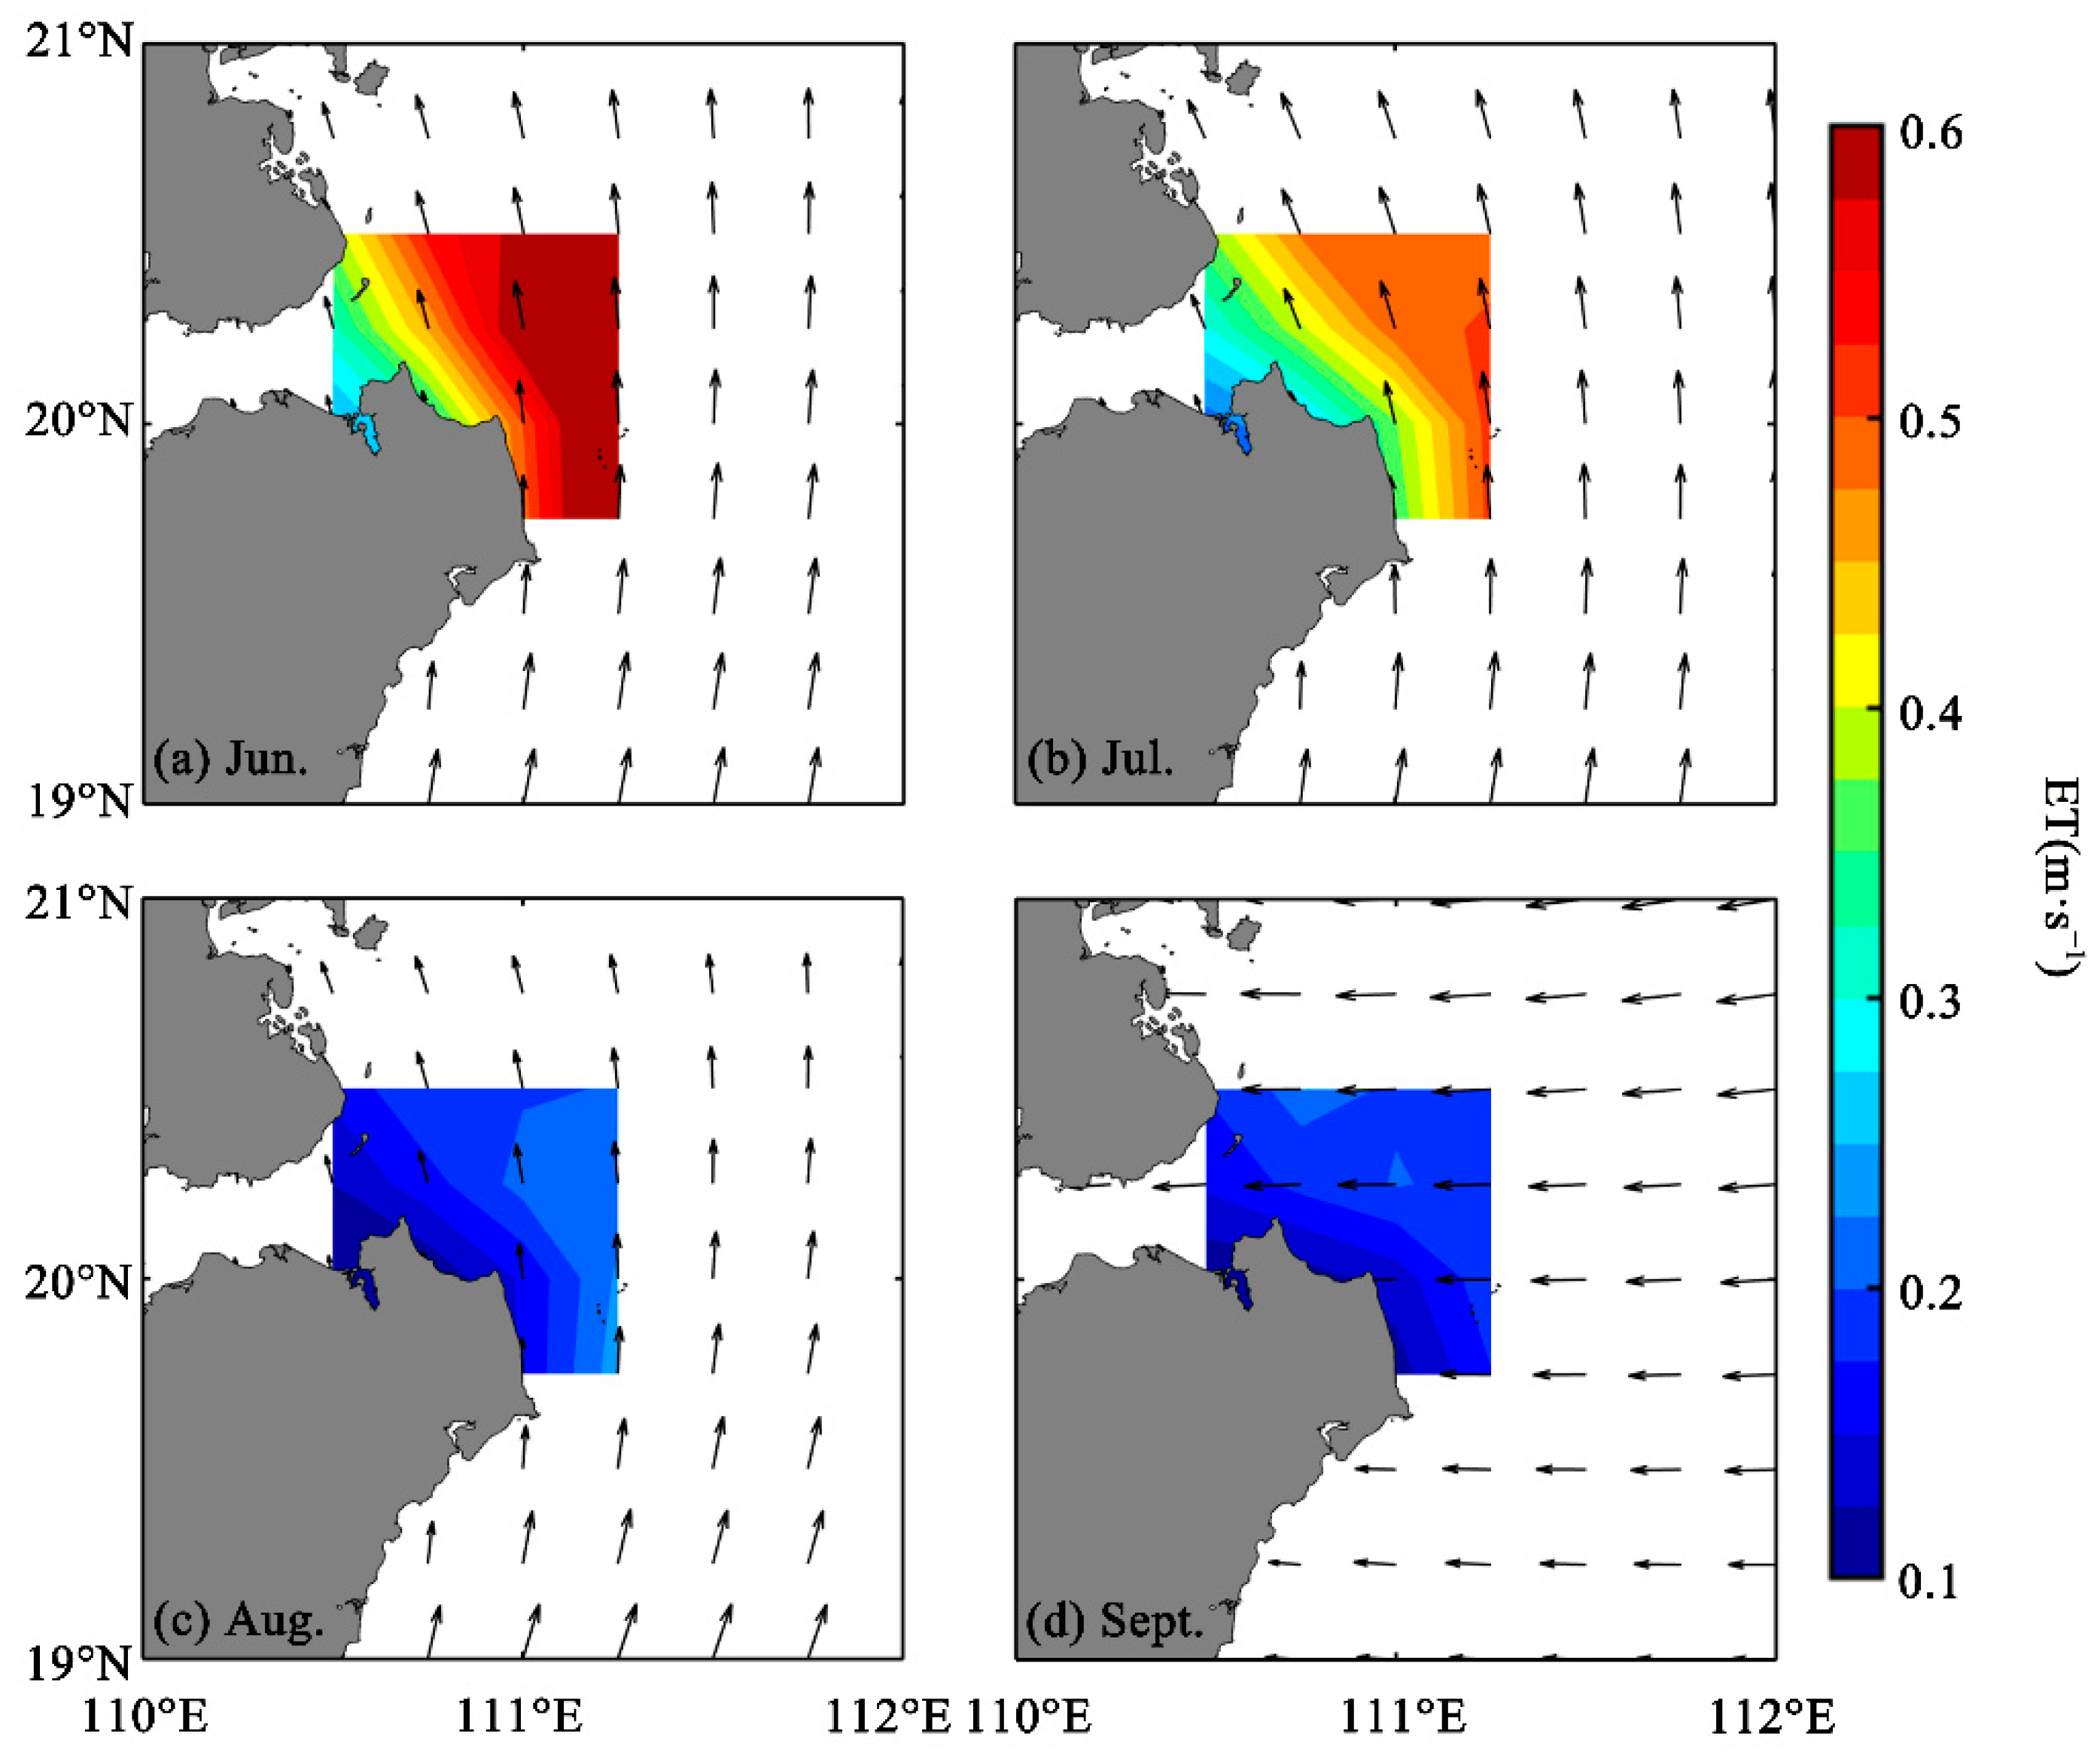
Alongshore wind parallel to the coastline can induce upwelling or downwelling along the coastlines. From June to August, the prevailing southeast wind northeast of Hainan Island would induce offshore Ekman transport, which can also trigger coastal upwelling. Meanwhile, the wind speed gradually weakened, resulting in a month-on-month weakening trend of ET (Figure 7), roughly consistent with the variation trend of EPV. In September, the wind direction changes and is almost perpendicular to the coast, thus the ET is weakest in this month.

3.3. Correlation Analysis of Chl-a and Other Conditions

A Pearson correlation analysis is conducted using monthly mean Chl-a with ΔSST, SSW, WSC, EPV, and ET in the northeast of Hainan Island from June to September 2009–2022. There are positive correlations between Chl-a and ET (r = 0.316, p < 0.05), EPV (r = 0.322, p < 0.05); Chl-a presents a significant negative correlation with ΔSST (r = −0.521, p < 0.01); the relationship between Chl-a and SSW (r = 0.026, p > 0.10) is a lower correlation.

4. Discussion

4.1. Influence of Upwelling on Summer Chl-a Increase

The high Chl-a in the most areas of the SCS during winter is mainly due to vertical mixing caused by strong winter wind [56], atmospheric deposition [59,60], etc. Meanwhile, Chl-a is generally low during summer [61], except for a few upwelling areas, such as the NSCS and the southeast Vietnam coast, which are influenced by the southwest monsoon [55,62], and usually have higher Chl-a. The peak of Chl-a off the northeastern coast of Hainan Island occurs in summer, indicating that an increase of nutrients induced by the upwelling may play an significant role in the high Chl-a [42,55].
Upwelling regions usually have lower temperatures and higher productivity than ambient regions without upwelling [61]. The southwest monsoon winds parallel to the coastline may cause the offshore transport of the upper water east of the islands, as well as the coast, and then trigger the vertical transport of nutrient-rich cold water into the upper ocean, inducing the upwelling and decreasing SST [10,29,63]. Thus, SST is generally considered as an important indicator for upwelling. The lower SST appears frequently northeast of Hainan Island in summer (Figure 5), suggesting the existence of significant upwelling in this area to a certain extent, and that is the UNEH [64,65]. The result is in line with the previous studies [31,33].
In this study, the summer mean Chl-a (~3.20 mg·m−3) in the study area is significantly higher than that in the background field without the influence of upwelling (~0.50 mg·m−3), implying UNEH may play an important role in the higher summer Chl-a. In September, the upwelling center shifted northwest, and the intensity of upwelling weakened (Figure 5d and Figure 6d), while Chl-a patches could also be found to move in this direction and Chl-a decreased, which supported the coastal upwelling and can significantly affect Chl-a and its distribution to some extent. Meanwhile, strong EPV and ET can be observed in this region, roughly coinciding with the previously described high Chl-a. EPV caused by wind stress in the study area in summer reaches more than 0.5 × 10⁻⁵ m·s−1 (~0.43 m·day−1) (Figure 6), which is consistent with the previous studies [66]. The phenomena imply that EPV possibly plays a significant role in the formation or enhancement of UNEH, as well as the Chl-a increase. The strong ET, roughly located in the northeast of Hainan Island, can also continuously uplift cold, nutrient-rich water into the euphotic layer. Thus, it would exert an important influence on the upwelling intensity and trigger Chl-a to increase. In addition, the above process could also bring phytoplankton from the subsurface layer into the surface layer directly [67], resulting in a sharp increase in surface phytoplankton Chl-a and a decrease in SST. Moreover, submarine groundwater discharge is recognized as a crucial nutrient and carbon source to the nearshore [32,68,69]. The natural groundwater recharge rate is much higher than the groundwater exploitation rate, and extensive infiltration from heavy rainfall makes the northern and eastern parts of Hainan Island a big groundwater storage area [70]. Therefore, submarine groundwater discharge could transport nutrients into the coastal ocean and exert an important influence on the Chl-a increase.

4.2. Key Environmental Factors Inducing Summer Chl-a Increase

Nutrients, light, and temperature are generally the most important regulating factors for the high Chl-a in NSCS [71,72]. Owing to the study region being located in the tropical area, light irradiance as well as temperature would not generally be a limiting factor on Chl-a increase [73], and nutrients are probably the main limiting factor for elevated Chl-a in the study area. Therefore, the supply of nutrients affected by the physical processes of the upper ocean becomes the key factor of elevated Chl-a in the present study.
The correlation analysis between surface Chl-a and environmental factors (Table 1) suggests that all ΔSST, ET, and EPV may exert important regulation on the variation of Chl-a in the region. The insignificant correlation between Chl-a and SSW suggests that summer high Chl-a may be less regulated directly by SSW. However, there are higher correlation coefficients between Chl-a and ET (r = 0.316, p < 0.05), EPV (r = 0.322, p < 0.05), suggesting that EPV and ET caused by wind stress played a positive role in the phenomenon of high Chl-a. However, from June to August, the EPV off the northeastern coast of Hainan Island is slightly smaller than that off the eastern coast of Hainan Island, suggesting that wind-induced UNEH is relatively weak. In other words, the intensity of UNEH may not only be influenced by wind stress.
ΔSST shows a higher correlation (r = −0.521, p < 0.01) with Chl-a, implying that ΔSST can better reflect the characteristics of UNEH. Compared with those between Chl-a and ΔSST, the correlation coefficients of Chl-a with ET and EPV are less, further indicating that SST not only reflects the upwelling intensity of ET and EPV but also the influence of other factors to a large extent. The local tidal mixing enhanced the upwelling intensity in the northeast of Hainan Island [39]. The tidal action causes strong westward current anomalies to obstruct the eastward transport of warm water from the Beibu Gulf, leading to the compensation of deeper, cooler seawater into the northeastern part of Hainan Island, which could lift the cold water near the bottom. Thus, strong tidal mixing can lead to the increase of Chl-a [15,39]. Moreover, previous studies have shown that large-scale current and topographic changes can uptake cold water from the bottom layer near the east or northeast coast of Hainan Island [30,34,50]. Due to the bottom ET and Ekman pumping caused by bottom friction and its curl, the interaction between the large-scale circulation flowing northeastward along the east coast and the nearshore topography can also induce upwelling and cause a decrease in SST and increase in Chl-a [10,23,35]. In addition, tropical cyclones occur frequently over the NSCS. In the Northwest Pacific, strong cyclonic systems are known as typhoons [74]. Typhoon events can also strengthen vertical mixing, resulting in sea surface cooling. Under the combined effect of typhoons and upwelling, Chl-a can increase significantly [46,75]. Therefore, ΔSST, better than EPV or ET, represents upwelling intensity playing a crucial role in the high summer Chl-a in the region northeast of Hainan Island. Compared with previous studies [57], the correlation between Chl-a and environmental factors is higher in coastal Vietnam than in northeastern Hainan Island, possibly due to the latter’s nearshore location and the complex hydrological conditions, as well as other terrestrial discharge. Our results show that EPV or ET may be one of the ways to regulate upwelling, inducing higher Chl-a, while tidal mixing, large-scale circulation, topographic changes, and typhoon events also likely contribute to the formation or intensification of upwelling in the region, thereby also affecting Chl-a in the region.

5. Conclusions

In this study, the spatial-temporal variation characteristics of Chl-a from 2009–2022 are studied off the northeastern coast of Hainan Island. There is generally obvious high Chl-a in summer, which coincides with the period of upwelling in both our result and previously reported results. Chl-a presents good correlations with ΔSST, EPV, and ET in summer, especially higher correlation coefficients with ΔSST, and less correlation with SSW. Based on the results of the correlation analysis, the summer Chl-a increase can be influenced by upwelling processes, which may be driven not only by wind-induced upwelling, including EPV and ET, but also by tidal mixing, large-scale circulation, topographic changes, and typhoon events, all of which could uplift cold water with abundant nutrients to the upper ocean and exert an important influence on the increase of Chl-a in the study region. Due to the special geographical location and complex dynamic environment of the northeastern coast of Hainan Island, the mechanisms driving the change of primary productivity in this region are worthy of further study.

Author Contributions

Conceptualization, H.Z.; methodology, Y.C., H.Z. and C.S.; software, Y.C.; validation, Y.C., H.Z. and C.S.; writing—original draft preparation, Y.C.; writing—review and editing, Y.C., H.Z. and C.S.; visualization, Y.C. and C.S.; project administration, H.Z.; funding acquisition, H.Z. All authors listed made a substantial, direct and intellectual contribution to the work, and approved it for publication. All authors have read and agreed to the published version of the manuscript.

Funding

The present research is supported by the National Natural Science Foundation of China (No. 42076162), and the project was supported by the Innovation Group Project of Southern Marine Science and Engineering Guangdong Laboratory (Zhuhai) (No. 311020004).

Data Availability Statement

Data sharing is not applicable to this article.

Acknowledgments

We are grateful to GlobColor’s Working Group for providing merged Chl-a (http://hermes.acri.fr, accessed on 18 February 2023). The European Centre for Medium-Range Weather Forecasts (ECMWF) for providing monthly SST and SSW products (https://cds.climate.copernicus.eu/, accessed on 19 February 2023).

Conflicts of Interest

The authors declare no conflict of interest.

References

  1. Wang, X.; Yu, J.; Li, Y.; Chen, B.; Huang, M. The relationship between major upwelling and the upwelling fishing grounds in the South China Sea. Mar. Sci. 2015, 39, 131. [Google Scholar] [CrossRef]
  2. Pauly, D.; Christensen, V. Primary production required to sustain global fisheries. Nature 1995, 374, 255–257. [Google Scholar] [CrossRef]
  3. Wang, D.; Wang, H.; Li, M.; Liu, G.; Wu, X. Role of Ekman transport versus Ekman pumping in driving summer upwelling in the South China Sea. J. Ocean Univ. China 2013, 12, 355–365. [Google Scholar] [CrossRef]
  4. Halpern, D. Offshore Ekman transport and Ekman pumping off Peru during the 1997–1998 El Niño. Geophys. Res. Lett. 2002, 29, 19–1–19-4. [Google Scholar] [CrossRef]
  5. Wu, R. Summarization of study on upwelling system in the South China Sea. J Ocean. Taiwan Strait 2003, 22, 269–276. [Google Scholar]
  6. Yan, Y.; Ling, Z.; Chen, C. Winter coastal upwelling off northwest Borneo in the South China Sea. Acta Oceanol. Sin. 2015, 34, 3–10. [Google Scholar] [CrossRef]
  7. Hu, J.; Hong, H.; Li, Y.; Jiang, Y.; Chen, Z.; Zhu, J.; Wan, Z.; Sun, Z.; Liang, H. Variable temperature, salinity and water mass structures in the southwestern Taiwan Strait in summer. Cont. Shelf Res. 2011, 31, S13–S23. [Google Scholar] [CrossRef]
  8. Zhao, B.; Ren, G.; Cao, D.; Yang, Y. Characteristics of the ecological environment in upwelling area adjacent to the Changjiang River estuary. Oceanol. Et Limnol. Sin. 2001, 32, 333–338. [Google Scholar] [CrossRef]
  9. Farshid, D.; Fredolin, T.; Liew, J. Simulation of southwest monsoon current circulation and temperature in the east coast of Peninsular Malaysia. Sains Malays. 2014, 43, 389–398. [Google Scholar] [CrossRef]
  10. Shu, Y.; Wang, D.; Feng, M.; Geng, B.; Chen, J.; Yao, J.; Xie, Q.; Liu, Q.Y. The contribution of local wind and ocean circulation to the interannual variability in coastal upwelling intensity in the Northern South China Sea. J. Geophys. Res. Ocean. 2018, 123, 6766–6778. [Google Scholar] [CrossRef]
  11. Wang, J.; Tang, D.; Sui, Y. Winter phytoplankton bloom induced by subsurface upwelling and mixed layer entrainment southwest of Luzon Strait. J. Mar. Syst. 2010, 83, 141–149. [Google Scholar] [CrossRef]
  12. Lu, W.; Yan, X.H.; Jiang, Y. Winter bloom and associated upwelling northwest of the Luzon Island: A coupled physical-biological modeling approach. J. Geophys. Res. Ocean. 2015, 120, 533–546. [Google Scholar] [CrossRef]
  13. Roughan, M.; Middleton, J.H. A comparison of observed upwelling mechanisms off the east coast of Australia. Cont. Shelf Res. 2002, 22, 2551–2572. [Google Scholar] [CrossRef]
  14. Palma, E.D.; Matano, R.P. Disentangling the upwelling mechanisms of the South Brazil Bight. Cont. Shelf Res. 2009, 29, 1525–1534. [Google Scholar] [CrossRef]
  15. Hu, J.; Kawamura, H.; Tang, D. Tidal front around the Hainan Island, northwest of the South China Sea. J. Geophys. Res.-Ocean. 2003, 108, 33–42. [Google Scholar] [CrossRef]
  16. Lü, X.; Qiao, F.; Wang, G.; Xia, C.; Yuan, Y. Upwelling off the west coast of Hainan Island in summer: Its detection and mechanisms. Geophys. Res. Lett. 2008, 35, 196–199. [Google Scholar] [CrossRef]
  17. Qiao, F.; Yang, Y.; Lü, X.; Xia, C.; Chen, X.; Wang, B.; Yuan, Y. Coastal upwelling in the East China Sea in winter. J. Geophys. Res. Atmos. 2006, 111, C11S06. [Google Scholar] [CrossRef] [Green Version]
  18. Lü, X.; Qiao, F.; Xia, C.; Zhu, J.; Yuan, Y. Tidally induced upwelling off Yangtze River estuary and in Zhejiang coastal waters in summer. Sci. China. Ser. D Earth Sci. 2007, 50, 462–473. [Google Scholar] [CrossRef]
  19. Pan, A.J.; Li, L.; Guo, X.G.; Xu, J.D. A preliminary study of the internal tide in the summertime upwelling regime off the Guangdong shelf edge in 2002 and its local feedback. J. Oceanogr. Taiwan Strait 2012, 31, 151–159. [Google Scholar]
  20. Zhao, H.; Han, G.; Zhang, S.; Wang, D. Two phytoplankton blooms near Luzon Strait generated by lingering Typhoon Parma. J. Geophys. Res. Biogeosciences 2013, 118, 412–421. [Google Scholar] [CrossRef]
  21. Hong, B.; Huang, X.; Liu, S.; Xu, H. Impact of Typhoon on Coastal Upwelling Off The Eastern Hainan Island: A Case Study of Typhoon Rammasun (2014). Front. Mar. Sci. 2022, 9. [Google Scholar] [CrossRef]
  22. Dong, X.; Huang, H.; Zheng, N.; Pan, A.; Wang, S.; Huo, C.; Zhou, K.; Lin, H.; Ji, W. Acidification mediated by a river plume and coastal upwelling on a fringing reef at the east coast of Hainan Island, Northern South China Sea. J. Geophys. Res. Ocean. 2017, 122, 7521–7536. [Google Scholar] [CrossRef]
  23. Gan, J.; Li, L.; Wang, D.; Guo, X. Interaction of a river plume with coastal upwelling in the northeastern South China Sea. Cont. Shelf Res. 2009, 29, 728–740. [Google Scholar] [CrossRef]
  24. McClean-Padman, J.; Padman, L. Summer upwelling on the Sydney inner continental shelf: The relative roles of local wind forcing and mesoscale eddy encroachment. Cont. Shelf Res. 1991, 11, 321–345. [Google Scholar] [CrossRef]
  25. Brannigan, L. Intense submesoscale upwelling in anticyclonic eddies. Geophys. Res. Lett. 2016, 43, 3360–3369. [Google Scholar] [CrossRef] [Green Version]
  26. Hu, J.; Wang, X. Progress on upwelling studies in the China seas. Rev. Geophys. 2016, 54, 653–673. [Google Scholar] [CrossRef]
  27. Shi, W.; Huang, Z.; Hu, J. Using TPI to Map Spatial and Temporal Variations of Significant Coastal Upwelling in the Northern South China Sea. Remote Sens. 2021, 13, 1065. [Google Scholar] [CrossRef]
  28. Xie, L.; Zhang, S.; Zhao, H. Overview of studies on Qiongdong upwelling. J. Trop. Oceanogr. 2012, 31, 35–41. [Google Scholar] [CrossRef]
  29. Jing, Z.; Qi, Y.; Hua, Z.; Zhang, H. Numerical study on the summer upwelling system in the northern continental shelf of the South China Sea. Cont. Shelf Res. 2009, 29, 467–478. [Google Scholar] [CrossRef] [Green Version]
  30. Li, Y.; Peng, S.; Yang, W.; Wang, D. Numerical simulation of the structure and variation of upwelling off the east coast of Hainan Island using QuikSCAT winds. Chin. J. Oceanol. Limnol. 2012, 30, 1068–1081. [Google Scholar] [CrossRef]
  31. Lin, P.; Hu, J.; Zheng, Q.; Sun, Z.; Zhu, J. Observation of summertime upwelling off the eastern and northeastern coasts of Hainan Island, China. Ocean Dyn. 2016, 66, 387–399. [Google Scholar] [CrossRef]
  32. Yang, W.; Guo, X.; Cao, Z.; Su, J.; Guo, L.; Wang, L.; Xu, Y.; Huang, T.; Li, Y.; Xu, Y.; et al. Carbonate dynamics in a tropical coastal system in the South China Sea featuring upwelling, river plumes and submarine groundwater discharge. Sci. China Earth Sci. 2022, 65, 2267–2284. [Google Scholar] [CrossRef]
  33. Bai, P.; Gu, Y.; Li, P.; Wu, K. Modelling the upwelling offthe east Hainan Island coast in summer 2010. Chin. J. Oceanol. Limnol. 2016, 34, 1358–1373. [Google Scholar] [CrossRef]
  34. Su, J.; Pohlmann, T. Wind and topography influence on an upwelling system at the eastern Hainan coast. J. Geophys. Res.-Ocean. 2009, 114, C06017. [Google Scholar] [CrossRef] [Green Version]
  35. Wang, D.; Shu, Y.; Xue, H.; Hu, J.; Chen, J.; Zhuang, W.; Zu, T.; Xu, J. Relative contributions of local wind and topography to the coastal upwelling intensity in the northern South China Sea. J. Geophys. Res. Ocean. 2014, 119, 2550–2567. [Google Scholar] [CrossRef]
  36. Hu, Q.; Chen, X.; Huang, W.; Zhou, F. Phytoplankton bloom triggered by eddy-wind interaction in the upwelling region east of Hainan Island. J. Mar. Syst. 2021, 214, 103470. [Google Scholar] [CrossRef]
  37. Xie, L.; He, C.; Li, M.; Tian, J.; Jing, Z. Response of sea surface temperature to typhoon passages over the upwelling zone east of Hainan Island. Adv. Mar. Sci. 2017, 35, 8–19. [Google Scholar] [CrossRef]
  38. Zheng, M.; Xie, L.; Zheng, Q.; Li, M.; Chen, F.; Li, J. Volume and Nutrient Transports Disturbed by the Typhoon Chebi (2013) in the Upwelling Zone East of Hainan Island, China. J. Mar. Sci. Eng. 2021, 9, 324. [Google Scholar] [CrossRef]
  39. Li, Y.; Curchitser, E.N.; Wang, J.; Peng, S. Tidal Effects on the Surface Water Cooling Northeast of Hainan Island, South China Sea. J. Geophys. Res.-Ocean. 2020, 125, e2019JC016016. [Google Scholar] [CrossRef]
  40. Li, J.; Li, M.; Wang, C.; Zheng, Q.; Xu, Y.; Zhang, T.; Xie, L. Multiple mechanisms for chlorophyll-a concentration variations in coastal upwelling regions: A case study east of Hainan Island in the South China Sea. EGUsphere 2023, 19, 469–484. [Google Scholar] [CrossRef]
  41. Liu, K.K.; Chao, S.Y.; Shaw, P.T.; Gong, G.C.; Chen, C.C.; Tang, T.Y. Monsoon-forced chlorophyll distribution and primary production in the South China Sea: Observations and a numerical study. Deep Sea Res. Part I Oceanogr. Res. Pap. 2002, 49, 1387–1412. [Google Scholar] [CrossRef]
  42. Song, X.; Lai, Z.; Ji, R.; Chen, C.; Zhang, J.; Huang, L.; Yin, J.; Wang, Y.; Lian, S.; Zhu, X. Summertime primary production in northwest South China Sea: Interaction of coastal eddy, upwelling and biological processes. Cont. Shelf Res. 2012, 48, 110–121. [Google Scholar] [CrossRef]
  43. Mahadevan, A. Eddy effects on biogeochemistry. Nature 2014, 506, 168–169. [Google Scholar] [CrossRef] [PubMed]
  44. Kim, T.-W.; Najjar, R.G.; Lee, K. Influence of precipitation events on phytoplankton biomass in coastal waters of the eastern United States. Glob. Biogeochem. Cycles 2014, 28, 1–13. [Google Scholar] [CrossRef]
  45. Li, J.; Li, M.; Wang, C.; Zheng, Q.; Xu, Y.; Zhang, T.; Xie, L. A modeling study of the effects of river runoff, tides, and surface wind-wave mixing on the Eastern and Western Hainan upwelling systems of the South China Sea, China. Ocean Dyn. 2015, 65, 1143–1164. [Google Scholar] [CrossRef]
  46. Shi, H.; Chen, Y.; Gao, H.; Zhao, H. Effects of typhoon and upwelling on Chlorophyll-a distribution in the northeastern coast of Hainan during Summer. PLoS ONE 2023, 18, e0284689. [Google Scholar] [CrossRef]
  47. Deng, S.; Zhong, H.; Wang, M.; Yun, F. On relation between upwelling off Qionghai and fishery. J. Oceanogr. Taiwan Strait 1995, 14, 51–56. [Google Scholar]
  48. Tang, D.; Kester, D.R.; Ni, I.-H.; Kawamura, H.; Hong, H. Upwelling in the Taiwan Strait during the summer monsoon detected by satellite and shipboard measurements. Remote Sens. Environ. 2002, 83, 457–471. [Google Scholar] [CrossRef]
  49. Jing, Z.; Qi, Y.; Du, Y. Upwelling in the continental shelf of northern South China Sea associated with 1997–1998 El Niño. J. Geophys. Res. Ocean. 2011, C02033, 116. [Google Scholar] [CrossRef]
  50. Jing, Z.; Qi, Y.; Du, Y.; Zhang, S.; Xie, L. Summer upwelling and thermal fronts in the northwestern South China Sea: Observational analysis of two mesoscale mapping surveys. J. Geophys. Res. Ocean. 2015, 120, 1993–2006. [Google Scholar] [CrossRef]
  51. Ren, X.; You, Q.; Jing, G.; Zhang, W. Characteristics analysis of current and residual current in the northeastern sea area of Hainan island. Guangxi Sci. 2018, 25, 418–422. [Google Scholar] [CrossRef]
  52. Maritorena, S.; Siegel, D.A. Consistent merging of satellite ocean color data sets using a bio-optical model. Remote Sens. Environ. 2005, 94, 429–440. [Google Scholar] [CrossRef]
  53. Maritorena, S.; d’Andon, O.H.F.; Mangin, A.; Siegel, D.A. Merged satellite ocean color data products using a bio-optical model: Characteristics, benefits and issues. Remote Sens. Environ. 2010, 114, 1791–1804. [Google Scholar] [CrossRef]
  54. Chen, Y.; Zhao, H. Spatial distribution of the summer subsurface chlorophyll maximum in the North South China Sea. PLoS ONE 2021, 16, e0248715. [Google Scholar] [CrossRef]
  55. Zhao, H.; Tang, D.; Wang, S. Spatial distribution of chlorophyll a concentration in summer in western South China Sea and its response to oceanographic environmental factors. J. Trop. Oceanogr. 2005, 24, 31–37. [Google Scholar]
  56. Gao, H.; Zhao, H.; Han, G.; Dong, C. Spatio-Temporal Variations of Winter Phytoplankton Blooms Northwest of the Luzon Island in the South China Sea. Front. Mar. Sci. 2021, 8. [Google Scholar] [CrossRef]
  57. Chen, Y.; Shi, H.; Zhao, H. Summer Phytoplankton Blooms Induced by Upwelling in the Western South China Sea. Front. Mar. Sci. 2021, 8, 740130. [Google Scholar] [CrossRef]
  58. Benesty, J.; Chen, J.; Huang, Y. On the importance of the Pearson correlation coefficient in noise reduction. Ieee Trans. Audio Speech Lang. Process. 2008, 16, 757–765. [Google Scholar] [CrossRef]
  59. Shen, C.; Zhao, H.; Chen, F.; Xiao, H. The distribution of aerosols and their impacts on chlorophyll-a distribution in the South China Sea. J. Geophys. Res. Biogeosciences 2020, 125, e2019JG005490. [Google Scholar] [CrossRef]
  60. Guo, C.; Yu, J.; Ho, T.-Y.; Wang, L.; Song, S.; Kong, L.; Liu, H. Dynamics of phytoplankton community structure in the South China Sea in response to the East Asian aerosol input. Biogeosciences 2012, 9, 1519–1536. [Google Scholar] [CrossRef] [Green Version]
  61. Zhao, H.; Qi, Y.; Wang, D.; Wang, W. Study on the features of chlorophyll-a derived from SeaWiFS in the South China Sea. Acta Oceanol. Sin 2005, 27, 45–52. [Google Scholar] [CrossRef]
  62. Chen, G.; Xiu, P.; Chai, F. Physical and biological controls on the summer chlorophyll bloom to the east of Vietnam. J. Oceanogr. 2014, 70, 323–328. [Google Scholar] [CrossRef]
  63. Xie, L.; Zong, X.; Yi, X.; Li, M. The interannual variation and long-term trend of Qiongdong upwelling. Oceanol. Limnol. Sin 2016, 47, 43–51. [Google Scholar]
  64. Roberts, M.J.; Ternon, J.-F.; Morris, T. Interaction of dipole eddies with the western continental slope of the Mozambique Channel. Deep-Sea Res. Part Ii-Top. Stud. Oceanogr. 2014, 100, 54–67. [Google Scholar] [CrossRef]
  65. Suresh, I.; Vialard, J.; Lengaigne, M.; Izumo, T.; Parvathi, V.; Muraleedharan, P.M. Sea Level Interannual Variability Along the West Coast of India. Geophys. Res. Lett. 2018, 45, 12440–12448. [Google Scholar] [CrossRef]
  66. Jing, Z.; Qi, Y.; Hua, Z. Numerical study on summer upwelling over northern continental shelf of South China Sea. J. Trop. Oceanogr. 2008, 27, 1–8. [Google Scholar] [CrossRef] [Green Version]
  67. Zhao, H.; Wang, Y. Phytoplankton Increases Induced by Tropical Cyclones in the South China Sea During 1998–2015. J. Geophys. Res. Ocean. 2018, 123, 2903–2920. [Google Scholar] [CrossRef]
  68. Liu, Q.; Dai, M.; Chen, W.; Huh, C.-A.; Wang, G.; Li, Q.; Charette, M.A. How significant is submarine groundwater discharge and its associated dissolved inorganic carbon in a river-dominated shelf system? Biogeosciences 2012, 9, 1777–1795. [Google Scholar] [CrossRef] [Green Version]
  69. Dai, G.; Wang, G.; Li, Q.; Tan, E.; Dai, M. Submarine groundwater discharge on the western shelf of the northern South China Sea influenced by the Pearl River plume and upwelling. J. Geophys. Res. Ocean. 2021, 126, e2020JC016859. [Google Scholar] [CrossRef]
  70. Luo, X.; Jiao, J.J.; Liu, Y.; Zhang, X.; Liang, W.; Tang, D. Evaluation of water residence time, submarine groundwater discharge, and maximum new production supported by groundwater borne nutrients in a coastal upwelling shelf system. J. Geophys. Res. Ocean. 2018, 123, 631–655. [Google Scholar] [CrossRef]
  71. Tang, D.; Kawamura, H.; Van Dien, T.; Lee, M. Offshore phytoplankton biomass increase and its oceanographic causes in the South China Sea. Mar. Ecol. Prog. Ser. 2004, 268, 31–41. [Google Scholar] [CrossRef]
  72. Piedras, F.R.; Odebrecht, C. The response of surf-zone phytoplankton to nutrient enrichment (Cassino Beach, Brazil). J. Exp. Mar. Biol. Ecol. 2012, 432, 156–161. [Google Scholar] [CrossRef]
  73. Tang, D.; Kester, D.R.; Ni, I.-H.; Qi, Y.; Kawamura, H. In situ and satellite observations of a harmful algal bloom and water condition at the Pearl River estuary in late autumn 1998. Harmful Algae 2003, 2, 89–99. [Google Scholar] [CrossRef]
  74. Pan, J.; Huang, L.; Devlin, A.T.; Lin, H. Quantification of Typhoon-Induced Phytoplankton Blooms Using Satellite Multi-Sensor Data. Remote Sens. 2018, 10, 318. [Google Scholar] [CrossRef] [Green Version]
  75. Pan, G.; Chai, F.; Tang, D.; Wang, D. Marine phytoplankton biomass responses to typhoon events in the South China Sea based on physical-biogeochemical model. Ecol. Model. 2017, 356, 38–47. [Google Scholar] [CrossRef]
Figure 1. Map of the NSCS (box A), the satellite data sampling area (box B), and the study area (box C).
Water 15 02770 g001
Figure 2. Scatter diagrams of in situ Chl-a (mg·m−3) and satellite Chl-a (mg·m−3). The black line refers to the fitted curve.
Water 15 02770 g002
Figure 3. The time series of Chl-a averaged for the study area from 2009 to 2022. The line in red indicates the monthly climatology of Chl-a (Clim-Chla).
Water 15 02770 g003
Figure 4. Monthly climatology of Chl-a averaged from 2009 to 2022. The red box indicates the study area.
Water 15 02770 g004
Figure 5. Monthly climatology of SST averaged from 2009 to 2022. The red box indicates the study area. The red triangle represents the cold water center. The red arrow indicates the direction of movement of the cold water center.
Water 15 02770 g005
Figure 6. Monthly climatology of EPV averaged from 2009 to 2022. The red box indicates the study area. The arrows superimposed on the figure indicate the direction and size of the wind.
Water 15 02770 g006
Figure 7. Monthly climatology of ET averaged from 2009 to 2022. The arrows superimposed on the figure indicate the direction and size of the wind.
Water 15 02770 g007
Table 1. Pearson correlation coefficient between Chl-a and environmental factors.
ΔSSTSSWETEPV
r−0.521 0.026 0.3160.322
p<0.01>0.10<0.05<0.05
Disclaimer/Publisher’s Note: The statements, opinions and data contained in all publications are solely those of the individual author(s) and contributor(s) and not of MDPI and/or the editor(s). MDPI and/or the editor(s) disclaim responsibility for any injury to people or property resulting from any ideas, methods, instructions or products referred to in the content.