Article

Meandering Flow Filter for Phosphorus Removal as a Component of Small Wastewater Treatment Plants—A Case Study

by
Beata Zawadzka
1,2,
Tadeusz Siwiec
1,
Michał Marzec
1,*,
Krzysztof Jóźwiakowski
1 and
Agnieszka Listosz
1
1
Department of Environmental Engineering and Geodesy, University of Life Sciences in Lublin, Leszczyńskiego 7, 20-069 Lublin, Poland
2
Mirosław Zalewski MONT-SAN, Rogoźnica 75, 21-560 Międzyrzec Podlaski, Poland
*
Author to whom correspondence should be addressed.
Water 2023, 15(15), 2703; https://doi.org/10.3390/w15152703
Submission received: 27 June 2023 / Revised: 24 July 2023 / Accepted: 25 July 2023 / Published: 27 July 2023
(This article belongs to the Section Wastewater Treatment and Reuse)

Abstract

:
Chemical phosphorus removal in wastewater treatment plants can be carried out by precipitation with iron or aluminum salts or by filtering wastewater through a bed of active sorptive material. This work aimed to investigate whether using a meander flow filter filled with the sorption material Rockfos® would improve phosphorus removal efficiency in a selected wastewater treatment plant. Tests were performed under laboratory conditions using a model of a meander flow filter and a similar filter under field conditions at full technical scale. This filter was the final element of a hybrid constructed wetland located in the village of Białka in the municipality of Dębowa Kłoda in southeastern Poland. A laboratory model of a phosphorus removal filter with vertical incomplete baffles forcing a meandering water flow was constructed to determine the hydraulic conditions of the flow. After one year of operation, the filter with horizontal wastewater flow operating at its full technical scale (without meanders) was modified by inserting appropriate baffles that were analogous to those in the laboratory model. The analysis of the hydraulic conditions in the laboratory model showed that, under the assumed conditions, wastewater flows through the filter layer in a laminar motion, so such filters can be modeled using the Kozeny–Carman formula. It was shown that, after approximately a year of operation in a filter operating at full technical scale, before modification, dead spaces formed, thus causing the channel and primarily surface flow of wastewater. The phosphorus removal efficiency during this test period averaged 9.4%. After introducing baffles and forcing meander flow in the filter chamber, the efficiency increased to 40.6%. The results indicate that meander flow filters can improve phosphorus removal efficiency in small wastewater treatment plants.

1. Introduction

Phosphorus is widely recognized as a significant component of water pollution [1]. The presence of phosphorus in surface waters is mainly caused by human activities, including the discharge of untreated or inadequately treated domestic and industrial wastewater directly into aquatic ecosystems [2]. Raw wastewater’s phosphorus comes primarily from fecal matter, food residues, and detergents [1]. It is a nutrient, and its excessive concentration in water causes eutrophication, thereby resulting in the intensive growth of algae and cyanobacteria, the deterioration of water quality, and the imbalance of water ecology [1,3,4]. Therefore, it is crucial to intensify phosphorus removal from wastewater to reduce its negative environmental impact.
Biological and chemical methods are used to remove phosphorus compounds from wastewater [5]. The chemical removal of phosphorus from wastewater in classical treatment plants is carried out by precipitation with PIX (the trade name of a coagulant based on iron III sulfate), PAX (trade name of a coagulant based on polyaluminium chloride), lime, or other similarly acting chemicals of hardly soluble salts, as well as the removal of phosphorus by the formation of struvite, hydroxyapatite, etc. [6,7]. It provides an opportunity to conduct phosphorus recovery [8,9] for agricultural use. The use of sludge from wastewater treatment plants for phosphorus recovery is vital, since its reserves in nature are small and are decreasing significantly [10].
Another way to chemically remove phosphorus from wastewater is to filter it through an active filter bed [11,12], which, using sorption [13] and ion exchange processes, retains phosphorus primarily in the form of phosphates. This method of phosphorus removal is used in wastewater treatment plants at the end of the process line when the wastewater is already free of organic pollutants. In the literature, one can find publications in which various minerals and reactive materials were studied [14,15,16,17,18,19,20,21,22]. Among them, carbonate–silica rock (ophiolite) has also been mentioned as a sorbent with a high capacity to absorb phosphorus [12,18,23,24,25].
Opoka is a transition rock between carbonate and siliceous that is mainly formed from fine organic debris. In the inhomogeneous structure of the bed, there are remains of fragmented organic detritus, especially bivalves and borers, as well as numerous sponge needles [23,24,26]. Opoka is divided into heavy opoka containing a higher mass proportion of calcium carbonate and light opoka with a predominance of silica (SiO2) [24]. Heavy opoka is better suited for removing phosphorus, especially those amounts fired at approximately 900 °C, as they become more reactive due to the formation of calcium oxide. Considerable research has been devoted to natural and calcined opoka forms [23,24,27,28].
The use of opoka and its derivatives as sorbents on a full technical scale is currently limited to small wastewater treatment plants, mainly those constructed in wetland in southeastern Poland [18,29,30,31]. Due to its availability, a material with the trade name Rockfos®, which is produced for wastewater treatment, is becoming more widely used in this area. It is produced by decarbonizing (high-temperature firing) the opoka, thereby making it a much more reactive material toward phosphorus than natural opoka [32]. Laboratory studies indicate that, with this material and a sufficiently long contact time, it is possible to remove more than 90% of the total phosphorus from wastewater [12]. In contrast, preliminary studies conducted on a full technical scale have shown a phosphorus removal efficiency of about 40% [18]. The efficiency of phosphorus sorption depends mainly on the flow conditions and the contact time of the wastewater with the sorption material; hence, the plants in operation are most often in the form of chambers with the forced vertical sewage flow through the filter bed [18]. It is possible to use filters in the shape of longitudinal troughs with a horizontal flow. However, in this case, regardless of the method of wastewater supply, there is a risk of specific flow paths limiting the effective use of the entire volume of the filter fill, which may result in a reduction in the efficiency of phosphorus removal from the wastewater. However, there is a lack of research on the practical application of rock-filled filters with horizontal wastewater flows in the filter chamber.
This study aimed to investigate whether using a meander flow filter filled with modified carbonate–silica rock (Rockfos®) would improve the efficiency of phosphorus removal in a selected wastewater treatment plant. The solution’s novelty lies in using vertical baffles in the longitudinal filter to force the meander flow of the wastewater and increase the flow path and contact time of the wastewater with the filter material. The study involved analyzing flow conditions in a laboratory model and then evaluating its phosphorus removal efficiency under real-world conditions after fabricating a full-scale filter.

2. Materials and Research Methods

2.1. Characteristics of Rockfos® Material

The Rockfos® material used in the study was produced from an opoka rock quarried near Piaski in Lublin Province. The material was formed by heat treatment of the rock at 900 °C. The material was subjected to analysis of the elemental composition of the substance by measuring characteristic radiation spectra—specifically, X-ray fluorescence. An XRF MiniPal 4 spectrometer from PANalytical (Malvern, UK) was used in the study. The weight % of elements and compounds in the test material was determined. It was characterized by a CaO content of 43.336% by weight and a SiO2 content of 36.047% (Table 1). The composition of Rockfos® material also had a significant share of Al2O3—approximately 6% by weight. Other compounds were present in small amounts, less than 3% by weight (Table 1). The granulation of the material was 2–5 mm. Rockfos® material has a porosity of 54%. The reaction of the material is alkaline, and its pH is 11–12 [18,32].

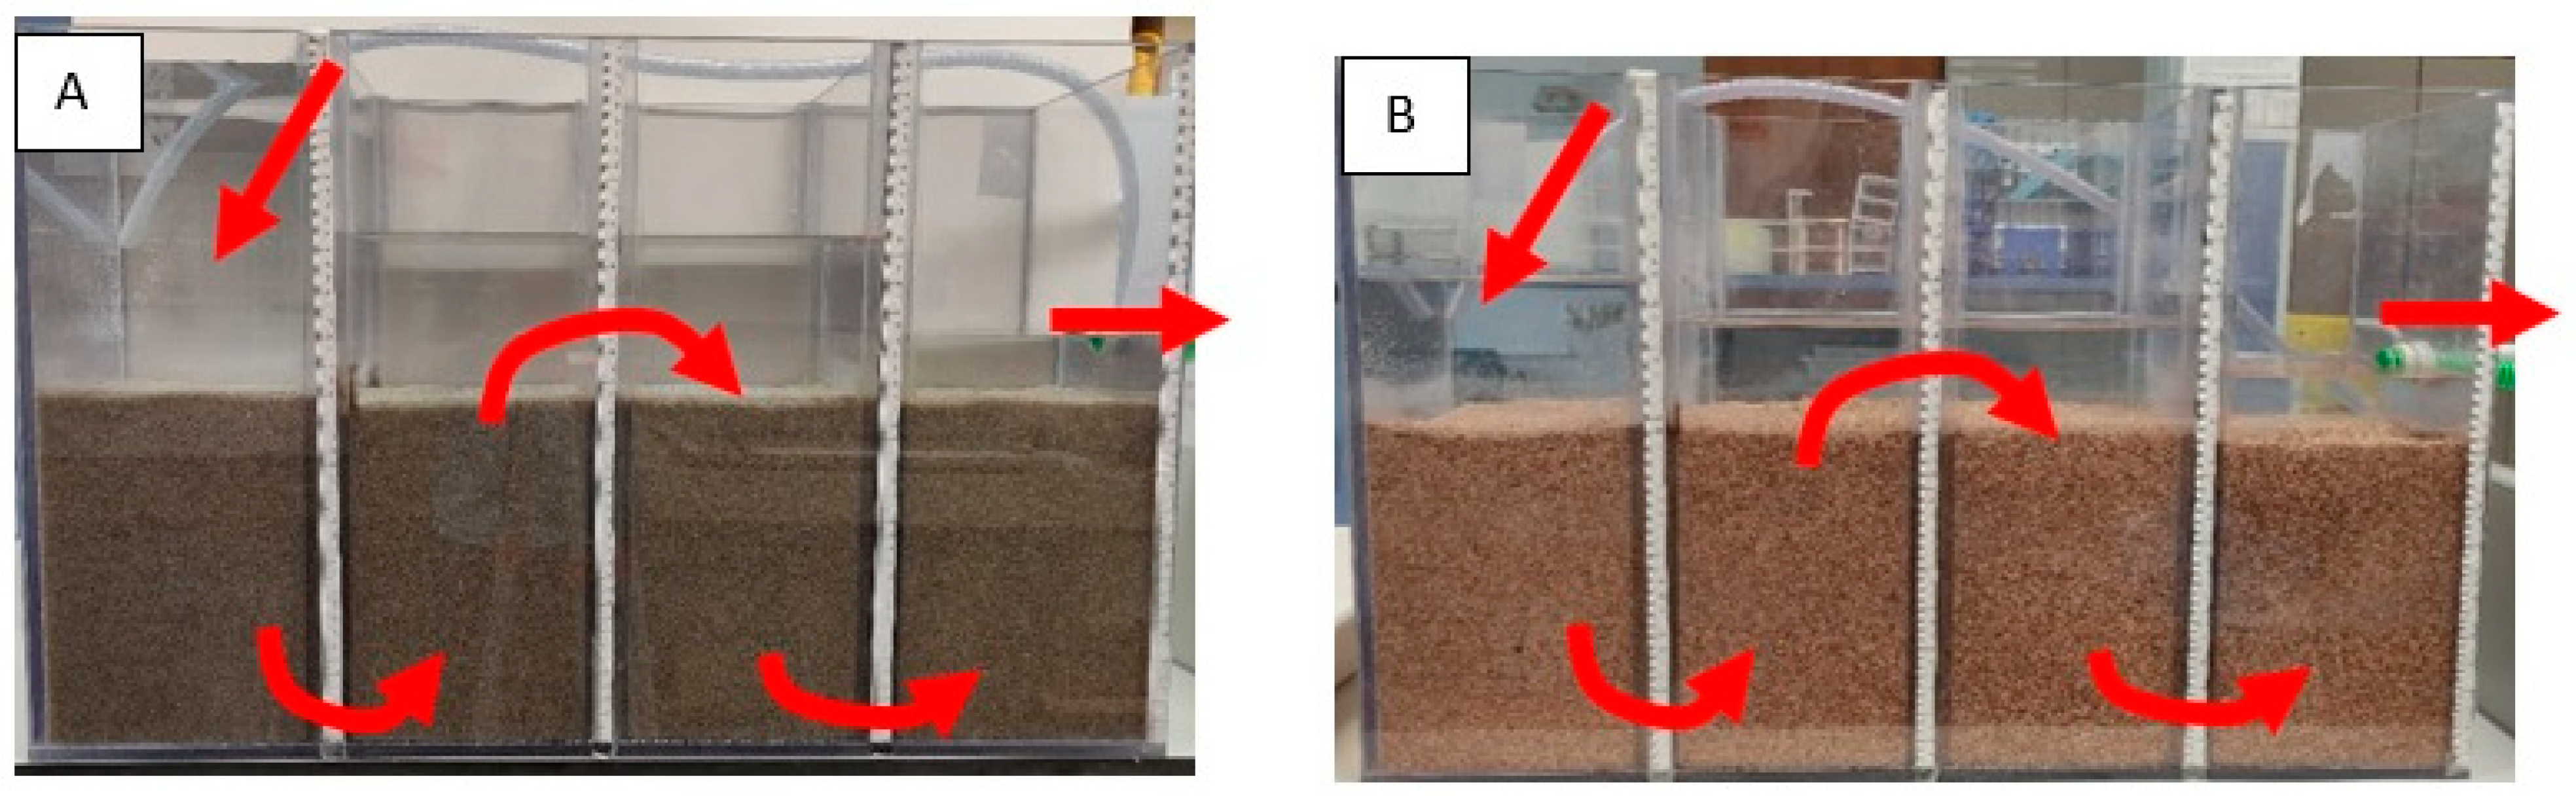
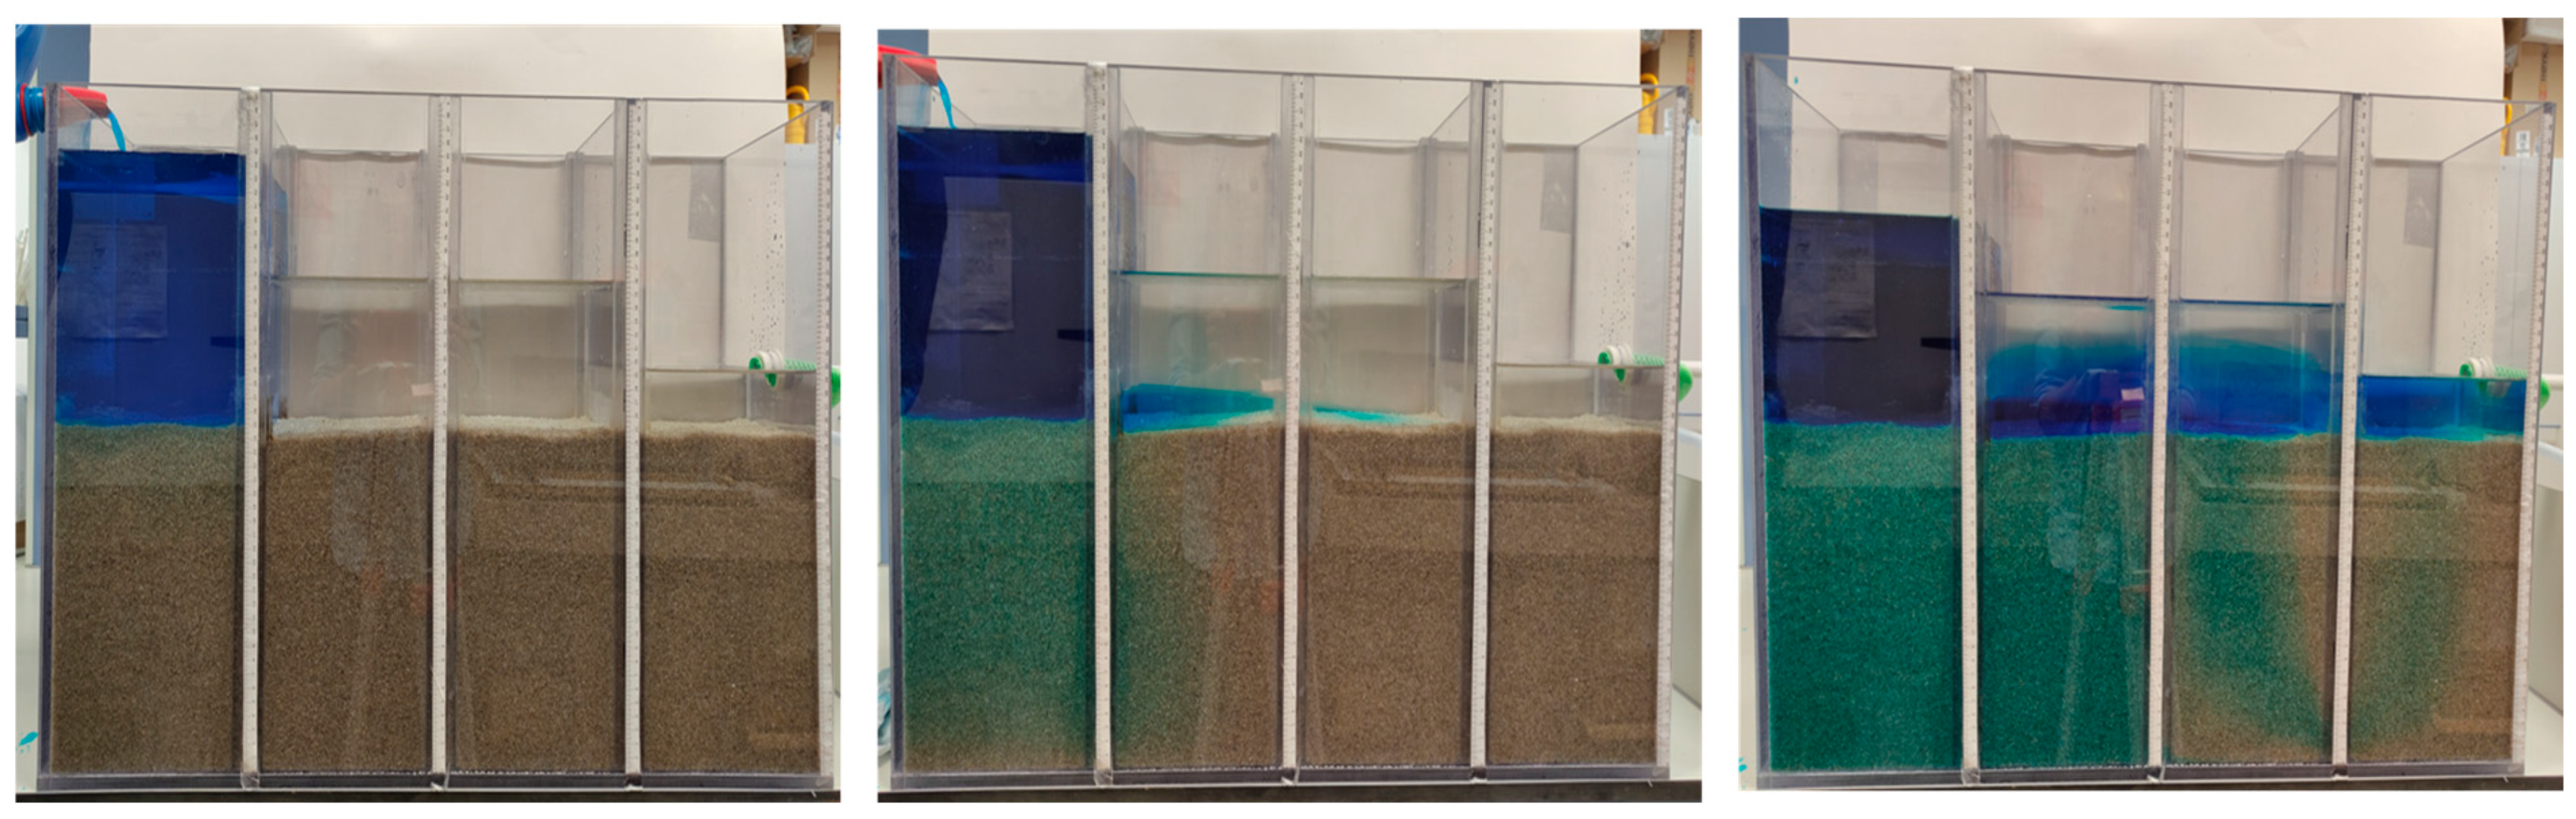
2.2. Construction of the Laboratory Model

For the hydraulic and technological analysis of opoka filters, a laboratory-scale stand shown in Figure 1 was built.
The filter model was made in the form of a rectangular tank with the following dimensions: length—0.80 m, width—0.20 m, and height—0.50 m (Figure 1). The tank was made entirely of sheets of transparent plastic (PLEXI). The interior of the tank was divided by 3 partitions into 4 chambers with dimensions (length/width) of 0.20 m × 0.20 m. The partitions between chambers A, B, C, and D were installed 0.05 m above the bottom of the tank and reached the top edge. The baffle between chambers B and C reached from the bottom of the tank to a height of 0.25 m. The connections of the baffles to the bottom and sidewalls of the tank were constructed to be airtight. At the rear wall of the tank, at a height of 0.30 m, a drain hole with a diameter of 25 mm was made. All tank chambers were filled to a height of 0.25 m with filter material (sand and Rockfos®) for the experiments. The supply of water to the model during the hydraulic tests was through chamber A, from which the water flowed, in turn, through chambers B, C, and D up to the outflow hole. The division of the tank into chambers and the arrangement of baffles forced the water to flow in a meandering manner, in chambers A and C—down the filter bed, in chambers B and D—moving upward. The appearance of the stand during operation with the sand bed and Rockfos® rock is shown in Figure 2.

2.3. Laboratory Model Testing Methodology

The purpose of the laboratory model tests was to determine the hydraulic conditions of water flow through the meander–flow bed to determine the relationship between the water flow rates and the water layer heights in chambers A and D. This relationship is essential in designing the volume and height of the walls concerning the height of the bed. This relationship is essential in adjusting the filter’s capacity for the requirements of a particular wastewater treatment plant as a filter for phosphorus removal.
Quartz sand was used as a reference level, because it is a mineral with well-defined filtration conditions [33]. In classical modeling of filtration conditions, flow through porous material is described by Ergun’s Formula (1) as a universal solution, including laminar, transient, and turbulent motion:
H L = k 1 · μ · 1 ε 0 2 ρ f · g · ε 0 3 · 6 ψ · d z 2 · V + k 2 1 ε 0 g · ε 0 3 · 6 ψ · d z · V 2 ,
where:
H—height of pressure loss differences in the height of water tables in adjacent chambers;
L—bed layer height;
k1 and k2—respective constants of 150/36 and 1.75/6 [34,35];
µ—dynamic viscosity coefficient of water, dependent on temperature;
ε0—bed porosity in a stable state (without flow);
g—gravitational acceleration;
ρf—water density;
ψ—sphericity of the bed grains;
dz—equivalent diameter of bed grains: d z = d m a x · d m i n ;
V—velocity of water through the bed: V = Q F ;
Q—flow rate;
F—crosssectional area to the direction of water flow.
Ergun’s formula consists of two members. The first member is a linear function of filtration velocity V and refers to laminar flow, and the second member is a quadratic function of filtration velocity V2 that refers to turbulent flow. The limits of each flow type are determined by the Reynolds number described by Equation (2) [36,37]:
R e = v · d e q · ρ μ
where v is the flow velocity through the filter calculated as the ratio of the liquid flow rate to its crosssectional area, deq is the equivalent diameter of the bed grains, ρ is the density of water, and μ is the dynamic viscosity coefficient. Water flows through the porous material with laminar motion if R < 6, with transitional motion if 6 < Re < 300, and with turbulent motion if Re > 300 [38].
In practice, filtration conditions rarely correspond to turbulent motion. As a rule, either laminar motion (Reynolds number Re < 6) or transient motion (Re > 6) at which there is no clear dominance of either a laminar or turbulent flow [38]. If there is laminar motion in the filter under study, that is, at low values of Re, the Kozeny–Carman formula given below is used (3):
H L = 180 · μ · 1 ε 0 2 ρ f · g · ε 0 3 · 1 ψ · d z 2 · V
In the first stage of hydraulic testing, the laboratory model was filled with a quartz strip with a grain diameter of 1.0–1.6 mm. The tests measured the height of the water tables in each model part as a function of the water flow rate. The water flow conditions through the filter layers in each model chamber were analyzed at water flow rate levels ranging from 0.023 to 0.096 m3/h.
The study of each flow rate variant followed the same procedure. It first included establishing the inflow rate into the model at a preset level. Stabilizing the level of the water table in each chamber of the model meant equalizing the flux of water flowing into and out of the model. Once the water tables in each chamber were stabilized, readings of their heights were taken using meters mounted on the model’s walls. After the height readings of the water tables were taken, the water flow rate was measured again using a measuring cylinder. The measurement was performed for 5 repetitions, and the arithmetic mean was calculated for further calculations. The same procedure was followed to test further variants regarding the water flow rate.
In the second stage of testing, the bed in the model was replaced. Crushed Rockfos® material with a 1.0–1.6 mm granulation, the same as the sand tested in the first stage, was used as the fill. The height of the filter bed was also identical—0.25 m. The difference between the sand and the Rockfos® material was the bed’s different grain shapes and porosity [39], thus resulting from different sourcing sources. Sand is a natural component of the environment that shows a shape close to being spherical [33], while Rockfos® is a fossil rock created by being crushed and burned. After preparing the model, the relationship between the heights of the water tables in the various chambers of the model and the water flow ratex were analyzed using the same procedure as in the first stage of the experiment. Six variants of the water flow rate were analyzed. The results of the measurements were compared with those obtained for quartz sand.

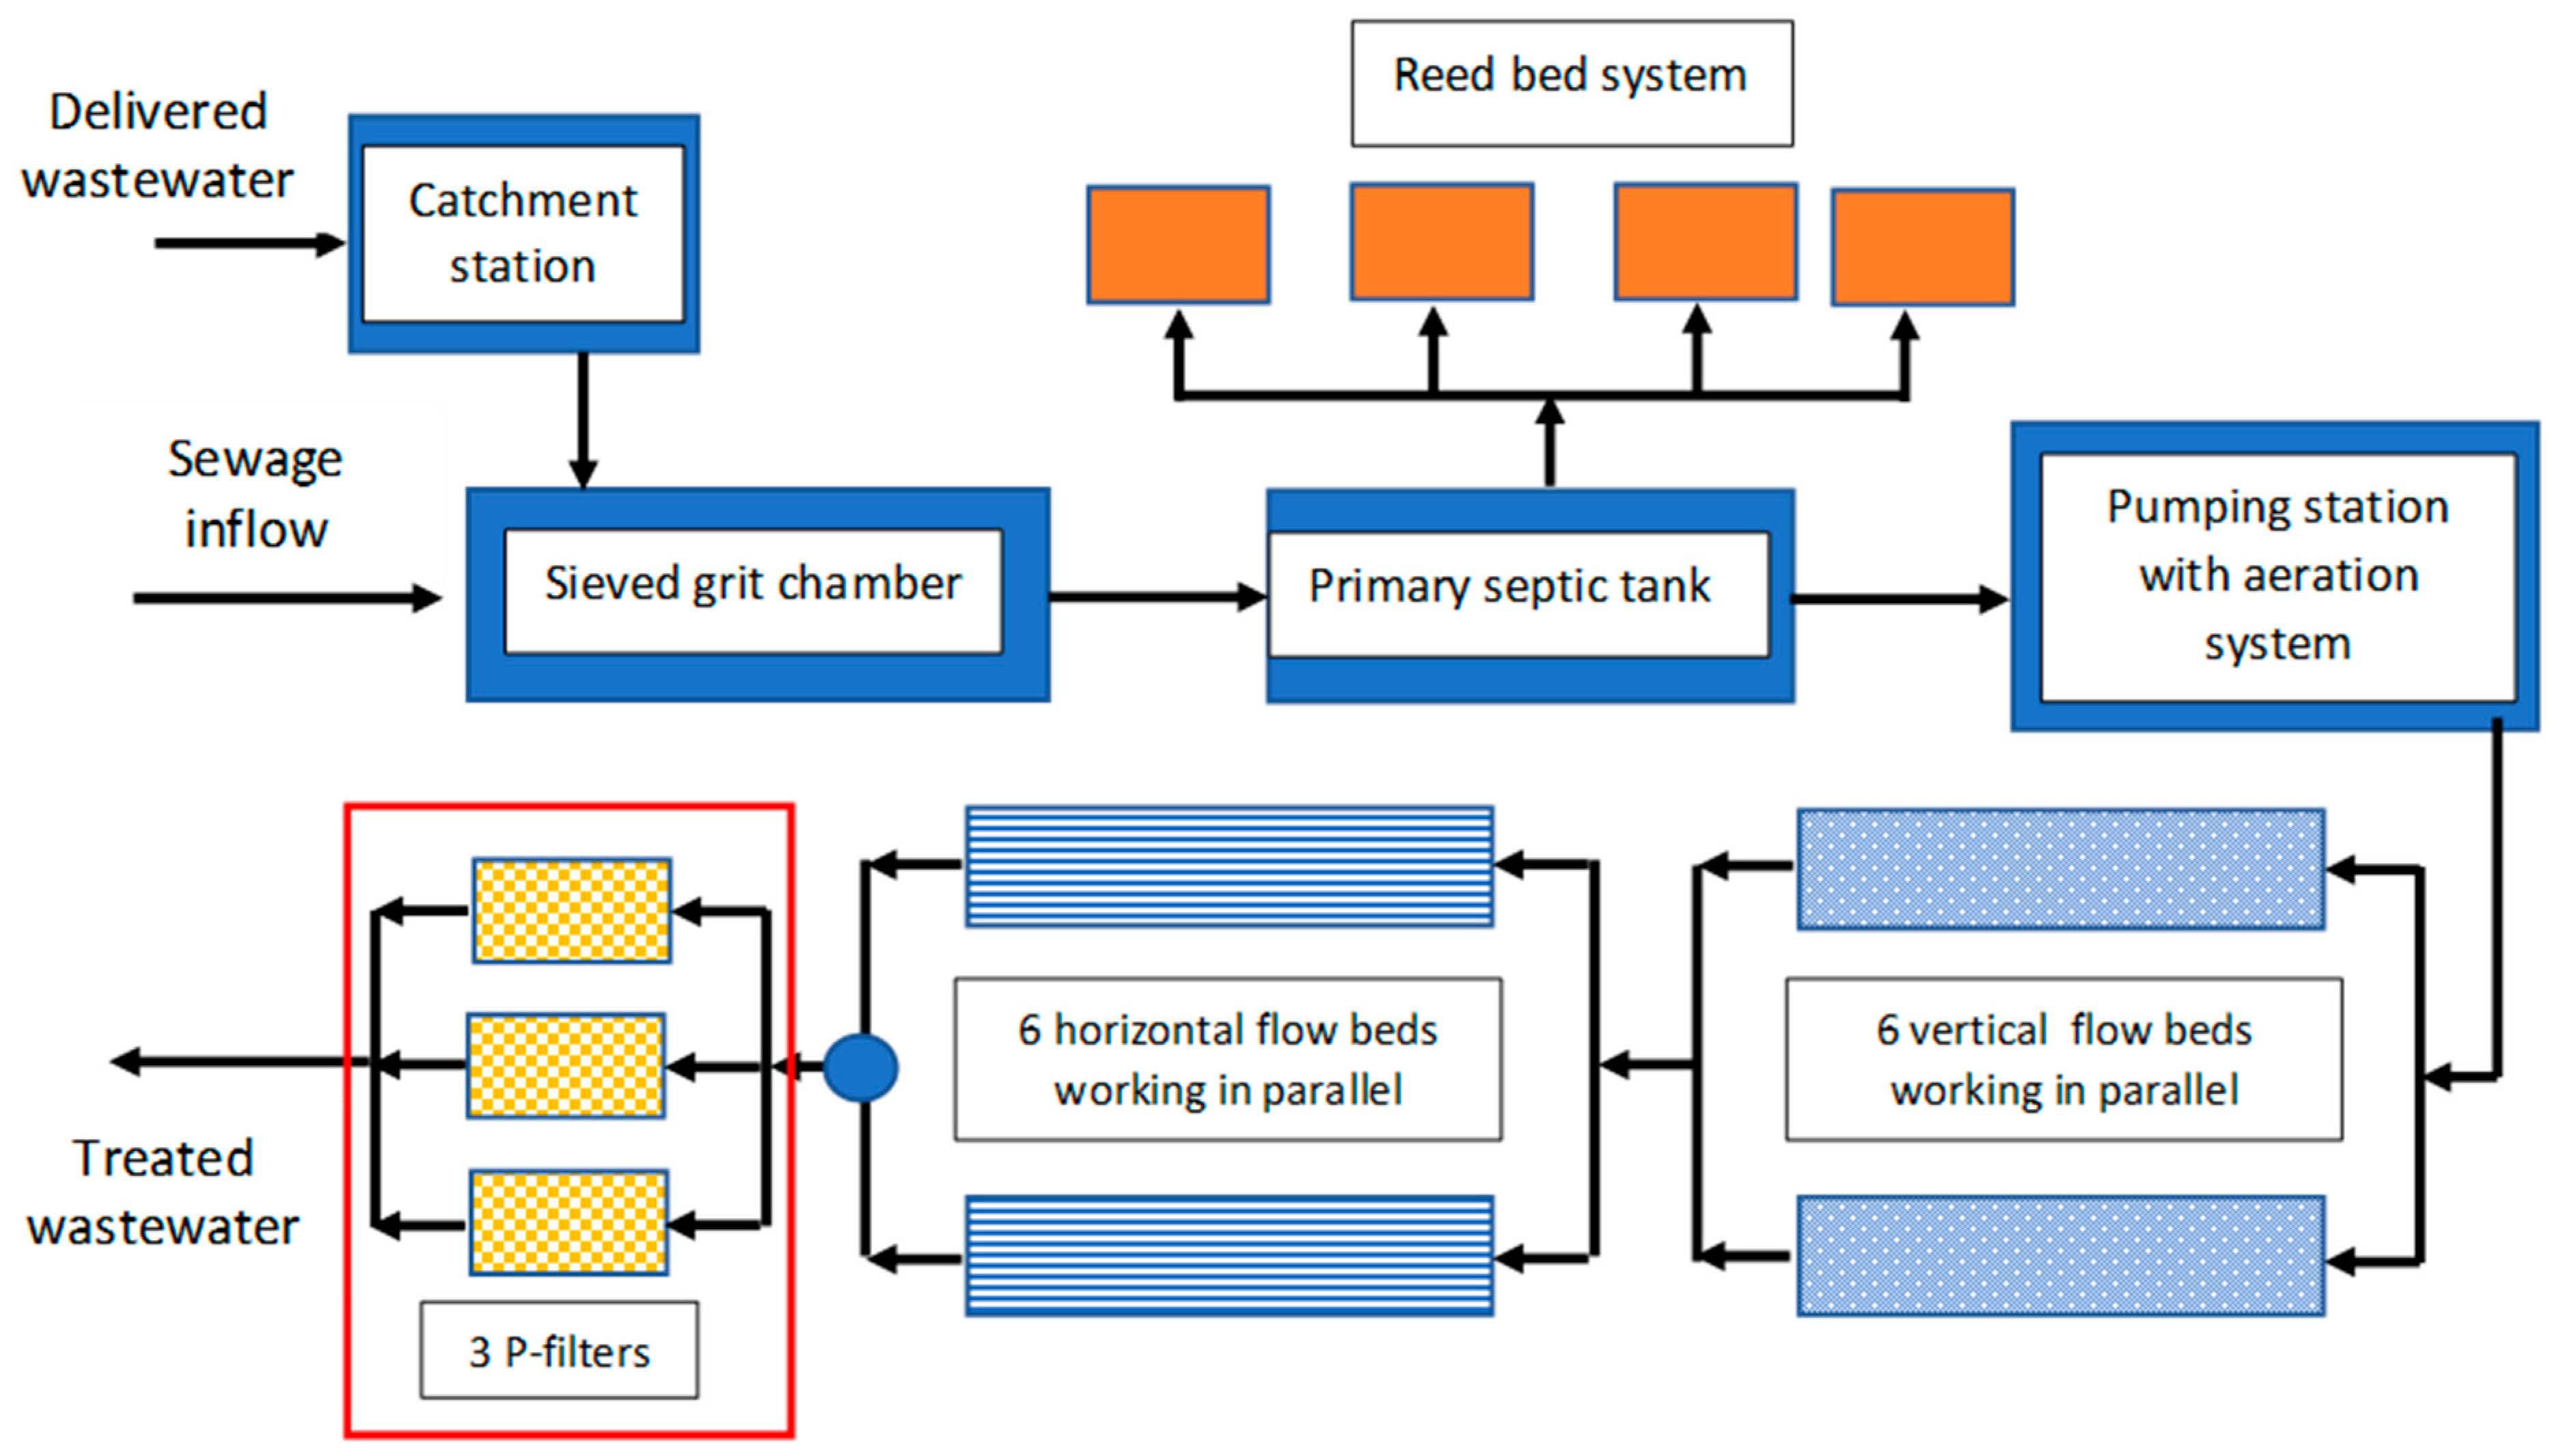
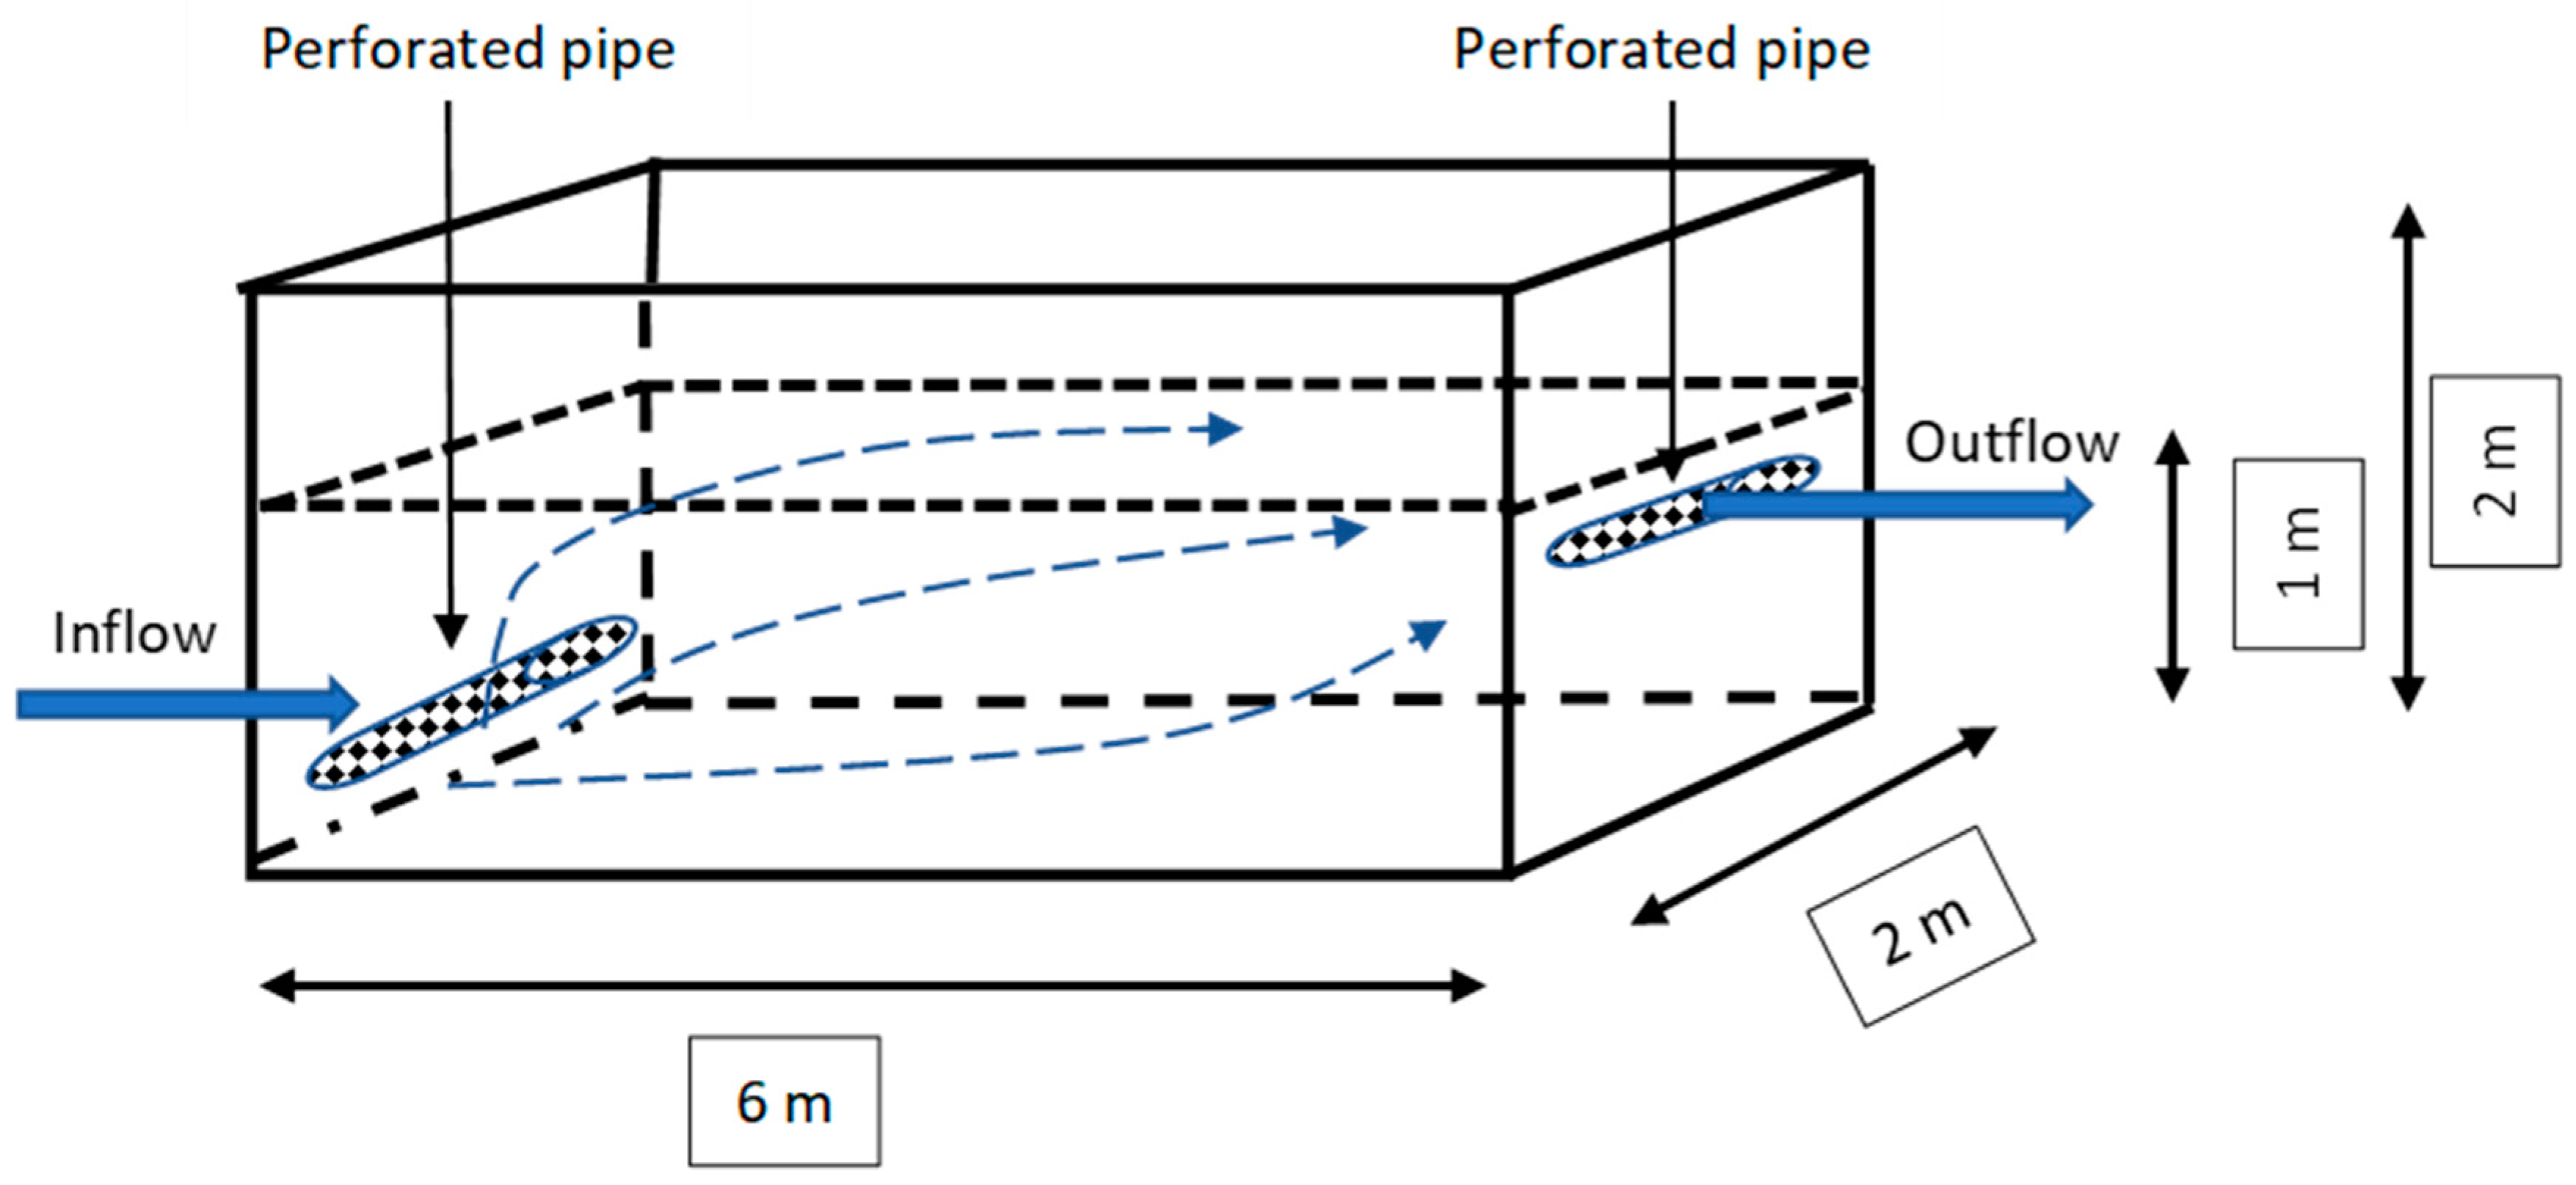
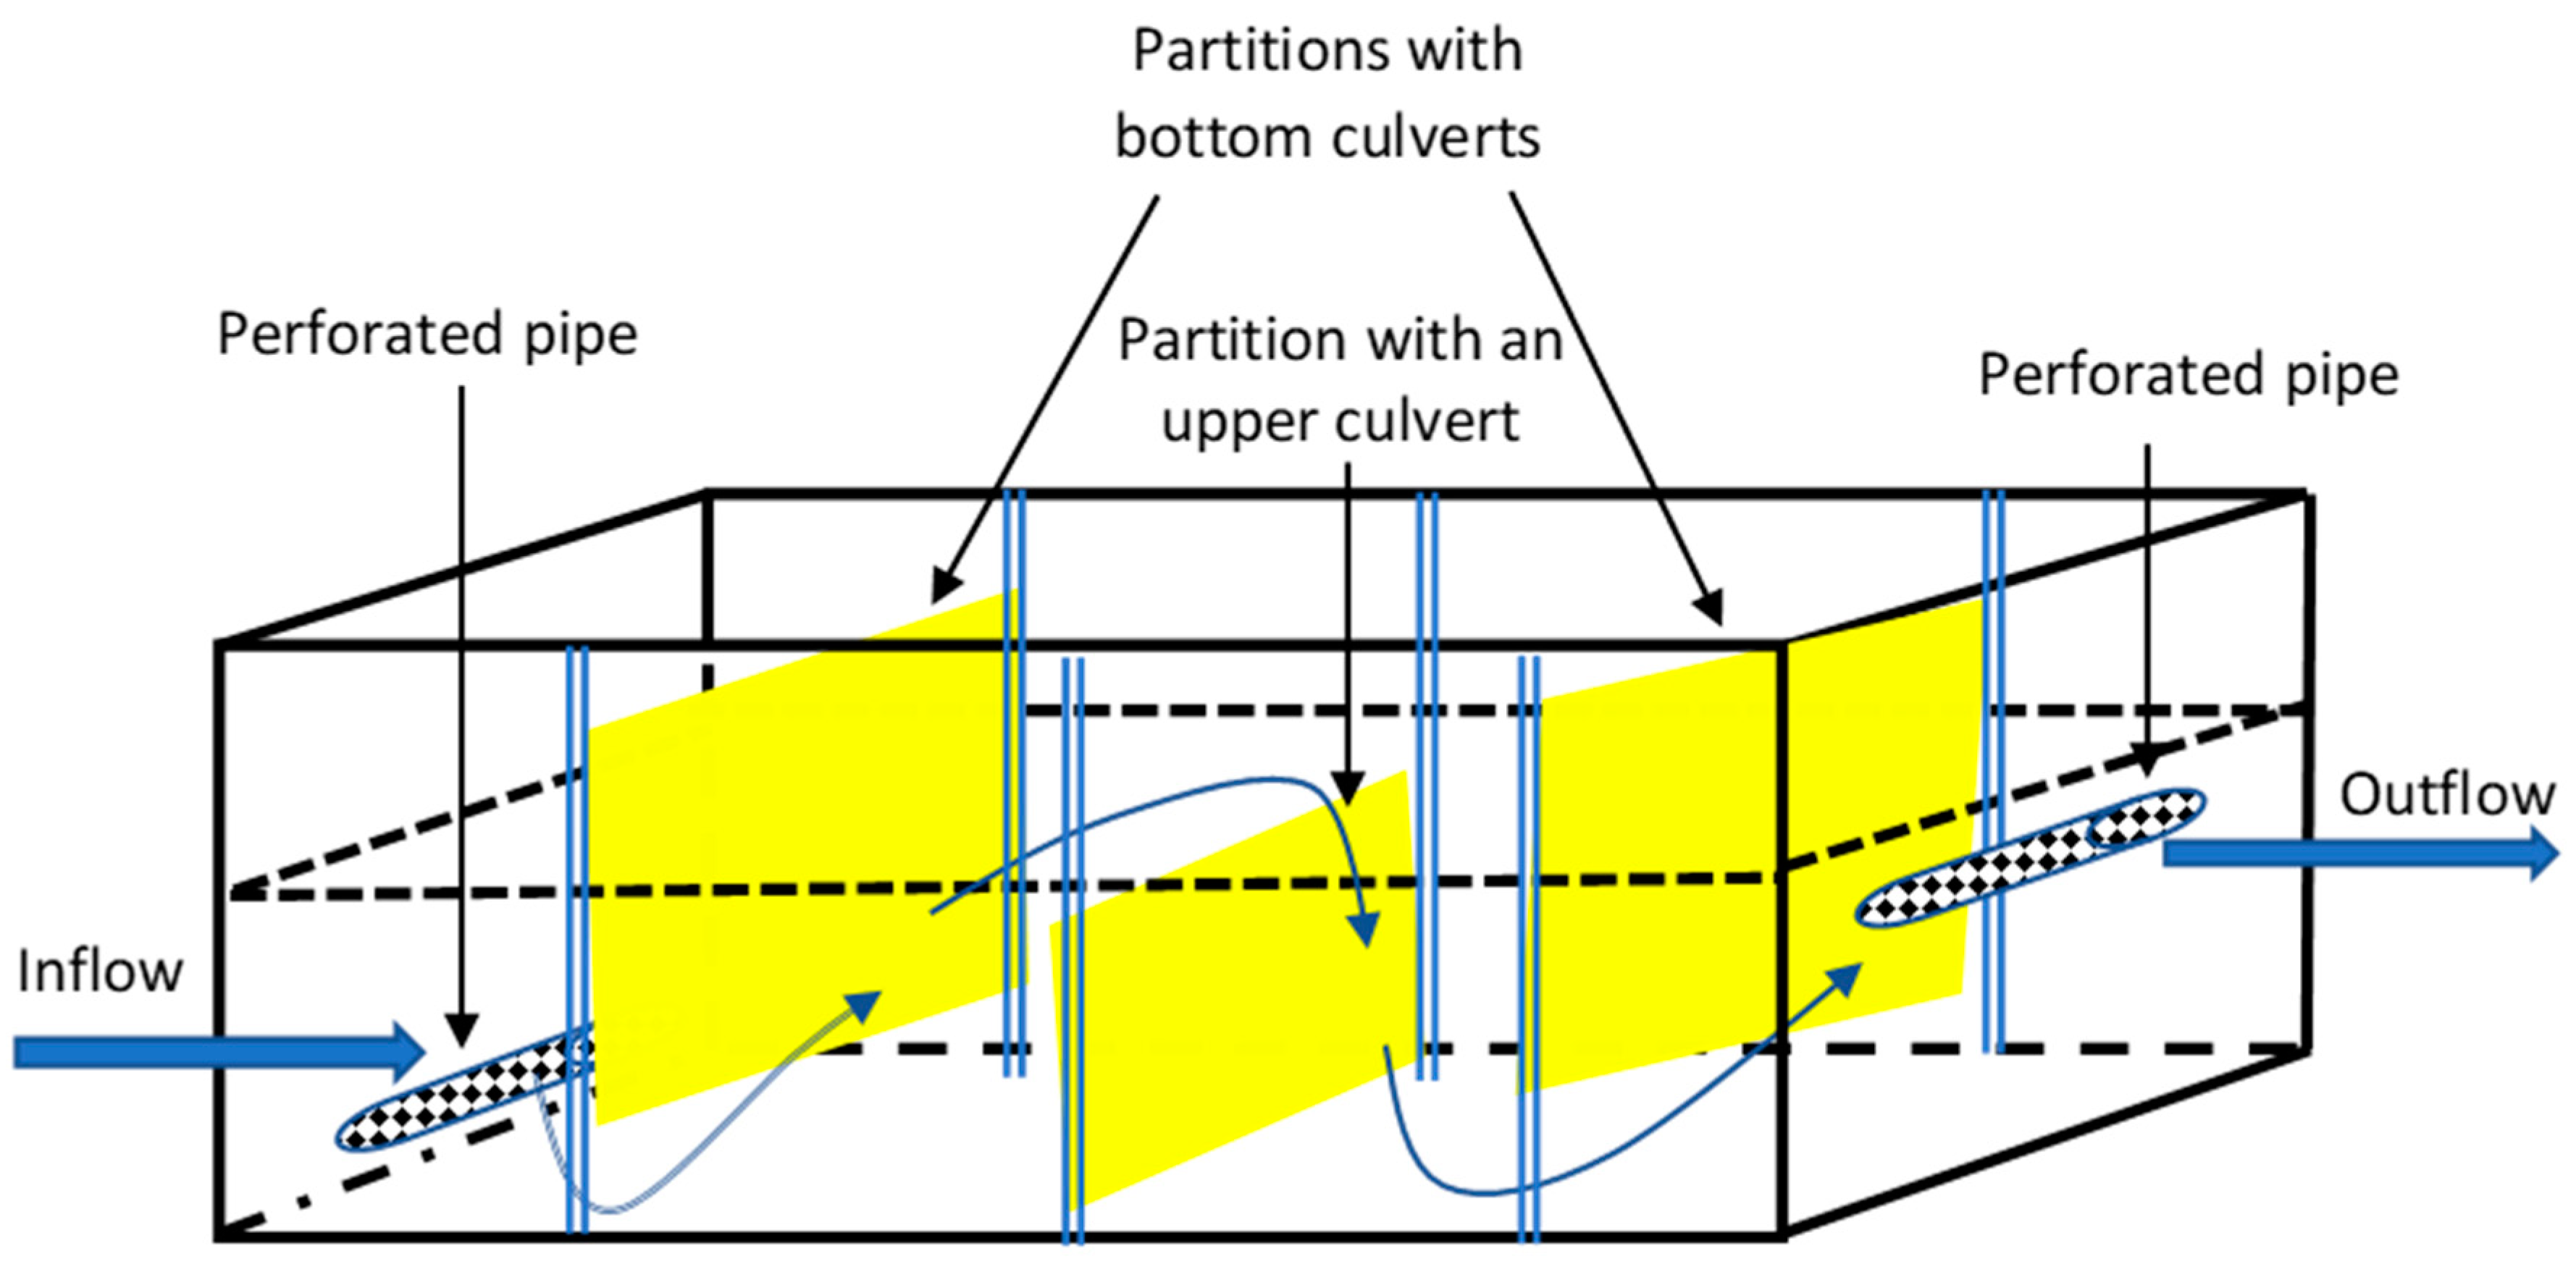
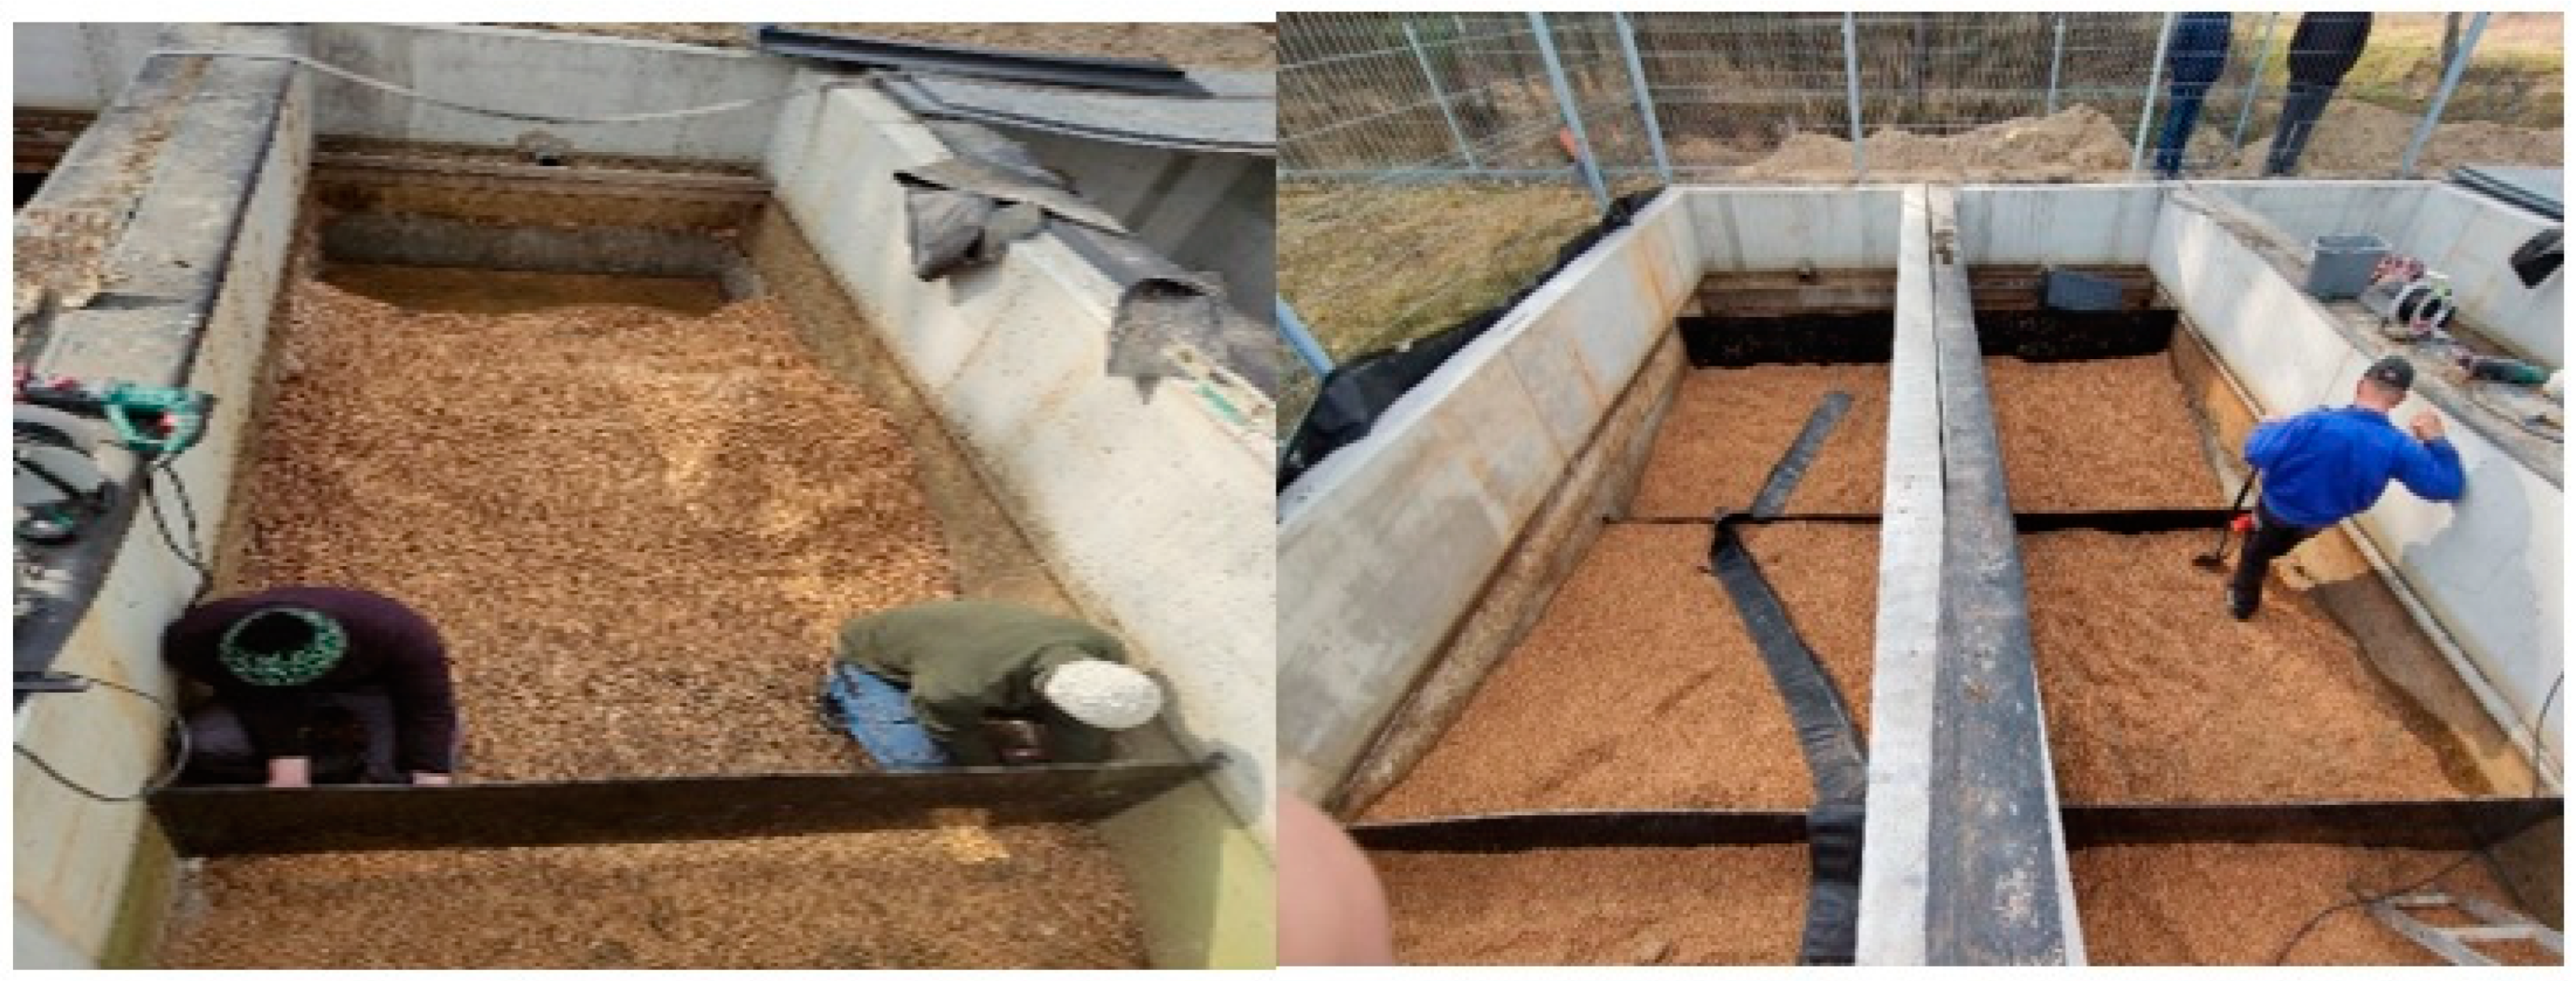
2.4. Construction of a Full-Scale Technical Filter

The main assumptions of the design of the laboratory model, i.e., the layout of the baffles, the proportions of the dimensions, and the height of the beds, were also applied to the full technical scale of the wastewater treatment plant operating in the village of Białka in southeastern Poland (Dębowa Kłoda commune) (51°32′06″ N 23°00′21″ E). The wastewater treatment plant is designed to dispose of domestic sewage flowing in through the sewer network from the village of Białka and sewage delivered by a septic tank fleet from no-outflow tanks. The average capacity of the treatment plant is 180 m3/d. The wastewater treatment process uses 6 hybrid ground-plant bed systems with vertical and horizontal wastewater flows. The technological system of the wastewater treatment plant also uses 3 filters to remove phosphorus from biologically treated wastewater before it is discharged into a receiving water body (Figure 3).
Filters for removing phosphorus from wastewater are in the shape of rectangular tanks made of reinforced concrete construction. Each tank had the following dimensions: length—6.0 m, width 2.0 m, and height 2.0 m. They were filled with Rockfos® material with granulation of 2.0–5.0 mm, and the height of the filter bed was 1.0 m (Figure 4). The wastewater inflow to each tank is carried out by perforated pipes at the bottom of the front wall. The outflow of treated wastewater to the receiver is located at the rear wall of each tank at a height of approximately 1.0 m above the bottom.
According to the design guidelines, the wastewater pressure fed to the filters flowed through the entire fill layer to the outflow overflow. During one year of operation, it became apparent that the filters were not eliminating phosphorus from the wastewater, which may have been related to the nature of the wastewater flow. The large mass of the filter beds most likely formed channels through which the wastewater flowed rapidly with limited contact with the Rockfos® grains (Figure 4). After more detailed observation and analysis, it was observed that the wastewater, after entering the bed through perforated pipes, flowed upward rather quickly and then flowed up the upper layers of the filter bed or even partially along the bed’s surface up to the outlet wall.
Therefore, modifications were made to the design of the filters. Three cross-baffles were installed in each filter. The first baffle was installed at a distance of 1.0 m from the front (inlet) wall, the second at 3.0 m, and the third at 5.0 m. The same assumptions were used in the laboratory model when installing the baffles. The first and third baffles were installed 0.4 m above the bottom of the tank, with their upper edge reaching above the wastewater table. The second baffle was installed near the bottom, and its height was 0.6 m (Figure 5).
A view of one of the filters during the installation of the baffles is shown in Figure 6. Installing the baffles resulted in a forced meander flow of wastewater between the inlet and outlet (Figure 5). Lengthening the flow path and forcing changes in the direction and velocity (varying crosssectional areas of the wastewater stream) were expected to result in prolonged contact between the wastewater and the bed (Rockfos® material) that would consequently increase the effects of phosphorus removal from the wastewater.

2.5. Analytical Methods and Statistical Analysis

Analysis of the removal of total phosphorus during the flow of biologically treated wastewater through filters filled with Rockfos® material, that is, full-scale technical analysis, was carried out based on the study’s results, which were collected in 2020–2022. Wastewater samples were analyzed monthly at two points: at the inlet to the filters with a Rockfos® bed and at the outlet from the filters (Figure 3). A total of 24 measurement series were performed: 16 in the period before the modification of the filter design and 8 series after the modification of the filters.
The pH and total phosphorus concentration were determined in the wastewater samples. The pH was determined using an ORION Star A329 meter (Thermo Scientific, Waltham, MA, USA). Total phosphorus was determined by a spectrophotometric method with oxidation of the test sample in a thermoreactor at 120 °C for 30 min. Measurements were made with a NANOCOLOR® UV–VIS spectrophotometer (Macherey-Nagel, Düren, Germany). The sampling, transport, and processing of samples and their analysis were performed following Polish standards (PN-ISO 5667-10:2021-11 [40]; PN-EN ISO 6878:2006 [41]; PN-EN ISO 10523:2012 [42]).
To correctly highlight the results, selected statistical measures were calculated: the mean, median, standard deviation, coefficient of variation defined as the ratio of the standard deviation to the mean, and maximum and minimum values.
Based on the average phosphorus concentrations in the influent (Cin) and effluent from the beds (Cout), the average phosphorus removal efficiency (η) was calculated according to the following Formula (4):
η = 100 1 C o u t C i n   [ % ] .

3. Results and Discussion

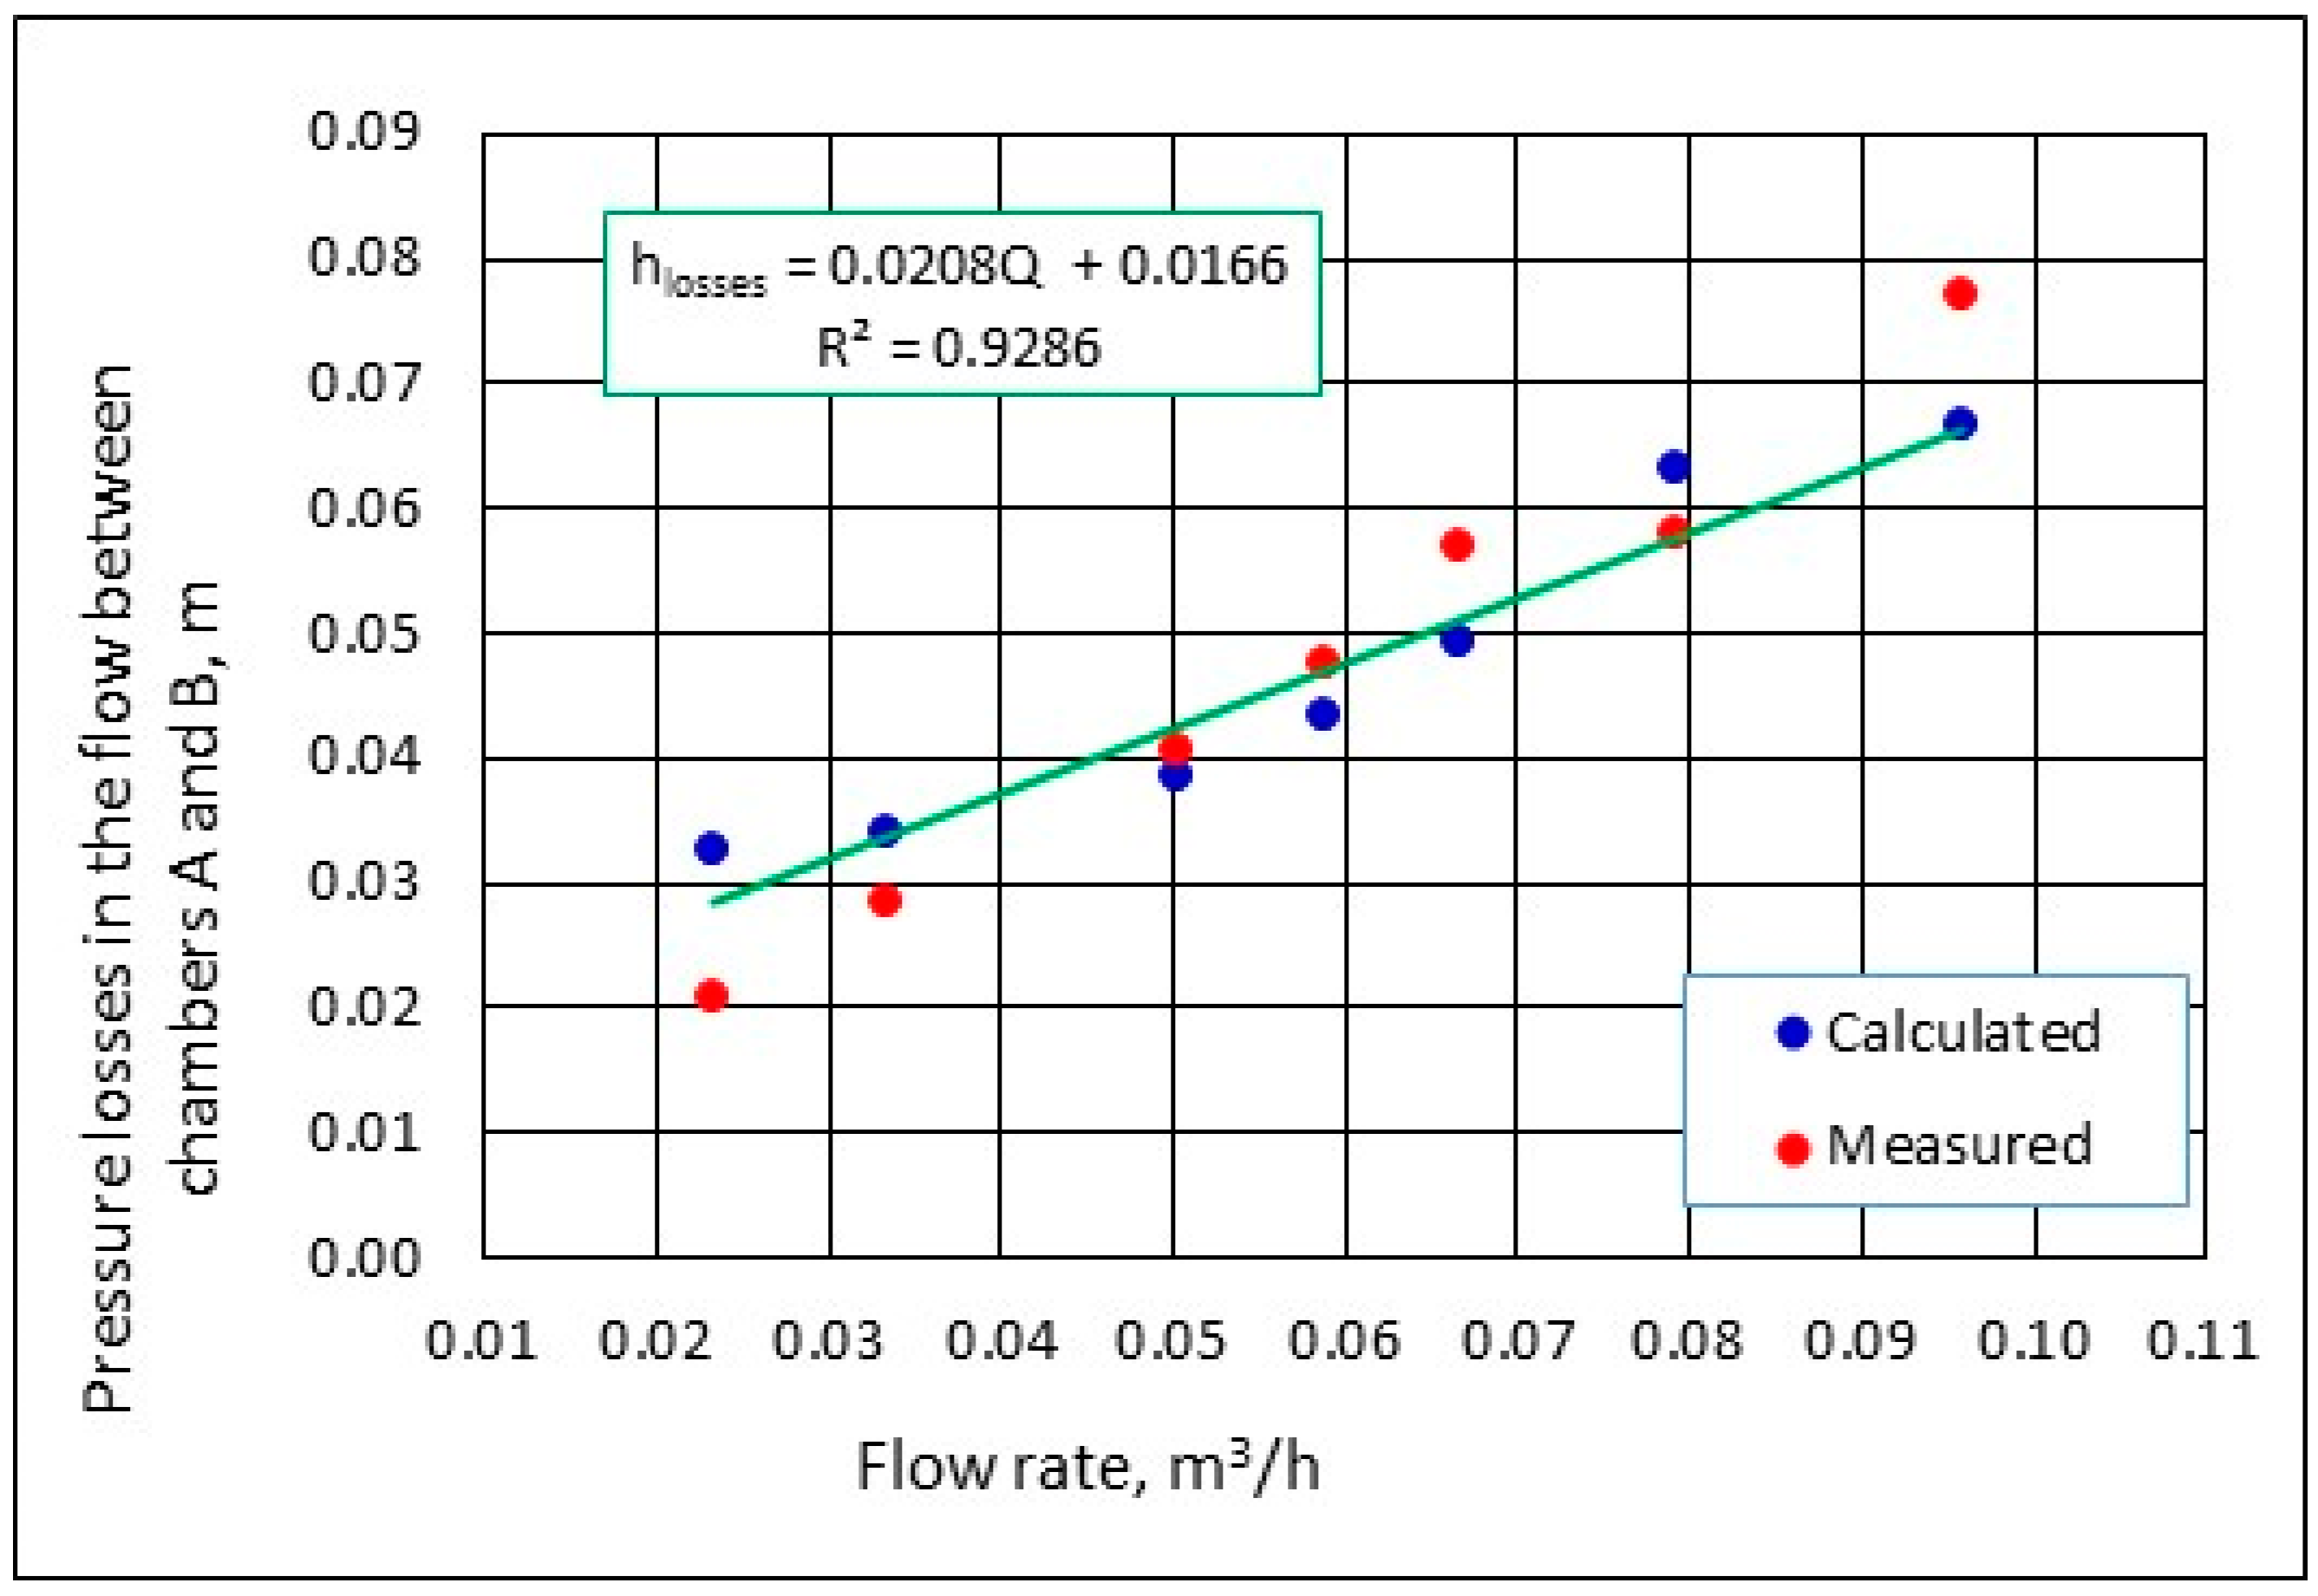
3.1. Hydraulic Flow Conditions through the Bed in a Laboratory Model

The results of the flow rate and water table heights “a”, “b”, and “c” are shown in Table 2.
The flow velocity was constantly changing during the flow of water through the bed in the laboratory model. It was due to changes in the crosssectional area. Initially, water flows down the entire crosssectional area of chamber A equaled to 0.04 m2 (0.2 m × 0.2 m) and then narrowed so that, at the bottom, it flowed through an opening under the baffle of 0.01 m2 (0.2 m × 0.05 m). After entering chamber B, it flowed upward, which increased the crosssectional area to 0.04 m2. The pressure loss for such water movement as a function of the flow rate through the sand is shown in Figure 7, and that through the Rockfos® is shown in Figure 8. Because of the continuous changes in the crosssectional area and, thus, the continuous changes in the velocity, the horizontal axis was dimensioned as the flow rate rather than the velocity. In Figure 7 and Figure 8, the blue points indicate those flow rates calculated using Ergun’s Formula (1), which assumed that, initially, over a length of 15 cm, the water flowed through an entire crosssectional area and then the flow narrowed, thus flowing through smaller and smaller crosssectional areas. For calculating the pressure losses, successive layers with a height of 1 cm were assumed, and the calculated crosssectional area was the field in the middle of each layer. The total pressure loss calculated in this way was related to the differences in the water levels in the adjacent chambers. The method of the procedure is shown in Figure 9.
The total pressure loss imaged by the difference in water tables between chambers A and D as a function of the flow rate is shown in Figure 10.
Due to the low Reynolds numbers (0.31 ÷ 2.51) values in the various sections, the water flow in the sand layer and the Rockfos® material were concluded to be in laminar motion. It was found because, in the pressure losses calculated by Ergun’s formula for the filter under study, the member responsible for the laminar motion contributed approximately 99.9% to the motion and contributed 0.1% for the turbulent motion. For this reason, the Kozeny–Carman formula [43] was used for the analysis. As the graph in Figure 10 shows, the effect of varying deposit types on the total pressure loss shown by the difference in water tables in the initial (A) and final (D) chambers was negligible. The points were arranged along a straight line, and their increasing tendency was a function of the increasing water flow rate. Tests on a laboratory model made it possible to design the filter volume and bed height interrelationship to achieve the required throughput under practical conditions in a specific wastewater treatment plant.
Water with a blue dye from Blueway was used to identify and visualize the course and areas of the water seepage through the model chambers during the meander flow. The results of observing the movement of the colored liquid stream are shown in Figure 11.
In the upper part of the first chamber, the water flow was uniform and took place over the entire surface of the bed. Furthermore, due to the lower constrictions (between chambers A, B, C, and D) and upper constrictions (between chambers B and C) in the baffles, the flow area narrowed and concentrated before and after the constrictions. Notably, the flow between chambers B and C occurred directly above the baffle, while the upper liquid layer took little part in the circulation. Nevertheless, with the use of baffles and forced flow through all the chambers, the use of the filter material was higher than in the filters operating without baffles. This picture explains the uneven water table heights between chambers A–B and C–D. The unequal crosssectional areas concerning the flow rate of the flowing water affected the changes in the filtration velocity and, consequently, the different heights of the pressure losses.

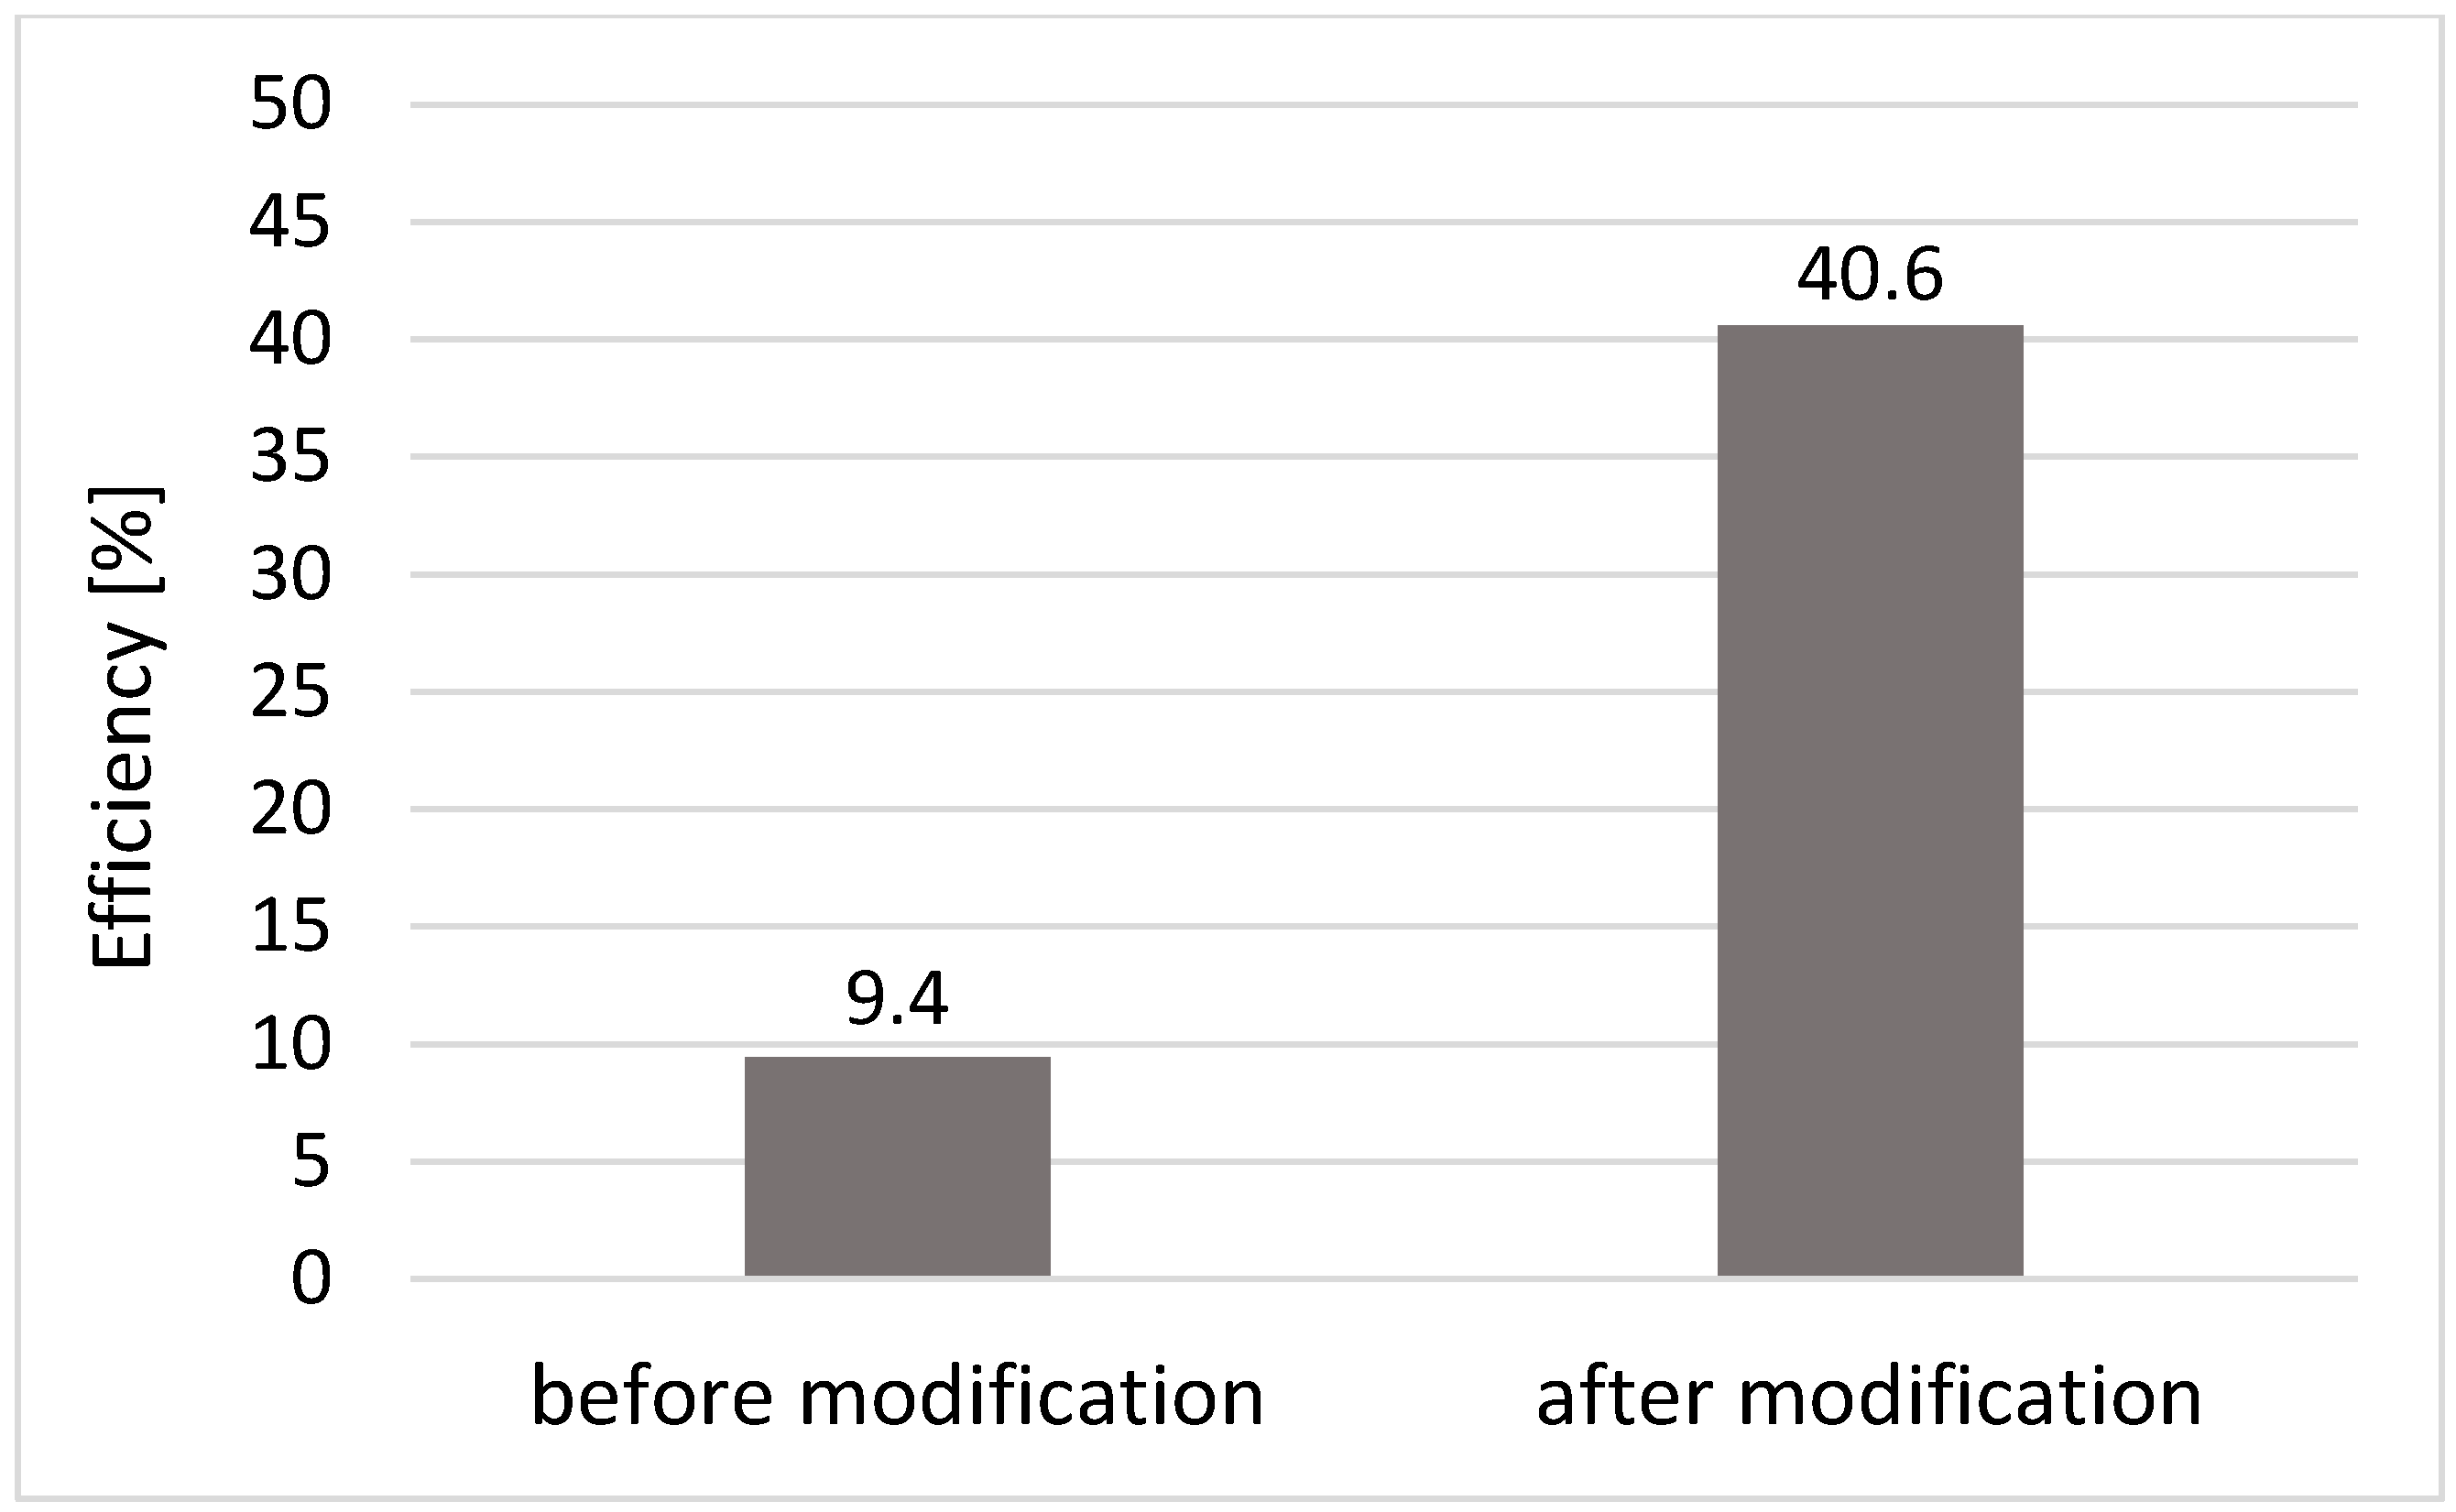
3.2. Efficiency of Phosphorus Removal in a Full-Scale Technical Filter

Before its modification, studies of the total phosphorus concentration in the influent and effluent from the filter operating at the full technical scale of the Białka WWTP were carried out from October 2020 to February 2022. Due to the insufficient phosphorus removal efficiency that was measured in March and April 2022, all three filter chambers were modified by introducing additional baffles to force a meandering wastewater flow. Up to the time of the modification, 16 measurement series were carried out, while, after the modification, 8 series were carried out (from May to December 2022). The results of the tests are shown in Table 3, and the changes in the total phosphorus removal efficiency due to the introduction of the baffles are shown in Figure 12, Figure 13 and Figure 14.
In the period before the modification, the wastewater flowing into the filters with Rockfos® material contained total phosphorus at an average concentration of 0.90 mg/L. The recorded values oscillated within broad ranges from 0.18 to 4.62 mg/L. With such a wide variation of data in the collection, the median was determined to be a valuable measure in its evaluation, as it shows the tendency of deviation from the symmetrical distribution of phosphorus concentrations in wastewater. In the present case, it deviated significantly from the mean and amounted to 0.48 mg/dm3, which indicates right-handed asymmetry, i.e., high phosphorus concentrations occurred incidentally, but their high values strongly increased the mean (Table 3). The low homogeneity of the dataset was also evidenced by the SD standard deviation value of 1.04 mg/L and the coefficient of variation—Cv (115%).
The literature rarely reports research results relating to the use of Rockfos® material on a full technical scale. Pytka-Woszczyło et al. [18] analyzed the operation of filters in natural conditions at the sewage treatment plant in Kosobudy and determined the efficiency of removal of total phosphorus at the level of 34–45%, which is similar to that obtained in the modified design of filters in Białka. According to the results of the same authors, in the treatment plant at Stary Załucze, the total phosphorus was removed with an efficiency of 82% in the first year of operation and 36–40% in the following two years. In both cases, there was a marked decrease in efficiency in the fourth (Stare Załucze) and fifth (Kosobudy) years of filter operation [18]. The filters in question were cuboidal tanks with forced vertical flows up the bed, thereby allowing the entire bed volume to be used. Reports from model tests have indicated that higher phosphorus elimination rates can be achieved with filtration through Rockfos® material. Jucherski et al. [12] used vertical filter columns under steady-state flow conditions and showed an average phosphate removal efficiency of 76.8–84.1% with an effluent retention time in the filter bed of 6 h, as well as 93.2–94.9% removal efficiency with a retention time of 12 h.
In the treated wastewater flowing away from the filters, the total phosphorus concentrations changed little compared to the influent wastewater. The average content of the component in the wastewater was 0.82 mg/L (Table 3, Figure 12). The recorded values ranged from 0.14 mg/L to 3.80 mg/L (Table 3, Figure 13). The SD value exceeded the mean value (0.89 mg/L), and the coefficient of variation was 110% (Table 3), which, on the scale given by Mucha [44], signified high variability. The average removal efficiency of total phosphorus in the filters was approximately 9.4% (Figure 14).
The initially low removal rate of total phosphorus from the wastewater can be linked to the original design of the filters. The elongated shape of the filter chambers, the location of the wastewater inlet and outlet, and the absence of obstructions (Figure 4) may have favored the selected flow paths. It is very likely that, in the present case, the effluent stream flowing out of the inlet pipe headed upward and then flowed over the filter bed or the top layer of the filter bed to the outlet. As a result, the active flow of wastewater through the bed only occurred in the front part of the chamber, and, in the rest of the chamber, there may have been dead zones that did not participate in filtration and phosphorus sorption.
In the second stage of the study, the average content of total phosphorus in the effluent flowing into the filters was 1.25 mg/L, which was a significant increase compared to the previous period. The middle value was 0.89 mg/L. There was a substantial variability of observations in the dataset—79%, with an SD value of 0.99 mg/L (Table 3). The large scatter of the results (from 0.29 to 3.36 mg/L) was determined to have primarily derived from the field nature of the study. The impact of many factors, such as the quality of wastewater feeding the treatment plant, the course of seasonal conditions, and the intensity of unit processes occurring at the mechanical and biological stages of wastewater treatment, could cause significant changes in the composition of wastewater entering the filters.
At the filter outlet, the average concentration of the total phosphorus decreased to 0.74 mg/L. The median at this stage of the study was 0.89 mg/L. The average elimination rate of the component from wastewater was 40.6% (Figure 14). Compared to the first stage of the study, the significant increase in phosphorus removal efficiency in filters with Rockfos® material can be attributed with high probability to the modification made in the design of the filters. The installation of cross-baffles and the induction of meander flow allowed for the use of a larger bed volume. It is not an optimal solution due to the location of the wastewater inlet near the bottom, which excludes the first chamber from the filtration process. Unfortunately, due to the original design and the need to install baffles during the treatment plant’s regular operation, it was impossible to make more advanced changes. The achieved degree of elimination of the total phosphorus in the horizontal filters with forced meander flows was similar to that obtained during the operation of vertical filters [18], wherein their design seems optimal from the point of view of the full utilization of the filter bed. Using this solution in large wastewater treatment plants is essential, where it is technically justified to use horizontal filters.
The use of Ca-rich reactive materials in phosphorus removal, including calcined opoka derivatives, increases the pH of the solution [11,12,17,45]. In the first stage of the study, before modification in the inflow to the filters, the median pH value was 7.24, and the recorded values ranged from 6.81 to 7.91. The increase in pH due to treating the wastewater in the filters with Rockfos® material was insignificant. In the effluent from the filters, the effluent pH ranged from 6.86–8.55, and the median value was 7.73. Many authors indicate that the effluent becomes more alkalized due to contact with natural sorbents based on carbonate–silica rocks [12,17,18]. Thus, the results may support the thesis of forming specific paths of wastewater flow through the filter beds, thereby limiting the active use of a significant volume of wastewater. The low level of alkalization of the wastewater after contact with the reactive material may explain the low efficiency of the filters in removing phosphorus compounds. Numerous studies show a close relationship between these indicators, with high pH values promoting the precipitation and sorption of phosphorus compounds by the reactive material [11,25].
After the modifications to the filter design, the pH in the influent wastewater was at a similar level as in the first stage of the study (before the modification). The median was 7.11, with a range of values from 6.76 to 7.49. There was a marked increase in pH values in the outflow wastewater. It is worth noting that, in the last series of measurements before the modification of the filters, a pH value of 7.51 was recorded in the outflow, while in the first series after the modification, it was already 10.43 (Table 3). In the initial period, the pH of the effluent flowing out of the filters exceeded 9.0, after which it varied in the range of 8.28–8.83. The median at this stage of the study was 9.28. The observed trend of the changes in the pH of the effluent is in line with the reports made by other authors studying opaque materials [12,46,47,48]. It can be assumed that, by modifying the filters and forcing a meandering flow of wastewater, there was a better utilization of those batches of deposits that were previously inactive. The alkalization of the wastewater during contact with the Rockfos® material may have determined the increase in total phosphorus removal efficiency [11,18,25]. Over time, the pH value decreased, which was consistent with the results of the studies cited above (Figure 15).

4. Conclusions

Tests performed in a laboratory model of a phosphorus removal filter showed that water flows in a laminar motion, thereby indicating that the Kozeny–Carman formula [49], which relates to laminar motion, can be used for modeling and designing filter wall heights. The second term of Ergun’s formula, which models turbulent motion in total pressure losses, did not exceed 0.1%; hence, its influence on water flow modeling was considered to be marginal.
Forcing a meandering flow of wastewater through a layer of sorption material in a filter filled with Rockfos® material offers the possibility of increasing the efficiency of phosphorus removal from wastewater at the outflow of a small-scale treatment plant. The example of a wastewater treatment plant operating at a full technical scale suggests that using longitudinal filters with an unobstructed horizontal flow creates specific flow paths in the filter bed, thus limiting the use of the entire volume of the filter material. The introduction of vertical baffles and a meander flow lengthened the filtration path, thus allowing more phosphorus to be retained. A spike in the treated wastewater’s pH value evidenced the filter bed’s more effective use during the meander flow. A strongly alkaline effluent reaction is a problem for safe wastewater discharge into the environment. Still, it was a temporary effect in the case described here, and the pH value decreased over time. On the other hand, the alkalization of the wastewater may have promoted the precipitation of calcium phosphate and reduced its concentration in the effluent. As was shown, after the modification involving the installation of vertical baffles in the filter chamber, there was an increase in the phosphorus removal efficiency from 9.4% to a level of 40.6%, which is comparable to vertical filters, whose design seems optimal from the point of view of the full utilization of the filter bed. Using the discussed solution can improve the removal of total phosphorus from biologically treated wastewater in high-throughput facilities, where it is technically justified to use horizontal filters. Compared to classical horizontal filters (without a meander flow), they are also not associated with any limitations, except for a slightly higher construction cost, while allowing for a significantly better ecological effect.

Author Contributions

Conceptualization, B.Z. and T.S.; Methodology, B.Z. and T.S.; Validation, T.S., M.M., K.J. and A.L.; Formal analysis, K.J.; Investigation, B.Z., T.S., M.M. and A.L.; Data curation, B.Z., T.S. and A.L.; Writing—original draft, B.Z., T.S. and M.M.; Visualization, B.Z., T.S., M.M. and K.J.; Supervision, T.S. and K.J.; Project administration, T.S. All authors have read and agreed to the published version of the manuscript.

Funding

The paper was written within the framework of a Ph.D. thesis prepared by Beata Zawadzka, from the project no DWD/5/0332/2021 financed by the Ministry of Education and Science (Poland) entitled “Development of guidelines for design and operation and implementation of a chemisorption modular phosphorus removal system in a selected wastewater treatment plant”.

Data Availability Statement

Not applicable.

Conflicts of Interest

The authors declare no conflict of interest.

References

  1. Loganathan, P.; Vigneswaran, S.; Kandasamy, J.; Bolan, N.S. Removal and recovery of phosphate from water using sorption. Crit. Rev. Environ. Sci. Technol. 2014, 44, 847–907. [Google Scholar] [CrossRef]
  2. Zamparas, M.; Gianni, A.; Stathi, P.; Deligiannakis, Y.; Zacharias, I. Removal of phosphate from natural waters using innovative modified bentonites. Appl. Clay Sci. 2012, 62, 101–106. [Google Scholar] [CrossRef]
  3. Hussain, S.; Aziz, H.A.; Isa, M.H.; Ahmad, A.; Van Leeuwen, J.; Zou, L.; Beecham, S.; Umar, M. Orthophosphate removal from domestic wastewater using limestone and granular activated carbon. Desalination 2011, 271, 265–272. [Google Scholar] [CrossRef]
  4. Kasprzyk, M.; Czerwionka, K.; Gajewska, M. Waste materials assessment for phosphorus adsorption toward sustainable application in circular economy. Resour. Conserv. Recycl. 2021, 168, 105335. [Google Scholar] [CrossRef]
  5. Xie, J.; Lin, Y.; Li, C.; Wu, D.; Kong, H. Removal and recovery of phosphate from water by activated aluminum oxide and lanthanum oxide. Powder Technol. 2015, 269, 351–357. [Google Scholar] [CrossRef]
  6. Rayshouni, H.; Wazne, M. Effects of Calcium on the Removal of Ammonium from Aged Landfill Leachate by Struvite Precipitation. Water 2022, 14, 1933. [Google Scholar] [CrossRef]
  7. Soares, A.; Czajkowska, J.; Colprim, J.; Gali, A.; Johansson, S.; Masic, A.; March, A.; McMeod, A.; Nenov, V.; Ruscalleda, M. Nutrients Recovery from Wastewater Streams; IWA Publishing: London, UK, 2017. [Google Scholar]
  8. Kasprzyk, M.; Gajewska, M. Phosphorus removal by application of natural and semi-natural materials for possible recovery according to assumptions of circular economy and closed circuit of P. Sci. Total Environ. 2019, 650, 249–256. [Google Scholar] [CrossRef]
  9. Zhang, Z.; Wang, X.; Zhao, J. Phosphate recovery from wastewater using calcium silicate hydrate (CSH): Sonochemical synthesis and properties. Environ. Sci. Water Res. Technol. 2019, 5, 131–139. [Google Scholar] [CrossRef]
  10. Cordell, D.; White, S. Life’s bottleneck: Sustaining the world’s phosphorus for a food secure future. Annu. Rev. Environ. Resour. 2014, 39, 161–188. [Google Scholar] [CrossRef]
  11. Jucherski, A.; Nastawny, M.; Walczowski, A.; Jóźwiakowski, K.; Gajewska, M. Badania przydatności alkalicznych materiałów filtracyjnych do usuwania fosforanów z biologicznie oczyszczonych ścieków bytowych. Ochr. Sr. 2017, 39, 33–38. [Google Scholar]
  12. Jucherski, A.; Walczowski, A.; Bugajski, P.; Jóźwiakowski, K.; Rodziewicz, J.; Janczukowicz, W.; Wu, S.; Kasprzyk, M.; Gajewska, M.; Mielcarek, A. Long-term operating conditions for different sorption materials to capture phosphate from domestic wastewater. Sustain. Mater. Technol. 2022, 31, e00385. [Google Scholar] [CrossRef]
  13. Letshwenyo, M.W.; Mokokwe, G. Phosphorus and sulphates removal from wastewater using copper smelter slag washed with acid. SN Appl. Sci. 2021, 3, 854. [Google Scholar] [CrossRef]
  14. Westholm, L.J. The use of blast furnace slag for removal of phosphorus from wastewater in Sweden—A review. Water 2010, 2, 826–837. [Google Scholar] [CrossRef] [Green Version]
  15. ÁdÁm, K.; Sovik, A.; Krogstad, T.; Heistad, A. Phosphorous removal by the filter materials light-weight aggregates and shellsand-a review of processes and experimental set-ups for improved design of filter systems for wastewater treatment. Vatten 2007, 63, 245. [Google Scholar]
  16. Vohla, C.; Kõiv, M.; Bavor, H.J.; Chazarenc, F.; Mander, Ü. Filter materials for phosphorus removal from wastewater in treatment wetlands—A review. Ecol. Eng. 2011, 37, 70–89. [Google Scholar] [CrossRef]
  17. Gubernat, S.; Masłoń, A.; Czarnota, J.; Koszelnik, P. Reactive materials in the removal of phosphorus compounds from wastewater—A review. Materials 2020, 13, 3377. [Google Scholar] [CrossRef] [PubMed]
  18. Pytka-Woszczyło, A.; Różańska-Boczula, M.; Gizińska-Górna, M.; Marzec, M.; Listosz, A.; Jóźwiakowski, K. Efficiency of filters filled with rockfos for phosphorus removal from domestic sewage. Adv. Sci. Technol. Res. J. 2022, 16, 176–188. [Google Scholar] [CrossRef]
  19. Grace, M.A.; Clifford, E.; Healy, M.G. The potential for the use of waste products from a variety of sectors in water treatment processes. J. Clean. Prod. 2016, 137, 788–802. [Google Scholar] [CrossRef] [Green Version]
  20. Penn, C.; Chagas, I.; Klimeski, A.; Lyngsie, G. A Review of Phosphorus Removal Structures: How to Assess and Compare Their Performance. Water 2017, 9, 583. [Google Scholar] [CrossRef]
  21. Ezzati, G.; Healy, M.G.; Christianson, L.; Feyereisen, G.; Thornton, S.; Daly, K.; Fenton, O. Developing and validating a decision support tool for media selection to mitigate drainage waters. Ecol. Eng. 2019, 142, 100010. [Google Scholar] [CrossRef]
  22. Bacelo, H.; Pintor, A.M.; Santos, S.C.; Boaventura, R.A.; Botelho, C.M. Performance and prospects of different adsorbents for phosphorus uptake and recovery from water. Chem. Eng. J. 2020, 381, 122566. [Google Scholar] [CrossRef]
  23. Bus, A.; Karczmarczyk, A. Charakterystyka skały wapienno-krzemionkowej opoki w aspekcie jej wykorzystania jako materiału reaktywnego do usuwania fosforu z wód i ścieków. Infrastrukt. I Ekol. Teren. Wiej. 2014, II/1, 227–238. [Google Scholar]
  24. Brogowski, Z.; Renman, G. Characterization of opoka as a basis for its use in wastewater treatment. Pol. J. Environ. Stud. 2004, 13, 15–20. [Google Scholar]
  25. Jóźwiakowski, K.; Gajewska, M.; Pytka, A.; Marzec, M.; Gizińska-Górna, M.; Jucherski, A.; Walczowski, A.; Nastawny, M.; Kamińska, A.; Baran, S. Influence of the particle size of carbonate-siliceous rock on the efficiency of phosphorous removal from domestic wastewater. Ecol. Eng. 2017, 98, 290–296. [Google Scholar] [CrossRef]
  26. Pinińska, J. Właściwości geomechaniczne opok. Górnictwo I Geoinżynieria 2008, 32, 293–301. [Google Scholar]
  27. Cucarella, V.; Zaleski, T.; Mazurek, R. Phosphorus sorption capacity of different types of opoka. Ann. Wars. Univ. Life Sci.-SGGW Land Reclam. 2007, 38, 11–18. [Google Scholar] [CrossRef]
  28. Nilsson, C.; Renman, G.; Westholm, L.J.; Renman, A.; Drizo, A. Effect of organic load on phosphorus and bacteria removal from wastewater using alkaline filter materials. Water Res. 2013, 47, 6289–6297. [Google Scholar] [CrossRef] [Green Version]
  29. Jóźwiakowski, K.; Marzec, M.; Gizińska-Górna, M.; Pytka, A.; Skwarzyńska, A.; Słowik, T.; Kowalczyk-Juśko, A.; Gajewska, M.; Steszuk, A.; Grabowski, T. The Concept of Construction of Hybrid Constructed Wetland for Wastewater Treatment in Roztocze National Park. Barom. Reg. Anal. I Prognozy 2014, 12, 91–102. [Google Scholar] [CrossRef]
  30. Jóźwiakowski, K.; Gajewska, M.; Marzec, M.; Gizińska-Górna, M.; Pytka, A.; Kowalczyk-Juśko, A.; Sosnowska, B.; Baran, S.; Malik, A.; Kufel, R. Hybrid constructed wetlands for the national parks in Poland–The case study, requirements, dimensioning and preliminary results. In Natural and Constructed Wetlands: Nutrients, Heavy Metals and Energy Cycling, and Flow; Springer: Berlin/Heidelberg, Germany, 2016; pp. 247–265. [Google Scholar]
  31. Jóźwiakowski, K.; Marzec, M.; Kowalczyk-Juśko, A.; Gizińska-Górna, M.; Pytka-Woszczyło, A.; Malik, A.; Listosz, A.; Gajewska, M. 25 years of research and experiences about the application of constructed wetlands in southeastern Poland. Ecol. Eng. 2019, 127, 440–453. [Google Scholar] [CrossRef]
  32. Available online: http://www.ceramika-kufel.pl/rockfos/ (accessed on 20 May 2023).
  33. Siwiec, T. The sphericity of grains of filtration beds applied for water treatment on examples of selected minerals. Electron. J. Pol. Agric. Univ. Civ. Eng. 2007, 10, #30. [Google Scholar]
  34. Radoičić, T.K.; Đuriš, M.; Garić-Grulović, R.; Arsenijević, Z.; Grbavčić, Ž. Particle characterization of polydisperse quartz filtration sand. Powder Technol. 2014, 254, 63–71. [Google Scholar] [CrossRef]
  35. Gibson, I.A.; Slim, C.J.; Zheng, Y.; Scott, S.A.; Davidson, J.F.; Hayhurst, A. An examination of Wen and Yu’s formula for predicting the onset of fluidisation. Chem. Eng. Res. Des. 2018, 135, 103–111. [Google Scholar] [CrossRef]
  36. Pang, M.; Zhang, T.; Meng, Y.; Ling, Z. Experimental study on the permeability of crushed coal medium based on the Ergun equation. Sci. Rep. 2021, 11, 23030. [Google Scholar] [CrossRef] [PubMed]
  37. Graciano-Uribe, J.; Pujol, T.; Puig-Bargués, J.; Duran-Ros, M.; Arbat, G.; Cartagena, F. Assessment of Different Pressure Drop-Flow Rate Equations in a Pressurized Porous Media Filter for Irrigation Systems. Water 2021, 13, 2179. [Google Scholar] [CrossRef]
  38. Cleasby, J.L.; Fan, K.-S. Predicting fluidization and expansion of filter media. J. Environ. Eng. Div. 1981, 107, 455–471. [Google Scholar] [CrossRef]
  39. Abbas, M.N. Modeling of porosity equation for water flow through packed bed of monosize spherical packing. J. Eng. Sustain. Dev. 2011, 15, 205–226. [Google Scholar]
  40. PN-ISO 5667-10:2021-11; Water Quality—Sampling—Part 10: Guidance on Waste Water Sampling. ISO: London, UK, 2021.
  41. PN-EN ISO 6878:2006; Water Quality—Determination of Phosphorus—Spectrometric Method with Ammonium Molybdate. ISO: London, UK, 2006.
  42. PN-EN ISO 10523:2012; Water Quality—Determination of pH. ISO: London, UK, 2012.
  43. Yang, T.; Hu, L.; Yu, D.; Xiong, X.; Chvojka, J.; Venkataraman, M.; Petrů, M.; Tomková, B.; Morikawa, H.; Militký, J. Simple determination of key structural parameters for fibrous materials enabled by Ergun-Type and Kozeny-type equations. Polym. Test. 2022, 108, 107514. [Google Scholar] [CrossRef]
  44. Mucha, J. Metody Geostatystyczne w Dokumentowaniu Złóż; Wydaw. AGH: Kraków, Poland, 1994. [Google Scholar]
  45. Kasprzyk, M.; Węgler, J.; Gajewska, M. Analysis of efficiency of phosphates sorption by different granulation of selected reactive material. E3S Web Conf. 2018, 26, 00002. [Google Scholar] [CrossRef] [Green Version]
  46. Albright, M.; Waterfield, H. Evaluating Phosphorus-Removal Media for Use in Onsite Wastewater Treatment Systems (Interim Report). 42nd Ann. Rept. (2009). SUNY Oneonta Biol. Fld. Sta., SUNY Oneonta 2010. Available online: https://oneonta365.sharepoint.com/sites/BFS/Shared%20Documents/Forms/AllItems.aspx?id=%2Fsites%2FBFS%2FShared%20Documents%2FWeb%20Documents%2FAnnual%2DReports%2F2009%2F19%20P%20removal%20report%2Epdf&parent=%2Fsites%2FBFS%2FShared%20Documents%2FWeb%20Documents%2FAnnual%2DReports%2F2009&p=true&ga=1 (accessed on 20 May 2023).
  47. Karczmarczyk, A.; Woja, K.; Bliska, P.; Baryła, A.; Bus, A. The efficiency of filtration materials (Polonite® and Leca®) supporting phosphorus removal in on site treatment systems with wastewater infiltration. Infrastrukt. Ekol. Teren. Wiej. 2017, IV/1, 1401–1413. [Google Scholar]
  48. Renman, A.; Renman, G. Long-term phosphate removal by the calcium-silicate material Polonite in wastewater filtration systems. Chemosphere 2010, 79, 659–664. [Google Scholar] [CrossRef]
  49. Sobieski, W.; Zhang, Q. Sensitivity analysis of Kozeny-Carman and Ergun equations. Technol. Sci./Univ. Warm. Mazury Olszt. 2014, 17, 235–248. [Google Scholar]
Figure 1. Scheme of a laboratory-scale filter model.
Water 15 02703 g001
Figure 2. Photograph of a laboratory model filled with sand (A) and Rockfos® (B).
Water 15 02703 g002
Figure 3. Scheme of the sewage treatment plant in Białka, Dębowa Kłoda commune.
Water 15 02703 g003
Figure 4. Diagram of the filter for removing phosphorus before modification.
Water 15 02703 g004
Figure 5. Diagram of the filter for removing phosphorus after modification.
Water 15 02703 g005
Figure 6. Photos of filter during montage of walls.
Water 15 02703 g006
Figure 7. Dependence of pressure losses when water flowed through sand from chamber A to B as a function of flow rate.
Water 15 02703 g007
Figure 8. Dependence of pressure losses when water flowed through Rockfos® from chamber A to B as a function of flow rate.
Water 15 02703 g008
Figure 9. Schematic division of the filtration layer into design sublayers.
Water 15 02703 g009
Figure 10. Dependence of pressure losses when water flowed through Rockfos® from chamber A to D as a function of flow rate.
Water 15 02703 g010
Figure 11. Freeze frames showing the course and position of the flow stream through individual chambers of the model.
Water 15 02703 g011
Figure 12. Average concentrations of total phosphorus in influent and effluent from filters with Rockfos® material (A—before modification; B—after modification). Notation: SE—standard error.
Water 15 02703 g012
Figure 13. Total phosphorus concentrations in influent and effluent from filters with Rockfos® material.
Water 15 02703 g013
Figure 14. Average efficiency of removal of total phosphorus from wastewater in filters with Rockfos® material.
Water 15 02703 g014
Figure 15. pH values in wastewater at the inflow and outflow of the filters.
Water 15 02703 g015
Table 1. The chemical composition of the material Rockfos® [18,32].
ComponentPercentage [% by Weight]
CaO43.336
SiO236.047
Al2O35.932
Na2O2.856
Fe1.340
MgO0.938
TiO20.960
S0.654
K2O0.489
P0.480
Cl0.237
MnO0.117
Table 2. Measurement results of water level height in individual chambers as a function of water flow rate.
ParameterUnitSand Bed Model
Flow ratem3/h0.0910.0810.0670.0600.0530.0470.045
Height “a”cm47.243.540.539.739.237.737.4
Height “b”cm36.335.134.033.533.232.532.4
Height “c”cm29.729.629.529.429.429.429.4
ParameterUnitRockfos® Bed Model
Flow ratem3/h0.0960.0790.0670.0590.0500.0330.023
Height “a”cm47.543.542.040.338.4535.433.6
Height “b”cm39.837.736.335.534.432.5531.5
Height “c”cm29.8529.829.629.629.4529.329.2
Table 3. Basic statistics of total phosphorus concentration in wastewater flowing in and out of filters with Rockfos® material.
Statistics Indicators Before Modification (n = 16)After Modification (n = 8)
TP [mg/L]pHTP [mg/L]pH
In OutInOutIn OutIn Out
Average0.900.82--1.250.74--
Median0.480.477.2457.730.890.527.1159.275
Min0.180.146.816.860.290.116.768.28
Max4.623.807.918.553.362.017.4910.43
SD1.040.89--0.990.58--
Cv [%]115.1109.7--79.178.0--
Notes: n—number of samples; TP—total phosphorus; Cv—coefficient of variation; SD—standard deviation.
Disclaimer/Publisher’s Note: The statements, opinions and data contained in all publications are solely those of the individual author(s) and contributor(s) and not of MDPI and/or the editor(s). MDPI and/or the editor(s) disclaim responsibility for any injury to people or property resulting from any ideas, methods, instructions or products referred to in the content.

