1. Introduction
Rainfall is the key driver of watershed surface runoff and soil erosion [
1,
2,
3,
4,
5,
6], especially erosive rainfall, which affects the separation of soil particles as well as sediment movement and deposition [
7,
8]. Erosive rainfall can increase regional soil erosion, taking away nutrient-rich topsoil and leading to a decrease in soil fertility [
9,
10,
11,
12,
13]. Additionally, a significant amount of soil nutrients are transported into water bodies via soil erosion [
14], causing water pollution and eutrophication. Therefore, soil erosion is also a source in the watershed of non-point source pollution [
15]. The study of rainfall regimes and their effects on surface runoff and soil erosion has become a hot issue of concern in ecohydrology, and it is of significant practical value for the prevention and control of soil erosion and non-point source pollution.
Rainfall characteristics include precipitation, rainfall duration, rainfall intensity, maximum 30 min rainfall intensity, movement direction and movement speed, etc. [
16]. Precipitation is the sum of all the time periods in the interval from the beginning to the end of the precipitation for this rainfall event. Rainfall duration is the period of time from the beginning to the end of a rainfall event. Rainfall intensity characterizes the precipitation per unit time period and is calculated by dividing the total precipitation from a single rainfall event by rainfall duration. Maximum 30 min rainfall intensity means during a rainfall event, use the maximum value of the sum of precipitation in any 30 min time period divided by 0.5 h; the value obtained is the maximum 30 min rainfall intensity. The movement direction is relative to stationary rainfall and means a rainfall center that moves in a certain direction during the course of the rainfall process. The movement speed refers to the speed at which the center of rainfall moves in a certain direction during the rainfall process. Many academics have conducted extensive research on the influence of rainfall characteristics on surface runoff and soil erosion [
17,
18,
19,
20,
21]. The findings indicate that rainfall intensity (I) and rainfall duration (D) are the two major factors influencing the creation of watershed runoff and that high-intensity or long-duration rainfall will hasten the onset of runoff generation and increase runoff [
1,
21], which in turn will lead to an increase in sediment yield (S) and intensify soil erosion [
22]; high-intensity rainfall can also cause damage to slopes, leading to geologic hazards [
23]. The rainfall erosion indicator (EI
30) defined by the Universal Soil Loss Equation is commonly used to calculate rainfall erosivity for an individual rainfall event, which is equal to the product of the total kinetic energy of a rainfall (E, MJ·h m
−2) and maximum 30 min rainfall intensity (I
30, mm·h
−1) during the rainfall. A study by Tu et al. [
24] in Jiangxi province, China, found a power function relationship between the rainfall erosion indicator (EI
30) and precipitation (P) [
24] and a primary function relationship between the rainfall erosion indicator (EI
30) and sediment yield (S) [
25]. Liu et al. [
26] found that soil erosion intensity and rainfall duration (D) were power functions on bare slopes and exponential functions on vegetated slopes in the Qinghai–Tibet Plateau region of China. Deng et al. [
27] conducted a simulated rainfall experiment at the Agricultural Science Experiment Station of Zhejiang University; the results showed that the runoff (W) and sediment yield (S) increase with the increase in rainfall intensity (I) on different slopes, and the relationship can be expressed as a power function.
The aforementioned studies demonstrate that runoff and sediment yield are closely related to substrate conditions (topography, vegetation, etc.) as well as rainfall characteristics such as precipitation (P), rainfall duration (D), and rainfall intensity (I) [
8]. Most of the above studies focus on the influence of single rainfall characteristics on runoff and sediment yield and lack of systematic evaluation [
1], as runoff and sediment generation may vary greatly depending on different rainfall regimes [
28]. Wei et al. [
29] used the K-mean clustering method to classify 131 rainfall events in the Loess Plateau region of China from 1986 to 1999 into 3 categories based on 3 indicators: precipitation (P), rainfall duration (D), and maximum 30 min rainfall intensity (I
30), and to analyze the effects of different rainfall regimes on the runoff and sediment yield. The results show that Rainfall Regime II, with high rain intensity, short duration, and high-frequency characteristics, is most likely to produce runoff and sediment in the watershed. Fang et al. [
30] conducted the same study in the Three Gorges area of China and found that Rainfall Regime II (which has the largest precipitation (P) and rainfall duration (D)) has the largest mean runoff coefficient and mean sediment yield. Yan et al. [
31], in the Molisol region of northeast China, found that Rainfall Regime I (characterized by maximum precipitation (P) and maximum 30 min rainfall intensity (I
30)) had the highest soil loss rate. The results of Peng and Wang [
22], using the hierarchical clustering method for karst landscape areas in Guizhou Province, China, are consistent with Yan et al. [
31]; they both found that rainfall regimes with high-intensity features caused the most surface runoff and soil erosion and were the most destructive rainfall regimes in the region. In the Iguatú watershed in Ceará State, Brazil, dos Santos et al. [
32] used a hierarchical clustering method based on three indicators: precipitation (P), rainfall duration (D), and maximum 30 min rainfall intensity (I
30), and it was found that the precipitation (P) and maximum 30 min rainfall intensity (I
30) of Rainfall Regime I in this basin were the largest, the rainfall duration (D) was the longest, and its occurrence frequency was the smallest but most likely to cause runoff and sediment yield, so this rainfall regime is most concerning. In summary, the rainfall characteristics of different regions are different, and there are differences in the main rainfall characteristics that cause the production of runoff and sediment, while the analysis methods of rainfall regimes mostly adopt the K-mean clustering method or hierarchical clustering method but lack the rationality test of rainfall regimes’ classification; moreover, the relationship between several rainfall characteristics, such as precipitation (P), rainfall duration (D), rainfall intensity (I), maximum 30 min rainfall intensity (I
30), and the response of runoff and sediment yield, is unclear.
The northern soil and rocky mountain area is one of the first-grade zones of soil and water conservation in China, and the 2021 China Soil and Water Conservation Bulletin shows [
33] that the soil erosion area in the northern soil and rocky mountain area is 160,000 square kilometers, accounting for 19.84% of its total land area, and the main erosion type in this area is hydraulic erosion, accounting for 87.25% of the total soil erosion area. Intense hydraulic erosion has caused serious soil nutrient loss in the area, resulting in reduced crop yields and having a significant detrimental effect on environmental sustainability. In the paper, a typical small watershed in the northern soil and rocky mountainous areas, the Yellow River downstream Culai Mountain watershed, was selected as the study area, which is located in Taian City, Shandong Province, China. The area is characterized by high mountains and steep slopes, and the soil is mainly brown loam and brown soil, with a loose texture and thin soil layer, with an annual rainfall of 690.6 mm; it is a warm temperate continental monsoon climate zone, influenced by monsoons [
34], with rainfall concentrated in summer and often heavy, and is one of the rainstorm centers in Shandong Province. The combination of soil and rainfall has led to very serious soil erosion in the watershed, seriously affecting local agricultural and economic development.
At present, there are few studies on the influence of rainfall regimes on watershed runoff and sediment yield in northern soil and rocky mountain areas, and the majority of the current research focuses on the northwest Loess region [
16,
29,
35], the northeast black soil region [
31], the southern red soil region, etc. [
36]. Therefore, we aimed to clarify the features of rainfall regimes in the typical small watershed of the northern soil and rocky mountainous areas, the Culai Mountain watershed, and to explore the influence of each rainfall characteristic indicator on runoff and sediment yield. In this paper, various cluster analysis methods (K-means clustering method and hierarchical clustering method) are used to classify the rainfall events in 2021–2022 in the Culai Mountain watershed, and discriminant analysis and ANOVA are used to analyze the rationality of rainfall regime classification. Using the multiple linear regression method and through path analysis, the response relationship models of rainfall characteristic indicators (P, D, I, and I
30) and runoff and sediment yield are established to quantify the relationship between rainfall characteristics indicators (P, D, I, and I
30), and runoff and sediment yield are established using multiple linear regression and path analysis in order to provide a theoretical foundation for regional non-point source pollution control and soil and water conservation.
2. Materials and Methods
2.1. Study Area
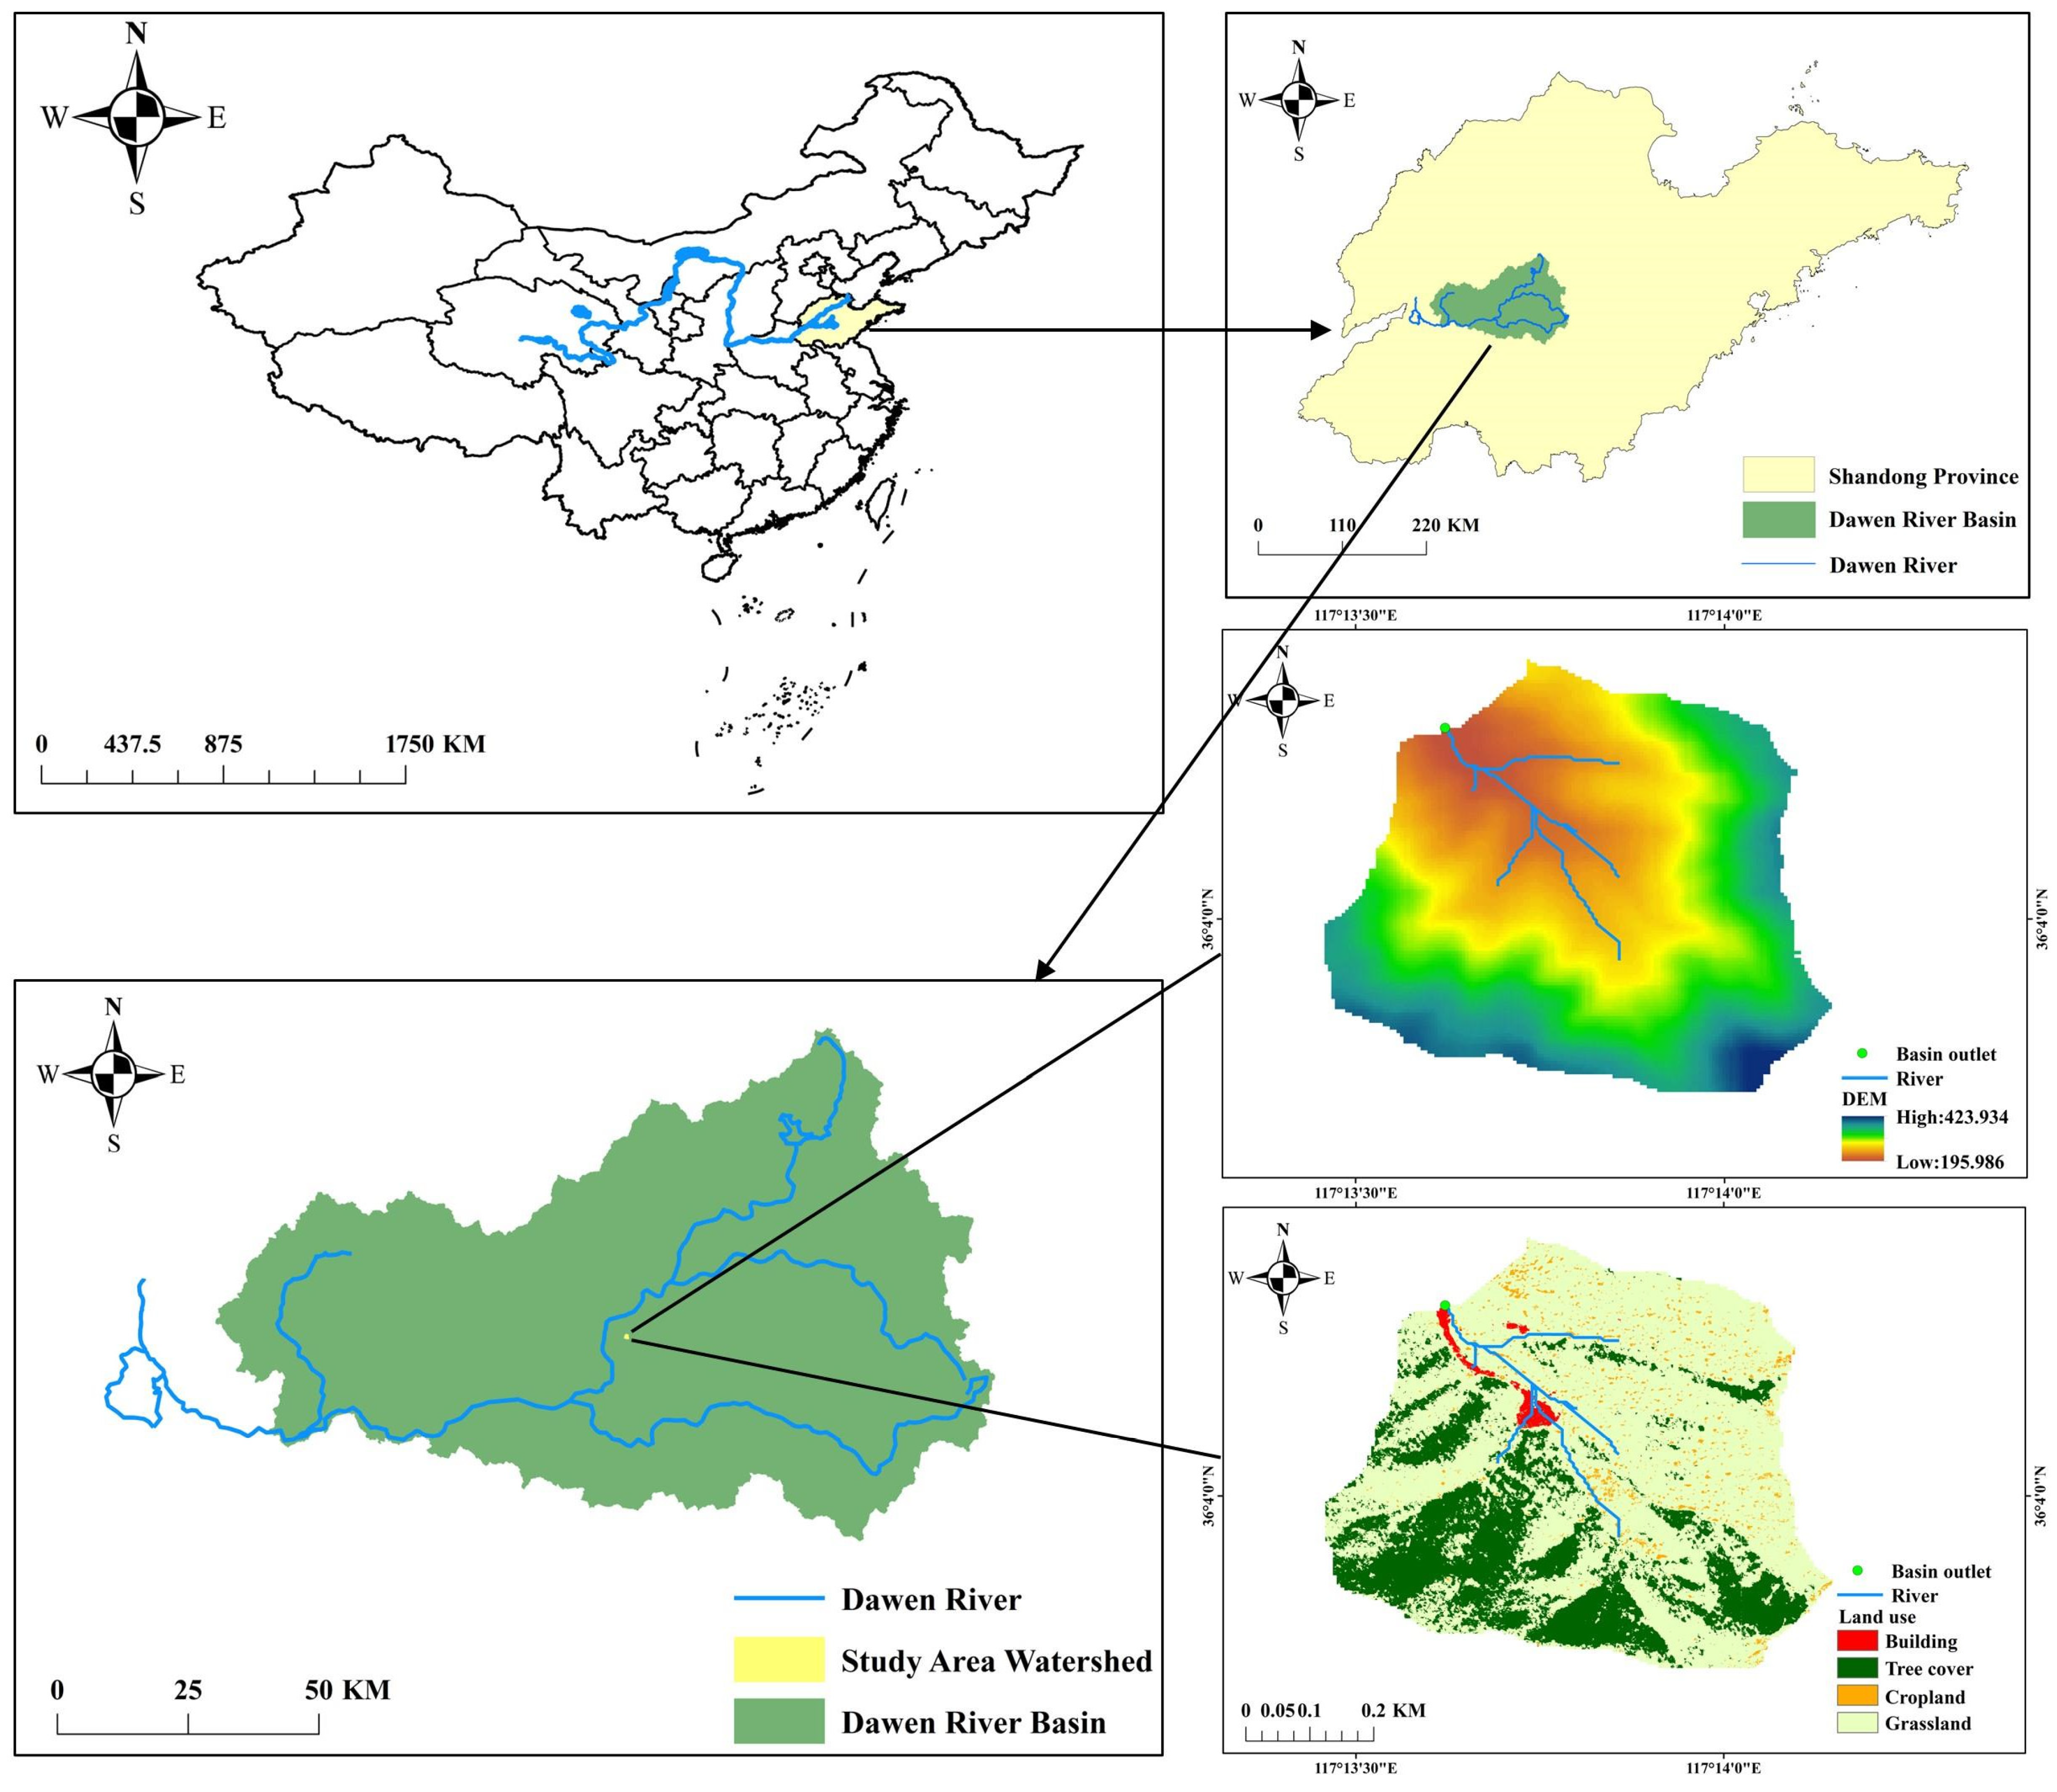
The study area is located at the Culai Mountain Integrated Soil and Water Conservation Observatory in Taian City, Shandong Province, China (117°13′27″–117°14′9″ E, 36°3′46″–36°4′32″ N; elevation 195.986–423.934 m; area 0.921 km
2), which is located in the Low Foothill Area of South Central Shandong Province, is part of to the Dawen River basin, and the first-level basin is the Yellow River basin (
Figure 1). The cumulative length of the dry ditch in the basin is 1.26 km, with an average ratio of 0.14; the cumulative length of main branch ditch is 4.09 km, with an average ratio of 0.18; and the average gully density is 5.82 km/km
2. A runoff observatory has been set up at the outlet of the watershed. The annual runoff of the basin is 2.189 × 10
5 m
3, and the annual sediment yield is 9.582 × 10
4 kg.
The region has a warm temperate continental monsoon climate with an average annual precipitation of 690.6 mm; the precipitation from June to September is 528.6 mm, accounting for 76.5% of the annual precipitation. This region features 2494 annual sunshine hours and an average annual temperature of 12.9 °C. The highest average temperature in the region is 26.4 °C in July, the lowest average temperature is −2.6 °C in January, the highest extreme temperature is 42.5 °C, the lowest extreme temperature is −22.6 °C, and the annual frost-free period is 190–210 days. The soil in the area is mainly brown soil and cinnamon soil, and the vegetation types in the watershed are mainly red pine, acacia, sagebrush oak, chestnut, and yellow wattle; the land use in the watershed is predominantly forest land, followed by grassland.
2.2. Rainfall Data Monitoring
The rainfall data were collected by siphon self-registering rain gauges in the observatory. The instrument recording error is ±0.05 mm, the recording time is 1 min, and the raw observation data include time and precipitation by time period.
Then, the rainfall events were divided. The interval between two rainfall events was controlled to be 6 h, the time when the precipitation was zero was greater than or equal to 6 h, then the subsequent rainfall was categorized as a second rainfall event [
37,
38]. A total of 59 different rainfall events overall were identified over the study period, and the precipitation (P, mm), rainfall duration (D, h), rainfall intensity (I, mm·h
−1), and maximum 30 min rainfall intensity (I
30, mm·h
−1) were collated for each rainfall event. The definitions of the four rainfall indicators are listed below:
Precipitation: The sum of the precipitation amounts for all time periods in the interval from the beginning to the end of the rainfall event is taken as the precipitation amount for this rainfall event (P).
Rainfall duration: Total duration of a rainfall event, from start to finish.
Rainfall intensity: This indicator characterizes the precipitation per unit time period and is calculated by dividing the total precipitation from a single rainfall event by the rainfall duration(D). The unit of this value is mm·h−1.
Maximum 30 min rainfall intensity: Means during a rainfall event, use the maximum value of the sum of precipitation in any 30 min time period (P30, mm), divided by 0.5 h; the value obtained is the maximum 30 min rainfall intensity (I30, mm·h−1).
2.3. Runoff and Sediment Yield Data Monitoring
The study area has a runoff station at the outlet of the watershed, where HCJ1 self-registering water level meter and automatic monitoring device for runoff and sediment yield in small watersheds are installed, which are international advanced devices capable of realizing automation and refinement of runoff and sediment yield data collection. The data collected by the device are copied out through the interface, and the original data interval is five minutes, including the time period runoff and sediment content. The formula for calculating the runoff (W, m
3) and the sediment yield (S, kg) for each rainfall event is as follows:
where
denotes runoff by a rainfall (m
3),
is streamflow (m
3/s) recorded by the device at the beginning of the time period,
is streamflow (m
3/s) recorded by the device at the end of the time period,
is the number of periods of this rainfall, and
is the duration of the time period(s).
where
denotes sediment yield by a rainfall (kg);
is loss of dry river sediment (kg/s) recorded by the device at the beginning of the time period;
is loss of dry river sediment (kg/s) recorded by the device at the end of the time period; and the other symbols, such as
,
, are consistent with Formula (1).
The runoff and sediment yield data were compared with the occurrence time of 59 rainfall events to finalize a total of 11 rainfall events with runoff and sediment production during the study period; the occurrence time, precipitation, rainfall duration, rainfall intensity, maximum 30 min rainfall intensity, and runoff and sediment yield for each of the rainfall events with runoff and sediment production are shown in
Table 1.
2.4. Statistical Analysis
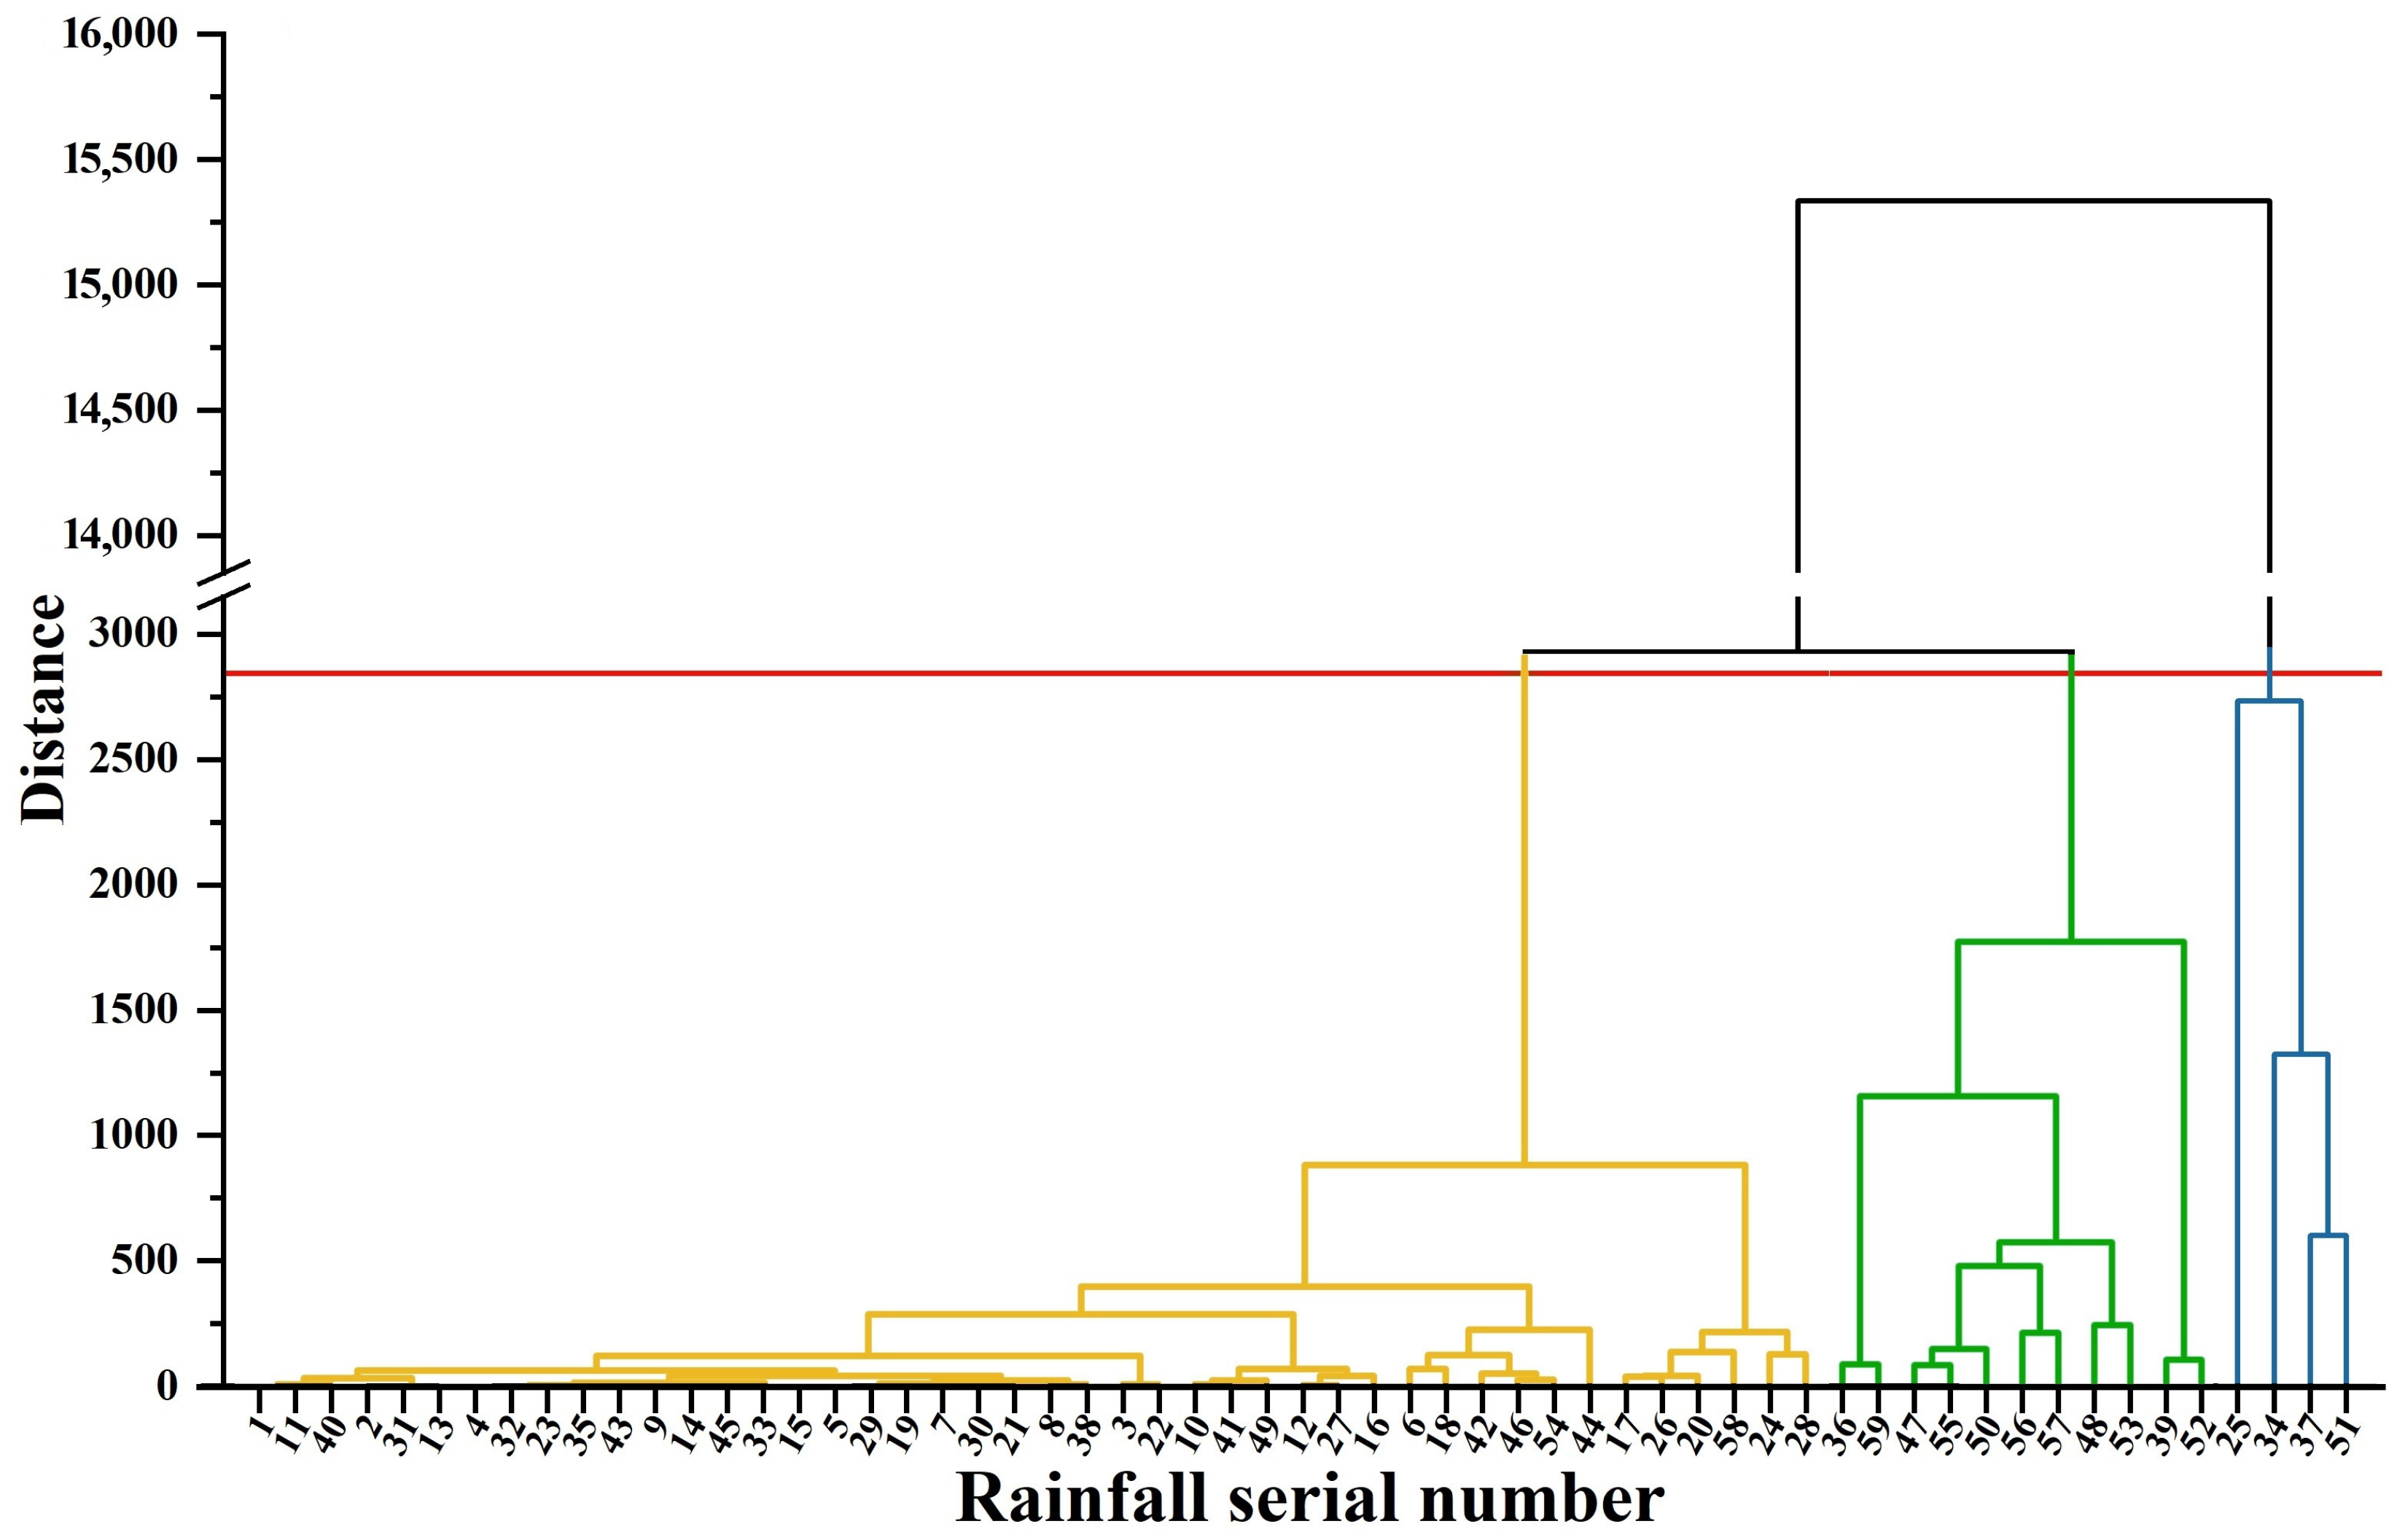
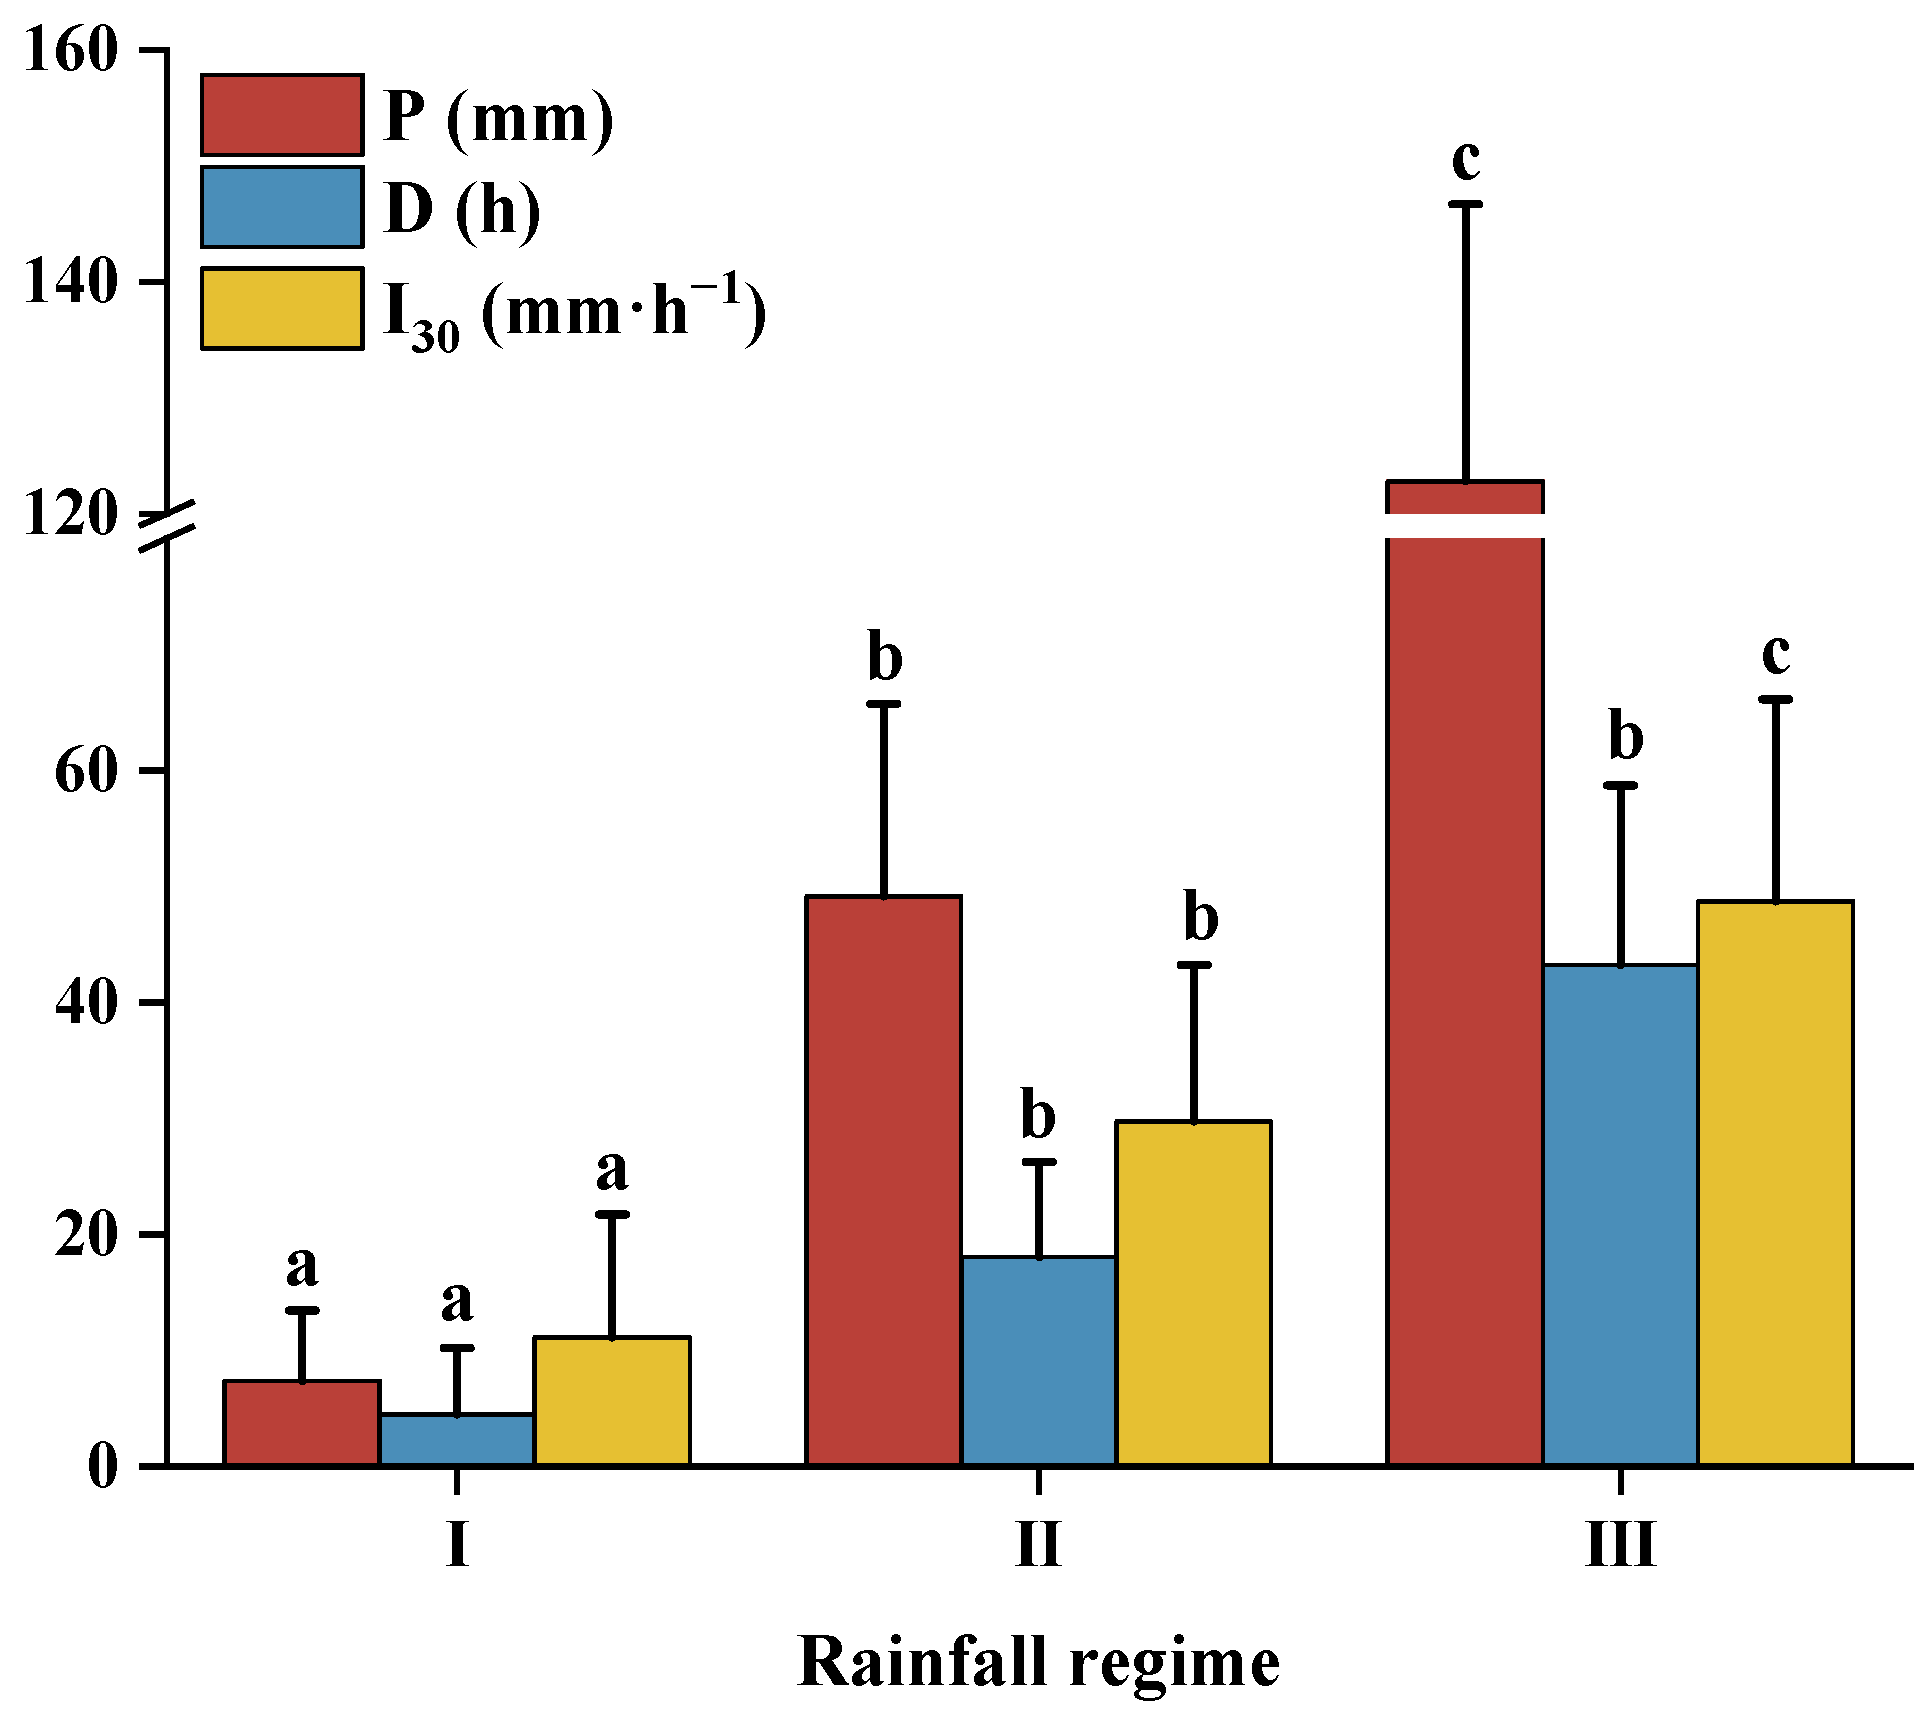
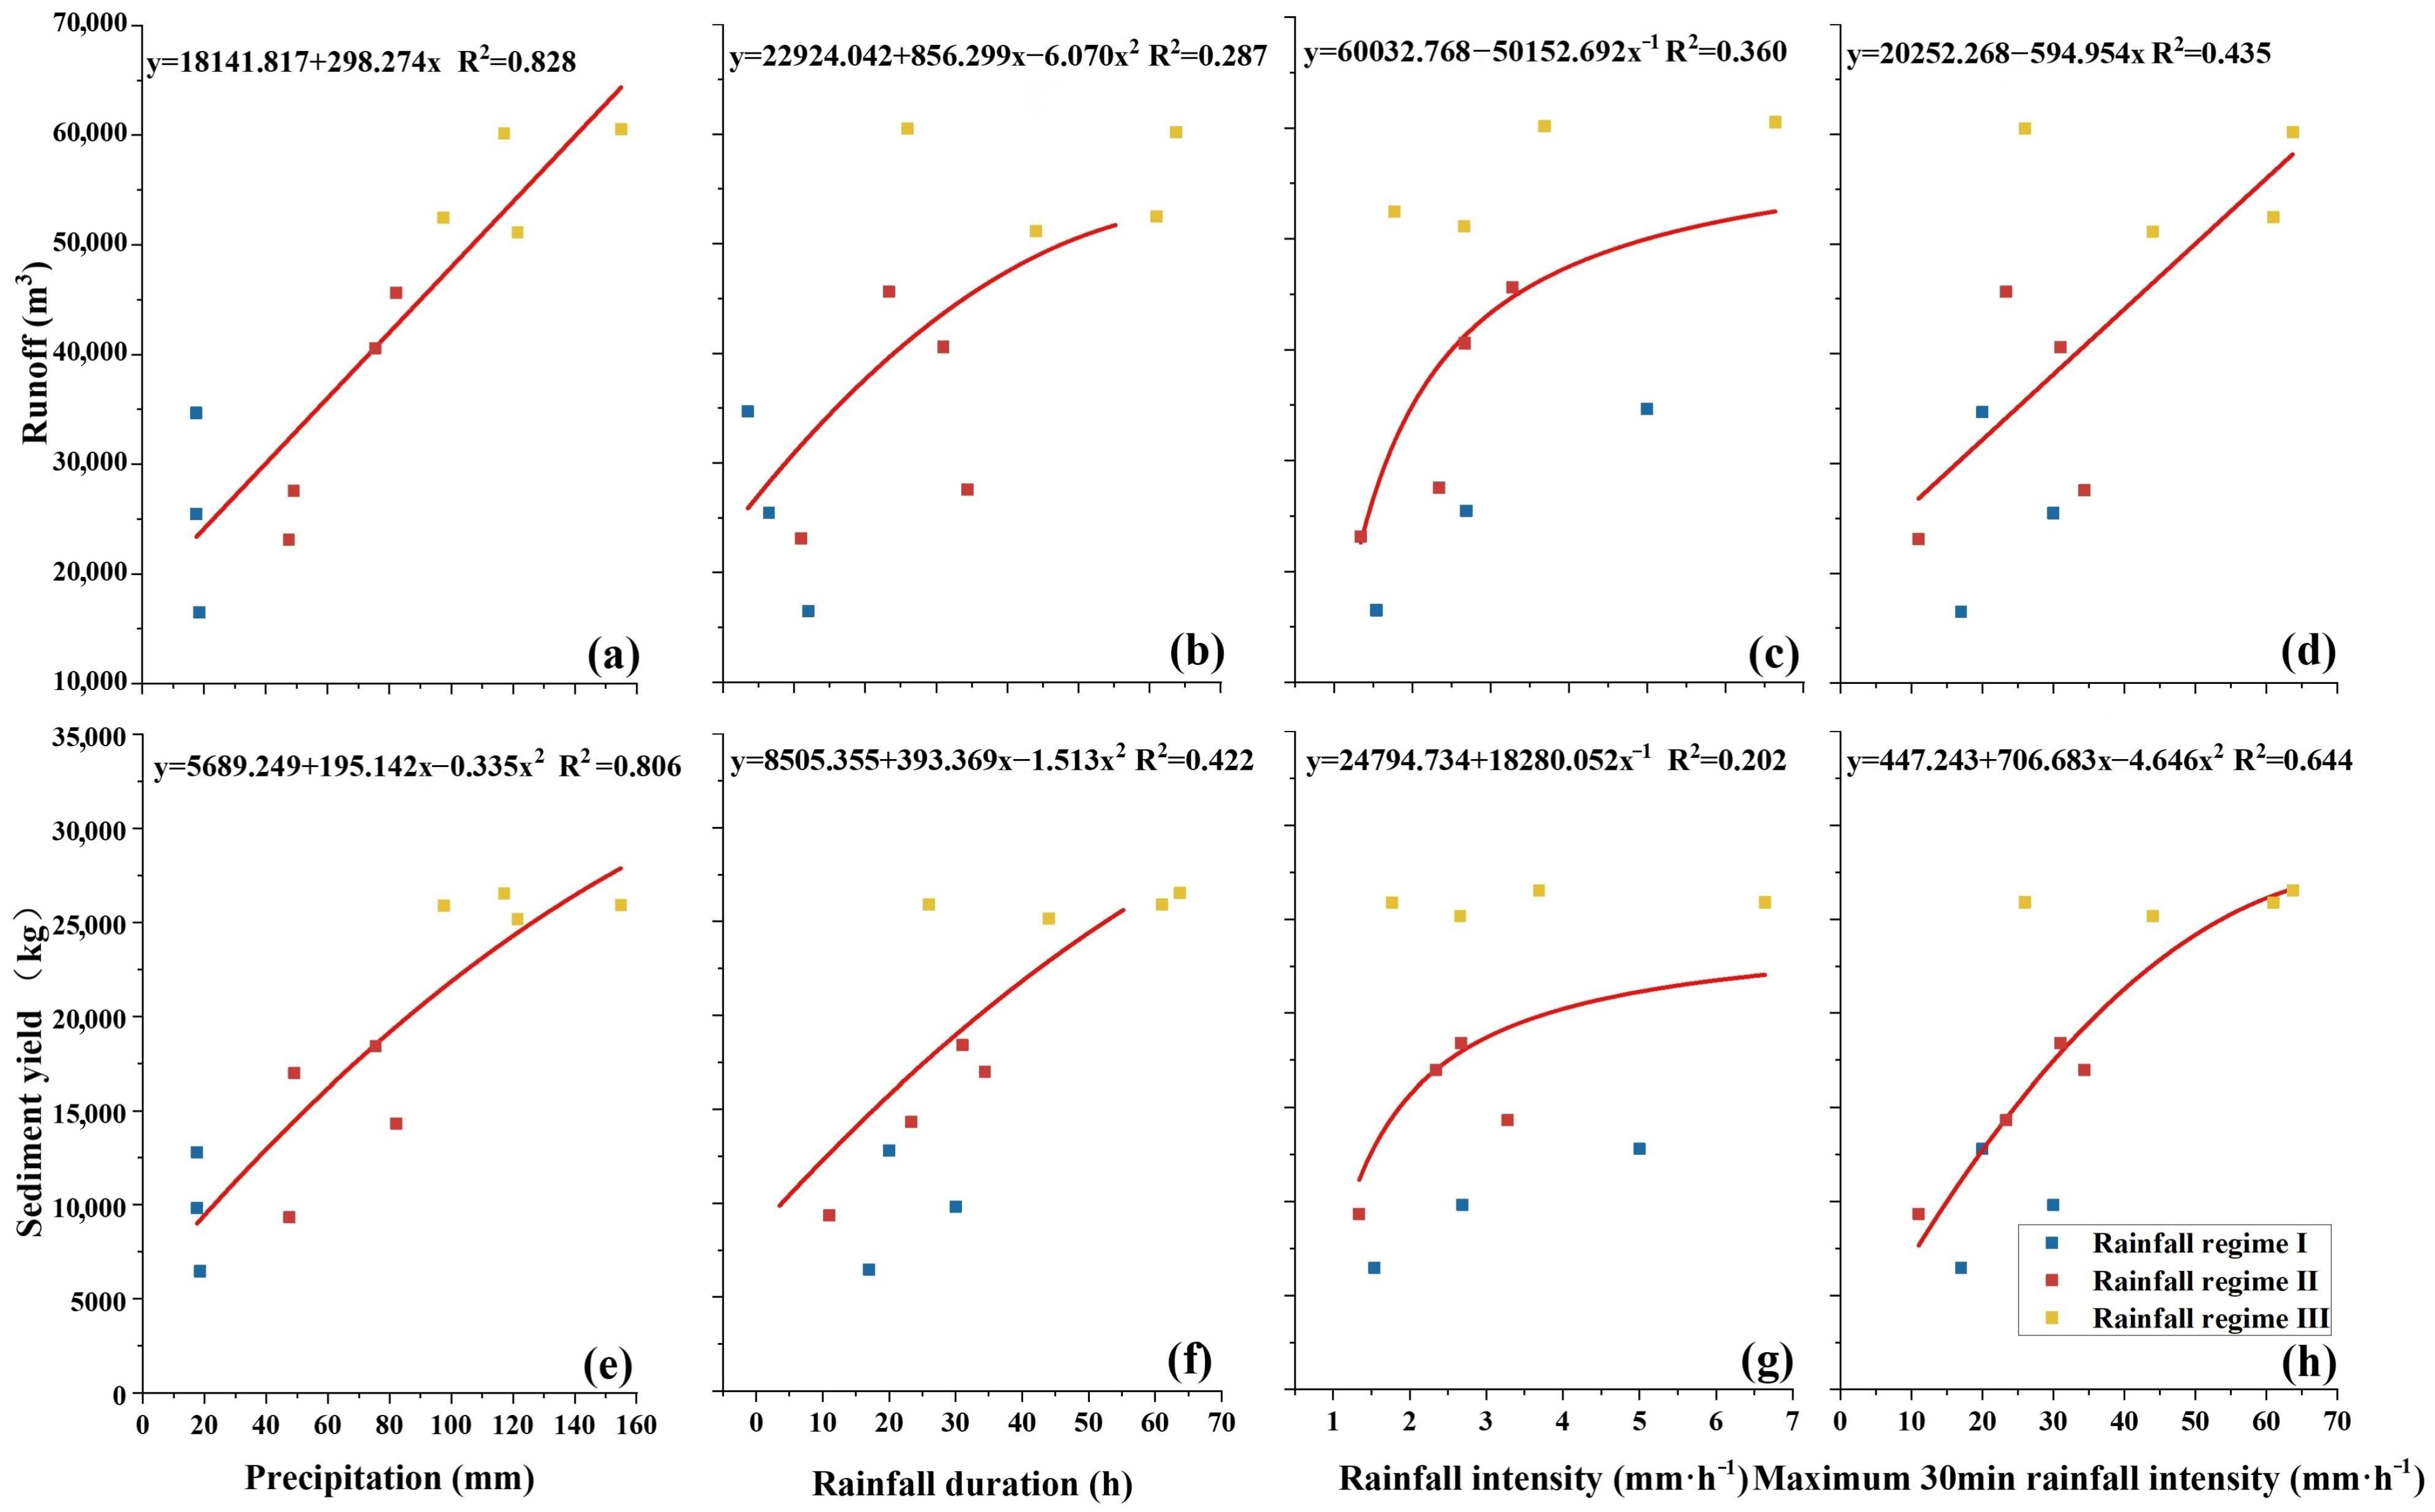
The correlation between rainfall characteristic indicators and runoff and sediment yield was explored in this study using Pearson correlation analysis, which identified the rainfall characteristic indicators used in clustering. The number of clusters was determined using the elbow rule, and the rainfall events were clustered using the K-means clustering method and the systematic clustering method. The results were then tested using ANOVA and Fisher discriminant analysis to confirm the findings, with primary, quadratic, power functions, etc., fit curves to represent relationships between individual rainfall variables, runoff, and sediment output. The multiple linear regression analysis method and the path analysis method were used to analyze the comprehensive effect of rainfall characteristic indicators on the runoff and sediment yield, quantify the degree of influence of each rainfall characteristic indicator on the runoff and sediment yield, select the rainfall characteristic indicators that have the most impact on the production of runoff and sediment, and carry out the construction of the rainfall characteristic indicators–runoff and sediment yield response relationship model.
2.4.1. Principle of the Elbow Rule
The principle of the elbow rule is as follows [
39]: if the sample is divided into most number of categories, then the structure within each category is looser, and the aggregation coefficient is smaller; the smaller the number of categories, then the tighter the structure within each category, and the larger the aggregation coefficient.
The aggregation coefficient will significantly drop as the number of categories is increased in the elbow rule approach when the number of categories is fewer than the ideal number of clusters, while when the number of categories is equal to the optimal number of clusters, the decrease in the aggregation coefficient will decrease abruptly, and thereafter the decrease in the aggregation coefficient will gradually level off with the increase in the number of categories. Therefore, the folding graph of aggregation coefficient is similar to the shape of the elbow, and the number of categories corresponding to the elbow position is the optimal number of clusters.
2.4.2. Path Analysis
Geneticist Sewall Wright proposed the through-path analysis in 1921 [
40], and this method has been continuously improved and refined to form a multivariate statistical technique. The method steps are as follows:
Assuming that there are
factors affecting the dependent variable
:
,
is the simple correlation coefficient of the independent variable
on the dependent variable
. The path analysis aims to decompose the simple correlation coefficient
into the direct effect of
on
and the indirect effect of
on the dependent variable
through
(other independent variables). In summary, the following formula holds:
The direct path coefficient, indirect path coefficient, and simple correlation coefficient can reflect the direct effect of the independent variable
on the dependent variable
, the indirect effect of the independent variable
on the dependent variable
through the other independent variables
, and the total effect among the many influencing factors on the dependent variable. However, there is inconsistency in the ranking of these coefficients, making it difficult for users to make decision judgments. The decision coefficient in the path analysis provides a solution to this problem. Yuan et al.’s [
41] proposal,
, should be used to represent the decision coefficient of the independent variable
on the dependent variable
. The decision coefficient reflects both the direct influence of the independent variable
on the dependent variable
and the indirect influence of the independent variable
on the dependent variable
through other independent variables, which can be used to reflect the size of the influence ability of each variable on the dependent variable in a comprehensive manner and make decision judgments accordingly.
For this paper, graphics were created using Origin 2018b program, and statistical analysis was performed using SPSS 26.0.
