Abstract
This study aimed to investigate the characteristics of marine heatwaves (MHWs) in the Makassar Strait and adjacent waters (MSAW) using the Optimum Interpolation Sea Surface Temperature (OISSTv2) dataset from 1982 to 2021. The analysis revealed a significant positive trend in the frequency and duration of MHWs, while the mean and maximum intensities displayed a negative trend over the 40-year period. By examining two different phases of the Pacific Decadal Oscillation (PDO), it was observed that the cold phase (more frequent La Niña events than El Niño) had higher MHW frequency and duration, whereas the warm phase (more frequent El Niño events than La Niña) exhibited higher mean and maximum intensities. Moreover, the occurrence of high-intensity MHWs was associated with weakened winds, the decaying phase of El Niño and positive Indian Ocean Dipole (IOD), and high net surface heat flux (NSHF). An intriguing finding emerged, indicating a notable lag of 7–9 months (10 months) between El Niño (positive IOD) events and the emergence of high-intensity MHWs. This lag suggests that MHWs are more likely to manifest during the transition towards La Niña and negative IOD conditions. Additionally, the study highlighted a stronger correlation between the El Niño–Southern Oscillation and MHW intensity in the MSAW compared to the IOD. Furthermore, the different intensities of MHWs were found to be linked to NSHF, which exhibited higher values during the warm phase of the PDO compared to the cold phase.
Keywords:
marine heatwaves; Makassar Strait; sea surface temperature; PDO; IOD; ENSO; net surface heat flux 1. Introduction
The phenomenon of global warming due to increasing anthropogenic activities in recent decades has had a broad impact, especially on the Earth’s climate [1]. The Intergovernmental Panel on Climate Change (IPCC) in its fourth assessment report (AR4), states that changes in global average surface temperature due to atmospheric carbon dioxide concentrations are in the range of 2–4.5 °C [2]. In relation to global warming signals (increase in the average temperature at a location), the frequency and intensity of extreme-temperature events (heatwaves) also increase as a consequence of anthropogenic climate change [3]. Heatwaves are prolonged periods of abnormally hot weather compared to the typical conditions for a particular area during that time of year. These heatwaves may be accompanied by elevated levels of humidity [4]. Additionally, heatwaves can manifest in the ocean as well, referred to as marine heatwaves (MHWs).
The earliest documented instances of MHWs, characterized by their duration, intensity, and spatial extent, are reported in the literature from 1982 to 2016. These events took place in various locations, including Benguela, Baja California, Peru, the Galapagos Islands, and the Caribbean Sea [5]. According to [6], global heatwaves between 1950 and 2011 exhibited an increasing trend in frequency, duration, and temperature intensity. Additionally, Ref. [7] discovered that from 1925 to 2016, there was a 34% rise in the average occurrence frequency of MHWs worldwide, accompanied by a 17% increase in their duration. Consequently, the number of days per year experiencing MHWs rose by 54%. These escalating trends in MHW intensity can be attributed to the overall increase in average sea temperatures and raise concerns about the potential for further increases in MHW occurrence due to the influence of global warming [8]. Over the past few decades, MHWs have been observed across oceans, inshore areas, and coastal waters worldwide [9,10,11,12,13].
Studies have demonstrated the severe deleterious effects of these temperature disturbances, ranging from sharp changes in marine ecosystems to long-term impacts on marine species, populations, and communities [14,15,16]. The occurrence of MHWs significantly affects marine ecosystems, such as the heatwaves that occurred in the northwest Mediterranean in the boreal summer of 2003 which resulted in thermal stratification and anomaly of an increase in sea surface temperature of 2–3 °C [17]. The MHWs have been reported to cause impacts on the physiology and metabolism of sea species. One of the significant environmental impacts of these MHWs was the death of benthic invertebrate populations as the impact of elevated temperatures on the organisms’ physiological processes [17] and the loss of seagrass ecosystems due to disruptions in seagrass metabolism, specifically the imbalance between photosynthesis and respiration [18]. Other impacts occur on coral reef ecosystems. The leading cause of widespread coral bleaching is prolonged exposure to high sea surface temperature (SST) anomalies [19,20]. Ref. [20] reported that coral bleaching in the north-central Red Sea was recorded when the area experienced severe MHWs in 2010 and 2015. Additionally, Ref. [21] discovered that an MHW event in 1998, which occurred after an exceptionally strong El Niño peak in the preceding year, resulted in mass coral bleaching in the Great Barrier Reef.
In tropical waters, the influence of global warming leads to the warming of the upper layer of water. This warming, in turn, intensifies thermal stratification, creating a more stable water column and limiting vertical mixing [22]. The strengthened thermal stratification can impede the upwelling process, which involves the ascent of cold, nutrient-rich water from the depths to the surface [23]. Consequently, this disrupts the supply of nutrients from the bottom to the surface, resulting in reduced plankton growth in the upper layers. Consequently, the combined effects of global warming and the occurrence of MHWs hinder the mixing processes in tropical waters, including Indonesian waters. These changes have adverse consequences on primary productivity, leading to a decline in fish stocks within the affected seas [15,24,25].
Indonesia is the largest archipelagic country that has close to 18,000 islands spanning around 5000 km at the crossroads of the Pacific and Indian Oceans [26,27]. Approximately 3.25 million km2 is the total territorial waters of Indonesia, which consist of shallow waters and deep waters, so Indonesia is a maritime nation and envisioned as a global maritime fulcrum (GMF) [28]. Geographically, Indonesia is flanked by two oceans, the Pacific Ocean-the largest ocean in the northwest, and the Indian Ocean in the west and south. This affects the climate conditions in Indonesia through ocean–atmosphere interaction. Due to its geographical location between the Pacific Ocean and the Indian Ocean, Indonesia is influenced by the interannual climate of these oceanic regions through remote forcing, such as El Niño–Southern Oscillation (ENSO) and Indian Ocean Dipole (IOD) [29,30,31]. The occurrence of ENSO and IOD has a significant impact on the oceanographic conditions of Indonesia, shaping their characteristics.
Indonesian waters serve as a crucial pathway for the global conveyor belt, a system of ocean currents for transporting water worldwide. The specific current that traverses through Indonesia is called the Indonesian Through Flow (ITF). Notably, the ITF carries warm and fresh Pacific waters to the Indian Ocean. This process significantly influences the SST variability in Indonesian waters, subsequently impacting the regional and global climate systems on a broader scale [32].
Positioned within the Coral Triangle, Indonesia stands as a marine biodiversity hotspot, hosting an abundance of marine and coastal flora and fauna. As a result, Indonesia boasts one of the world’s most prosperous and diverse coral reef ecosystems and other marine resources [33,34]. The country’s fisheries sector also thrives, generating substantial fishery products through both capture fisheries and aquaculture. To effectively manage its vast and diverse water territories, Indonesia has established several fisheries management areas known as Indonesia Fisheries Management Areas (IFMAs).
Research on MHWs in Indonesian waters is still very limited. Meanwhile, Indonesian waters have a very rich marine ecosystem, the MHW phenomenon can disrupt the ecology of local waters by directly impacting the physiology and survival of marine organisms, leading to coral bleaching, seagrass decline, altered species interactions, and the loss of habitat and ecosystem services. These ecological disruptions have significant implications for the health and resilience of marine ecosystems in Indonesian waters and beyond. Research on the dynamic characteristics of MHWs, such as frequency of occurrence, duration, and intensity can provide information and guidance for fisheries management in a water area [35]. In addition, understanding the aspects of MHWs can also provide knowledge to predict the occurrence of MHWs and their impact on ecology. Previous researchers [35,36,37,38,39] have conducted research on MHWs in several areas of Indonesian waters. However, further studies have not been carried out in other Indonesian territorial waters, such as Makassar Strait. There is a limited amount of detailed research on MHWs in the Makassar Strait and its surrounding waters. Investigating this subject in these areas is crucial not only because the Makassar Strait serves as the primary route for the ITF [40], but also because these areas boast rich marine and coastal ecosystems. In addition, the long-term variation of MHWs in the study area and their characteristics during different phases of the Pacific Decadal Oscillation (PDO) remain poorly understood.
Therefore, the objective of this study is to investigate the dynamic characteristics of MHWs that have occurred in the Makassar Strait and its surrounding waters over the last 40 years (1982–2021). Moreover, this study also aims to gain a better understanding of the potential physical drivers behind MHW events.
2. Materials and Methods
2.1. Study Area
IFMA is divided into 11 areas, as illustrated in Figure 1A. Among these areas, IFMA 713 encompasses the Makassar Strait (indicated as MS in Figure 1B) along with its adjacent waters, including Bone Bay, Flores Sea, and Bali Sea (represented as BB, FS, and BS in Figure 1B, respectively). This particular region is of significant interest to our study. IFMA 713 boasts abundant fish resources and serves as a crucial fishing ground in Indonesia, particularly for small pelagic, large pelagic, demersal, and reef fish species that are consumed by the local population. According to the Directorate General of Capture Fisheries (2015) [41], IFMA 713 contributed to the second-largest fish production in Indonesia in 2014, accounting for 12.43% of the total national production (6,037,654 tons). Moreover, these areas are characterized by diverse marine and coastal ecosystems, including coral reefs, mangroves, and seagrass [42,43].
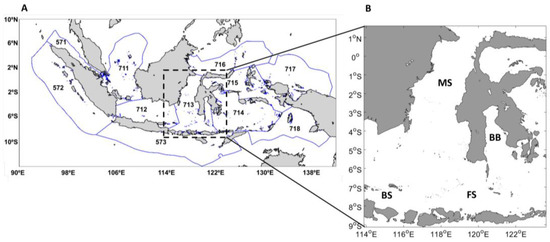
Figure 1.
(A) 11 IFMAs, (B) IFMA 713. The names of the seas (denoted by alphabet letter) are Makassar Strait (MS), Bone Bay (BB), Bali Sea (BS), and Flores Sea (FS).
2.2. Sea Surface Temperature
SST data served as the primary dataset utilized for analyzing the characteristics of MHW occurrences. The daily SST data underwent processing to derive both the climatological average SST value and the threshold value used for detecting and analyzing the occurrence of MHWs and their characteristics. In this study, daily SST data were used for 40 years from January 1982 to December 2021. The SST data were obtained from the Optimum Interpolated Sea Surface Temperature (OISSTv2) dataset which can be accessed at [44]. The OISSTv2 dataset is a reanalyzed product to produce smoother data and it resembles the original SST data because it is a combination of high-level satellite data and in situ data collected by buoys and cruise ships [45]. OISSTv2 is one of the globally available SST data with long temporal availability (starting from September 1981 until the present time) at 1/4-degree spatial resolution. These data have a daily mean temporal resolution (free from diurnal variability). This dataset only provides one level on the surface, with the depth range considered typically limited to the immediate vicinity of the sea surface, ranging from a few micrometers to a few meters in depth.
2.3. Physical Forcings of MHWs
In this study, the local factors, i.e., wind and net surface heat flux (NSHF) were studied on the formation of MHWs in the year with the highest number of frequency and total days, and the highest value of average duration, maximum intensity, and mean intensity. To review local wind factors on the formation of MHWs, wind magnitude anomaly calculations were conducted using daily wind data obtained from European Centre for Medium-Range Weather Forecasts (ECMWF) available at [46]. The data have a spatial resolution of 1/4 degree and a temporal resolution of six hours. Zonal and meridional wind speeds of 10 m above sea level (u10 and v10, respectively) were used. From these two data, the magnitude of wind speed was calculated. The monthly climatology and monthly anomalies were calculated afterward.
To support the analysis in this research, the Oceanic Niño and Dipole Mode Indices (ONI and DMI, respectively) were utilized to identify climate conditions and assess the interannual influences of ENSO and IOD on the variability of MHWs within the study region. The ONI represents the SST anomaly in the Niño 3.4 region (5° N–5° S, 170°–120° W), providing an average SST estimate for the equatorial Pacific waters. El Niño and La Niña are identified when the ONI exceeds 0.5 °C and falls below −0.5 °C, respectively [47]. Meanwhile, the DMI is calculated as the difference between the SST anomaly in the Western Tropical Indian Ocean (WTIO) and the Southeastern Tropical Indian Ocean (SETIO). Positive IOD (pIOD) events are identified when DMI values exceed +0.48 °C, while negative IOD (nIOD) events occur when DMI values fall below −0.48 °C [48]. The ONI and DMI data are derived from daily SST data analysis using Reynolds Optimum Interpolation version 2, which can be accessed at [49]. Furthermore, the PDO index data obtained from Japan Meteorological Agency (JAMSTEC) [50] was utilized to determine the PDO phases during the study period.
The data components used to calculate NSHF include surface net solar radiation (, net flux of infrared radiation from the sea (, surface latent heat flux (), and surface sensible heat flux (. The four data are taken from ECMWF [51]. The data have a spatial resolution of 1/4 degree and a temporal resolution of six hours. Each of these components’ annual average value was calculated, then summed up to obtain the NSHF value in years with notable MHW events. NSHF ( is defined as:
2.4. MHW Identification
In general, MHWs are defined as anomalous occurrences of hotter seawater on a prolonged basis, which can be described by their duration, intensity, rate of change, and coverage area. Ref. [3] specifically defined MHWs as anomalous occurrences of warmer seawater lasting for five consecutive days or more, with temperatures exceeding the 90th percentile based on a minimum of 30-year historical baseline climate. An 11-day window average was used to calculate the SST climatology for each day of the year for the 40-year data. We applied a 30-day moving average for smoother climatology as suggested by [3]. The 90th percentile for each day as the threshold value for MHWs was calculated using the same methods. Each MHW event had a distinct start and end time when the SST data exceeded the threshold for at least five days continuously.
Ref. [3] proposes a hierarchical set of measures or metrics to describe an occurrence of MHWs which is divided into primary, secondary, and tertiary metrics. Following [3], a main characterizing measure can describe the general ratio between duration and magnitude (intensity). We then computed the primary characteristics, namely the frequency, duration, maximum intensity, mean intensity, and total days of MHWs for 40 years (1982–2021) in each grid point. The frequency is the number of MHWs each year, while the duration of MHWs is defined as the period during which the MHWs last. Mean and maximum intensities are the average and highest SST anomaly during each MHW event, respectively. We also calculated the total days of MHWs for each year. The MHW analysis was implemented using the Matlab toolbox provided by [52].
In addition to reviewing the characteristics of MHWs over a 40-year period, we also examined their characteristics during two distinct PDO phases, specifically the warm and cold phases. PDO is a phenomenon of Pacific climate variability like ENSO but has a longer period of 20–30 years [53]. The positive (warm) and negative (cold) phases of PDO are determined based on the PDO index, as can be seen in Figure 2. The two phases of the PDO are characterized by more El Niño years during a PDO warm phase and more La Niña years during a PDO cold phase. The timespan of this research study is divided into two different phases of PDO, 1982 to 2007 (phase I) included in the warm phase of the PDO while 2008 to 2021 (phase II) included in the cold phase of the PDO [54]. The average characteristic during the warm phase (phase I) was then subtracted from that of the cold phase (phase II) of the PDO to see the differences in the characteristics and trends of the MHWs.
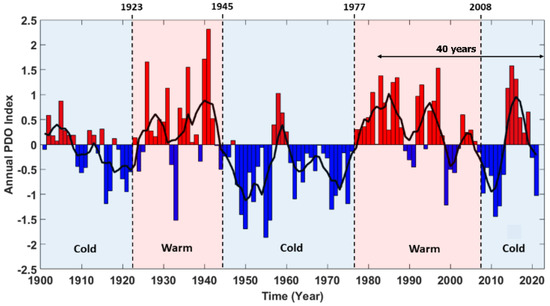
Figure 2.
Annual PDO index from 1900 to 2021. The black curve is the 9−year moving average.
3. Results
3.1. 40-Year Characteristics of MHWs
The characteristics of the average MHWs during the years 1982–2021 in IFMA 713 can be seen in Figure 3. The frequency of MHWs was in the range of 1.5–2.6 events per year (Figure 3A). Locations with high frequency are seen in the Flores Sea and Bone Bay (denoted by FS and BB in Figure 1B, respectively). Furthermore, for the MHW duration, the average ranged around 6–12 days for each event (Figure 3B). The areas with long duration were also mostly found in the south of IFMA 713 or the Flores Sea area, while the area with short duration was in Bone Bay and mid-Makassar Strait at 2° S. Figure 3C,D showed a distribution of the mean and maximum intensities of MHWs, respectively, in which the southern region of IFMA 713 tends to have a higher maximum intensity than the northern region. The mean and maximum intensities of MHWs are in the range of 1.0–1.3 °C and 1.1–1.7 °C, respectively (Figure 3C,D). The area with the highest mean maximum intensity is at coordinates 118.0°–119.6° E and 5.25°–6.17° S (Figure 3D).
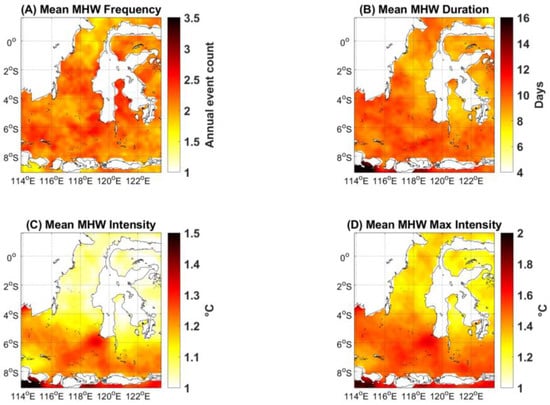
Figure 3.
Mean MHW properties (A) frequency, (B) duration, (C) mean intensity, and (D) maximum intensity during 1982–2021 in IFMA 713.
Because the analysis was carried out for 40 years, it is possible to review the characteristics of MHWs decadally in the last 4 decades. The MHW frequency and total days, as well as average duration, were identified to increase continuously throughout the decades (Table 1). The frequency in the fourth or last decade is 48% of the total frequency for four decades, which is nearly ten times higher than the frequency in the first decade. Similar to frequency, the total days’ parameter also shows a very high number in the last decade. The first decade accounted for only 3% of the total days for four decades, while the last decade accounted for 18.4 times more. Meanwhile, the average MHW duration was not increasing drastically unlike the MHW frequency and total days.

Table 1.
Decadal value of MHW properties: frequency, total days, average duration, and average maximum and mean intensities.
The average maximum intensity showed an increasing trend of around 0.04 °C per decade, except for the last decade, which appeared to be decreasing from the previous decade, from 0.86 °C to 0.81 °C. Meanwhile, the average mean intensity did not exhibit a significant trend. From the first decade into the second decade, mean intensity increased by 0.02 °C. However, after that, mean intensity continually decreased by 0.01 °C per decade. In total, in the past 40 years, on average in IFMA 713 there were 79 MHW events, with a total of 1122 MHW days, and the average duration, maximum intensity, and mean intensity were 11.1 days, 0.82 °C, and 0.69 °C, respectively.
Figure 4 displays the difference in characteristics of MHWs between the two phases of the PDO. The frequency of MHWs during the cold phase (phase II: more La Niña events) was found to be greater than during the warm phase (phase I: more El Niño events), with an average positive value (Figure 4A). Similar results were observed in the duration of MHWs, in which phase II exhibited longer durations than phase I (Figure 4B). In contrast to the MHW frequency and duration, there was a predominantly negative difference observed in the mean and maximum intensities of MHWs. This suggests that the MHW mean and maximum intensities were higher during the warm phase of the PDO compared to the cold phase (Figure 4C,D).
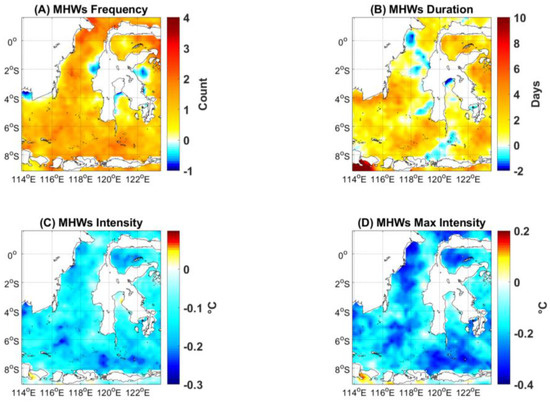
Figure 4.
Difference between MHW characteristics (A) frequency, (B) duration, (C) mean intensity, and (D) maximum intensity of cold phase of the PDO (2008−2021) and warm phase of the PDO (1982−2007) in IFMA 713.
The 40-year linear trend of MHW characteristics: frequency, duration, mean intensity, and maximum intensity in IFMA 713 can be seen in Figure 5A–D. The frequency of MHWs appears to have a positive linear trend ranging from 0 to 1.2 events per decade (Figure 5A). Almost all regions have a positive linear trend, except for the northern region of Bone Bay (denoted by BB in Figure 1B) which has a negative linear trend of −0.5 events per decade. Meanwhile, the area with the highest linear trend of MHW frequency is in the north of the Makassar Strait (denoted by MS in Figure 1B) with a linear trend of 1.3 events per decade. Based on the linear trend plot of the frequency of MHWs, it can be seen that almost all regions have a high level of significance marked by a p-value of lower than 0.05 (above 95% confidence level).
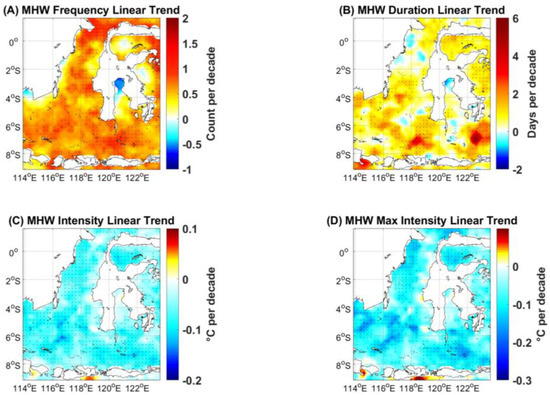
Figure 5.
The 40−year linear trend of MHW properties (A) frequency, (B) duration, (C) mean intensity, and (D) maximum intensity. The stippled areas represent a significant linear trend (p < 0.05).
The linear trend of the duration of MHWs is the same as the frequency of MHWs, which is spatially dominated by a positive sign (Figure 5B). However, some areas have a negative linear trend of MHW duration. The linear trend of the duration of MHWs ranged from −1 to 4 days per decade. Most of the positive linear trend values have a p-value of less than 0.05 so it can be classified as a significant linear trend. Meanwhile, areas that have a negative linear trend have a p-value of more than 0.05. Figure 5C,D showed that the mean and maximum intensities of MHWs have a dominantly negative linear trend, with a range of 0 °C to −0.12 °C and 0 °C to −0.2 °C per decade, respectively. However, there were a small number of areas in Makassar Strait with positive linear trends of MHW maximum intensity with a very small value of around 0.05 °C per decade. Most areas of IFMA 713 have a significant linear trend marked by black dots indicating a p-value of less than 0.05.
To better understand the temporal changes in the parameters of MHWs, a calculation of the spatial average of the frequency, duration, total days, mean intensity, and maximum intensity of MHWs each year across all areas of IFMA 713 was carried out. The annual characteristics can be seen in Figure 6. The frequency of MHWs throughout 1982–2021 appeared to have a maximum value in 2010 with an average number of events of 10 (denoted by the magenta bar in Figure 6A). Subsequent high frequencies occurred in 2005 and 2016 with 8 events for each year (denoted by the cyan and red bars in Figure 6A, respectively).
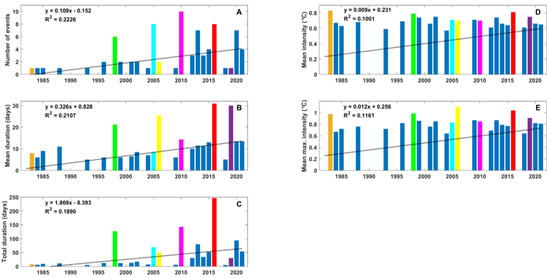
Figure 6.
(A) Frequency, (B) mean duration, (C) total duration, (D) mean intensity, and (E) mean maximum intensity of all MHW events that have occurred each year from 1982 to 2021 in the IFMA 713. The colored bars (apart from the blue ones) represent the prominent years. The dotted black lines represent linear regression.
The mean duration of MHWs showed the largest value in 2016 of 30.9 days (denoted by the red bar in Figure 6B), and close to that the second longest duration was in 2019 with 30.0 days (denoted by the purple bar in Figure 6B). Similar to the mean duration, the highest number of MHW days also occurred in 2016 with a total of 247 days. The second-highest was in 2010 with a total of 143 days (denoted by the magenta bar in Figure 6C). The maximum intensity has the largest value in 2006 with a value of 1.10 °C (denoted by the yellow bar in Figure 6E). Furthermore, the next highest maximum intensity occurred in 2016, reaching 1.04 °C. In contrast to the other parameters, the highest mean intensity of MHWs occurred during the first decade, i.e., in 1983 with 0.83 °C (denoted by the brown bar in Figure 6D). The next highest mean intensity occurred in 2016 at 0.81 °C. Moreover, Table 2 presents a summary of the years that attained the highest values for each of the MHW characteristics. In addition to the aforementioned years, the MHWs in 1998 (denoted by the green bar in Figure 6A–E) also have notably high characteristics, with a mean duration of 21.2 days (Figure 6B), maximum intensity of 0.99 °C (Figure 6E), mean intensity of 0.79 °C (Figure 6D), and 127 days of MHWs under 6 events (Figure 6A,C).

Table 2.
The years that reached the highest values for each of the MHW characteristics. The MHW characteristics obtained by averaging the SST in IFMA 713.
3.2. Variability of Prominent MHWs
Using the prominent MHWs detected in Figure 6, we computed a spatial average of SST for the entire IFMA 713. We then created time-series graphs for each year (1983, 1998, 2005, 2006, 2010, 2016, and 2019), depicting the development of each MHW event in those years and categorizing them based on intensity [55], as shown in Figure 7A–G.
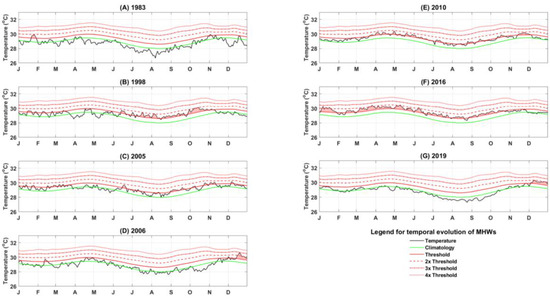
Figure 7.
Time series of daily SST and the corresponding MHW events in (A) 1983, (B) 1998, (C) 2005, (D) 2006, (E) 2010, (F) 2016, and (G) 2019. Those graphs are acquired by averaging the SST over the IFMA 713. The green and red lines represent the long-term climatology and MHW threshold, respectively. The black line represents the daily SST. The first, second, and final red dashed lines represent 2, 3, and 4 times the threshold (upper limit for Category I, II, and III), respectively. Meanwhile, the light red shade shows the incidence of MHWs.
In 1983, a single event of MHWs was detected during the west monsoon (January) (Figure 7A). This event lasted for a short duration of 8 days, reaching a maximum intensity of 0.98 °C, which falls under Category I. Despite its rapid onset and offset, this phenomenon exhibited a relatively high mean intensity of 0.83 °C. Moving on to Figure 7B, a total of six MHWs occurred throughout 1998, each with varying durations and intensities. Two events were categorized as moderate MHWs (Category I), while the remaining four were classified as strong MHWs (Category II).
Throughout 2005, MHWs occurred 8 times, being the second-highest frequency of MHWs in a year after 2010 with 10 events (Figure 7C). However, most MHWs lasted only around 5–10 days, except for September MHWs, which extended for a duration of 24 days. Meanwhile, there were only two events of MHWs in 2006 (Figure 7D). The two events resulted in a mean maximum intensity of 1.10 °C, making it the highest mean maximum intensity of all 40 years.
In 2010, there were a total of ten incidents of MHWs, making it the year with the highest frequency of MHWs (Figure 7E). All these MHWs were categorized as Category I, with a mean intensity of 0.70 °C and a mean maximum intensity of 0.85 °C. Moving on to Figure 7F, it is evident that in 2016, MHWs occurred nearly year-round with significant intensity. The year 2016 recorded the highest total number of MHW days, with a duration of 247 days. Moreover, the intensity of these events was relatively high, making 2016 the second-highest in terms of mean intensity and mean maximum intensity among all 40 years.
In 2019, there was only a single occurrence of MHWs. Interestingly, the SST in 2019 was predominantly below the climatological mean (Figure 7G). However, on December 4th, an MHW began to form and persisted into the following year, lasting for a total of 30 days. During this period, the MHW reached a maximum intensity of 0.91 °C, placing it in Category II, with a mean intensity of 0.74 °C. This 30-day MHW in 2019 contributed to the second-highest mean duration for that year, surpassed only by 2016.
3.3. Physical Factors of MHWs
In the formation and maintenance of MHWs, the mixed layer heat budget is an important factor, and it can be defined as follows [56]:
where T is the mixed layer temperature, t is time, is the net surface heat flux, is the density of seawater, is the heat capacity of seawater, and is the mixed layer depth. However, at this stage of the research process, it is still difficult to obtain the heat advection and diffusion data in the Indonesian seas, both based on observations and numerical models. A complex bathymetry and high tidal mixing within the Indonesian seas make it difficult to estimate the heat advection and diffusion based on the model outputs as they may not reproduce a correct SST within the Indonesian seas, especially in the Makassar Strait and the adjacent waters [57,58].
Therefore, in this study, we only considered the role of (NSHF) on the SST changes within the heat budget formulation. To what extent this heat advection and diffusion could modulate the SST changes is still unresolved in our current investigation. Detailed analysis of the heat budget calculations incorporating heat advection and diffusion is not within the scope of this research and can be considered in a future study. Nevertheless, we have also investigated the correlation between the occurrence of MHWs during the prominent years and various factors, including local forcing like wind speeds that influence vertical mixing, as well as remote forcing associated with large-scale climate variability, such as the ENSO and IOD. Based on these investigations, we hypothesize that higher wind speeds, promoting enhanced vertical mixing, will be inversely correlated with the occurrence and intensity of MHWs in the Makassar Strait area. Furthermore, we expect a positive correlation between La Niña events, characterized by warmer sea surface temperatures near Indonesian waters, and the occurrence and intensity of MHWs. Similarly, negative phases of the IOD, reflecting warmer sea surface temperatures in the eastern Indian Ocean, are hypothesized to be positively correlated with the occurrence and intensity of MHWs in the region.
3.3.1. Local Wind Forcing
Weak winds can play a role in reducing heat loss from the sea to the atmosphere through sensible and latent heat fluxes, causing positive heat content anomalies in the sea [13]. Wind also plays a role in vertical mixing which can stir the water mass and lift the cold-water mass from the depths. Therefore, weak winds cause low vertical mixing so that heat is stored and accumulated in the surface layer [11]. This decrease in vertical mixing was an important driver for many MHWs events [59]. In this section, we analyzed the wind speed characteristics during the significant years of MHWs.
Figure 8 illustrates the annual average wind speed anomaly, calculated based on monthly climatological data. The analysis reveals a consistent pattern of negative wind anomalies (weaker wind) during the years of prominent MHWs: 1983, 1998, 2005, 2010, and 2016. Specifically, during the high-intensity MHW years of 1983 and 1998, negative wind anomalies of −0.26 m/s and −0.31 m/s were observed, respectively, indicating that the actual wind speed was below the expected or average value.
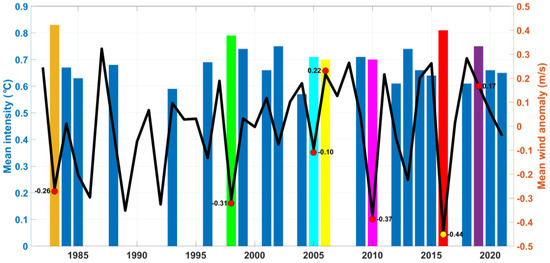
Figure 8.
Annual wind speed anomaly over the period of 1982−2021, along with the mean intensity of MHWs within the IFMA 713. The colored bars, excluding the blue ones, represent the prominent MHW years. Dots on the graph indicate the wind speed anomalies during those notable MHW years, and the corresponding values (in m/s) are highlighted in the text.
Furthermore, in the years with the highest MHW frequencies, namely 2010 and 2016, the wind anomalies reached their lowest levels in 40 years, with values of −0.38 m/s and −0.44 m/s, respectively. This indicates significantly weaker wind conditions during those years. In 2005, a year with a high MHW frequency, the wind speed was also weaker than usual, with a negative anomaly of −0.10 m/s. These findings suggest that the presence of weak wind conditions contributes to the formation of MHWs. However, it is worth noting that in 2006 (the year with the highest mean maximum intensity) and 2019 (the year with the second-highest mean duration), the average local wind exhibited a positive anomaly of 0.22 m/s and 0.17 m/s, respectively. This implies that factors other than wind speed may have played a significant role in the formation of MHWs during those years.
3.3.2. Remote Forcings
To examine the relationship between MHW events in IFMA 713 and large-scale climate modes, such as ENSO and IOD for the period of 1982–2021, we conducted cross-correlation calculations between the mean intensity of MHWs in IFMA 713 and both ONI and DMI. The mean intensity was chosen as a primary metric for MHWs, reflecting their strength. The cross-correlation between MHW mean intensity and ONI is presented in Figure 9A. In our investigation, we assume that the ENSO climate mode acts as the driving force behind MHWs, rather than a reciprocal relationship. Therefore, we will focus on the correlation within the positive x-axis, representing the MHW lag. This lag specifically refers to the change in ONI preceding the subsequent alteration in the mean intensity of MHWs.
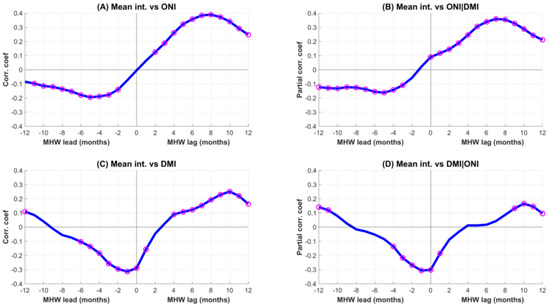
Figure 9.
The lead−lag correlations between the MHW mean intensity and the following variables in IFMA 713: (A) ONI, (B) partial correlation with ONI, (C) DMI, and (D) partial correlation with DMI. The magenta dots represent significant correlations (p < 0.05).
In IFMA 713, a distinct relationship between the ENSO climate mode and MHWs was observed, as shown in Figure 9A. The two variables exhibited a positive correlation, indicating that higher ONI values were associated with greater MHW mean intensity. Specifically, stronger El Niño events preceded more intense MHWs by approximately 8 months. Notably, during the decay phase of El Niño in IFMA 713, around 7–9 months after its peak, there was a notable occurrence of strong MHW intensity. The highest maximum correlation coefficient between the mean intensity of MHWs in IFMA 713 and ONI reached 0.4 (indicated by the blue line in Figure 9A) with an 8-month lag.
In addition, we investigated the partial cross-correlation between the mean intensity of MHWs and the ONI in IFMA 713. Our primary focus was to gain insights into the exclusive role of the ENSO climate mode, independent of the IOD, and to identify the primary climate mode that predominantly impacts MHWs (refer to Figure 9B). The results of the partial cross-correlation analysis revealed a slightly lower coefficient correlation value compared to the scenario with no partial correlation, as depicted in Figure 9A. The maximum correlation observed was 0.37, with a lag of 7 months (Figure 9B). These findings suggest that the IOD mildly strengthens the relationship between ENSO and the mean intensity of MHWs.
We conducted further research on the connection between MHWs in IFMA 713 and the IOD climate mode by analyzing the cross-correlation between the 40-year mean intensity of MHWs and DMI (Figure 9C). Building upon the notion that the IOD climate mode impacts the occurrence of MHWs, our focus shifts to the positive x-axis, which represents changes in DMI preceding subsequent alterations in the mean intensity of MHWs within IFMA 713. Notably, the maximum correlation coefficient in this region reached 0.25 with a lag of 10 months.
Furthermore, upon removing the effects of ENSO using partial correlation, the results revealed a significantly reduced positive correlation coefficient between MHW mean intensity in IFMA 713 and DMI (Figure 9D). This suggests that the changes in MHW mean intensity may be predominantly influenced by ENSO rather than IOD (Figure 9B,D). Overall, the maximum correlation coefficients reached 0.18 with a lag of 10 months. The relationship between IOD and MHWs in IFMA 713 exhibited a positive correlation, indicating that higher occurrences of positive DMI or pIOD will lead to a higher mean intensity of MHWs in the subsequent 10 months (during the pIOD decay).
To enhance the findings presented in Figure 9, Figure 10 provides a clearer depiction of the time lag between the peak of El Niño and the peak of positive SST anomalies, which ranges from approximately 7 to 9 months. Additionally, the prominent years of MHWs in 1983, 1998, 2010, and 2016 share a common characteristic in terms of ENSO mode, transitioning from strong El Niño towards La Niña. In each of these preceding years, a strong El Niño event occurred, predominantly peaking at the beginning of the northwest monsoon (December). Subsequently, in 1983, 1998, 2010, and 2016, the intensity of El Niño gradually diminished and gave way to La Niña conditions.
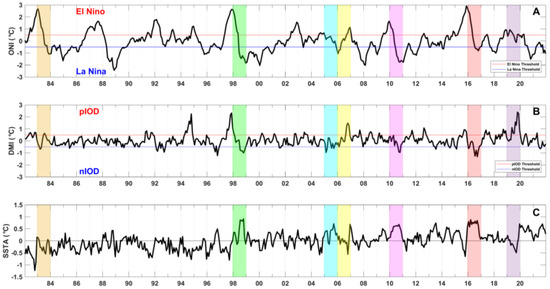
Figure 10.
Time series of (A) ONI, (B) DMI, and (C) SST Anomaly. The ONI and DMI values are presented monthly and have been smoothed using a 6−month moving average. In graphs (A,B), the red line represents the El Niño (pIOD) threshold, while the blue line represents the La Niña (nIOD) threshold. The graph in (C) illustrates the daily SST anomaly averaged over the IFMA 713, which has also been smoothed using a 6-month moving average. The shaded color highlights the prominent years of MHWs, namely 1983, 1998, 2005, 2006, 2010, 2016, and 2019.
After calculating the correlation coefficients and lags between the mean intensity of MHWs and ENSO and IOD, as shown in Figure 9, the next step involves mapping the annual occurrences of MHWs to gain a comprehensive overview of their frequency in IFMA 713 across different ENSO and IOD phases (Figure 11). This analysis allows us to examine the cumulative intensity values and total duration of MHWs associated with the ENSO and IOD indices, providing a more holistic understanding of MHW patterns in IFMA 713. To select the ENSO and IOD indices, we focused on the period from August to December, as these months exhibited stronger values compared to other periods within the 40-year timeframe. Subsequently, the annual occurrences of MHWs were plotted against the cumulative intensity values on the y-axis. In this plot, the cumulative intensity values were derived using MHW data from the subsequent year and aligned with the ENSO and IOD index data on the x-axis. This approach is informed by the findings of the cross-correlation analysis, which revealed a lag of 7–9 months between the incidence of ENSO and IOD and the occurrence of MHWs. Consequently, the ENSO and IOD indices in year x contribute to the manifestation of MHWs in year x + 1.
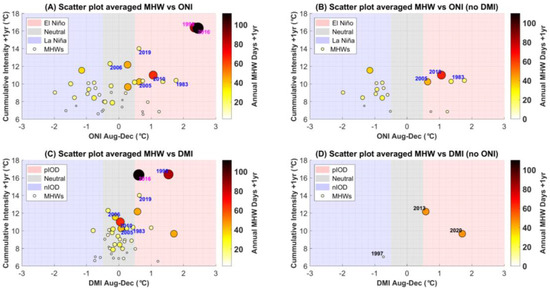
Figure 11.
Scatter plot between annual MHWs in IFMA 713 and four different indices: (A) ONI, (B) partial ONI, (C) DMI, and (D) partial DMI. Blue shades indicate a negative phase (La Niña and nIOD), grey shades indicate a neutral phase, and red shades indicate a positive phase (El Niño and pIOD).
Figure 11A displays the distribution of annual MHW occurrences across ENSO phases. It is worth noting that out of the total events, 12 were attributed to the El Niño phase, while the neutral and La Niña phases accounted for 13 and 15 events, respectively. However, a closer examination of the cumulative intensity values and the number of annual MHW days reveals a clear association between stronger MHW events and the El Niño phase. Interestingly, among the seven previously identified prominent years, six were situated within the El Niño phase, further emphasizing its significance. Notably, the two highest values of cumulative intensity and the greatest number of annual MHW days coincided with an ONI value of approximately 2.4 °C, indicating the occurrence of a strong El Niño event. It is crucial to consider the lag information from previous analyses when interpreting these findings.
In examining the distribution of annual MHW occurrences in relation to the IOD phase, it is important to highlight that IOD events have been relatively scarce compared to ENSO events over the past 40 years. As a result, the majority of MHW events took place during the neutral IOD phase (Figure 11C). Comparing the pIOD and nIOD phases, we find that a greater number of MHW events occurred during pIOD, totaling eight years. However, only three prominent years, namely 1998, 2016, and 2019, were associated with the pIOD phase.
To gain further insights, we analyzed the distribution of MHW years using a scatter plot, focusing separately on ENSO-only and IOD-only conditions (Figure 11B,D). By excluding years with pIOD and nIOD conditions (Figure 11B), we can observe the distribution of MHW years solely during ENSO phases. Comparing this to Figure 11A, we notice that when the IOD phase is removed, there are only 18 years of MHW occurrences. Notably, within the ENSO-only phase, the highest cumulative intensity and annual MHW days were observed in 2010, reaching values of 11°C and 80 days, respectively. These values, however, are lower than those depicted in Figure 11A. This difference can be attributed to the significant MHW events in 1998 and 2016, which resulted from the combined influence of El Niño and pIOD, effectively reinforcing each other. Continuing our analysis, Figure 11D examines the distribution of MHW years during neutral ENSO conditions, while considering only the IOD phase. Remarkably, the number of MHW years is considerably low, totaling only three years.
3.3.3. Net Surface Heat Flux
Overall, this study reveals that the development of MHWs was supported by weak winds, as well as the decay of El Niño and pIOD, as demonstrated in Figure 8, Figure 9 and Figure 10. However, there were exceptions observed in 2006 and 2019 when the positive anomaly of local winds did not favor the occurrence of MHWs. Furthermore, in 2006, both the remote forcing modes (ENSO and IOD) did not support the manifestation of MHWs. Similarly, in 1983, 2005, and 2010, despite weak wind conditions, only the ENSO mode, specifically the decay of a strong El Niño, supported the remote forcing, while the IOD mode remained neutral. Hence, it is likely that other factors played a role in driving the heightened characteristics of MHWs in 1983, 2005, 2006, 2010, and 2019.
To delve deeper into this aspect, the study calculated the NSHF to assess the energy absorbed and released by the ocean’s surface. Figure 12A–G present the average NSHF values for 1983, 1998, 2005, 2006, 2010, 2016, and 2019. Through spatial averaging, it was determined that the NSHF values for 1983 and 2019 were the highest among the seven years, reaching 42.67 and 42.59 W/m2, respectively (as indicated in Table 3). This substantial NSHF likely contributed to the elevated mean intensity of MHWs in 1983 (0.83 °C) and 2019 (0.75 °C). In the remaining years, the NSHF ranged from 29.46 to 40.38 W/m2.
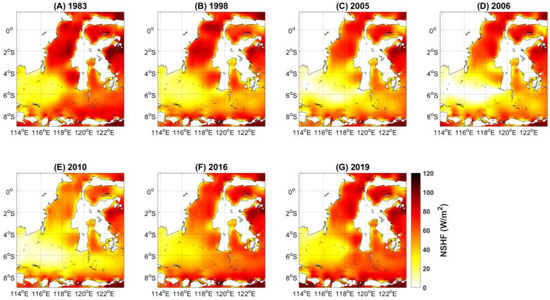
Figure 12.
Yearly average NSHF expressed in W/m2 for the following years: (A) 1983, (B) 1998, (C) 2005, (D) 2006, (E) 2010, (F) 2016, and (G) 2019.

Table 3.
The average surface heat flux components (SWR, LWR, SHF, and LHF) and the NSHF (the total of all components) for the 7 prominent years across the IFMA 713.
The calculation of NSHF involves four key components of surface heat flux: shortwave radiation (SWR), longwave radiation (LWR), sensible heat flux (SHF), and latent heat flux (LHF). The NSHF represents the cumulative effect of these components, where a positive value indicates heat transfer from the atmosphere to the ocean, and a negative value signifies the opposite direction of heat flow. SWR refers to solar radiation absorbed by the ocean, contributing to the warming of its upper layer. The highest recorded total SWR during the studied period was in 2019 (216.80 W/m2), while the lowest was observed in 2010 (194.09 W/m2).
In contrast, LWR, SHF, and LHF are negative values, indicating heat loss from the ocean to the atmosphere. Both SHF and LHF are influenced by wind speed, with lower wind speeds leading to reduced heat transfer. Among these components, LHF represents the highest potential for heat loss through evaporative cooling [60]. Notably, the highest total LHF occurred in 2006 (−109.96 W/m2), while the lowest was recorded in 1983 (−100.40 W/m2). These values suggest that the ocean stored the highest amount of heat in 1983, as indicated by the negative LHF.
4. Discussion
4.1. Trends of MHWs
The findings in Section 3.1 were highly intriguing, particularly regarding the trends of MHWs in IFMA 713. From Table 1, we observed a notable increase in the frequency, duration, and total number of days associated with MHWs. However, contrary to expectations, both the maximum and mean intensity exhibited a decrease. This same trend persisted even after analyzing MHW characteristics by accounting for two phases of PDO and the 40-year linear trend. Notably, the frequency and duration continued to display an upward trend, while the maximum and mean intensities showed a consistent decline.
Based on the analysis of MHW characteristics during two phases of PDO, it was observed that the frequency and duration were higher in phase II, which corresponds to the cold phase. This can be attributed to the fact that in the cold phase of PDO, the SST anomaly in the western and central North Pacific Oceans tends to be higher [61]. Hence, the increased MHW characteristics during the cold phase can be influenced by the inherent variability of PDO itself. The dominance of La Niña during the cold phase leads to a positive SST anomaly in Indonesian waters. However, contrary to expectations, the mean and maximum intensities showed an opposing pattern (as shown in Figure 4C,D), with higher values observed during the warm phase (phase I) compared to the cold phase (phase II) of PDO. This discrepancy in the characteristics of MHW mean and maximum intensities suggests that their variations may not necessarily be driven by remote forcing associated with large-scale climate variability, such as PDO.
We proceeded to compute the average NSHF over a span of 40 years, as well as during phase I (warm phase of PDO) and phase II (cold phase of PDO) (see Figure 13A–C). Upon spatial averaging, the 40-year NSHF was determined to be 36.81 W/m2. Notably, the NSHF during phase I (warm phase) was measured at 37.77 W/m2, surpassing the value during phase II (cold phase) which stood at 35.05 W/m2. These findings suggest that the higher mean and maximum intensities observed during the warm phase, which coincided with a greater number of El Niño years, were closely associated with the elevated NSHF rather than the PDO phases.

Figure 13.
Average NSHF expressed in W/m2 for three distinct periods in IFMA 713: (A) 40 years (1982–2021), (B) warm phase of the PDO (1982–2007), and (C) cold phase of the PDO (2008–2021).
The frequency and duration of MHWs displayed a noteworthy increasing trend over the 40-year period (as shown in Figure 5A,B). These positive trends align with the global findings reported by [7], which also documented an upward trend in MHWs frequency and duration. MHWs are closely associated with rising SST [8]. Notably, SST in the Indonesian waters, specifically in the Makassar Strait and the Flores Sea, exhibited a significant upward trend. According to [56], this warming trend in Indonesian waters can be attributed to the shoaling of the mixed layer depth, creating favorable conditions for surface heat flux to warm the surface. It is plausible to suggest that the notable increase in MHW frequency and duration observed in IFMA 713 is linked to this SST trend. Given the concerning upward trends in MHWs, it becomes imperative to implement mitigation strategies aimed at reducing their detrimental impact on both the physical system and the ecosystem.
4.2. Possible Driving Forces of Prominent MHWs
In Section 3.3, we assessed four key factors: wind, ENSO, IOD, and NSHF, and their influence on MHWs in the study area. This analysis sheds light on how these factors contribute to our understanding of MHW dynamics. Notably, it was observed that during the most prominent MHW years, the wind conditions exhibited a negative anomaly, indicating weaker winds than normal. Weak winds can play a significant role in minimizing heat loss from the sea to the atmosphere through sensible and latent heat fluxes, leading to positive heat content anomalies within the sea [13]. Furthermore, winds also contribute to vertical mixing, which helps stir the water mass and bring up colder water from deeper layers. Consequently, weaker winds result in reduced vertical mixing, allowing heat to accumulate and be stored in the surface layer [11]. This decrease in vertical mixing emerges as a crucial driver for numerous MHW events [59].
Furthermore, in the Indonesian waters, the condition of El Niño (La Niña) is indicated by cooler (warmer) SST since the warm water in the Pacific pushed towards the eastern (western) Pacific. However, Figure 9 and Figure 10 revealed that El Niño, especially the strong ones, could generate MHWs in IFMA 713 with a time lag of 7–9 months. Extreme MHWs that occurred after strong El Niño years were also recorded in the southern waters of Java [35] and the southeastern coastal waters of Queensland, Australia [62], whereas they occurred during El Niño years in the coastal waters of Chile [13]. Ref. [62] found that a positive ONI or El Niño had a significant effect on a positive SST anomaly on the west coast of Queensland with a time lag of 7 months. The time lag of the ENSO index with the SST anomaly on the west coast of Queensland indicates that the same thing can happen with the SST anomaly in IFMA 713. The positive phase of ENSO can lead to wind weakening and a reduction in the vertical mixing of heat at the surface to the water column below so that the sea surface is warmer than usual [11].
Likewise, the positive correlation observed between the IOD and MHWs in IFMA 713 indicates that higher mean intensities of MHWs can be expected in the subsequent 10 months. This time lag suggests that MHW occurrences may be triggered by the decay of pIOD and develop during the transition toward a nIOD phase. Additionally, a study by [63] revealed that in 2016, the Southeastern Tropical Indian Ocean experienced the longest-lasting MHWs, which were triggered by eastward-propagating equatorial Kelvin waves associated with the nIOD phase.
The results depicted in Figure 11A–D demonstrate that the ENSO climate mode exerts a more dominant influence on the mean intensity of MHWs in IFMA 713 compared to the IOD. Upon comparing the partial correlation between MHW mean intensity and ENSO, as well as the IOD, it becomes evident that the changes in correlation magnitude between MHW mean intensity and regular ENSO (non-partial ENSO), relative to partial ENSO, are relatively smaller compared to the changes in correlation magnitude between MHW mean intensity and regular IOD (non-partial IOD), relative to partial IOD. This observation suggests that the impact of ENSO on IOD surpasses the impact of IOD on ENSO. Consequently, the influence of ENSO on MHWs in IFMA 713 exhibits greater strength when compared to IOD. Furthermore, Figure 12D also indicates that the influence of IOD on MHW occurrences in IFMA 713 is relatively minor in comparison to ENSO. These findings further support the earlier results, highlighting the higher or predominant influence of ENSO over IOD on MHW events in the IFMA 713.
Finally, the analysis of NSHF revealed that higher NSHF values appear to have contributed to the elevated mean intensity of MHWs (as depicted in Figure 12A–G). A previous study identified anomalous surface heat flux as a key driver of anomalous warming in the northeast Pacific [64]. Our findings indicate that SWR and LHF are the primary components contributing to NSHF in the IFMA 713. These results are consistent with previous studies conducted in other regions, such as the Indian Ocean and the west coast of Australia [12,65].
In this study, the factors contributing to the highest mean maximum intensity of MHWs in 2006 (as shown in Figure 6E) remain unresolved. As demonstrated in Figure 8 and Figure 11, local winds, ENSO, and IOD do not appear to be conducive to the SST warming observed during that specific year. Moreover, the NSHF value in 2006 (32.24 W/m2) was the second lowest among the other notable MHW years listed in Table 3. Therefore, it is essential to delve deeper into the physical mechanisms underlying this phenomenon. Incorporating heat advection and diffusion into the heat budget calculations could be a potential avenue for exploring these challenges. Addressing these complexities would require further research that extends beyond the scope of the present study.
5. Conclusions
This study investigates the occurrence of MHWs in IFMA 713, encompassing the Makassar Strait and nearby waters in the inner Indonesian seas, spanning the past four decades (1982–2021). Over this period, an average of 79 MHW events occurred in IFMA 713, resulting in a total of 1122 MHW days. The average duration, maximum intensity, and mean intensity of these events were 11.1 days, 0.82 °C, and 0.69 °C, respectively. The frequency, total duration, and average duration of MHWs have consistently increased over the decades, with these parameters being roughly ten, 18.4, and two times higher, respectively, in the fourth decade compared to the first decade. However, there is a tendency for the maximum and mean intensities of MHWs to decrease based on a linear trend analysis. When comparing the two phases of the PDO, it was observed that the frequency and duration of MHWs were higher during the cold phase, while the mean and maximum intensities were greater during the warm phase. These metrics appear to be linked to the NSHF, which was higher during the warm phase than the cold phase.
IFMA 713 experienced seven notable years with significant MHWs: 1983, 1998, 2005, 2006, 2010, 2016, and 2019. This study suggests that severe MHWs in the study region were associated with weakened wind speeds, the decay phase of El Niño and pIOD, as well as high NSHF values. Interestingly, there was a lag of approximately 7–9 months (10 months) between El Niño (pIOD) events and the occurrence of high-intensity MHWs, indicating a tendency for MHWs to manifest during the transitional period towards La Niña (nIOD) conditions. The findings also revealed a stronger association between the ENSO and MHW intensity in the Makassar Strait area compared to the IOD. However, the factors responsible for the highest mean maximum intensity of MHWs in 2006 remain unclear, as local winds, ENSO, IOD, and NSHF do not appear to explain the warming of SST in this case. Therefore, it is crucial to incorporate heat advection and diffusion calculations into the heat budget formulation to gain a better understanding of the physical mechanisms underlying this phenomenon. Although a detailed analysis of the heat budget calculations is beyond the scope of this article and will be investigated in future studies, it is also essential to examine how oceanographic processes such as eddies and internal waves in the Makassar Strait area may have influenced the occurrence of MHWs. We recommend a future study to focus on this matter. Nevertheless, the current findings provide an initial estimate to identify the most vulnerable regions in IFMA 713 to the impact of MHWs.
Moreover, acquiring a deeper understanding of MHWs in Indonesian waters holds significant value for disaster management planning. This knowledge is crucial for comprehending the effects of climate change on the ocean and the broader ecosystem, as well as for developing strategies to mitigate their impact. By doing so, we can promote the sustainability of marine ecosystems and industries.
Author Contributions
Conceptualization, N.S.N.; methodology, N.S.N., S.R.G., E.B. and A.T.; software, S.R.G. and E.B.; formal analysis, N.S.N., S.R.G. and E.B.; investigation, N.S.N.; resources, N.S.N.; writing—original draft preparation, S.R.G.; writing—review and editing, N.S.N., S.R.G. and E.B.; visualization, S.R.G. and E.B.; supervision, N.S.N. and A.T.; project administration, N.S.N.; funding acquisition, N.S.N. All authors have read and agreed to the published version of the manuscript.
Funding
This research was funded by the Indonesian Ministry of Education, Culture, Research and Technology (Kemendikbudristek) under the research program of Penelitian Dasar Unggulan Perguruan Tinggi (PDUPT) 2022 (Research Grand Contract (RGC) No. 187/E5/PG.02.00.PT/2022) and 2023 (RGC No. 007/E5/PG.02.00/PL/2023).
Data Availability Statement
The OISSTv2 dataset can be accessed at https://www.ncei.noaa.gov/data/sea-surface-temperature-optimum-interpolation/v2.1/access/avhrr (accessed on 20 May 2022). The Niño 3.4 Index and DMI are available at https://stateoftheocean.osmc.noaa.gov/sur/ (accessed on 18 June 2022). PDO index can be obtained at https://ds.data.jma.go.jp/tcc/tcc/products/elnino/decadal/pdo_month.html (accessed on 18 June 2022). Wind speed, SWR, LWR, SHF, and LHF can be accessed at https://cds.climate.copernicus.eu/cdsapp#!/dataset/reanalysis-era5-single-levels?tab=form (accessed on 9 July 2022).
Acknowledgments
The authors are very thankful for the support of Kemendikbudristek and Institut Teknologi Bandung (ITB). We also would like to gratefully acknowledge data support from NOAA, JAMSTEC, and ECMWF.
Conflicts of Interest
The authors declare no conflict of interest. The funders had no role in the design of the study; in the collection, analyses, or interpretation of data; in the writing of the manuscript; or in the decision to publish the results.
References
- Houghton, J.T.; Ding, Y.D.J.G.; Griggs, D.J.; Noguer, M.; van der Linden, P.J.; Dai, X.; Johnson, C.A. (Eds.) Climate Change 2001: The Scientific Basis: Contribution of Working Group I to the Third Assessment Report of the Intergovernmental Panel on Climate Change; Cambridge University Press: Cambridge, UK; New York, NY, USA; Singapore, 2001. [Google Scholar]
- Rogelj, J.; Meinshausen, M.; Knutti, R. Global warming under old and new scenarios using IPCC climate sensitivity range estimates. Nat. Clim. Chang. 2012, 2, 248–253. [Google Scholar] [CrossRef]
- Hobday, A.J.; Alexander, L.V.; Perkins, S.E.; Smale, D.A.; Straub, S.C.; Oliver, E.C.; Benthuysen, J.A.; Burrows, M.T.; Donat, M.G.; Feng, M.; et al. A hierarchical approach to defining marine heatwaves. Prog. Oceanogr. 2016, 141, 227–238. [Google Scholar] [CrossRef]
- What Is a Heatwave? Available online: https://www.metoffice.gov.uk/weather/learn-about/weather/types-of-weather/temperature/heatwave (accessed on 30 April 2023).
- Holbrook, N.J.; Scannell, H.A.; Gupta, A.S.; Benthuysen, J.A.; Feng, M.; Oliver, E.C. A global assessment of marine heatwaves and their drivers. Nat. Comm. 2019, 10, 2624. [Google Scholar] [CrossRef]
- Perkins, S.E.; Alexander, L.V.; Nairn, J.R. Increasing frequency, intensity and duration of observed global heatwaves and warm spells. Geophys. Res. Lett. 2012, 39, 10. [Google Scholar] [CrossRef]
- Oliver, E.C.J.; Donat, M.G.; Burrows, M.T.; Moore, P.J.; Smale, D.A.; Alexander, L.V. Longer and more frequent marine heatwaves over the past century. Nat. Commun. 2018, 9, 1324. [Google Scholar] [CrossRef] [PubMed]
- Frölicher, T.L.; Fischer, E.M.; Gruber, N. Marine heatwaves under global warming. Nature 2018, 560, 360–364. [Google Scholar] [CrossRef]
- Fewings, M.R.; Brown, K.S. Regional Structure in the Marine Heat Wave of Summer 2015 off the Western United States. Front. Mar. Sci. 2019, 6, 564. [Google Scholar] [CrossRef]
- Thomsen, M.S.; Mondardini, L.; Alestra, T.; Gerrity, S.; Tait, L.; South, P. Local extinction of bull kelp (Durvillaea spp.) due to a marine heatwave. Front. Mar. Sci. 2019, 6, 84. [Google Scholar] [CrossRef]
- Behrens, E.; Fernandez, D.; Sutton, P. Meridional Oceanic Heat Transport Influences Marine Heatwaves in the Tasman Sea on Interannual to Decadal Timescales. Front. Mar. Sci. 2019, 6, 228. [Google Scholar] [CrossRef]
- Feng, X.; Shinoda, T. Air-Sea Heat Flux Variability in the Southeast Indian Ocean and Its Relation with Ningaloo Niño. Front. Mar. Sci. 2019, 6, 266. [Google Scholar] [CrossRef]
- Pujol, C.; Perez-Santos, I.; Barth, A.; Alvera-Azcarate, A. Marine Heatwaves Offshore Central and South Chile: Understanding Forcing Mechanisms during the Years 2016–2017. Front. Mar. Sci. 2022, 9, 800325. [Google Scholar] [CrossRef]
- Wernberg, T.; Bennett, S.; Babcock, R.C.; De Bettignies, T.; Cure, K.; Depczynski, M. Climate-driven regime shift of a temperate marine ecosystem. Science 2016, 353, 169–172. [Google Scholar] [CrossRef] [PubMed]
- Oliver, E.C.J.; Benthuysen, J.A.; Bindoff, N.L.; Hobday, A.J.; Holbrook, N.J.; Mundy, C.N. The unprecedented 2015/16 tasman sea marine heatwave. Nat. Commun. 2017, 8, 16101. [Google Scholar] [CrossRef]
- Smale, D.A.; Wernberg, T.; Oliver, E.C.J.; Thomsen, M.; Harvey, B.P.; Straub, S.C. Marine Heatwaves Threaten Global Biodiversity and the Provision of Ecosystem Services. Nat. Clim. Chang. 2019, 9, 306–312. [Google Scholar] [CrossRef]
- Garrabou, J.; Coma, R.; Bensoussan, N.; Bally, M.; Chevaldonné, P.; Cigliano, M. Mass mortality in Northwestern Mediterranean rocky benthic communities: Effects of the 2003 heat wave. Glob. Chang. Biol. 2009, 15, 1090–1103. [Google Scholar] [CrossRef]
- Marba, N.; Duarte, C.M. Mediterranean warming triggers seagrass (Posidonia oceanica) shoot mortality. Glob. Chang. Biol. 2010, 16, 2366–2375. [Google Scholar] [CrossRef]
- Glynn, P.W.; Maté, J.L.; Baker, A.C.; Calderón, M.O. Coral bleaching and mortality in Panama and Ecuador during the 1997–1998 El Niño–Southern Oscillation event: Spatial/temporal patterns and comparisons with the 1982–1983 event. Bull. Mar. Sci. 2001, 69, 79–109. [Google Scholar] [CrossRef]
- Genevier, L.G.; Jamil, T.; Raitsos, D.E.; Krokos, G.; Hoteit, I. Marine heatwaves reveal coral reef zones susceptible to bleaching in the Red Sea. Glob. Chang. Biol. 2019, 25, 2338–2351. [Google Scholar] [CrossRef]
- Salinger, J.; Hobday, A.J.; Matear, R.J.; O’Kane, T.J.; Risbey, J.S.; Dunstan, P. Decadal-scale forecasting of climate drivers for marine applications. Adv. Mar. Biol. 2016, 74, 1–68. [Google Scholar] [CrossRef]
- Doney, S.C. Plankton in a Warmer World. Nature 2006, 444, 695–696. [Google Scholar] [CrossRef]
- Merino, M. Upwelling on the Yucatan Shelf: Hydrographic evidence. J. Mar. Syst. 1997, 13, 101–121. [Google Scholar] [CrossRef]
- Mills, K.E.; Pershing, A.J.; Brown, C.J.; Chen, Y.; Chiang, F.S.; Holland, D.S.; Wahle, R.A. Fisheries management in a changing climate: Lessons from the 2012 ocean heat wave in the Northwest Atlantic. Oceanography 2013, 26, 191–195. [Google Scholar] [CrossRef]
- Cheung, W.W.L.; Frölicher, T.L. Marine Heatwaves Exacerbate Climate Change Impacts for Fisheries in the Northeast Pacific. Sci. Rep. 2020, 10, 6678. [Google Scholar] [CrossRef] [PubMed]
- Dupont, A. Indonesian Defence Strategy and Security: Time for a Rethink. Contemp. Southeast Asia 1996, 18, 276. [Google Scholar]
- Chou, L.M. Southeast Asian Reefs-Status update: Cambodia, Indonesia, Malaysia, Philippines, Singapore, Thailand and Viet Nam. In Status of Coral Reefs of the World; Australian Institute of Marine Science: Townsville, Australia, 2000; pp. 117–129. [Google Scholar]
- Saha, P. Indonesia’s potential as a maritime power. Marit. Aff. J. Natl. Marit. Found. India 2016, 12, 28–41. [Google Scholar] [CrossRef]
- Susanto, R.D.; Moore, T.S.; Marra, J. Ocean color variability in the Indonesian Seas during the SeaWiFS era. Geochem. Geophys. Geosyst. 2006, 7, Q05021. [Google Scholar] [CrossRef]
- Dewi, Y.W.; Wirasatriya, A.; Sugianto, D.N.; Helmi, M.; Marwoto, J.; Maslukah, L. Effect of ENSO and IOD on the variability of sea surface temperature (SST) in Java Sea. IOP Conf. Ser. Earth Environ. Sci. 2020, 530, 012007. [Google Scholar] [CrossRef]
- Kurniadi, A.; Weller, E.; Min, S.K.; Seong, M.G. Independent ENSO and IOD impacts on rainfall extremes over Indonesia. Int. J. Climatol. 2021, 41, 3640–3656. [Google Scholar] [CrossRef]
- Ningsih, N.S.; Sakina, S.L.; Susanto, R.D.; Hanifah, F. Simulated zonal current characteristics in the southeastern tropical Indian Ocean (SETIO). Ocean Sci. 2021, 17, 1115–1140. [Google Scholar] [CrossRef]
- Edinger, E.N.; Jompa, J.; Limmon, G.V.; Widjatmoko, W.; Risk, M.J. Reef degradation and coral biodiversity in Indonesia: Effects of land-based pollution, destructive fishing practices and changes over time. Mar. Pollut. Bull. 1998, 36, 617–630. [Google Scholar] [CrossRef]
- Widyatmoko, D. Biodiversity in Indonesia. In Global Biodiversity; Apple Academic Press: Palm Bay, FL, USA, 2018; pp. 149–164. [Google Scholar]
- Iskandar, M.R.; Ismail, M.F.A.; Arifin, T.; Chandra, H. Marine Heatwaves of Sea Surface Temperature Off South Java. Heliyon 2021, 7, e08618. [Google Scholar] [CrossRef]
- Ismail, M.F.A. Characteristics of Marine Heatwaves off West Sumatra Derived from High-Resolution Satellite Data. J. Hunan Univ. Nat. Sci. 2021, 48, 130–136. [Google Scholar]
- Beliyana, E.; Ningsih, N.S.; Tarya, A. Characteristics of Marine Heatwaves (2008–2021) in the Savu Sea, East Nusa Tenggara. J. Phys. Conf. Ser. 2022, 2377, 012043. [Google Scholar] [CrossRef]
- Gunawan, S.R.; Ningsih, N.S.; Beliyana, E.; Tarya, A. Marine Heatwaves Characteristics in Spermonde Islands, West Coast of South Sulawesi, Indonesia. J. Phys. Conf. Ser. 2022, 2377, 012040. [Google Scholar] [CrossRef]
- Habibullah, A.D.; Tarya, A.; Ningsih, N.S.; Putri, M.R. Marine Heatwaves in the Indonesian Fisheries Management Areas. J. Mar. Sci. Eng. 2023, 11, 161. [Google Scholar] [CrossRef]
- Gordon, A.L.; Susanto, R.D.; Ffield, A. Throughflow within Makassar Strait. Geophys. Res. Lett. 1999, 26, 3325–3328. [Google Scholar] [CrossRef]
- Koeshendrajana, S.; Rusastra, I.W.; Martosubroto, P. The Potential of Marine Resources and Fishery of the Fisheries Management Area (FMA) 713 of the Republic of Indonesia; AMAFRAD Press: Jakarta, Indonesia, 2019. [Google Scholar]
- Nienhuis, P.H.; Coosen, J.; Kiswara, W. Community structure and biomass distribution of seagrasses and macrofauna in the Flores Sea, Indonesia. Neth. J. Sea Res. 1989, 23, 197–214. [Google Scholar] [CrossRef]
- Tahir, A.; Samawi, M.F.; Sari, K.; Hidayat, R.; Nimzet, R.; Wicaksono, E.A.; Werorilangi, S. Studies on microplastic contamination in seagrass beds at Spermonde Archipelago of Makassar Strait, Indonesia. J. Phys. Conf. Ser. 2019, 1341, 022008. [Google Scholar] [CrossRef]
- Index of Data Sea Surface Temperature Optimum Interpolation V2.1. Available online: https://www.ncei.noaa.gov/data/sea-surface-temperature-optimum-interpolation/v2.1/access/avhrr/ (accessed on 16 June 2022).
- Reynolds, R.W.; Smith, T.M.; Liu, C.; Chelton, D.B.; Casey, K.S.; Schlax, M.G. Daily High-Resolution-Blended Analyses for Sea Surface Temperature. J. Clim. 2007, 20, 5473–5496. [Google Scholar] [CrossRef]
- ERA5 Hourly Data on Single Levels from 1940 to Present. Available online: https://cds.climate.copernicus.eu/cdsapp#!/dataset/reanalysis-era5-single-levels?tab=form (accessed on 20 June 2022).
- Cold and Warm Episodes by Season. Available online: https://origin.cpc.ncep.noaa.gov/products/analysis_monitoring/ensostuff/ONI_v5.php (accessed on 21 June 2022).
- Pant, V.; Girishkumar, M.S.; Udaya Bhaskar, T.V.S.; Ravichandran, M.; Papa, F.; Thangaprakash, V.P. Observed interannual variability of near-surface salinity in the Bay of Bengal. J. Geophys. Res. Oceans 2015, 120, 3315–3329. [Google Scholar] [CrossRef]
- The State of the Ocean Climate. Available online: https://stateoftheocean.osmc.noaa.gov/sur/ (accessed on 16 August 2022).
- Monthly Pacific Decadal Oscillation (PDO) Index. Available online: https://ds.data.jma.go.jp/tcc/tcc/products/elnino/decadal/pdo_month.html (accessed on 18 September 2022).
- Climate Data Store. Available online: https://cds.climate.copernicus.eu/cdsapp#!/home (accessed on 20 September 2022).
- Zhao, Z.; Marin, M. A Matlab toolbox to detect and analyze marine heatwaves. J. Open Source Softw. 2019, 4, 1124. [Google Scholar] [CrossRef]
- Yao, J.; Xiao, L.; Gou, M.; Li, C.; Lian, E.; Yang, S. Pacific decadal oscillation impact on East China precipitation and its imprint in new geological documents. Sci. China Earth Sci. 2018, 61, 473–482. [Google Scholar] [CrossRef]
- Pacific Decadal Oscillation Index (PDO). Available online: https://www.daculaweather.com/4_pdo_index.php (accessed on 17 September 2022).
- Hobday, A.J.; Oliver, E.C.; Gupta, A.S.; Benthuysen, J.A.; Burrows, M.T.; Donat, M.G.; Holbrook, N.J.; Moore, P.J.; Thomsen, M.S.; Wernberg, T.; et al. Categorizing and naming marine heatwaves. Oceanography 2018, 31, 162–173. [Google Scholar] [CrossRef]
- Iskandar, I.; Mardiansyah, W.; Lestari, D.O.; Masumoto, Y. What did determine the warming trend in the Indonesian sea? Prog. Earth Planet. Sci 2020, 7, 20. [Google Scholar] [CrossRef]
- Kida, S.; Richards, K.J. Seasonal sea surface temperature variability in the Indonesian Seas. J. Geophys. Res. 2009, 114, C06016. [Google Scholar] [CrossRef]
- Halkides, D.; Lee, T.; Kida, S. Mechanisms controlling the seasonal mixed-layer temperature and salinity of the Indonesian seas. Ocean Dyn. 2011, 61, 481–495. [Google Scholar] [CrossRef]
- Gupta, A.S.; Thomsen, M.; Benthuysen, J.A.; Hobday, A.J.; Oliver, E.; Alexander, L.V. Drivers and impacts of the most extreme marine heatwave events. Sci. Rep. 2020, 10, 19359. [Google Scholar] [CrossRef]
- Talley, L.D.; Pickard, G.L.; Emery, W.J.; Swift, J.H. Mass, salt, and heat budgets and wind forcing. In Descriptive Physical Oceanography; Talley, L.D., Ed.; Academic Press: Cambridge, MA, USA, 2011; pp. 111–145. [Google Scholar] [CrossRef]
- Mantua, N.J.; Hare, S.R.; Zhang, Y.; Wallace, J.M.; Francis, R.C. A Pacific interdecadal climate oscillation with impacts on salmon production. Bull. Am. Meteorol. Soc. 1997, 78, 1069–1080. [Google Scholar] [CrossRef]
- Heidemann, H.; Ribbe, J. Marine heat waves and the influence of El Niño off Southeast Queensland, Australia. Front. Mar. Sci. 2019, 6, 56. [Google Scholar] [CrossRef]
- Zhang, Y.; Du, Y.; Feng, M.; Hu, S. Long-lasting marine heatwaves instigated by ocean planetary waves in the tropical Indian Ocean during 2015–2016 and 2019–2020. Geophys. Res. Lett 2021, 48, e2021GL095350. [Google Scholar] [CrossRef]
- Zaba, K.D.; Rudnick, D.L. The 2014–2015 warming anomaly in the Southern California Current System observed by underwater gliders. Geophys. Res. Lett. 2016, 43, 1241–1248. [Google Scholar] [CrossRef]
- Tomita, H.; Kubota, M. Variability of surface heat flux over the Indian Ocean. Atmosphere-Ocean 2004, 42, 183–199. [Google Scholar] [CrossRef]
Disclaimer/Publisher’s Note: The statements, opinions and data contained in all publications are solely those of the individual author(s) and contributor(s) and not of MDPI and/or the editor(s). MDPI and/or the editor(s) disclaim responsibility for any injury to people or property resulting from any ideas, methods, instructions or products referred to in the content. |
© 2023 by the authors. Licensee MDPI, Basel, Switzerland. This article is an open access article distributed under the terms and conditions of the Creative Commons Attribution (CC BY) license (https://creativecommons.org/licenses/by/4.0/).