1. Introduction
The estimation of the parameters of vertical transport in stratified natural waters remains in the focus of attention of researchers and is a key issue, for example, in the context of mixing, transport of gases and impurities, and the functioning of biota. Different methods are used for studying mixing and vertical transport, and the complexity of these processes is evidenced by the significant scatter of the results. Such differences, as indicated in [
1], may be associated with a significant spatial inhomogeneity of mixing processes and the parameters describing these processes. A significant scatter in the estimates of transport parameters is also due to a multitude of vertical mixing mechanisms. Along with mechanical and radiatively driven mixing, one of the most important mixing mechanisms is associated with internal waves (IWs), their interaction, and breaking [
2].
IWs, especially basin-scale ones, often represent the most vigorous flows in stratified lakes [
3,
4,
5], being the driving force for horizontal and vertical mixing. This is evidenced by a detailed analysis of the energy budget and the energy fluxes [
6]. At the same time, quantitative estimates of IW energy vary from tenths of to several J/m
2 in stratified lakes during the open water period [
1], which is only a minor part (1% or less, according to the initial estimates of Lorenz [
7]) of the characteristic values of the potential energy (Schmidt stability parameter).
The generation, propagation, overturning, and breaking up of IWs are probably powerful transport and mixing mechanisms in ice-covered lakes [
4,
8,
9,
10,
11]. However, the dynamics of IWs in ice-covered lakes is still very poorly studied despite the increased interest in winter hydrodynamics in recent years [
12,
13]. Today, the importance of the winter period in the annual cycle of the functioning of lake ecosystems is obvious [
14,
15,
16]. In particular, the spring under-ice convection energizes under-ice flows and sufficiently enhances the vertical transport [
8,
10,
13,
17,
18,
19,
20,
21,
22,
23,
24], and thus can play a significant role in the development of a plankton and gases regime [
15,
18,
21,
25,
26,
27,
28,
29,
30]. It was found that despite the relatively weak energy of under-ice processes, the coefficients of turbulent diffusion significantly (several times or an order of magnitude) exceed the molecular values even in a small ice-covered lake without significant river in- and outflow [
9,
11].
It can be assumed that IWs are one of the essential elements of the energy balance of ice-covered lakes. Taking into account results presented in [
9,
11], the characteristic velocities of IWs can be estimated at several mm/s. However, even at such relatively low velocities, the energy of IWs proves to be comparable with the lower bound of the estimates for the open water period. As for the mechanism of vertical transfer enhancement associated with IWs, it is likely due to their interaction and breaking. However, some details of this mechanism remain challenging, giving rise to a number of specific questions, both theoretical and experimental. In the context of this study, three problems/challenges are the most significant, as summarized below.
The first problem, which is also typical for open water periods, is associated with the complex spatial structure of IWs and, accordingly, the inhomogeneity of the temperature field not only down the water column, but also in the horizontal plane. As a consequence, both the energy fluxes and the values of the turbulent heat transfer coefficients are distributed unevenly in lakes due to IWs.
Some studies highlight the special role of the bottom layer. Thus, it is noted in [
6,
31] that in the presence of IWs, the Richardson number usually exceeds the critical value in the stratified water column, wherefore mixing due to the occurrence of the Kelvin–Helmholtz instability is inhibited in the water column. In this regard, it has been suggested that the intensification of vertical transport can occur due to growing turbulence of the near-bottom boundary layer as a result of the interaction of currents induced by IWs with a sloping bottom [
31,
32]. Within the framework of such a mechanism, the coefficient of turbulent diffusion turns out to be significantly inhomogeneous depthwise, as confirmed by data presented in the above-mentioned papers.
In a broader context, the problem of spatial inhomogeneity of the temperature field (such inhomogeneity as a rule persists even after averaging over significant time intervals [
33]) and energy fluxes is closely related to the problem of determining the mode structure of IWs and identifying the dominant vertical modes. In this regard, considerable attention is paid not only to the study of the cumulative energy balance of the water column as a whole, but also to the development of methods to determine the decay rates and details of the energy balance of individual IW modes and, accordingly, their contribution to mixing. The focus in such studies is usually on basin-scale IWs; viz., a detailed comparative analysis of the role of several mean vertical modes in the mixing process was carried out in [
32,
33].
The second aspect that deserves special attention is related to the study of short IWs, which determine the fine horizontal and vertical structures of the temperature field. One of the motivations for studying them is the possible intensification of mixing as a result of the interaction of short IWs with a sloping bottom [
34].
The mechanisms of short IWs generation are quite diverse. Some studies [
34,
35,
36,
37] have shown that during the open water period, such IWs can occur in different types of lakes as a result of wind action at the antinodes of low-frequency Kelvin waves. The periods and lengths of such IWs vary within a few minutes and several tens of meters, respectively. A similar mechanism of short IWs generation is also possible in ice-covered lakes if basin-scale waves appear. The pronounced temperature fluctuations of the bottom layer in the first weeks after ice formation in the small Lake Müggelsee (Germany) were interpreted as basin scale IWs—the Kelvin and Poincaré waves [
4]. The authors suggested that such waves can form in an ice-covered lake and exist during several weeks of an ice period as a result of enhanced hydrodynamics of the pre-freeze period. The temperature oscillations were initiated immediately after the ice-on by the release of the potential energy of the tilted thermocline. The rotational nature ensured long wave damping times and allowed water temperature oscillations to persist in the lake for several weeks. Therefore, it can be assumed that in ice-covered lakes, a mechanism for the generation of short IWs at the antinodes of basin waves is possible during early winter.
As shown in [
11], a resonant mechanism of generation of short IWs is possible in ice-covered lakes as a result of the interaction of barotropic seiches with bottom inhomogeneities. This mechanism is similar to tidal conversion in the oceans. Barotropic seiches in an ice-covered lake can occur as a result of atmospheric action, while the energy path is as follows: atmospheric pressure disturbances over the lake water area—wind action on ice—ice cover fluctuations—seiches [
38,
39].
Other mechanisms for generating short IWs in ice-covered lakes are also possible. Short IWs (with periods from 5 s to 2 h) were found in the stratified layer below the convectively mixed layer during the spring under-ice convection in the Petrozavodsk Bay of Lake Onega [
8]. These waves appeared in the middle of the day and existed until the middle of the night; that is, there was a time delay between the maxima of solar radiation and the development of IWs. The authors considered two main hypotheses for the generation of these short IWs: (1) convective plumes falling onto the thermocline [
40,
41], and (2) a gravitational slope current intruding into the stratified layer [
42,
43,
44,
45]. Slope gravity currents can arise in ice-covered lakes as a result of non-uniform heat input from bottom sediments, due to faster radiative heating of under-ice water in shallow coastal areas in spring, and also due to the influx of melt water [
10,
13,
44].
Further progress in the study of short IWs is largely restrained by experimental capabilities, and this is another one of the problems mentioned above. To assess the role of such IWs in mixing, temperature field fine structure, and horizontal variations of isotherm depths, it is necessary to determine IW key parameters: in particular, amplitudes and wave numbers. To determine these parameters, measurements are required at several horizontally spaced verticals at distances comparable to the expected wavelength. However, such experimental studies are scarce [
43,
46].
This paper presents the results of research on short IWs in a small ice-covered lake. The main parameters of IWs were estimated through processing of experimental data obtained on several horizontally spaced thermistor chains (TR-chains). At the same time, the following tasks were considered as priorities:
- -
planning of experiments to reveal the presence of standing and propagating short IWs in an ice-covered lake;
- -
detection of propagating short IWs and specific features of their generation and propagation;
- -
assessment of the key parameters of IWs (phase and group velocities, wave numbers) that are essential for studying the intensification of vertical mixing.
2. Material and Methods
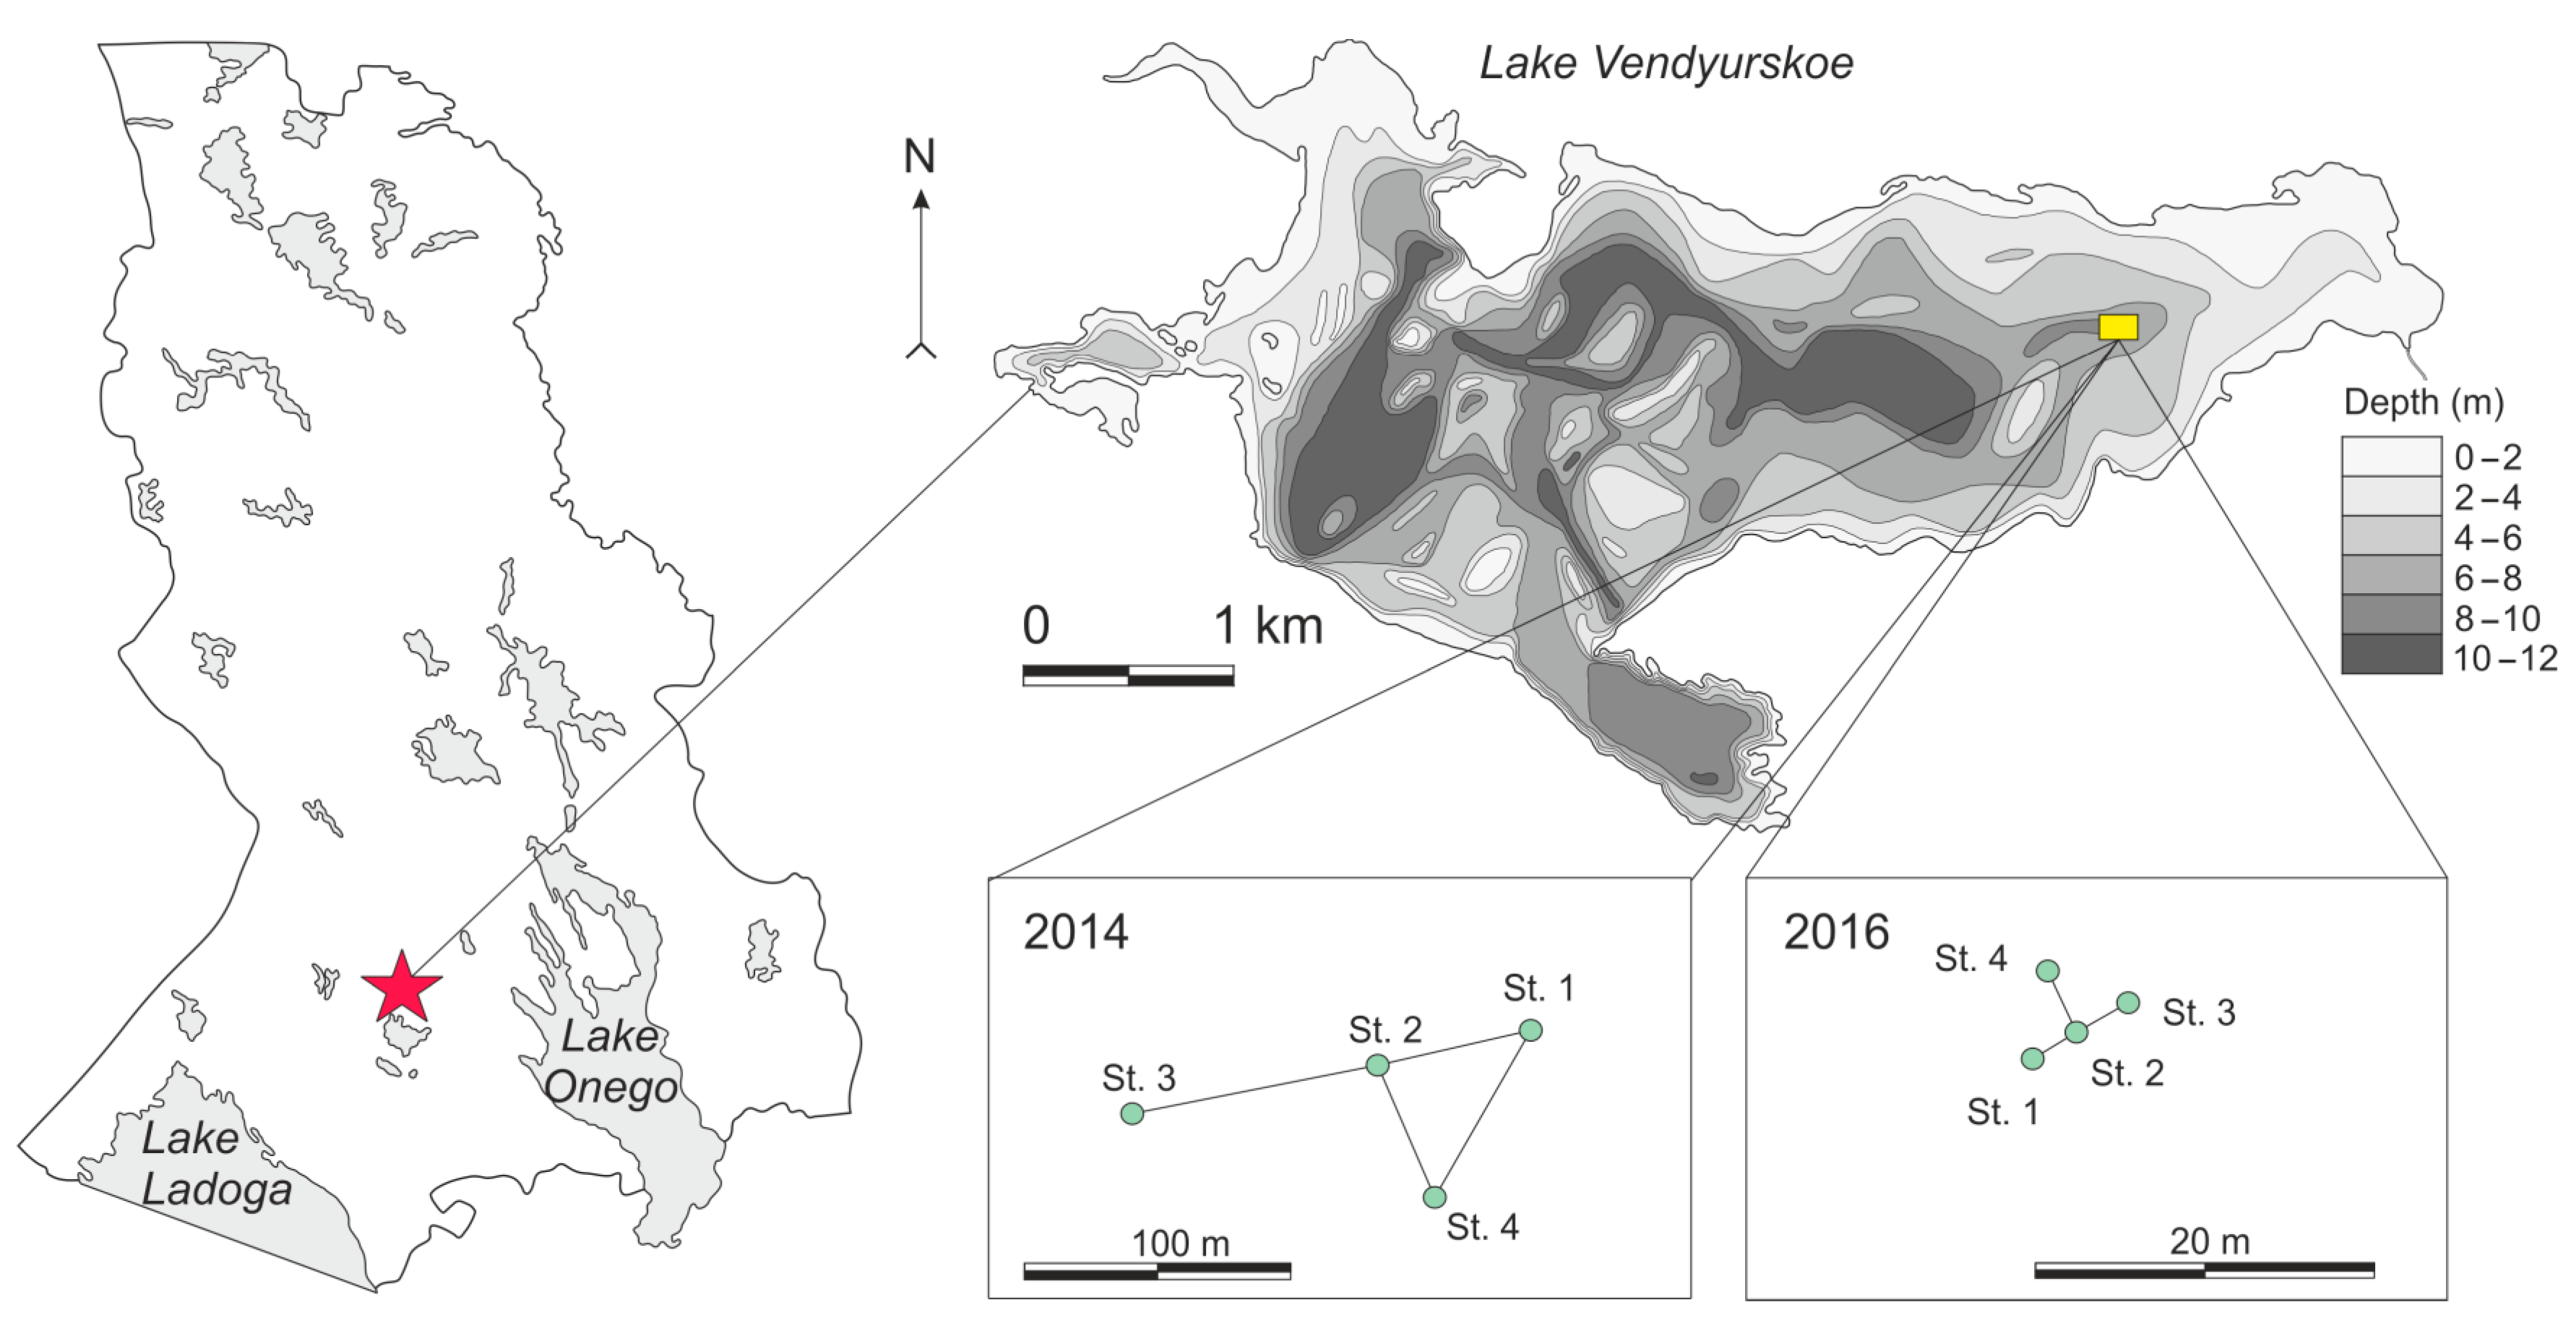
The measurements were carried out in a small Lake Vendyurskoe (
Figure 1) located in Northwest Russia (62°10′−62°20′ N, 33°10′−33°20′ E). The catchment area of this lake is 82.8 km
2, the surface area is 10.4 km
2, the water volume is ~5.5·10
7 m
3, the average depth is 5.3, and the maximum depth is 13.4 m. The basin of the lake is elongated from the southwest to the northeast; its length is 7 km, and its width reaches 1.5–2 km. Ice-on occurs from early November to mid-December in different years; ice-off occurs from the end of April to the second ten days of May.
In winter, stable stratification of the water column is observed with a temperature gradient of 0.3 °C/m and a Brent–Väisälä frequency of 10
−2 rad/s. Long-term temperature measurements [
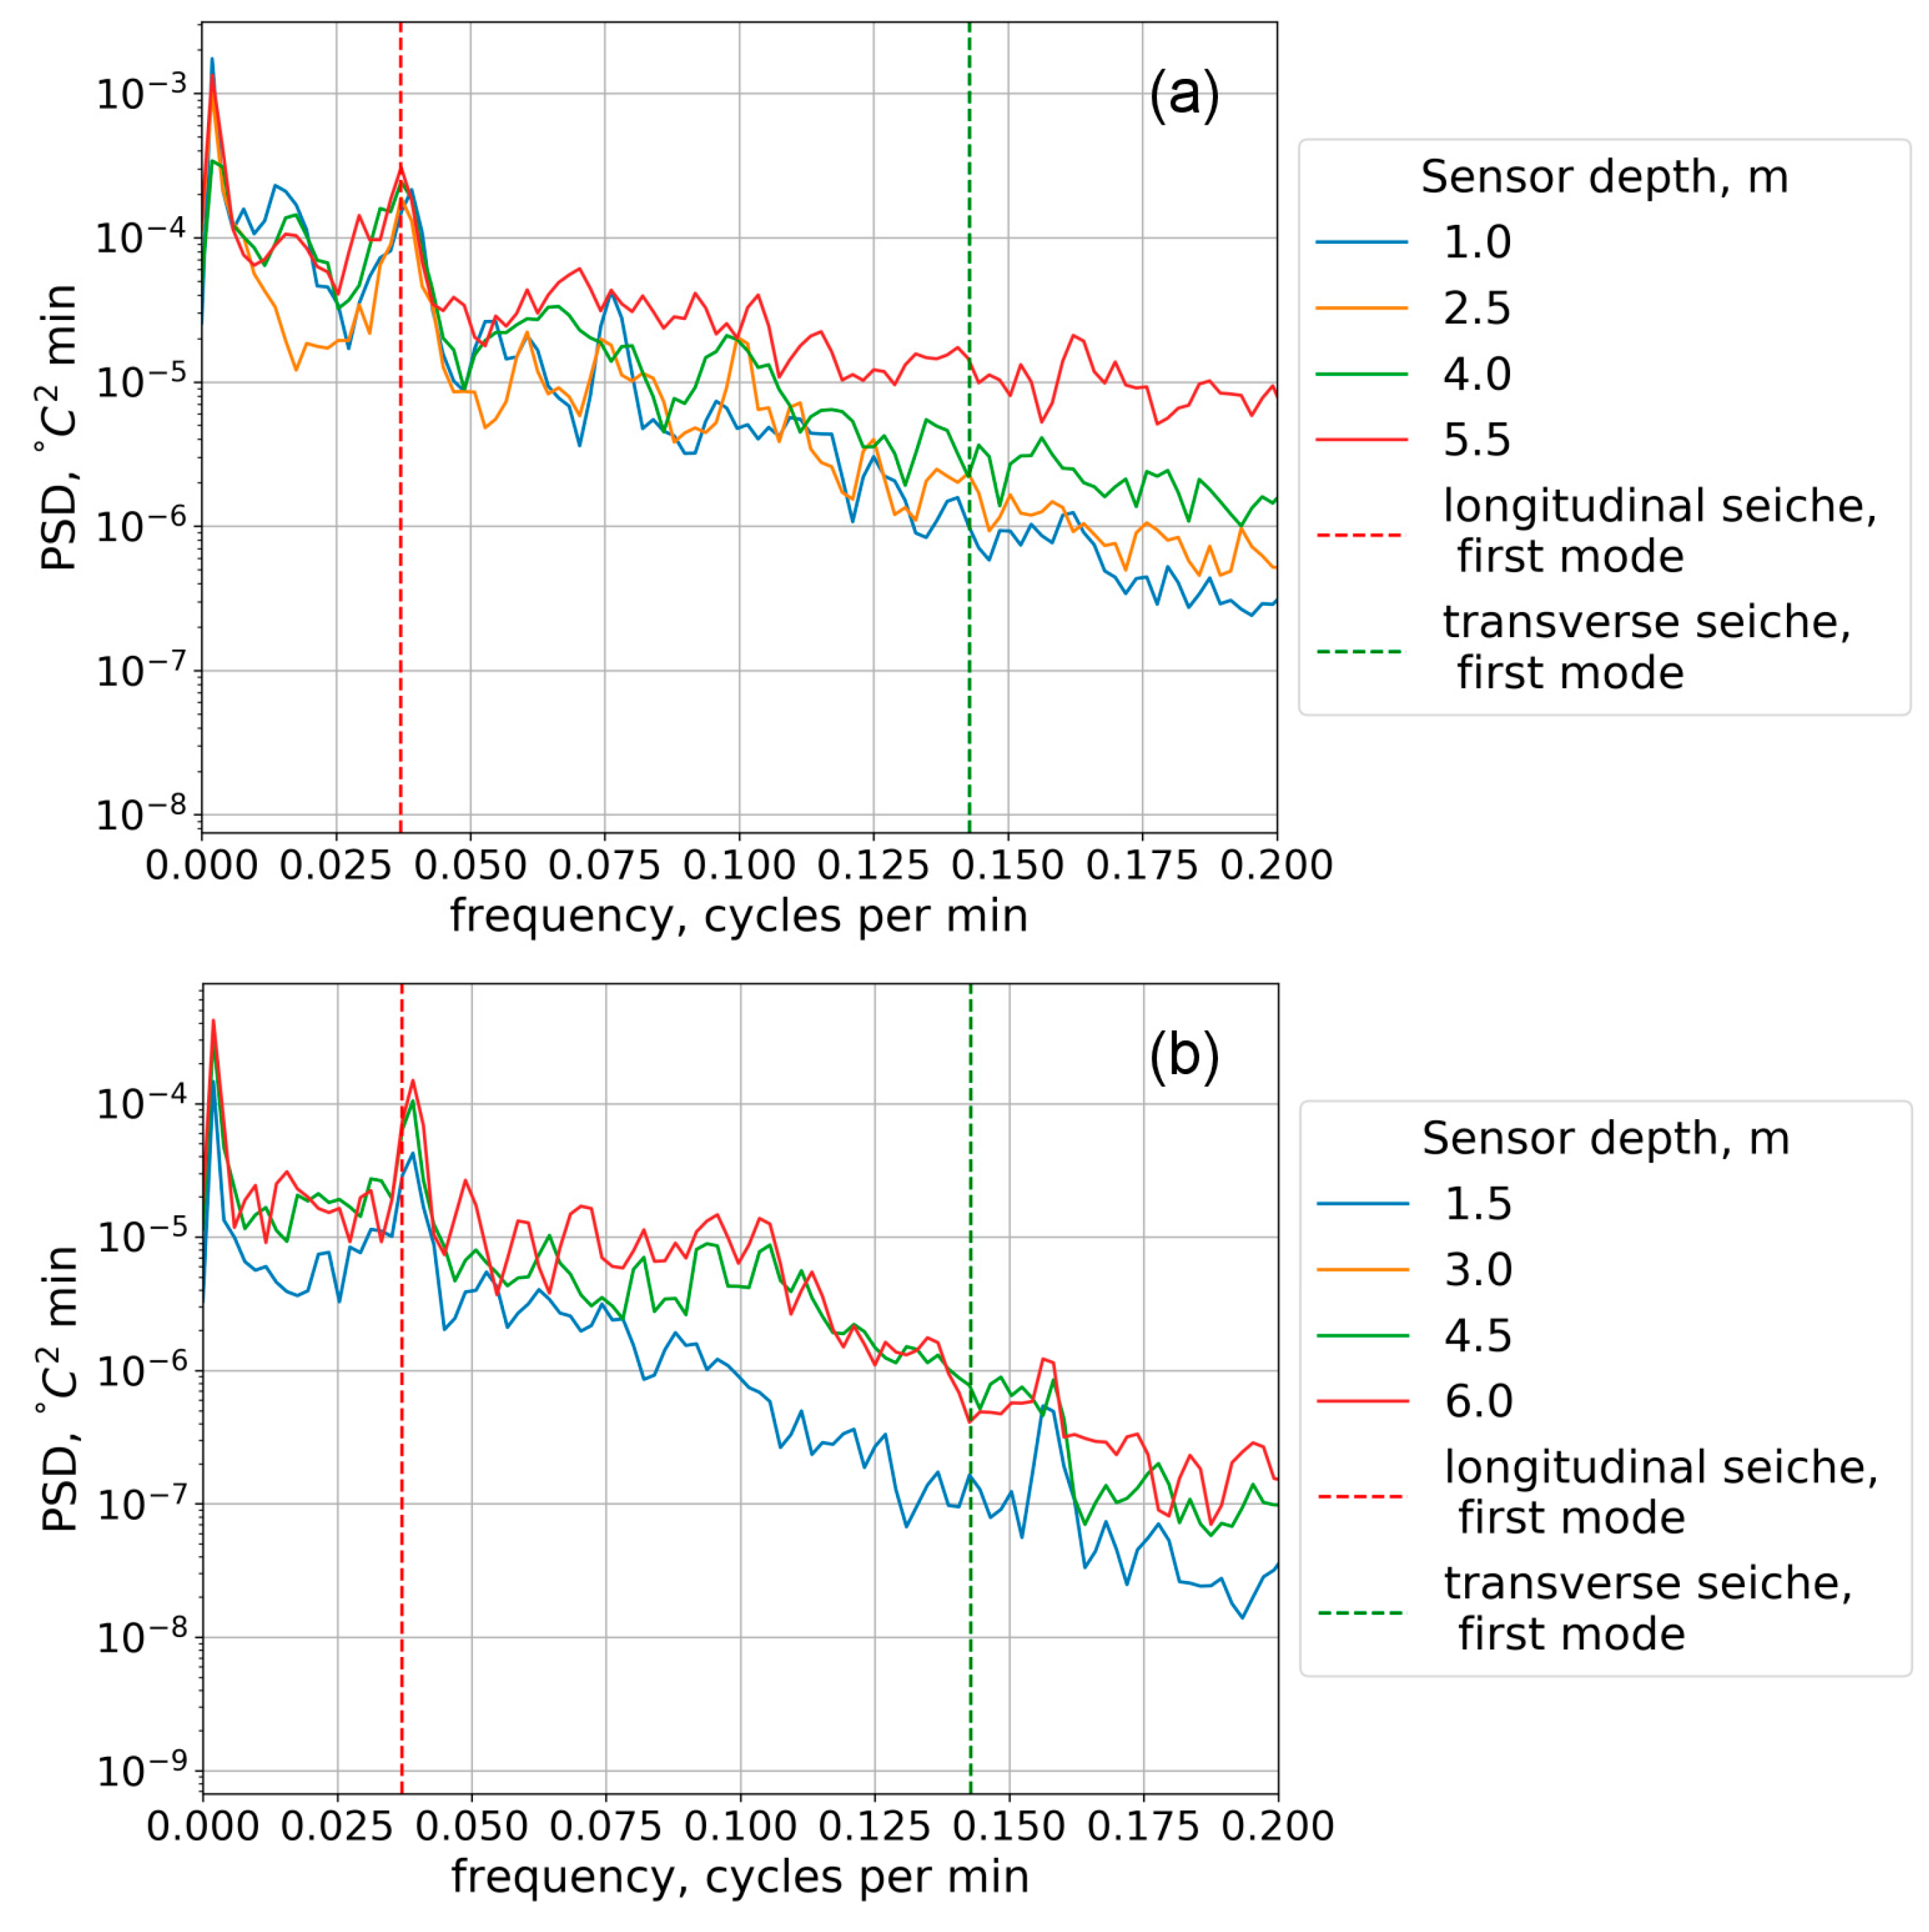
9] indicate significant wave activity in the whole water column throughout the winter season. During the entire ice-covered period, the water temperature spectrum shows peaks corresponding to 7 and 27 min [
9]. These peaks are very close to the periods of the first modes of the transverse and longitudinal barotropic seiches of the lake [
38,
47].
At the same time, some features of these water temperature oscillations point to their baroclinic nature. One of these features is an abnormally large isotherm depth displacement compared with vertical ice displacements [
9,
47]. In particular, the isotherm depth displacements
were calculated using the temperature deviation from moving 27-min averaged temperature values
[
9]:
.
It was found that the vertical isotherm displacements were 10–15 cm at maximum [
9]. The baroclinic nature of the detected temperature oscillations was also indicated by the heterogeneity of their amplitudes down the water column, as well as the often-observed stable phase shift between oscillations at different depths [
9]. Most often, the phase shift was close to π, which can be considered as a direct indication of the existence of short standing IWs.
One of the possible mechanisms for the occurrence of such IWs, associated with their resonant excitation due to the interaction of barotropic seiches with bottom inhomogeneities (seiche conversion), is considered in [
11]. To prove the existence of such a mechanism, it is necessary to estimate key parameters of IWs—the wavelength and phase- and group velocities. In this section, we analyze the theoretical (within the framework of the seiche conversion mechanism of IW generation) and experimental possibilities of such estimates. In theoretical analysis, two approaches have been used to describe IWs [
48]: one of them based on the mode structure of IWs, and the other using the concept of beams along which energy is transferred by IWs.
For experimental estimation of IW parameters, it is necessary to study the spatial structure of the temperature fields. Horizontally spaced TR-chains equipped with autonomous temperature sensors with loggers, as well as mobile underwater vehicles or gliders, can be used for these purposes [
46,
49,
50]. It should be noted that the installation of several TR-chains during the open water period is associated with some problems [
35], such as maintaining the mutual position of TR-chains in a highly turbulent medium. An example of a very complex installation is a platform with 95 TR-chains (the total number of sensors is 2925), deployed in the western Mediterranean in 2020. This platform was designed for 3D scanning of the water column with a volume of half a cubic hectometer [
51]. However, such complex studies are rare, especially for ice-covered lakes. In this regard, it is worth mentioning the temperature measurements during two winters on 2–7 TR-chains spaced along different shores and in the center of Lake Pȁȁjȁrvi, Finland, and parallel measurements of currents and heat flow from the bottom to the water [
43].
The study of the spatial structure of the water temperature in ice-covered lakes has a number of advantages, since TR-chains are fixed directly to ice, ensuring that they remain in the same positions relative to each other throughout the measurement period. Important tasks in the planning of the experiment are choosing the distance between the TR-chains and their relative position to each other in the horizontal plane. The latter is a precondition when the direction of short IW propagation is not known in advance. The complexity of this choice is due to the multimode structure of short IWs and a wide spectrum of their frequencies.
The first task, i.e., choosing the distance between TR-chains, is the key to estimating wavelengths. In our study, the framework for choosing the distance between the TR-chains was the concept of resonant generation of IWs [
11]. We used the well-known dispersion relationship (hereinafter, it is used in the approximation
f <<
N [
52], where
f is the Coriolis parameter):
Here,
and
m are the horizontal and vertical components of the wave vector
k,
is the wavelength,
is the frequency;
is determined by the main seiche frequencies or their higher harmonics. In the case of standing IWs,
m =
n/
H (
n is the number of the vertical mode) and relation (1) can be written as
Considering the values of 7 and 27 min for the periods of the first modes of the transverse and longitudinal barotropic seiches in Lake Vendyurskoe, we obtain an estimate for the frequency ratio
N/
in the interval (0.7, 3). Hence, for the wavelength, we obtain the double approximate inequality 1.5
H/
n ≤
≤ 6
H/
n. An analysis of the spectrum of temperature fluctuations also indicates the feasibility of not only the main vertical mode of IWs, but also multimode structures corresponding to values of
n = 2, 3, or more [
11]. In this case, at characteristic depths
H ~ (6–12) m, the horizontal cell size of standing short IWs can be from 3 to 36 m.
It should be emphasized that within the framework of the resonant mechanism of IWs generation, the wavelength turns out to be significantly smaller than the dimensions of the lake. But since the mode structure of these IWs is not known in advance, the choice of the distance between TR-chains becomes complicated.
Temperature measurements were carried out in Lake Vendyurskoe in the mid-winter of 2014 and 2016 at the eastern slope with 6–8 m depths (
Figure 1). TR-chains were fixed on ice and temperature measurements were taken during several days. Temperature sensors RBR TR-1060 (accuracy 0.002 °C) were used. Taking into account the above estimates, three TR-chains were deployed at distances of 50 m and 100 m from each other at stations 1, 2, and 3 on 1–3 February 2014, and then at distances of 50 m and 70 m from each other at stations 1, 2, and 4 on 3–5 February 2014 (
Figure 1). The depth gradually increased from 7 m at station 1 to 8 m at station 3. Taking into account the results achieved in 2014, the distance between TR-chains was significantly reduced to 4 m in the measurements conducted on 28 January–2 February 2016. The depths of the stations in 2016 were smaller, 6–7 m. In both years, temperature sensors were arranged every 0.5 m from the ice bottom to the sediments, and the time interval between measurements was one minute.
An important challenge is the detection of propagating IWs and estimation of their parameters, primarily the group velocity. From an experimental point of view, the problem is complicated since the direction of the propagation of beams is not known in advance, nor is the degree of localness of bottom surface disturbances that cause the formation of IW trains. In this regard, the result of the experiment largely depends not only on the distance between TR-chains, but also on the mutual position of TR-chains in the horizontal plane.
The beam interpretation of IWs is convenient when choosing the mutual arrangement of TR-chains. Namely, it should be taken into account that in the case of IWs, the particle velocities are directed along straight lines (the simplest stratification with
N = const is assumed) perpendicular to the wave vector
k. The same straight lines set the direction of the group velocity and the beams along which the wave trains travel and energy is transferred. For a wave train traveling in the
XZ plane, the group velocity components
ug are determined by the relations [
48,
52]
Here,
is the angle between the horizontal axis X and the direction of the wave vector
k = (
k,
m). It should be noted that the angle
and, accordingly, the angle of inclination of the “beams” in accordance with (3) is uniquely determined only by the base frequencies
N,
and does not depend on the mode numbers. A result of this feature of IWs is that, under certain conditions, energy flows are concentrated in narrow bands adjacent to the beams [
53]. It is this circumstance that can enhance the role of IWs in the mixing process: in the zones adjacent to the beams, the velocity shear can reach sufficiently large values and, accordingly, when the threshold value of the Richardson parameter
Ri is reached, instability and intensification of local mixing may occur.
On the other hand, the localization of IW trains in narrow beams makes it hard to detect and, thus, complicates the task of choosing the relative position of TR-chains in the horizontal plane. The only exception is the case when the wavelength is determined by the size of the lake (basin-scale waves): in this case, a series of TR-chains can be arranged along the main axis of the lake, as was conducted in the pioneering work of Farmer [
54]. Such an arrangement of TR-chains along one line (perpendicular to the wave crests) is also possible in the case when the orientation of the wave crests is known [
35,
55]. In the case of short IWs, however, the direction of the beams is not known in advance [
34]. Even in the simple case of IW generation due to bottom inhomogeneities, it is very difficult to predict beam trajectories, given the irregularity of the lakebed topography. Here, it is preferable to place the TR-chains at the vertices of a triangle [
37] or in a “star-shaped array” version [
36].
In 2014 and 2016, the position of TR-chains relative to each other was different. In 2014, three TR-chains were oriented along the main axis of the lake, and then were oriented in the form of a triangle. In 2016, four TR-chains were installed in the form of an asymmetric star at a distance of 4 m from one another (
Figure 1).
The beams were studied through detection and analysis of certain events in different temperature sensors’ records. Wave trains, additional peaks in the spectra [
1], as well as so-called surges, i.e., abrupt jumps in temperature and isotherm depth [
35], can be used as such events. The first option is rather difficult to use because of the complex nature of the modulation of IWs, while the second option is highly sensitive to the degree of spatial localization of the event. We tracked beam trajectories by the appearance of surges both in the vertical (surges appearing at different depths of the same TR-chain with a time lag) and the horizontal (surges appearing at different depths of an adjacent TR-chain with a time lag) directions. The group velocity components were estimated from the lag between surges.
The data of each temperature sensor were subjected to a moving averaging procedure for 27 min, and then the difference ΔT between the averaged and measured data was obtained. The series of temperature fluctuations ΔT were analyzed separately for each TR-chain. Then, a joint analysis of the ΔT series of different TR-chains was carried out.
3. Results
The experimental data obtained in both years were first processed for each TR-chain separately. Oscillations of Δ
T with a prevailing period of 27 min (
Figure 2) were found for all temperature sensors of all TR-chains. Oscillations with such a period were previously obtained for a series of Δ
T [
9], and for current velocities and vertical ice displacement series [
38,
39,
47] for the same part of Lake Vendyurskoe and for the central deep part and the northern slope. The typical amplitude of isotherm depth oscillations was several centimeters, i.e., an order of magnitude greater than the amplitude of vertical ice displacement [
9,
47].
Another feature of these ΔT oscillations was the depthwise inhomogeneity of their amplitudes. Typically, ΔT oscillations at different depths occurred in counterphase during a long time period (5–10 h). Both of the ΔT dynamics features are typical for standing internal waves.
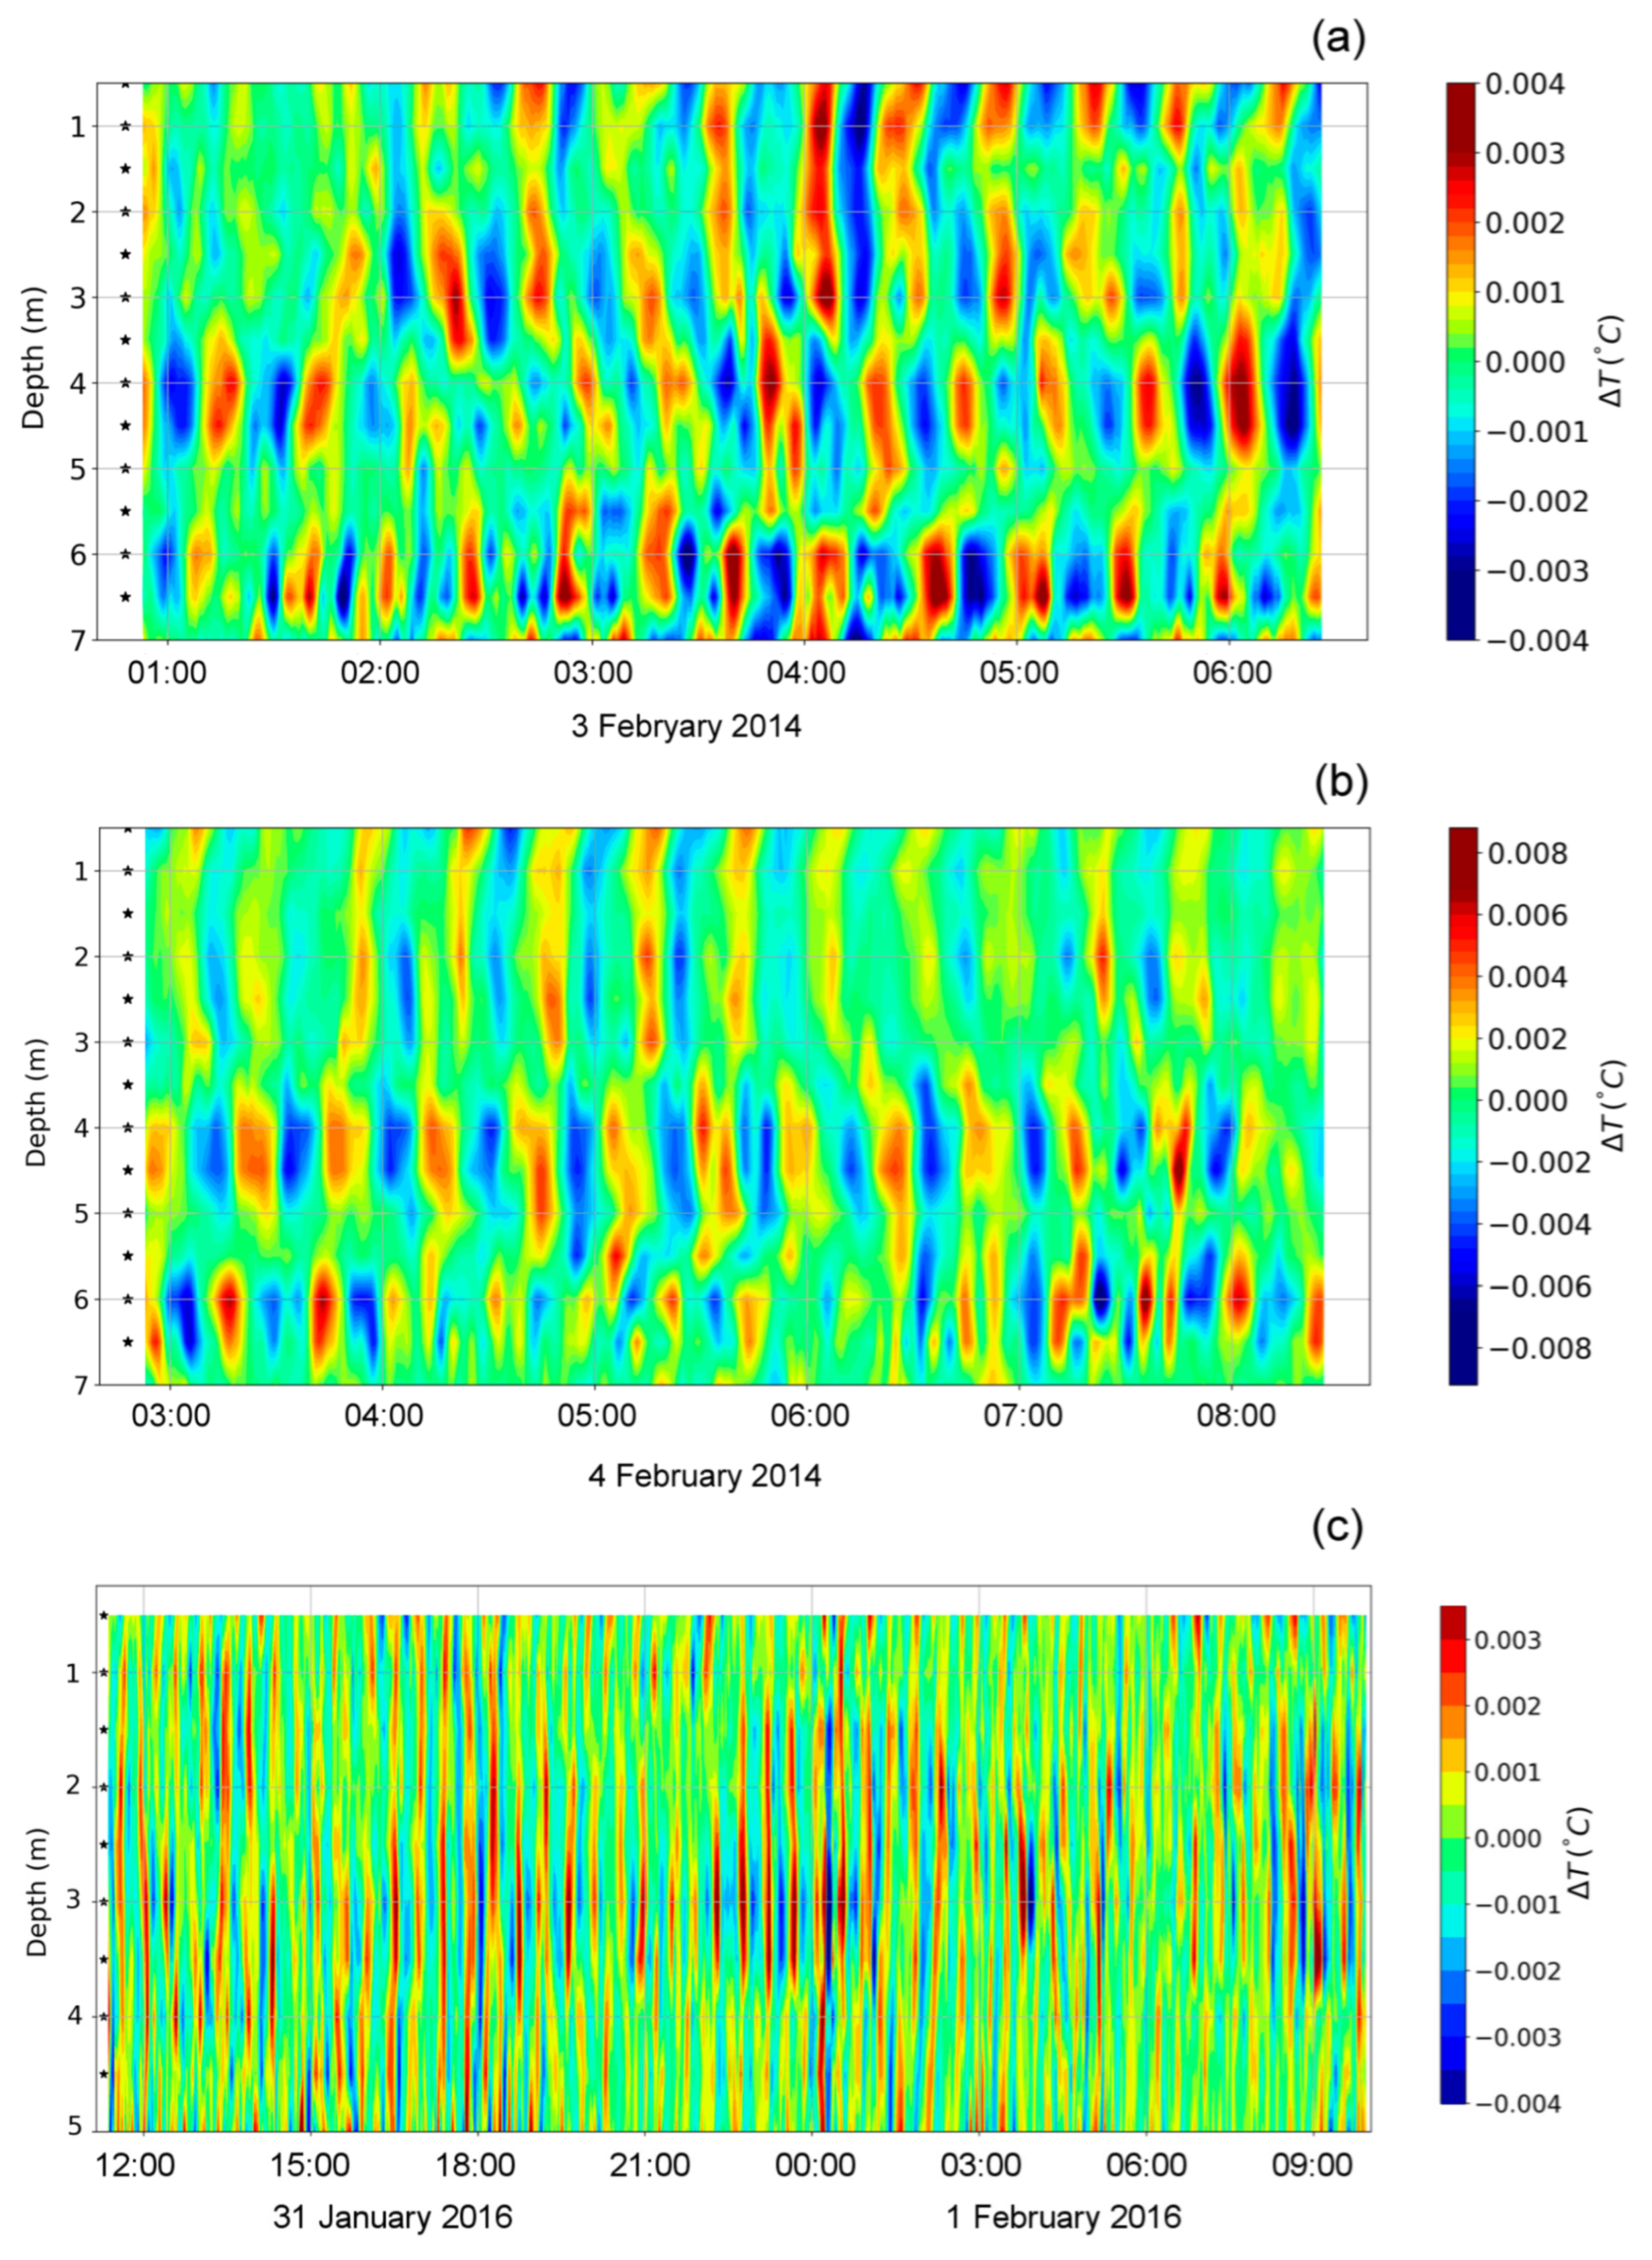
It should be noted that in most cases, Δ
T oscillations in the water column were represented by several modes (
Figure 3). Often, high vertical modes with the numbers 3, 4, and 5 were dominant. They had quite clearly pronounced “nodal depths” with minimal amplitudes of Δ
T oscillation alternating with “antinodes”, where Δ
T amplitudes were the greatest.
Such “layering” of the water column was quite variable. For example, nodal depth positions changed slightly over time, and even the number of layers could change, which led to a change in the mode structure.
However, the layered structure of the water column was preserved even after averaging over several hours or days. Thus,
Figure 4 shows the vertical profiles of the variance of Δ
T for four different TR-chains averaged over a time interval of 36 h from 19:00 1 February 2014 to 15:00 3 February 2014 (
Figure 4a,c) and 72 h from 21:00 28 January 2016 to 21:00 31 January 2016 (
Figure 4b,d). For each TR-chain, several layers can be distinguished where the pulsation amplitudes differ by a factor of 3–5.
Figure 4 also shows the spatial (vertical) correlation function
f12 of temperature fluctuations Δ
T at different depths:
, where Δ
z =
z2 −
z1.
For definiteness, the depth of the first temperature sensor was used as the reference point z
1. For both years, the calculated curves have an oscillating character, despite the rather significant averaging period. This fact can be regarded as indirect evidence of the stability of the multimode structure of the water column. At the same time, the vertical mode of the fifth order was predominant in 2014, while the third-order mode dominated in 2016, which is consistent with the visual image of the Δ
T field shown in
Figure 3.
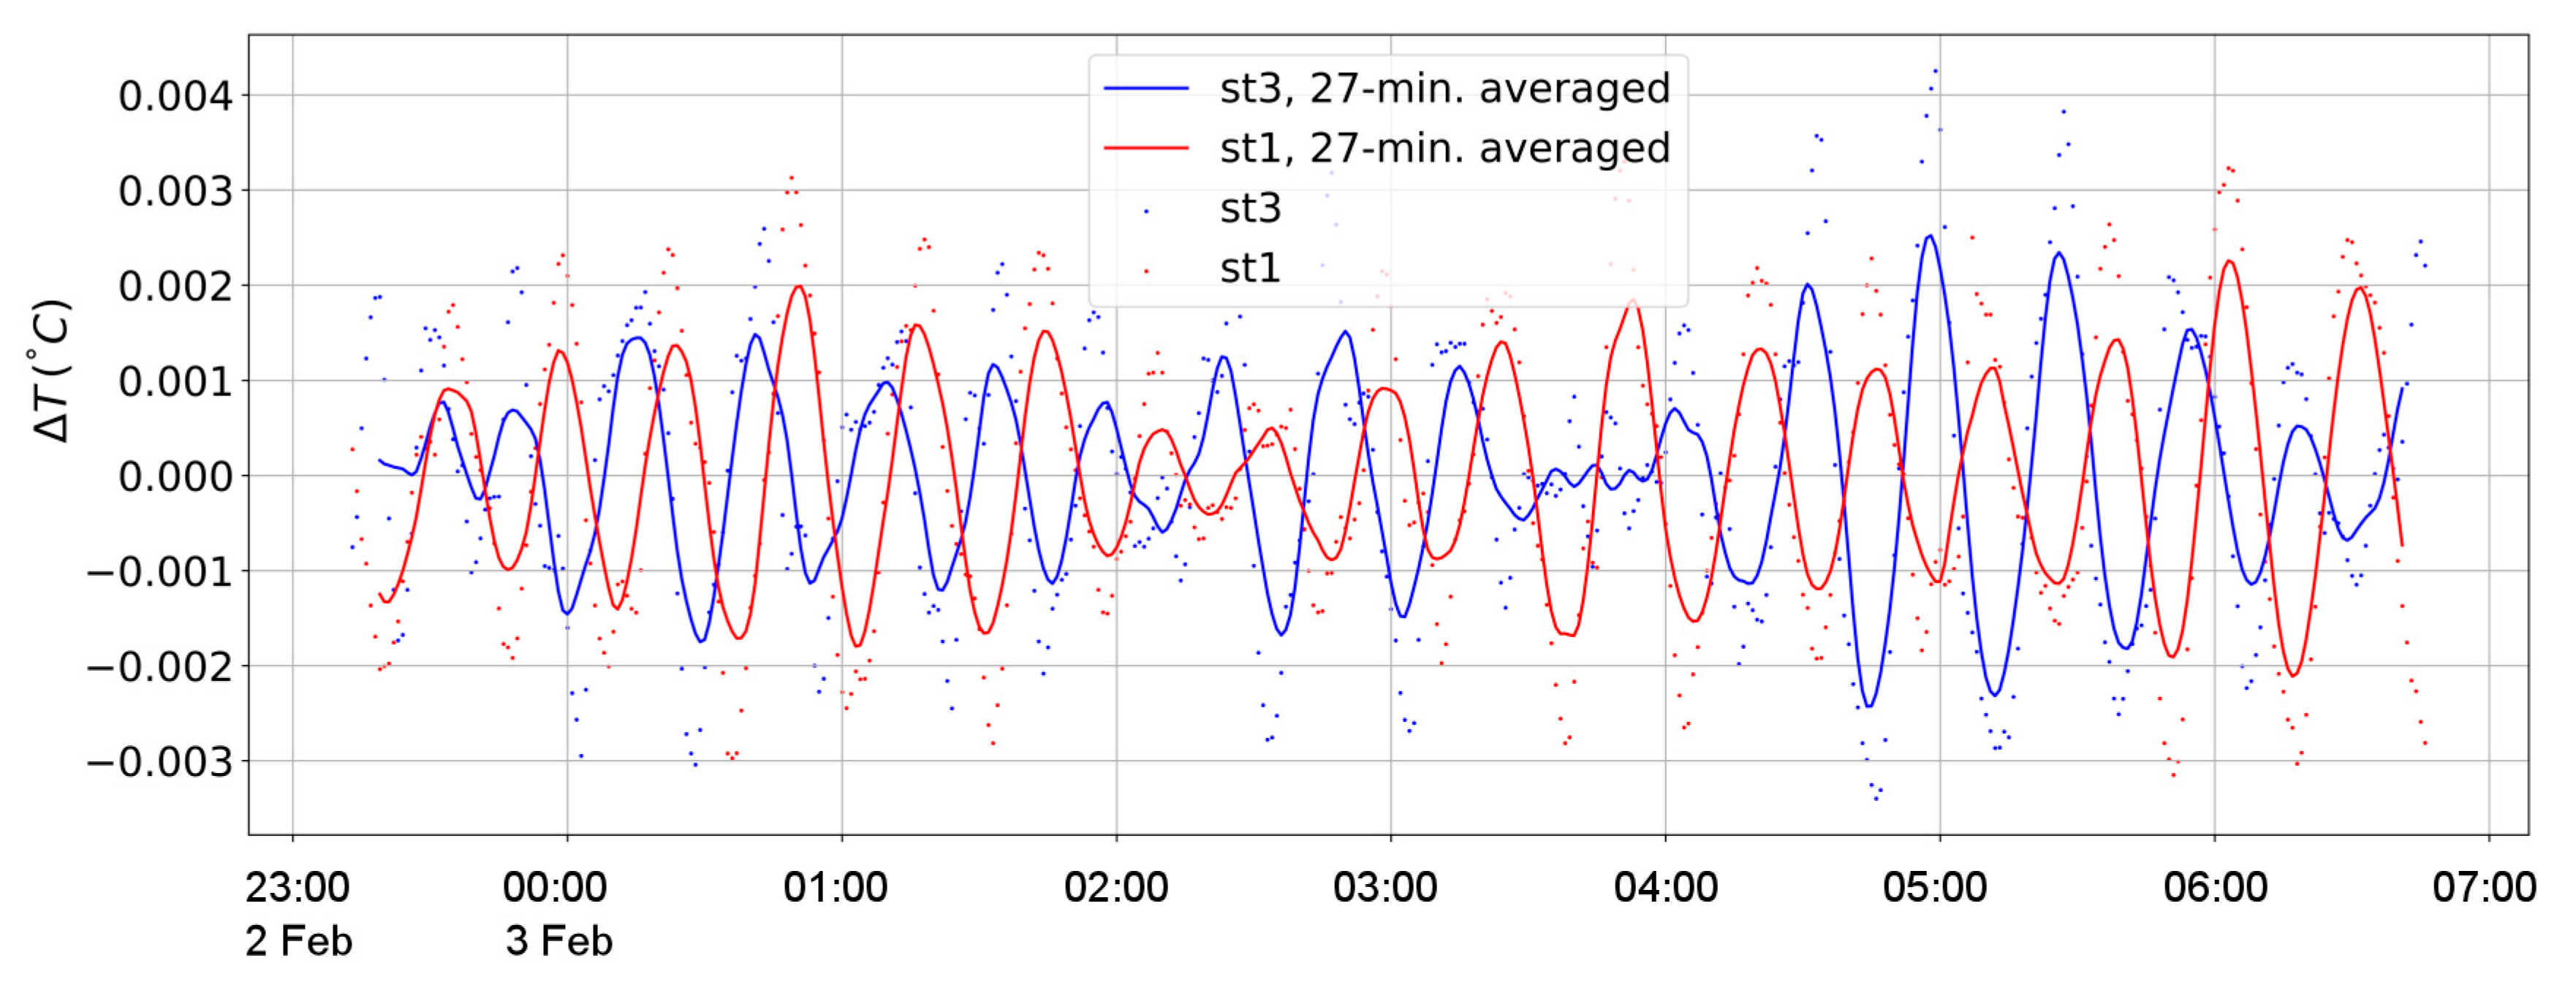
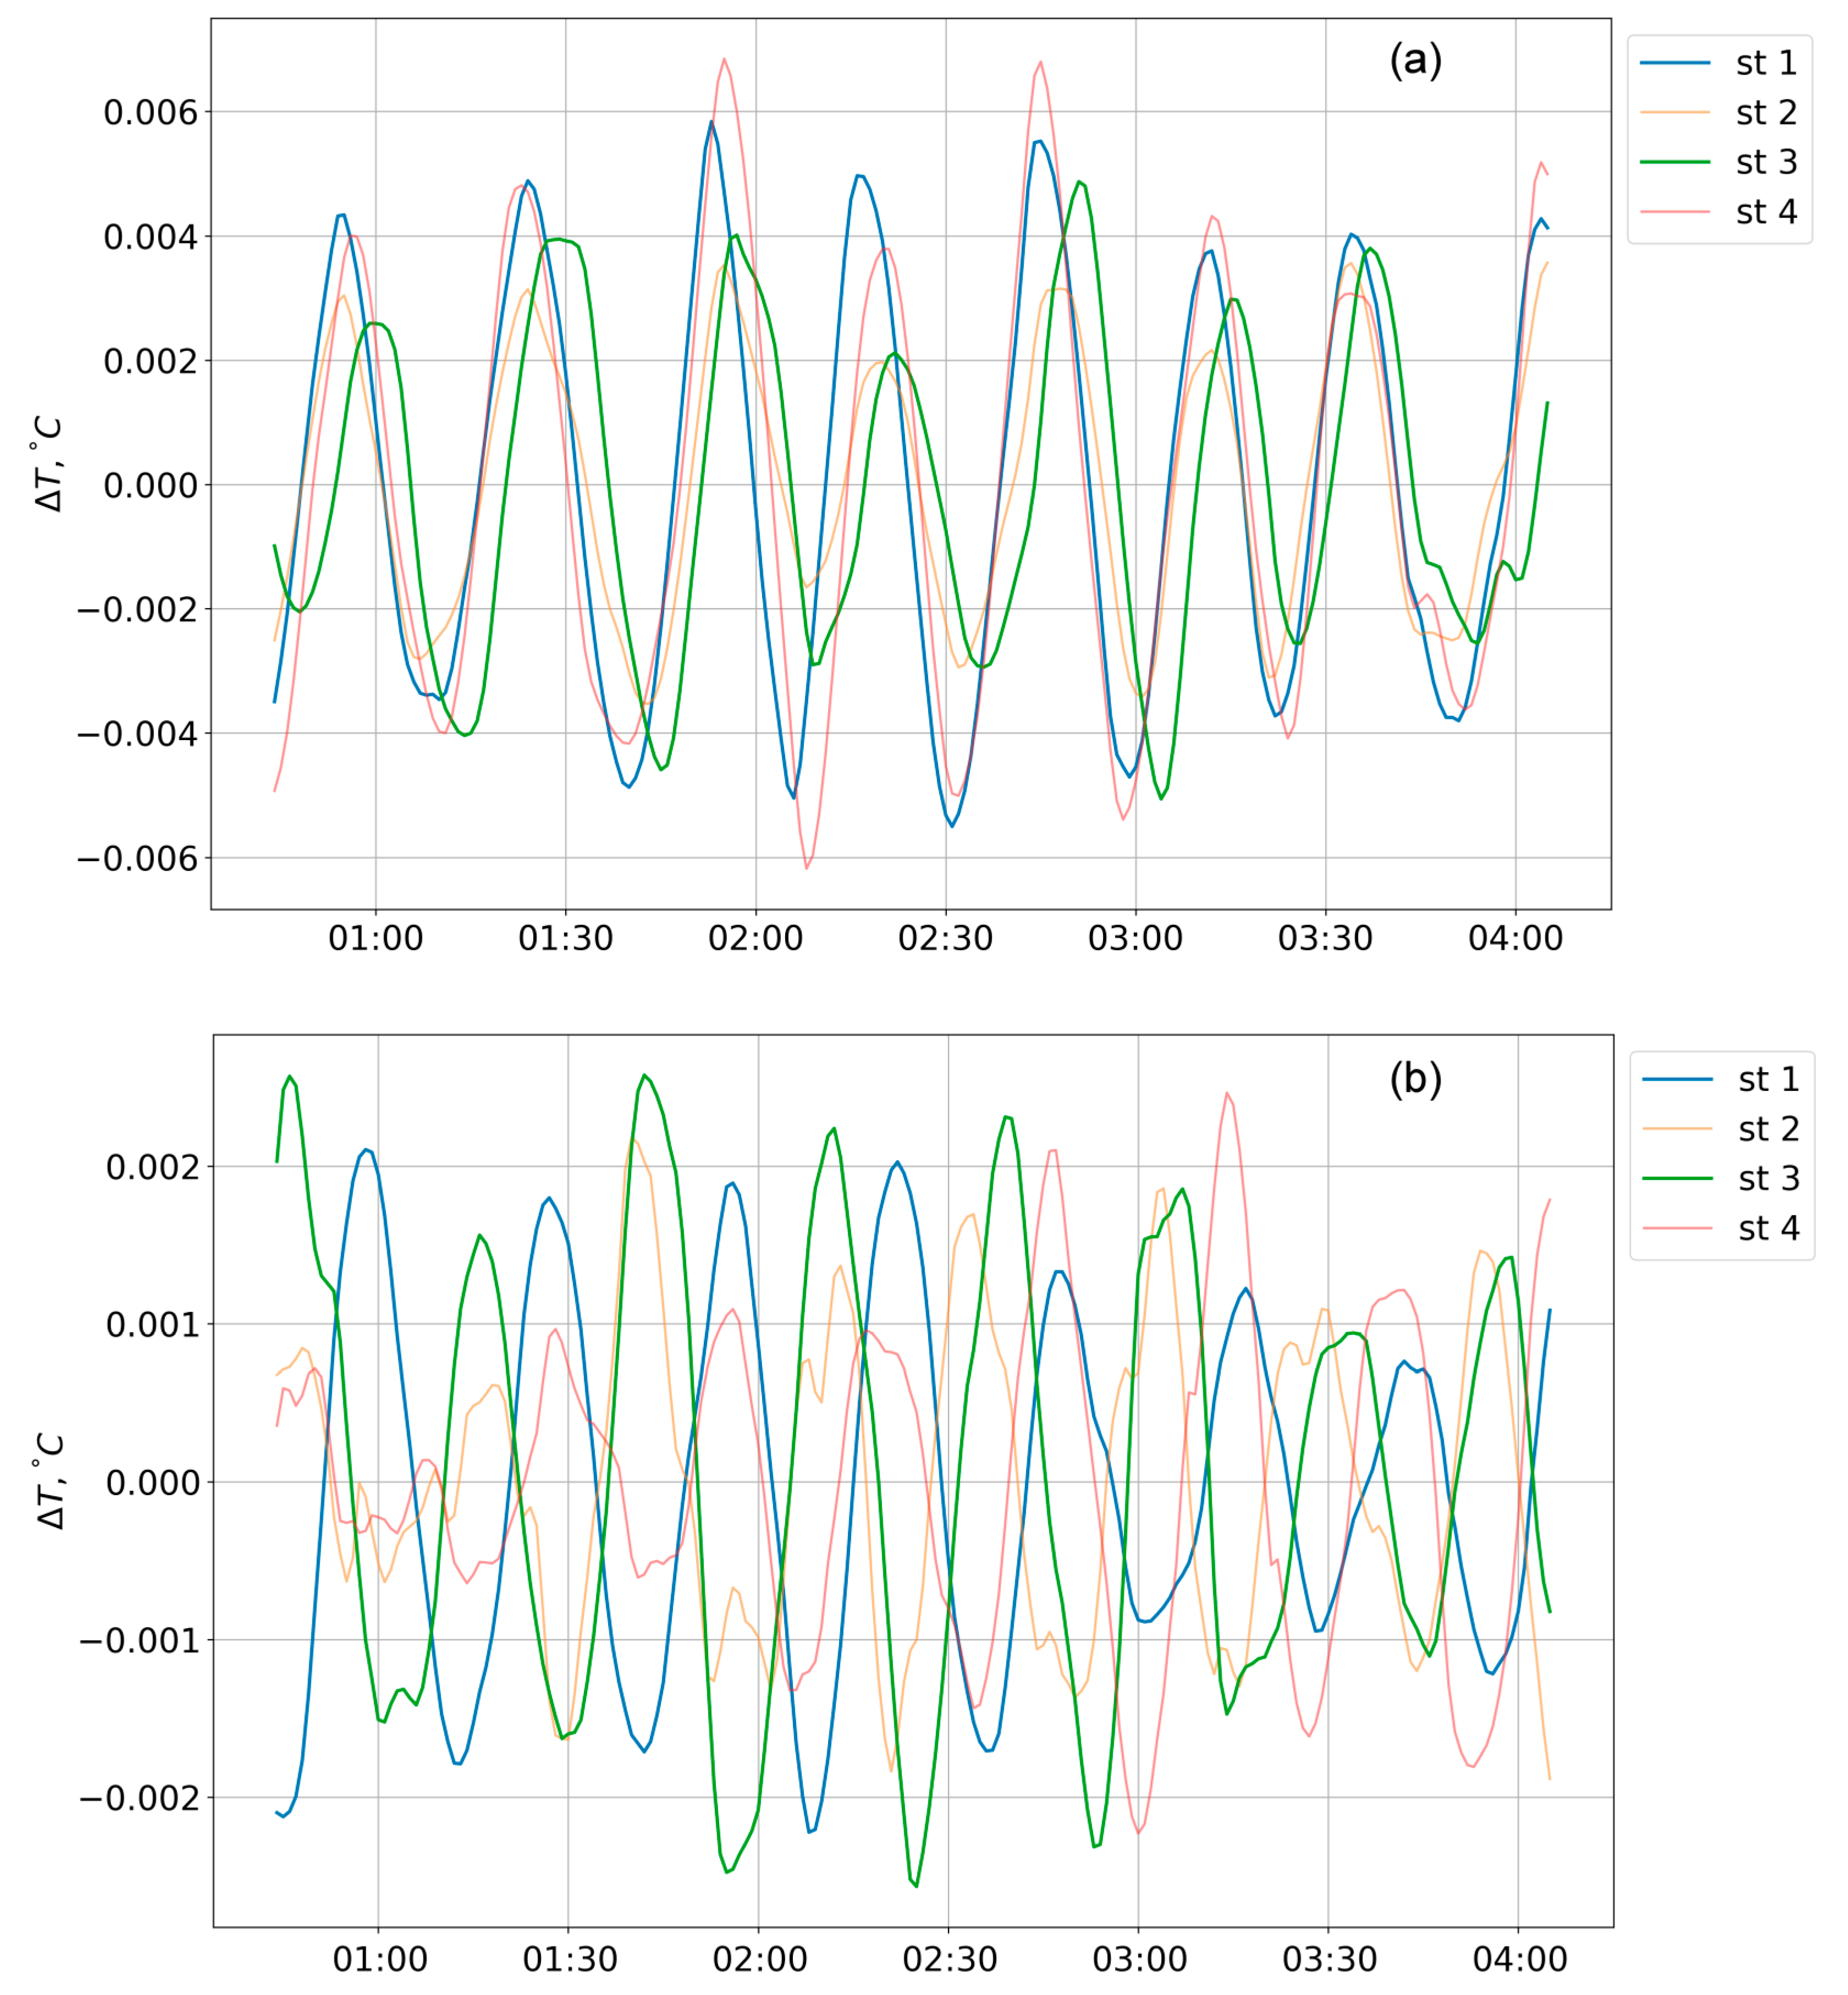
At the next stage of data processing, a comparative analysis of series for horizontally spaced TR-chains was carried out. We found it quite typical in both years for the situation to be that, when at some depths, there was a Δ
T for different chains oscillated in antiphase (
Figure 5). This fact can be considered as direct proof of the existence of standing IWs in the water column.
At 1–3 February 2014, when the distance between the chains was 50 and 100 m, the total duration of episodes with antiphase was comparable to the duration of measurements. At the same time, the episodes themselves were somewhat blurred, in particular due to a rather irregular alternation of the depths where the oscillations occurred in antiphase (presumably due to the presence of high modes and the mobility of the nodes). In general, however, it can be assumed that for a significant part of the time, the sensors of different TR-chains were located on the opposite sides of the nodal lines. Given the known distance between the TR-chains, an upper estimate for the wavelength can be inferred: λ ≤ 100 m, which is consistent with the theoretical values given in the previous section.
In 2016, the TR-chains were spaced much more closely (~4 m). Due to this narrow spacing, temperature fluctuations recorded by the sensors of different TR-chains, as a rule, occurred in phase (
Figure 6a). On the other hand, the long (up to 5–7 h) time intervals with antiphase oscillations at different TR-chains were also recorded. The number of such intervals, however, turned out to be significantly smaller than in 2014, although the antiphase specifics of the oscillations was much more pronounced (
Figure 6b).
These features of ΔT fluctuations in 2016 can be used for estimating the lower bound of IW wavelength. Namely, the absence of a phase shift at significant time intervals corresponds to a situation when all chains are located between adjacent nodal lines, within one “cell” of a standing wave, which is possible when the wavelength is greater than the distance between the TR-chains, that is, λ ≥ 8 m.
In general, phase analysis gives a fairly vague estimate for the wavelength: 8 m ≤ λ ≤ 100 m. A more accurate estimate of the wavelength is possible by analyzing a propagating wave. Namely, by tracing the trajectory of the wave beam generated by some external disturbance, one can calculate this disturbance propagation speed and then estimate λ by taking Formulas (2) and (3) into account.
Such a program, however, is not so easy to implement, and the success largely depends on how local the beams are themselves and the regions in which the disturbance is generated. In particular, if these areas are large and, accordingly, the wave beams are blurred, the traditional method [
48] of determining the wavelength from the depths at which the isotherm displacements are maximum at different TR-chains does not always work. In turn, an excessive concentration of energy in narrow beams makes it difficult to detect these beams using a limited number of TR-chains, especially with considerable distances between them.
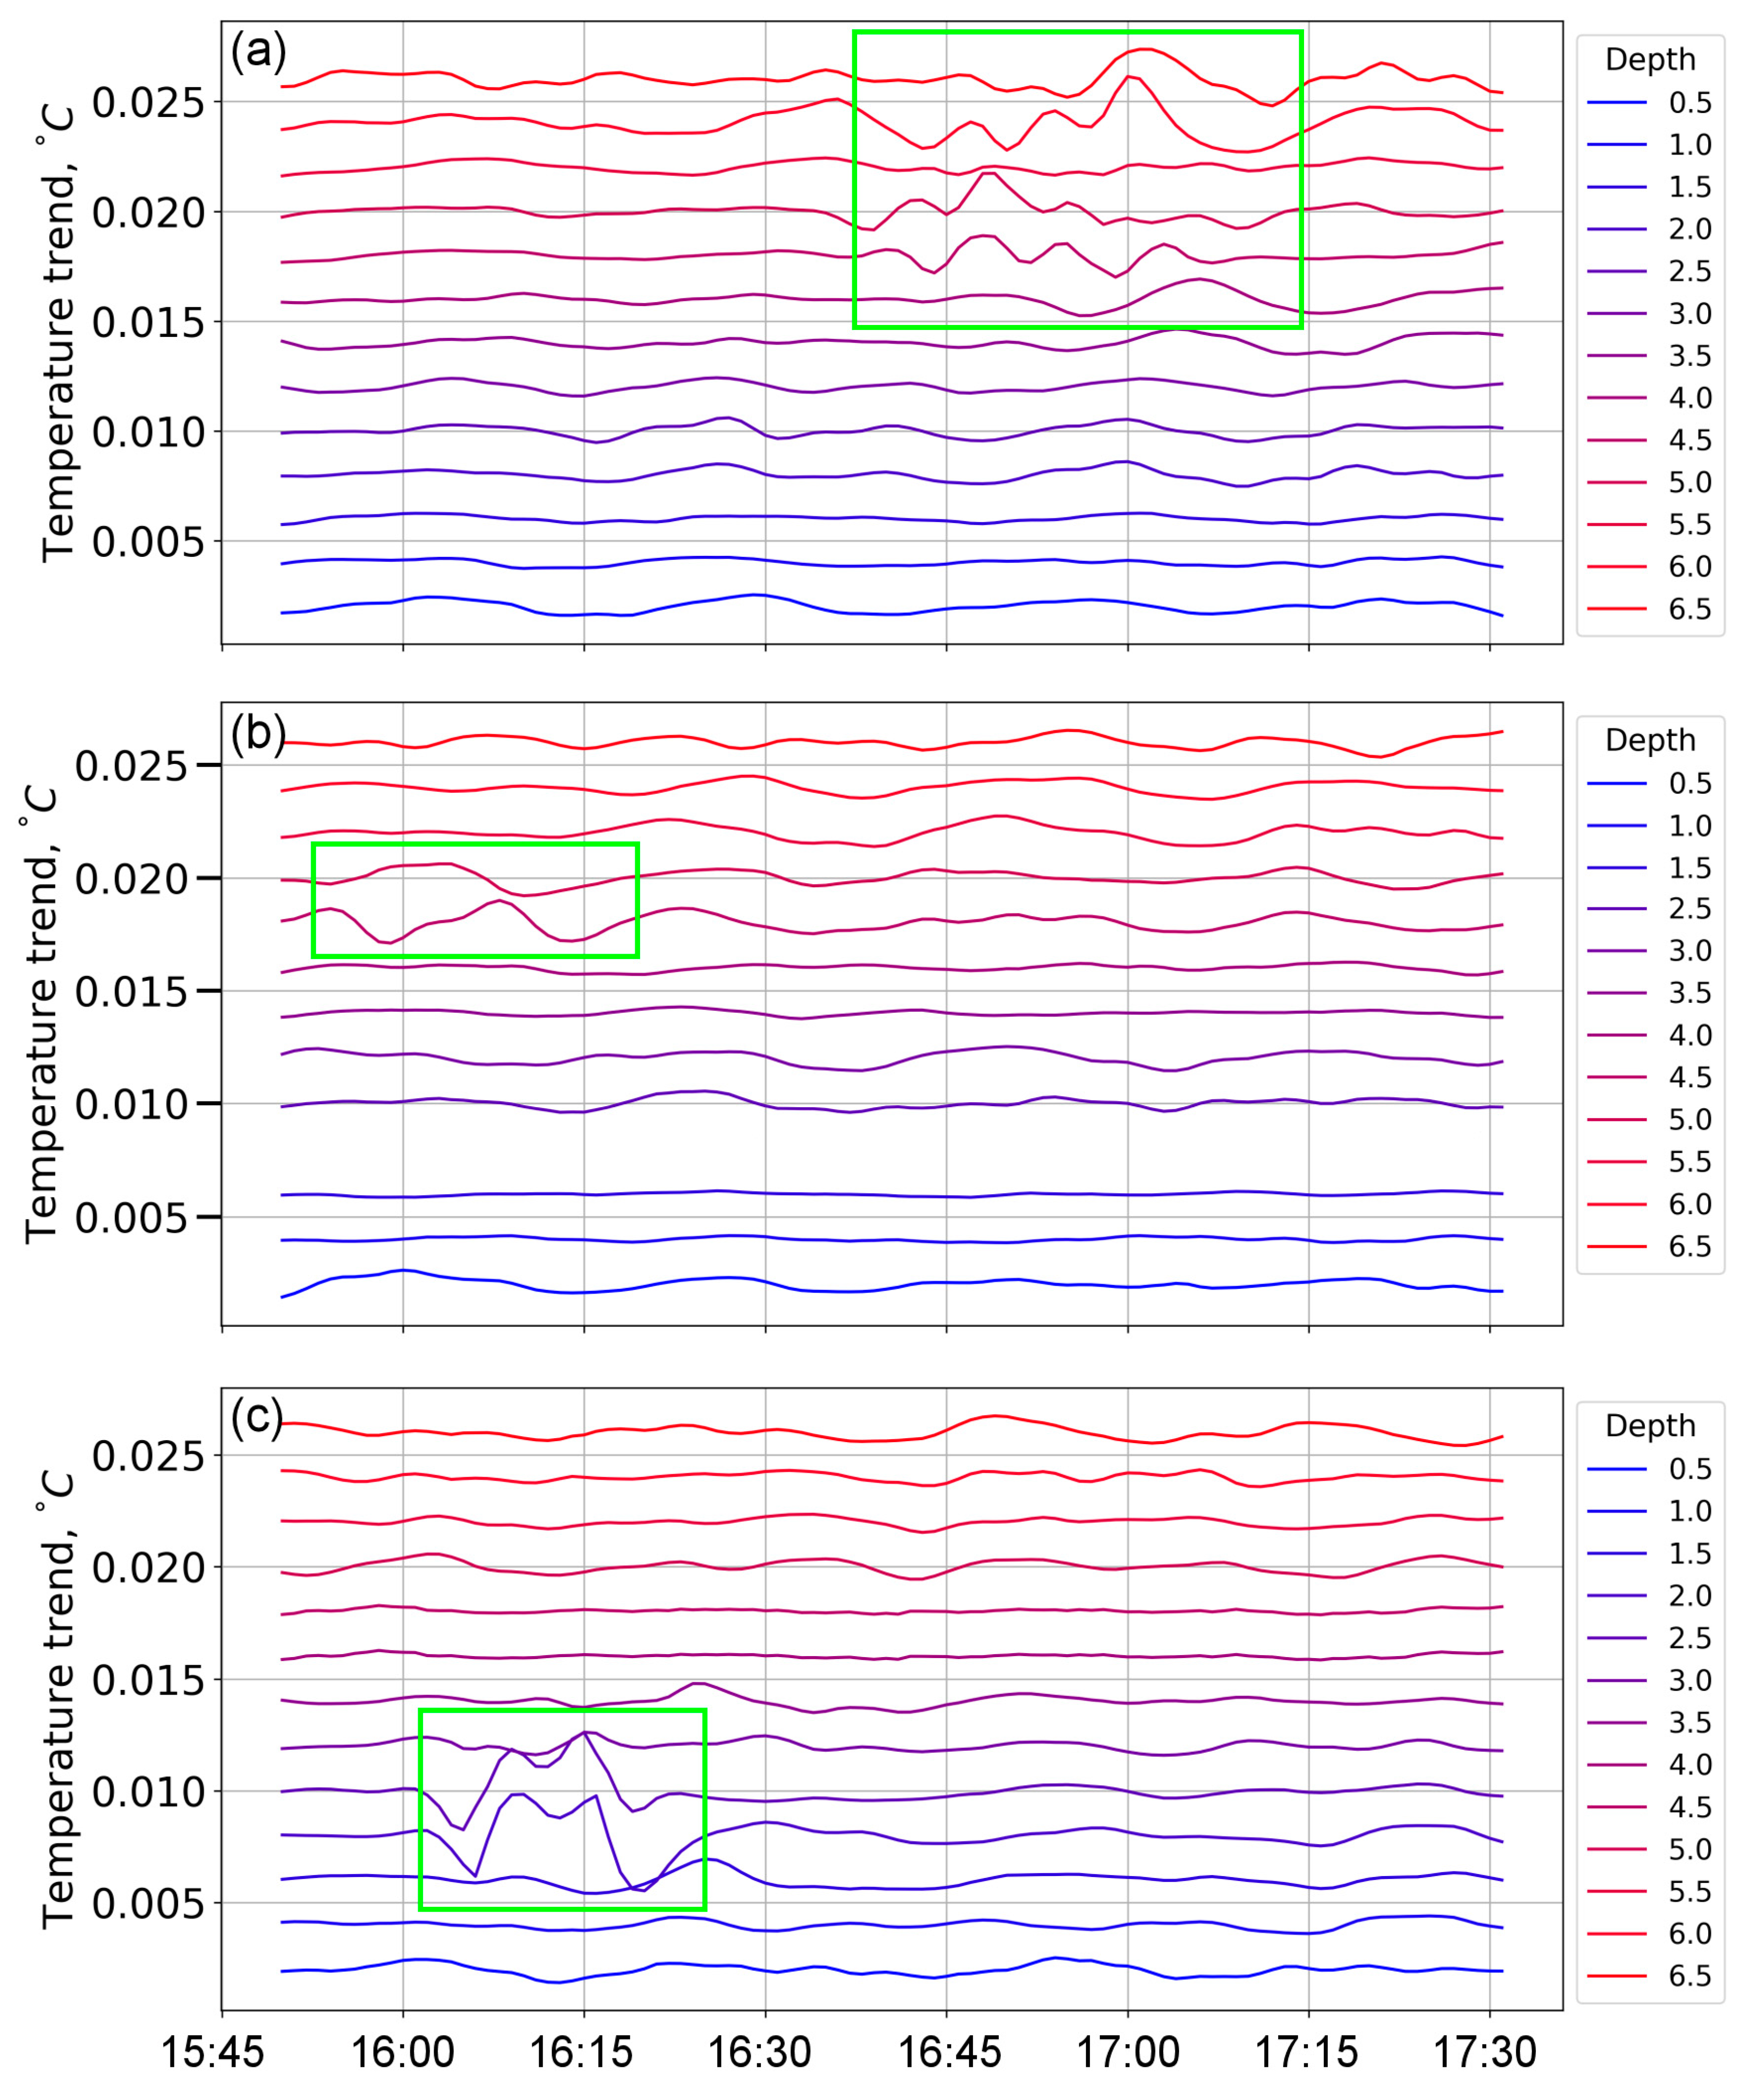
Sharp disturbances of the temperature field were registered in both years, but the paths of these disturbances could be derived directly from experimental data only for a few cases. In particular, events connected with disturbances in 2014 in most cases were localized not only in time, but also both vertically and horizontally (for the given time interval, each signal was recorded by the sensors of only one TR-chain).
Figure 7 represents some of such events through the depthwise temperature series of sensors at stations 1, 2, and 4. In the general case, it was not easy to determine whether these events are traces of the same disturbance (and belong to the same beam) or whether they are independent. These features make it difficult to reveal the spatial paths of temperature perturbations and calculate IWs’ propagation direction, velocity, and other characteristics, especially for the cases when the distance between the TR-chains is significant. A similar conclusion about the local nature of the generation and dissipation of high-frequency IWs was previously made in [
36,
37]. It was with this circumstance in mind that in 2016, the TR-chains were located at a very small (~4 m) distance from one another in order to increase the probability of detecting the disturbances and tracing their trajectories.
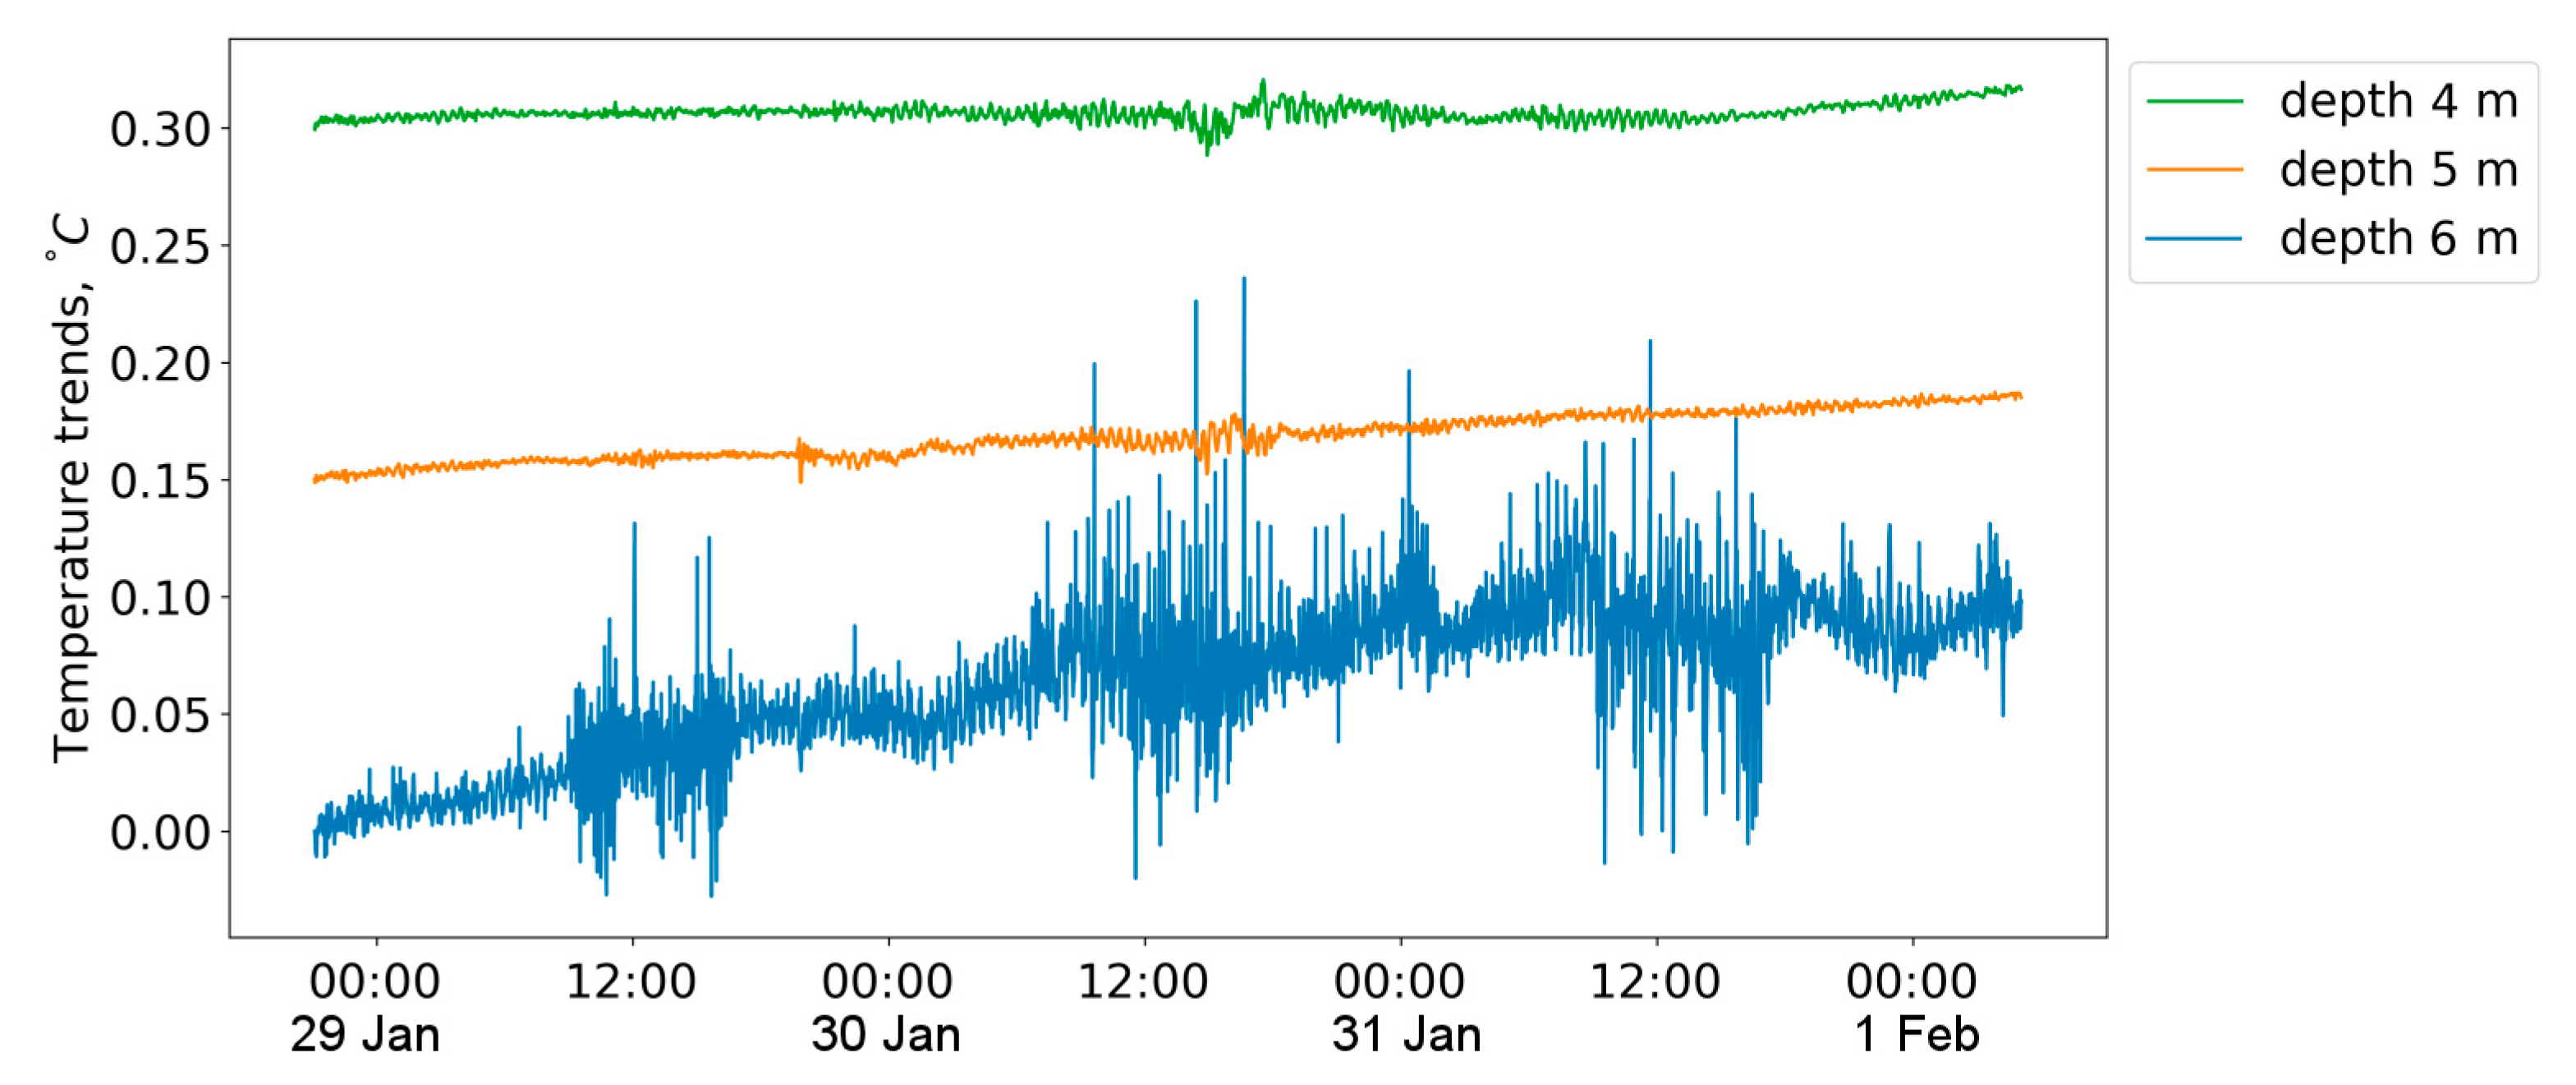
In the course of data analysis of the 2016 experiment, the study of disturbances and propagating IWs was preceded by an analysis of temperature fluctuations in the bottom layers of all four TR-chains in order to check for the localness of IW generation. The near-bottom layers were chosen considering that, in accordance with the concept that short surges are generated by the interaction of a barotropic seiche with bottom irregularities, one can expect that disturbances first appear in the near-bottom layer. This feature of IW generation is confirmed by experimental data. In particular, in the winter period before the onset of under-ice convection, the amplitude of temperature fluctuations is usually the greatest in the near-bottom layer. As an example,
Figure 8 shows the temperature dynamics in the near-bottom layer and at depths of 4 and 5 m on the TR-chain at station 4 in 2016.
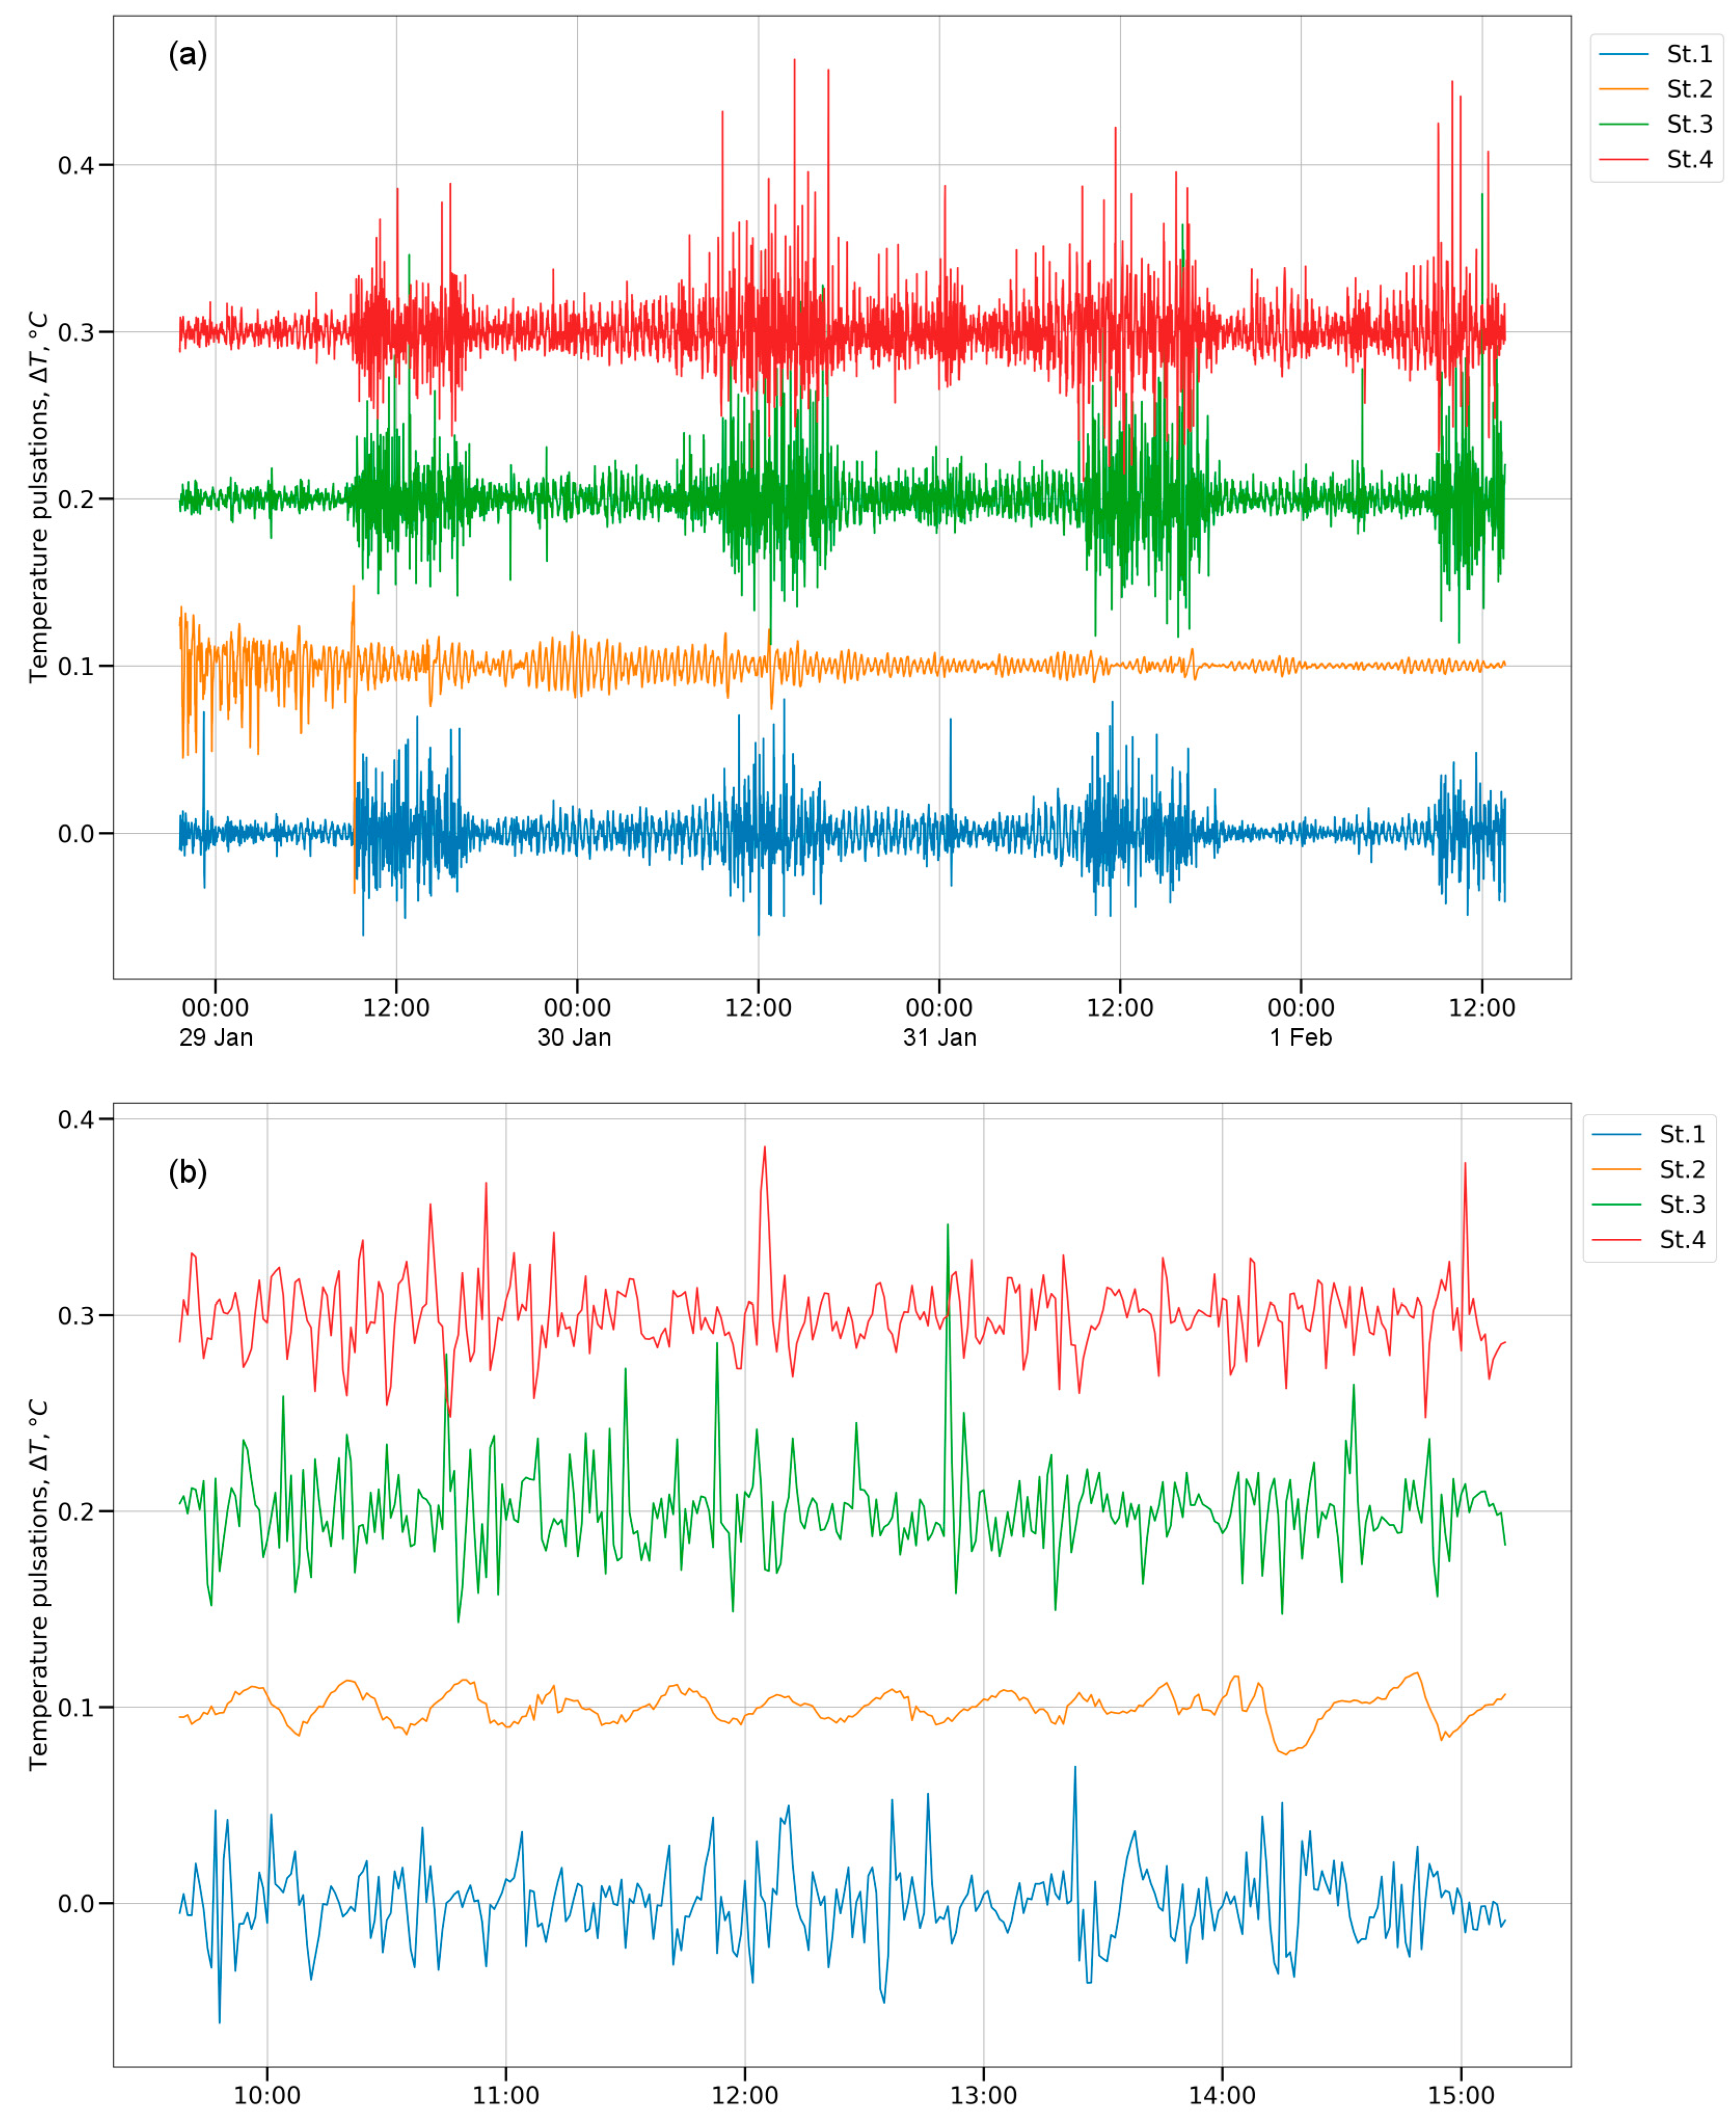
The dynamics of temperature fluctuations in near-bottom layers (at 5.5 m depth) on all four TR-chains in 2016 are shown in
Figure 9a. At a first glance, the signals seem to be correlated for three out of four TR-chains, at least as far as diurnal variations are concerned. However, a more detailed analysis of the ΔT series for shorter time intervals shows that the signals are not identical for different TR-chains (
Figure 9b). For such intervals, the correlation is practically absent; at least the largest surges on different chains, which are presumably responsible for IWs generation, are observed at different time moments. These data confirm the local nature of the disturbances that generate IWs.
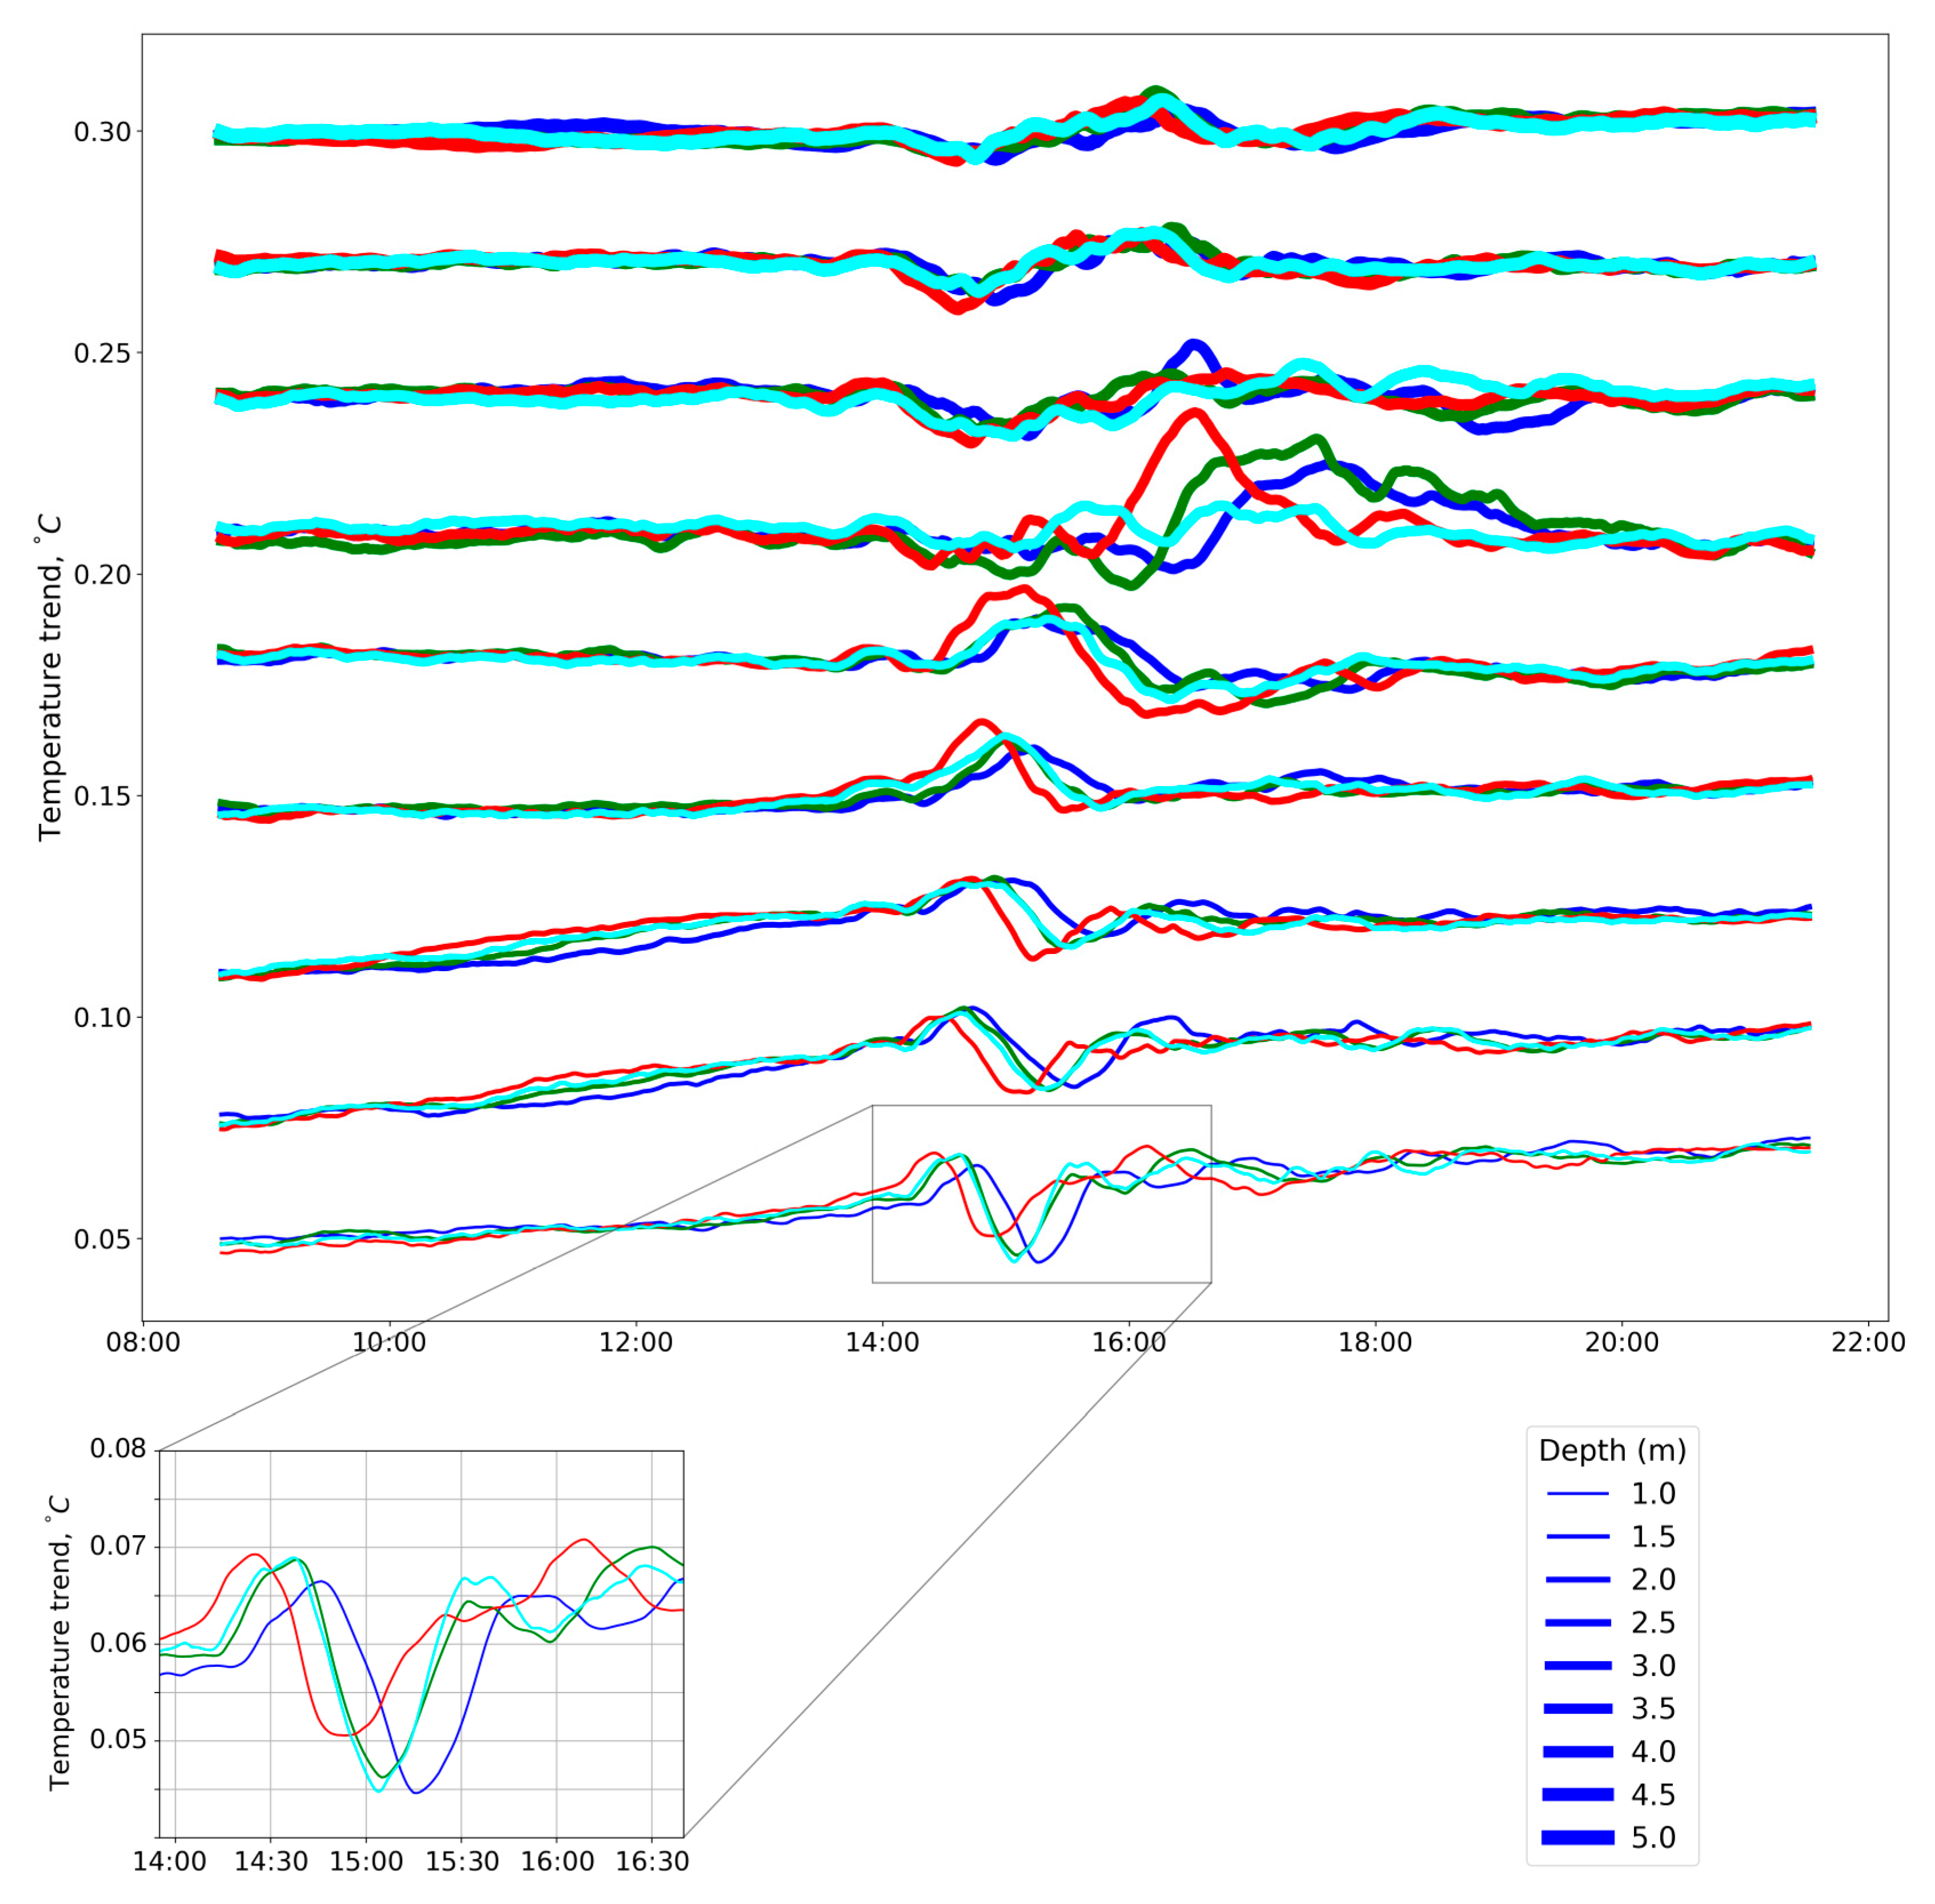
The local spatial scope of the IW sources and the use of closely spaced TR-chains in 2016 have enabled the detection of propagating IWs and their direction and speed. Special attention during data processing was given to the analysis of those local surges that were consecutively registered not only at certain depths of the same TR-chain, but also at different TR-chains. One of these surges, registered in 2016, is presented in
Figure 10. The corresponding surge, or perturbation of the temperature field, was recorded by temperature sensors on all four TR-chains. At the same time, the thermal disturbance reached the TR-chains at stations 2 and 3 with some (~10 and 20 min, respectively) delay from the TR-chain at station 1.
Taking these delays into account and using the known distance between the chains, the horizontal component
cgx of the group velocity was estimated by the analysis of some surges. For different surges, the value of
cgx varied in the range of a few mm/s, depending on depths. For the surge shown in
Figure 10, the value
cgx ≈ 0.65 cm/s was obtained for shallow depths. Since the direction of the horizontal projection of the wave vector
k is, strictly speaking, not known, this value can be considered as a lower estimate of the value of
cgx. Substituting the values
H ~ 6 m,
N ~ 10
−2 rad/s, and ω/
N ~ 1/3 in Formula (3), the above estimate of
cgx allows us to identify the disturbance under consideration as a vertical mode of a sufficiently high (
n = 3 or 4) order. Taking these vertical mode numbers into account, the horizontal wavenumber k is derived directly from (2). Finally, we obtain the estimate
λ ~ (9–12) m for horizontal wavelength.
4. Discussion
The analysis of the experimental data collected using several horizontally spaced TR-chains confirms the conclusion about the presence of short IWs of small ice-covered lakes. It is shown that these waves have a rather complex and mobile mode structure, with wavelength ranging from several meters to several tens of meters; their periods are determined by the frequencies of barotropic seiches.
The analysis of experimental data revealed the presence of both standing and propagating IWs. In the latter case, both the generation of IWs and their propagation along the beams are characterized by significant spatial localness. It cannot be ruled out that it is this feature that explains the specifics of the processes of water column mixing under ice; however, the role of IWs in this process has not been studied enough. In this regard, several challenging points can be highlighted.
The first challenge is related to the stability of IWs. Experimental data indicate a more intense mechanism of vertical transfer than the molecular one. However, the observed diapycnal diffusivities exceed the corresponding molecular value only by several times or by an order of magnitude [
9,
11]. This may suggest that an alternative mechanism that intensifies the vertical transfer is associated with the instability of IWs and their breaking. However, estimates of the Richardson gradient parameter
carried out in a number of studies [
31,
56] showed that its values varied widely, from several units to several hundred, but in most cases significantly exceeded the critical threshold of 0.25. Therefore, the mechanism of IW breaking due to the occurrence of the Kelvin–Helmholtz instability is questionable.
The second point is related to the assessment of the role of the near-bottom boundary layer in the intensification of vertical mixing. To wit, a number of studies on the role of IWs in mixing during the open water period [
2,
6,
33] have demonstrated that it is in this layer that turbulent fluctuations are the most intensive. In this case, a rise in turbulence near the bottom may be a result of near-bottom shear currents that arise in the presence of IWs [
2,
32,
33].
It cannot be ruled out that this feature is also characteristic of mixing processes in ice-covered lakes. In this context, the study of the temperature field in the near-bottom layer is of particular interest. It is this problem that we consider as a priority when planning further studies of IWs in ice-covered lakes.
The role of IWs in ice melting remains poorly understood. It is known that the currents in ice-covered lakes can reduce the thickness of the ice [
17,
57,
58]: for example, huge rings with a diameter of several kilometers on the ice of large lakes Baikal and Teletskoye appear, presumably, above intrathermocline lens-like stationary eddies [
58]. The authors emphasize that if the under-ice eddy is non-stationary, then the ice ring does not appear [
58]. Also known is the phenomenon of the appearance of star-like structures on the ice of small lakes and ponds during the spring thawing and the development of under-ice radiatively-driven convection. An overview of such studies is given in [
17]. One of the possible reasons for the appearance of star-shaped structures on ice may be stationary flows in convective cells. It should be noted that in lakes where there is advective transport, star-shaped structures on ice are not observed, since the position of convective cells changes with time [
20,
59]. In this regard, it is difficult to expect a significant effect of IWs on ice melting, since both standing and propagating short IWs found by us are quite variable both in time and space.
Another methodological problem of the study of short IWs in ice-covered lakes is the choice of the position of measurement stations. In the case of basin-scale standing IWs, the location of nodes and antinodes is of great importance, since the velocities differ sharply in these points [
60]. There exist models and solution methodologies (semi-analytical, Finite Elements) for the determination of eigenfrequencies and eigenmodes of ice-covered basins, e.g., [
61,
62]. Therefore, when choosing the location of the measurement station, the position of these critical points should be taken into account. In our study, when choosing measurement points, we did not rely on a preliminary analysis of the position of the bonds and antinodes of the barotropic seiche, but in future studies, we will fill this gap.
