Article

Marine Calcareous Biological Ooze Thermoluminescence and Its Application for Paleoclimate Change since the Middle Pleistocene

1
School of Earth Science and Resources, China University of Geosciences, Beijing 100083, China
2
Institute of Nuclear and New Energy Technology, Tsinghua University, Beijing 100084, China
3
School of Geophysics and Information Technology, China University of Geosciences, Beijing 100083, China
4
School of Ocean Science, China University of Geosciences, Beijing 100083, China
*
Author to whom correspondence should be addressed.
Water 2023, 15(14), 2618; https://doi.org/10.3390/w15142618
Submission received: 29 May 2023 / Revised: 13 July 2023 / Accepted: 14 July 2023 / Published: 19 July 2023
(This article belongs to the Section Oceans and Coastal Zones)

Abstract

:
Natural thermoluminescence (TL) from the core of MD81349 marine calcareous biological ooze samples in the Ninetyeast Ridge of the equatorial northeast Indian Ocean and from the core of IODP306-U1312B in the high latitudes of the North Atlantic Ocean was studied. The spurious TL intensity of 395 °C at its peak is dose independent when the heating rate is 6 °C/s in a nitrogen atmosphere. TL signals have exhibited a significant correlation with the marine isotope stages (MIS) in the two oceans since the mid-Pleistocene era. High TL intensity corresponds to a negative δ18O in the interglacial stages, and low TL intensity corresponds to a positive δ18O in the glacial stages. The TL of both cores from the two oceans reveal that global climate has experienced eight cold and warm cycles since the mid-Pleistocene era. In this study, a single-frequency spectrum analysis of the MD81349 and U1312B TL cores in the last 300 ka is performed. Near the equator of the northeast Indian Ocean, the short cycles of 38 ka and 5 ka are more significant, while the cycle of 8 ka is more significant in the North Atlantic Ocean. In addition, a correlation analysis shows that the TL has a significant positive correlation with the trace element 135Ba and a significant negative correlation with 47Ti. The impurity ions (e.g., Ba2+, Mn2+ and Ti2+) doped in carbonate act as activators and suppressants, respectively. A time series of the TL of the calcareous biological ooze tests provide an important record of climate change. The source of the TL signal is also discussed.

1. Introduction

Mineral TL refers to the condition whereby crystalline solids can generate free electrons and holes in the crystal when exposed to ionizing radiation. Parts of the free electrons and holes are captured and trapped inside the crystal. When the crystal is heated, the trapped electrons and holes regain energy, escape from the trap, return to the ground status, and release excess energy in the form of TL. The TL of marine sediment minerals is widely applied in dating [1,2,3], natural dose measurement [4], stratigraphic division, environmental change, and other fields [5,6,7,8]. Marine sediments are composed of calcareous and siliceous biological and nonbiological components, such as terrestrial elements, autogenous elements, and volcanic and cosmic dust. In accordance with the relative abundance and formation mechanism of the components, they are divided into five main types, namely, calcareous biological ooze, siliceous ooze, oceanic clay, terrestrial detrital, and pyroclastic. Calcareous biological ooze from eupelagic deposits is rich in carbonate minerals and is most commonly found in oceans. It also contains abundant temporal information about climate change.
At the 2013 annual meeting of paleoceanography in Barcelona, Spain, an important theme was the development of alternative indicators of paleoceanography. Carbonate has been proven to be an excellent TL carrier mineral [9,10,11,12,13,14,15,16,17]. Research on TL through marine carbonate has achieved results in the fields of dating [18,19,20] and paleoclimate change [21]. In this study, calcareous biological ooze TL from two cores collected from the Ninetyeast Ridge of the equatorial northeast Indian Ocean and the high latitude of the North Atlantic Ocean were analyzed. The TL peak intensities in calcareous biological ooze caused by paleoclimatic changes that have occurred since the middle and late Pleistocene eras are explored by comparing the results of the δ18O, and are compared with the carbonate contents in sediments and the Milankovitch spectrum period extracted from the TL time series.

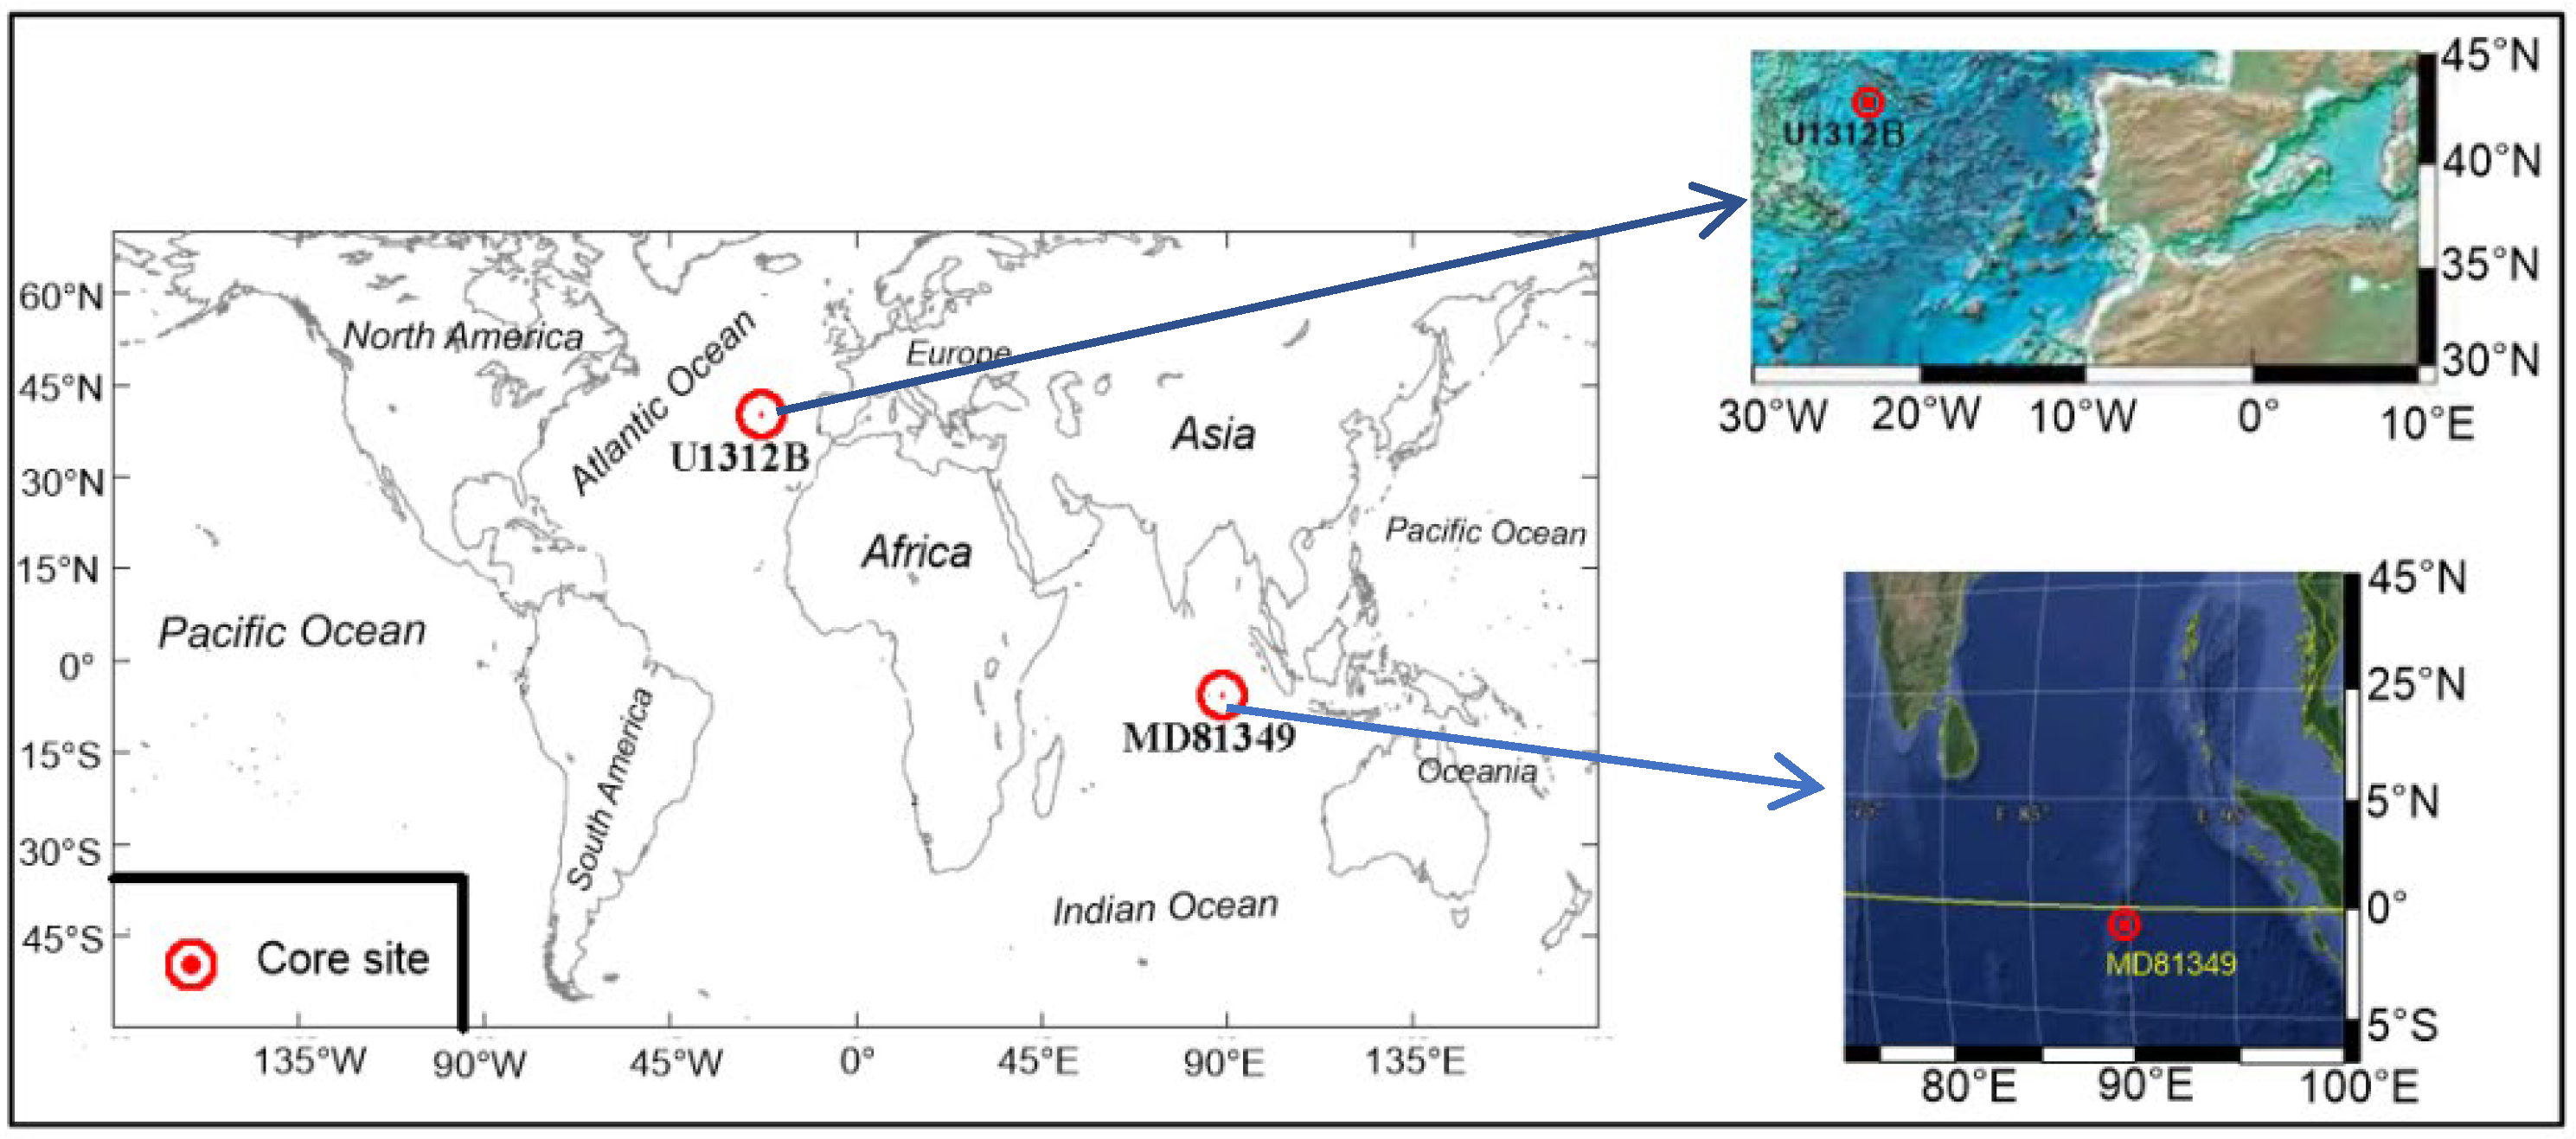
2. Geographical Setting

2.1. The Ninetyeast Ridge of the Equatorial Northeast Indian Ocean

The MD81349 piston core was collected near the equatorial Ninetyeast Ridge by the French scientific vessel Marion Dufresne. The Ninetyeast Ridge in the northeast Indian Ocean was formed in the south Indian Ocean during the Cretaceous era. Since the Cenozoic era, the collision between the Indian plate and the Eurasian plate led to the uplift of the Himalayas and the Tibetan Plateau, thereby affecting global climate and environmental changes. With the Indian Plate moving northward along the Ninetyeast Ridge, it was extended from 31° S to 10° N, measuring approximately 4000 km in length and 2000–3000 m in height. The Ninetyeast Ridge is far from the continental margin. Land-based debris accounts for a small proportion of its sediments. Unaffected by the input of terrestrial materials, its sedimentary environment is stable. It belongs to an area where the equatorial east wind and the south Asian monsoon meet and is an important geographical tectonic unit in the northeast Indian Ocean. It echoes with the Himalayas and the Qinghai–Tibet Plateau in the north. The Ninetyeast Ridge is a typical study area for paleoceanography and paleoclimatology [22,23].
Abyssal sediments are regarded as suitable carriers for high-resolution paleoclimatology research, which is of great significance to global climate change research. The marine sediments in the northeast Indian Ocean region have preserved information on paleoclimate and environmental evolution, making it an ideal area for studying the response of sedimentary records to the changes in the paleoclimate and paleoenvironment.
The calcareous biological ooze in the core MD81349, represented by the oceanic origin of gray-white ooze, constitutes the main sedimentary components and is an excellent carrier of climate signals. The carbonate content is as high as 80–90%. The sediments are primarily nannofossils and foraminifers, with an average deposition rate of 1.45 cm/ka. The foraminifer assemblages are dominated by planktonic foraminifers, while benthic foraminifers are rare and small.

2.2. The North Atlantic Ice-Rafted Detritus Belt

Core IODP306-U1312B was continuously cored with a variable-length hydraulic piston coring (VLHPC) system at the U1312 station, from 2 March to 25 April 2005, of the Integrated Ocean Drilling Program (IODP306). The North Atlantic ice-rafted detritus belt (IRD belt) is directly related to Arctic glacier activity and is the starting point of deep water in the global warm-salt circulation. Low-temperature and high-salinity seawater enters the Labrador and Greenland Seas, driving the current global ocean cycle and heat exchange and affecting global climate. Therefore, this area is regarded as the driver of global climate change [24]. In contrast to the stable sedimentary environment of the Ninetyeast Ridge in the Indian Ocean, the North Atlantic IRD belt is affected by the alternation of cold and warm climates throughout history. The interconversion of the material composition and sedimentation process under the influence of glacial and interglacial periods was recorded. Therefore, the North Atlantic IRD belt is regarded as a sensitive area to experience climate change in the Earth. The IRD belt [25,26] is another hotspot for research. It refers to the floating ice carrying debris from the land to the sea, away from the land margin. With the gradual melting of ice floes, debris releases into the water body and sinks through the water column to the bed of the sea. The IRD belt is a highly sensitive indicator of climate change. This belt is an abundant carbonate deposition area, with an average deposition rate of 2.0 cm/ka, rendering it conducive to studies on climate change and air–sea interactions on a short time scale at the millennium level and the long time scale of millions of years since the Pliocene.
Sediments from Site U1312B are composed of varying mixtures of biogenic and detrital components, primarily nannofossils, foraminifers, and clay minerals. Lithologies include nannofossil ooze, foraminifer nannofossil ooze, foraminifer nannofossil ooze with clay, nannofossil ooze with foraminifers, nannofossil ooze with clay, nannofossil ooze with clay and foraminifers, silty clay nannofossil ooze with foraminifers, silty clay nannofossil ooze, nannofossil silty clay, and silty clay calcareous ooze. Most contact between these lithologies is bioturbated or gradational. Common smear slide estimates of the biogenic components include nannofossils (30–90%), foraminifers (5–30%), diatoms (<5%), radiolarians (trace), silicoflagellates (trace), and sponge spicules (trace). Total carbonate content ranges from 59 to 98 wt% in the core [27].
The geographic location of the cores is shown in Figure 1. The core parameters are shown in Table 1.

3. Analysis Methods

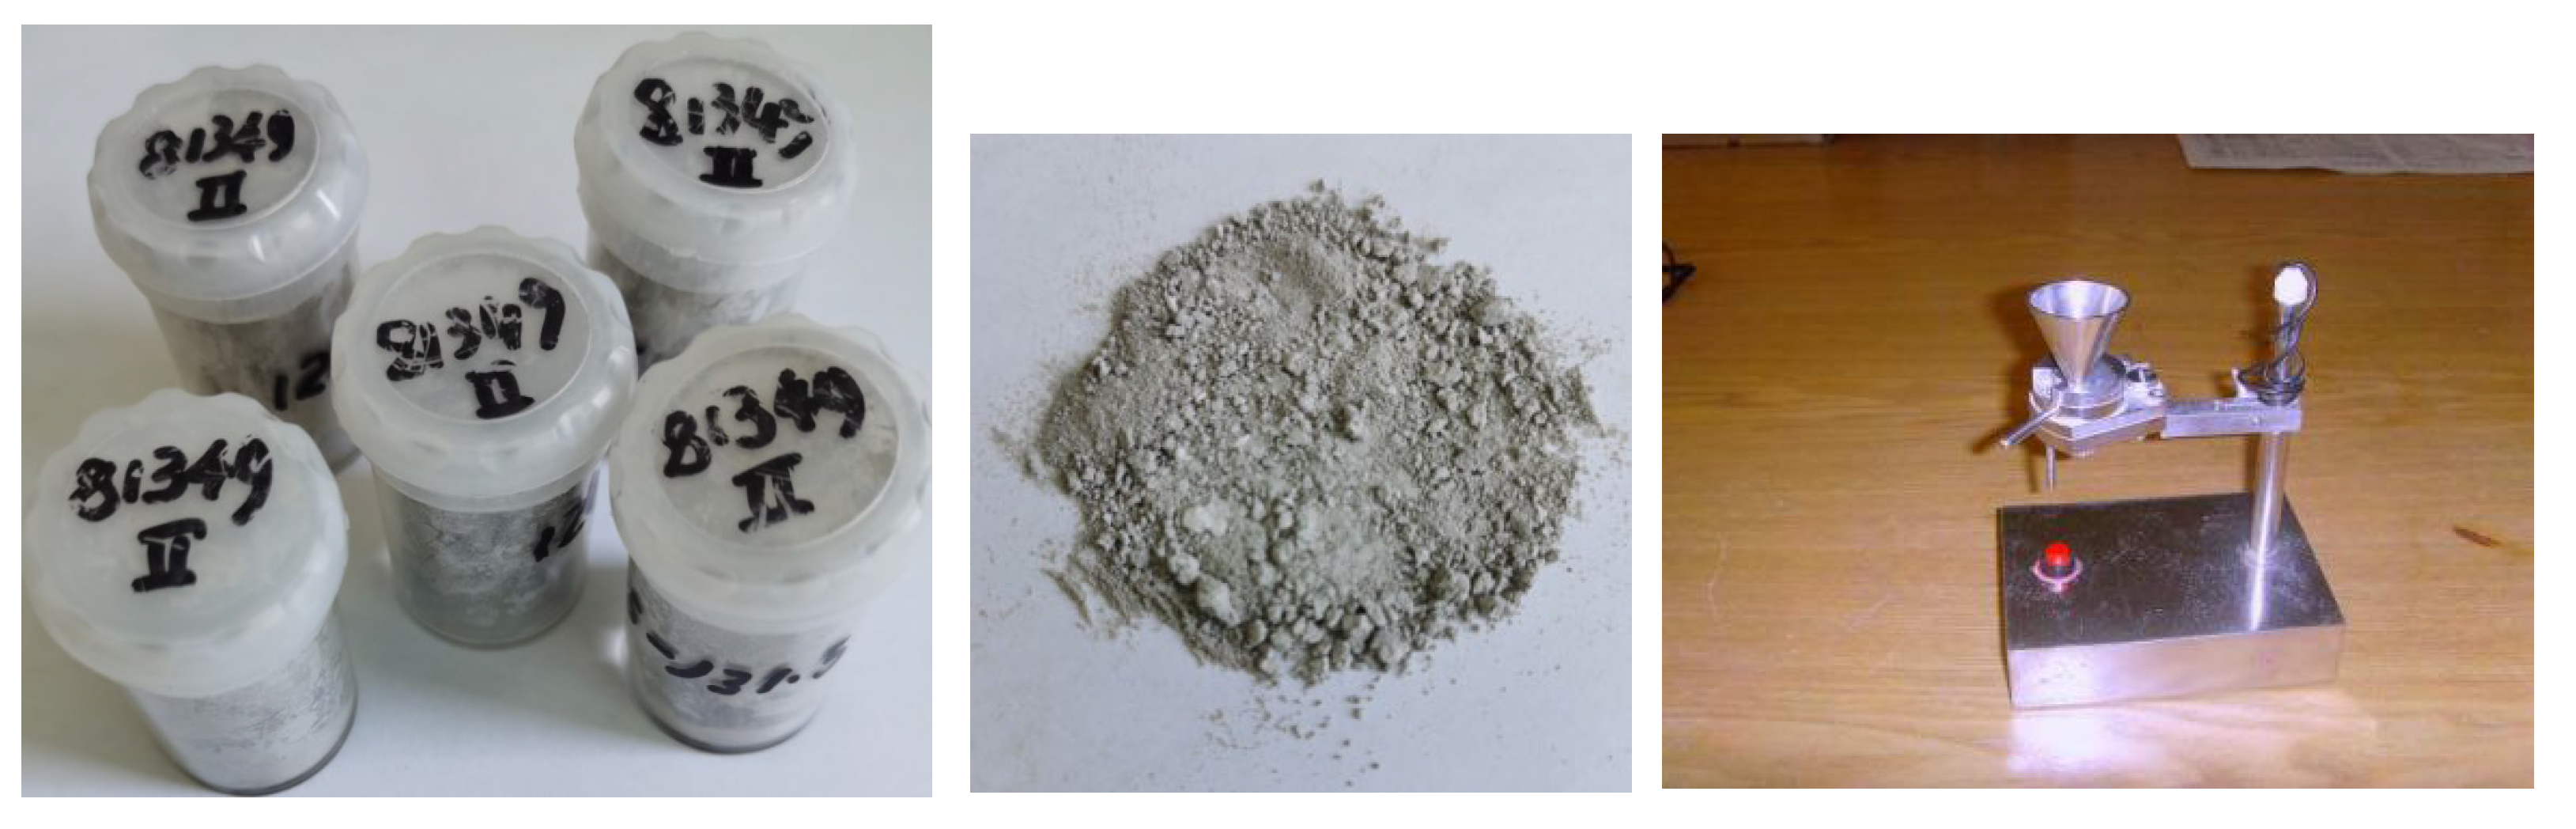
3.1. Sample Preparation

The sampling spacing for TL analysis of the core MD81349 is 3–5 cm and is 2–4 cm of the core U1312B. Each sample of calcareous biological ooze is weighed with a fixed volume sample splitter. The quality of the sample was tested with an electronic balance with an accuracy of 0.1 mg, and the mass was about 4.0 mg. The planktonic foraminifer (Globigerinoides ruber, G. ruber) were picked out of the samples under a microscope and measured after ultrasonic cleaning. It is a gray-white calcareous biological ooze sample. The sample splitter is shown in Figure 2.

3.2. Measurements

The TL of calcareous biological ooze and the CaCO3 measurements from the cores MD81349 and IODP306-U1312B were carried out at the Radiation and Environmental Laboratory of the School of Oceanography, China University of Geosciences (Beijing). The TL measurements were taken using an RGD-3 model. The samples from the core MD81349 were evenly measured on a stainless steel heating plate at a heating rate of 6 °C/s in 2001 under an air atmosphere, and with 5 °C/s in 2011 for the core U1312B under an air atmosphere. The optical signal was converted into an electrical signal output with a highly sensitive photomultiplier tube. The measurement result is the total TL peak intensity (a.u./4 mg), including the chemiluminescence (CL) derived from the high-temperature oxidation of organic matter [17,28,29] and spurious TL [30].
Oxygen isotopes in the G. ruber from the core MD81349 were determined at the French National Research Center for Climate and Environmental Sciences. After sieving and washing the samples, 15–20 planktonic G. ruber larger than 150 μm were collected. The shell was reacted with 100% phosphoric acid at 25 °C. After vacuuming and dehydration, the generated CO2 gas was collected and used for the isotope test with a British OPTIMA mass spectrometer.
Due to the limited number of G. ruber available for oxygen isotope testing [31], the global ocean standard LR04 [32] was cited to determine the stages of oxygen isotopes and establish an age model for the core U1312B.
To study the fine structure of G. ruber, the samples were analyzed with a JEM-2010F field-emission transmission electron microscopy (FE-TEM) at Tsinghua University (Beijing). Point resolution: 0.23 nm; crystalline lattice resolution: 0.102 nm; minimum beam spot size: 0.5 nm; maximum magnification factor: 1.5 M; maximum tilt angle of the sample table: X = ±35°, Y = ±30°.

4. Results

4.1. TL Measurement Results

The TL was determined for 89 calcareous biological ooze samples and 92 planktonic foraminifer samples (G. ruber) in the core MD81349. Among them, 73 samples were consistent with the sampling depth of oxygen isotopes. The maximum TL of the samples of the core MD81349 is 174.7 a.u. (TL peak intensity of the sample at a.u./4 mg, arbitrary unit, same below). The minimum value is 27.3 a.u. and the average value is 94.1 a.u. The TL values of planktonic foraminifers are higher than the TL of biological ooze samples, where the maximum value is 300.10 a.u., the minimum value is 114 a.u., and the average value is 186.84 a.u.
The maximum value of the TL of calcareous biological ooze of the core U1312B is 199.23 a.u., the minimum value is 28.49 a.u., and the average value is 84.7 a.u. for a total of 139 samples.

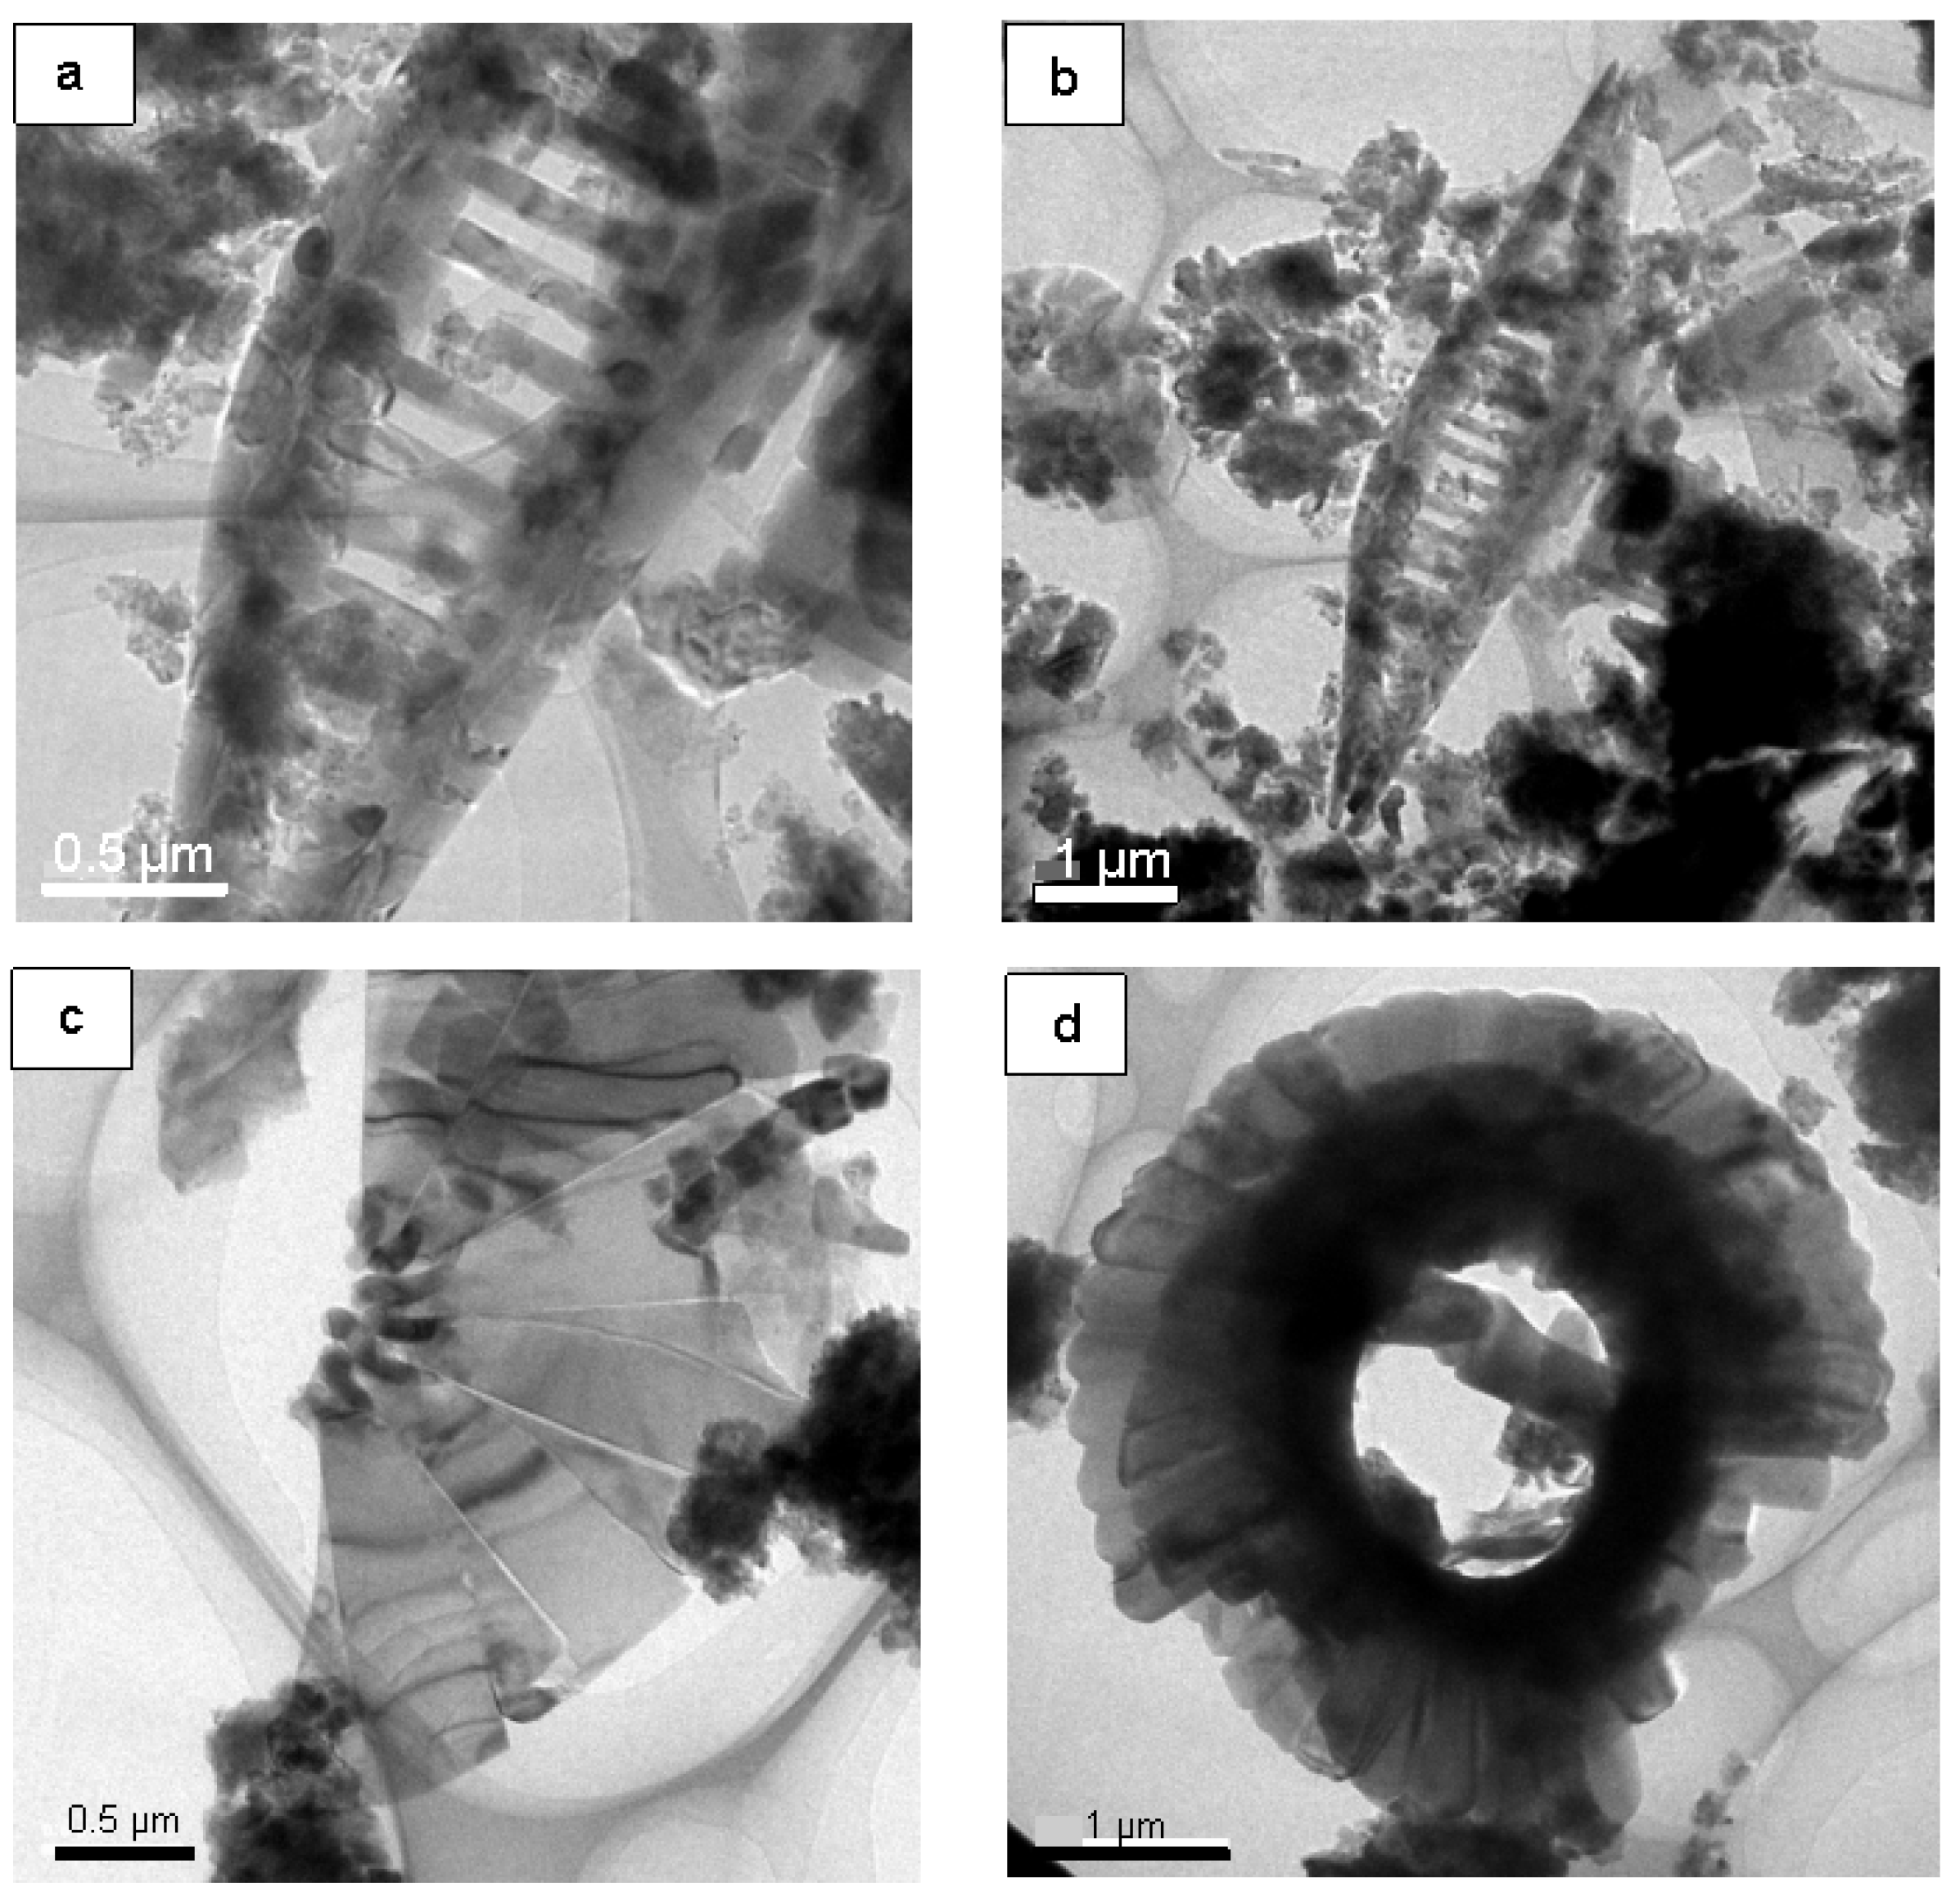
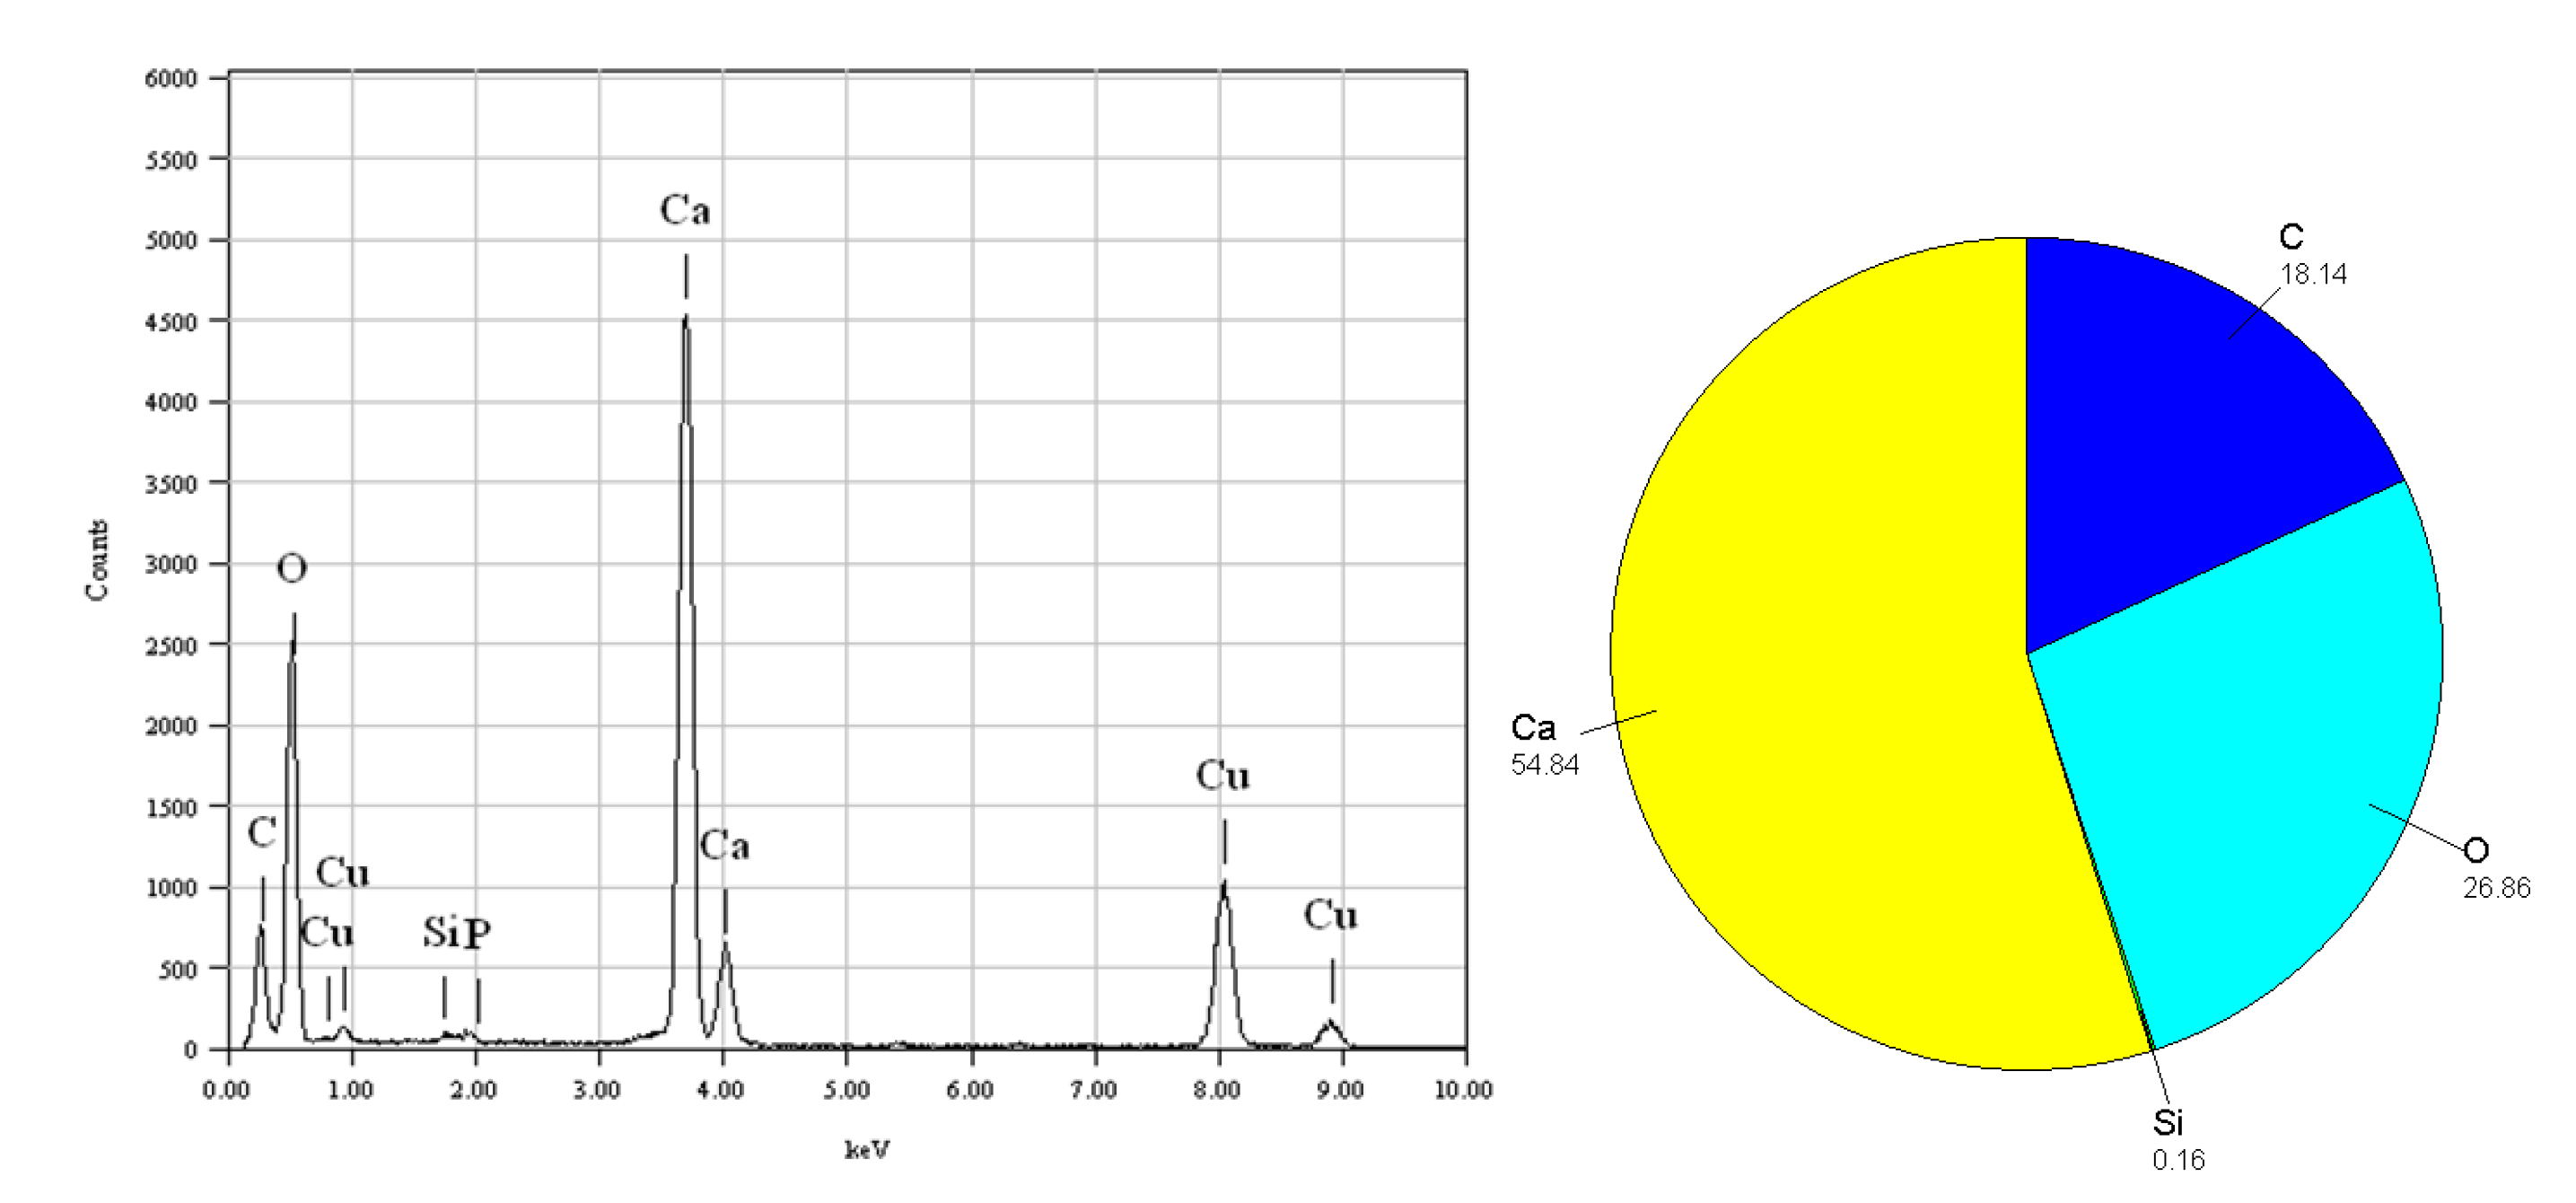
4.2. FE-TEM of Planktonic Foraminifer Shells

The FE-TEM microscopic imaging of planktonic foraminifer is shown in Figure 3, indicating the evident shape of foraminifer nannofossil ooze. The elemental composition of calcareous organisms is mainly Ca, O, and C, and trace P and Si. The main constituent mineral is carbonate, as shown in Figure 4.

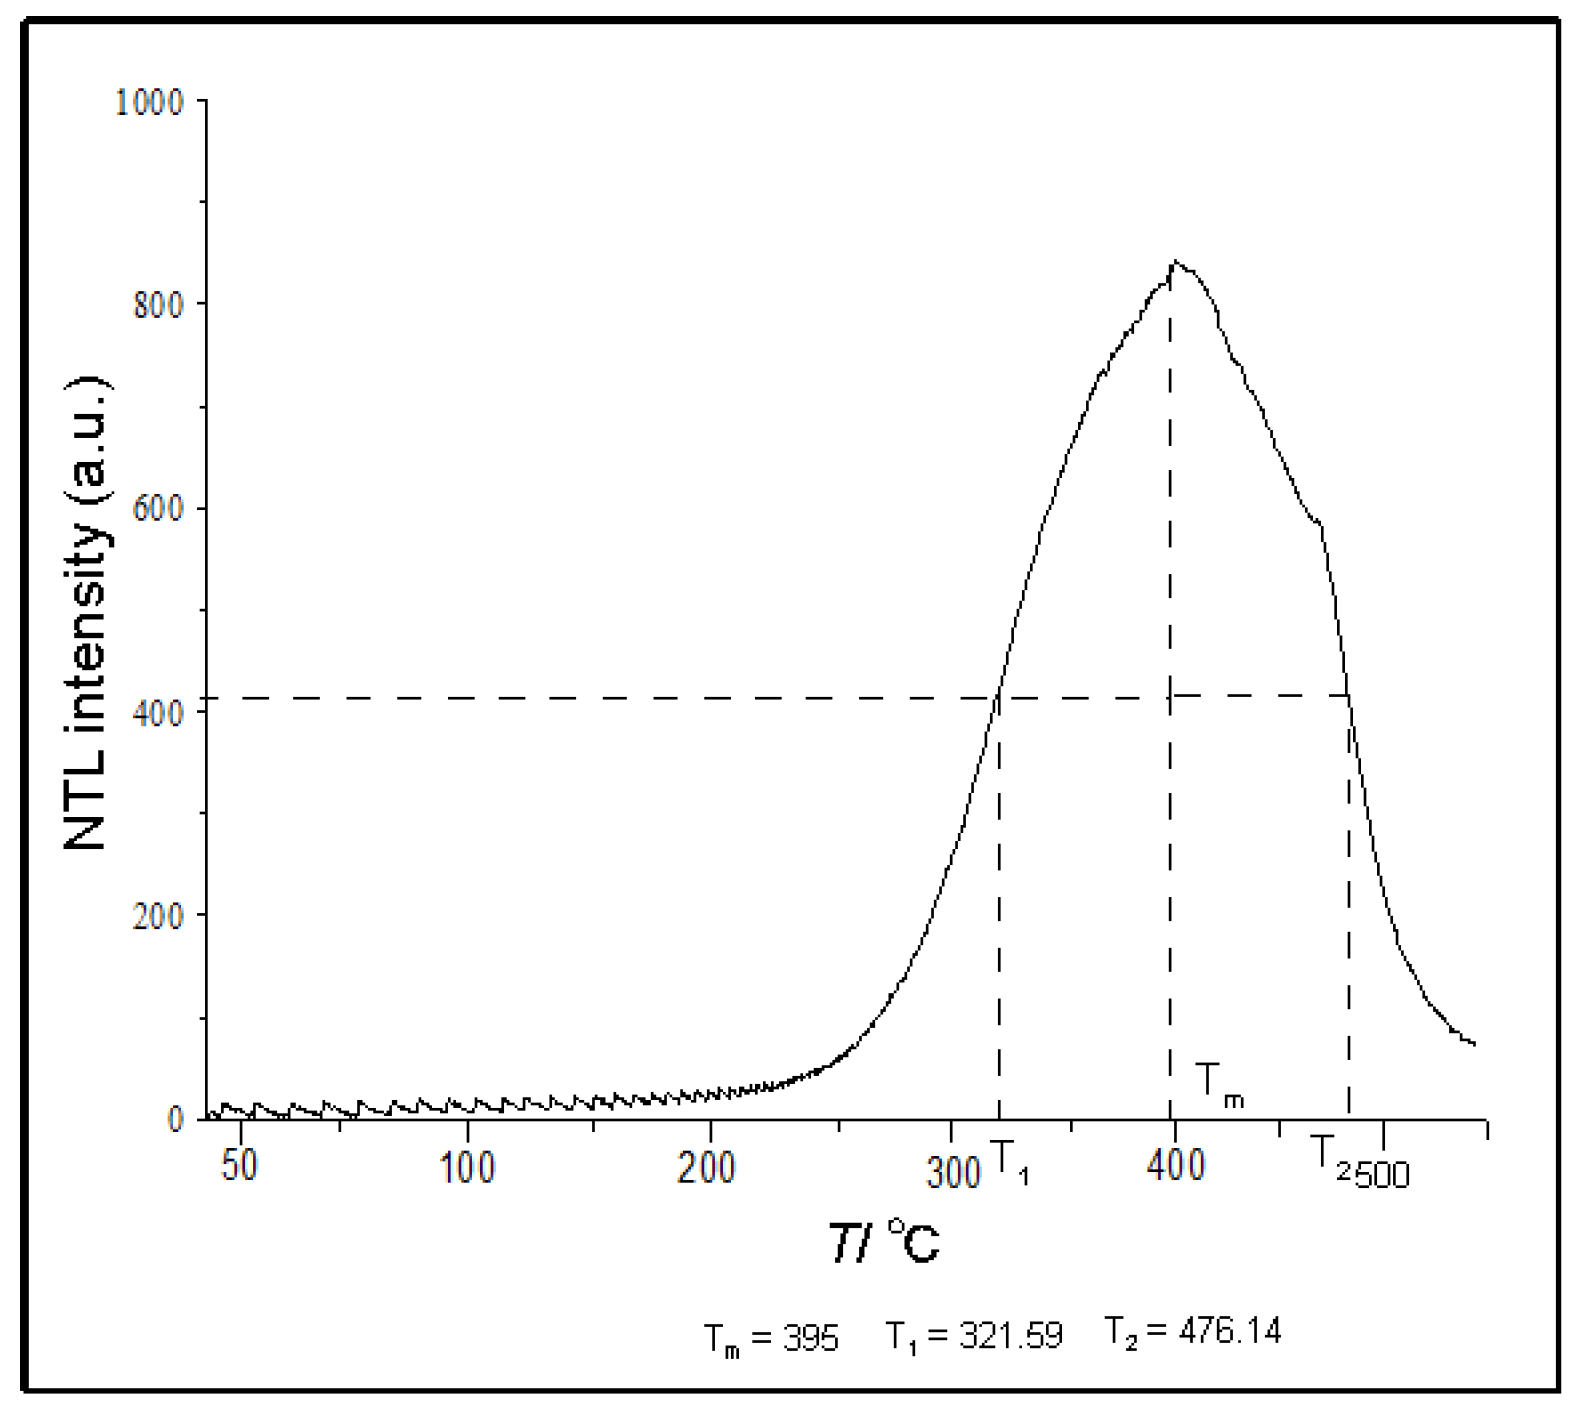
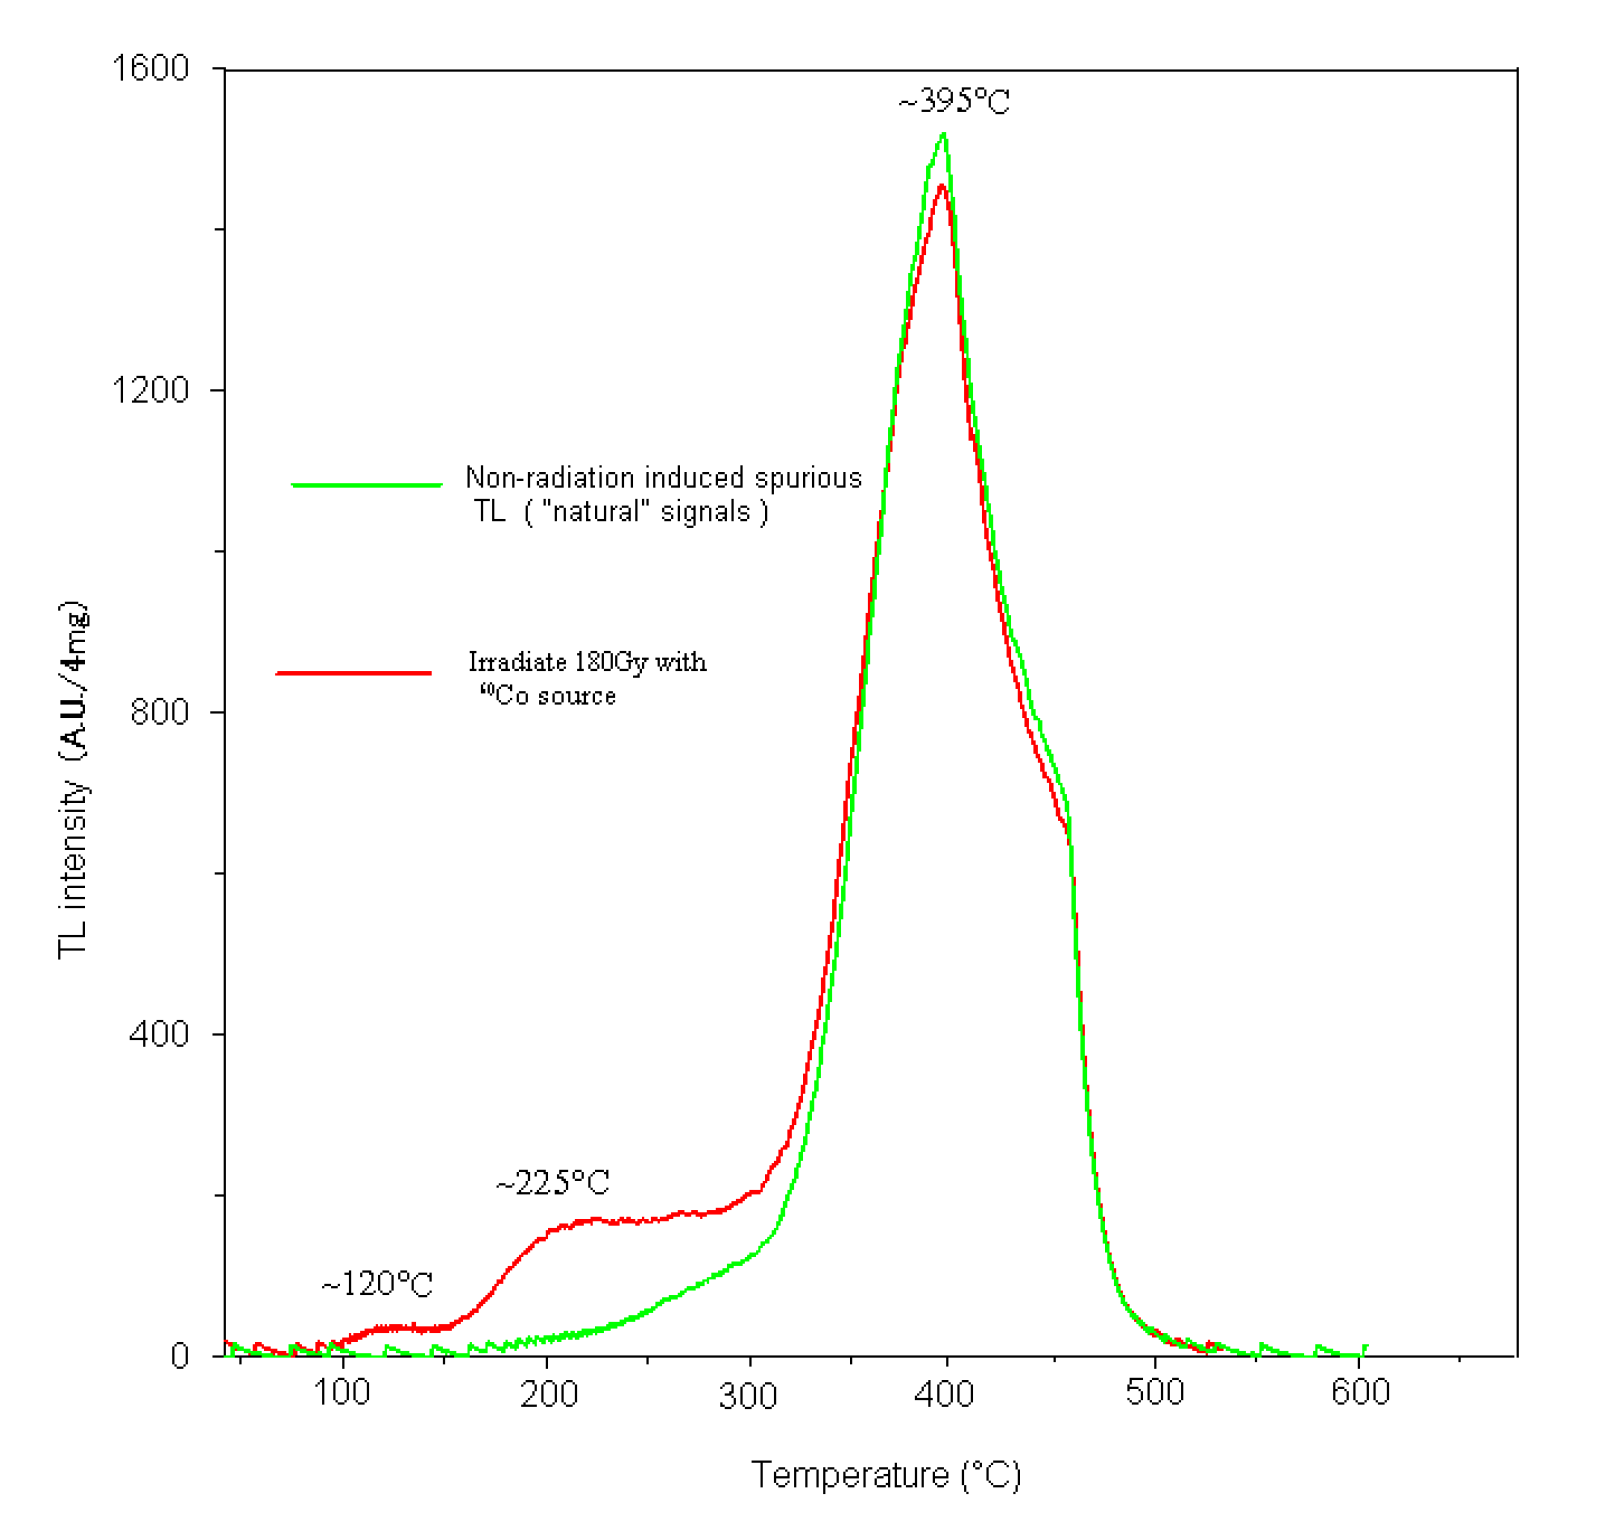
4.3. TL Glow Curve and Thermal Stability of Foraminifer Nannofossil Ooze

The luminescence peak intensity is related to the heating rate. Medlin (1963) [33] found that the TL of marine foraminifers can show a single peak of 227 °C (500 K). Ponnusamy et al. (2006) [34] indicated that the TL of biological shells only shows a TL peak of 330 °C. Research shows that calcite minerals exhibit three main luminescence peaks, and the corresponding peak temperatures are 120 °C, 280 °C, and 350 °C, respectively, when the heating rate is 5 °C/s. Among them, the TL of theh 280 °C luminescence peak has been demonstrated to have great potential for dating [35]. TL signals by heating to a high temperature (i.e., 400–450 °C), which for calcite could generate spurious TL signals [36]. The typical TL peak of planktonic foraminifer of the core MD81349 is shown in Figure 5. Tm, T1, and T2 are the maximum peak temperature and the low-end and high-end temperatures corresponding to the TL glow curve at peak temperature and half-peak height. The heating rate is 6 °C/s, and the TL peak is quite broad at about 395 °C.
The thermal stability of the charge in the TL peak at about 395 °C was not measured in this study. Longer lifetimes are associated with high temperature TL signals, or peaks, and shorter lifetimes are associated with low-temperature TL signals. For example, the high-temperature luminescence peak of feldspar is extremely stable under normal-temperature and low-temperature environments [37,38]. The low-temperature (120–130 °C) TL peak of calcite has a lifetime of several hours, while the 280 °C TL peak corresponds to a lifetime of more than 10 Ma [36,39]. The luminescence peak at 335 °C from calcitic snail opercula has a lifetime of more than 1011 years [20].

4.4. Preservation of TL Signatures

At least two sources are found for the TL of the deposited calcium carbonate minerals: the source of the geological dose and the inherent “defect” sources of the mineral crystallization. The TL signals of geological dose are that after the crystallization of mineral crystals, they are subjected to the external natural radionuclides uranium (U), radium (Ra), thorium (Th), potassium (K), and their decay daughter nuclides. The TL of geological dose has a positive linear relationship with the deposition time and is frequently used as an important method of dating [40]. Furthermore, Castagnoli et al. (1988, 1990) [41,42] indicated that the minerals in the atmospheric dust are energy receivers during periods of strong solar activity and when the solar wind, solar protons, ultra-high-energy ultraviolet rays, and high-energy gamma rays reach the Earth. They store radiant energy, which is also one of the materials of sedimentary cores and the source of radiant energy, and is consistent with the cause of the environmental radiation of TL. Sediments from the Subantarctic Ocean and Cape Basin (South Atlantic), where oxic conditions currently prevail, show high accumulation rates of authigenic Cd and U during glacial intervals. A third core, located south of the Antarctic Polar Front, shows an approximately inverse pattern to the Subantarctic record. The contrasting patterns at the north and south of the Antarctic Polar Front suggest that higher accumulation rates of Cd and U in Subantarctic sediments were driven primarily by increased productivity [43]. From this point of view, the relationship between natural radionuclides and climate change is complex. The U, Th, and their decay daughter nuclides concentration in these biogenic carbonates is not known. We cannot subtract the contribution from the geological dose of radioactive elements contained in the samples. The experiment proves that the spurious TL of calcareous biological ooze is dose independent. The TL measurements were performed after gamma irradiation using a 60Co gamma source with increasing doses (irradiation times of 3600 s, with irradiation dose rates of 50 mGy/s, irradiation dose 180 Gy). Heating was at 6 °C/s in a nitrogen atmosphere (2 L of nitrogen per minute). The main objective of the measurements was to acquire the natural TL intensity of a 395 °C peak, which does not increase with doses of the calcareous biological ooze samples, without the effects of additional laboratory treatments. Calcareous biological ooze is TL carrier minerals. The TL glow curves of calcareous biological ooze that received a 60Co gamma dose of 180 Gy show prominent peaks at temperatures of 120 °C, 225 °C, and 395 °C. The TL intensity of the dosimetric peak located around 395 °C does not increase with irradiation dose (Figure 6). We did not conduct a saturated absorption dose test.
The lattice defects formed during the crystallization of minerals are called inherent “defect” sources. TL from the inherent “defect” of mineral crystallization is called spurious TL [28,30]. Zeller et al. (1957) [44] found that fresh calcite formed by simulated seawater evaporation exhibits TL without any radiation and mechanical action. The generation of TL is related to pressure and the crystallization temperature [45], the number and type of mineral lattice defects, the content and type of impurities, such as Mn2+ substituted for Ca2+ in calcite lattices [8,46], and the temperature and deposition time for calcite mineral formation [47]. As shown in Figure 7a, the TL has a significant positive correlation with the trace elements 135Ba (n = 92, r = 0.318, p < 0.01), and a significant negative correlation with 47Ti (n = 92, r = −0.325, p < 0.01). 135Ba acts as an activator in the TL of marine authigenic calcite, while 47Ti may be an impurity for quenching TL. The 55Mn content of the samples shows a positive relationship with the TL peak intensities (n = 92, r = 0.144). As shown in Figure 7b, Mn2+ is the key ion because the TL emission efficiency and the partition coefficient of Mn are greater for calcite than that of aragonite [7].
Thus, it can be inferred that the spurious TL of 395 °C peak intensities from the marine calcareous biological ooze is dependent on the temperature of formation of minerals. The impurity ions (e.g., Ba2+, Ti2+ and Mn2+) doped in carbonate are acting as activators and suppressants, respectively. From the perspective of the formation and crystallization of minerals, the internal defects that form carbonate mineral crystals will produce certain differences under different temperature environments.

5. Discussion

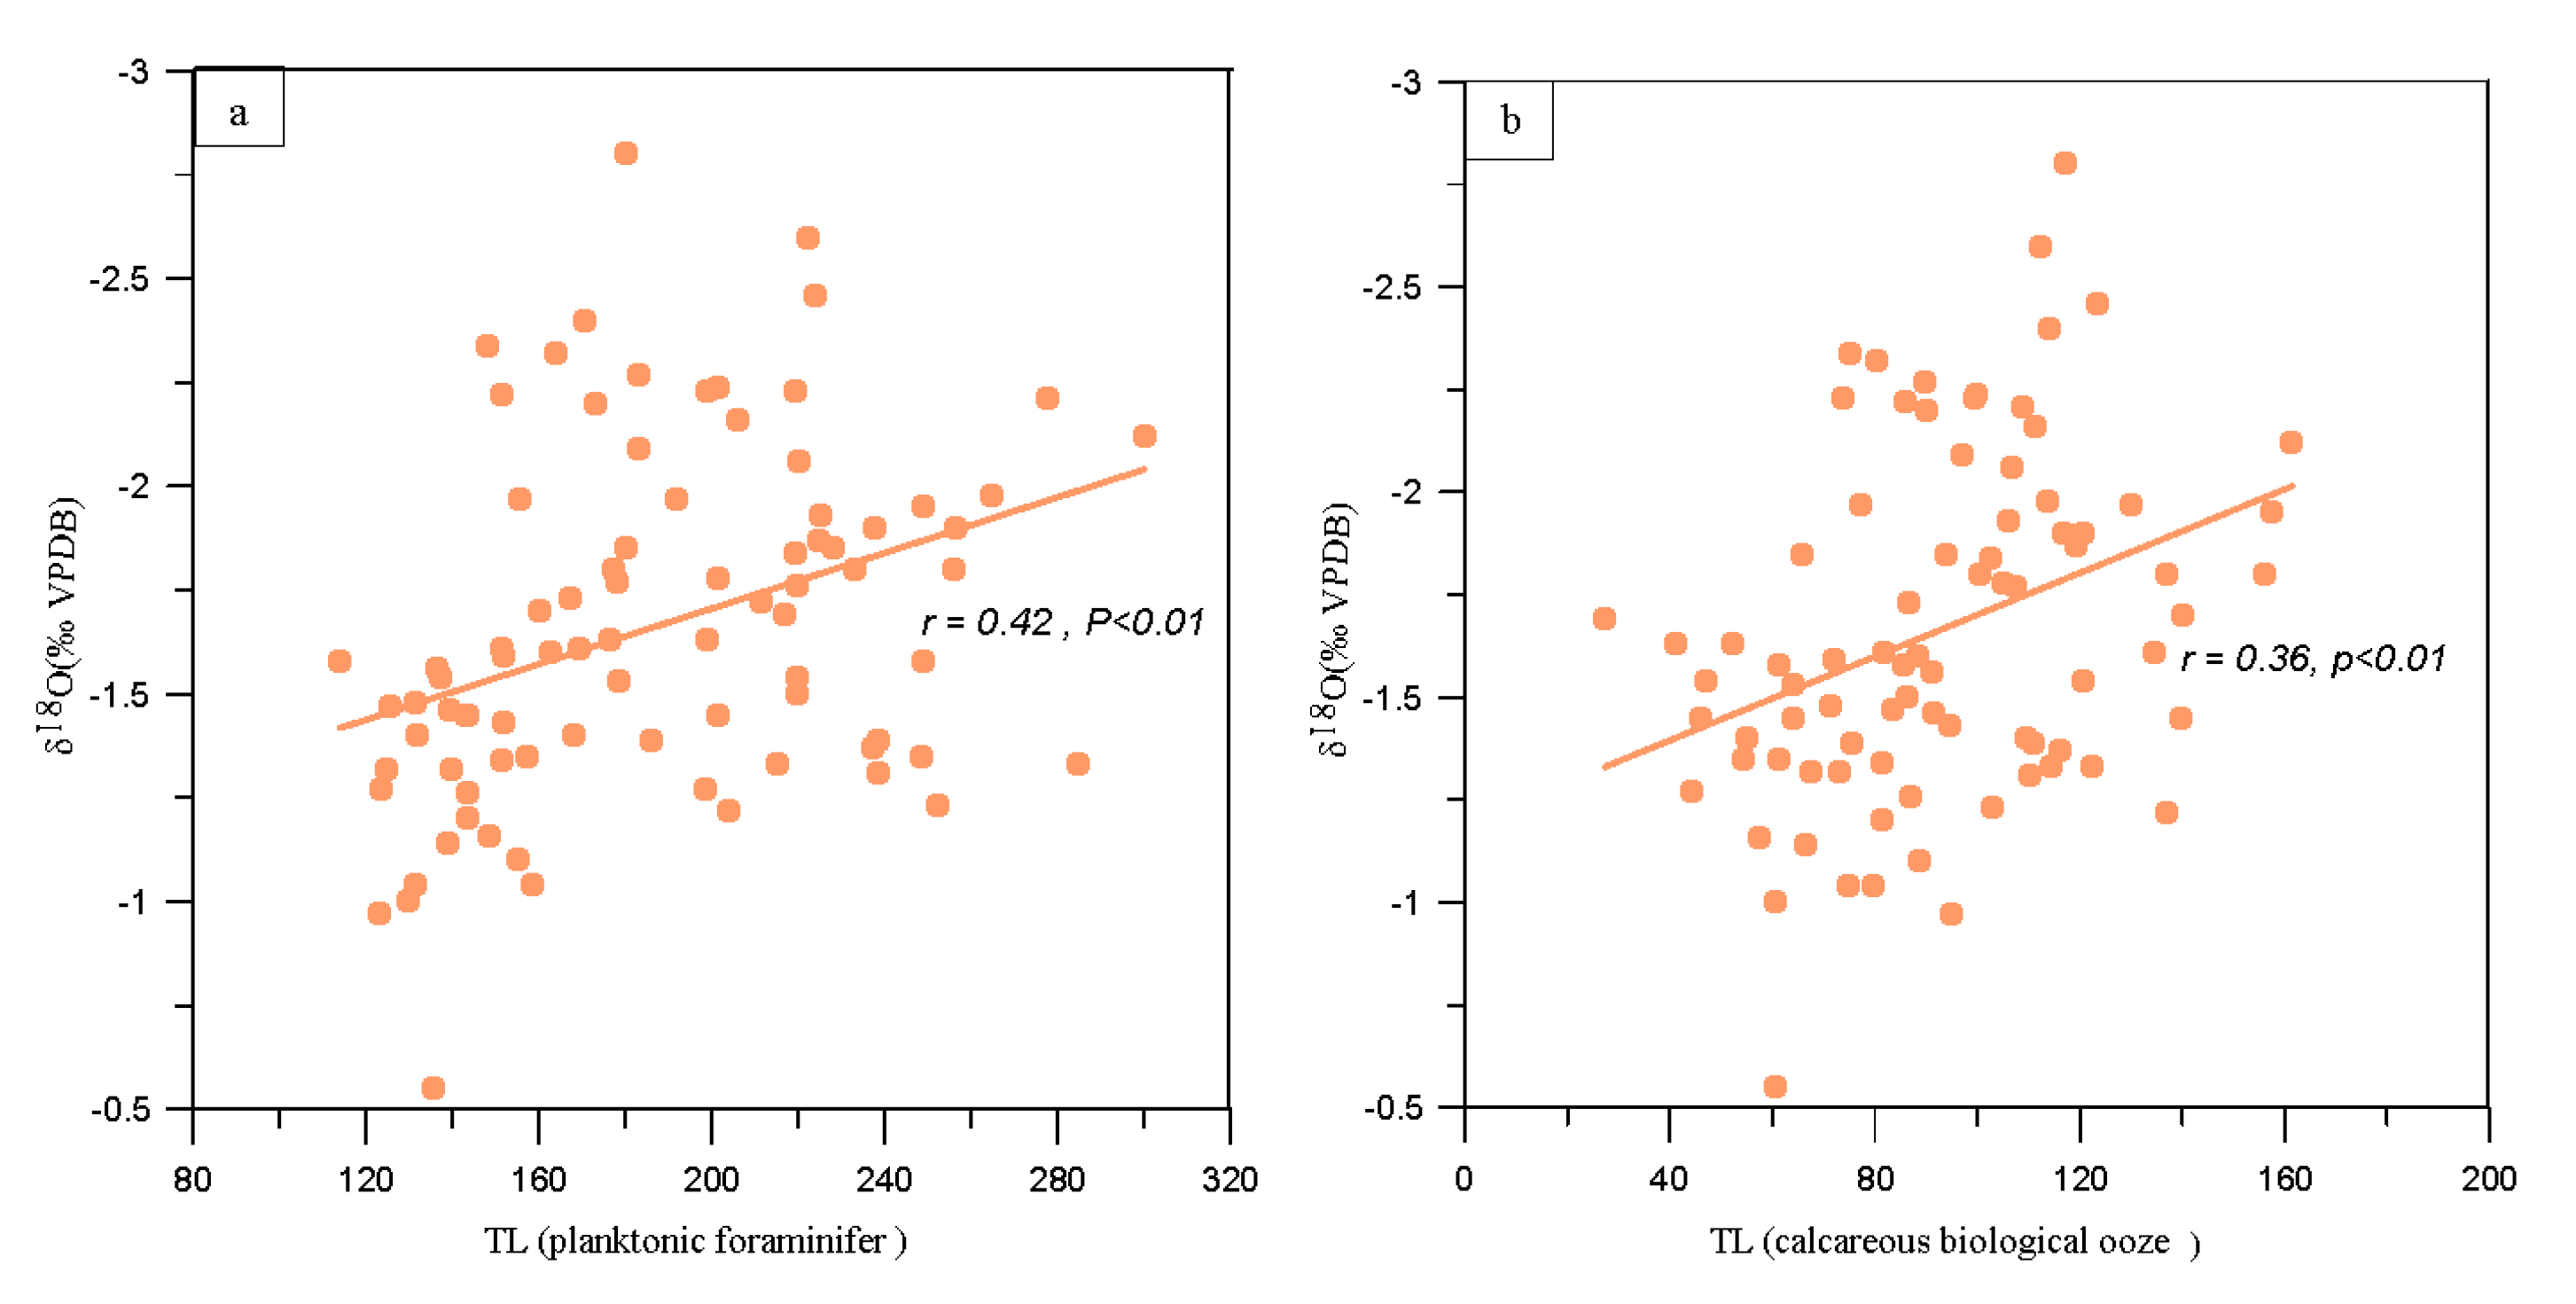
5.1. Relevance between TL and Oxygen Stable Isotope Formation

The seawater oxygen isotope composition is an indicator of sea level rise and fall, reflecting global change in climate and the global ice volume information. The oxygen isotopes of planktonic foraminifera not only contain information on global ice volume, but are also affected by the surface temperature and salinity of seawater, which can reflect regional climate change. Globigerinoides ruber (G. ruber) is a widely distributed species of planktonic foraminifer. In tropical and temperate zones, the Rhizaria population frequently accounts for a large proportion. The suitable temperature for the survival of this species is about 12–30 °C, which is used to reflect the warm water temperature environment. Another important ecological feature is that it only lives at a sea water depth of 50 m for its entire life cycle. The oxygen isotopes of benthic foraminifer can reflect the nature of the bottom water, and the δ18O values in the foraminifer shells from various oceanic regions show a synchronized history of change [32].
Therefore, the paleoclimate cycle reflected by the abyssal oxygen isotope value is an important criterion for high-precision and large-scale stratigraphic division and comparison [48,49]. From the new to old, the stages corresponding to oxygen isotopes are sorted by numbers, and the stages corresponding to the odd numbers 1, 5, and 7 are defined as interglacial stages that represent climate warming. The stages corresponding to the even numbers 2, 4, 6, and 8 are defined as the ice age, indicating that the climate is getting colder [50] (Berger, et al., 2016). Since 300 ka to now, the Earth has experienced eight cold and warm fluctuations with long durations.
Bioclastic carbonate minerals are sensitive carriers of TL [7,51]. Carbonate minerals grow on networks formed by organic polymers [17]. Many biomineralized crystals are made up of inorganic minerals, but they can also contain trace elements of organic compounds that can control the process of biomineralization. The deposition of calcium carbonate from a supersaturated solution caused by the biochemical activities of microbial cells is called microbially induced calcite precipitation (MICP). Organisms may excrete one or more metabolic products (CO32−) that react with ions (Ca2+ in the environment during MICP, leading to subsequent mineral precipitation [52].
Ronca and Zeller (1965) [53] found that a certain functional relationship exists between the TL of sedimentary carbonate rocks and the average monthly maximum temperature in low-latitude regions, and used this relationship to study the climate and temperature changes in the Earth by measuring the TL of sedimentary carbonate rocks. Statistical Product Service Solutions (SPSS 19.0) software correlation and significance tests are performed on TL calcareous biological ooze from the core MD81349 and δ18O, calculated in accordance with a statistical significance level of 99%. From the perspective of the correlation coefficient, the TL of foraminifer fossils extracted from the ooze is best correlated with δ18O, and the correlation coefficient is r = 0.42 (p < 0.01). The two are significantly and positively correlated at the 99% significance level. As is common knowledge, planktonic foraminifers are strongly influenced by environmental conditions at the near-surface sea in which they live, particularly due to their sensitivity to environmental temperatures and salinity [54]. The correlation coefficient between the TL of calcareous biological ooze and δ18O is r = 0.36 (p < 0.01), as shown in Figure 8.

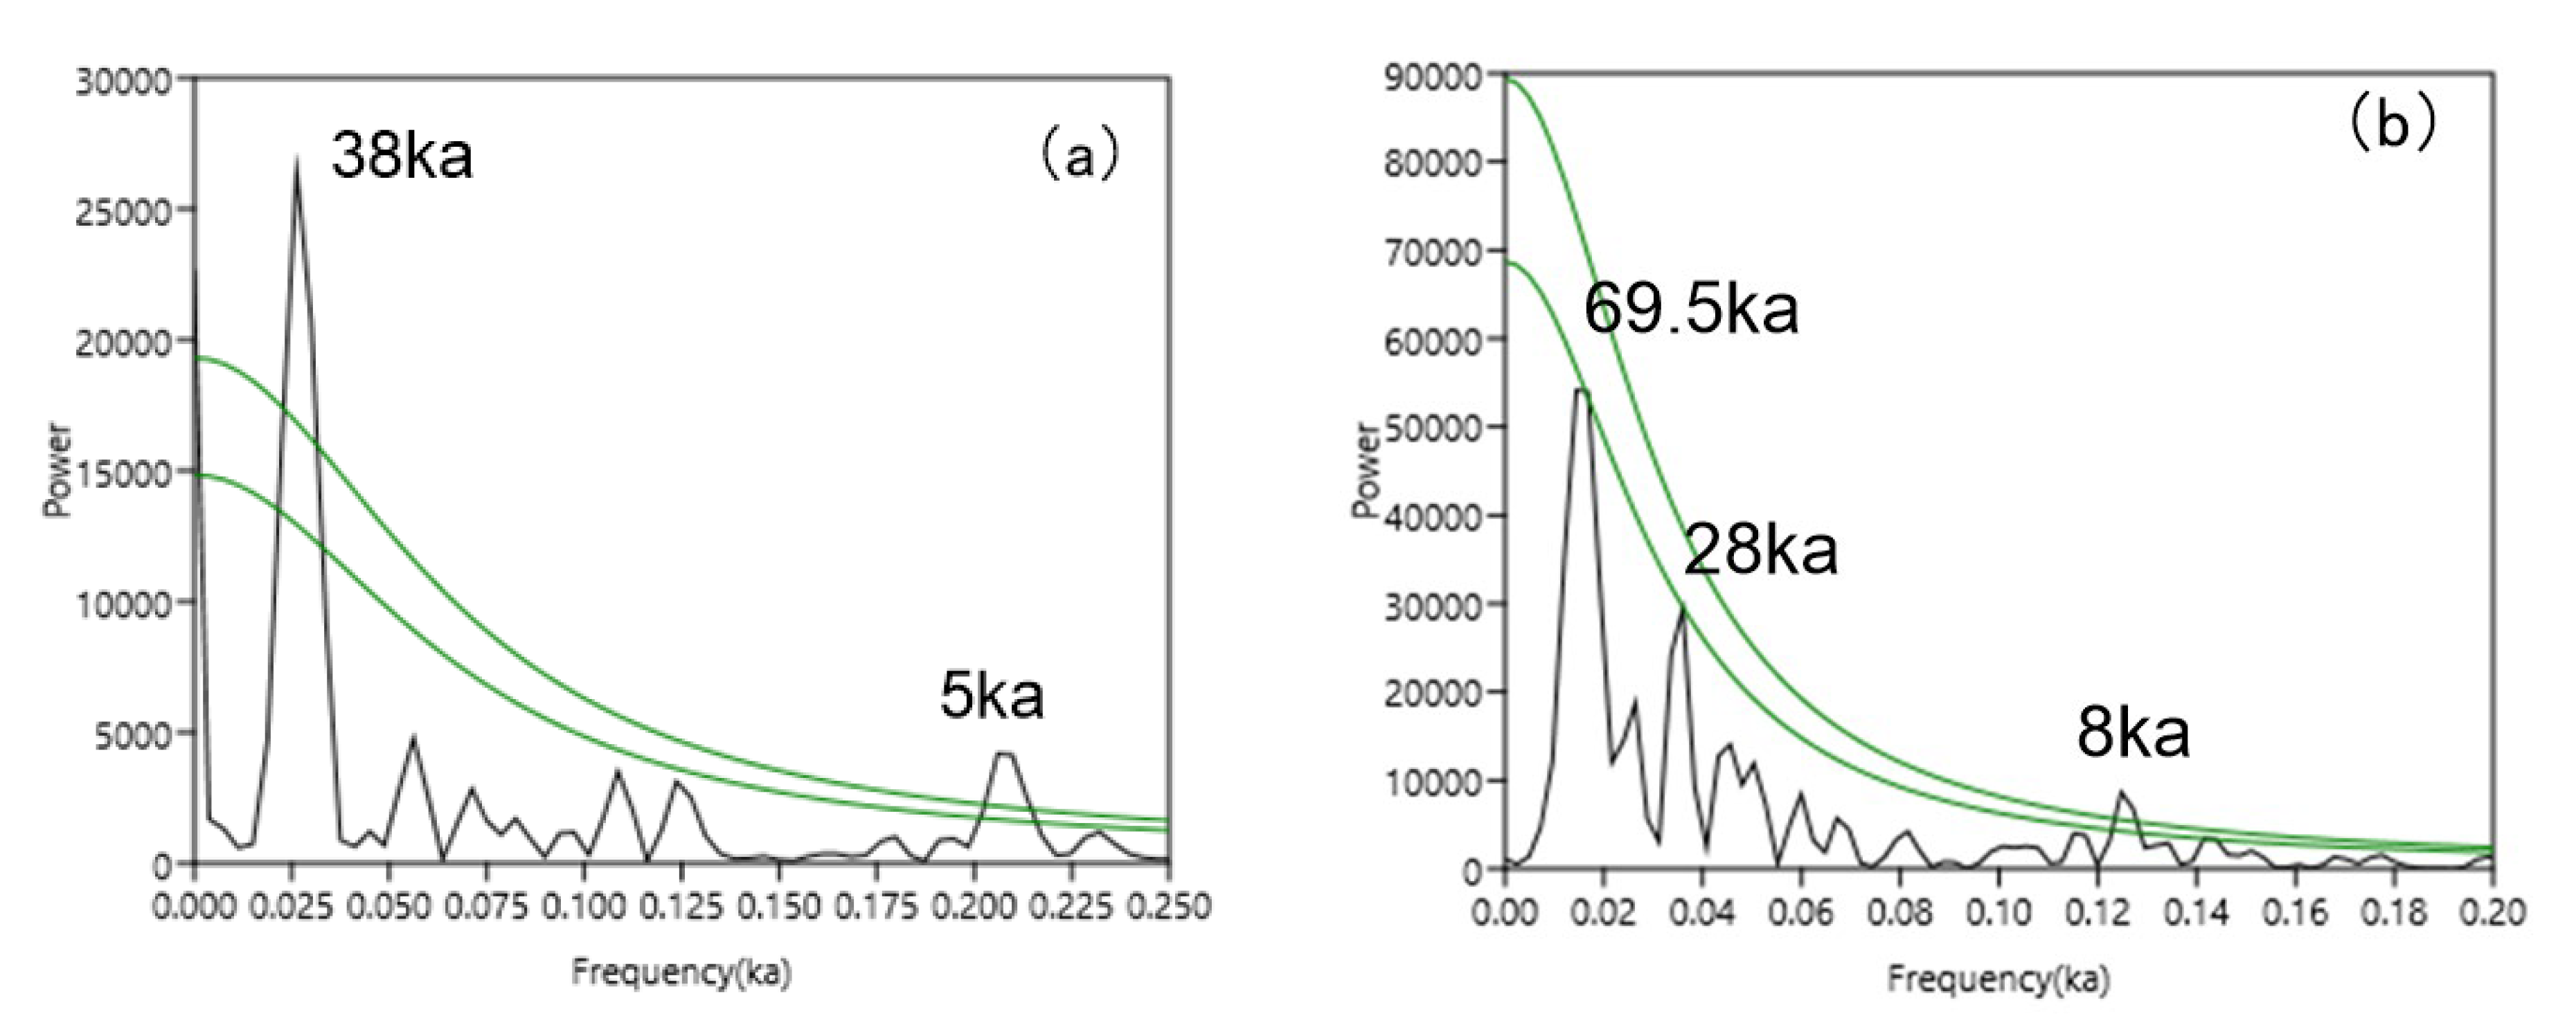
5.2. Periodic Variations of TL Peak Intensities Associated with Orbital Forcing

The changes in global temperature and paleoclimate are mainly controlled by astronomical and tectonic factors, with global simultaneity. The strict regularity of the astronomical cycle enables the paleoclimatic cycle to have a strong temporal regularity because of the effect of the Earth’s orbital cycle. Moreover, the paleoclimate of the Earth periodically changes. The most typical one is the Milankovitch cycle, which includes the period (100 ka) of the Earth’s orbit eccentricity (e), the inclination of the Earth’s axis (yellow intersection angle) (ε) period (54, 41 ka, etc.), and the annual difference in solar radiation (p) period (23, 19 ka, etc.). The analysis of the existence of the Milankovitch cycle in various indicators in marine sediments has become the basis for verifying whether it can reflect the changes in paleoclimate. δ18O, seawater surface temperature, CaCO3 percentage content, and C. davisiana content spectrum analysis results indicate 100, 42, 23, and 19 ka cycles [55]. The frequency spectrum of δ18O, CO2 in the North Atlantic Ocean and Vostok ice core contains 107.5 ka, 41.5, 23.1, and 19.3 ka cycles, indicating that Milankovitch cycles [56,57,58] occur in high latitudes. The frequency spectrum analysis of TL found that it corresponded to the sunspot activity cycle and can be compared with the 10Be, δ18O period comparison of polar ice core, such as the 11-year Schwabe cycle, 22-year Hale cycle, 90-year Gleissberg cycle, and 200-year Suess cycle [40,41,59,60,61,62,63,64].
The TL time series of calcareous biological ooze in the MD81349 core deposited since 296 ka B.P. was analyzed using spectrum analysis software 4.0 [65]. The results of the analysis show the following: at the confidence levels above 90%, the change in TL is prominent in periods that are mainly close to 38 ka and 5 ka, as shown in Figure 9a. The TL cycle of 38 ka and 5 ka is stable and significant.
The age span of the core U1312B over 0–6.6 m is approximately 299 ka. At the confidence levels above 90%, TL spectrum analysis results show periods of 69.5 ka, 28 ka, and 8 ka, as shown in Figure 9b. The 8 ka cycle is stable and significant.

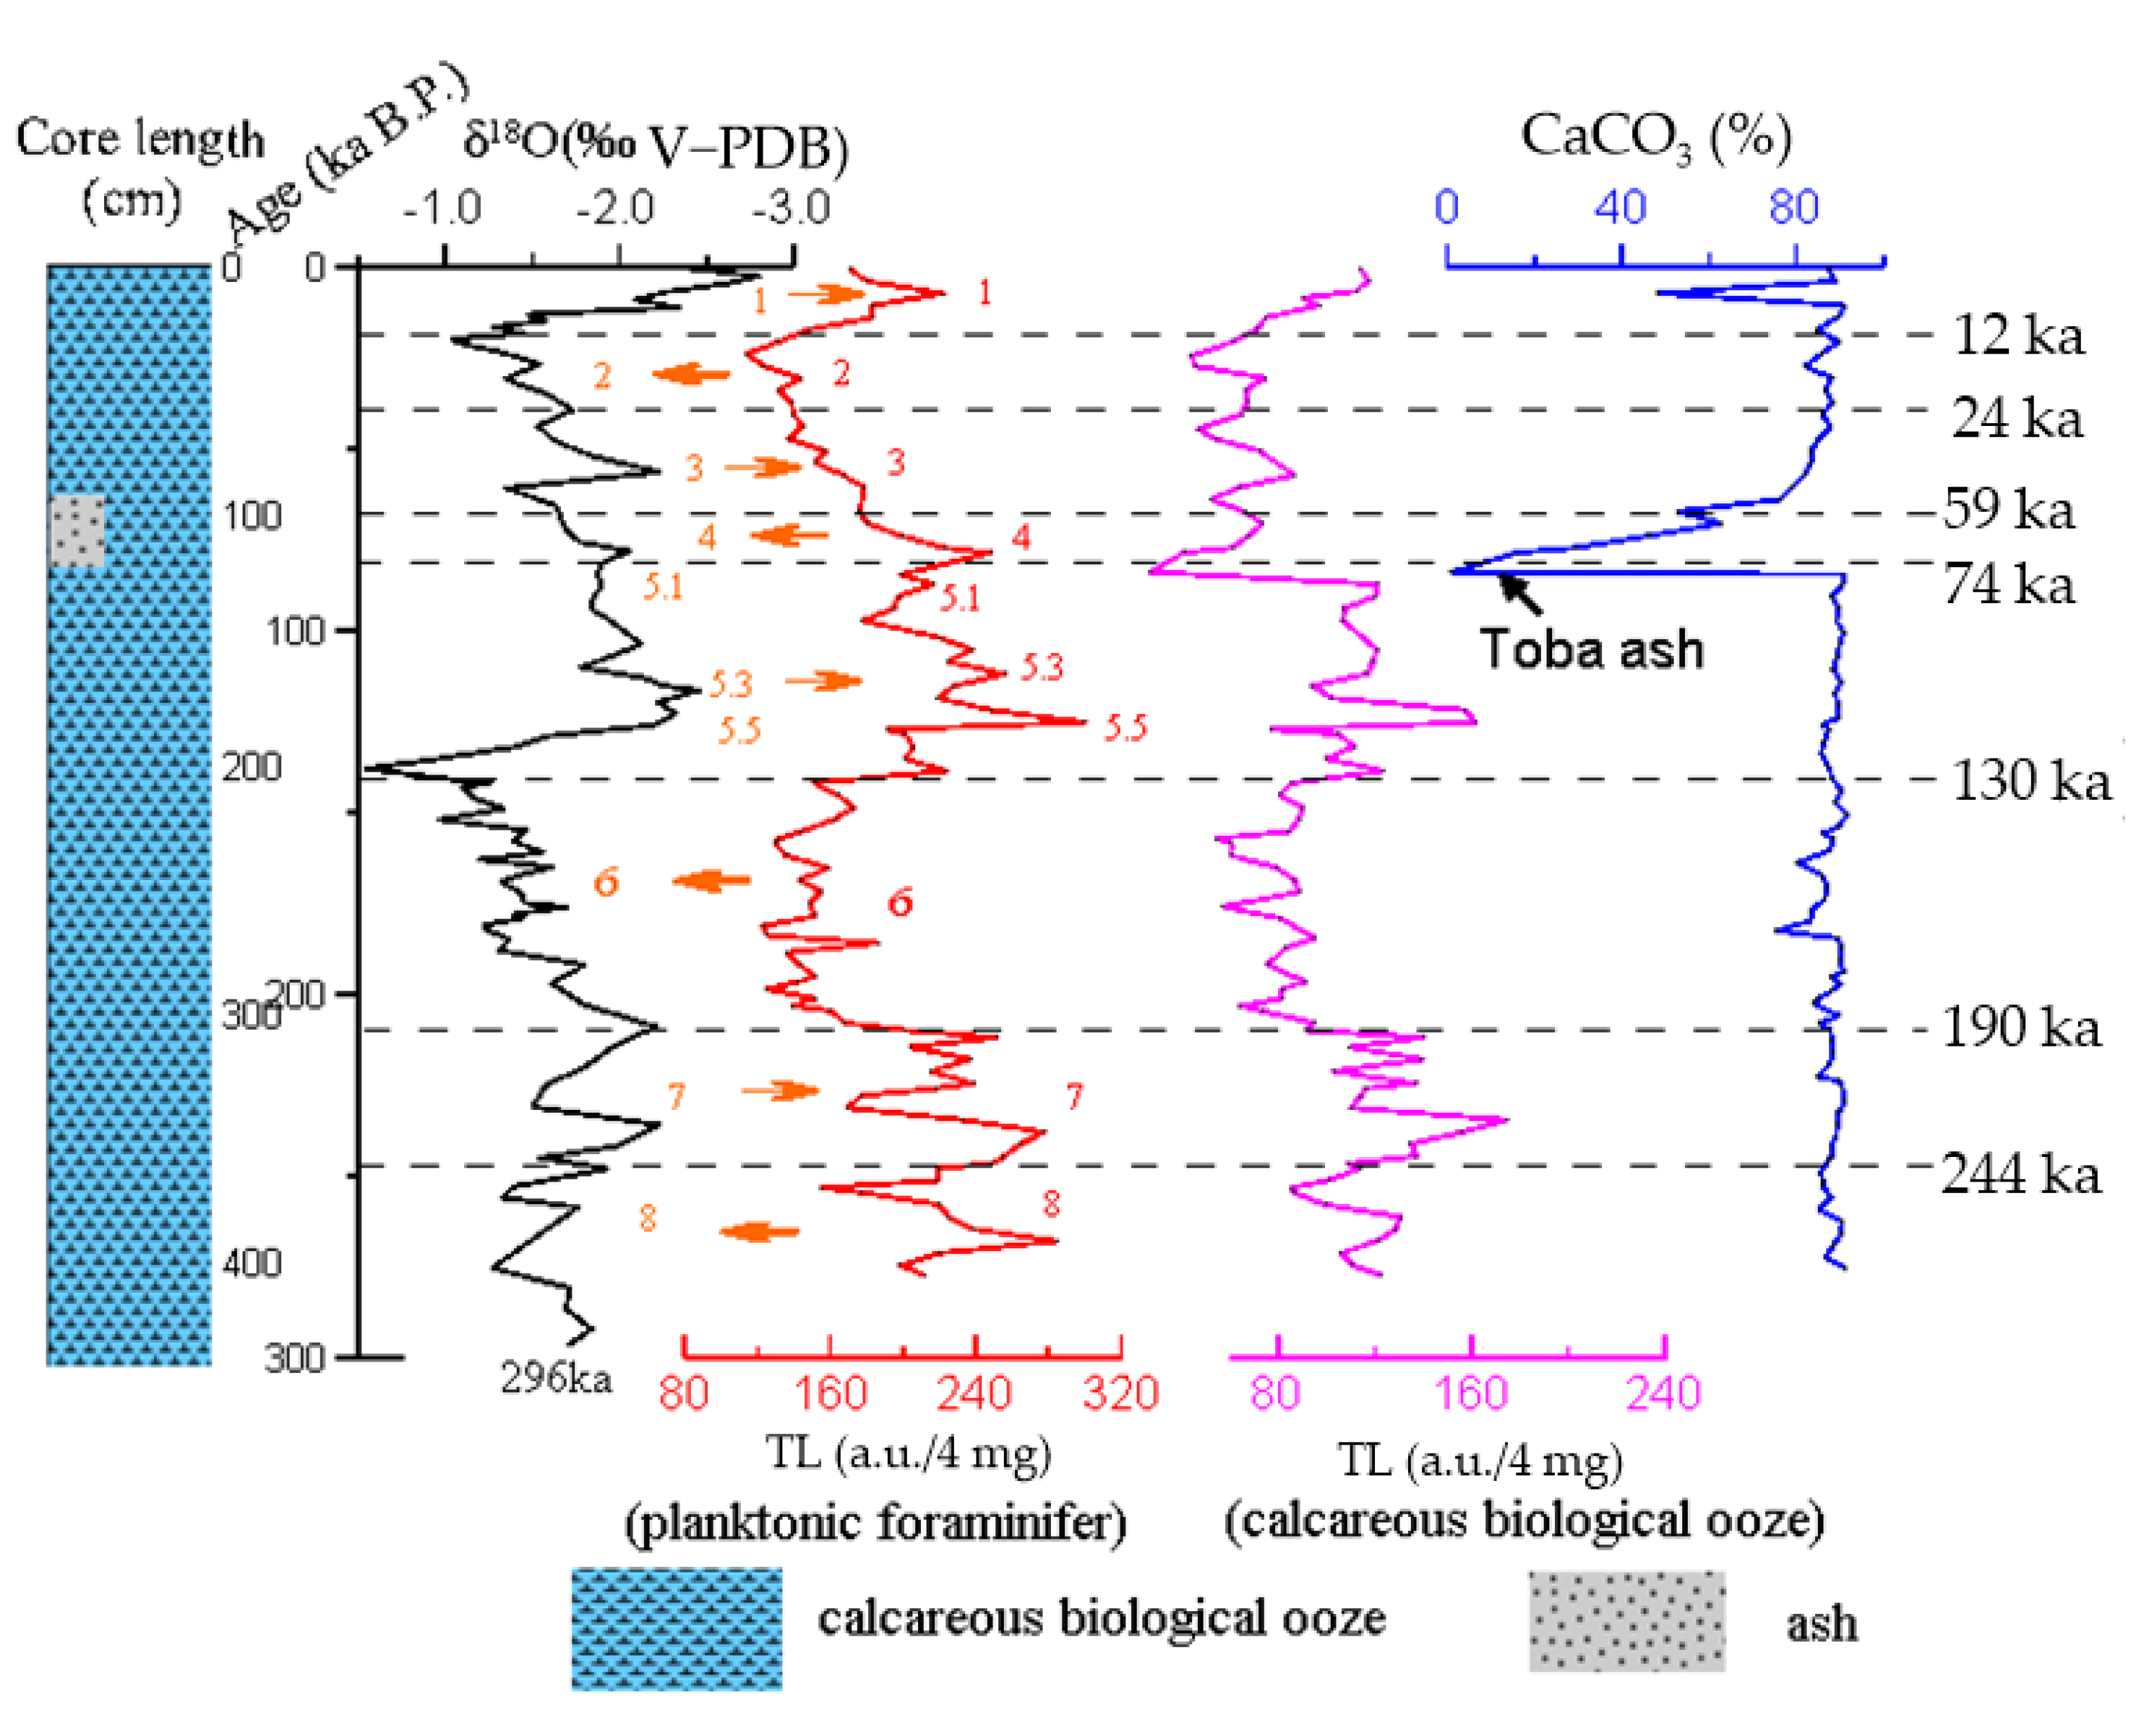
5.3. TL of the Core MD81349 to Paleoclimate Change Response

The δ18O measured in G. ruber is compared with the standard age [32]. It corresponds to an age at approximately 296 ka B.P. The core of 0–4.30 m records the evolutionary history of the ancient marine environment since the mid-Pleistocene and can be divided into MIS 1–8. The core was affected by abrupt tectonic–climatic events, the most notable being the Toba volcanic ash formed around 75 ka [66] when evident volcanic ash deposits were formed. Thus, the core was mixed with many silicate clay components. The geological history represents the sedimentary environment from the mid-late Pleistocene to the Holocene. The measured TL data are plotted as a curve with depth and compared with the δ18O time curve, as shown in Figure 10. Comparative findings show that the fluctuations of the TL profile show a significant corresponding relationship with the fluctuations of the oxygen isotope. The range of the increase in TL corresponds to MIS 1, 5 and 7. The paleoclimate shows the characteristics of the interglacial period. The reduction range of TL corresponds to MIS 2, 4, 6 and 8, showing the characteristics of the glacier. The TL profile is particularly significant in the fifth period of climate change, which can be divided into 5.1, 5.3 and 5.5 subcycles. In addition, there is a temporal delay which needs further discussion between the beginning of the interglacial MIS 5e and the TL maximum labeled 5.5. Throughout the entire profile, the TL profile can be divided into 1–8 and several sub-stages from the newest to the oldest in the sequence of stratigraphic deposition. The only exception is that the early oxygen isotope in the fourth period is affected by the composition of volcanic ash (Toba ash), and the TL value of calcareous biological ooze suddenly decreases, indicating that the volcanic ash experienced high temperatures and the residual TL is low. The TL of foraminifera shells was slightly affected by the volcanic eruption. From the profile of CaCO3, the volcanic ash deposited from the Toba volcanic eruption at 75 ka shows a clear manifestation that the global climate rapidly cooled during this period.

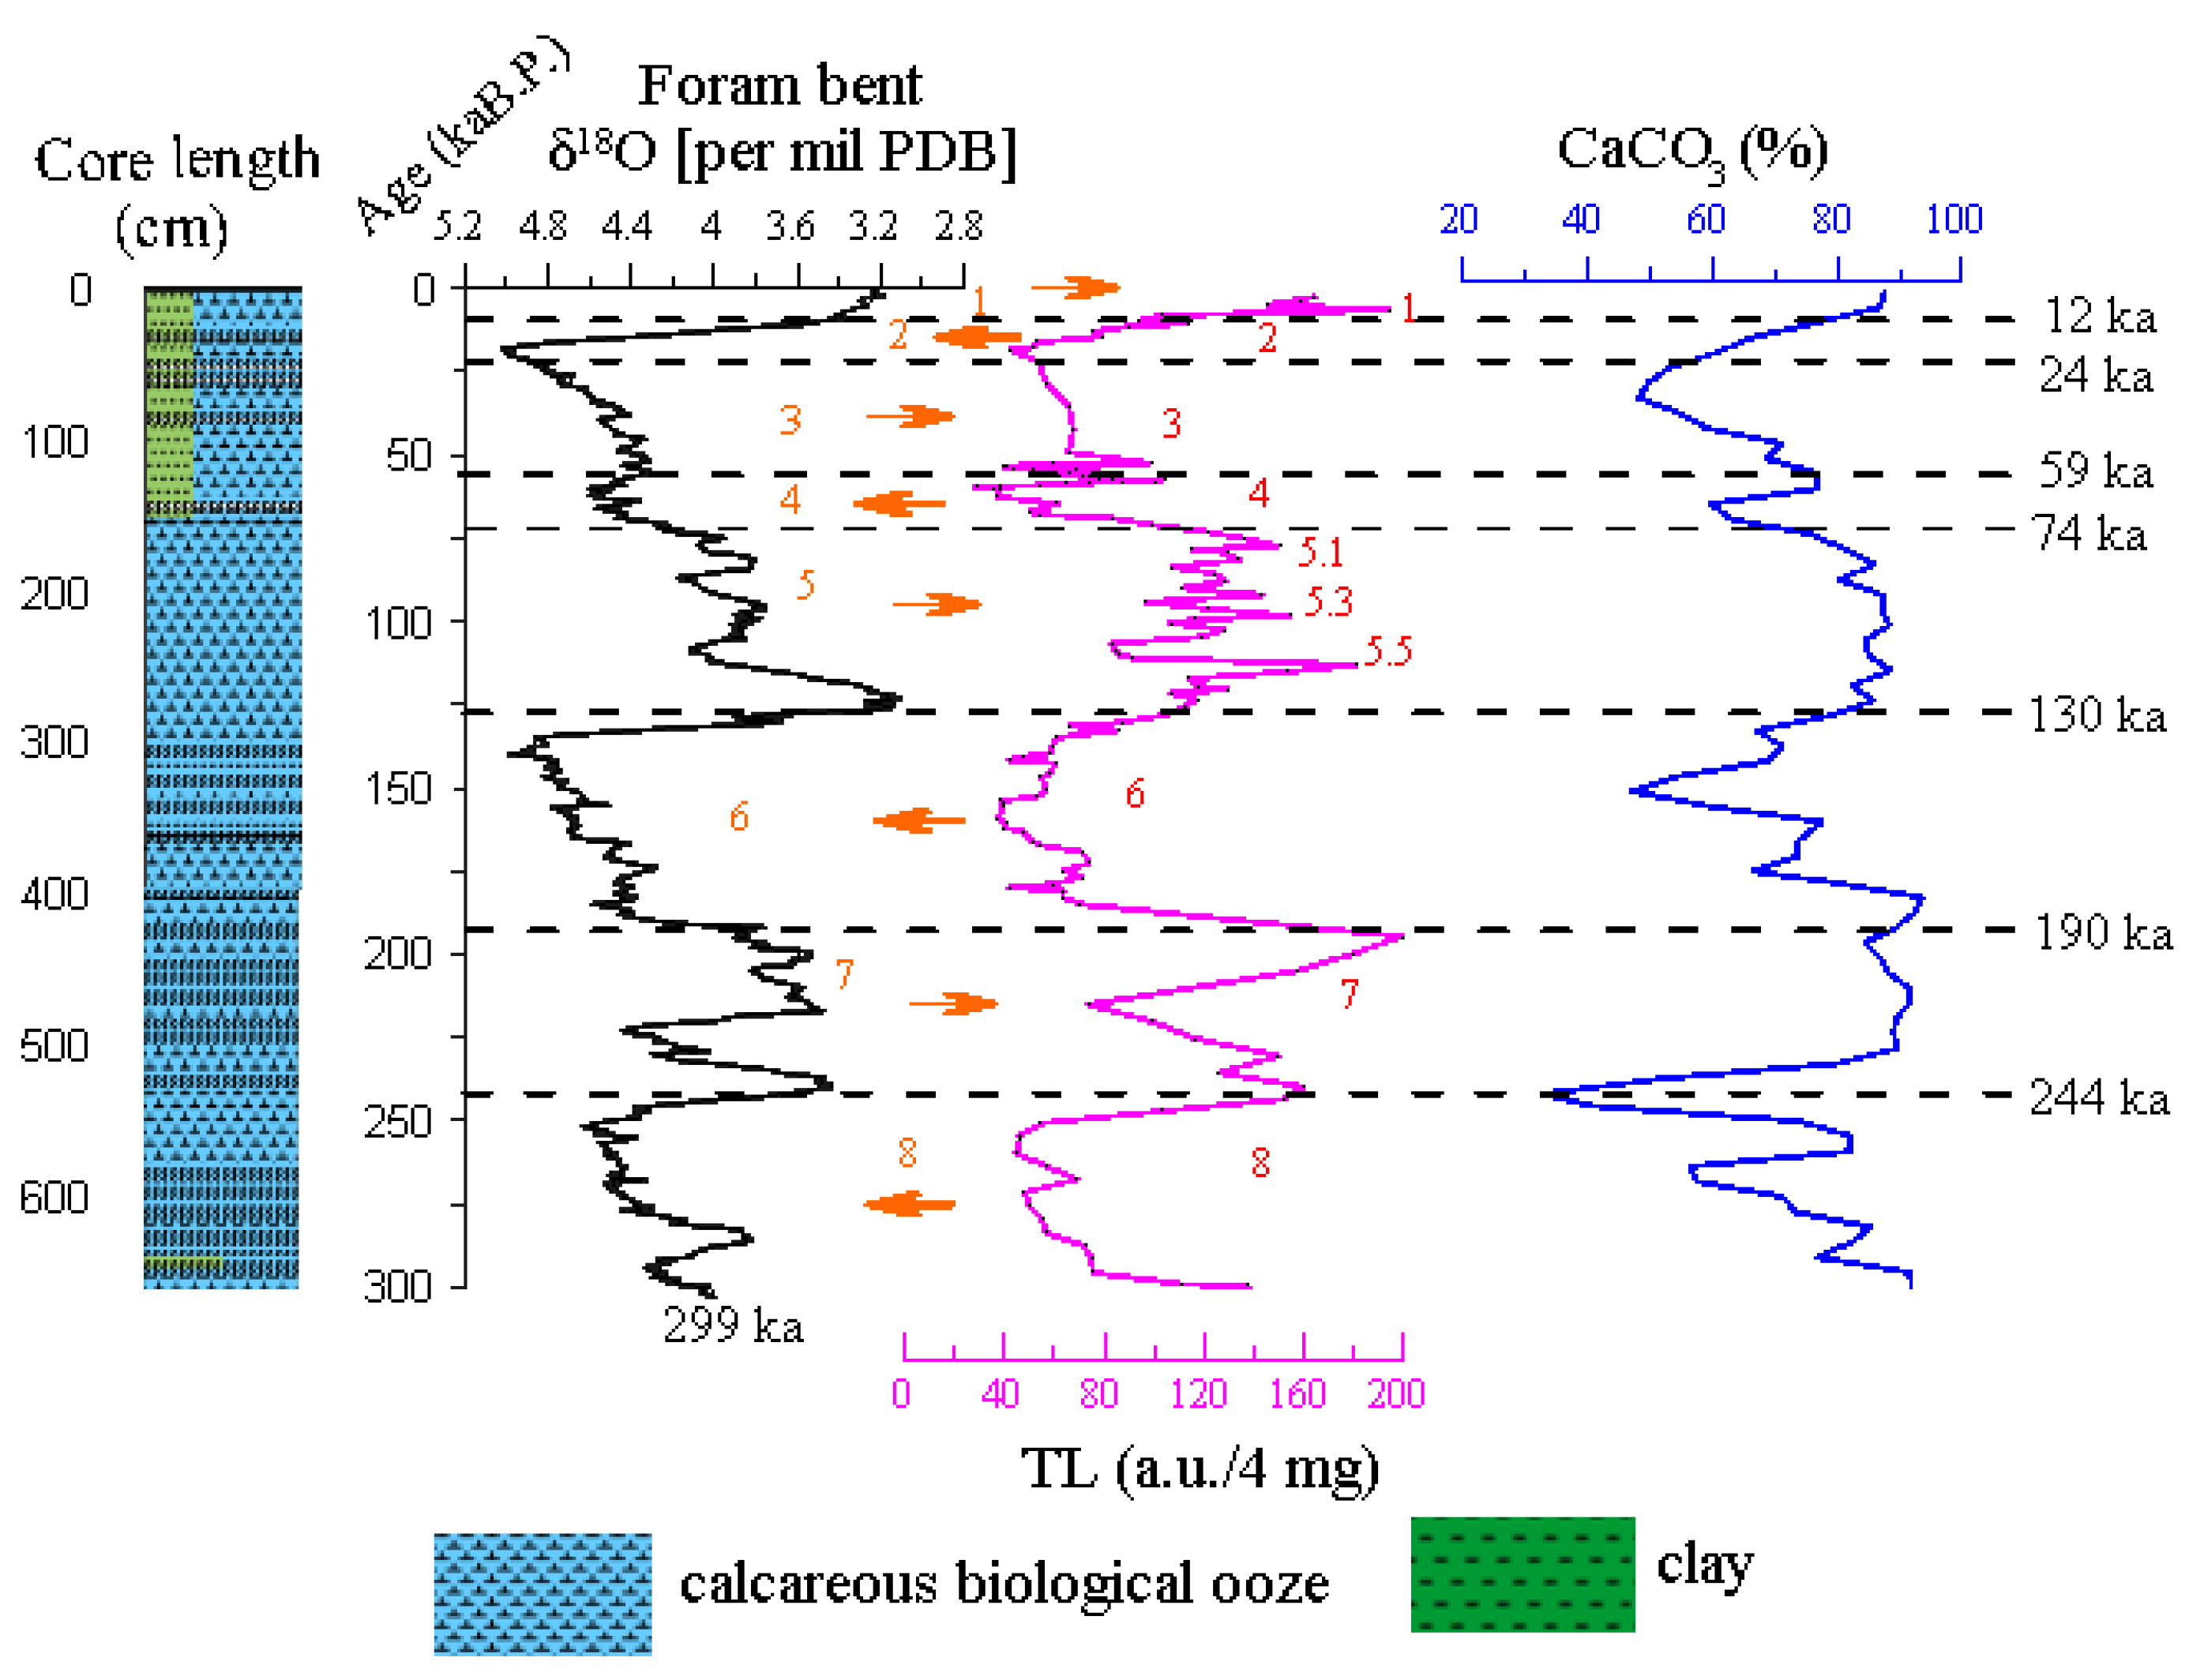
5.4. TL of the Core U1312B to Paleoclimate Change Response

The North Atlantic ice-rafted detritus belt (“IRD belt”) [25,26] is another hotspot for research. The age of the oxygen isotope in the 0–6.6 m section is approximately 299 ka B.P. The core U1312B deposition sequence at station 1312 of the comprehensive ocean drilling IODP306 voyage represents the past 11 Ma depositions. The climate change on the millennium scale and the million-year scale and the interaction between air and sea under various boundary conditions can be studied. The core of 0–6.6 m is selected for TL analysis in this research and the corresponding ages in MIS1–8 stages are divided, representing the sedimentary environment from the mid-late Pleistocene to the Holocene. A sample at 4 cm spacing is chosen for TL measurement, as shown in Figure 11. The characteristics of TL profile in core U1312B are similar to those in the core MD81349, showing that the high-value area corresponds to the oxygen isotope stages MIS1, 5 and 7 and reflecting the interglacial characteristics of the glacier cycle. The low-temperature TL region corresponds to the MIS 2, 4, 6 and 8 stages of oxygen isotopes, reflecting the ice age characteristics of the glacier cycle. The TL profile is particularly significant in the fifth period of climate change, which can be divided into 5.1, 5.3, and 5.5 sub-cycles. Similar to the core MD81349, there is a temporal delay between the start of the inter ice MIS 5e and the TL maximum labeled 5.5 which could be related to IRD deposition during the deglaciation. This TL profile is significantly consistent with MD81349 near the northeast Indian Ocean equator, reflecting that TL has similar changes in different latitudes, revealing the characteristics of universal regularity. It contains a small amount of clay at 0–2.5 m and exerts minimal effect on TL.

6. Conclusions

  • The TL age profile of calcareous biological ooze reveals eight subglacial cycles and cyclical climate changes since 299 ka B.P. The interglacial period corresponds to enhanced TL. The ice age corresponds to a reduction in TL. The TL of the glacial–interglacial cycle can be compared remotely.
  • The analysis results of the TL spectrum show a relationship with the changes in the Earth’s orbital parameters and the corresponding astronomical cycle. Near the equator of the northeast Indian Ocean, it is more significant than the short cycle of 38 ka and 5 ka, while it is more significant than the cycle of 8 ka in the North Atlantic since the middle Pleistocene.
  • TL fluctuations have provided us with a relationship between thermoluminescence and the temperature of the formation of calcareous biological ooze.
  • Calcareous biological ooze contains TL carrier minerals. The spurious TL intensity of the 395 °C peak from the marine calcareous biological ooze is dose independent, regardless of the irradiation dose.
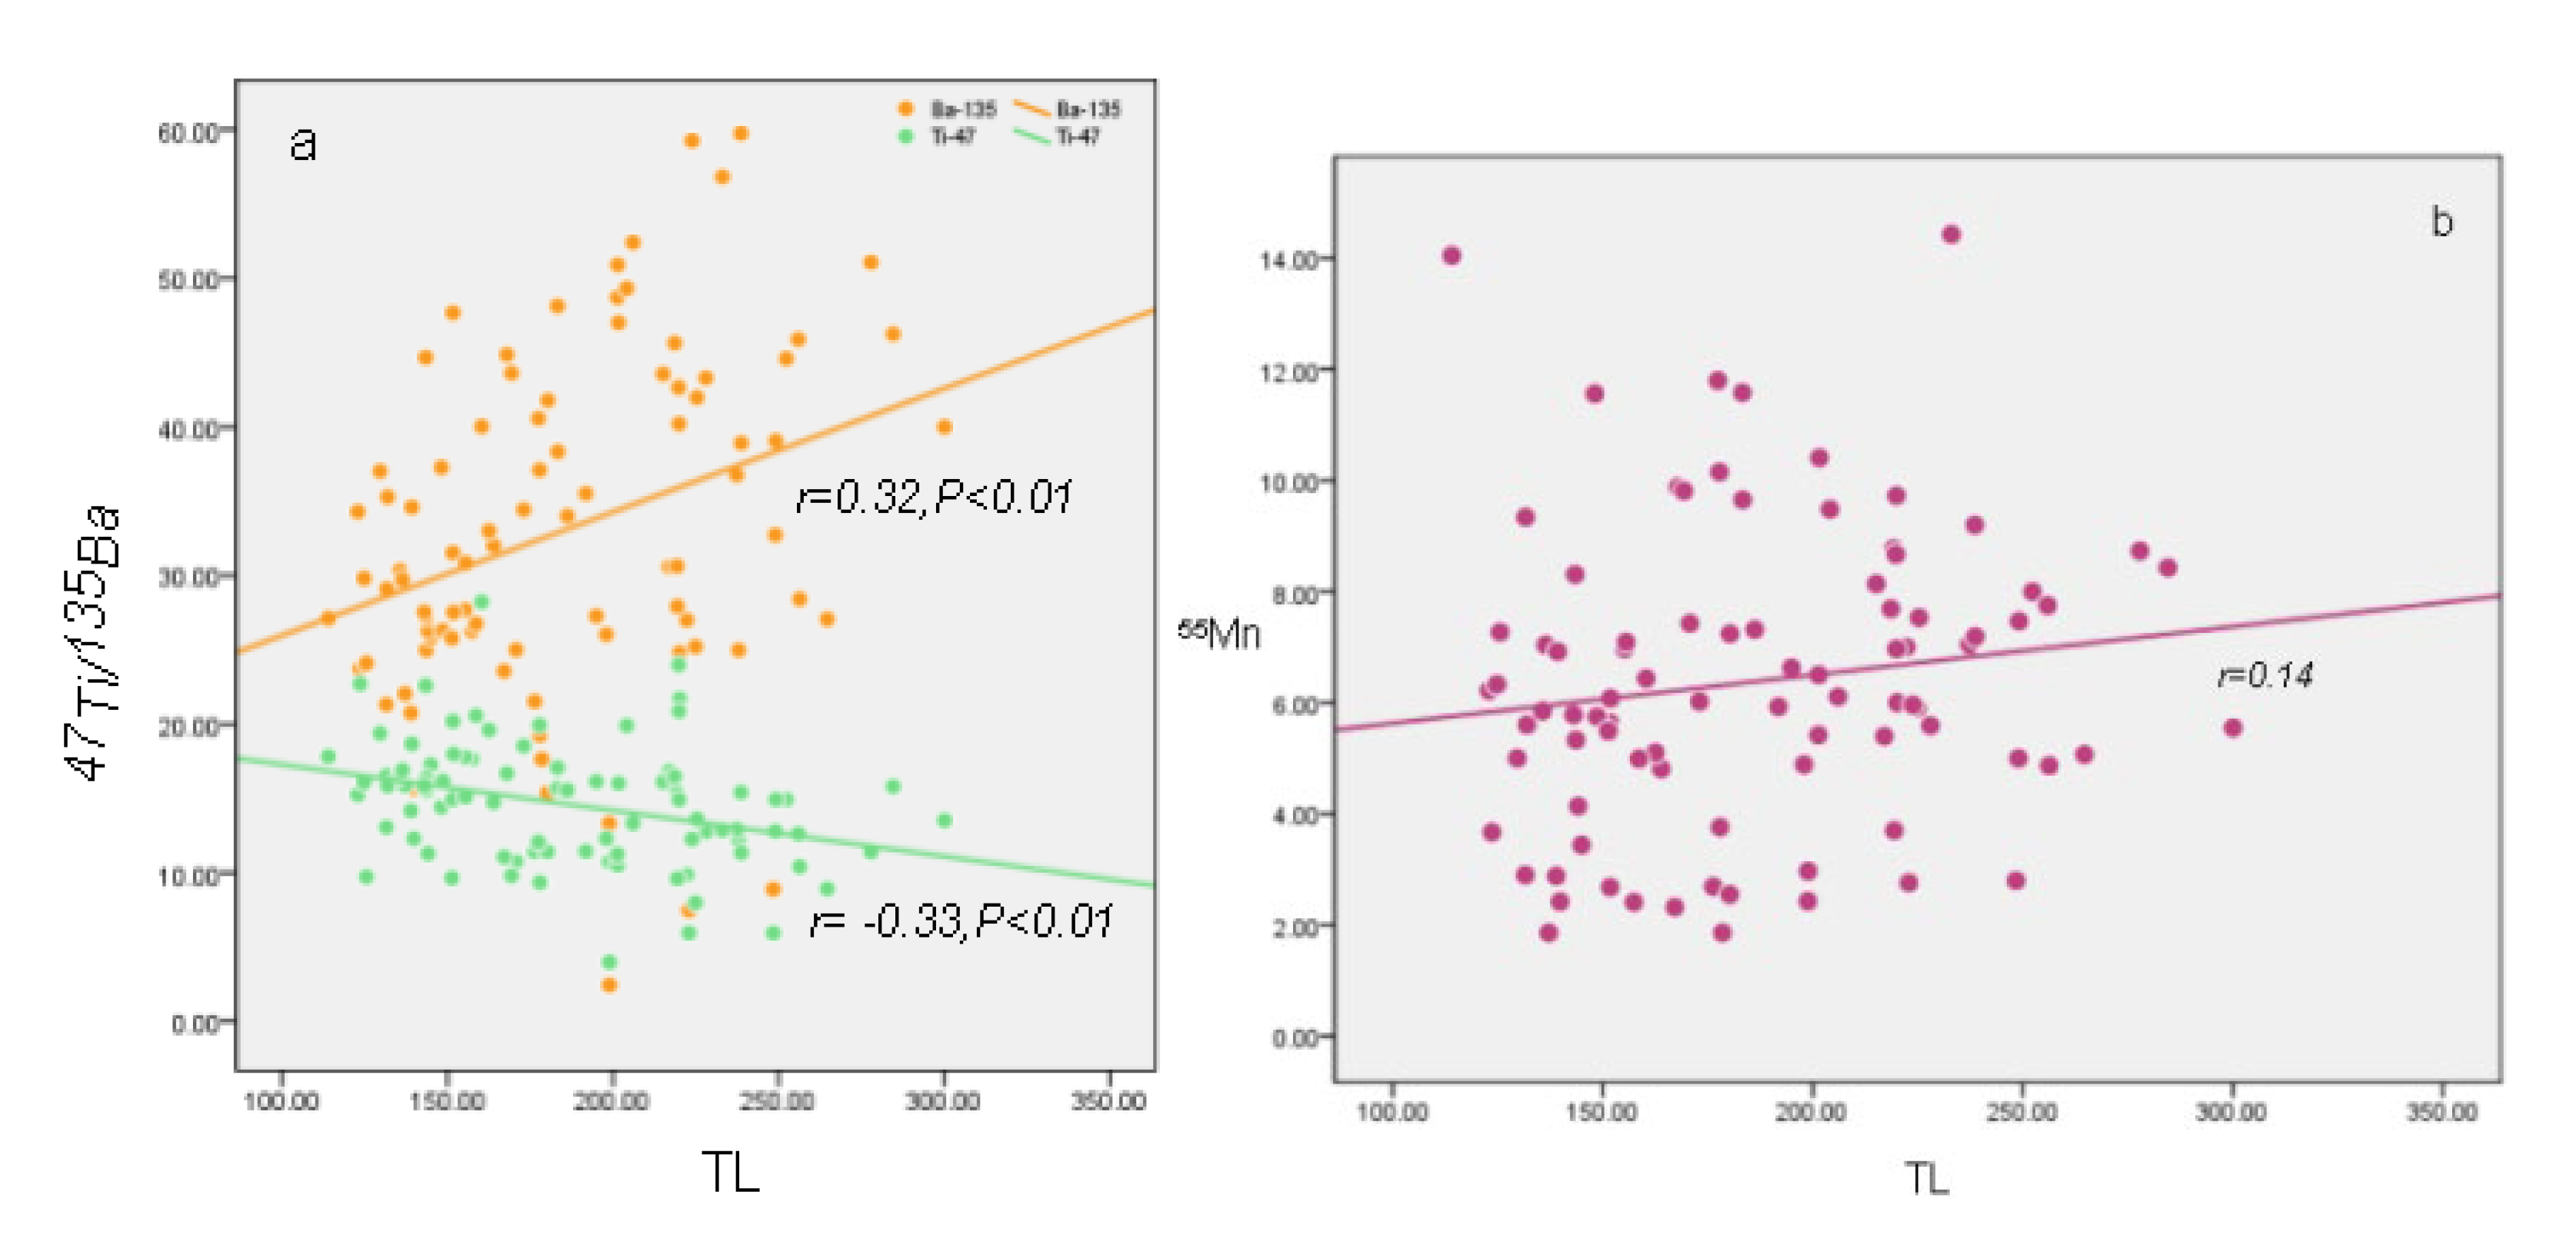
  • The impurity ions (e.g., Ba2+ and Mn2+) doped in carbonate act as activators of TL, while Ti2+ acts as a suppressant.

Supplementary Materials

The following supporting information can be downloaded at: https://www.mdpi.com/article/10.3390/w15142618/s1.

Author Contributions

Methodology, P.Z., H.L., S.H. and N.W.; Formal analysis, P.Z., N.W. and N.F.; Investigation, H.L.; Resources, S.H. and N.F.; Data curation, P.Z.; Writing—original draft, H.L. All authors have read and agreed to the published version of the manuscript.

Funding

This study was supported by the National Natural Science Fund (No. 10875067 and 40306017).

Data Availability Statement

Supplementary data to this article can be found in Supplementary Materials.

Acknowledgments

The samples were provided by the School of Ocean in China University of Geosciences (Beijing). TL analysis was immensely supported by the Radiation and Environmental Laboratory in China University of Geosciences (Beijing). Graduate student Bo Li completed the thermoluminescence measurement of U1312B core samples.

Conflicts of Interest

The authors declare that they have no conflicts of interest.

References

  1. Huntley, D.J.; Johnson, H.P. Thermoluminescence as a potential means of dating siliceous ocean sediments. Can. J. Earth Sci. 1976, 13, 593–596. [Google Scholar] [CrossRef]
  2. Wintle, A.G.; Huntley, D.J. Thermoluminescence dating of a deep-sea sediment core. Nature 1979, 279, 710–712. [Google Scholar] [CrossRef]
  3. Wintle, A.G.; Huntley, D.J. Thermoluminescence dating of ocean sediments. Can. J. Earth Sci. 1980, 17, 348–360. [Google Scholar] [CrossRef]
  4. Yassin, A.; Abdel, R. Thermoluminescence dosimetry using natural calcite. J. Taibah Univ. Sci. 2016, 10, 286–295. [Google Scholar]
  5. Chen, G.F.; Hu, C.Y.; Li, N.; Yi, Z.H. Thermoluminescence in response to the mass extinction event in Penglaitan Section in Laibin, Guangxi. Sci. China Earth Sci. 2013, 56, 1350–1356. [Google Scholar] [CrossRef]
  6. Joseph, J.T.; Merlin, L.M.; Eduardo, G.Y.; Adam, C.C. Thermoluminescent microparticle thermal history sensors. Microsyst. Nanoeng. 2016, 2, 16037. [Google Scholar] [CrossRef] [Green Version]
  7. Noriyuki, T.; Atsushi, S.; Hiroshi, I.; Katsuyuki, H.; Takayuki, H. Thermoluminescence of coral skeletons: A high-sensitivity proxy of diagenetic alteration of aragonite. Sci. Rep. 2017, 7, 17969. [Google Scholar] [CrossRef] [Green Version]
  8. Qiu, Z.P.; Song, H.J.; Hu, C.Y.; Wignall, P.B.; Song, H.Y. Carbonate Thermoluminescence and its implication for marine productivity change during the Permian-Triassic transition. Palaeogeogr. Palaeoclimatol. Palaeoecol. 2019, 526, 72–79. [Google Scholar] [CrossRef]
  9. Johnson, N.M. An empirical isothermal decay law for the thermoluminescence of calcite. J. Geophys. Res. 1965, 70, 4653–4662. [Google Scholar] [CrossRef]
  10. Vaz, J.E.; Zeller, E.J. Thermoluminescence of calcite from high gamma radiation doses. Am. Mineral. 1966, 51, 1156–1166. [Google Scholar]
  11. Medlin, W.L. Color center growth curves in calcite. J. Phys. Chem. Solids 1967, 28, 1725–1733. [Google Scholar] [CrossRef]
  12. Bothner, M.H.; Johnson, N.M. Natural thermoluminescence dosimetry in Late Pleistocene pelagic sediments. J. Geophys. Res. 1969, 74, 5331–5338. [Google Scholar] [CrossRef]
  13. Christodoulides, C.; Fremlin, J.H. Thermoluminescence of biological materials. Nature 1971, 232, 257–258. [Google Scholar] [CrossRef]
  14. Nambi, K.S.V. Thermoluminescence investigations of natural calcite crystals of differing genesis. Thermochim. Acta 1978, 27, 61–67. [Google Scholar] [CrossRef]
  15. Sunta, C.M. A Review of thermoluminescence of calcium fluoride, calcium sulphate and calcium carbonate. Radiat. Prot. Dosim. 1984, 8, 25–44. [Google Scholar] [CrossRef]
  16. Calderon, T.; Aguilar, M.; Jaquel, F.; Coy-Yll, R. Thermoluminescence from natural calcites. J. Phys. C Solid State Phys. 1984, 17, 2027–2038. [Google Scholar] [CrossRef]
  17. Carmichael, L.A.; Sanderson, D.C.W.; Riain, S.N. Thermoluminescence measurement of calcite shells. Radiat. Meas. 1994, 23, 455–463. [Google Scholar] [CrossRef]
  18. Ninagawa, K.; Takahashi, N.; Wada, T.; Yamamoto, I.; Yamashita, N.; Yamashita, Y. Thermo-luminescence measurements of a calcite shell for dating. Quat. Sci. Rev. 1988, 7, 367–371. [Google Scholar] [CrossRef]
  19. Duller, G.A.T.; Penkman, K.E.H.; Wintle, A.G. Assessing the potential for using biogenic calcites as dosemeters for luminescence dating. Radiat. Meas. 2009, 44, 429–433. [Google Scholar] [CrossRef]
  20. Stirling, R.J.; Duller, G.A.T.; Roberts, H.M. Developing a single-aliquot protocol for measuring equivalent dose in biogenic carbonates. Radiat. Meas. 2012, 47, 725–731. [Google Scholar] [CrossRef]
  21. Liu, H.S.; Fang, N.Q.; Hou, S.L.; Chen, Y.X. Natural thermolum inescence of fossilforaminiferls as a potential proxy for deep sea temperature changes. Acta Oceanol. Sin. 2008, 27, 30–34. [Google Scholar]
  22. Chen, M.T.; Farrell, J. Planktonic foraminifer faunal variations in the northeastern Indian Ocean: A high-resolution record of the past 800,000 years from site 758. Proc. Ocean. Drill. Program Sci. Results 1990, 121, 125–126. [Google Scholar]
  23. Farrell, I.W.; Janecek, T.R. Late Neogene paleoceangraphy and paleoclimatology of the northeast Indian Ocean (site758). Proc. Ocean. Drill. Program Sci. Results 1990, 121, 297–350. [Google Scholar]
  24. Gerard, C.B.; Rusty, L. Iceberg dischardes into the North Atlantic on millennial time scales during the last glaciation. Science 1995, 267, 1005–1010. [Google Scholar]
  25. Dansgaard, W.; Johnsen, S.J.; Clausen, H.B.; Dahl-Jensen, D.; Gundestrup, N.S.; Hammer, C.U.; Hvidberg, C.S.; Steffensen, J.P.; Sveinbj Örnsdottir, A.E.; Jouzel, J.; et al. Evidence for general instability of past climate from a 250-kyr ice-core record. Nature 1993, 364, 218–220. [Google Scholar] [CrossRef]
  26. Stein, R.; Kanamatsu, T.; Alvarez Zarikian, C.A.; Higgins, S.; Zhai, Q. North Atlantic paleocenography: The last five million years. EOS 2006, 87, 129–133. [Google Scholar] [CrossRef] [Green Version]
  27. Channell, J.E.T.; Kanamatsu, T.; Sato, T.; Stein, R.; Alvarez Zarikian, C.A.; Malone, M.J. Expedition 303/306 Scientists. In Proceedings of the Integrated Ocean Drilling Program; Integrated Ocean Drilling Program Management International, Inc., College Station, TX, USA, 2006; Volume 303/306. [Google Scholar] [CrossRef] [Green Version]
  28. Roque, C.; Guibert, P.; Vartanian, E.; Bechtel, F.; Schvoerer, M. Thermoluminescence—Dating of calcite: Study of heated limestone fragments from Upper Paleolithic layers at Combe Saunière, Dordogne, France. Quat. Sci. Rev. 2001, 20, 935–938. [Google Scholar] [CrossRef]
  29. Wang, H.Y.; Li, C.; Hu, C.Y.; Xie, S.C. Spurious thermoluminescence characteristics of the Ediacaran Doushantuo formation (ca. 635–551 Ma) and its implications for marine dissolved organic carbon reservoir. J. Earth Sci. 2015, 26, 883–892. [Google Scholar] [CrossRef]
  30. Pagonis, V.; Maniatis, Y.; Michael, C.; Bassiakos, Y. Spurious and regenerated thermoluminescence in calcite powder samples. Radiat. Meas. 1997, 27, 37–42. [Google Scholar] [CrossRef]
  31. Liu, J.; Fang, N.; Wang, F.; Yang, F.; Ding, X. Features of ice-rafted debris (IRD) at IODP site U1312 and their palaeoenvironmental implications during the last 2.6 Myr. Palaeogeogr. Palaeoclimatol. Palaeoecol. 2018, 511, 364–378. [Google Scholar] [CrossRef]
  32. Lisiecki, L.E.; Raymo, M.E. A Pliocene-Pleistocene stack of 57 globally distributed benthic δ18O records. Paleoceanography 2005, 20, PA1003. [Google Scholar] [CrossRef] [Green Version]
  33. Medlin, W.L. Thermoluminescence of sedimentary rocks. In Proceedings of the 6th World Petroleum Congress, Frankfurt am Main, Germany, 19–26 June 1963; Volume 1, pp. 63–77. [Google Scholar]
  34. Ponnusamy, V.P.; Ramasamy, V.; Anandalakshmi, K. Effect of preheating in biogenic shells-thermostimulated luminescence and FTIR study. Indian J. Pure Appl. Phys. 2006, 44, 13–19. [Google Scholar]
  35. Zhang, J.J.; Wang, L.B. Thermoluminescence dating of calcite—Alpha effectiveness and measurement protocols. J. Lumin. 2020, 223, 117205–117213. [Google Scholar] [CrossRef]
  36. Huang, C.; Zhang, J.J.; Wang, L.B.; Zhao, H.; Li, S.H. Equivalent dose estimation of calcite using isothermal thermoluminescence signals. Quat. Geochronol. 2022, 70, 101310. [Google Scholar] [CrossRef]
  37. Biswas, R.H.; Herman, F.; King, G.E.; Braun, J. Thermoluminescence of feldspar as a multi-thermochronometer to constrain the temporal variation of rock exhumation in the recent past. Earth Planet. Sci. Lett. 2018, 495, 56–68. [Google Scholar] [CrossRef]
  38. Biswas, R.H.; Frédéric, H.; Georgina, E.K.; Benjamin, L.; Ashok, K.S. Surface paleothermometry using low-temperature thermoluminescence of feldspar. Clim. Past 2020, 16, 2075–2093. [Google Scholar] [CrossRef]
  39. Engin, B.; Güven, O. Thermoluminescence dating of Denizli travertines from the southwestern part of Turkey. Appl. Radiat. Isot. 1997, 48, 1257–1264. [Google Scholar] [CrossRef]
  40. Aitken, M.J. Thermoluminescence Dating; Academic Press Inc.: London, UK, 1985. [Google Scholar]
  41. Castagnoli, G.C.; Bonono, G.; Provenzale, A. On the thermoluminescence profile of an Ionian sea sediment: Evidence of 137, 118, 12.1, and 10.8y cycles in the last two millennia. Nuovo C. C 1988, 11, 1–12. [Google Scholar] [CrossRef]
  42. Castagnoli, G.C.; Bonono, G.; Provenzale, A.; Serio, M. On The solar origin of the thermoluminescence profile of the GT14 core. Sol. Phys. 1990, 127, 357–377. [Google Scholar] [CrossRef]
  43. Rosenthal, Y.; Boyle, E.A.; Labeyrie, L.; Oppo, D. Glacial enrichments of authigenic Cd and U in Subantarctic sediments: A climatic control on the elements’ oceanic budget? Paleoceanography 1995, 10, 395–413. [Google Scholar] [CrossRef]
  44. Zeller, E.J.; Wary, J.L.; Daniels, F. Factors in age determination of carbonate sediments by thermoluminescence. Bull. Am. Assoc. Pet. Geol. 1957, 41, 121–129. [Google Scholar]
  45. Zeller, E.J.; Wary, J.L.; Daniels, F. Thermoluminescence induced by pressure and by crystallization. J. Chem. Phys. 1955, 23, 2187. [Google Scholar] [CrossRef]
  46. Townsend, P.D.; Luff, B.J.; Wood, R.A. Mn2+ transitions in the thermoluminescence emission spectra of calcite. Radiat. Meas. 1994, 23, 433–440. [Google Scholar] [CrossRef]
  47. Kononova, V.A.; Tarashchan, A.N. Thermoluminescence of carbonates from carbonatites. Int. Geol. Rev. 1970, 12, 272–280. [Google Scholar] [CrossRef]
  48. Martinson, D.G.; Pisias, N.G.; Hays, J.D.; John, I.; Moore, T.C.; Shackleton, N.J. Age dating and the orbital theory of the ice ages: Development of a high resolution 0-300000 years chronostratigraphy. Quat. Res. 1987, 27, 1–29. [Google Scholar] [CrossRef] [Green Version]
  49. Shemesh, A.; Charlis, C.D.; Fairbanks, R.G. Oxygen isotopes in biogenic silica: Global changes in ocean temperature and isotopic composition. Science 1992, 256, 1434–1436. [Google Scholar] [CrossRef]
  50. Berger, A.; Crucifix, M.; Hodell, D.A.; Past Interglacials Working Group of Pages. Interglacials of the last 800,000 years. Rev. Geophys. 2016, 54, 162–219. [Google Scholar] [CrossRef] [Green Version]
  51. Johnson, N.M. Thermoluminescence in biogenic calcium carbonate. J. Sediment. Res. 1960, 30, 305–313. [Google Scholar]
  52. Esme, I.; Dilek, T.; Mehmet BEr Muhammed, H. Classification of thermoluminescence features of CaCO3 with long short-term memory model. Luminescence 2021, 36, 1684–1689. [Google Scholar] [CrossRef]
  53. Ronca, L.B.; Zeller, E.J. Thermoluminescence as a function of climate and temperature. Am. J. Sci. 1965, 263, 416–428. [Google Scholar] [CrossRef]
  54. Carla, T.; Silvia, A.; Sara, R.; Gianna, V.; Salvatore, M. Data Descriptor: A foraminiferal δ18O record covering the last 2200 years. Sci. Data 2016, 3, 160042. [Google Scholar] [CrossRef] [Green Version]
  55. Hays, J.D.; Imbrie, J.; Shackleton, N.J. Variations in the Earth orbit pacemaker of the ice age. Science 1976, 194, 1121–1132. [Google Scholar] [CrossRef]
  56. Ruddiman, W.F.; Raymo, M.; Mcintrye, A. Matayama 41,000 year cycles: North Atlantic Ocean and Northern hemisphere ice sheets. Earth Planet Sci. Lett. 1986, 80, 117–129. [Google Scholar] [CrossRef]
  57. Jouzel, J.; Lorius, C.; Pettl, J.R.; Genthon, C.; Barkov, N.I.; Kotlyakov, V.M.; Petrov, V.M. Vostok ice core: A continuous isotope temperature record over the last climate cycle (160,000 years). Nature 1987, 329, 403–408. [Google Scholar] [CrossRef]
  58. Shackleton, N.J. The 100,000-Year Ice-age cycle identified and found to lag temperature, carbon dioxide, and orbital eccentricity. Science 2000, 289, 1897–1902. [Google Scholar] [CrossRef] [Green Version]
  59. Casstagnoli, G.C.; Bonino, G.; Attolini, M.R.; Galli, M. The 11y cycle in the thermoluminescence profile of sea sediments. Nuovo C. C 1984, 7, 69–73. [Google Scholar] [CrossRef]
  60. Casstagnoli, G.C.; Bonino, G.; Attolini, M.R.; Beer, J. Solar cycles in the last centuries in 10Be and δ18O in polar ice and in thermoluminescence signals of a sea sediment. Nuovo C. C 1984, 7, 235–244. [Google Scholar] [CrossRef]
  61. Casstagnoli, G.C.; Bonino, G. Comparison of thermoluminescence profiles in recent sea cores. Nucl. Tracks Radiat. Meas. 1985, 10, 759–761. [Google Scholar] [CrossRef]
  62. Casstagnoli, G.C.; Bonino, G.; Attolini, M.R.; Nanni, T. The Schwabe cycle in the thermoluminescence profiles of an Ionian sea core. Nuovo C. C 1987, 10, 315–322. [Google Scholar] [CrossRef]
  63. Castagnoli, G.C.; Bonono, G.; Della, M.P.; Taricco, C. Record of thermoluminescence in sea sediments in the last millennia. Nuovo C. C 1997, 20, 1–8. [Google Scholar]
  64. Castagnoli, G.C.; Bonono, G.; Della, M.P.; Procopio, S.; Taricco, C. On the solar origin of the 200y Suess wiggles: Evidence from thermoluminescence in sea sediments. Nuovo C. C 1998, 21, 237–241. [Google Scholar]
  65. Hammer, O.; Harper, D.; Ryan, P. PAST: Paleontological statistics software package for education and data analysis. Palaeontol. Electron. 2001, 4, 1–9. [Google Scholar]
  66. Rose, W.I.; Chesner, C.A. Dispersal of ash in the great Toba eruption, 75ka. Geology 1987, 15, 913–917. [Google Scholar] [CrossRef]
Figure 1. Location map of sampling and geographic environment.
Water 15 02618 g001
Figure 2. Calcareous biological ooze sample and sample splitter used in this study. No. 81349 is the core number, and no. II represents the sampled section.
Water 15 02618 g002
Figure 3. Core MD81349 FE-TEM imaging of foraminifer nannofossil ooze ((ad) microscopic images revealed by different imaging resolutions and different shells).
Water 15 02618 g003
Figure 4. Core MD81349 foraminifer nannofossil ooze electron microscope analysis results.
Water 15 02618 g004
Figure 5. TL glow curve of planktonic foraminifers.
Water 15 02618 g005
Figure 6. Comparison of TL intensity as a function of exposure dose. The red line is the sample that received a 60Co gamma dose of 180 Gy curve, and the green line is the natural signal curve of the same sample. The peak temperature of the calcareous biological ooze sample is approximately 395 °C, which is similar to the “natural” signal, indicating that they may be caused by non-radiation induced and spurious TL, regardless of the irradiation dose [30].
Water 15 02618 g006
Figure 7. Cross-plots between TL and 135Ba, 47Ti (a) and 55Mn (b). 135Ba concentrations show a significant positive correlation with TL (n = 92, r = 0.32, p < 0.01), and 47Ti shows a significant negative relationship (n = 92, r = −0.33, p < 0.01). 55Mn concentrations show a weakly positive relationship with TL (n = 92, r = 0.14).
Water 15 02618 g007
Figure 8. Cross−plots between δ18O and TL. δ18O show a positive relationship with planktonic foraminifer TL (a) (n = 73, r = 0.42, p < 0.01) and calcareous biological ooze TL (b) (n = 73, r = 0.36, p < 0.01).
Water 15 02618 g008
Figure 9. REDFIT spectrum analysis for MD81349 (a) and U1312B TL (b) over 300 ka intervals. Numbers indicate the significant periodicities, and green lines indicate the 95% and 90% significant levels from up to down. REDFIT spectrum analysis was performed using Past 4.0 [65]. The parameters of this test are over sampling = 3, segments = 1, window = rectangle and Monte Carlo on. (For interpretation of the references to color in this figure legend, the reader is referred to the web version of this article).
Water 15 02618 g009
Figure 10. Core MD81349 composite records of δ18O, TL, CaCO3 vs. age based on the δ18O age model [48]. Depth of the major ash layer (Toba ash) at 75 ka is labeled. The global climate abruptly cooled during this period. Affected by volcanic ash, the TL of carbonate ooze decreased significantly, while the TL of foraminifera shell was weakly affected. Numbered intervals in the legend refer to interglacial and glacial stages. The dotted red arrow shows the periodic variations in the TL-peak of planktonic foraminifer samples and the magenta curve shows the periodic variations in calcareous biological ooze samples.
Water 15 02618 g010
Figure 11. Profiles of TL, CaCO3 of core U1312B vs. δ18O and age based on the δ18O age model [32]. Numbered intervals in the legend refer to interglacial and glacial stages. CaCO3 is from [27] and plotted as the blue curve. The dotted red arrow shows the periodic variations in the TL-peak in calcareous biological ooze samples and the magenta curve shows the periodic variations in calcareous biological ooze samples.
Water 15 02618 g011
Table 1. Cores MD81349 [21] and IODP306-U1312B parameters [27].
RegionsCoreSeawater Depth(m)Core Length(m)LatitudeLongitudeAgeCore DrillingTime
Northeast Indian OceanMD8134925054.301°01′0 S89°22′0 E296 ka B.P.1981
North Atlantic OceanIODP306-U1312B (1H-2H)CC *3533.66.6042°50.2150′ N23°5.2652′ W299 ka B.P.2005
Notes: * Cored totals: cored length 231.90 m and corresponds to an age at approximately 10.95 Ma B.P., recovered 236.84 m, recovery (%) 102.08.
Disclaimer/Publisher’s Note: The statements, opinions and data contained in all publications are solely those of the individual author(s) and contributor(s) and not of MDPI and/or the editor(s). MDPI and/or the editor(s) disclaim responsibility for any injury to people or property resulting from any ideas, methods, instructions or products referred to in the content.

