1. Introduction
Water is essential to life and forms part of the environment. Global concern for the state of the environment has identified that water resources are subject to significant pressures from water demand and climate change impacts. The pressures on organizations to implement water efficiency programs can arise from limited water resources, particularly in resource exploitation activities. They might also arise from commercial, institutional, and industrial activities, whether water is supplied by water utilities or comes directly from the environment [
1].
The deterioration of water quality for its classified use can be quantified by physical, chemical, or biological monitoring. Possible deterioration is caused by navigation, recreation, irrigation, fish, and aquatic life [
2].
With 40% of the global population residing in water-stressed regions or facing contamination of water sources, addressing the present and future needs of communities emerges as another significant challenge for cities. ISO standards cover virtually every aspect related to water use and represent the international consensus on best practices for effective water management [
3].
When deciding on issues of providing the drinking water supply in the location of interest, it is essential to estimate the water demand properly [
4]. Supplying municipalities with high-quality drinking water is an infinite demand of stakeholders, which is placed on water management organizations. The quality of this water cannot be cheated or otherwise modified when external or internal conditions change. The interaction of the transport system and the transported medium is constantly under scrutiny. Continuously ongoing programs, such as Municipal Water Quality Investigations (MWQI) and the Volunteer’s Aqueduct Project (VAP), which relate to this demanding task, only underline the importance of this issue [
5,
6].
In a broader perspective, the goal of municipal water systems, encompassing drinking water, wastewater, and stormwater, is to eliminate potential contaminants from surface water and underground sources for human consumption. Subsequently, the water is treated after usage and pollution, ensuring its safe discharge into the environment. This cyclical process continues to benefit downstream communities. Within this context, integrated and effective management is needed to coordinate such efforts and ensure that resources are there to achieve these objectives. However, every once in a while, there are triggers and incentives that prompt the government apparatus to modernize and improve on its obligation to protect human health and the environment [
7].
An in-depth overview of the water supply network in the municipality, passport processing, and accident and malfunction recording is provided based on data provided by the owner and operator of the water mains, as well as the data collected by our own field survey. The individual water supply lines were classified based on their structural condition. In addition, a proposed plan for financing the reconstruction of the water supply mains was created [
8].
Transporting drinking water over long distances imposes significant demands on distribution systems, with utmost emphasis placed on hygiene, health, and safety. Ensuring the quality of the pipeline system materials used to transport this vital resource involves specific requirements. Various factors, including geometric, physicochemical [
9], biological [
10], incrustation [
11,
12], operational [
13,
14], legislative [
15,
16], and numerous normative factors at both national and international levels, play a role in influencing the dynamics within the pipeline [
17,
18,
19,
20,
21].
When establishing and subsequently applying the water supply standard requirements, adequate consideration is always given to the importance of the reliability and safety of the water supply for human needs, as well as for services, industry, agriculture, and fire purposes. It is often a set of very diverse requirements, including different national legal requirements for the water supply, differences in population structure, and social and climatic conditions [
22].
Water supply systems encompass essential components required for water abstraction (water source), water treatment (water treatment plant), storage (water tank), pumping (pumping station), and pipes that serve as conduits for water transportation. The pipes connect the water source, water treatment, and storage elements, ensuring water delivery to consumers through service connections. The network of pipes to which the service connections are connected is known as the distribution network. There are two primary types of water supply systems based on terrain elevation and the arrangement of system components: gravity supply systems and pumped supply systems. In practice, we encounter various combinations of these two systems and different positions of elements within the system. This includes scenarios such as tanks located before or after the consumption area, multiple water sources with multiple pumps, or the presence of multiple tanks within the system. When multiple elements supply water to multiple consumption areas, resulting in complex water supply systems, they are referred to as regional water supply systems [
4].
Within water management structures, pipeline systems play a crucial role, and it is the internal space of these pipelines that significantly impacts the transportation of drinking water, both directly and indirectly. The properties of conveyance and surrounding fluids on both interior and exterior pipe surfaces can generally cause one of two potential actions upon the pipe material: corrosion or incrustation. While both processes typically occur more or less conjointly, for the purpose of this paper, only incrustation will be considered. Notably, the presence of extensive incrustations caused by hard water, primarily composed of calcium carbonate, poses challenges, such as increased operational costs, compromised water flow, and decreased heat transfer coefficients.
Addressing the issue of pipeline interior incrustation removal is a complex problem that has been the subject of inquiry for several decades. Determining the appropriate and targeted approach for addressing this challenge remains a topical question. De-incrustation processes involve mechanical, physicochemical, or chemical principles. However, harmonizing these activities with the unique conditions of each exposed location presents a considerable challenge.
A key strategic indicator for advancing public water supply systems is an increasing number of residents receiving their water from these systems, with a particular emphasis on ensuring the delivery of safe drinking water [
16].
Consequently, the strategic objective is to provide citizens with high-quality drinking water by using water mains as transportation systems. This objective can be pursued through discrete measures, where the focus is on separately addressing the transportation system and the transport medium. Alternatively, it can be achieved by considering the interaction between the aforementioned components, resulting in incrustation on the inner surface of the transport system and the presence of dispersed particles in the transported medium, i.e., unsettled incrustation particles.
The primary aim of this article is to propose the most suitable combination of available parameters for the distribution water system, specific to the selected territorial location, in order to minimize pipe incrustation caused by water scale and ensure the required water quality. Additional sub-goals include identifying effective solutions for reducing scale formation within the pipe system, optimizing the transport pair “system and medium,“ and maintaining the necessary water quality. Throughout the study, we consider the inherent nature of the interaction between incrustation and the system.
2. Literature Review
This study conducted a literature review that specifically investigated the application of multicriteria analysis in addressing issues pertaining to water distribution systems. The primary objective was to identify the factors influencing incrustation development and their incorporation into optimization approaches aimed at resolving this problem.
The development of materials used in water distribution systems has evolved significantly over time. Initially, water distribution systems were constructed using materials such as wood, clay, and stone. While these materials served their purpose to some extent, they had limitations in terms of durability, corrosion resistance, and overall performance. The most extensive water distribution systems in ancient times were the Roman aqueducts, which conveyed water long distances by means of gravity through a collection of open and closed conduits [
23]. The primary material used in the construction of Roman aqueducts was stone, and by using the opus quadratum building technique, the stone was carefully cut and fitted together without the use of mortar to create a sturdy and durable structure.
As technology advanced, metals such as cast iron and galvanized steel became popular choices for water distribution pipes. These materials offered improved strength and durability compared to their predecessors. However, they were still susceptible to corrosion and had a limited lifespan.
There is an official record of the cast iron pipe manufactured at Siegerland, Germany, in 1455 for installation at the Dillenburg Castle [
24]. The complex water distribution systems of channels were constructed to move water from the well sources in and out of castles [
23].
In recent decades, the use of more advanced materials in water distribution systems has gained traction. One of the most widely used materials today is ductile iron, which provides increased strength and durability, while offering better corrosion resistance. The ductile iron pipe was cast experimentally for the first time in 1948 and was introduced to the marketplace in 1955 [
24]. Additionally, various types of plastics, including polyvinyl chloride (PVC), high-density polyethylene (HDPE), and cross-linked polyethylene (PEX), have become popular choices due to their corrosion resistance, flexibility, and ease of installation [
25].
Furthermore, there has been a growing interest in using alternative materials, such as a fiber-reinforced polymer (FRP) and concrete with internal linings for specific applications. Utilizing these materials presents several advantages, including increased corrosion resistance, extended service life, improved water quality, and effective solutions for addressing the challenges associated with restoring and maintaining existing and deteriorating infrastructure [
26].
Incrustation occurs in practically any pipe material or combination of materials. It is a gradual process with various warning signs that precede the system’s failure. Some of the signals (but not limited to) are related to the progressive decline in water system production, drop in water pressure, reduced transfer heat, the shorter life span of the related equipment, frequent clogs, changes in the physical attributes of water (color, smell, taste), leaks, and the like. Ultimately, problems become not only economically demanding, but also a worrying safety issue.
Societal concerns about drinking water quality have a long history, but the specific focus and recognition of its importance have evolved over time, spurred by historical events, scientific advancements, public health concerns, and environmental movements. Today, ensuring access to safe and clean drinking water remains a priority for governments, organizations, and communities worldwide.
In the year 2000, the United Nations Millennium Development Goals acknowledged the significance of access to water services as a fundamental human right. As part of this recognition, a goal was established to fulfill the global population’s requirements for safe drinking water and basic sanitation. This commitment to providing adequate water services gained prominence within this framework. Building upon these efforts, the United Nations adopted the Sustainable Development Goals (SDGs) in 2015 as part of the 2030 Agenda for Sustainable Development, which serves as a comprehensive plan for the betterment of people, the planet, and prosperity. Included in the SDGs is a dedicated goal on water and sanitation, known as SDG 6, which sets out to ensure the availability and sustainable management of water and sanitation for all, which broadens the focus on drinking water and sanitation to cover the entire water cycle, including the management of water, wastewater, and ecosystem resources [
27].
As an essential resource for environmental and socio-economic progress, water is under growing strain by population increase and economic expansion, unequal allocation of land, and climate change [
28].
The network ensuring the drinking water supply is one of the basic structures of the critical infrastructure in all developed countries [
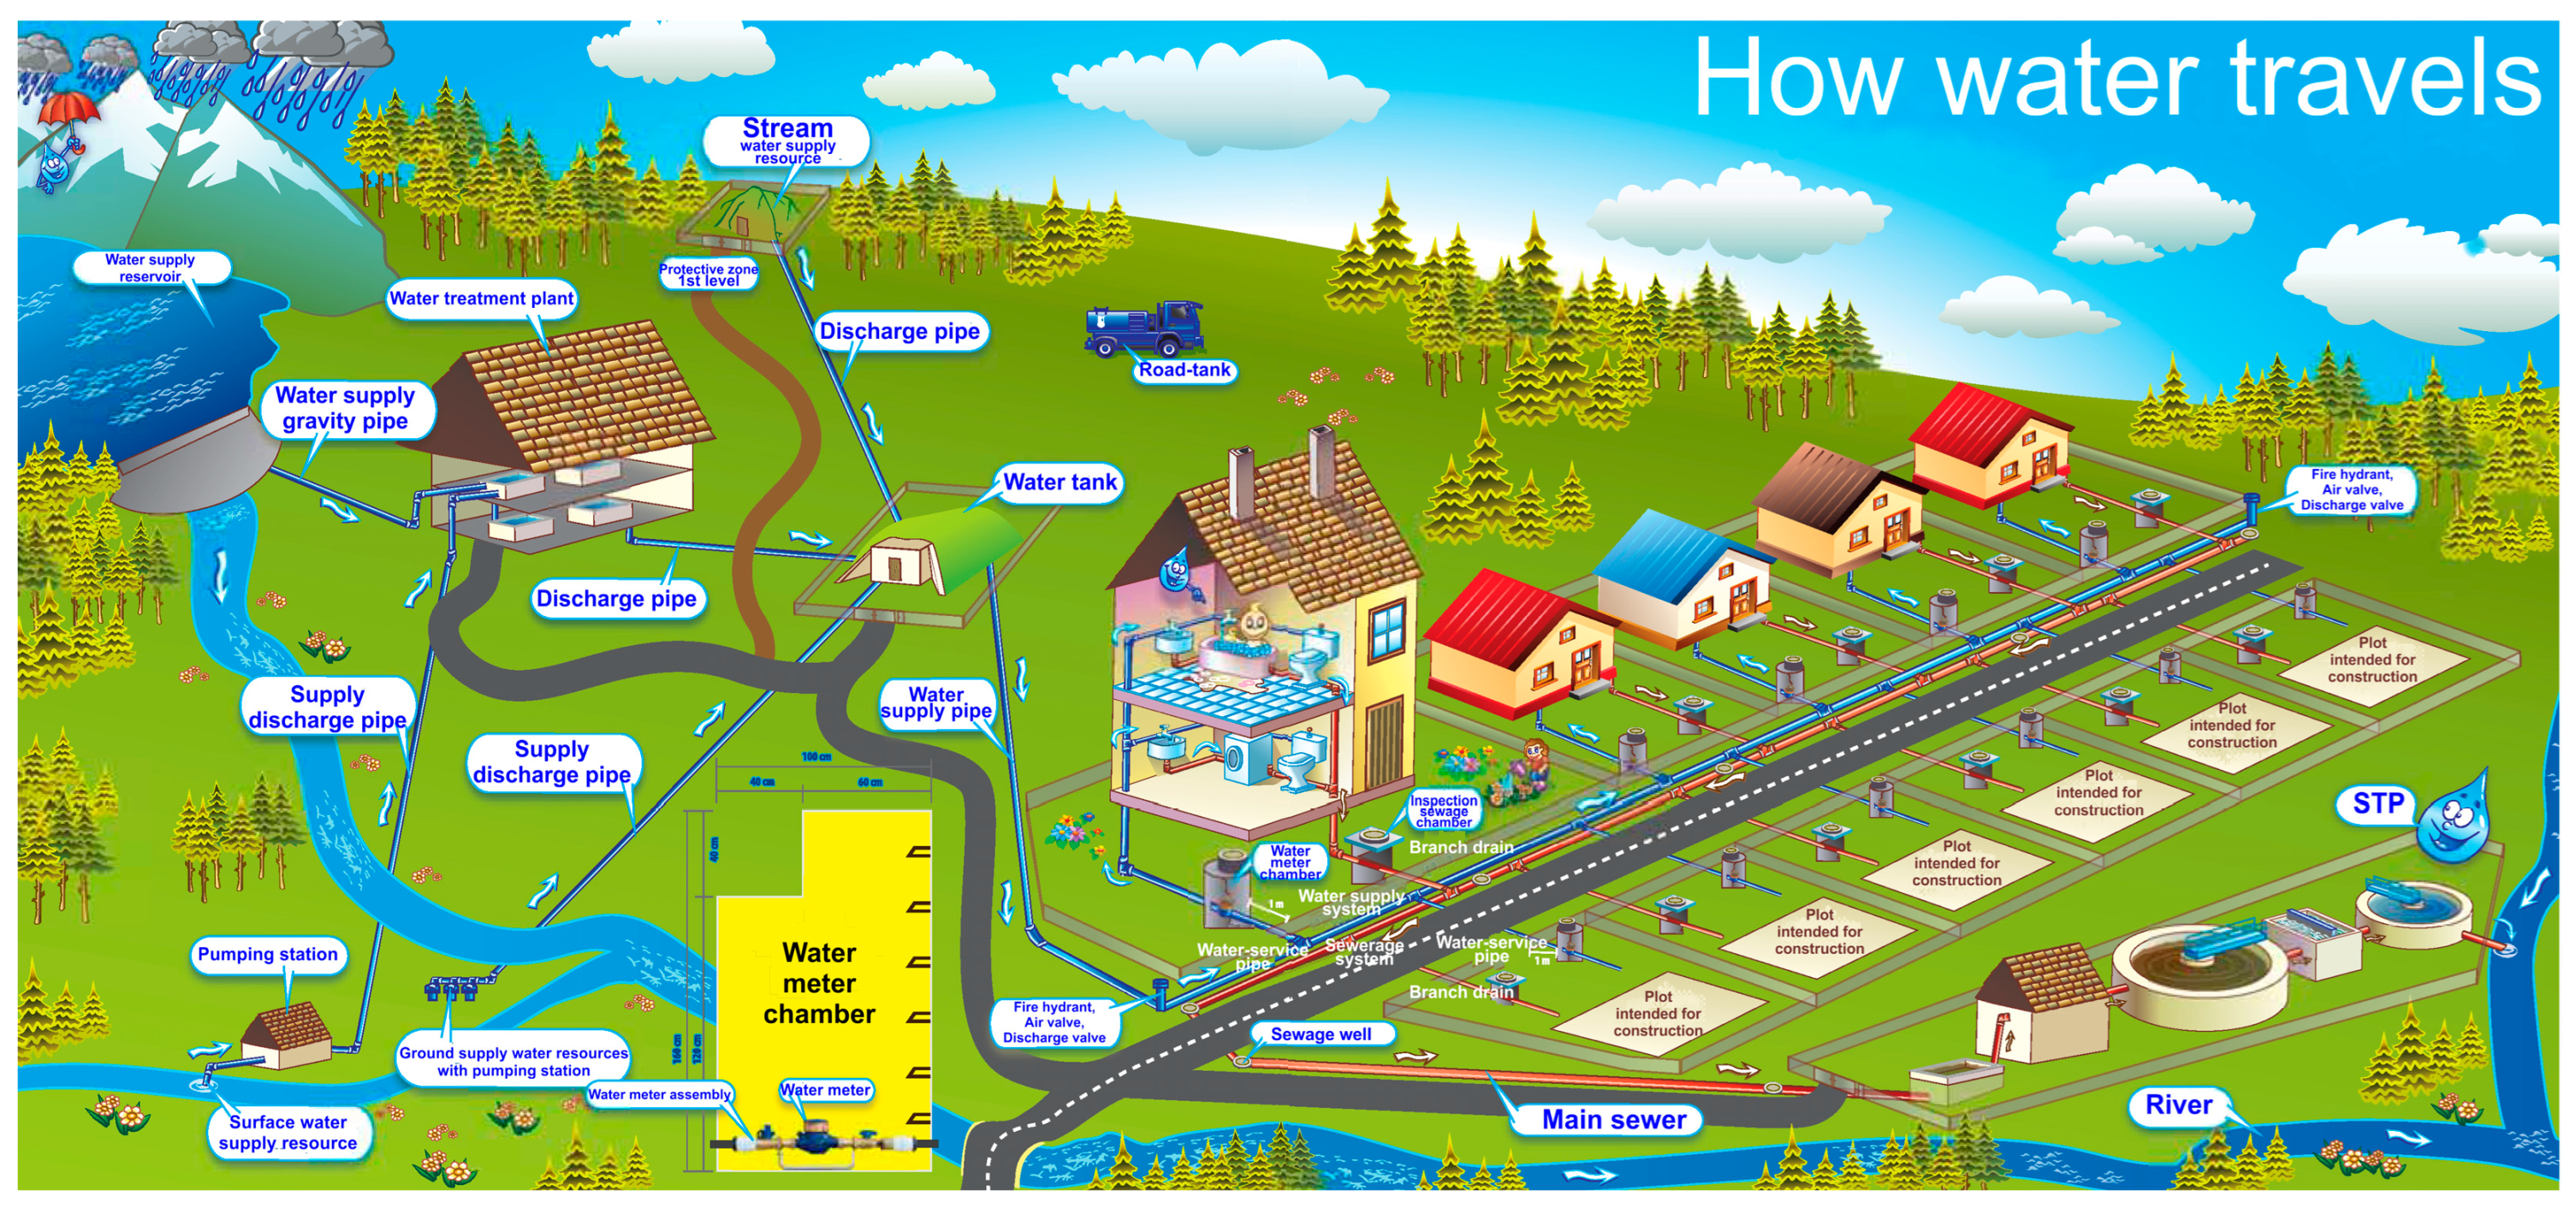
29]. The urban water cycle, from the source to the consumer, in
Figure 1 [
30] succinctly shows how complex the system of drinking water supply and wastewater removal is.
Incrustations are deposits formed inside the pipes within the water treatment and distribution network, in the heat exchangers, in the filling packs of the evaporative tower, and whenever there is hard water with the increase of its temperature [
31]. Experts in the field agree that incrustation is an electrochemical process that can occur either due to a reduction–oxidation (redox) reaction or a precipitation process. Referred to as scaling, specific dissolved elements or compounds revert to a settleable solid that deposits or adheres onto the pipe’s surface. Precipitation is caused by one or a combination of reactions due to water temperature, pressure changes, and the concentration of the salts present in the water. The most commonly found salt in water wells is the compound that causes water hardness (calcium carbonate, CaCO
3), although other compounds can also cause precipitation, such as ferrous hydroxide (dissolved iron in solution), ferric hydroxide (reduced iron), and manganese hydroxide (dissolved manganese) [
32].
In the context of water transportation, the majority of conveyed water exhibits corrosive and/or encrusting properties, necessitating the selection of appropriate anti-corrosion measures, pre-treatment of water prior to entering the transport system, and the use of durable pipeline materials. One of the ways to effectively mitigate sediment formation is to implement preventative measures at the entry point of the distribution pipeline [
33]. This can be achieved by facilitating the crystallization of CaCO
3 in the form of aragonite or by increasing the frequency of hydrodynamic pulses, which enhances the likelihood of removing CaCO
3 microcrystals from the inner pipe surface.
An alternative approach involves reducing the concentration of Ca
2+ and Mg
2+ ions through chemical water purification, ion exchange, or degassing processes, such as removing CO
2 using the air stripping method [
34]. Another technique is to coat the inner pipe surface with a substance that is inert to CO
2 and O
2 or possesses significant crystallographic differences compared to calcite [
35].
Similar control strategies were suggested by [
36], noting that in order to control corrosion and the formation of incrustations, one must select appropriate materials and a sound system design, apply the proper chemical treatment (adjusting pH, alkalinity, oxygen, the use of corrosion inhibitors), and use coatings and paints resistant to corrosion in order to protect the walls of the pipes [
36].
Incrustation formation arises from the interplay of various physical, chemical, electrochemical, and biological factors, often resembling corrosion processes. In most instances, isolating the effects of individual factors is challenging, as they tend to intertwine. However, certain situations may exhibit a dominant influence of one factor over others.
Multi-criteria decision analysis has emerged as a valuable tool for evaluating various aspects of drinking water management. It has demonstrated effectiveness in selecting optimal combinations of distribution system factors [
37], choosing new sources of drinking water [
38], and supporting the development of integrated water quality assessment and management strategies [
39]. These sources collectively emphasize the importance of employing an integrated assessment method to effectively handle multiple sources, objectives, and the inherent uncertainty involved in decision-making processes.
The study presented in [
40] focuses on utilizing multi-criteria decision-making models for assessing the performance of water pipelines. The models consider three categories of factors that influence pipeline performance: physical, environmental, and operational. To develop these models, data were collected through questionnaire surveys distributed among plumbing professionals, and multiple calculation methods were employed.
The study demonstrates the value of using multi-criteria decision-making models for water pipeline performance assessment. It highlights the superiority of the fuzzy analytical network process (FANP) in handling complex decision scenarios as it effectively incorporates interdependency and uncertainty into the decision-making process.
In contrast to the mentioned approach, our methodology incorporates two additional sets of factors: chemical factors and incrustation factors. We augmented the theoretical information with real-world data obtained from specific fault locations. To perform calculations, we employed Saaty’s method, which allowed for a comprehensive analysis without a high degree of uncertainty and vagueness.
3. Materials and Methods
The “Methods and Materials” section serves as a critical section of this research paper, providing a comprehensive overview of the methodologies employed in the study. This section outlines the systematic approach taken to address the research objectives and ensures the transparency and reproducibility of the research methodology.
The section is organized as follows:
Section 3.1 defines factors influencing the quality of the transported medium, dividing them into chemical, physical, geometrical, operational, and incrustation. The factors influencing the formation of incrustation during the interaction between the water transport pipe system and the transported water medium, as well as their significance in guaranteeing the desired water quality, can be categorized into sets of factors. These sets encompass the geometric, physical, chemical, operational, and incrustation characteristics of the transport system.
Section 3.2 outlines the sampling collection methods used in the study, while the emphasis was placed on the appropriateness and completeness of simultaneous documented information. Building on the sample collection,
Section 3.3 focuses on the sample preparation and evaluation, where the samples’ dimensions were measured using a digital caliper and a tape measure. The final
Section 3.4 describes Saaty’s matrix, used to prepare the basis for a multi-criteria evaluation of the transport system—the transported medium.
3.1. Selection of Factors Influencing the Quality of Transported Water
Geometric factors are closely connected with the construction water management project and related documentation. They define the internal and external environment in 3D, taking into account the localization of the transport system, and the qualitative and quantitative characteristics of the pipeline transport system in comparison: the technical documentation of the project and the real state.
The selected geometric characteristics are defined as internal (G2, G3, G16, and G17) and external (G1, G4–G15). An overview summary is presented in
Table 1.
When water comes into contact with the pipe material, it undergoes a process that leads to the formation of incrustations. These incrustations result from the precipitation of certain substances present in the water, which gradually accumulate on the inner surface of the pipe. The intensity of this process depends on the water quality, its aggressive properties, and the pipe material used [
41]. The sensory quality of drinking water can be influenced by the physical factors associated with the water, which are defined by relevant water management standards.
Table 2 presents a list of these factors, which characterize the internal environment within the pipeline. For our research, the focus is on studying the impact of these factors on drinking water quality.
The chemical factors are divided into two distinct groups: those relating to the medium (water, CH1–CH5) and those pertaining to the pipeline (CH6–CH8). Notably, the pipeline category, CH8, is further subdivided into four segments based on the specific pipeline materials investigated (refer to
Table 3). While CH1–CH5 primarily concern laboratory practices aimed at ensuring drinking water quality, CH6–CH8 become significant during pipeline construction, where the incrustation potential varies with different pipe materials. The CH6 factor was included in this set because the number of materials used in the transport system directly influences the extent to which their chemical properties affect the transported medium. This variability adds complexity to the pipeline protection methods. Consequently, CH8 warrants separate research, particularly in materials engineering, and merits attention in other professional works.
The technological factors that define the supply of drinking water are outlined in
Table 4. These factors are categorized into two main groups: those relating to the water itself and those concerning the water transport system, including their combined impact. Specifically, P1 and P2 pertain to the characteristics of the transported medium, which is water. Conversely, P3 and P4 address the interaction between water and the transport system, with provisions for adjustability. Additionally, factor P5 exclusively relates to the water transport system. By analyzing these technological factors, this study provides insights into optimizing the drinking water supply process.
Incrustation factors, as outlined in
Table 5, present a summary and analysis of factors in the interaction between water and the transport system. The factors, namely, I1 and I2, contribute to the formation of incrustations and are subject to various influences. I1 is dependent on geometric, chemical, and operational factors, while I2 is experimental in nature. Importantly, these factors exhibit interactive behavior, further influencing incrustation formation in the water transport system interface.
3.2. Sample Collection
During the implementation of the experimental work, specific methods and procedures were carefully selected to ensure the accurate collection and subsequent preparation of the samples for experimentation. Special attention was given to the appropriateness and completeness of simultaneous documentation.
At the dispatch center of the drinking water supply organization VVS Inc. in Košice, Slovakia, a malfunction in the transport pipeline system was reported. This report included detailed information regarding the fault location and a description of the issue. An intervention unit was dispatched from the center to the site to conduct an inspection and carry out the necessary repairs. For our research purposes, a total of 17 water pipe samples intended for drinking water were managed.
After determining the precise location of the failure, the organization’s workers, as needed, closed the nearest valve on the supply water pipeline as the first step. The second step involved exposing the fault site through excavation, utilizing either mechanical equipment or manual methods, based on the accessibility and terrain conditions. The project documentation of the transport system was consulted to accurately determine the location and depth of the pipeline.
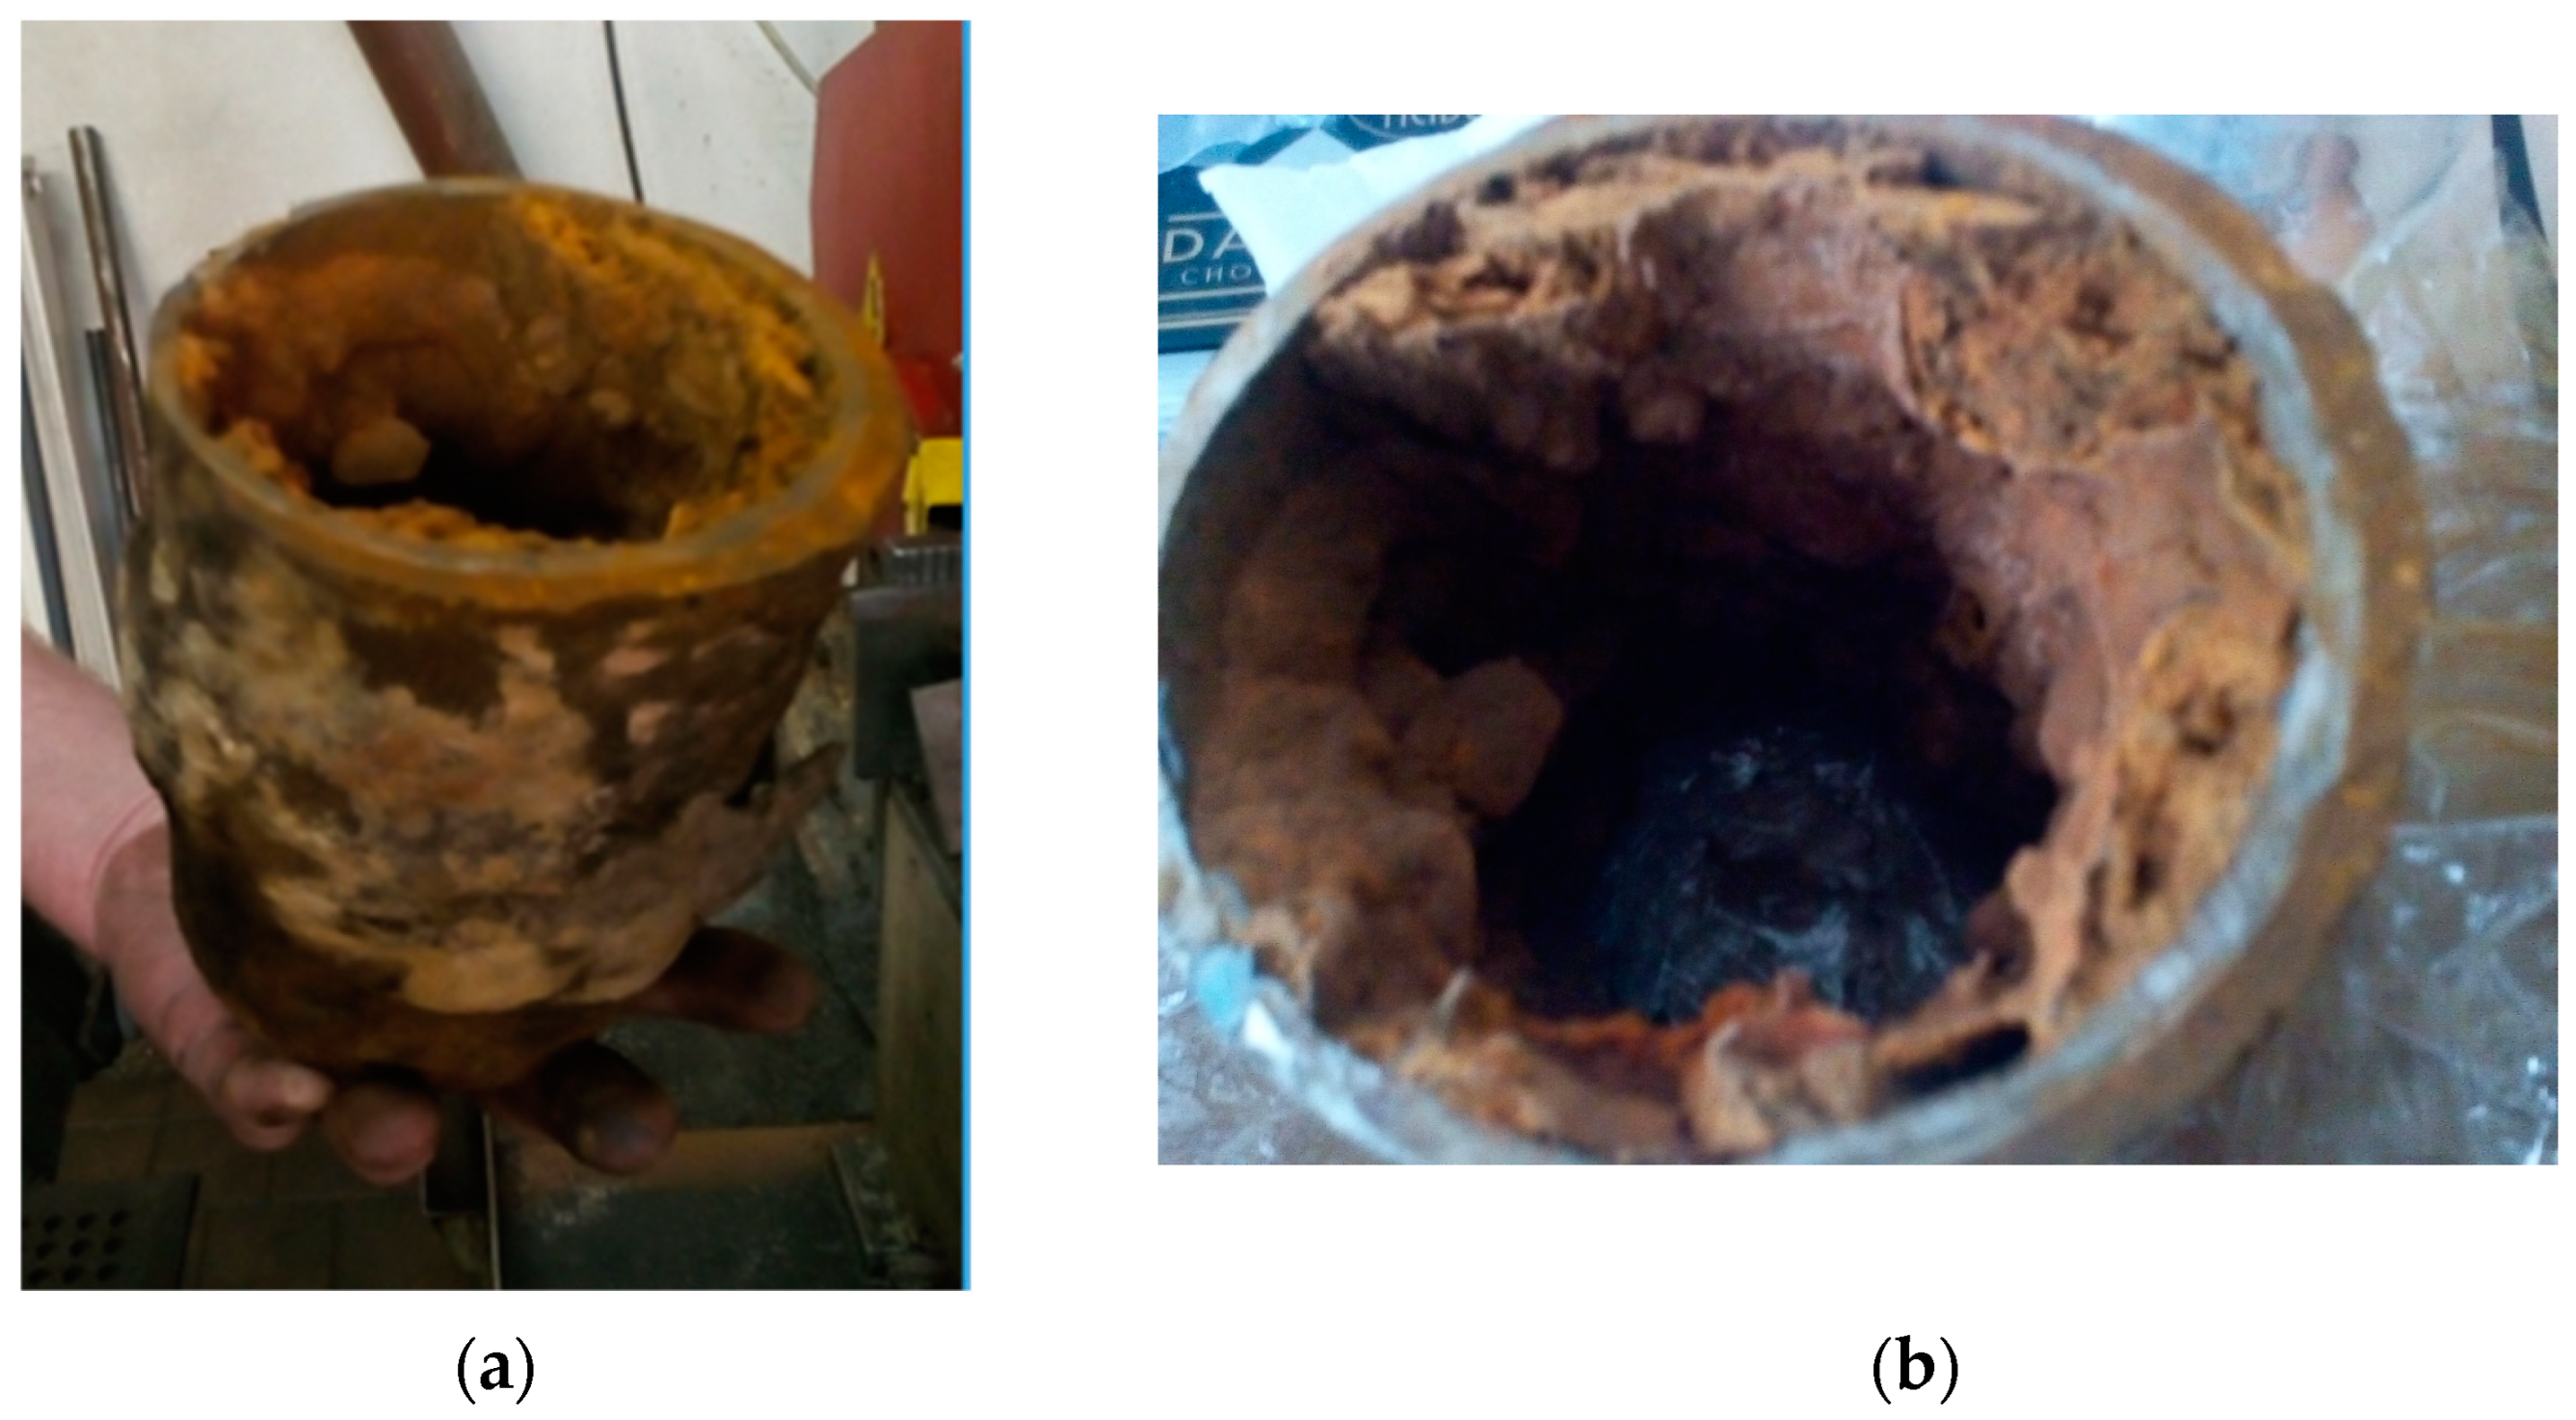
Following the excavation and exposure of the failure site, a sump pump hose was inserted into the excavated pit in most cases as the third step, aiming to partially dry the space beneath the pipe. As the fourth step, post-failure sampling (sectioning) of the sample, as shown in
Figure 2a, was performed using a hand saw.
The damaged portion of the pipe was wrapped in PE stretch film,
Figure 2b, to prevent rapid drying.
Figure 2a also shows a significant incrustation of the inner space of the pipe.
3.3. Preparation and Evaluation of Samples
The dimensions of the collected samples were measured using a digital caliper and a tape measure.
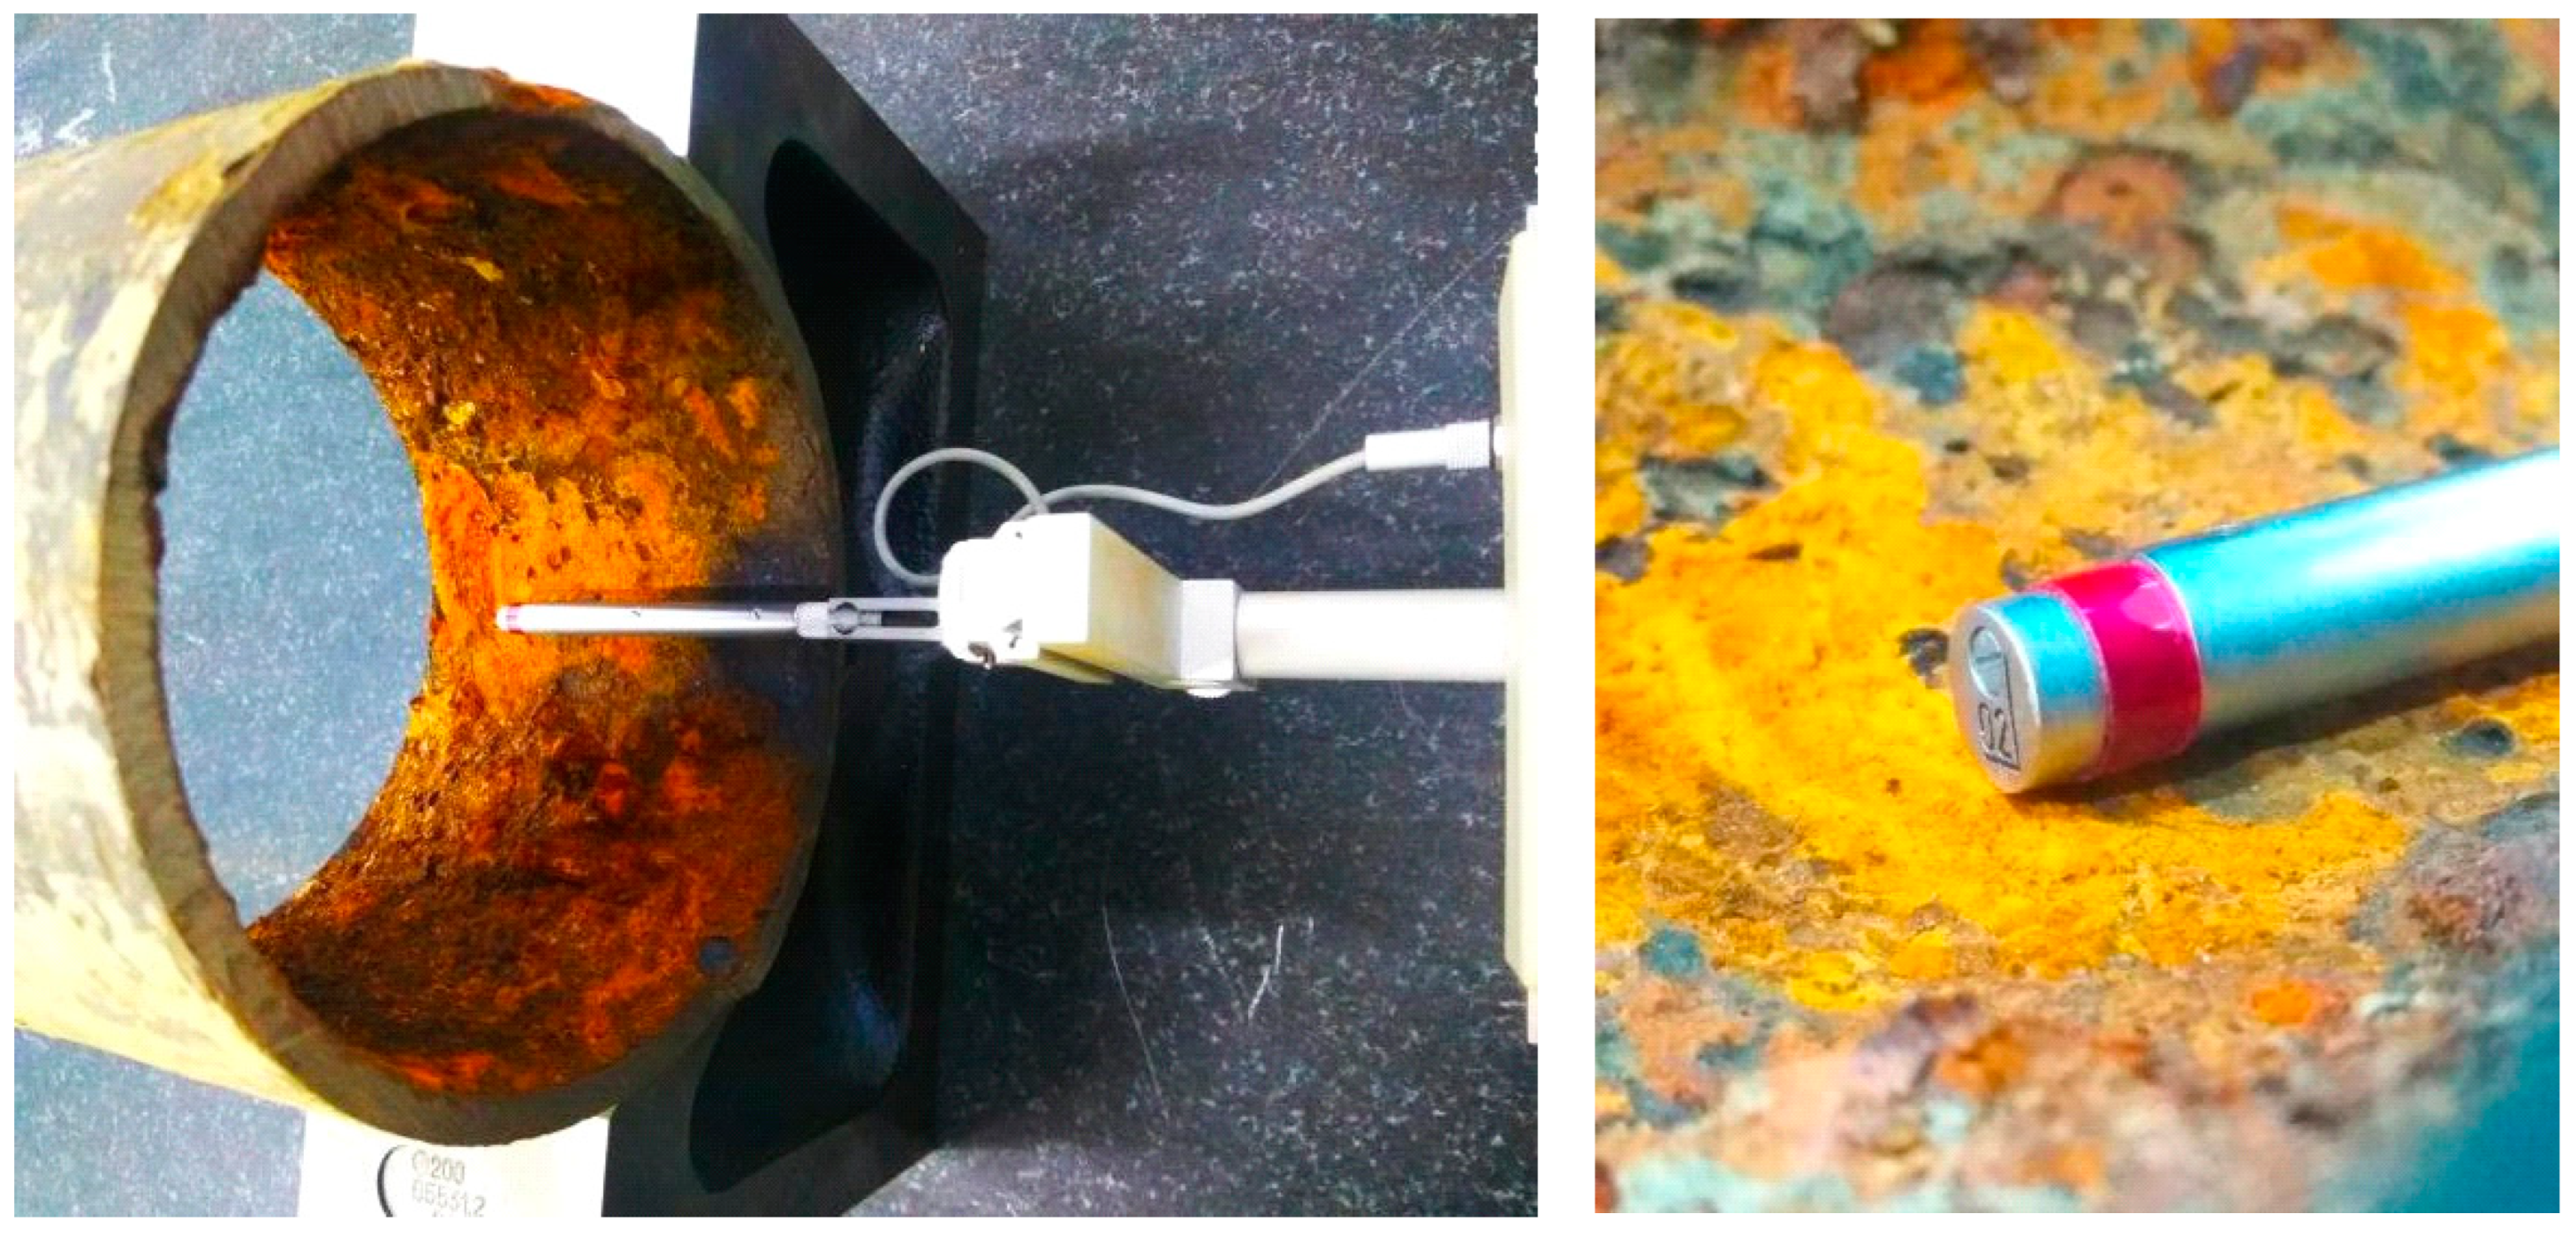
To assess surface roughness, the direct contact measurement method was employed. A Surtronic 3+ Taylor Hobson profilometer was utilized for this purpose. The measurement involved using a sensing touch with a specific rounding radius, as depicted in
Figure 3. It is advisable to measure the surface roughness on both incrustation-free and incrustation-affected surfaces.
The hardness of the samples was determined using the Brinell hardness test, performed in accordance with the ISO 6506-1 standard [
41]. The test involves applying a specific test loading force (F) to press a carbide ball with a diameter (D) into the surface of the tested material. The Brinell hardness (HBW) is calculated as the ratio of the loading force (F) to the surface area of the indentation (S).
For non-metallic materials, hardness was determined through conversion using the Shore reflection test, following the ISO 2039-1 [
42] and ISO 868 [
43] standards. This test involves determining hardness based on the rebound of a weight (ball or diamond point) dropped from a specified height onto the tested material. The impact of the weight causes plastic deformation of the material and the absorption of some of the weight’s energy, resulting in reduced rebound height. Shore hardness (HSh) was measured using a Shore scleroscope.
Both the directly measured and recalculated values for hardness, according to Brinell (HB,) were included in the multi-criteria evaluation, considering metallic and non-metallic materials.
The physical and chemical characteristics of the water were measured in the analysis laboratories of our partner organization, VVS Inc., Košice, Slovakia. The results of these measurements were kindly provided to us to conduct the research.
3.4. Saaty Matrix
To establish priorities among individual factors, we utilized Saaty’s matrix as the foundation for a multi-criteria evaluation of the transport system and the transported medium. Saaty’s Matrix, also known as the Analytic Hierarchy Process (AHP), is a decision-making tool that involves pairwise comparisons to determine the relative importance or preference of criteria or alternatives. It uses crisp values (whole numbers) in the pairwise comparison matrix and relies on a precise mathematical framework for calculating priorities.
The first step in prioritizing the factors involved determining their significance within the matrix. We employed a 5-point scale to assess significance, ranging from the least significant factor (assigned a value of 1) to a slightly significant factor (2), an average factor (3), a significantly significant factor (4), and a strongly significant factor (5).
Factors that were determined to be the least significant (1) or slightly significant (2) were excluded from the evaluation. Consequently, the scale shifted significantly towards the right, focusing on more impactful factors.
The following factors were excluded from the evaluation: G1, G8 to G10, G12 to G14, F3, CH3, CH5 to CH6, CH8, and P1 to P4. The decision to exclude these factors was based on their limited influence on the resulting water quality within the incrustation of the internal environment of the pipe system. Additionally, some factors could not be modified due to technical and/or legislative requirements governing the supply of municipalities.
Factors rated as average (3) include G11, G15, and CH7. Significantly significant factors (4) include G2, G4 to G7, F1 to F2, F4 to F5, CH1 to CH2, CH4, and I1 to I2. Strongly significant factors (5) include G3, G16 to G17, and P5.
The next step involved comparing the factors to each other using descriptors on a scale of 1 to 9.
Table 6 presents Saaty’s matrix, displaying the compared factors and their evaluations. The results in Saaty’s matrix for the Analytical Hierarchy Process were derived through collaborative negotiation and agreement among a team of six experienced experts who have devoted significant time to studying incrustation and its accelerators.
After the descriptors have been entered into Saaty’s decision matrix, a series of calculations is performed to determine the normalized eigenvector of the evaluation matrix, which corresponds to its absolute value to the largest real eigenvalue. The components of the eigenvector can be determined by taking the n-th root of the product of the elements in each row of the evaluation matrix [
44], as stated in relation (1).
The unstandardized weight of factor vi is calculated using relation (2).
To obtain the weighted score for determining the standardized weight of the factor or for evaluating variants based on individual factors, relation (3) is applied. In this relation, v
F represents the significance of the factor.
3.5. Multi-Criteria Analysis
The formation of incrustation is influenced by the independent variable of time and is affected by various criteria or factors. If a criterion reinforces the process, incrustation formation is significantly accelerated. Conversely, if a criterion weakens it, it has a slowing effect. When multiple criteria act simultaneously, they can either strengthen, weaken, or negate each other.
To comprehensively assess the dynamics of incrustation processes over longer time periods (months, years), it is suitable to employ a complex multi-criteria method. This approach can gather information from specific locations (such as fault locations) to determine the extent of incrustation processes.
Selecting the appropriate criteria for evaluating incrustation formation is challenging due to the numerous factors involved, and monitoring all of them would be financially unfeasible.
In the evaluation methodology of incrustation formation, it is crucial to work with a restricted number of characteristic criteria that effectively depict the incrustation process, can be determined easily, and can be subsequently analyzed statistically. Therefore, the selection of criteria is a precise and expert-driven procedure that corresponds to the selection of elements in the statistical file.
To facilitate the processing of statistical data, it is essential for each criterion to be quantifiable, meaning it can be expressed numerically [
45]. This numerical value corresponds to the respective impact on incrustation formation.
From a theoretical standpoint, the task at hand involves determining the dependent variable (regressand), which is the target measure of incrustation. This can be achieved by using independent variables (regressors), such as initial values (e.g., criteria). We can represent this concept in a general matrix as “Matrix 4”.
The components of the Y matrix represent measurable data related to the interaction between the transport pipeline system and the substance being transported. These data are considered statistical features or descriptors. This terminology is preferred, as it avoids assuming that we have direct knowledge of the quantities that directly influence the regressor’s value. We assume that the formation of incrustation at a specific i-th location is described by the n-dimensional vector Yi, which can be expressed symbolically as (5).
It is rarely possible to compare two locations on the basis of their vectors, because in vector calculus, it is true that two vectors of the same dimension are equal (or not equal) to each other only if the sign of equality (or inequality) applies to all components of the vectors, i.e., for all j = 1, 2, …, n, while not a single relation may hold.
The issue of vector comparability in practical applications requires careful consideration. During the examination of the proposed and existing recorded statistics related to incrustation formation, several specific aspects have emerged that need to be addressed as a priority:
Descriptors with both positive and negative impacts.
Variability of descriptors, such as temperature [°C], conductivity [mS/m], distance [m], etc.
Specific orders of descriptors, with some being on the order of 10^2 and others on the order of 10−2.
Interrelationships among descriptors.
Weighting of descriptors.
To begin, we start with a 4 × 4 matrix Y = (Yij), containing fundamental information about incrustation formation. It is essential to include all available descriptors in the matrix, as the proposed methodology’s approximation of the effect will be more accurate with a larger number of elements in the matrix (n). Each element Yij represents quantitative values attained by location i = 1, 2, …, m for descriptor j = 1, 2, …, n.
Columns j representing descriptors with evidently positive incrustation effects are reversed by multiplying them by minus one, resulting in the matrix A = (aij). To ensure vector comparability, an additional row is added to matrix A, representing a hypothetical location called the artificial vector U = (uj). This artificial vector serves as the basis for calculations and comprises the typical permissible values for the descriptors. The resulting matrix constructed in this manner is denoted as A+.
Throughout this process, we construct the new matrix to satisfy relation (7).
While the following equation is valid
The vectors of real locations can already be compared with this vector, because it is guaranteed to be smaller than any vector of a real location, while (9) holds that:
The possibility of summation, i.e., elimination of variability and difference of orders, was solved on the principle of discrimination, in such a way that the positive difference a
ij—u
j is divided by the standard deviation s
j (Equation (10)), while the dimension is the same as the values from which it was calculated and also adjusts the order of the numbers:
From the elements of the matrix A, we get to the elements of B using the following transformation (11):
The elements of the matrix B = (bij) are already measurable dimensionless numbers, i.e., summable. In addition, the standard deviation in the denominator also fulfills the role of severity—the weight of the descriptor.
The question of mutual relations among descriptors is taken into account using the correlation matrix R = (
rjl), which provides the basis for the calculation of reduction constants. We calculate their value from the following relationships:
The reduction constants mentioned here disregard the multiplicative effect of a specific influence that arises when assessing the formation of incrustation in various scenarios using different descriptors. The resulting relationship, as presented in Equation (11), takes the following form:
where
Qj is a value of the incrustation formation in the i-location,
aij is the adjusted value of the j-descriptor in the i-location,
uj is the value of the j-component of the artificial vector,
sj is the standard deviation of the adjusted j-descriptor,
kj is reduction constants.
Assessment of incrustation formation, as determined through the aforementioned calculation multi-criteria method, can also be represented visually. By monitoring changes in total incrustation over time, we can observe the dynamics by using shorter time periods and recording current incrustation values.
Through the application of the multi-criteria evaluation methodology on statistical sets, valuable insights have been gained regarding the optimal number of evaluation criteria required to cover the entire monitored area. However, further refinement of the methodology is necessary to accurately capture the effects of criteria that, when acting jointly, significantly contribute to incrustation formation.
One possible approach is to exclude the consideration of existing correlation dependencies among these criteria in the methodology. By doing so, the numerical support for their accelerating influence is disregarded, resulting in a more negative evaluation of the resulting variable Qi.
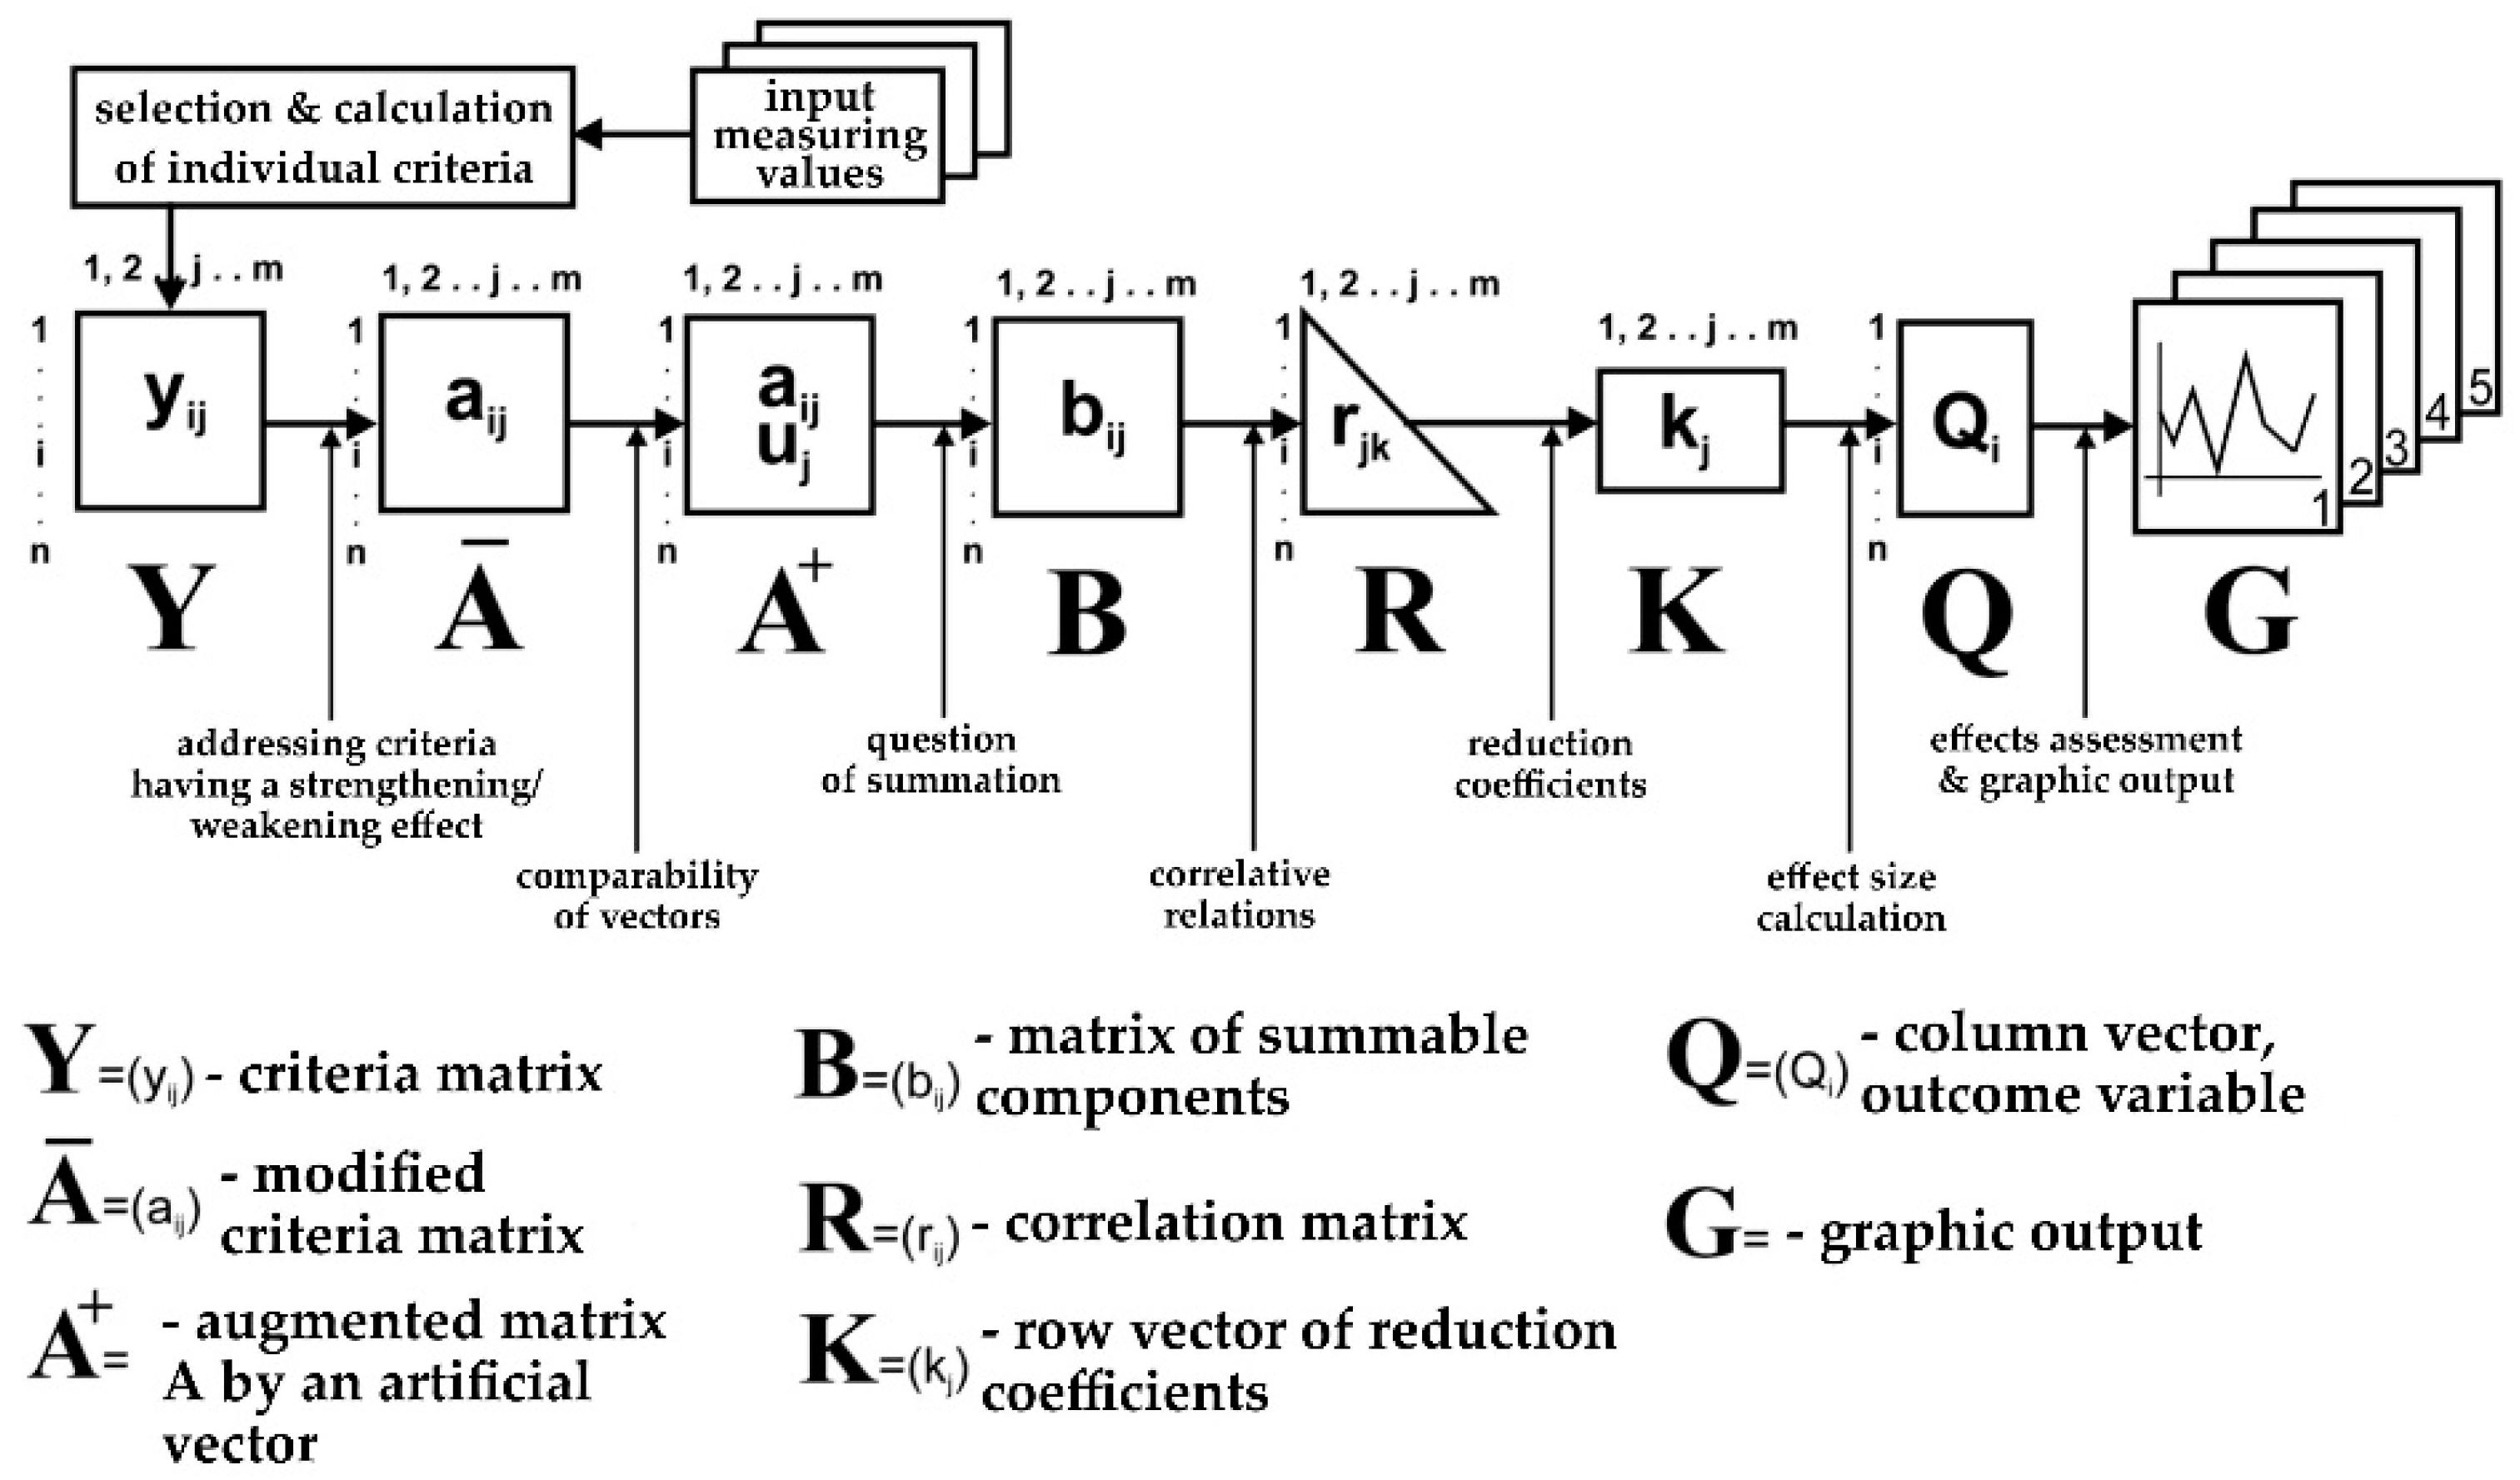
To enhance comprehension of the individual steps, we have included a simplified schematic representation of the procedure in
Figure 4. This visual aid provides a clear overview of the process.
5. Discussion
This paper presents a holistic approach to address the complex issue of removing incrustation within piping systems. Our objective was to comprehensively understand this task and propose appropriate de-incrustation processes, whether mechanical, physicochemical, or chemical, for further research.
Throughout our study, we recognized several general principles that are commonly applicable in practice:
The technically and/or economically optimal solution may not necessarily be the most socially acceptable.
The most socially acceptable solution may not always be the most suitable in all aspects.
The most suitable solution may not necessarily be the absolute best overall.
In developing our solution, our aim was to find an effective approach that would deliver lasting value to the stakeholders affected by incrustation. We strived to align our actions with the actual conditions observed in the selected exposed locations. As a result, we formulated a three-stage optimization process to enhance the overall solution.
By undertaking this research, we sought to provide a comprehensive and effective approach that caters to the needs of stakeholders, while considering the practical realities of the problem at hand.
5.1. Optimization of the Solution—First Stage
The optimization of the solution is carried out in a tertiary manner, and the pilot or first stage of optimization encompasses the following steps:
I./(1) Initially, a selection of 41 factors was made, including 18 geometrical characteristics of the transport system (
Table 1), 5 physical factors related to the transported drinking water (
Table 2), 11 chemical factors (5 associated with the transported water and 6 pertaining to pipe materials,
Table 3)), 5 operational factors (
Table 4), and 2 incrustation factors (
Table 5). These factors were considered for the solution process across 17 collection points or locations.
I./(2) The selected interaction factors underwent an initial prioritization process, which involved (
Table 7):
I./2(a) Polarization of the factors.
I./2(b) Determination of the trend exhibited by each factor.
I./(3) Subsequently, a second narrowed selection was made, resulting in 22 interaction factors.
I./(4) Prioritization of the narrowed set of interaction factors was performed using Saaty’s method, with a focus on incrustation formation (
Table 6). This process involved:
I./(4a) Assessing the significance of these factors.
I./(4b) Comparing the factors using descriptors.
I./(4c) Calculating the weighted score for each individual factor (according to Equations (1)–(3)).
During the first stage, an expert assessment was conducted to determine the order in which these factors would enter the multi-criteria evaluation. This order holds significant importance in obtaining relevant results, as the highest priority is given to the factor that is considered the “strongest” in terms of inducing incrustation.
5.2. Optimization of the Solution—Second Stage
The second stage of optimization included a complex multi-criteria evaluation procedure:
II./(1) Creation of the order of interaction factors (according to I./4c);
II./(2) Determination of the smallest numerical value for each interaction factor;
II./(3) Calculation of the arithmetic mean of the factor;
II./(4) Calculation of the standard deviation of the factor (according to Equation (10));
II./(5) Calculation of correlation coefficients for compared factors (according to Equation (12));
II./(6) Calculation of the reduction constant for individual factors (according to Equation (13));
II./(7) Calculation of the incrustation load for individual locations (according to Equation (14));
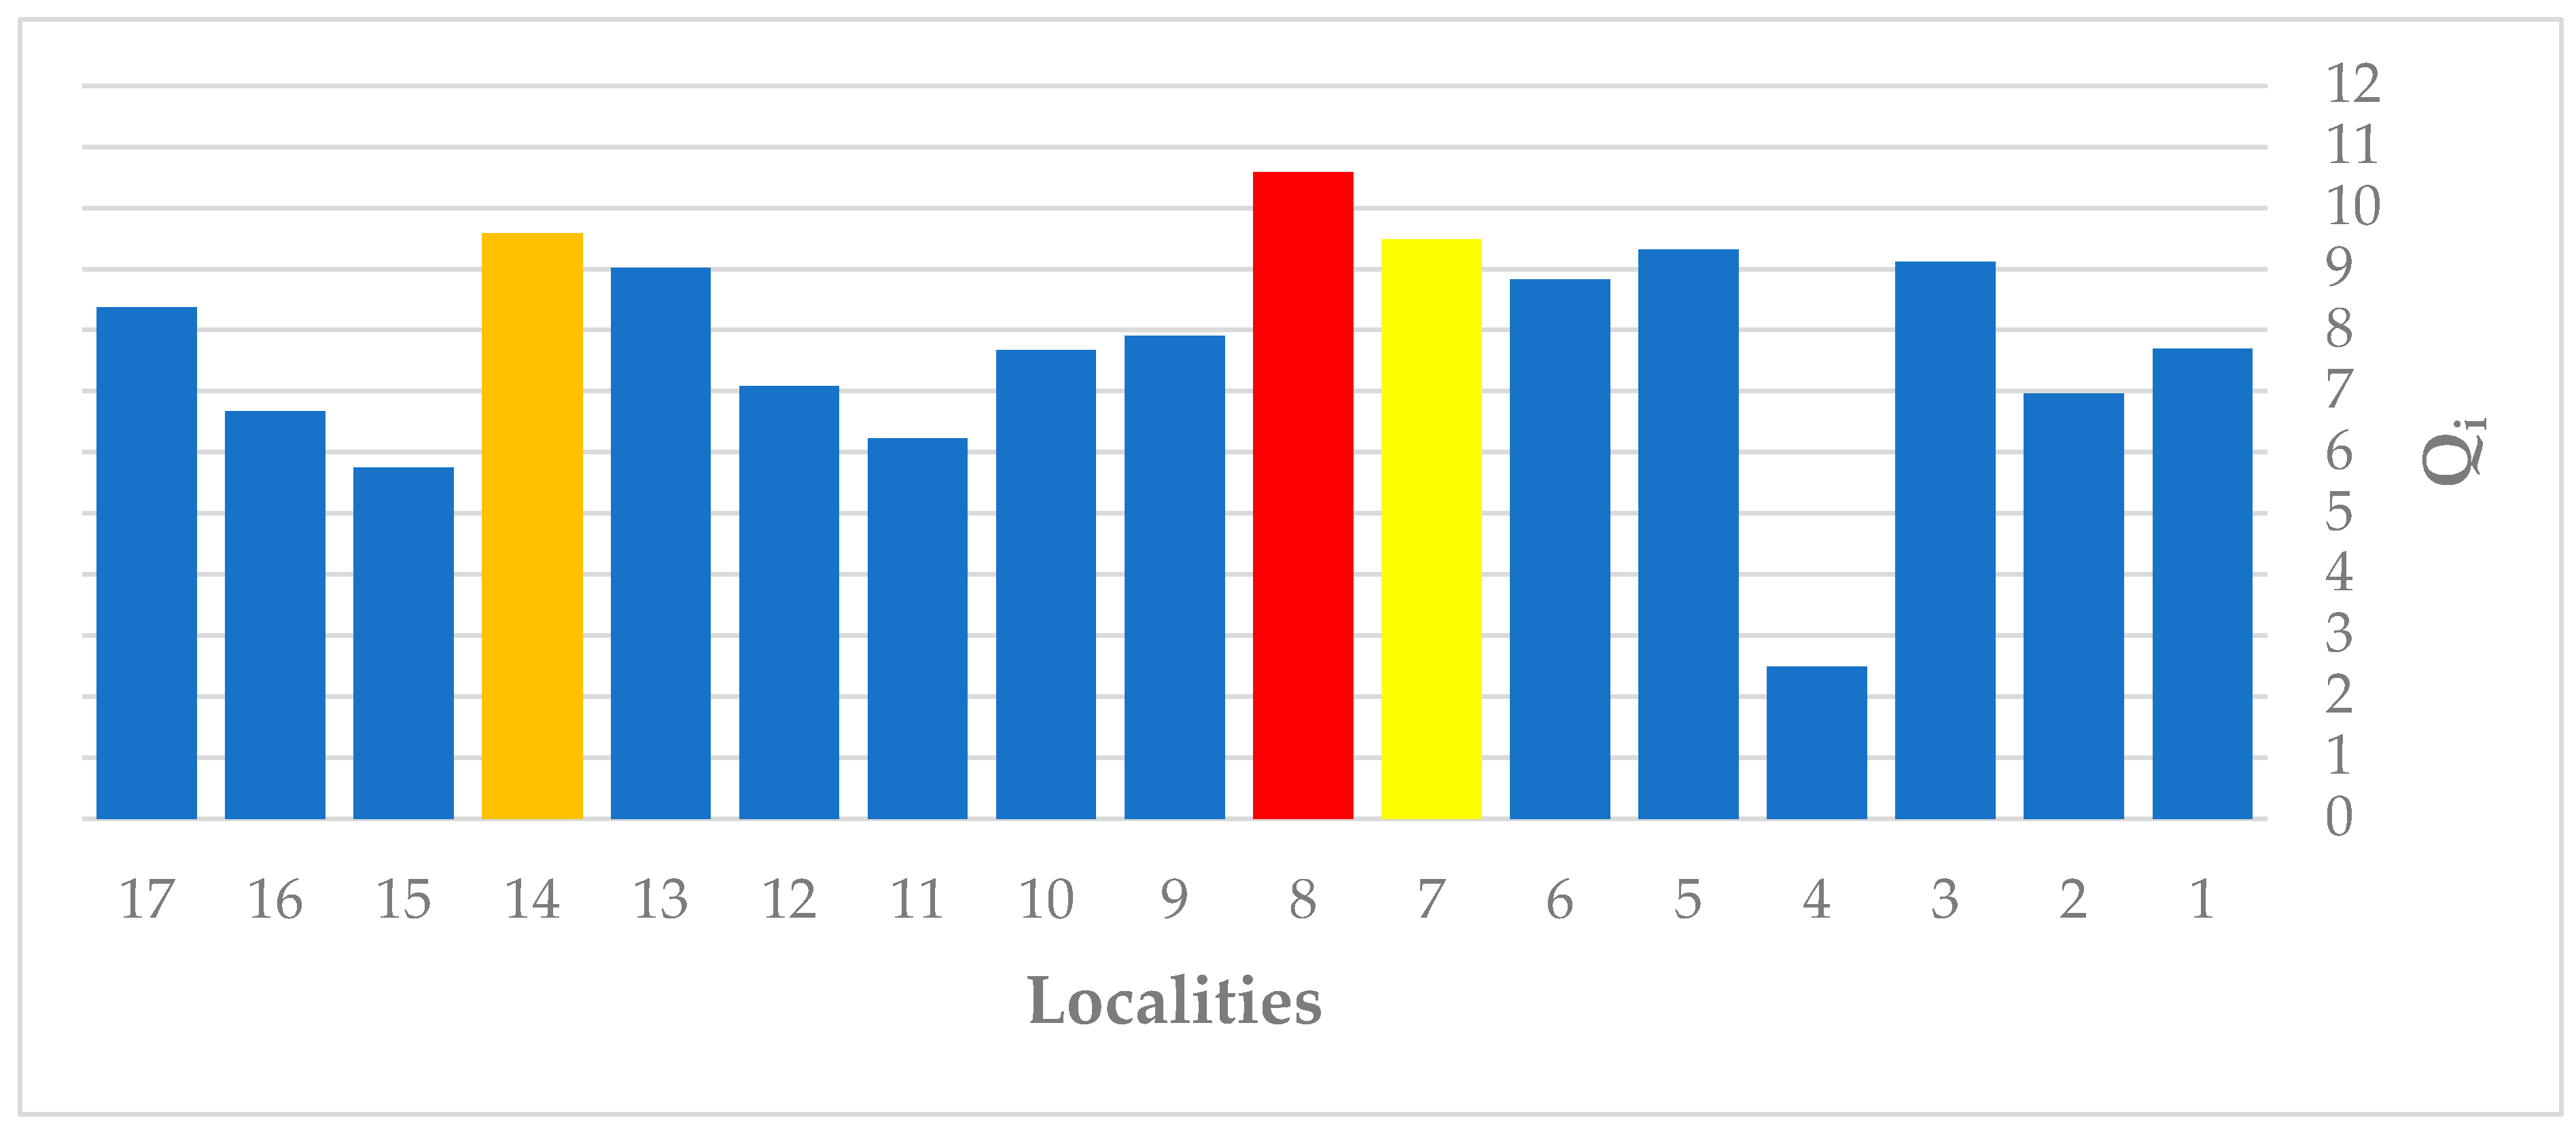
II./(8) Determination of the most heavily loaded areas due to incrustation processes.
During the second stage, the locations were arranged based on the incrustation load. Notably, the first three locations examined in this stage had a cast iron pipe transport system for drinking water. This finding provided valuable insights into the potential cause of the incrustation load and served as a basis for initiating the solution in the third stage. This finding holds valuable implications for predicting future failures in the water transport system. It is specifically linked to properties of cast iron, such as fragility and the roughness of its internal environment. The rougher surface facilitates the initiation of incrustation deposits at a faster rate compared to pipe materials with a smoother internal space, which are typically more durable and resistant. It is in this stage that experimental and calculated results are utilized and matched.
The optimization of the solution revolves around leveraging and utilizing the outcomes of experiments and the expert-driven multi-criteria evaluation of interaction factors related to the pipeline transport system and the transported drinking water. Through careful measurements and calculations, we identified location No. 8 as the most heavily loaded area, with an incrustation load value of 10.59.
5.3. Optimization of the Solution—Third Stage
The last third stage of optimization includes correction, corrective measures, prevention, and preventive measures, i.e., reduction of incrustation formation to a negligible level or even its elimination.
It is advisable to propose preventive and corrective measures only where it is really required so that resources (financial, human, material, etc.) are not wasted. For this reason, it is necessary to know exactly which location is the most loaded and why it is so. The remedy is defined as a measure to eliminate a detected deficiency, but a corrective measure, in addition to eliminating the deficiency, also removes its cause and is aimed at preventing its recurrence [
46].
Designing the optimal combination of distribution water system parameters varies according to the territorial location. Our most important consideration was to reduce scale build-up in the pipes, while ensuring the required water quality. An effective procedure includes:
III./(1) Division of transport system factors into potentially changeable and unchangeable;
III./(2) Division of potentially changeable factors of the transport system into those that affect incrustation and those that do not;
III./(3) Breakdown of potentially changeable factors that affect incrustation:
III./(3a) According to the strength of their influence,
III./(3b) According to the level of difficulty, implement changes associated with them (time, technical, material, financial, human, know-how, etc.),
III./(3c) According to the duration of the change (temporary, permanent),
III./(3d) According to the request/need,
III./(3e) According to linked parameters (strengthening effect, neutral effect, weakening effect);
III./(4) Prioritization of parameters taking into account (3a) to (3e);
III./(5) Combination of prioritized parameters for the given location;
5.4. Optimization of the Solution—Continuation of the Third Stage in Future Research Tasks
III./(6) Design and development of a technical solution (another research task), e.g., selected water treatment [
47,
48,
49,
50,
51,
52];
III./(7) Implementation of a technical solution (another research task);
III./(8) Control and maintenance of the technical solution (another research task);
III./(9) Continuous improvement of the combination of parameters for a given location (another research task), e.g., when using a standard or standards for management systems.
Based on the findings, it is recommended to introduce a practical tool to implement the results of the solution. One such tool is the implementation of management systems based on the ISO 46001:2019 standard, known as WEMS (Water Efficiency Management Systems) [
1].
The proposal to adopt and maintain a management system supported by this standard is an integral part of the preventive measures suggested. It is evident that this standard will effectively facilitate cooperation in optimizing the interaction between the transport system and the transported medium to ensure the required water quality [
13].
Management system standards primarily serve to support management and leadership functions within an organization’s overall structure. The WEMS standard, being applicable to various sectors, emphasizes the end consumers and their water quality requirements. It serves as an excellent tool for establishing robust organizational water management practices.
Furthermore, according to guidance [
53], it is possible to develop other integrated management systems in the future based on ISO 46001. Some recommended integrated standards include ISO 9001 [
54], ISO 14001 [
55], ISO 22301 [
56], ISO 28001 [
57], and ISO 50001 [
58,
59]. These consolidated standards can further enhance the comprehensive management approach.


 ,
, 


