Article

The Mechanisms Controlling the CO2 Outgassing of a Karst Spring–River–Lake Continuum: Evidence from Baotuquan Spring Drainage Area, Jinan City, Northern China

1
Shandong Engineering Research Center for Environmental Protection and Remediation on Groundwater, 801 Institute of Hydrogeology and Engineering Geology, Shandong Provincial Bureau of Geology & Mineral Resources, Shandong Provincial Geo-Mineral Engineering Exploration Institute, Jinan 250014, China
2
Chongqing Key Laboratory of Wetland Science Research of the Upper Reaches of the Yangtze River, School of Geography and Tourism Science, Chongqing Normal University, Chongqing 401331, China
3
Shandong GEO-Surveying & Mapping Institute, Jinan 250002, China
*
Authors to whom correspondence should be addressed.
These authors contributed equally to this work.
Water 2023, 15(14), 2567; https://doi.org/10.3390/w15142567
Submission received: 7 June 2023 / Revised: 5 July 2023 / Accepted: 10 July 2023 / Published: 13 July 2023
(This article belongs to the Special Issue Karst Dynamic System and Its Water Resources Environmental Effects)

Abstract

:
The significance of CO2 emissions at the water–air interface from inland water bodies in the global carbon cycle has been recognized and is being studied more and more. Although it is important to accurately assess CO2 emission flux in a catchment, little research has been carried out to investigate the spatio-temporal variations in CO2 emissions in view of a water continuum. Here, we systematically compared the differences and control factors of CO2 degassing across the water–air interface of a spring–river–lake continuum in the discharge area of Baotuquan Spring in July 2017, which is a typical temperate karst spring area in Jinan city, northern China, using hydrogeochemical parameters, stable carbon isotope values, and CO2 degassing flux. Affected by the pCO2 concentration gradient between the water and ambient air, the spring water showed a high CO2 degassing flux (166.19 ± 91.91 mmol/(m2 d)). After the spring outlet, the CO2 degassing flux in the spring-fed river showed a slight increase (181.05 ± 155.61 mmol/(m2 d)) due to river flow rate disturbance. The river flow rate was significantly reduced by the “blockage” of the lake, which promoted the survival and reproduction of phytoplankton and provided favorable conditions for aquatic plant photosynthesis, increasing the plankton biomass in the lake to 3383.79 × 104/L. In addition, the significant decrease in the dissolved inorganic carbon (DIC) concentration and the increase in the δ13CDIC values in the lake also indicated that the photosynthesis of the lake’s aquatic plants resulted in a significant decrease in the pCO2 concentration, thus limiting the amount of CO2 off-gassing (90.56 ± 55.03 mmol/(m2 d)).

1. Introduction

Although inland water bodies represent only a small fraction of the Earth’s surface, freshwater aquatic ecosystems play an important role in the global carbon cycle and can even influence the regional carbon balance [1]. In recent years, there has been great interest in CO2 degassing processes in freshwater (rivers, reservoirs, lakes, etc.), and studies have shown fluxes as high as 1.4 to 2.1 PgC/yr, which is comparable to or even higher than the 0.9 PgC/yr flux of inorganic and organic carbon delivered to the ocean by rivers [1,2]. Such a large CO2 source will undoubtedly require additional sinks to balance it, which puts more pressure on the uncertainty of “residual land sink” (2.5 PgC/yr) that we are currently facing, and prompts us to reconsider the model of the global carbon budget [3]. Therefore, an in-depth understanding of the inland freshwater CO2 degassing process is of great importance to the regional and even global carbon balance.
Typically, CO2 concentrations in inland surface waters are much higher than in the atmosphere. Most early published estimates of pCO2 in water bodies focused on lakes, estuaries, a few large rivers, and inland boreal waters [4,5,6,7,8]. After decades of research, the spatial and temporal variability of CO2 concentrations and fluxes in inland waters has been fairly well described and found to be controlled mainly by the terrestrial environment, aquatic metabolic processes, hydrological dynamics, and climate [9,10,11,12,13,14]. In addition, human activities increase carbon input through altering environmental factors, which ultimately affect CO2 concentrations and fluxes in inland waters [15,16,17]. In conclusion, the factors influencing CO2 concentrations and fluxes in inland waters are complex [18,19], including biological, chemical, and physical factors operating at various temporal and spatial scales, and exhibit significant spatial and temporal variability driven by combinations of environmental factors [20,21].
In recent decades, a large number of dams and reservoirs have been built for the purpose of flow regulation or power supply, resulting in the loss of river connectivity. Currently, there are more than 2.8 million reservoirs around the world with a reservoir area greater than 103 m2 [22], so only 37% of rivers with a length of more than 1000 km remain free-flowing along their entire length [23]. Thus, a large number of “river-lake (reservoir)” systems have been formed, which can also be understood as the concept of sequence discontinuity mentioned in river ecosystems (the serial discontinuity concept) [24]. The system formed by damming significantly affects the biogeochemical carbon cycle of the river, especially the deepening of water depth, the slowing of flow velocity, and the inundation of riparian vegetation, which profoundly affects the concentration and flux of river CO2 [25]. In karst areas, due to surface water shortages and flood disasters, many reservoirs have also been built for water supply and flood control in southern China, the Balkans, the Dinaric region, the Apennines, Iberia, the eastern United States, etc. [15,22,25,26,27]. Therefore, a spring (groundwater)–river–lake/reservoir continuum can be formed due to natural hydrological condition changes in the karst area, which is also a “carbon-rich” system because the rich bicarbonate contents in water result from the interaction of CO2–H2O–CaCO3. This may lead to higher CO2 degassing flux and more active carbon cycle processes in karst areas.
However, up to now, few studies have focused on CO2 degassing flux across the water–air interface in the karst spring (groundwater)–river–lake/reservoir continuum. In addition, the highly complex spatial and temporal variability of karst “carbon-rich” springs and rivers (streams) can also have a significant impact on the carbon emission processes across the water-air interface of their reservoirs (lakes) downstream, which is not well understood. Therefore, it is more important to explore the variability and control mechanisms of CO2 fluxes at the karst spring–river (stream)–lake (reservoir) water–air interface as a whole. Based on this, we selected a typical northern China karst area—Jinan Baotuquan Spring drainage area (BTQ)—as the study area and set up on-site monitoring and discrete sampling points in springs, rivers, and lakes (Daminghu Lake) where the characteristics of water bodies are inherited. Tests on the CO2 degassing rate across the water–air interface, the phytoplankton population, and the physicochemical properties of water bodies were carried out. The objectives of this study are to explore the spatial differences and the control mechanism of CO2 degassing at the water–air interface of the karst spring–river–lake continuum.

2. Materials and Methods

2.1. Study Area

The Jinan Baotuquan Spring drainage area (116°40′30″~117°14′10″ E; 36°14′50″~36°46′10″ N) is located between the north wing of Mount Tai in the south and the piedmont plain in the north and north-central part of Shandong Province, north China (Figure 1). It has a warm temperate continental climate with four distinct seasons. The annual average temperature is 13.8 °C, and the annual average precipitation is 647.9 mm. The seasonal, interannual, and spatial variations of precipitation are obvious.
The BTQ is bordered by the Dongwu Fault and Mashan Fault to the east and west, respectively. And these two faults are weakly permeable in the south part and permeable in the north. The southern boundary is the ridgeline of the Tarzan Mountains and the intrusive rock mass in the north. In the BTQ, the major stratigraphic sequences include the Quaternary strata, the Ordovician strata, the Cambrian strata, and the New Archean Taishan Group. The major karst aquifers are the upper Cambrian and Ordovician stratum, and the lithology is composed mainly of limestone, dolomite limestone, gray dolomite, dolomite, and mendacious limestone.
The absolute ground elevation gradually decreased from 500~600 m in the southeast to 25~50 m in the northwest in the Baotuquan Spring catchment. The Baotuquan Spring catchment is generally a north-dipping monoclinic structure with the Paleozoic strata as the main body, which is consistent with the topographical distribution (Figure 2). Due to the specific topographical and geological structural conditions, after the atmospheric precipitation in the southern mountainous area recharges the karst aquifer, karst groundwater in the Cambrian and Ordovician causes carbonate rock formations with strong karstic condition movement from south to north until they encounter northern magmatic rock bodies and carboniferous rocks. Karst groundwater was blocked and accumulated in the contact zone of carbonate and non-carbonate rock and exposed in the form of rising springs, forming four karst spring groups of Baotuquan Springs, Heihu Springs, Zhenzhu Springs, and Wulongtan Springs in Jinan City (Figure 2 and Figure 3). After these springs were exposed, the spring water started to flow northward along a river and subsequently flow into Daminghu Lake.

2.2. Sampling and Analysis

2.2.1. Hydrochemical Field Parameters

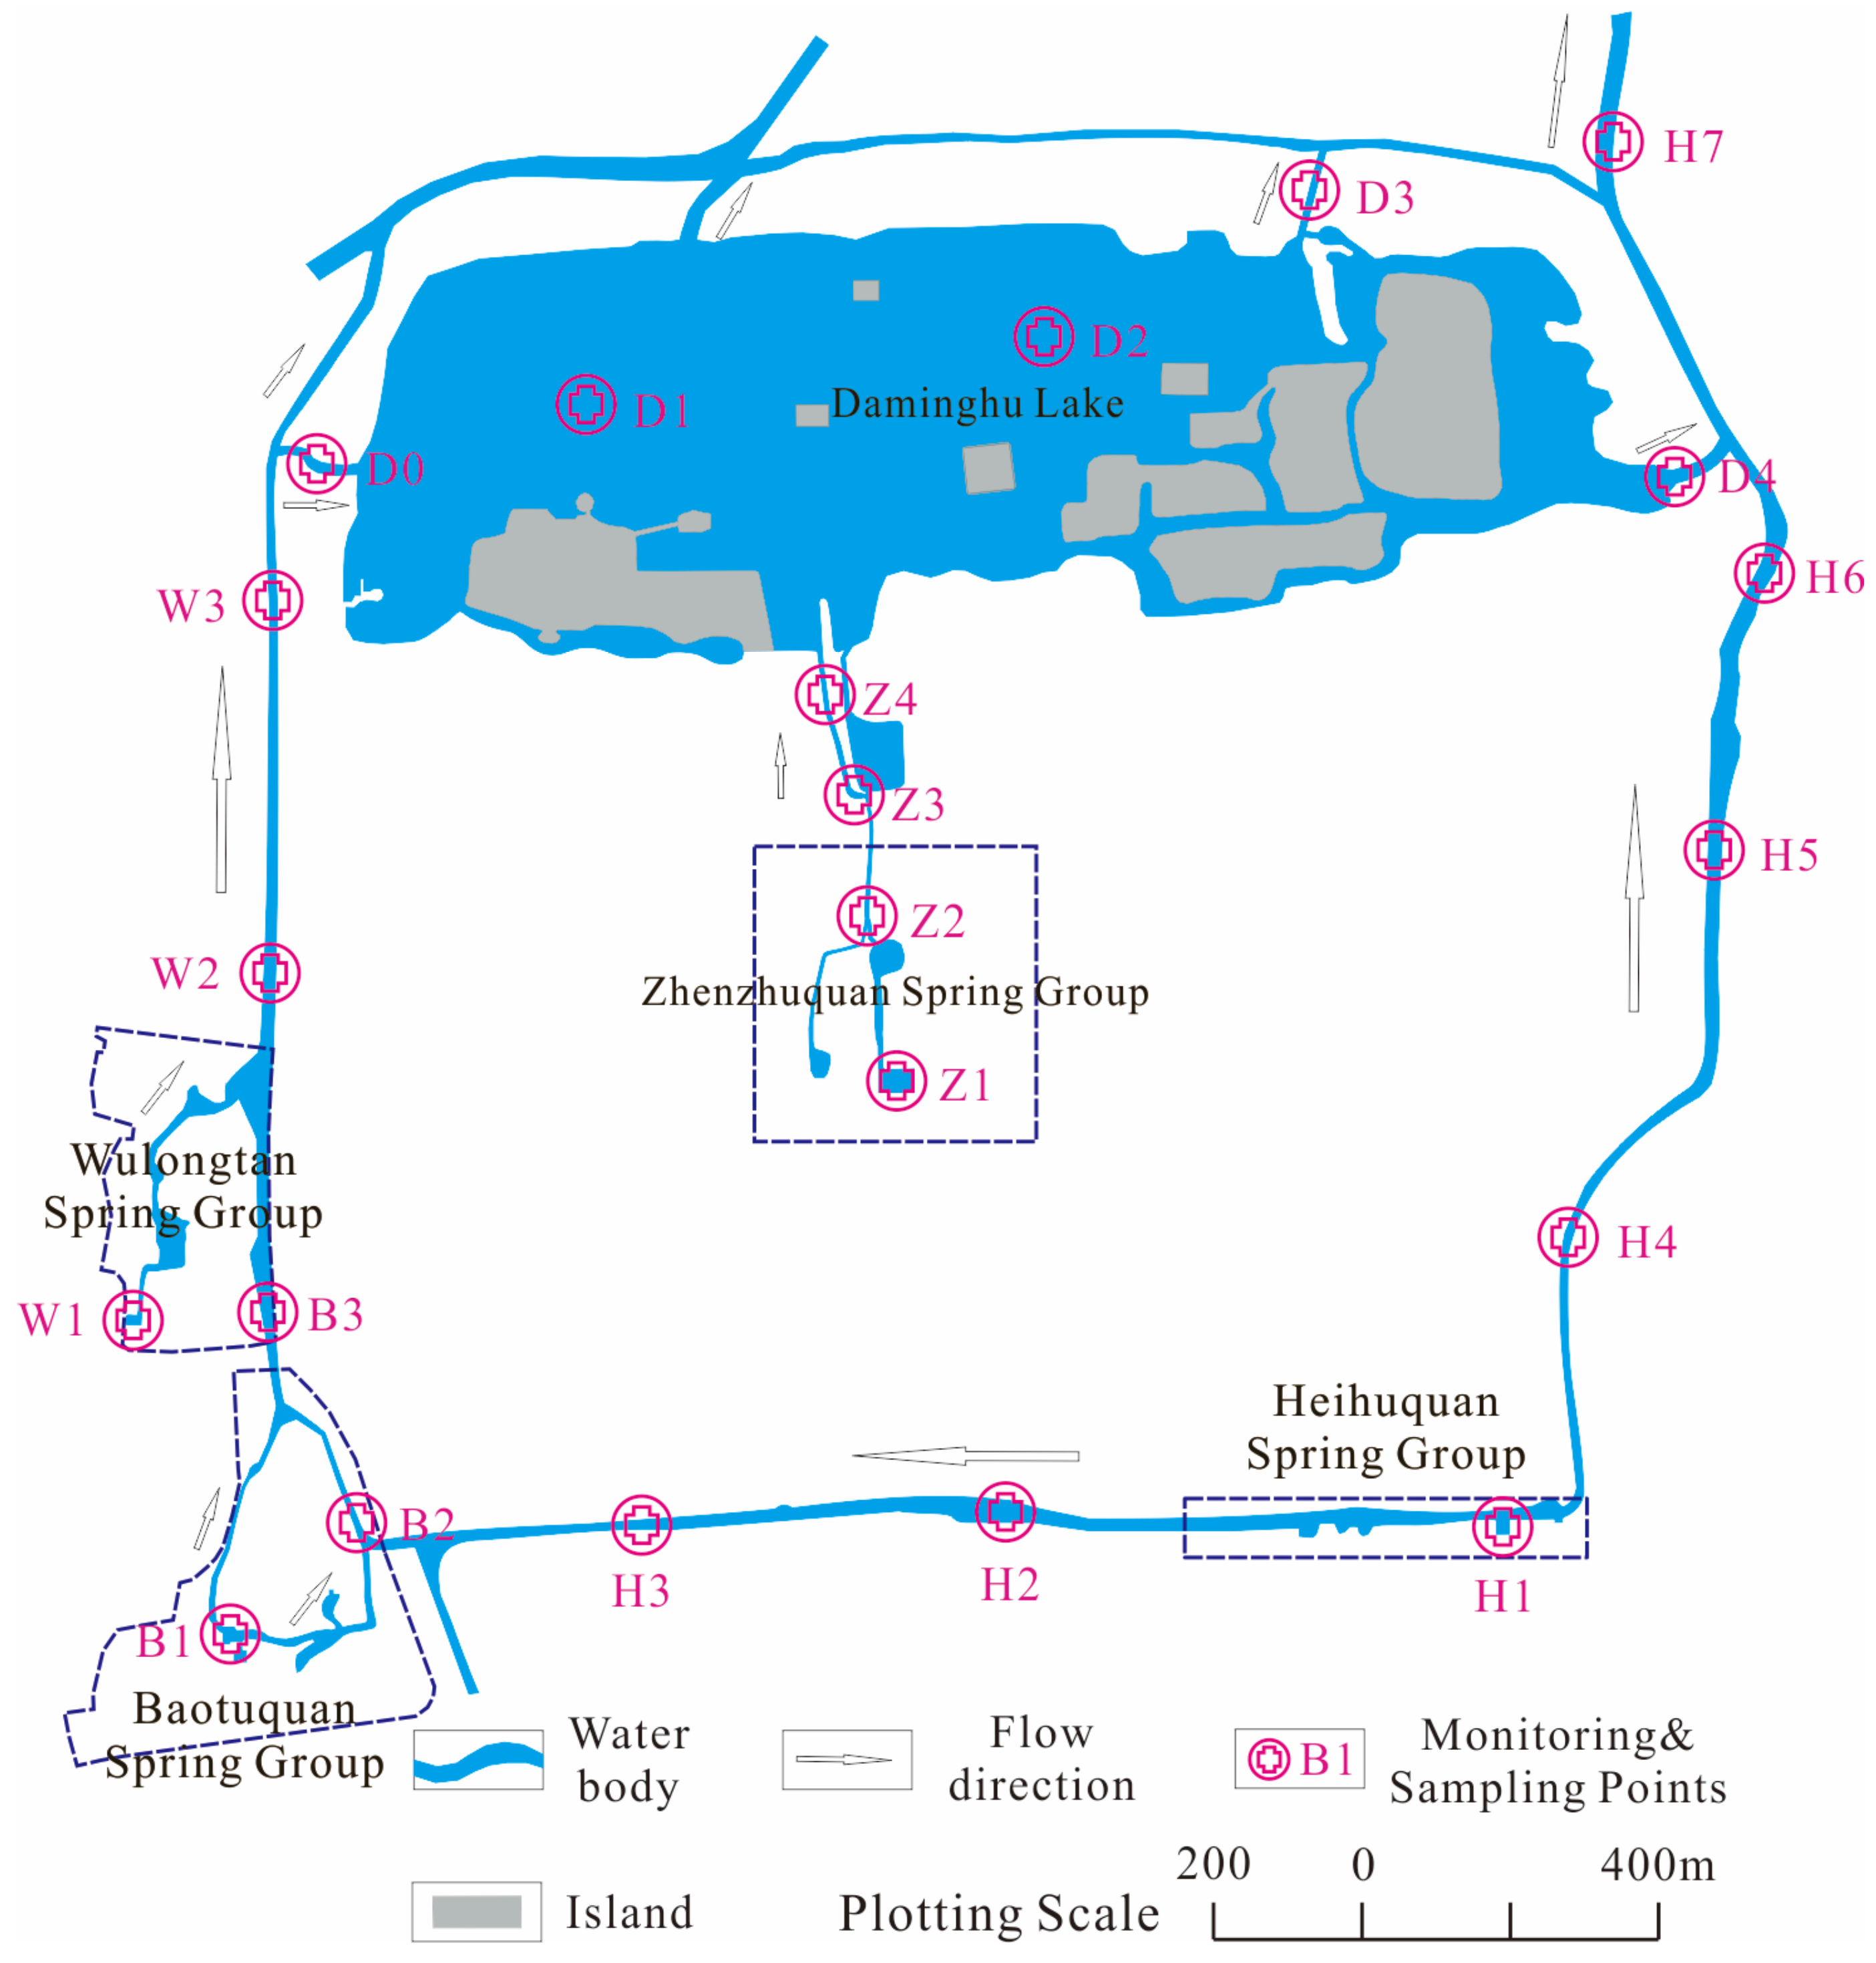
According to the research objectives of this study, we chose spring outlets, a spring-fed river, and Daminghu Lake as the sampling and monitoring sites (Figure 3). A total of 20 monitoring sites were set up, of which the spring, river, and lake include 4 points (H1, B1, W1, and Z1), 10 points (H2, H3, H4, H5, B2, W2, D0, Z2, Z3, and Z4), and 6 (D1, D2, D3, D4, and H6 and H7), respectively (Figure 3). Among them, although H6 and H7 belong to rivers, they are classified as lakes because they are greatly affected by lake water.
A multi-parameter meter (WTW Multi 3630 IDS, WTW GmbH, Weilheim, German) was employed to monitor the in situ water temperature (T), pH, dissolved oxygen (DO), and specific conductivity (SpC) at these 20 sites during July 2017. According to the manufacturer’s specifications. the meter was calibrated prior to use. The resolutions for temperature, pH, DO, and specific conductivity (SpC) were 0.1 °C, 0.01 pH unit, 0.01 mg/L, and 1 μS/cm, respectively. The river and lake depths were measured manually on site.

2.2.2. Discrete Sample Collection and Analysis

Discrete water samples were collected at all 20 sites using syringes. The collected water samples were filtered through a 0.45 μm cellulose acetate membrane and stored in pre-rinsed high-density polyethylene (HDPE) bottles for major ion analyses. The samples for cations were acidified to pH < 2 with 7 M HNO3. Unfiltered sub-samples were titrated for HCO3 in the field after collection with an accuracy of 0.05 mmol/L using a portable testing kit by Merck KGaA (Darmstadt, Germany). The samples of δ13CDIC were collected in 25 mL acid-washed dry HDPE bottles, and three drops of saturated HgCl2 were added to prevent microbial activity. All of the samples were stored in a portable ice box before they were delivered to the laboratory, where they were kept chilled in a refrigerator at 4 °C until analysis.
Major anions (Cl, SO42−, NO3) were measured by an automated Dionex, Sunnyvale, CA, USA, ICS-900 ion chromatograph based on the APHA 2012 method [29]. Major cations (Ca2+, Mg2+, K+, and Na+) were analyzed by ICP–OES (IRIS Intrepid II XSP, Thermo Fisher Scientific, Waltham, MA, USA) using a procedure based on the EPA method 200.7. The analytical errors were ±1.9%. The δ13CDIC values were analyzed using a MAT-253 mass spectrometer coupled to a Gas Bench II automated device with an analytical precision of ±0.15‰, following a modified version of the method by Atekwana and Krishnamurthy (1998) [30]. The δ13CDIC analysis was carried out in the Environmental Stable Isotope Lab., Chinese Academy of Agricultural Sciences, Beijing, China. The major anions and cations were analyzed in a laboratory at the 801 Institute of Hydrogeology and Engineering Geology, Shandong Provincial Bureau of Geology and Mineral Resources, Jinan, Shandong, China. The partial pressure of CO2 (pCO2) and the saturation index of calcite (SIc) were calculated using the hydrochemical datasets, including pH, water temperature, and concentrations of K+, Na+, Ca2+, Mg2+, Cl, SO42−, and HCO3 by the program WATSPEC [31].
According to the phytoplankton sampling regulations, water bodies with a depth of less than 2 m were sampled at 0.5 m underwater. Approximately 75 mL of Lugol’s solution was added to the 1500 mL water sample collected on site. After standing for 48 h, we removed the supernatant water and concentrated the remains to 45 mL. We took 0.1 mL of the concentrated liquid and put it into the phytoplankton-counting box. A cover glass was used to cover the counting box. We used an Olympus, Tokyo, Japan, BX51 microscope to observe the phytoplankton in the counting box. We observed them under a 40× objective lens, counted 100 fields of view, and inversely deduced the phytoplankton biomass of the collected water samples according to the obtained values [32]. The identification of phytoplankton was completed in the Freshwater Algae Culture Collection at the Institute of Hydrobiology (FACHB), Chinese Academy of Sciences (CAS).

2.3. CO2 Fluxes across the Water–Air Interface

The CO2 exchange flux at the water–air interface was sampled using a self-designed planktonic static box [33]. The gas sampling box is a double-layer opaque heat-insulating stainless-steel cylinder with a diameter of 30 cm and a height of 40 cm. A small fan was installed on the top of the box to fully mix the gas in the box. Before each launch, the box should be placed horizontally, and the open end should avoid CO2 sources such as crowds. The power must be on for 5 min to fully mix the gas in the box. Then, the rubber plug of the vent hole at the top of the cylinder is removed, and the cylinder is placed vertically on the water surface flotation device. After it is stable, it is covered with a rubber stopper, and 1 L of the gas samples is taken into the sample bag at the 0th, 5th, 10th, and 20th minutes from this starting point, and they are sealed away from light. After gas sample collection, the gas samples were immediately sent to the Environmental Stable Isotope Laboratory of the Chinese Academy of Agricultural Sciences to detect the CO2 content, which was used to calculate the slope (Slope) of the linear relationship equation of CO2 with time at each point, and it was brought into the following formula to calculate the CO2 exchange flux [34]:
F l u x = S l o p e × F 1 × F 2 × V F 3 × S
where Flux is greenhouse gas flux (mg/(m2·h)); Slope is the CO2 slope of the time–concentration relationship curve (10−6/min); F1 is the CO2 molecular weight (44 g/mol); F2 is the min and h conversion factor (60); V is the volume inside the inner wall of the flotation tank (m3); F3 is the μg and mg conversion factor (1000); S is the water surface area covered by the inner wall of the flotation tank (m2).
Regression analysis and ANOVA were performed on the data using OriginPro 8.5, MapGIS 6.7, and CorelDraw X6, which were used to draw the other drawings.

3. Results

3.1. Hydrochemical Composition

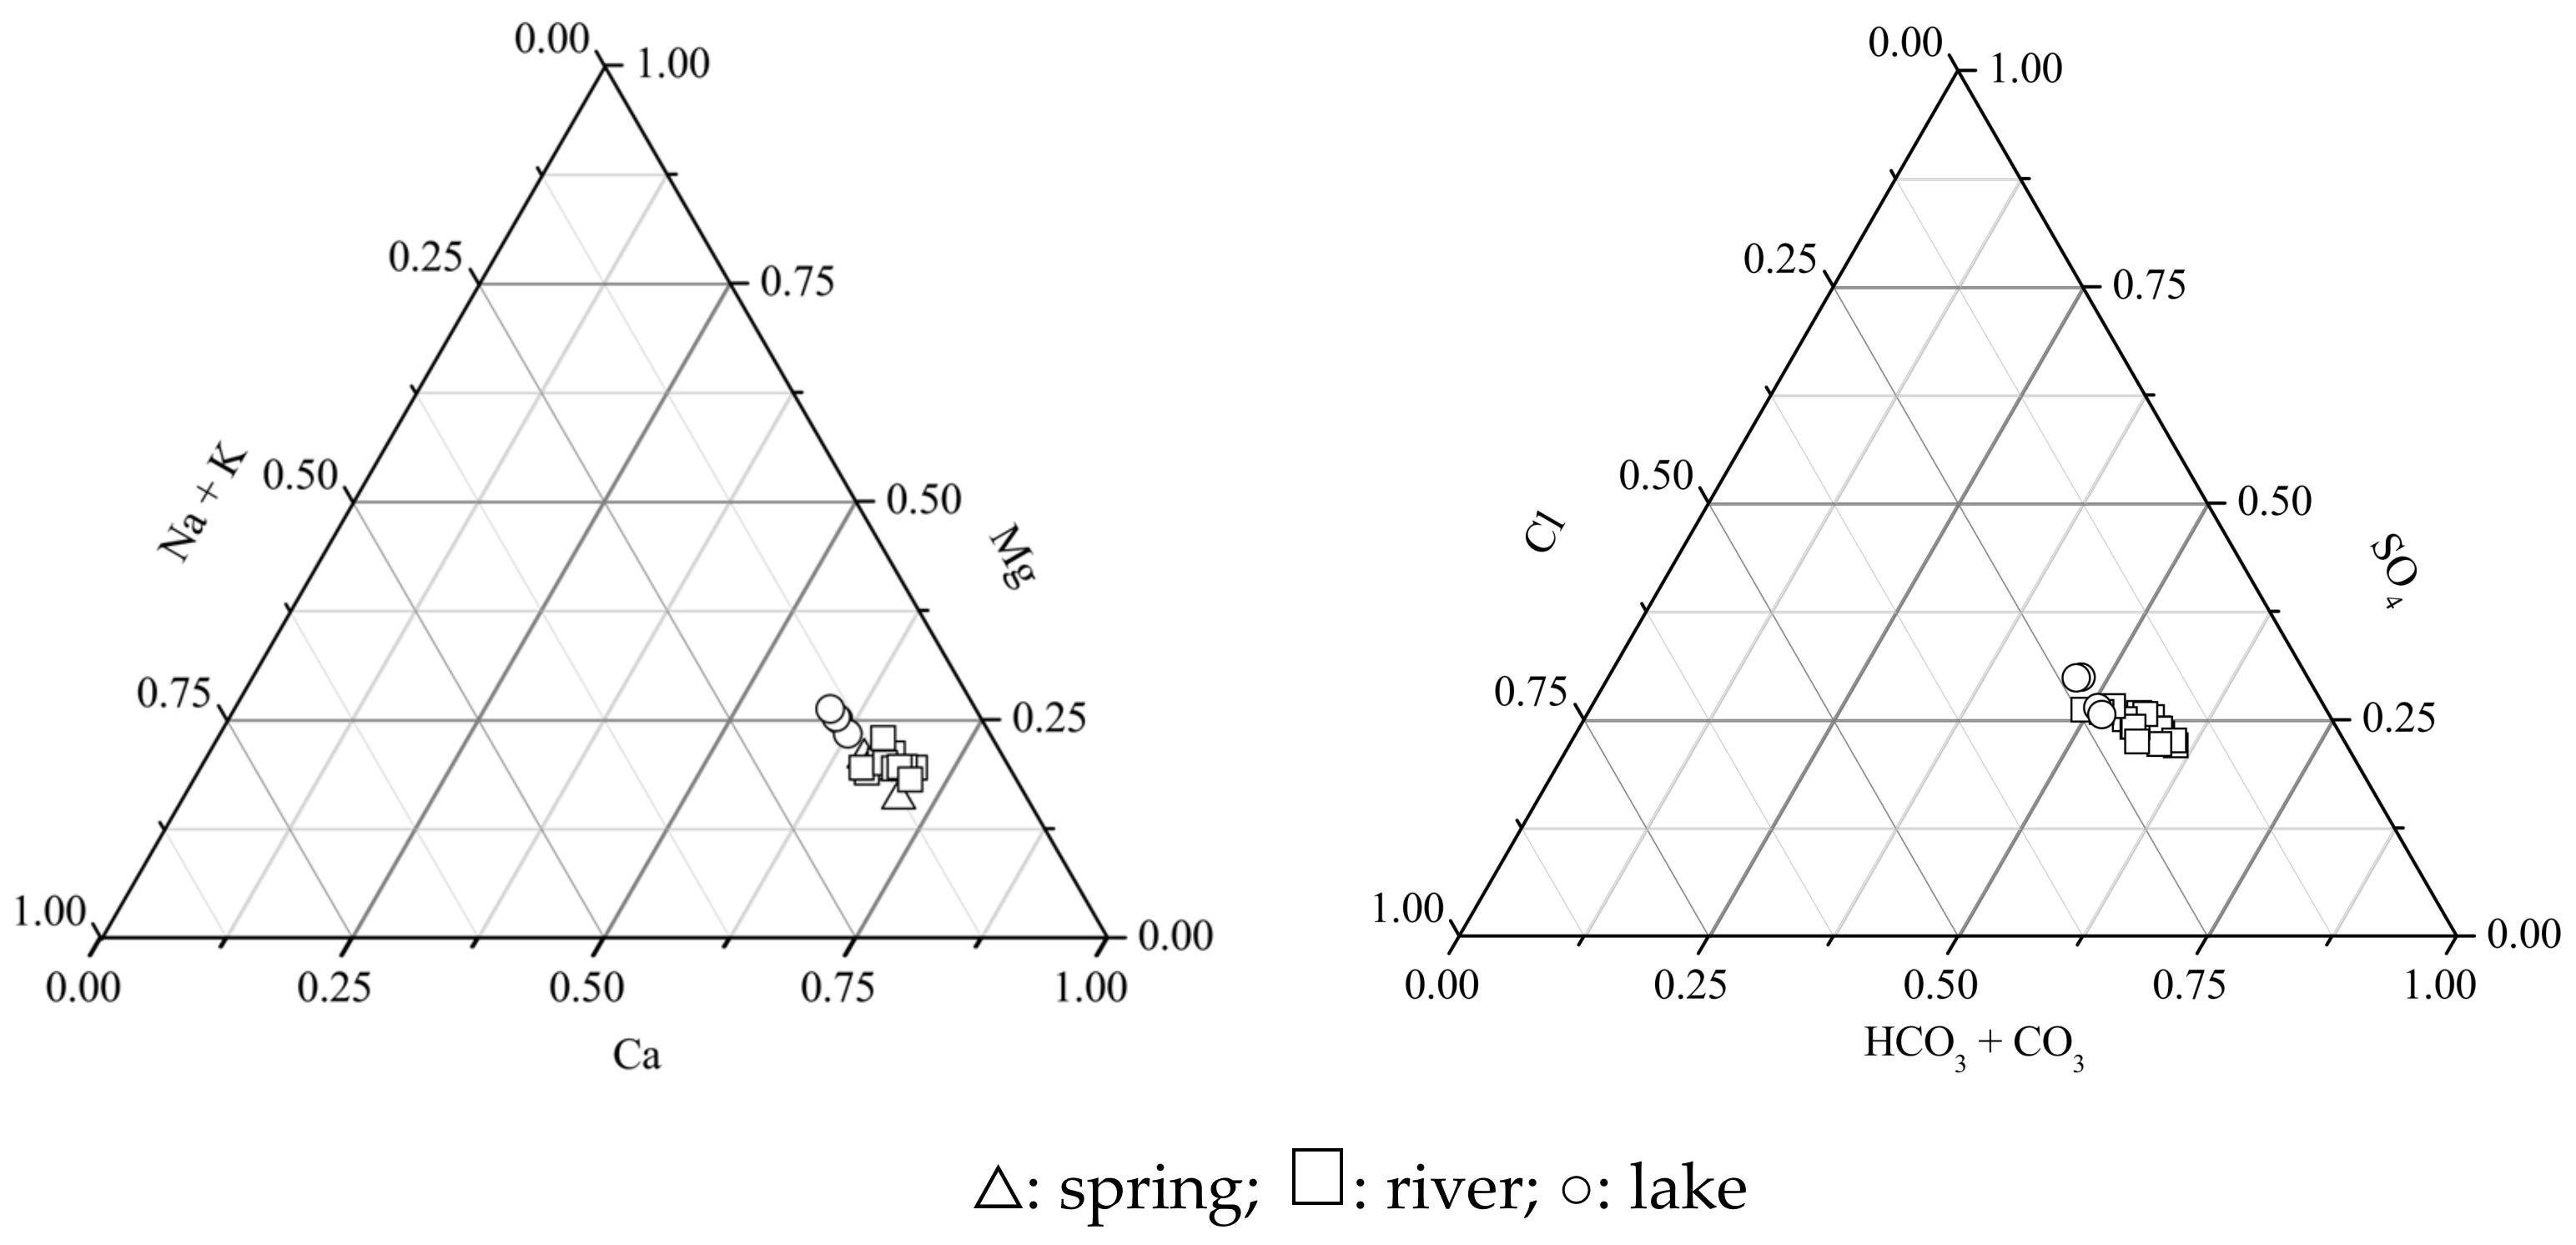
According to the statistical data about major cations in springs, rivers, and lakes in the BTQ, Ca2+ was the dominant major cation, accounting for 59.36~74.10%, while Mg2+ accounted for 16.76~26.21%. Meanwhile, the percentage of Na+ + K+ ranged from 9.14 to 15.27%. HCO3 was the dominant anion, ranging from 44.9% to 56.49%. SO42−, NO3, and Cl ranged from 20.54% to 28.89%, 3.55% to 8.14%, and 15.97% to 22.96%, respectively (Figure 4).
The hydrochemical types of the springs and rivers were HCO3–Ca and of the lakes, they were HCO3·SO4–Ca. The hydrochemical composition of the spring water in the BTQ showed typical karst water characteristics controlled by carbonate rock dissolution. Along the water-flow path from the spring outlet to the lake, human activities may cause the SO42− content to increase.
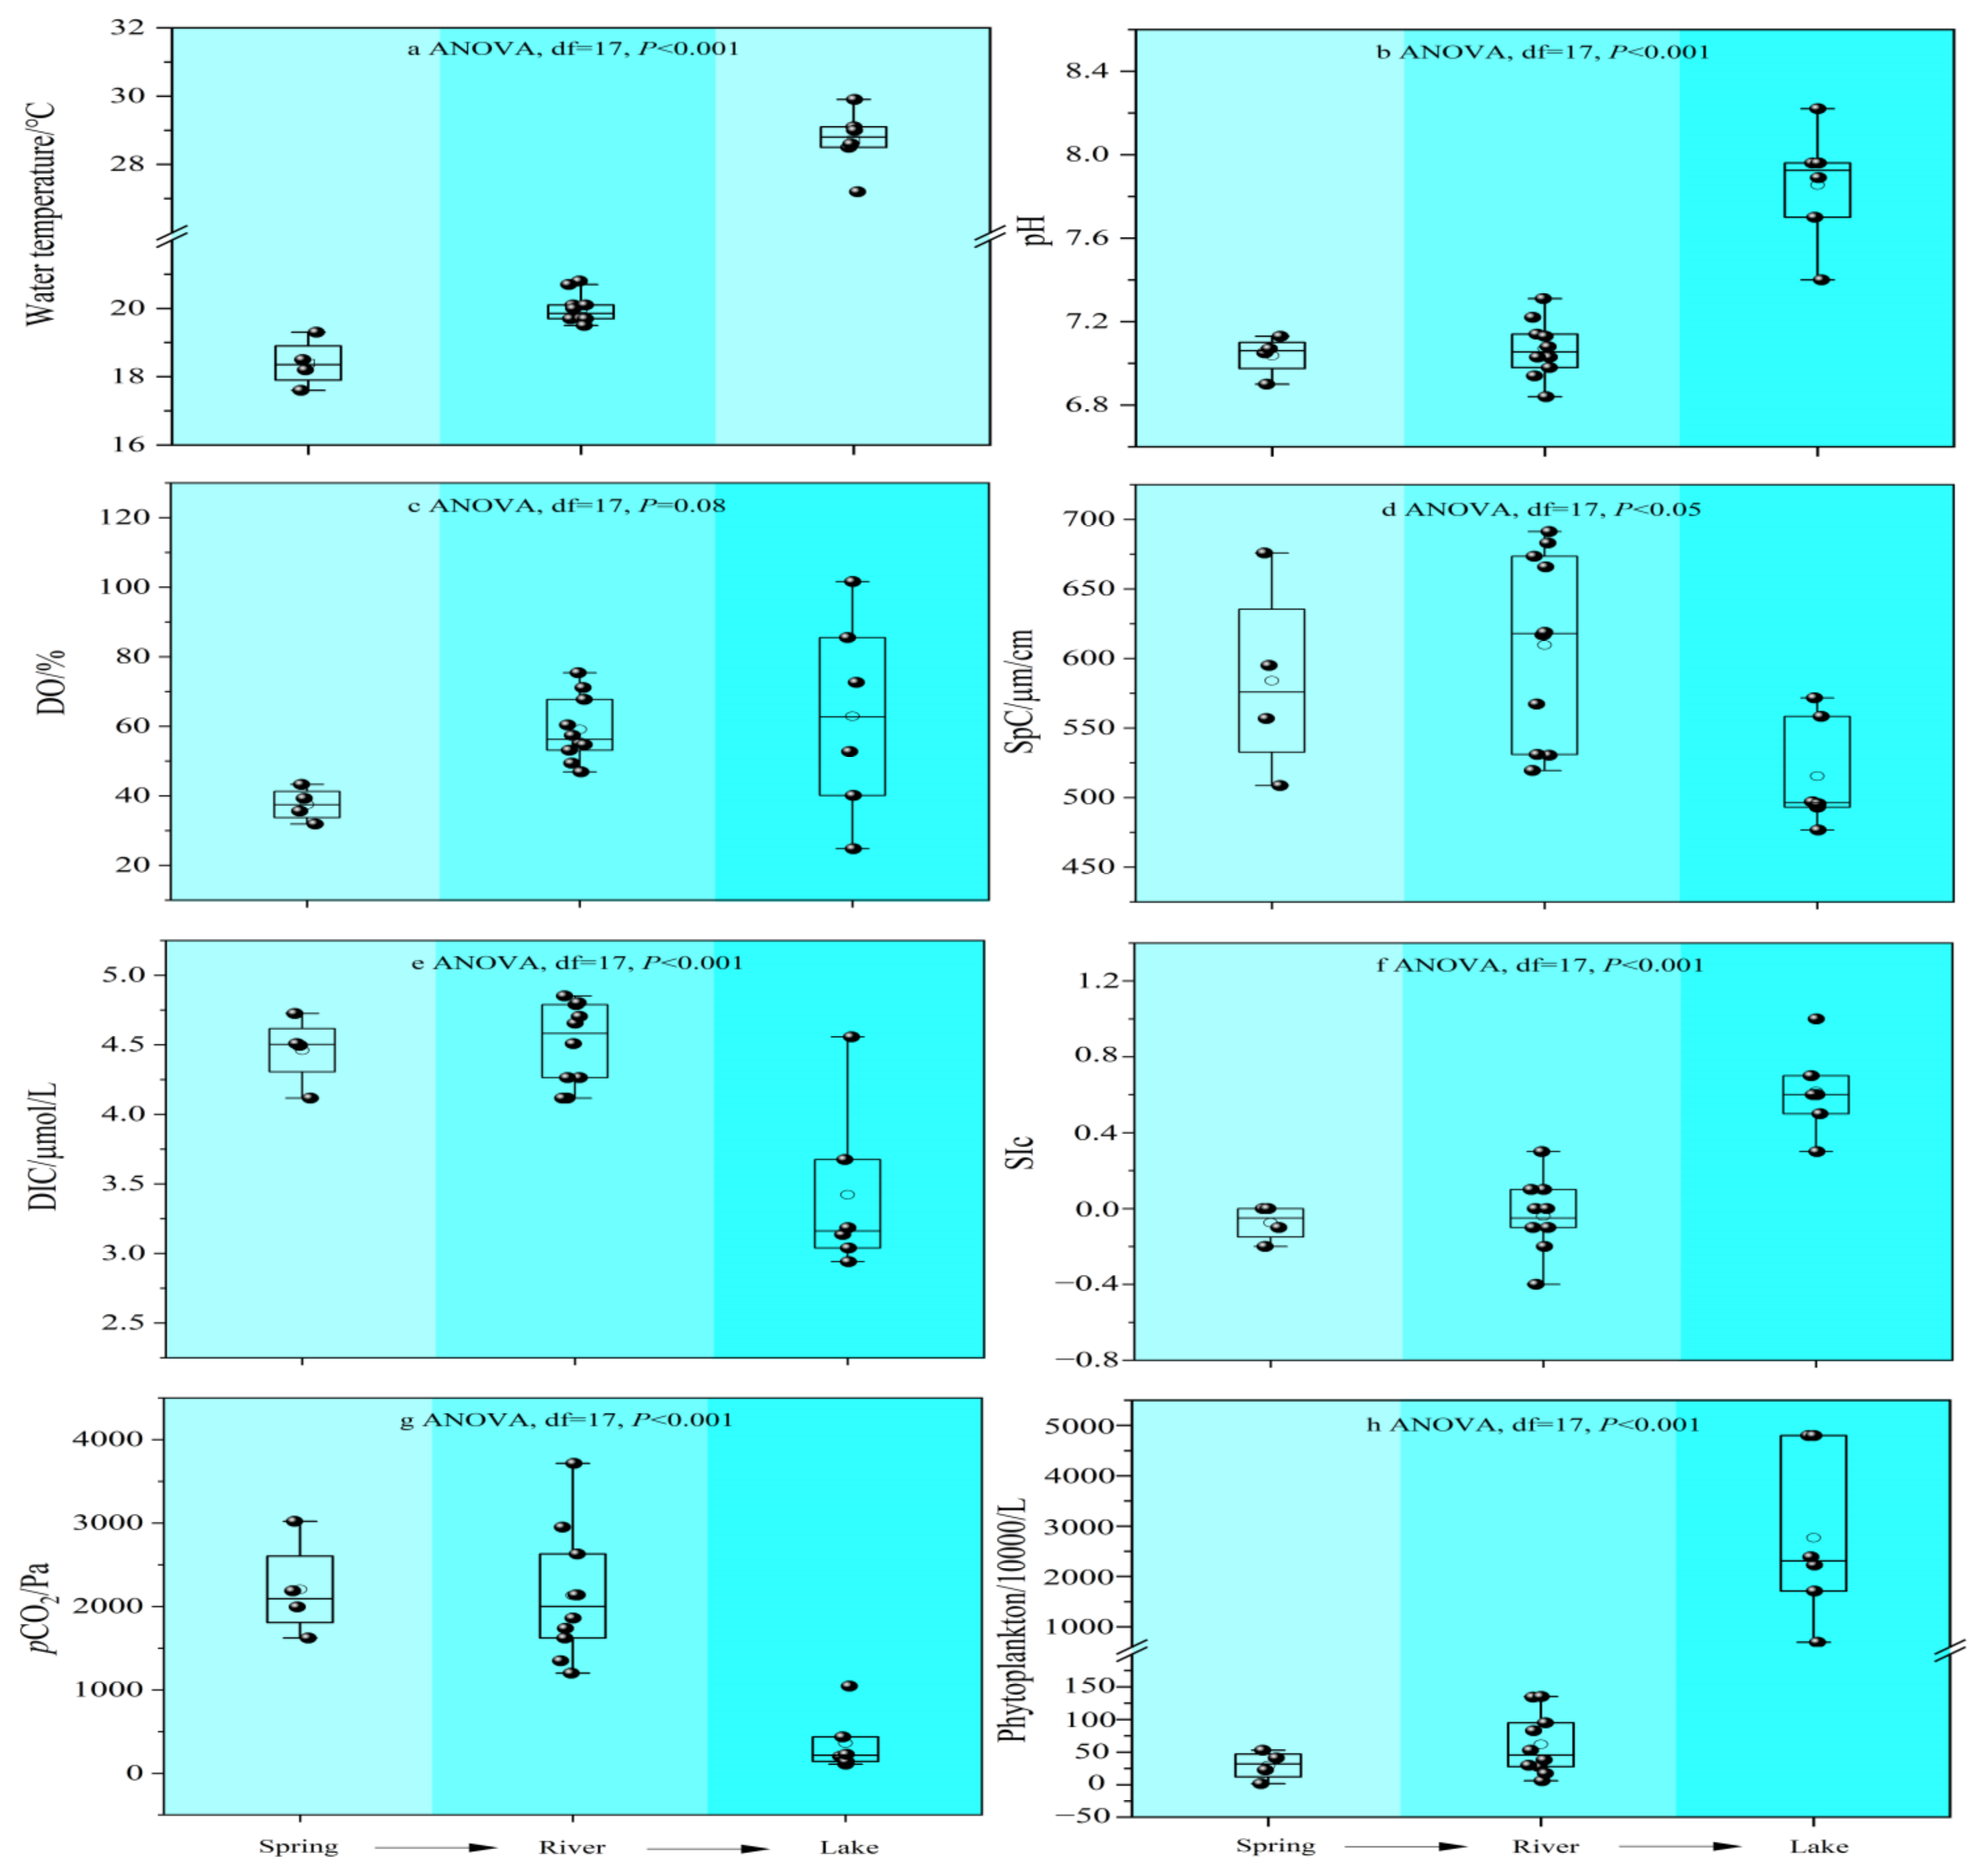
The hydrogeochemical parameters (including T, pH, SpC, DO, DIC, Sic, and pCO2) in the BTQ show significant spatial variation characteristics (Figure 5). The T and DO gradually increase in the order of spring, river, and lake, while SpC rises first and then decreases. In contrast, pH, DIC, Sic, and pCO2 show a trend of small variation from the spring to the river. After entering the lake, pH and SIc showed an increasing trend, while DIC and pCO2 decreased significantly. In conclusion, the hydrogeochemical parameters are relatively close between the spring and the river due to the rapid water movement from the spring to the river. When water flows into a lake through hundreds of meters, its hydrogeochemical characteristics change significantly due to the lake’s effects.

3.2. Phytoplankton

The mean phytoplankton numbers in the springs, rivers, and lakes were 29.65 ± 22.42 × 10⁴/L, 61.96 ± 47.23 × 10⁴/L, and 2769.72 ± 1678.78 × 104/L, respectively (Figure 5). Although the phytoplankton numbers increased slightly after entering the river from the springs, they were still in the same order of magnitude and did not change much between the springs and the river. However, there was an explosive increase in the lake, which was 93.4 and 44.7 times higher than in the spring and river, respectively. In addition, it has been found that the phytoplankton species and biological density are high in Daminghu Lake in summer due to the influence of domestic sewage input, and the lake water is generally in a mesotrophic state with a tendency to deteriorate towards eutrophication [35].

3.3. CO2 Degassing Fluxes at the Water–Air Interface

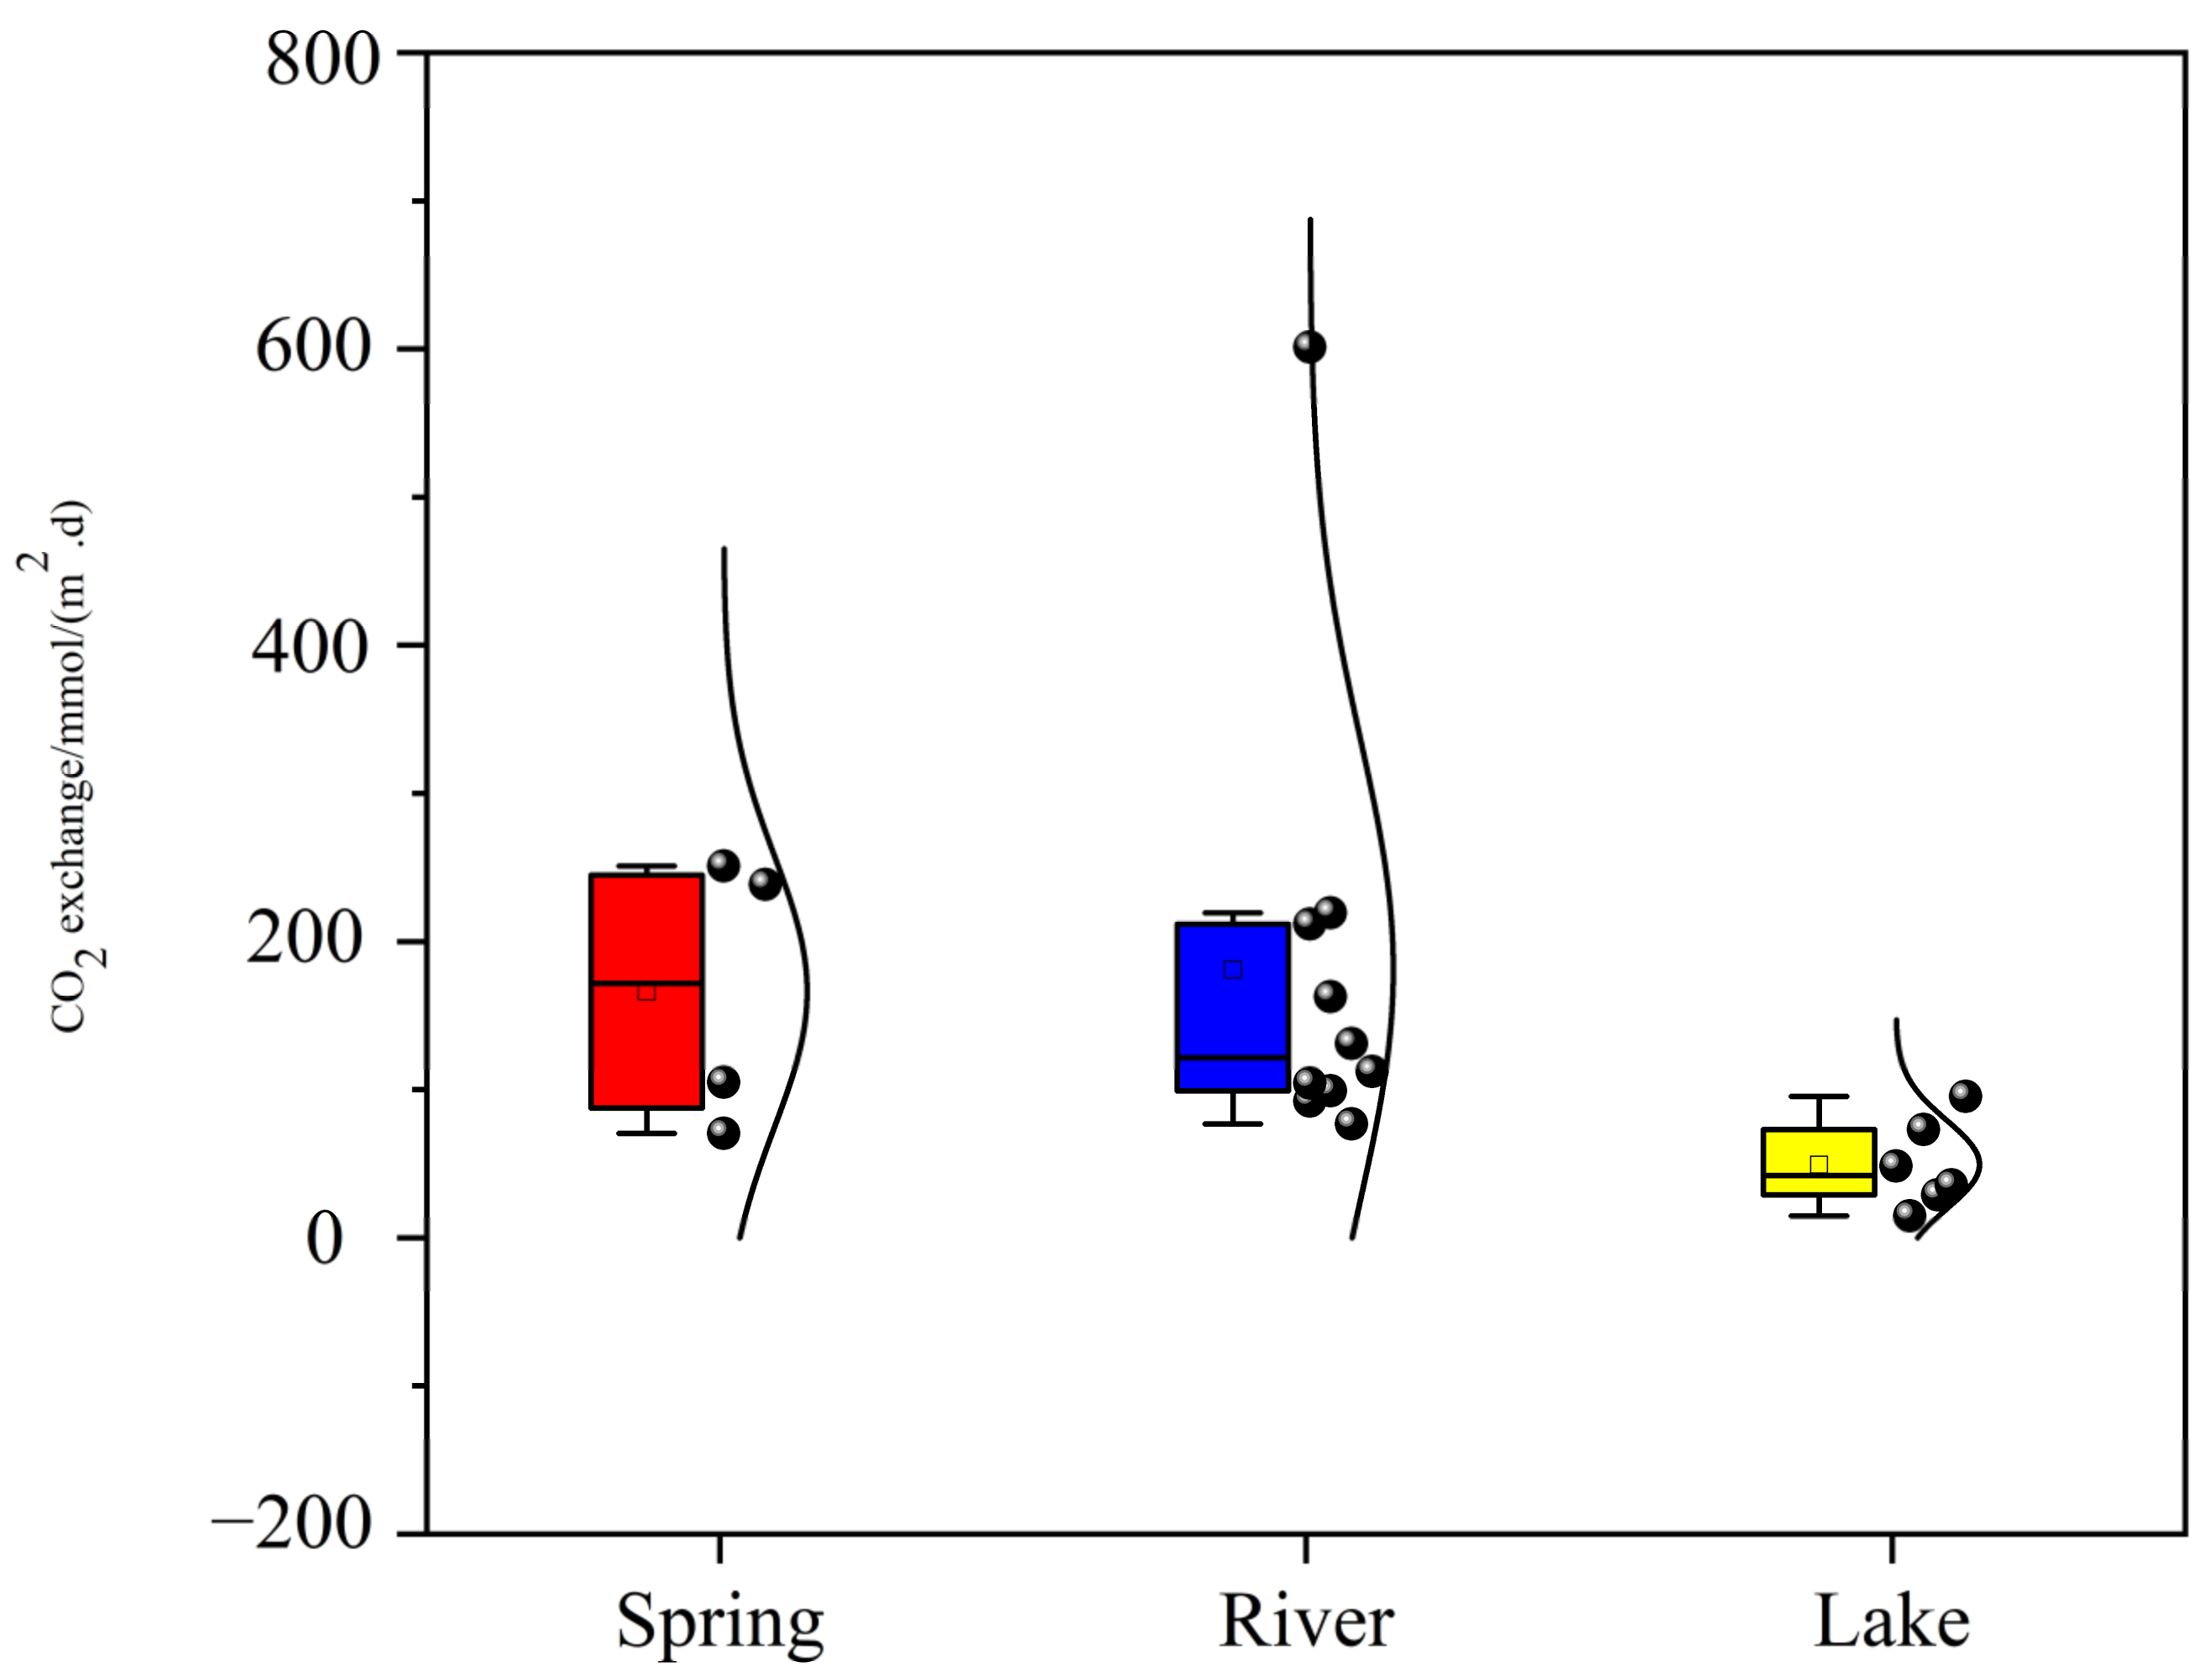
The CO2 degassing at the water–gas interface in the spring, river, and lake differed significantly (K-text, p < 0.01) (Figure 6), with means of 166.19 ± 91.91, 181.05 ± 155.61, and 90.56 ± 55.03 mmol/(m2 d), respectively, showing a slight increase from the spring to the river and a significant decrease in the lake. Due to the rapid recharge from the spring, the CO2 degassing of the river slightly increased under the influence of hydrodynamic conditions. However, the sharp decrease in the amount of CO2 degassing after river water flows into the lake may be mainly limited by the photosynthesis of aquatic plants.
This section is divided into subheadings. It should provide a concise and precise description of the experimental results, their interpretation, as well as the experimental conclusions that can be drawn.

4. Discussion

4.1. Controls on CO2 Fluxes

Usually, CO2 fluxes at the water–air interface are mainly influenced by complex biological, chemical, and physical processes, including hydrodynamic conditions, temperature, in situ respiration and degradation, soil CO2 production and transport, aquatic biological metabolic processes, and carbonate dissolution and precipitation processes [10,21,36,37]. Because the BTQ is a sequential hydrological system and karst springs are the ultimate water source, we think that the carbon sources in springs, rivers, and lakes are similar.
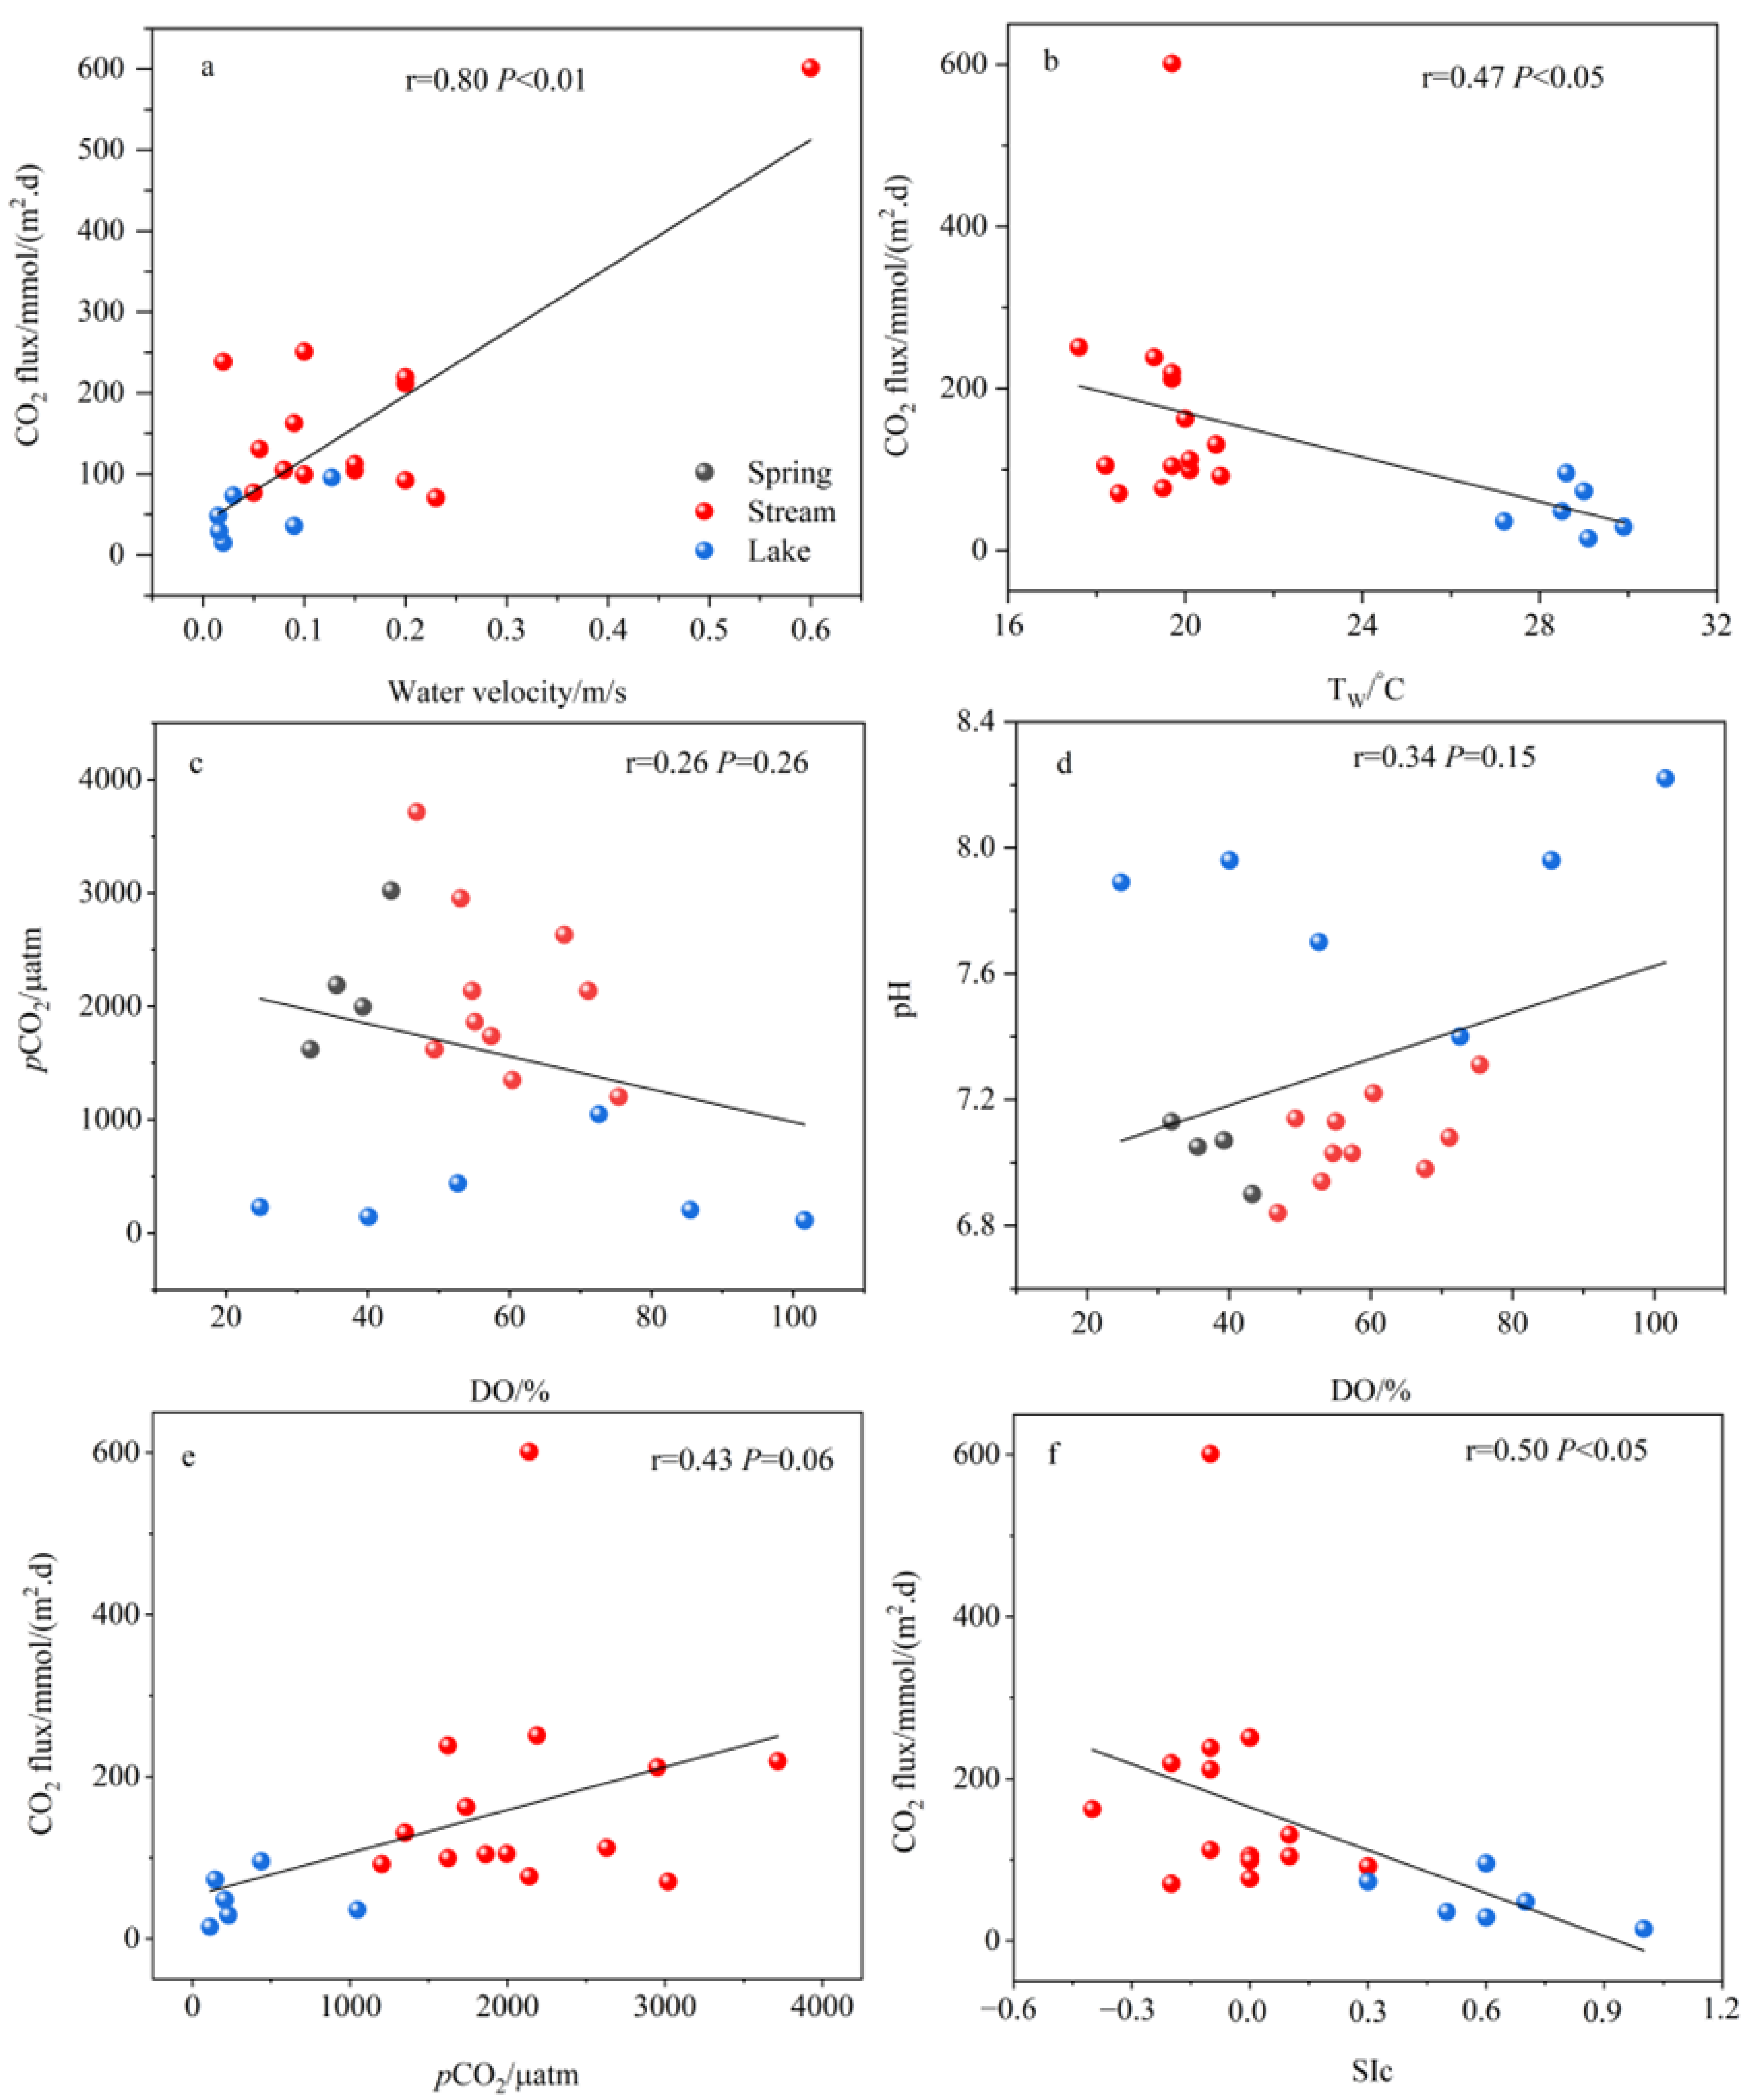
Theoretically, the solubility of CO2 is inversely proportional to water temperature [38] which means that the amount of CO2 degassing rises with increasing water temperature. However, it can be seen from Figure 7b that CO2 degassing in the BTQ is significantly negatively correlated with water temperature, which is not consistent with the theory. The water temperature from the spring outlet to the river and then to the lake gradually increased because of the influence of the ambient environment. The average water temperature increased by 10 °C after reaching the lake, while the CO2 degassing amount showed a significant decreasing trend (Figure 7b), which indicates that there are other more important factors than temperature controlling the process of CO2 degassing.
Studies have shown that changes in hydrodynamic conditions (flow velocity, slope, etc.) drive the degree of turbulence in streams and rivers, which in turn affects the water–air interface and gas exchange coefficient and thus changes the CO2 flux [39,40,41]. However, as the form of the water body changes, especially when springs and streams merge into large rivers and even lakes, turbulence is significantly reduced by flow velocity [39,42]. As can be seen in Figure 7a, the CO2 flux in the BTQ shows a significant positive correlation with flow velocity, indicating that flow velocity affects the CO2 flux in the BTQ. However, since the flow velocity decreases significantly from the spring outlet and the river channel to the lake (basical lentic status), lake hydrodynamic conditions have may little effect on the CO2 flux. On the contrary, the CO2 degassing flux was elevated by the effect of higher flow velocity and specific drop at the spring point and river channel. For example, the highest CO2 degassing flux of 601.29 mmol/(m2 d) was observed at the Z2 monitoring site in the river channel, which was obviously influenced by its high flow velocity of 0.6 m/s.
Generally, by changing the relationship between in situ respiration, organic matter degradation, and photosynthesis, pCO2 will vary seasonally or with the river section [10], thus changing the CO2 flux by affecting the concentration gradient between dissolved CO2 and atmospheric CO2. From Figure 7c–e, although pCO2 showed a positive correlation with CO2 flux, dissolved oxygen saturation did not show a correlation with pCO2, and the dissolved oxygen saturation was 37.5 ± 4.9%, 59.1 ± 9.4%, and 62.9 ± 28.9% in the springs, rivers, and lakes, respectively, which were unsaturated, indicating that BTQ was weakly influenced. This indicates that BTQ was weakly influenced by photosynthesis and did not significantly change the CO2 fluxes. Furthermore, the extent of photosynthesis and respiration in inland freshwater aquatic communities is mainly controlled by temperature, turbulent disturbances, and seasonal and spatial variations in flow velocity [43]. Clearly, lower water temperatures and higher flow velocities in the springs and rivers may inhibit photosynthetic intensity by causing greater disturbance to aquatic growth (Figure 7). Interestingly, lakes have relatively high water temperatures and low flow rates, which are undoubtedly more favorable for aquatic plant photosynthesis [44,45].
The influence of carbonate minerals on CO2 flux is mainly through the control of the dissolved CO2 concentration [14,46], which is reflected in the change in the mineral saturation state (SIc) in water. When carbonate minerals in water are in a supersaturated state (SIc > 0.1), carbonate minerals precipitate and thus release CO2 into the water column, which undoubtedly will drive CO2 degassing and increase CO2 fluxes. However, as seen in Figure 7f, the SIc and CO2 flux show a negative correlation, which is not consistent with the expected results, indicating that carbonate rock dissolution and precipitation may have less influence on CO2 flux in the BTQ.

4.2. Processes Affecting the Decline of CO2 Fluxes in Lakes

Typically, CO2 degassing at the water–gas interface in inland waters is determined by the degassing coefficient (k600 value) and the pCO2 value of the water column [2]. Studies have shown that the large input of soil CO2 to primary streams results in water column pCO2 values that are much higher than atmospheric values and are supersaturated, resulting in significant carbon release from streams through CO2 degassing over short distances due to significant concentration gradients. For example, Öquist (2009) [47] showed that within 200 m of stream outflow, 90% of the dissolved inorganic carbon from soil sources is re-emitted back to the atmosphere in the form of CO2 degassing. Thus, the flow from the spring to the lake in the BTQ passes through about 300~1000 m and is also likely to be significantly degassed because of the large difference in CO2 concentration gradients (Figure 6). And with the confluence into the lake, the concentration gradient decreases sharply, driving a decrease in CO2 degassing, which is also found in the significant decrease in pCO2 (Figure 5g).
It has been shown that the k600 value at the water–gas interface of inland water bodies is affected by fluctuations in the water surface, and flow velocity plays a major role in the hydrodynamic conditions of streams [41,42]. Through the above analysis, we found that CO2 degassing shows a decreasing trend with flow velocity from springs and rivers to lakes, so it is likely that the decrease in lake CO2 degassing in the BTQ is also influenced by flow velocity. Multiple regression analysis (Table 1, Grömping, 2006) [48] revealed that pCO2 and the flow rate could explain 65% of the decrease in CO2 degassing, with the flow rate alone explaining 55.2% of the decrease, indicating that hydrodynamic conditions significantly influenced the CO2 degassing process in the lake. In contrast, pCO2 explains only 9.3%, suggesting that other processes significantly influence pCO2 concentration.
The limitation of pCO2 and CO2 degassing in karst lake waters during spring and summer under the influence of aquatic photosynthesis and thermal stratification effects has been known for a long time. For example, Wang (2012) [12] showed that thermal stratification and mixing processes in the reservoir controlled the pattern of DIC changes in Red Maple Lake. However, the photosynthesis of phytoplankton and the dilution effect of precipitation in summer made the DIC concentrations much lower than in other seasons, which may also be an important reason why the reservoir pCO2 values found in their supplementary bimonthly data did not reach saturation. In a study of 13 lakes on the Yunnan-Guizhou plateau, it was also found that some of the lakes exhibited a significant decrease in CO2 degassing and even the absorption of atmospheric CO2 in summer due to the enhanced photosynthesis of aquatic plants [49], and the same phenomenon was observed in the Hongjiadu reservoir of the Wujiang River, where algal outbreaks were caused by the increased water temperature in spring [50]. Pu et al. (2020) [51] showed that CO2 degassing in the water column was affected by both the thermal stratification and photosynthesis of aquatic organisms in a karst reservoir, and the degassing amount in the summer stratification period (mean value of 7.15 mg/(m2−h)) was much lower than that in the mixing period (mean value of 191.35 mg/(m2−h)), and it showed prolonged absorption of atmospheric CO2 in the summer stratification period. It is speculated that the thermal stratification effect and aquatic photosynthesis may also play an important role in the decline of CO2 degassing in Daminghu Lake.
However, the average water depth of Daminghu Lake is only about 2 m, its thermal stratification effect is not obvious, and its influence on the CO2 degassing process is not significant. It can be seen from Figure 5a,g that the water temperature and phytoplankton population increase significantly along the spring–river–lake sequence, and the flow rate decreases and the phytoplankton population shows an explosive increase, both of which are obviously more favorable to photosynthesis. In addition, phytoplankton abundance also showed significant positive (r = 0.50, p < 0.05) and negative (r = 0.74, p < 0.01) correlations with the DO and pCO2 values, respectively, also indicating that aquatic plant photosynthesis in the lake played an important role in reducing pCO2 in the water column, which in turn drove the decrease in CO2 degassing at the water–air interface (Figure 8a,b).
Generally speaking, the sources of DIC in water bodies in karst areas include atmospheric CO2, CO2 from soil respiration, and dissolved carbonate rocks. δ13CDIC values are directly controlled by carbon sources, all water bodies in the BTQ are in a state of CO2 degassing, and the influence of atmospheric CO2 near the water–gas interface onδ13CDIC is negligible or secondary [52]. Studies have shown that the δ13C value of CO2 production from plant respiration and soil organic matter decomposition in watersheds controlled by C3 vegetation is about −23‰ [53,54]. Carbonate rocks are usually deposited in the marine phase, and their δ13C average value is 0 ± 1‰. The current karst system is open, and the relative proportions of dissolved carbonate minerals and soil CO2 and their isotopic compositions determine the isotopic values of DIC to be between −11.5~−14‰ and ~12‰ [55,56].
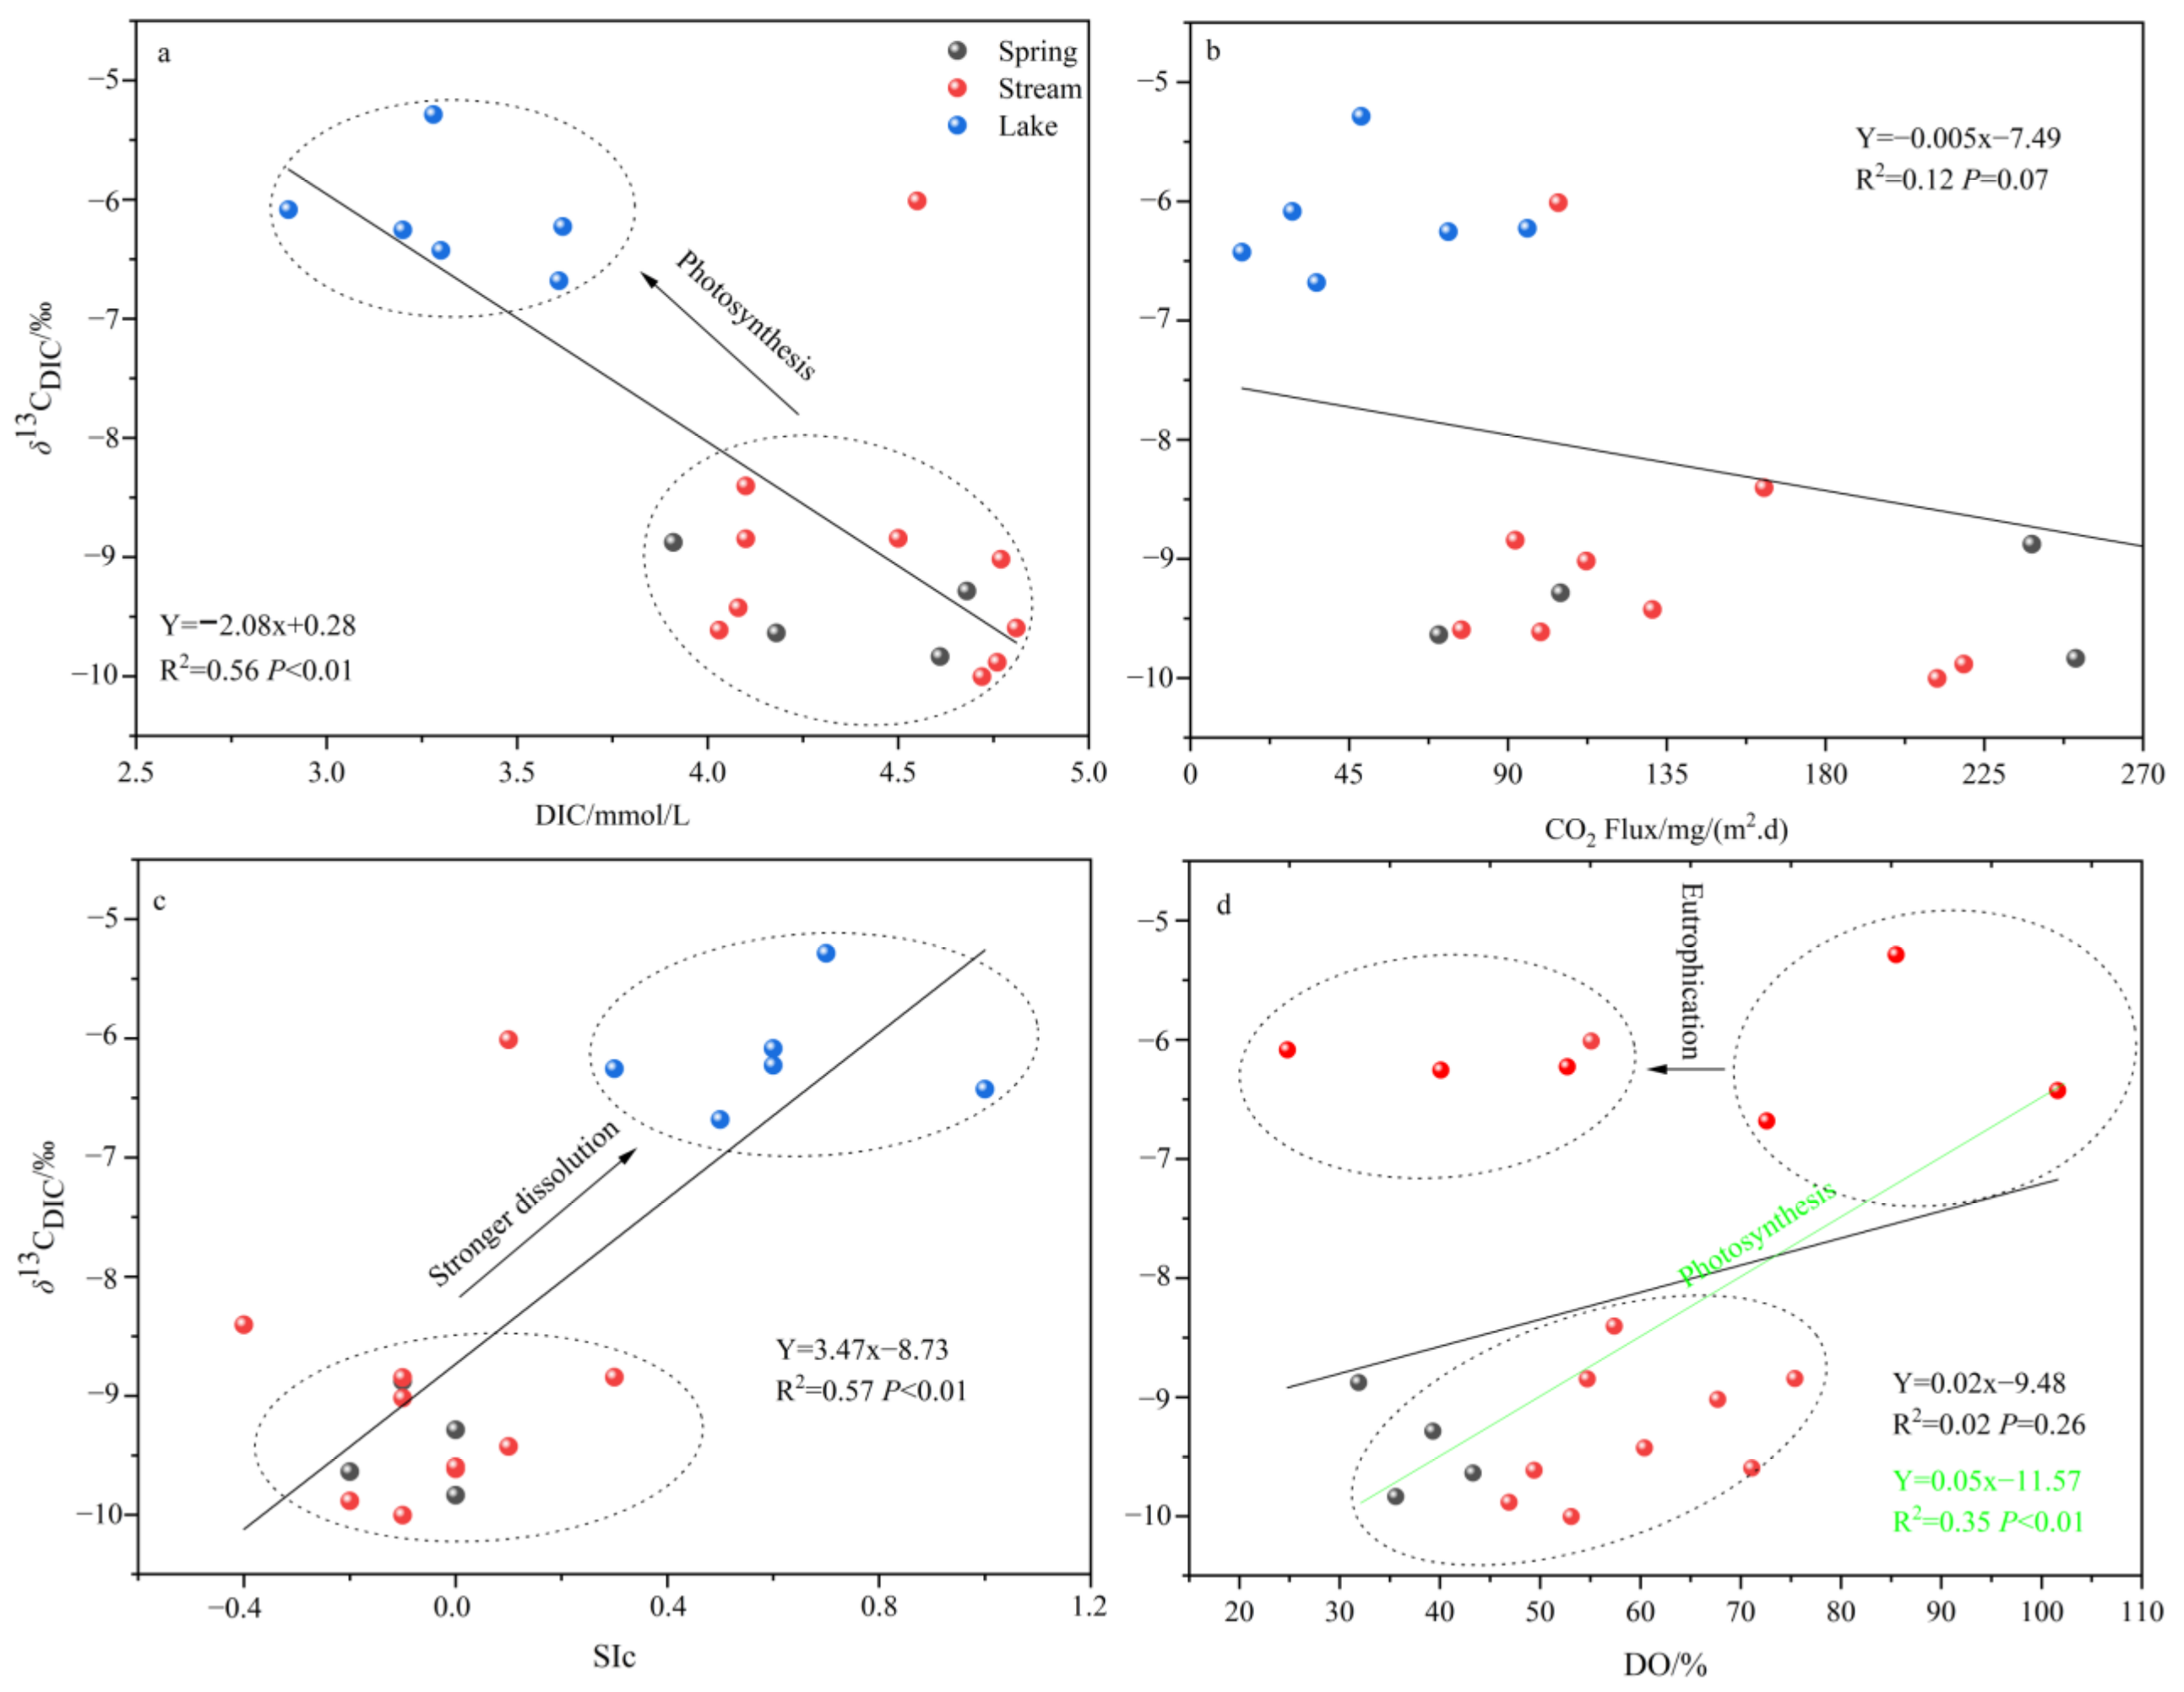
As can be seen from Figure 9a, the δ13CDIC values of spring and river water are not very different, with both around −9‰, with the average values of −9.41 ± 0.42‰ and −8.96 ± 1.16‰, respectively, both of which are more positive than the theoretical value of −12‰, indicating that carbonate rock dissolution is an important source of carbon in the BTQ. Of course, due to the presence of gypsum strata in the BTQ recharge area, some sulfuric acid enters the groundwater and thus directly dissolves carbonate rocks, which also makes the δ13CDIC values of the spring and river water in the BTQ positive. However, the mean value of δ13CDIC in the lake is −6.16 ± 0.47‰, which is about 3‰ more positive than that in the river, indicating that the DIC and δ13CDIC values in the lake may be influenced by several biogeochemical processes such as aquatic metabolism, CO2 degassing, and carbonate mineral precipitation. It was shown that the CO2 degassing process leads to a 2.4 ± 0.1‰ increase in downstream δ13CDIC values [56], but CO2 degassing does not completely control the enrichment of δ13CDIC values in the lake by about 3‰, and the amount of CO2 degassing does not show a correlation with the δ13CDIC values (Figure 9b). In addition, under equilibrium conditions, carbonate precipitation also biases the δ13CDIC value of the residual DIC pool by 0.5~1‰. However, a significant positive correlation between the δ13CDIC values and SIc can be found in Figure 9c, indicating a gradual strengthening of carbonate dissolution and a smaller effect of carbonate precipitation.
However, paradoxically, there was a significant positive δ13CDIC value but a simultaneous decrease in DIC concentration in the study area, which was probably influenced by the photosynthesis of aquatic plants, in which 12C was preferentially absorbed, resulting in a decrease in the DIC concentration and an increase in the δ13CDIC value [57]. From Figure 7 and Figure 9d, it can be seen that although the DO concentration of the lake water increased, the mean DO saturation was only 62.9 ± 28.9%, which was still in the unsaturated state. Moreover, DO did not show a correlation with the pCO2 and δ13CDIC values, suggesting that there may be other processes that significantly constrain the variation of DO. Apparently, the BTQ lakes show a significant increase in water temperature by 10 °C compared to the rivers, with a consequent significant decrease in gas solubility [38], causing the DO concentrations to exhibit a significant downward trend. More importantly, Daminghu Lake is generally in a mesotrophic state due to the influence of tourism activities and domestic sewage input, while in July and August, there are many phytoplankton species and a high biological density of the diatom–green algae–cyanobacteria type, which has a tendency to transition to eutrophication [35], and DO will undoubtedly be consumed in large quantities, leading to a significant decrease in its concentration. Of course, due to the poor mobility and slow flow rate of the lake water, the physicochemical properties of the lake water in different regions may not be homogeneous, as seen in Figure 9d; when several extremely low values of DO were removed, a significant positive correlation was shown between the DO and δ13CDIC values, which also reflected the significant effect of photosynthesis.

4.3. Implications

The BTQ is a typical and complete natural karst “spring-river-lake (reservoir)” sequence discontinuity, and the river and lake water mainly originate from springs, which ensures that the three sources of carbon are basically the same, providing an ideal place to systematically carry out research on carbon exchange processes at the water–gas interface of different karst water bodies and their control mechanisms and providing an example for the work related to the increasing number of river “sequence discontinuity” systems formed by reservoir construction.
In general, pCO2 in groundwater is often maintained at very high levels, up to tens or even more than a hundred times the atmospheric CO2 content, due to the influence of high soil CO2 leaching, and thus is often in a state of supersaturation [58,59]. Therefore, when groundwater emerges from the ground as a spring and forms a river, most of the DIC escapes rapidly to the atmosphere due to the large CO2 concentration gradient. As shown in Figure 5 and Figure 6, the mean values of pCO2 in the springs and their fast input streams in the BTQ are 2206.2 ± 591.2 Pa and 2134.6 ± 774.1 Pa, respectively, both reaching tens of times the atmospheric equilibrium pCO2, and both exhibit significant CO2 degassing processes under the influence of such huge concentration gradients. Of course, the intensity of the influence of hydrodynamic conditions increases progressively as the spring joins the river, and it determines the gas exchange coefficient by driving turbulence, which affects the amount of CO2 degassing [39]. In the case of the BTQ river, where the mean pCO2 value is slightly lower than that of the spring, but instead, its CO2 degassing is slightly higher than that of the spring, it is clearly influenced by the flow rate. Most notably, CO2 off-gassing was also highest at point Z2 where the flow rate was fastest during the monitoring period (Figure 7a).
In addition, stream and river water pCO2 and CO2 degassing are influenced by temperature, hydrogeochemistry, and biology. For example, appropriate water temperatures, slower flow rates, and lower turbidity are conducive to photosynthesis by aquatic plants in streams and rivers, a process that results in the significant uptake of water column CO2 and lower pCO2, thereby reducing CO2 degassing at the water–air interface [14,37,60]. Clearly, BTQ streams are less affected by biotic effects due to faster flow rates and the limitation of lower water temperatures (Figure 7). However, as streams and rivers converge into lakes and reservoirs, CO2 degassing is again controlled by complex physicochemical biotic factors such as temperature, thermal stratification effects, and aquatic biotic metabolic processes as the concentration gradient decreases significantly [51]. The pCO2 concentration gradient decreases significantly, the flow velocity slows, and the temperature increases significantly as the BTQ springs and rivers converge into lakes, all of which provide an opportunity for lake aquatic organisms. A significant decrease in CO2 degassing was observed as the gradient of the pCO2 concentration decreased significantly, the flow rate slowed down, and the temperature increased significantly, which provided the conditions for the important role of photosynthesis in lake aquatic organisms.
Due to the different degrees of biological, physical, and chemical influences on the water bodies of springs, rivers, and lakes in the BTQ, their water–air interface CO2 degassing processes show significant differences. As a typical “sequence discontinuity”, the spring–river–stream–lake reservoir system is directly influenced by aquatic metabolic processes, and lakes and reservoirs are important sites for reducing CO2 emissions at the water–air interface and even forming carbon sinks in inland water bodies [51,61]. For example, in eutrophic lakes and reservoirs, abundant nutrients drive aquatic organisms to proliferate, and DIC is utilized and buried as organic carbon during photosynthesis [62]. Although, there is still a great debate on whether hydropower is a clean energy source and the carbon sink effect after reservoir construction [25,63,64], it is undeniable, however, that the “sequence discontinuity” formed by the construction of a large number of reservoirs has led to significant changes in watershed material transport and biogeochemical processes, even affecting global carbon cycle processes [3]. Therefore, using the BTQ as a study area to deeply understand the spring–river–stream–lake reservoir system cannot only understand the buffering effect of lake carbon biogeochemical processes on high-intensity carbon emissions from rivers but also reflect the impact of high-intensity human activities, which is important for clarifying the regional carbon cycle processes.

5. Conclusions

(1)
The water chemistry parameters such as pH, DIC, SIc, pCO2, and planktonic biomass changed little between the two because of the rapid input to the river after the spring outcrop, but they all changed dramatically after entering the lake. Due to the presence of a significant pCO2 concentration gradient, the spring emerges from the dew point with high CO2 off-gassing. And as the spring enters the river, the degree of influence of flow velocity also increases significantly, and the river CO2 degassing volume under the joint control of both shows a slightly increasing trend. However, as the river water joins the lake, the CO2 degassing volume shows a significant decreasing trend.
(2)
Both the decrease in flow velocity and the increase in temperature in the lake promoted the survival and reproduction of phytoplankton, making the phytoplankton biomass in the lake as high as 3383.79 × 104 per L, which provided favorable conditions for the photosynthesis of aquatic plants. In addition, the significantly decreasing DIC concentration and increasing δ13CDIC values of the lake also indicated the important role of aquatic plant photosynthesis in limiting CO2 degassing in the lake. Of course, the summer eutrophication of the lake, influenced by domestic sewage, also increased the intensity of aquatic plant photosynthesis, but at the same time, it constrained the dissolved oxygen (DO) concentration of the lake water.
(3)
The CO2 degassing processes at the water–gas interface of karst springs, rivers, and lakes show significant differences under the influence of different physical, chemical, and biological interactions. However, by comparing the CO2 degassing processes at the water–gas interface of karst springs, rivers, and lakes, it was found that karst lakes are the most active places for the biogeochemical processes of carbon elements, which are not only influenced by the complex effects of river inputs, human activities, and the carbon cycle of the lakes themselves but are also important places for the possible formation of carbon sinks, which deserve careful verification and in-depth study.
(4)
The results of this study highlight the significance of the dynamic response of CO2 degassing processes at the water–gas interface to different inland karst water bodies, i.e., spring–river–lake systems. It is an ideal study area to study the response of karst river carbon fluxes to the artificially constructed river–lake system.

Author Contributions

Conceptualization, W.L. and J.P.; software, T.Z.; investigation, Q.G. and C.L. (Chunwei Liu); resources, P.M. and C.L. (Chuanlei Li); data curation, Y.L. and L.Y.; writing—original draft preparation, W.L. and T.Z.; writing—review and editing, W.L., T.Z., C.L. (Chunwei Liu) and J.P.; visualization, H.L. and Y.T.; supervision, C.L. (Changsuo Li); project administration, W.L. All authors have read and agreed to the published version of the manuscript.

Funding

This research was funded by the Scientific and technological innovation project of the 801 Institute of Hydrogeology and Engineering Geology, Shandong Provincial Bureau of Geology and Mineral Resources (grant number: 2022JBGS801-13); the Geological Exploration Project of Shandong Province (grant number: 2016-79); the Geological exploration and scientific and technological innovation projects of Shandong Provincial Bureau of Geology & Mineral Resources (grant number: HJ202110); the Open Project of Shandong Engineering Research Center for Environmental Protection and Remediation on Groundwater (grant number: 801KF2021-10); and the National Natural Science Foundation of China (grant number: 42272288).

Data Availability Statement

The data presented in this study are available on request from the corresponding author. The data are not publicly available due to the project is still in progress.

Acknowledgments

Sincere are given thanks to the World’s Best Spring Scenic Area Service Center of Jinan for their efforts in the sampling process.

Conflicts of Interest

The authors declare no conflict of interest. The funders had no role in the design of the study; in the collection, analysis, or interpretation of the data; in the writing of the manuscript; or in the decision to publish the results.

References

  1. Cole, J.J.; Prairie, Y.T.; Caraco, N.F.; McDowell, W.H.; Tranvik, L.J.; Striegl, R.G.; Duarte, C.M.; Kortelainen, P.; Downing, J.A.; Middelburg, J.J.; et al. Plumbing the global carbon cycle: Integrating inland waters into the terrestrial carbon budget. Ecosystems 2007, 10, 172–185. [Google Scholar] [CrossRef] [Green Version]
  2. Raymond, P.A.; Hartmann, J.; Lauerwald, R.; Sobek, S.; McDonald, C.; Hoover, M.; Butman, D.; Striegl, R.; Mayorga, E.; Humborg, C.; et al. Global carbon dioxide emissions from inland waters. Nature 2013, 503, 355–359. [Google Scholar] [CrossRef] [PubMed] [Green Version]
  3. Ciais, P.; Sabine, C.; Bala, G.; Bopp, L.; Brovkin, V.; Canadell, J.; Chhabra, A.; DeFries, R.; Galloway, J.; Heimann, M.; et al. Carbon and Other Biogeochemical Cycles. Climate Change. The Physical Science Basis. In Contribution of Working Group I to the Fifth Assessment Report of the Intergovernmental Panel on Climate Change; Stocker, T.F., Qin, D., Plattner, G.K., Tignor, M., Allen, S.K., Boschung, J., Nauels, A., Xia, Y., Bex, V., Midgley, P.M., Eds.; Cambridge University Press: Cambridge, UK; New York, NY, USA, 2013; pp. 465–570. [Google Scholar]
  4. Park, P.K.; Gordon, L.I.; Hager, S.W.; Cissell, M.C. Carbon Dioxide Partial Pressure in the Columbia River. Science 1969, 166, 867–868. [Google Scholar] [CrossRef]
  5. Kling, G.W.; Kipphut, G.W.; Miller, M.C. The flux of CO2 and CH4 from lakes and rivers in arctic Alaska. Hydrobiologia 1992, 240, 23–36. [Google Scholar] [CrossRef]
  6. Cole, J.J.; Caraco, N.F.; Kling, G.W.; Kratz, T.K. Carbon dioxide supersaturation in the surface waters of lakes. Science 1994, 265, 1568–1570. [Google Scholar] [CrossRef] [Green Version]
  7. Raymond, P.A.; Caraco, N.F.; Cole, J.J. Carbon Dioxide Concentration and Atmospheric Flux in the Hudson River. Estuaries 1997, 20, 381–390. [Google Scholar] [CrossRef]
  8. Frankignoulle, M.; Abril, G.; Borges, A.; Bourge, I.; Canon, C.; Delille, B.; Libert, E.; Théate, J.-M. Carbon Dioxide Emission from European Estuaries. Science 1998, 282, 434–436. [Google Scholar] [CrossRef] [PubMed] [Green Version]
  9. Hope, D.; Palmer, S.M.; Billett, M.F.; Dawson, J.J.C. Variations in dissolved CO2 and CH4 in a first-order stream and catchment: An investigation of soil-stream linkages. Hydrol. Process. 2004, 18, 3255–3275. [Google Scholar] [CrossRef]
  10. Yao, G.; Gao, Q.; Wang, Z.; Huang, X.; He, T.; Zhang, Y.; Jiao, S.; Ding, J. Dynamics of CO2 partial pressure and CO2 outgassing in the lower reaches of the Xijiang River, a subtropical monsoon river in China. Sci. Total. Environ. 2007, 376, 255–266. [Google Scholar] [CrossRef]
  11. Lynch, J.K.; Beatty, C.M.; Seidel, M.P.; Jungst, L.J.; DeGrandpre, M.D. Controls of riverine CO2over an annual cycle determined using direct, high temporal resolution pCO2 measurements. J. Geophys. Res. Atmos. 2010, 115, G03016. [Google Scholar] [CrossRef]
  12. Wang, S.; Yeager, K.M.; Wan, G.; Liu, C.; Wang, Y.; Lü, Y. Carbon export and HCO3 fate in carbonate catchments: A case study in the karst plateau of southwestern China. Appl. Geochem. 2012, 27, 64–72. [Google Scholar] [CrossRef]
  13. Li, S.; Lu, X.X.; Bush, R.T. CO2 partial pressure and CO2 emission in the Lower Mekong River. J. Hydrol. 2013, 504, 40–56. [Google Scholar] [CrossRef]
  14. Pu, J.; Li, J.; Khadka, M.B.; Martin, J.B.; Zhang, T.; Yu, S.; Yuan, D. In-stream metabolism and atmospheric carbon sequestration in a groundwater-fed karst stream. Sci. Total. Environ. 2017, 579, 1343–1355. [Google Scholar] [CrossRef] [PubMed]
  15. Wang, F.S.; Wang, Y.; Zhang, J.; Xu, H.; Wei, X. Human impact on the historical change of CO2degassing flux in River Changjiang. Geochem. Trans. 2007, 8, 7. [Google Scholar] [CrossRef] [Green Version]
  16. Ran, L.; Lu, X.X.; Yang, H.; Li, L.; Yu, R.; Sun, H.; Han, J. CO2outgassing from the Yellow River network and its implications for riverine carbon cycle. J. Geophys. Res. Biogeosci. 2015, 120, 1334–1347. [Google Scholar] [CrossRef]
  17. Wang, X.; He, Y.; Yuan, X.; Chen, H.; Peng, C.; Zhu, Q.; Yue, J.; Ren, H.; Deng, W.; Liu, H. pCO2 and CO2 fluxes of the metropolitan river network in relation to the urbanization of Chongqing, China. J. Geophys. Res. Biogeosci. 2017, 122, 470–486. [Google Scholar] [CrossRef]
  18. Banks, D.; Odling, N.E.; Skarphagen, H.; Rohr-Torp, E. Permeability and stress in crystalline rocks. Terra Nova 1996, 8, 223–235. [Google Scholar] [CrossRef]
  19. Stober; Bucher. Origin of salinity of deep groundwater in crystalline rocks. Terra Nova 1999, 11, 181–185. [Google Scholar] [CrossRef]
  20. Weyhenmeyer, G.A.; Kortelainen, P.; Sobek, S.; Müller, R.; Rantakari, M. Carbon Dioxide in Boreal Surface Waters: A Comparison of Lakes and Streams. Ecosystems 2012, 15, 1295–1307. [Google Scholar] [CrossRef]
  21. Peter, H.; Singer, G.A.; Preiler, C.; Chifflard, P.; Steniczka, G.; Battin, T.J. Scales and drivers of temporal pCO2 dynamics in an Alpine stream. J. Geophys. Res. Biogeosci. 2014, 119, 1078–1091. [Google Scholar] [CrossRef]
  22. Lehner, B.; Liermann, R.; Revenga, C.; Vorosmarty, C.; Fekete, B.; Crouzet, P.; Döll, P.; Endejan, M.; Frenken, K.; Magome, J.; et al. High-resolution mapping of the world’s reservoirs and dams for sustainable river-flow management. Front. Ecol. Environ. 2011, 9, 494–502. [Google Scholar] [CrossRef] [PubMed] [Green Version]
  23. Grill, G.; Lehner, B.; Thieme, M.; Geenen, B.; Tickner, D.; Antonelli, F.; Babu, S.; Borrelli, P.; Cheng, L.; Crochetiere, H.; et al. Mapping the world’s free-flowing rivers. Nature 2019, 569, 215–221. [Google Scholar] [CrossRef] [PubMed]
  24. Ward, J.V.; Stanford, J.A. The Serial Discontinuity Concept of Lotic Ecosystem; Fontaine, T.D., Bartell, S.M., Eds.; Dynamics of Lotic Ecosystems; Ann Arbor Science Publishers: Ann Arbor, MI, USA, 1983; pp. 29–42. [Google Scholar]
  25. Barros, N.; Cole, J.J.; Tranvik, L.J.; Prairie, Y.T.; Bastviken, D.; Huszar, V.L.; del Giorgio, P.; Roland, F. Carbon emission from hydroelectric reservoirs linked to reservoir age and latitude. Nat. Geosci. 2011, 4, 593–596. [Google Scholar] [CrossRef]
  26. Milanović, P. Dams and Reservoirs in Karst. In Karst Management; Van Beynen, P.E., Ed.; Springer: Dordrecht, The Netherlands, 2011; pp. 47–73. [Google Scholar]
  27. Manoutsoglou, E.; Lazos, I.; Steiakakis, E.; Vafeidis, A. The Geomorphological and Geological Structure of the Samaria Gorge, Crete, Greece—Geological Models Comprehensive Review and the Link with the Geomorphological Evolution. Appl. Sci. 2022, 12, 10670. [Google Scholar] [CrossRef]
  28. Gong, R.B.; Han, Z.S.; Wang, T.F.; Li, C.M.; Zheng, B.D.; Zhou, X.V.; Wang, Z.H.; Zhang, B.R. Hydrogeological Survey Report of Water Supply Near Ji’nan; Hydrogeology Engineering Geology Brigade of Shandong Geological Bureau: Ji’nan, China, 1959. [Google Scholar]
  29. Rice, E.W.; Baird, R.B.; Eaton, A.D.; Clesceri, L.S. Standard Methods for the Examination of Water and Wastewater, 22nd ed.; American Public Health Association: Washington, DC, USA; The American Water Works Association and the Water Environment Federation: Washington, DC, USA, 2012. [Google Scholar]
  30. Atekwana, E.A.; Krishnamurthy, R.V. Seasonal variations of dissolved inorganic carbon and δ13C of surface waters: Application of a modified gas evolution technique. J. Hydrol. 1998, 205, 265–278. [Google Scholar] [CrossRef]
  31. Wigley, T.M.L. WATSPEC: A Computer Program for Determining the Equilibrium Speciation of Aqueous Solutions; Geo-Abstracts for the journal of British Geomorphological Research Group; British Society for Geomorphology: London, UK, 1977; pp. 1–49. [Google Scholar]
  32. Hu, H.J.; Wei, Y.X. Freshwater Algae in China: System, Ecology and Classification; Science Press: Beijing, China, 2006. [Google Scholar]
  33. Liu, W.; Pu, J.B.; Zhang, C. A Portable Greenhouse Gas Collection Equipment in Water and Land Dual-Use. China Patent ZL 201420363633.4, 11 May 2014. (In Chinese). [Google Scholar]
  34. UNESCO/IHAGHG. Greenhouse gas emissions related to freshwater reservoirs. In World Bank Report; The World Bank: Washington, DC, USA, 2010; pp. 64–127. [Google Scholar]
  35. Zheng, L.; Tang, H.; Wang, Z.; Wang, Z. Phytoplankton investigation and water quality evaluation in the landscape water of Daminghu Lake in Jiannan. J. Shandong Norm. Univ. 2017, 32, 135–138. (In Chinese) [Google Scholar]
  36. Zhang, T.; Li, J.; Pu, J.; Martin, J.B.; Khadk, M.B.; Wu, F.; Li, L.; Jiang, F.; Huang, S.; Yuan, D. River sequesters atmospheric carbon and limits the CO2 degassing in karst area, southwest China. Sci. Total. Environ. 2017, 609, 92–101. [Google Scholar] [CrossRef]
  37. Zhang, T.; Li, J.; Pu, J.; Yuan, D. Carbon dioxide exchanges and their controlling factors in Guijiang River, SW China. J. Hydrol. 2019, 578, 124073. [Google Scholar] [CrossRef]
  38. Drysdale, R.; Lucas, S.; Carthew, K. The influence of diurnal temperatures on the hydrochemistry of a tufa-depositing stream. Hydrol. Process. 2003, 17, 3421–3441. [Google Scholar] [CrossRef]
  39. Alin, S.R.; de Fátima, F.L.; Rasera, M.; Salimon, C.I.; Richey, J.E.; Holtgrieve, G.W.; Krusche, A.V.; Snidvongs, A. Physical controls on carbon dioxide transfer velocity and flux in low-gradient river systems and implications for regional carbon budgets. J. Geophys. Res. Atmos. 2011, 116, G01009. [Google Scholar] [CrossRef]
  40. Hall, R.O.; Ulseth, A.J. Gas exchange in streams and rivers. WIREs Water 2020, 7, e1391. [Google Scholar] [CrossRef]
  41. Zhang, T.; Li, J.; Pu, J.; Wu, F. Physical and chemical control on CO2 gas transfer velocities from a low-gradient subtropical stream. Water Res. 2021, 204, 117564. [Google Scholar] [CrossRef] [PubMed]
  42. Raymond, P.A.; Zappa, C.J.; Butman, D.; Bott, T.L.; Potter, J.; Mulholland, P.; Laursen, A.E.; McDowell, W.H.; Newbold, D. Scaling the gas transfer velocity and hydraulic geometry in streams and small rivers. Limnol. Oceanogr. Fluids Environ. 2012, 2, 41–53. [Google Scholar] [CrossRef]
  43. Barth, J.A.; Veizer, J. Carbon cycle in St. Lawrence aquatic ecosystems at Cornwall (Ontario), Canada: Seasonal and spatial variations. Chem. Geol. 1999, 159, 107–128. [Google Scholar] [CrossRef]
  44. Meybeck, M. Riverine transport of atmospheric carbon: Sources, global typology and budget. Water Air Soil Pollut. 1993, 70, 443–463. [Google Scholar] [CrossRef]
  45. Ludwig, W.; Amiotte Suchet, P.; Probst, J.L. River discharges of carbon to the world’s oceans: Determining local inputs of alkalinity and of dissolved and particulate organic carbon. Sci. Terre Et Planètes (Comptes rendus de l’Académie des sciences) 1996, 323, 1007–1014. [Google Scholar]
  46. De Montety, V.; Martin, J.B.; Cohen, M.; Foster, C.; Kurz, M. Influence of diel biogeochemical cycles on carbonate equilibrium in a karst river. Chem. Geol. 2011, 283, 31–43. [Google Scholar] [CrossRef]
  47. Öequist, M.G.; Wallin, M.; Seibert, J.; Bishop, K.; Laudon, H. Dissolved Inorganic Carbon Export Across the Soil/Stream Interface and Its Fate in a Boreal Headwater Stream. Environ. Sci. Technol. 2009, 43, 7364–7369. [Google Scholar] [CrossRef]
  48. Grömping, U. Relative importance for linear regression in R: The package relaimpo. J. Stat. Softw. 2006, 17, 139–147. [Google Scholar] [CrossRef] [Green Version]
  49. Wang, S.; Wan, G.; Liu, C.; Yang, W.; Zhu, Z.; Xiao, H.; Tao, F. Geochemical changes of CO2 and its atmospheric CO2 source sink effect in lakes of Yunnan-Guizhou Plateau. Quat. Res. 2003, 23, 581. [Google Scholar] [CrossRef]
  50. Yu, Y.; Liu, C.; Wang, F.; Wang, B.; Wang, S.; Liu, F. Spatiotemporal characteristics and diffusion flux of partial pressure of dissolved carbon dioxide (pCO2) in Hongjiadu reservoir. Chin. J. Ecol. 2008, 27, 1193–1199. [Google Scholar]
  51. Pu, J.; Li, J.; Zhang, T.; Martin, J.B.; Yuan, D. Varying thermal structure controls the dynamics of CO2 emissions from a subtropical reservoir, south China. Water Res. 2020, 178, 115831. [Google Scholar] [CrossRef]
  52. Telmer, K.; Veizer, J. Carbon fluxes, pCO2 and substrate weathering in a large northern river basin, Canada: Carbon isotope perspectives. Chem. Geol. 1999, 159, 61–86. [Google Scholar] [CrossRef]
  53. Cerling, T.E.; Solomon, D.; Quade, J.; Bowman, J.R. On the isotopic composition of carbon in soil carbon dioxide. Geochim. Cosmochim. Acta 1991, 55, 3403–3405. [Google Scholar] [CrossRef]
  54. Palmer, S.M.; Hope, D.; Billett, M.F.; Dawson, J.J.; Bryant, C.L. Sources of organic and inorganic carbon in a headwater stream: Evidence from carbon isotope studies. Biogeochemistry 2001, 52, 321–338. [Google Scholar] [CrossRef]
  55. Mook, W.G.; de Vries, J.J. Environmental isotopes in the hydrological cycle principles and applications. In Technical Documents in Hydrology1; UNESCO; IAEA: Paris, France, 2000; Volume 4, No. 39. [Google Scholar]
  56. Doctor, D.H.; Kendall, C.; Sebestyen, S.D.; Shanley, J.B.; Ohte, N.; Boyer, E.W. Carbon isotope fractionation of dissolved inorganic carbon (DIC) due to outgassing of carbon dioxide from a headwater stream. Hydrol. Process. 2008, 22, 2410–2423. [Google Scholar] [CrossRef]
  57. Hellings, L.; Dehairs, F.; Van Damme, S.; Baeyens, W. Dissolved inorganic carbon in a highly polluted estuary (the Scheldt). Limnol. Oceanogr. 2001, 46, 1406–1414. [Google Scholar] [CrossRef] [Green Version]
  58. Davidson, E.A.; Figueiredo, R.O.; Markewitz, D.; Aufdenkampe, A.K. Dissolved CO2 in small catchment streams of eastern Amazonia: A minor pathway of terrestrial carbon loss. J. Geophys. Res. Atmos. 2010, 115, 470–479. [Google Scholar] [CrossRef]
  59. Wang, Z.; Yin, J.-J.; Pu, J.; Xiao, Q.; Zhang, T.; Li, J. Flux and influencing factors of CO2 outgassing in a karst spring-fed creek: Implications for carbonate weathering-related carbon sink assessment. J. Hydrol. 2020, 596, 125710. [Google Scholar] [CrossRef]
  60. Liu, H.; Liu, Z.; Macpherson, G.; Yang, R.; Chen, B.; Sun, H. Diurnal hydrochemical variations in a karst spring and two ponds, Maolan Karst Experimental Site, China: Biological pump effects. J. Hydrol. 2015, 522, 407–417. [Google Scholar] [CrossRef]
  61. Lu, W.; Wang, S.; Yeager, K.M.; Liu, F.; Huang, Q.; Yang, Y.; Xiang, P.; Lü, Y.; Liu, C.-Q. Importance of Considered Organic Versus Inorganic Source of Carbon to Lakes for Calculating Net Effect on Landscape C Budgets. J. Geophys. Res. Biogeosci. 2018, 123, 1302–1317. [Google Scholar] [CrossRef]
  62. Peng, X.; Liu, C.-Q.; Wang, B.; Zhao, Y.-C. The impact of damming on geochemical behavior of dissolved inorganic carbon in a karst river. Chin. Sci. Bull. 2014, 59, 2348–2355. [Google Scholar] [CrossRef]
  63. Qiu, J. Chinese dam may be a methane menace. Nature 2009, 29, 1038. [Google Scholar] [CrossRef]
  64. Tranvik, L.J.; Downing, J.A.; Cotner, J.B.; Loiselle, S.A.; Striegl, R.G.; Ballatore, T.J.; Dillon, P.; Finlay, K.; Fortino, K.; Knoll, L.B.; et al. Lakes and reservoirs as regulators of carbon cycling and climate. Limnol. Oceanogr. 2009, 54, 2298–2314. [Google Scholar] [CrossRef] [Green Version]
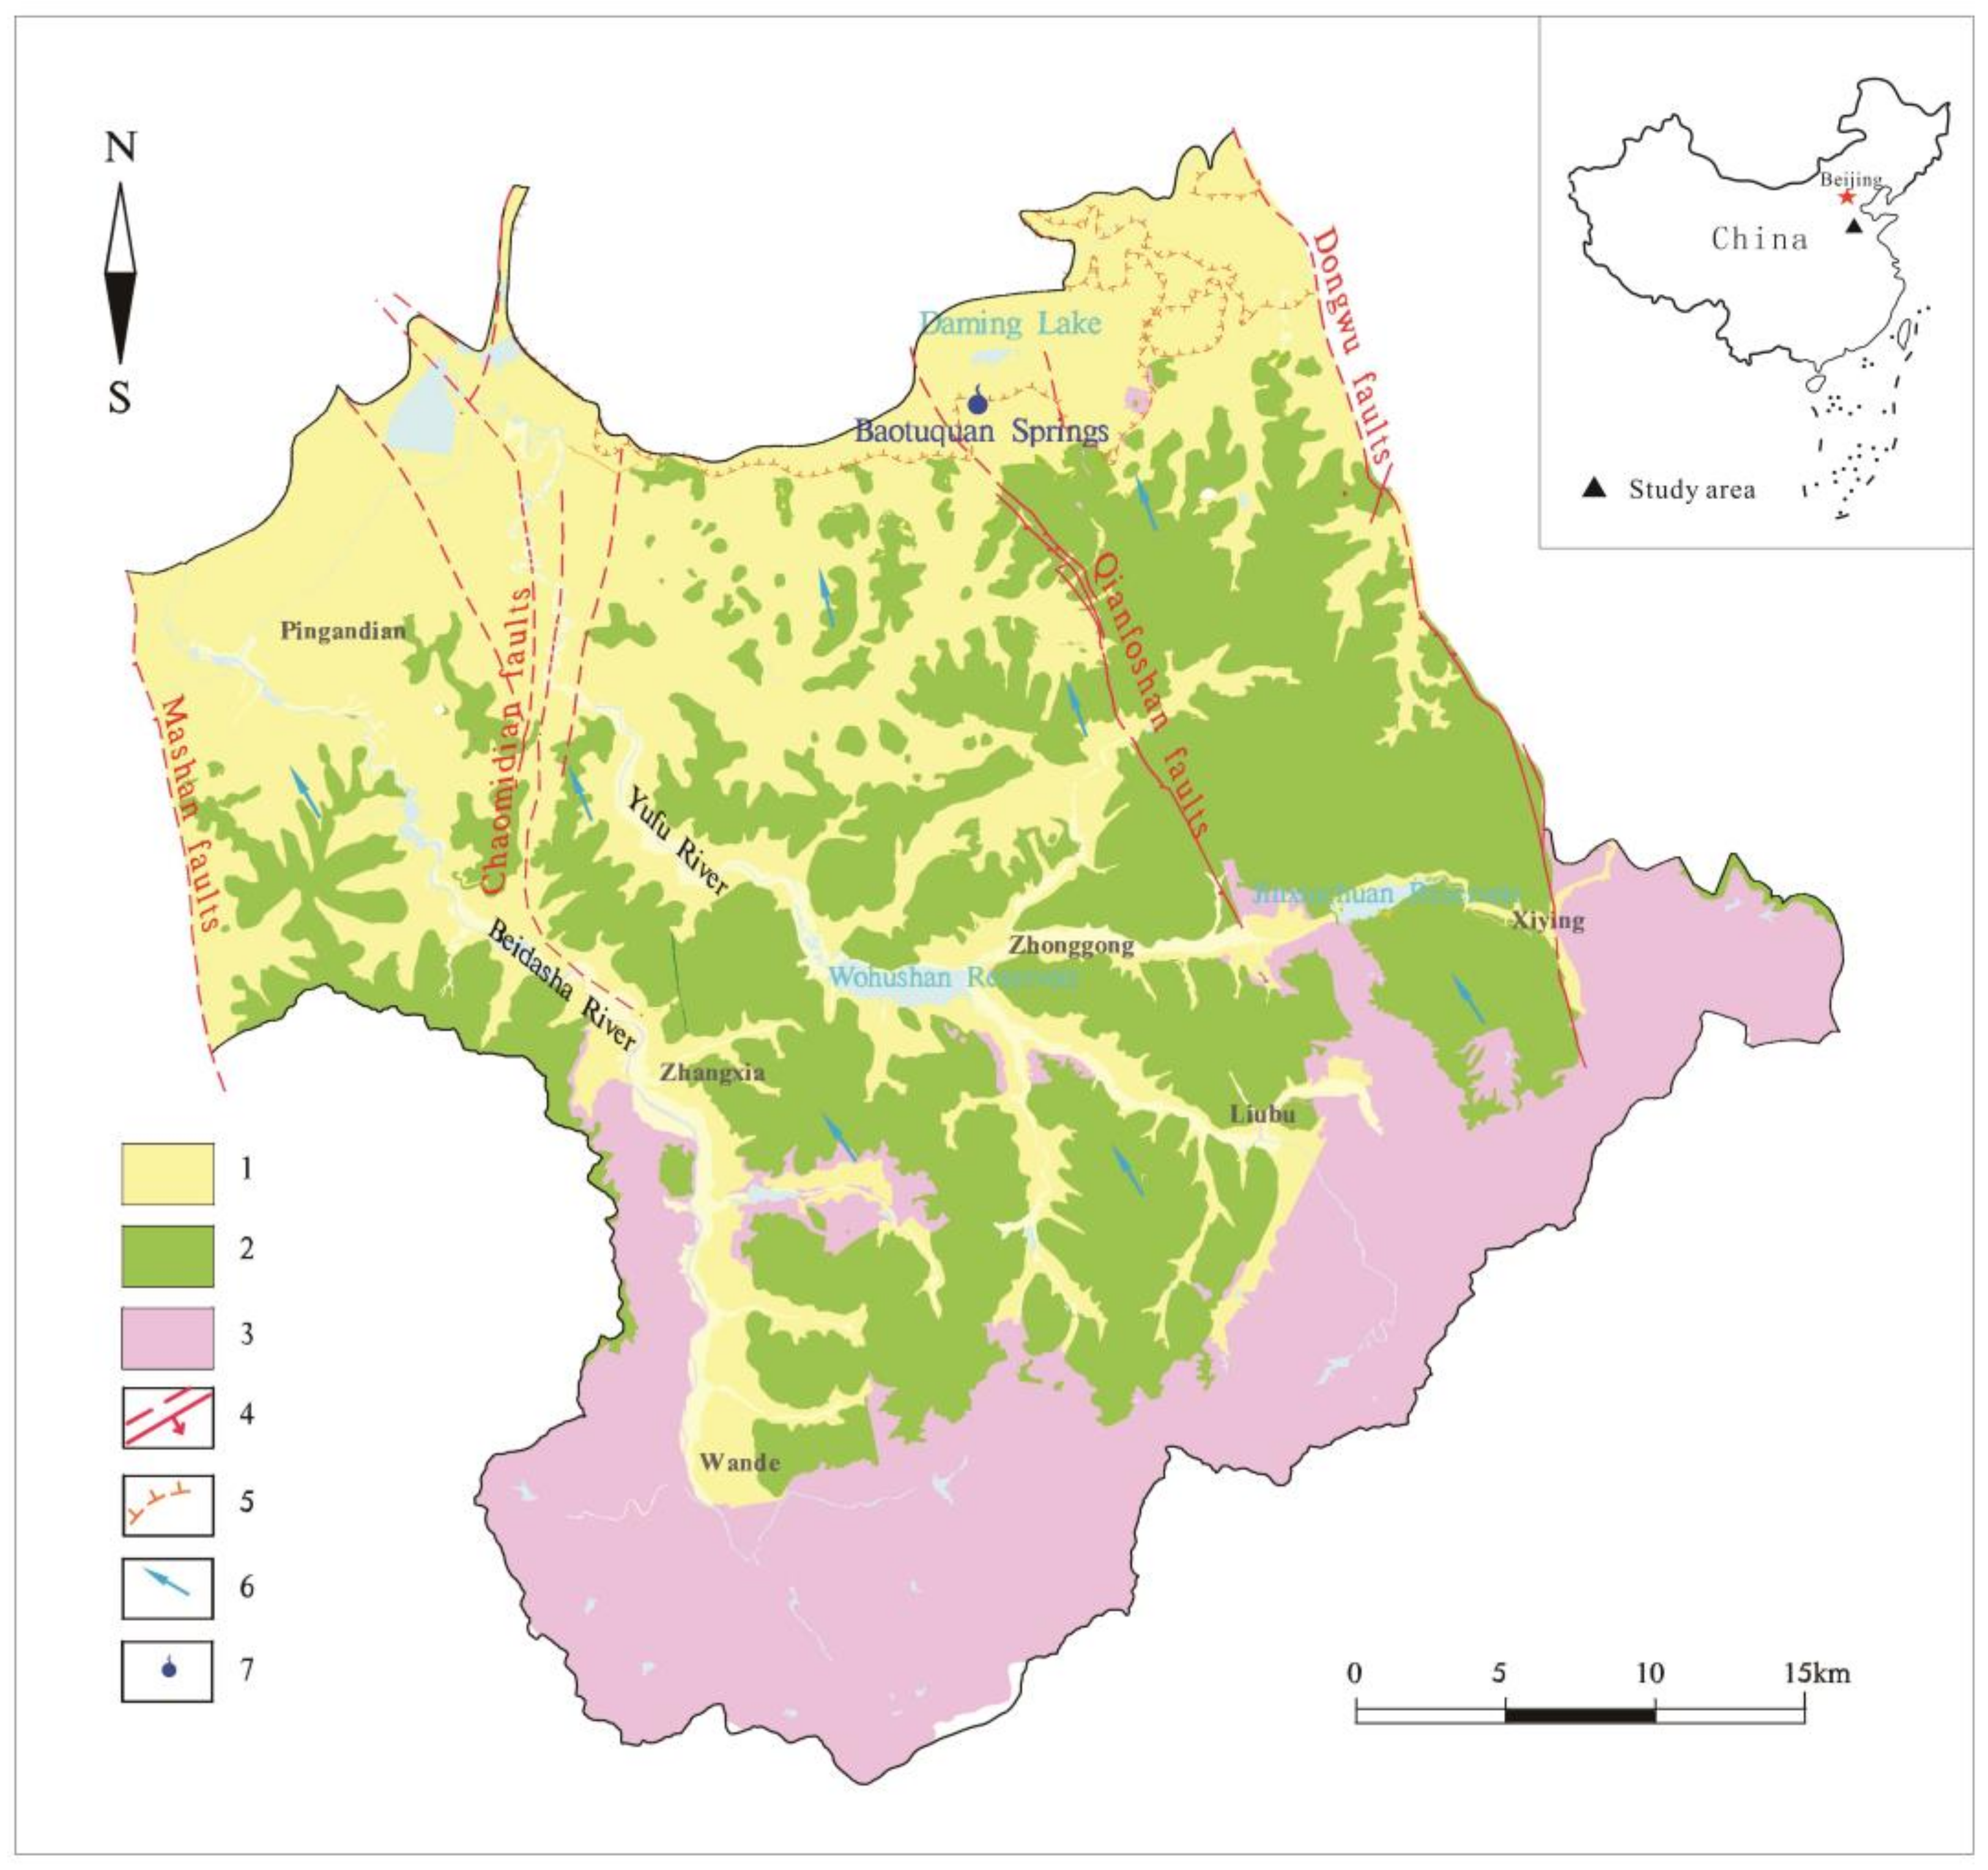
Figure 1. The location and geological sketch of the Baotuquan Spring area (1. Quaternary; 2. Ordovician–Cambrian; 3. Archaean; 4. faults; 5. magmatic boundary; 6. flow of groundwater; and 7. springs).
Water 15 02567 g001
Figure 2. Schematic diagram of the karst water movement path in the Jinan area ([28]).
Water 15 02567 g002
Figure 3. Distribution map of the sampling sites.
Water 15 02567 g003
Figure 4. Piper diagrams of the hydrochemistry in the BTQ discharge area (the triangle represents the spring, the square represents the river, and the circle represents the lake; the left figure represents the proportion of the main cations, while the right one represents the proportion of the main anions).
Water 15 02567 g004
Figure 5. The variations in the hydrogeochemical parameters in the BTQ discharge area. (The circle represents the average value, the long horizontal line represents the median value, and the short horizontal line represents the maximum and minimum values; The ANOVA is the analysis of variance, df is the degree of freedom, which represents the unlimited number of variables, p value is the significance).
Water 15 02567 g005
Figure 6. Box diagram of the CO2 degassing flux across the water–air interface in the BTQ discharge area. (The square represents the average value, the long horizontal line represents the median value, and the short horizontal line represents the maximum and minimum values).
Water 15 02567 g006
Figure 7. Correlation between CO2 degassing fluxes and geochemical parameters across the water–air interface in the BTQ discharge area ((a,b): The correlation between CO2 flux with water velocity and water temperature; (c,d): The correlation between DO with pCO2 and pH; (e,f): The correlation between CO2 flux with pCO2 and SIc.).
Water 15 02567 g007
Figure 8. Correlation of phytoplankton abundance with the DO (a) and pCO2 values (b).
Water 15 02567 g008
Figure 9. Correlation between the δ13CDIC values and the geochemical parameters (ad): The correlation between the δ13CDIC values with DIC, CO2 flux, SIc and DO, respectively.).
Water 15 02567 g009
Table 1. Multiple linear regressions of CO2 flux as a function of pCO2 and water velocity in the BTQ a.
CoefficientInterceptR2Lmg bdf
pCO2Water VelocitypCO2Water Velocity
0.070.77 ***0.00.659.3%55.2%17
Note(s): a *** p < 0.001, blank, not significant. b The average incremental contribution of each predictor (DO and water level) to the total R2 of the model.
Disclaimer/Publisher’s Note: The statements, opinions and data contained in all publications are solely those of the individual author(s) and contributor(s) and not of MDPI and/or the editor(s). MDPI and/or the editor(s) disclaim responsibility for any injury to people or property resulting from any ideas, methods, instructions or products referred to in the content.