Article

Influence of Rainfall Pattern on Wetness Index for Infinite Slope Stability Analysis

1
Department of Civil Engineering, Dong-A University, Busan 49315, Republic of Korea
2
Department of Civil and Environmental Engineering, Chung-Ang University, Seoul 06974, Republic of Korea
3
Department of Fire and Disaster Prevention, Konkuk University, 268 Chungwon-daero, Chungju 27478, Republic of Korea
*
Author to whom correspondence should be addressed.
Water 2023, 15(14), 2535; https://doi.org/10.3390/w15142535
Submission received: 24 May 2023 / Revised: 6 July 2023 / Accepted: 9 July 2023 / Published: 11 July 2023

Abstract

:
Landslides are one of the riskiest disasters combining excessive rainfall and unstable slope that a wetness index can quantify. The wetness index generated by water infiltration considering the rainfall pattern such as cumulated rainfall, rainfall duration and rainfall intensity should be estimated for the slope stability analysis. Even though the infiltration capacity of soils has been largely focused to evaluate the slope stability, the temporal patterns of rainfall have commonly been ignored or assumed as a steady state for the prediction of the slope failure in the previous studies. Thus, this study focuses more on evaluating the influence of various rainfall patterns on the slope stability, and compares it with an actual landslide incident that occurred in 2011, in Korea. The factor of safety (FS) considering the time-dependent wetness index variation is used to determine the slope stability. For the various rainfall designs, the uniform rainfall distribution, Yen and Chow, Mononobe, alternating block and second quartile Huff models are adopted. Thereafter, the FS variations from five models are compared with an actual landslide incident in Seoul, Korea. Among the rainfall designs, the models that consider the abrupt rainfall intensity capture the landslide time with an FS < 1. Therefore, the appropriate adoption of a rainfall distribution model should be highlighted for landslide prediction.

1. Introduction

Slope instability in mountain terrains, which can generate slope failures such as landslides, is one of the critical factors in widespread natural disasters. Recently, slope stability analysis has received attention from civil engineers because urban development and enlarging city areas have been widely seen, due to the rapid increase in populations [1]. A slope failure can be generally triggered by rainfall, which builds up a pore water pressure between soil particles, so that it results in the loss of the effective stress in the slope [2,3,4,5,6]. Thus, the infiltrated water from the slope surface induced by rainfall should be considered as well as the rising groundwater table [7].
For the consideration of the degree of water infiltration, the concept of the wetting front can be used for the estimation of the wetness index, proposed by Beven and Kirkby [8]. Numerous studies have applied the wetness index for the slope stability analysis using an infinite slope model [9,10]. The wetness index presents a ratio of the saturation depth to the thickness of soils in an infinite slope model, thus the slope stability continuously changes as the wetting front increases. Thus, the wetness index depends on the infiltration capacity of soils and rainfall patterns [7]. Geotechnical engineers have focused on the infiltration capacity of soils, which is determined by soil properties such as the unit weight, porosity and mineral composition, to evaluate the slope stability [11,12]. However, the rainfall patterns have been ignored or assumed as a steady state for the prediction of the slope failure [13]. From the observation of the rainfall conditions after the occurrence of slope failure, rainfall patterns composed of cumulated rainfall, rainfall duration and rainfall intensity play a crucial role in the slope stability [14,15,16,17]. For this reason, each rainfall pattern or combined patterns such as rainfall intensity duration (ID) should be considered for the prediction of the probability of a slope failure [18,19]. In addition, the antecedent rainfall and soil moisture content should be reflected because it may accelerate the wetness index temporarily [20,21].
There have been numerous attempts to develop landslide hazard assessment models, which can be classified into three categories: (1) data-driven approaches, (2) physically based models and (3) empirical/hydrological models [22]. First, the data-driven landslide susceptibility assessment approach is based on the statistical analysis with transferred data from the locations where landslides have occurred frequently to landslide-free locations under similar climatic and geophysical conditions. It mainly focuses on the landslide influencing factors using past and present landslide datasets [23,24,25]. Although this method is considered to provide more accurate results than other approaches [26], it has been challenged by the difficulties in collecting a sufficient amount of data with their spatial distribution and ignoring the complex physical processes involved in landslide initiation [27,28]. The physically based models have been widely adopted to analyze rainfall-induced landslide risk on the virtue of their capability to calculate the physical processes governing landslides mathematically and dynamically [29,30]. Hence, they can quantify the slope stability by combining the infinite slope stability approach and hydrological assumptions considering the geotechnical characteristics of a slope based on the GIS information [31,32,33,34,35]. The last one is a simple but efficient approach for Early Warning Systems (EWSs) based on empirical models. Many empirical models, including intensity-duration (ID) schemes [36,37,38] and antecedent precipitation (AP) approaches [39,40,41], and combined methods have been proposed [42]. They commonly demonstrate how to determine certain thresholds or critical values for rainfall intensity triggering landslide hazards based on hydrological theories. For instance, De Luca and Versace [43] proposed a generalized empirical/hydrological model that provides a mobility function from the real pattern of rainfall data by advancing the Forecasting of Landslides Induced by Rainfalls (FLaIR) model developed by [44,45,46].
Unlike previous studies, this study conducts a comprehensive evaluation of the design rainfall temporal distribution models to determine the most appropriate model to detect landslide events that recently occurred in Korea. In East Asian regions, including Korea, Japan, Thailand and Indonesia, we develop and apply the pre-determining models that can distribute a total amount of observed storm events to derive design hyetographs [47]. Although these models have mostly been used for hydrologic purposes (e.g., determining the size of hydraulic structures or estimating flood quantiles under specific return periods) [48], they can definitely be adopted to predict landslide occurrence as this is highly correlated with the temporal structure of intense rainfall events [49]. In fact, there have been several attempts to investigate the influence of temporal rainfall patterns on the risk of landslides [50,51,52,53,54]. However, those who applied distribution models are limited to taking simple-shaped patterns such as uniform and linear models with a monotonous increase or decrease, or a certain type of probability distribution function, which rarely occur in reality. In addition, as the temporal characteristics of rainfall become unpredictable or complex due to the impact of the changing climate, it is important to widen our perspectives on more models prone to landslide occurrence by considering the observed rainfall patterns. This study focuses on the purposes of designing landslide prevention structures or early warning systems by figuring out the most suitable observation-based rainfall distribution model for detecting landslide occurrences, and further validates the model’s predictability with actual events that occurred in 2011, in Korea.
In this study, the rainfall pattern models are considered to evaluate the wetness index and factors of safety variations during infinite slope stability analysis. First, the slope stability determination using a factor of safety (FS) regarding the wetness index is introduced. Thereafter, the concepts of four temporal distributions of design rainfall are described, and an actual landslide in July 2011 in Seoul, Korea, is reported. Finally, the FSs from uniform rainfall distribution and four design rainfalls are compared with the actual landslide incident to determine the reliable model.

2. Methodology

2.1. Slope Stability

For the estimation of slope stability at a shallow depth, an infinite slope model is widely used, assuming that the length of the probable failure plane is relatively greater than the depth and the probable failure plane is parallel to the slope surface. The schematic drawing of the infinite slope model is presented in Figure 1.
The infinite slope stability analysis can be carried out by using the factor of safety (FS) and the FS is derived as follows:
τ = T b / cos β = W b cos β sin β
σ = P b / cos β = W b cos 2 β
where τ and σ are shear stress and vertical stress on the failure plane. T, P, b, β and W denote total shear stress, total vertical stress, width, gradient and weight of target slope. Meanwhile, the slope failure occurs when the shear stress on the probable failure plane is greater than the shear strength, and the shear strength can be expressed according to the Mohr–Coulomb failure criterion as follows:
S = c + ( σ u ) tan ϕ
where S, c, u and φ denote shear strength, cohesion, pore water pressure and internal friction angle of soils. For the application of FS to estimate slope stability as mentioned above, the shear stress in Equations (1) and (3) can be expressed as follows:
τ = S F S
By substitution of Equations (1)–(4), the equation of the infinite slope stability is determined as follows:
W b cos β sin β = 1 F S c + ( W b cos 2 β u ) tan ϕ
In addition, Equation (5) can be expressed in terms of FS for the utilization of slope failure criterion as follows:
F S = c + ( γ D cos 2 β u ) t a n ϕ γ D cos β sin β = c + cos 2 β γ ( D D w ) + cos 2 β ( γ γ w ) D w tan ϕ γ D cos β sin β
where γ, γw, D and Dw are the unit weights of soils and water, and the depth of soils and infiltrated water, respectively. As presented in Equation (6), the FS is significantly affected by the infiltrated water; thus, the depth of the infiltrated water should be considered to determine the slope stability.
A number of previous studies have introduced and applied a wetness index, which is a ratio of the depth of the infiltrated water to that of the depth of soils, as follows:
m = D w D
where m is a wetness index. Based on Darcy’s law, the water flow in the infiltrated and saturated slope subsurface is as follows:
i A = k D w b sin β
where i, A and k are the rainfall intensity, target area and hydraulic conductivity of soils. By substituting Equation (8) into Equation (7), the wetness index is as follows:
m = i a k D sin β
where a is A divided by b. For the application of the wetness index, Equation (6) can be simply expressed as follows:
F S = c + cos 2 β γ ( D D w ) + ( γ γ w ) D w tan ϕ γ D cos β sin β = c + cos 2 β ( γ D γ w D w ) tan ϕ γ D cos β sin β = c γ D cos β sin β + cos β tan ϕ sin β γ w cos β tan ϕ γ sin β m = C + tan ϕ tan β ( 1 γ w γ m )
However, the depth of the infiltrated water varies with a rainfall patterns such as cumulated rainfall, rainfall duration and rainfall intensity; thus, the FS should consider the time-dependent variation owing to the effect of the rainfall patterns on the wetness index as follows:
F S = C + tan ϕ tan β { 1 γ w γ m ( t ) }
where m(t) presents the wetness index as a function of time. Finally, the slope stability analysis reflects the rainfall patterns by the application of FS in Equation (11). The slope failure may occur when the FS is lower than 1.0, at which the slope stability is unstable. For the FS greater than 1.0, the slope stability can become quasi-stable, moderately stable and stable as summarized in Table 1. Three stable states are divided by the values of 1.0, 1.25 and 1.50 [55]. In this study, the slope stability is mainly determined by the FS value of 1.0 whether the state is stable or unstable.

2.2. Temporal Distribution of Design Rainfall

2.2.1. The Yen and Chow Model

A simple triangle-shaped design hyetograph for small drainage basins was developed, characterized by the statistical moments of dimensionless time with the design rainfall depth R (mm) and duration T (h) [56]. Hence, the total area of the hyetograph is R. The peak value of rainfall (height of the triangle) is calculated as 2R/T (mm/h) and the peak time of rainfall is dependent upon a storm advancement coefficient (r), which is defined as the ratio between the peak time of rainfall and the rainfall duration. It can be divided into three types, such as a centered-type model (r = 0.5), an advanced-type model (r < 0.5) and a delayed-type model (r > 0.5).

2.2.2. The Mononobe Model

The Mononobe model is a simple temporal downscaling equation for rainfall given the storm’s duration and total rainfall depth. It considers a difference in the cumulative rainfall depths between the previous and current time interval to obtain the design hyetograph [57]. The cumulative rainfall depth until the specific time t can be obtained from Equation (12) below:
R t = R T T T t n t
where Rt is the cumulative rainfall depth (mm) up to time t, RT is the design rainfall depth (mm) and T is the design rainfall duration (h). In general, the constant n is assumed to be 2/3 in Asian regions [58,59]. After locating the rainfall peak, the next largest rainfall intensity is located alternately around the rainfall peak by turn. The Mononobe model can be classified into three types, advanced, delayed and centered, depending on the location of the rainfall peak. When the rainfall peak is located before the center of the storm duration, we call it “advanced type”, but if the case is the opposite, it is indicated as the “delayed type”. The “centered type” means the rainfall peak is at the mid-point of the total duration. The centered type Mononobe model has been applied to distribute the design rainfall depth by analyzing the rainfall data mainly in Asia, including Korea and Indonesia [60,61,62].

2.2.3. The Alternating Block Method

The alternating block method introduces the statistical properties of rainfall data, namely the rainfall intensity-duration-frequency (I-D-F) curve, to temporally distribute the design rainfall. It is often used in the US for the purposes of hydraulic structure design [63]. First, the design rainfall duration T (h) needs to be determined and equally separated by the unit time interval Δt. Then, the rainfall intensities for each rainfall duration of Δt, 2Δt, 3Δt, etc. are estimated from a local I-D-F curve. Accordingly, the cumulative rainfall depths for the considered rainfall durations are calculated by multiplying the rainfall intensity by the corresponding duration. The rainfall intensities for the unit interval Δt at each time step during the rainfall duration can be obtained from the sequential subtraction between the successive cumulative rainfall depths. The highest rainfall intensity block is assumed to occur at the mid-point of the design storm duration and the remaining blocks of rainfall intensities are arranged in descending order from the center block to the right and left, similar to the centered type Mononobe model [64].

2.2.4. The Huff Model

The Huff model is highly dependent on the observed rainfall patterns as it was derived initially based on analyzing the temporal patterns of storm events in Illinois, Indiana, Michigan, Maryland, Minnesota, Wisconsin, Ohio and Kentucky. Huff [65] analyzed the rainfall data collected over small basins (less than 400 mi2) and extracted a normalized model of temporal rainfall distribution. That is, the observed rainfall events are transformed into dimensionless ones by normalizing the time by the total rainfall duration, and the cumulative rainfall depth is also normalized by the total rainfall amount. The normalized rainfall distributions are separated into four types (i.e., first, second, third and fourth quartiles), dividing the normalized duration with respect to the frequent occurrence of the rainfall peak over the rainfall duration. Then, only those rainfall events locating their peak times within the same quartile are collected. For each type, the cumulative probability distributions are derived by applying the smoothing scheme, which indicates that the normalized cumulative rainfall at each normalized time is expressed by its exceedance probability [66]. The cumulative probabilities of exceedance occurrence for 10% to 90% with increments of 10% are derived. As a result, the second quartile 50% Huff model represents a cumulative rainfall pattern that should be exceeded in about half of the storms with which their rainfall peaks locate the second quartile of the normalized durations.
The dimensionless Huff model for each type is described as follows:
P T ( i ) = T ( i ) T × 100
P R ( i ) = R ( i ) R × 100
where PT(i) is the dimensionless time percentage of the time T(i) over the rainfall duration T, and PR(i) is the cumulative rainfall depth percentage calculated as a ratio between the rainfall depth R(i) cumulated from the time zero to the time T(i) and the total rainfall depth R. Generally, 10 time intervals are considered (i.e., i = 1, …, 10). When design rainfall duration and total rainfall depth are determined, we can derive the Huff model by multiplying those by PT(i) and PR(i).

3. Results and Analyses

3.1. Landslides in July 2011 in Seoul, Korea

A total of 151 landslides and 33 debris flows, which resulted in extensive damage to infrastructures, houses and roads, were triggered by rainfall events in July 2011 in Umyeon-mountain, Seoul, Korea. The Umyeon-mountain area has been subjected to humid conditions owing to the extreme rainfall events during the summer and dry conditions during the winter, which represents temperate monsoon zone. In particular, the averaged total precipitation has ranged between 1100 and 1500 mm per year, and 70% of precipitation has been distributed in the summer season. This annual trend of rainfall distribution including intensity and duration is adoptable for most of Korea’s territory, so that the applicable temporal distribution of a rainfall model can be used to predict the slope failure [67].
On 27 July 2011, the rainfall intensity and cumulative rainfall were recorded by rain gauges in Seocho station, which is the closest station to Umyeon-mountain. Figure 2 shows the recorded data for 13 h including the slope failure moments around 8 a.m. The rainfall intensity is distributed between 0 and 10 mm/10 min from 1 a.m. to 7 a.m., increases from 7 a.m. to 8:30 a.m., and begins to let up after 10 a.m. During the recorded period, the peak rainfall intensity was 17.5 mm/10 min, which corresponds to a heavy rainfall value of 105 mm/h. For the cumulative rainfall, the value gradually increased from 1 a.m. to 7 a.m., significantly increased from 7 a.m. to 8:30 a.m., and tended to converge after 10 a.m. The total cumulative rainfall during the recorded 13 h was 280 mm, which corresponds to 516.9 mm of the cumulative 24 h rainfall amount. During this rainfall event, the slope failure occurred around 8 a.m., which did not match with the highest peak rainfall intensity since the depth of infiltrated water is dependent on overall rainfall pattern. Thus, the time-dependent FS owing to the wetness index should be considered.
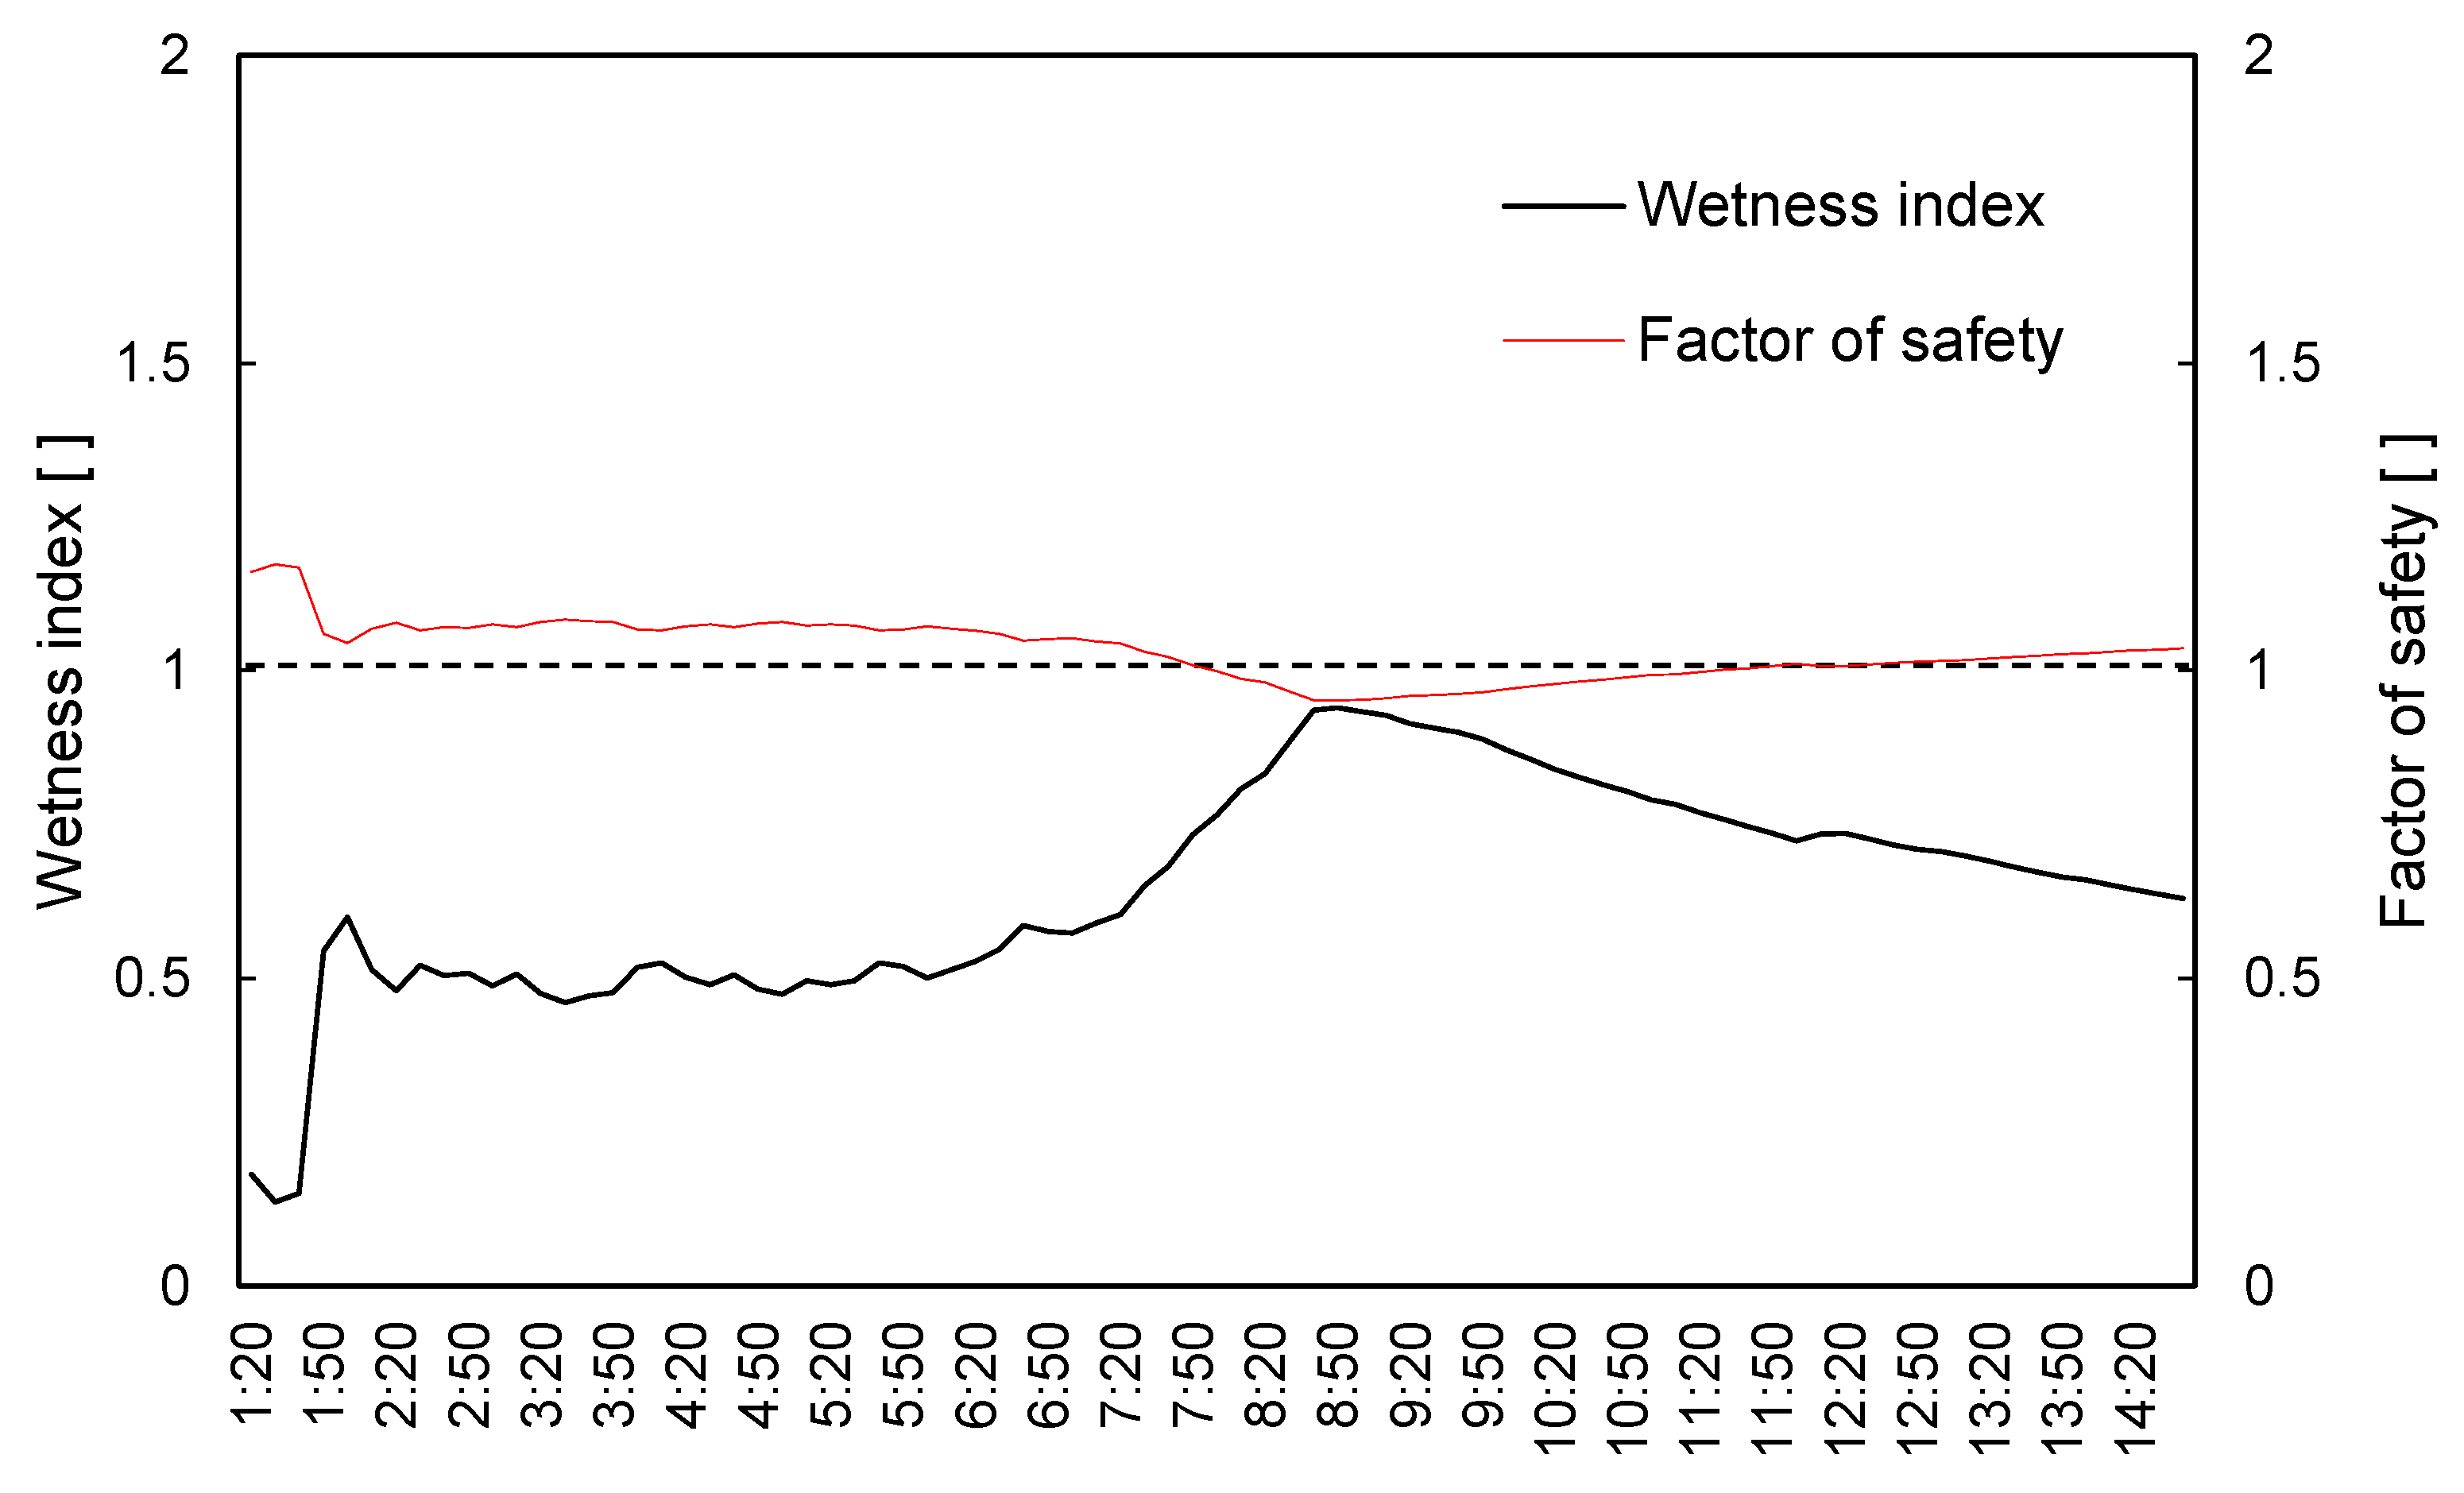
The variation of the wetness index and FS from the recorded data are presented in Figure 3. For the estimation of the wetness index, the factors such as hydraulic conductivity, depth of soil and slope gradient should be pre-determined as expressed in Equation (9). After the slope failure in Umyeon-mountain, post-event investigation in the geotechnical field was conducted for cause analysis and several reports have been presented [68,69]. From the previous investigations, the hydraulic conductivity of 28.8 mm/h, the soil depth of 2 m and a slope gradient of 35° were determined. In addition, the cohesion of 12 kPa, soil unit weight of 18.5 kN/m3 and internal friction angle of 20° were adopted for the estimation of the FS as expressed in Equation (10). The wetness index indicated by black line varied similar to the rainfall intensity up to 9 am (see Figure 2), but decreased after the highest peak rainfall intensity. Note that the water infiltrated into the soil continuously flowed along the slope; thus, the wetness index might have decreased when the rainfall intensity was insufficient. Meanwhile, the FS varied contrary to the wetness index, and it began to decrease under the value of 1.0 around 8 a.m. In this study, the slope stability is determined by the FS value of 1.0, whether the state is stable or unstable, and the beginning of the unstable time is well-matched with the slope failure moment as shown in Figure 2. Thus, the pre-determined factors from previous investigations are reliable to be used in further model analysis.

3.2. Impact of Rainfall Pattern on Slope Stability

To evaluate the impact of temporal rainfall patterns on slope stability, we first redistributed the total cumulative rainfall during the rainfall event triggering the landslide at Umyeon-mountain, Seoul, Korea. The four distribution models described in Section 2.2 and a case assuming that rainfall intensities are uniformly distributed were used to locate a total rainfall amount of 280 mm, which was recorded within 13 h. The unit time interval Δt was set to be 10 min, so the total rainfall depth was redistributed with 10 min rainfall intensities in this study.
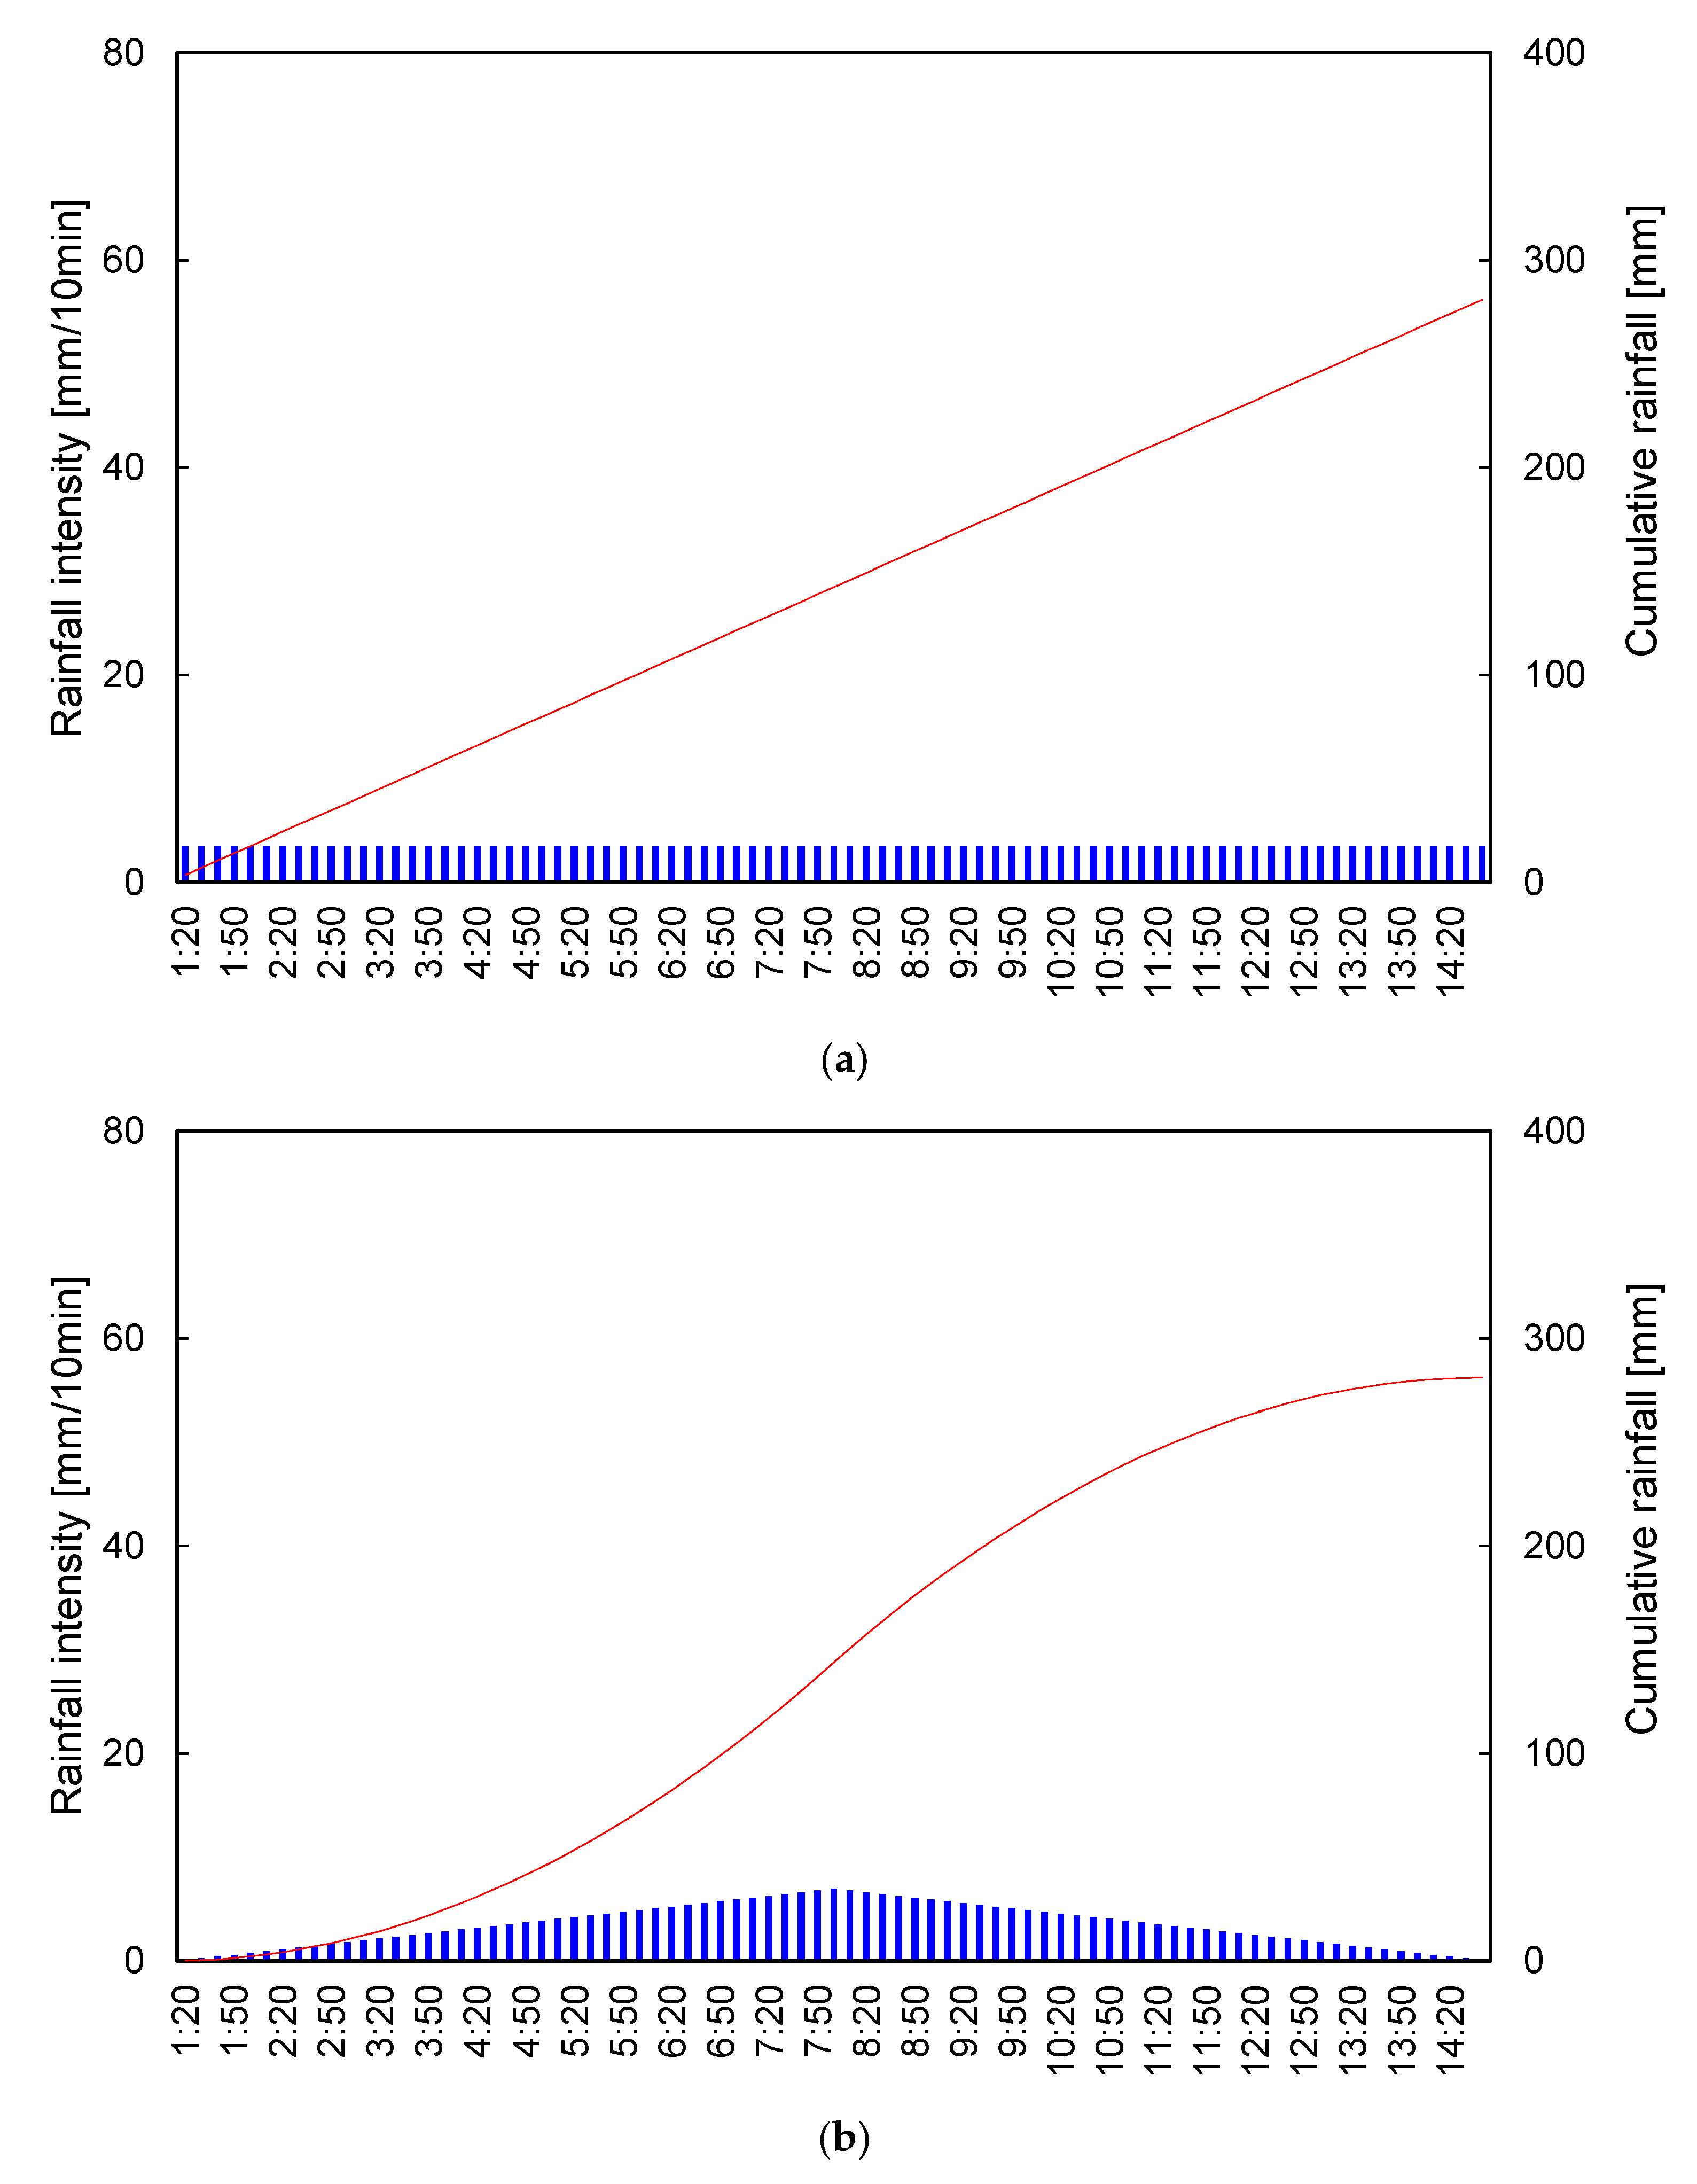
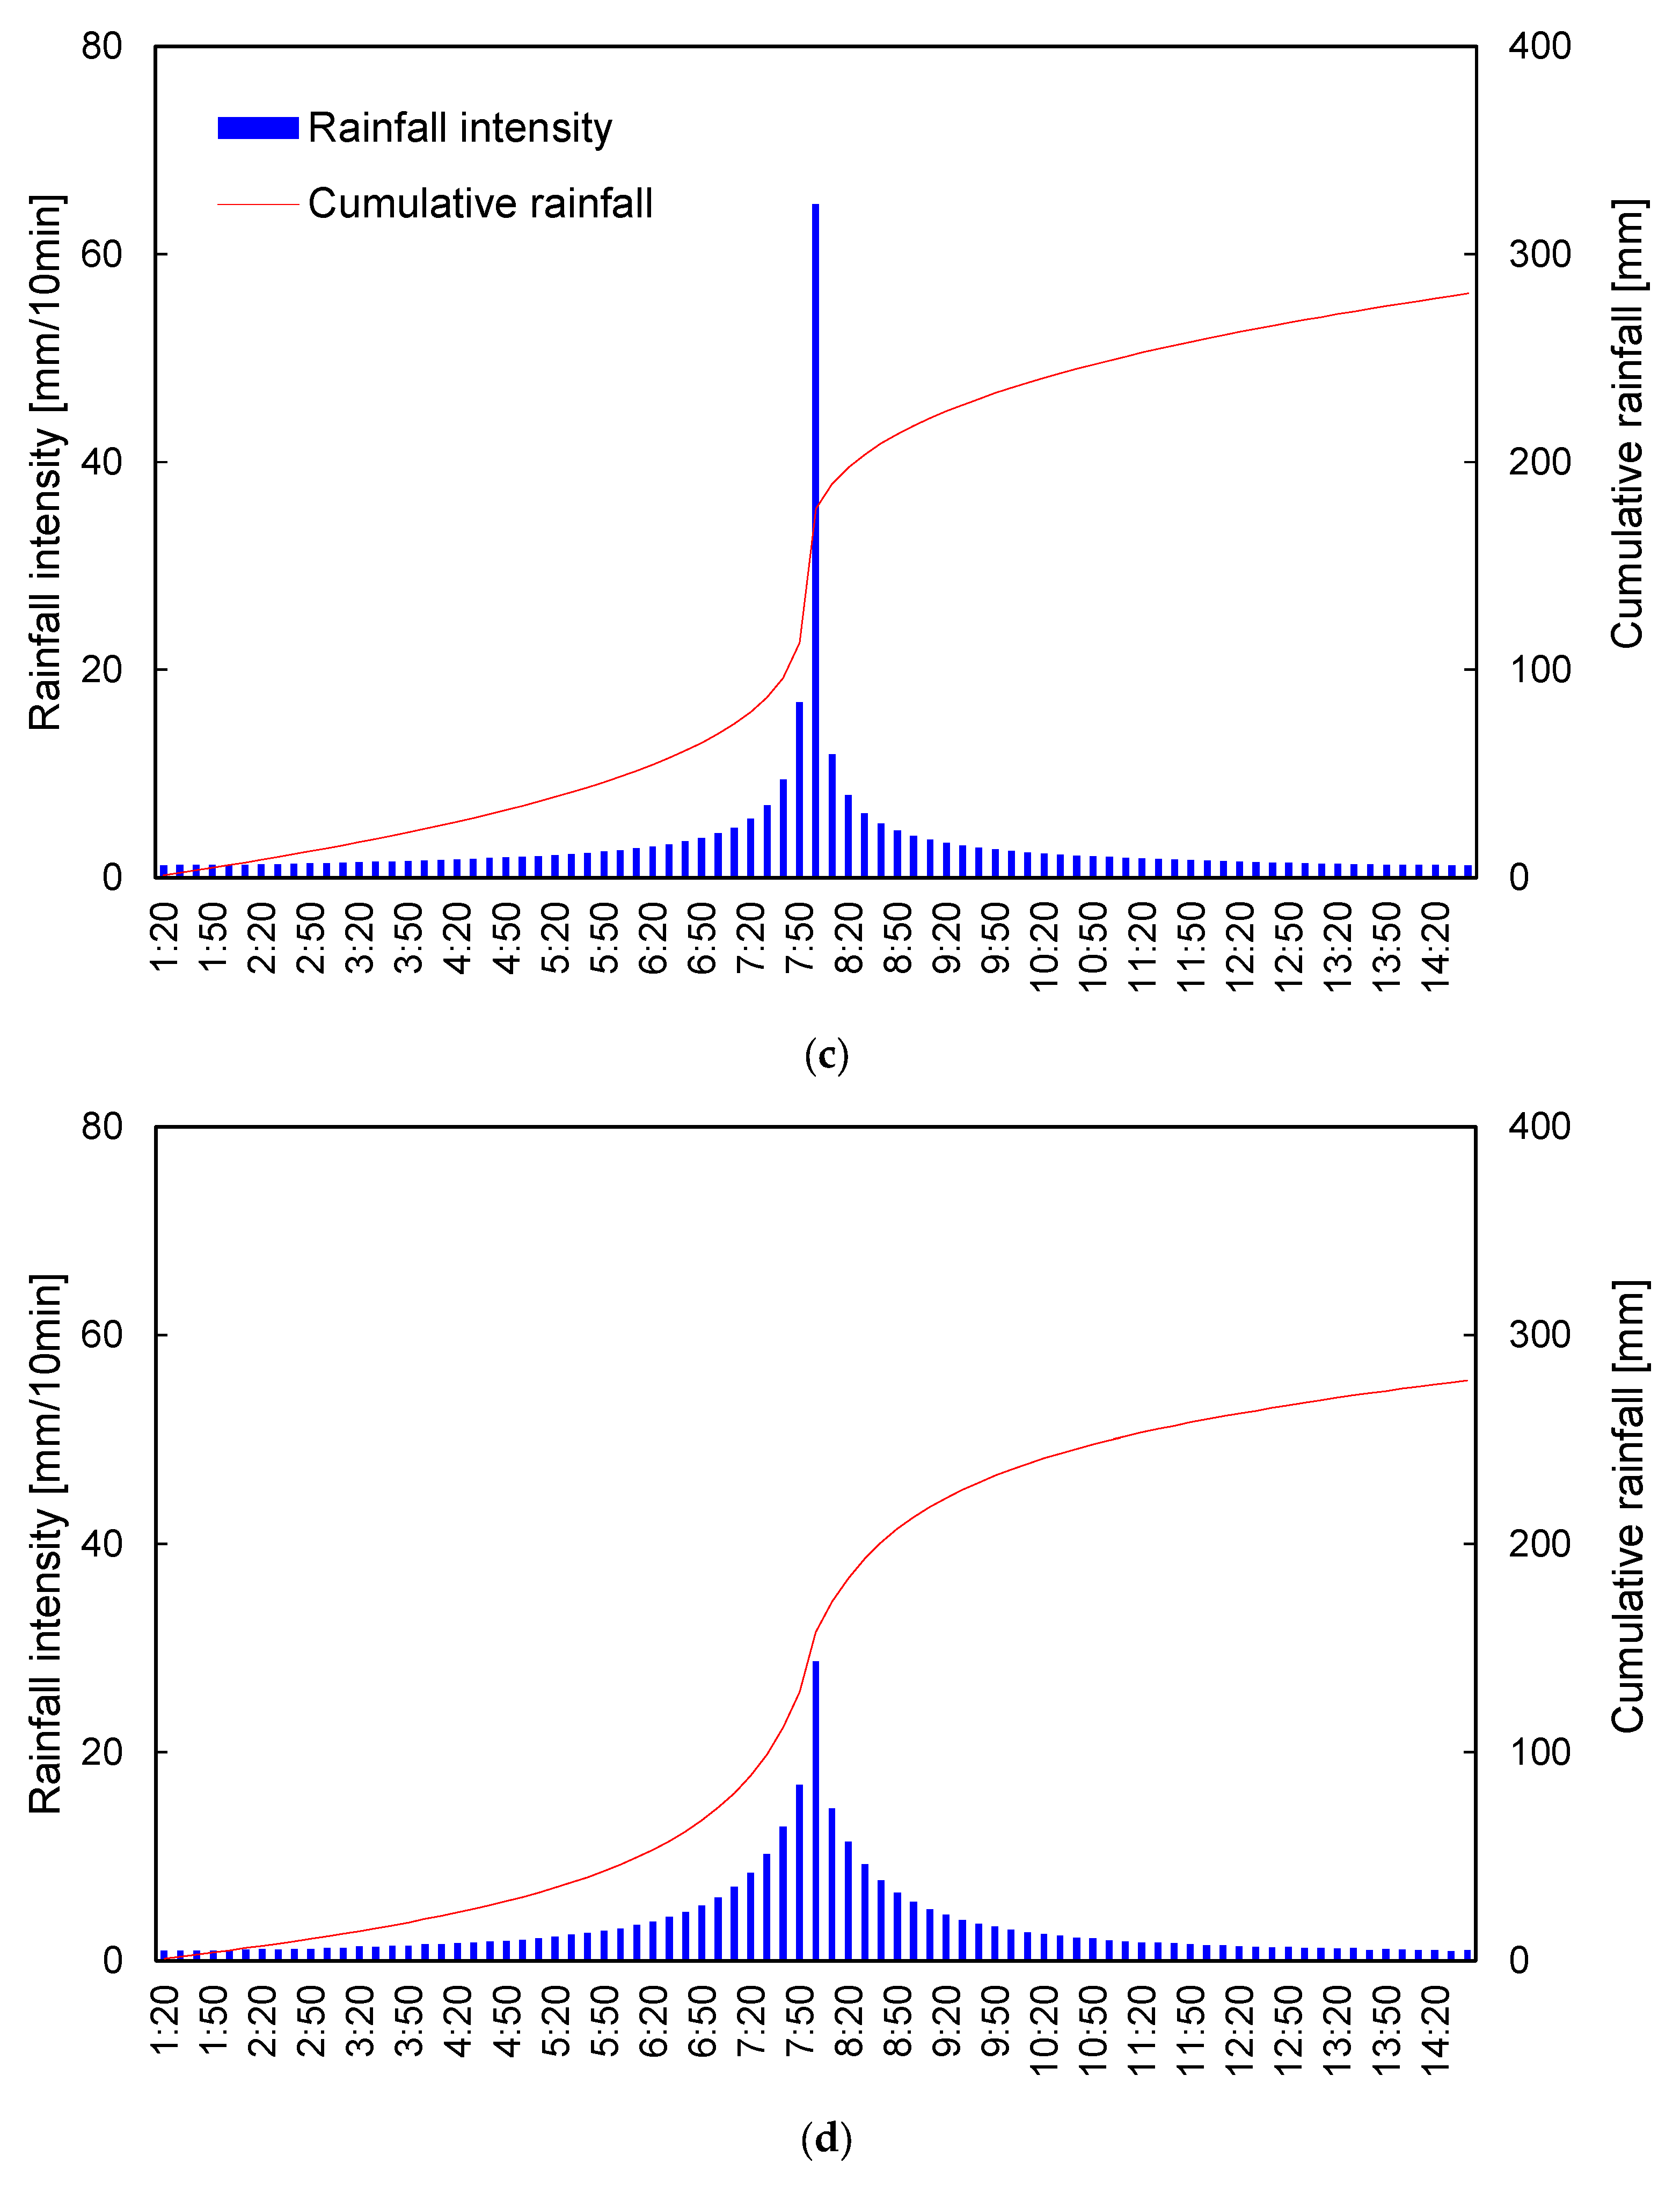
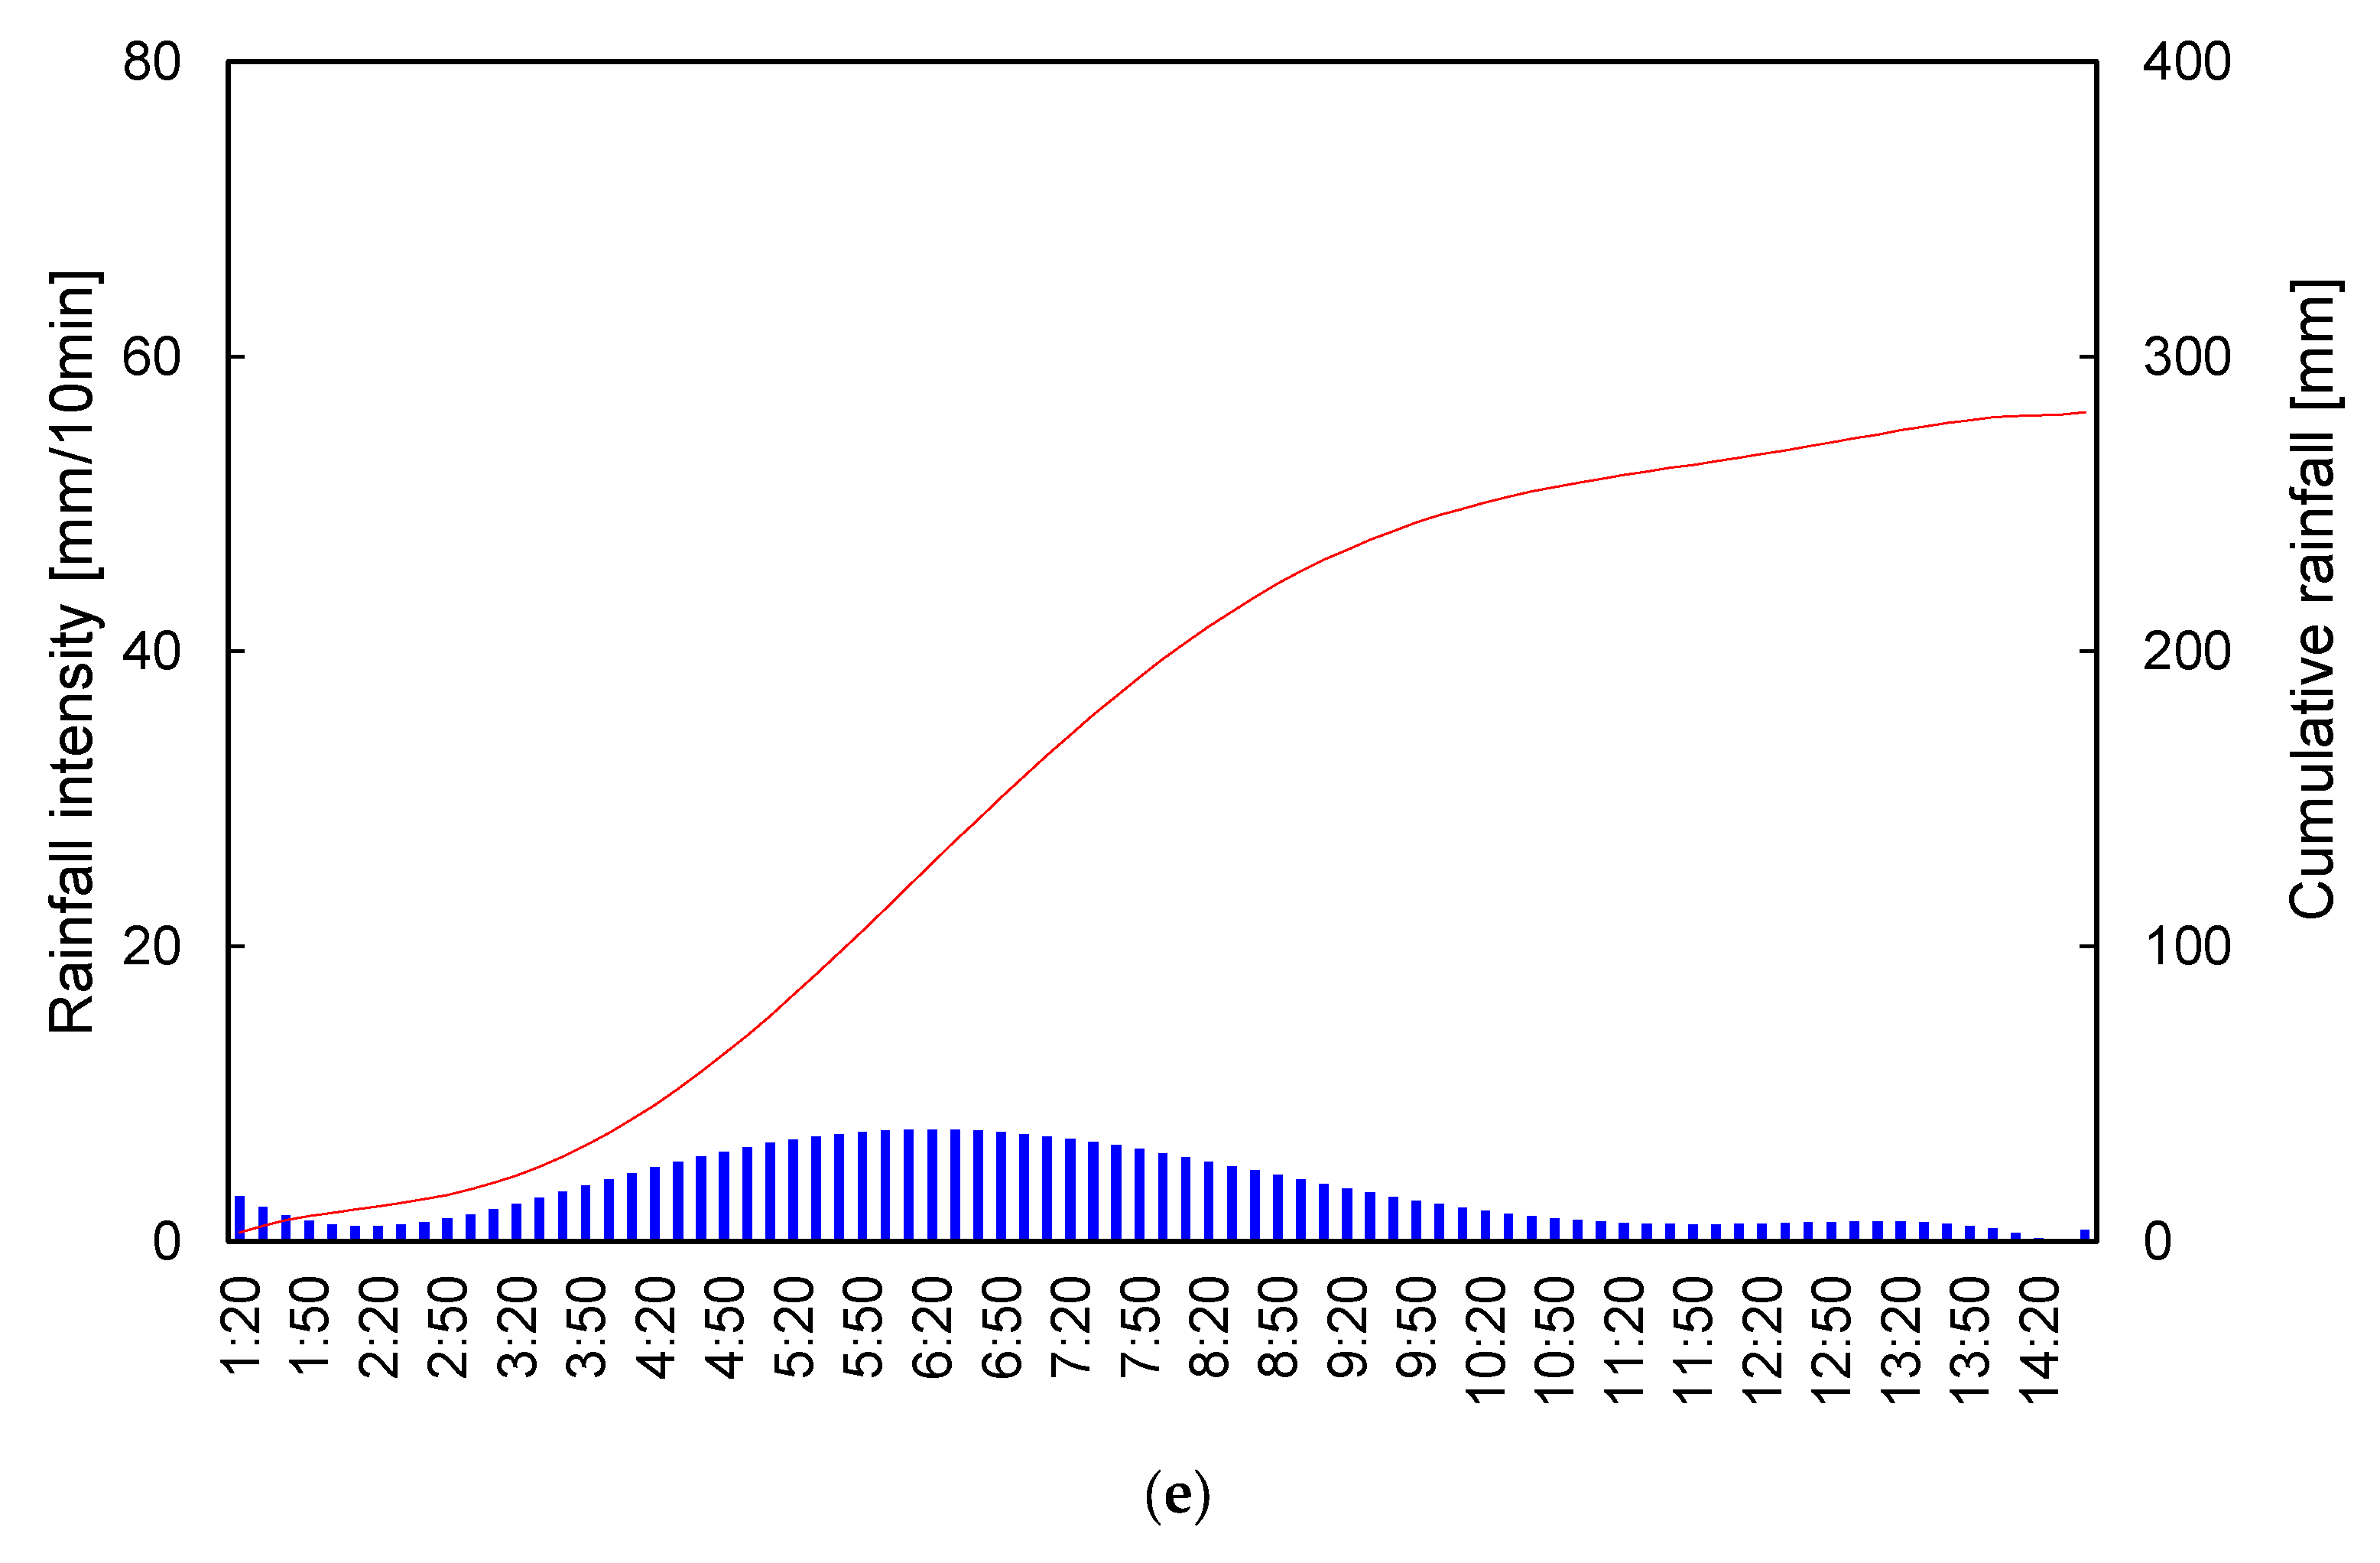
The uniform case had exactly the same rainfall intensities, 3.5 mm/10 min (=20.8 mm/h) during the storm event, resulting in a linear function of cumulative rainfall depths (Figure 4a). It had no peak rainfall or temporal pattern as the rainfall intensities were standardized, which cannot be found in the other four models. The Yen and Chow model provided a triangle-shaped rainfall distribution (Figure 4b), monotonically increased to the peak rainfall intensity of 6.9 mm/10 min (=41.6 mm/h) at the mid-point of the storm duration and decreased to zero at the end of the duration. The centered type Mononobe model generated an exceptionally high rainfall peak, 64.8 mm/10 min (=388.5 mm/h), which is unrealistic in Korea (Figure 4c). The peak value was the highest among those of the four models. As the peak rainfall intensity was too high, other rainfall intensities became relatively small, even those close to peak time. The shape of the alternating block model is very similar to the Mononobe model in that the patterns to the left and right sides of the peak rainfall intensity decrease exponentially (Figure 4d). The difference can be found from the lower rainfall peak, 28.7 mm/10 min (=172.4 mm/h). Lastly, we derived the second quartile 50% Huff model as it is found to be the most frequent pattern observed in Korea among the four types of Huff models [70,71,72]. Hence, the Huff model had a peak rainfall intensity ahead of the center of the storm duration with a value of 7.6 mm/10 min (=45.4 mm/h). In summary, the peak rainfall intensities of only the Mononobe and alternating block models were higher than that which occurred in the storm event at Umyeon-mountain, Seoul, Korea (17.5 mm/10 min = 105.0 mm/h).
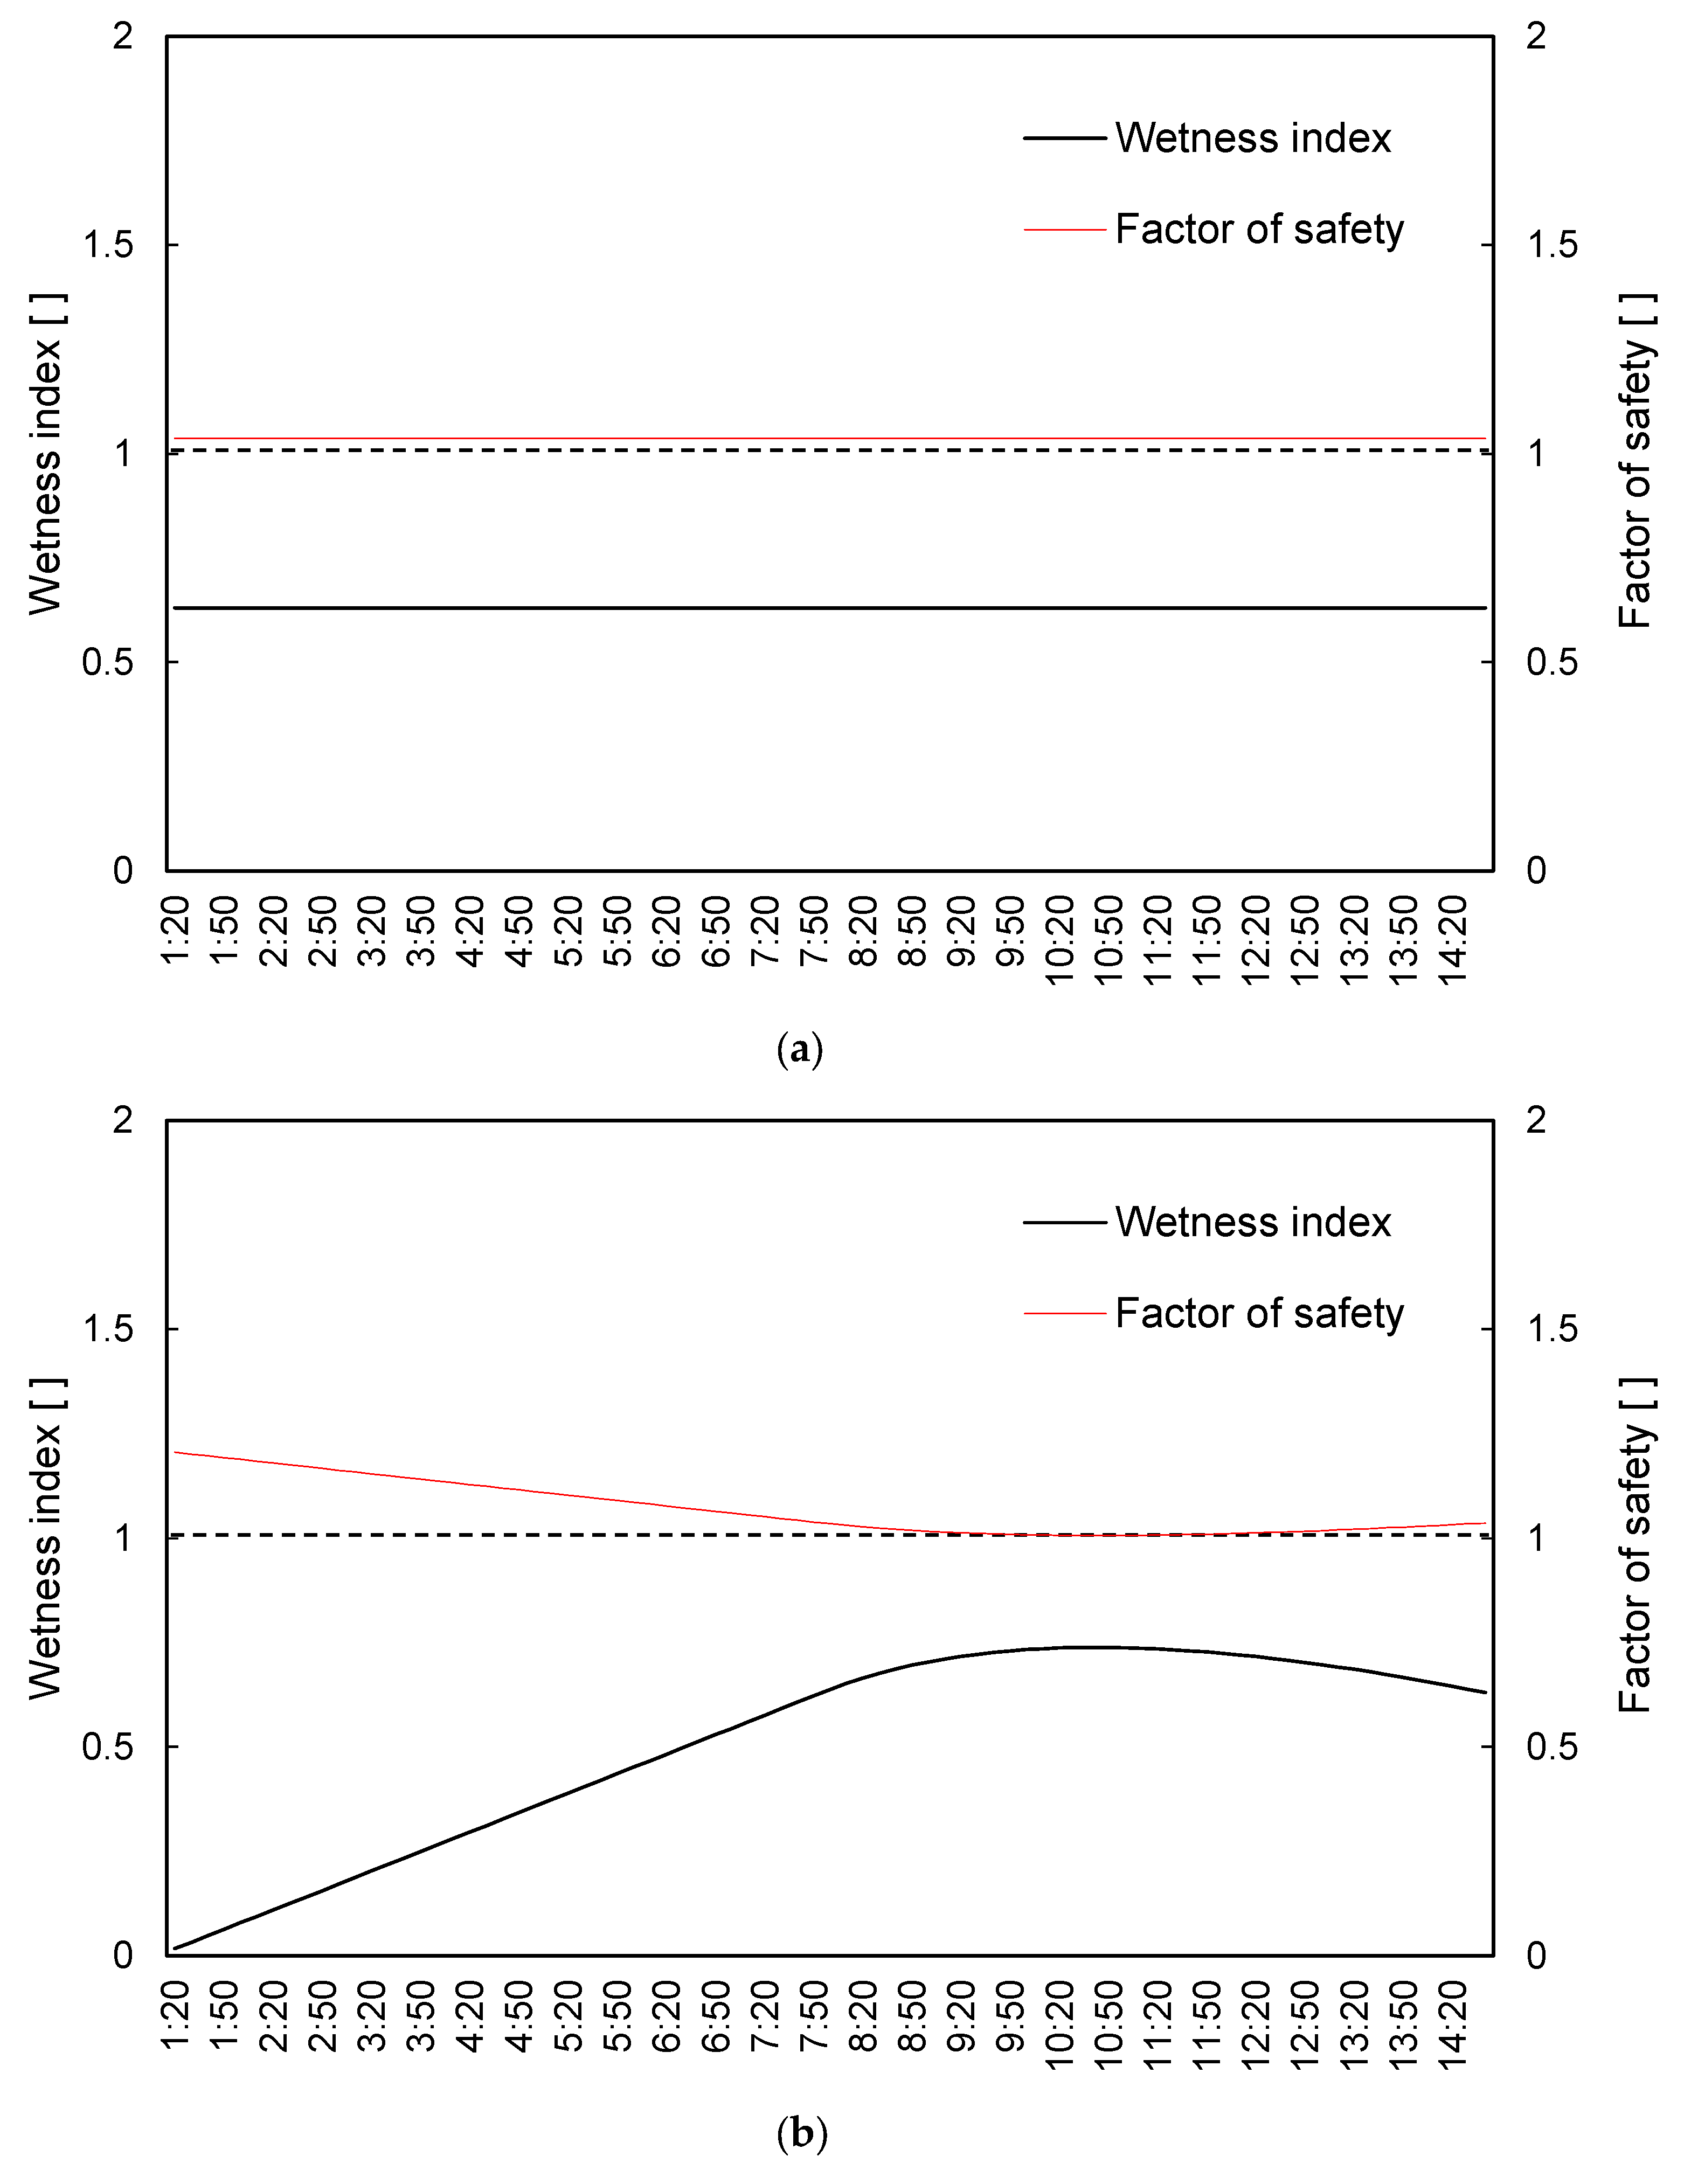
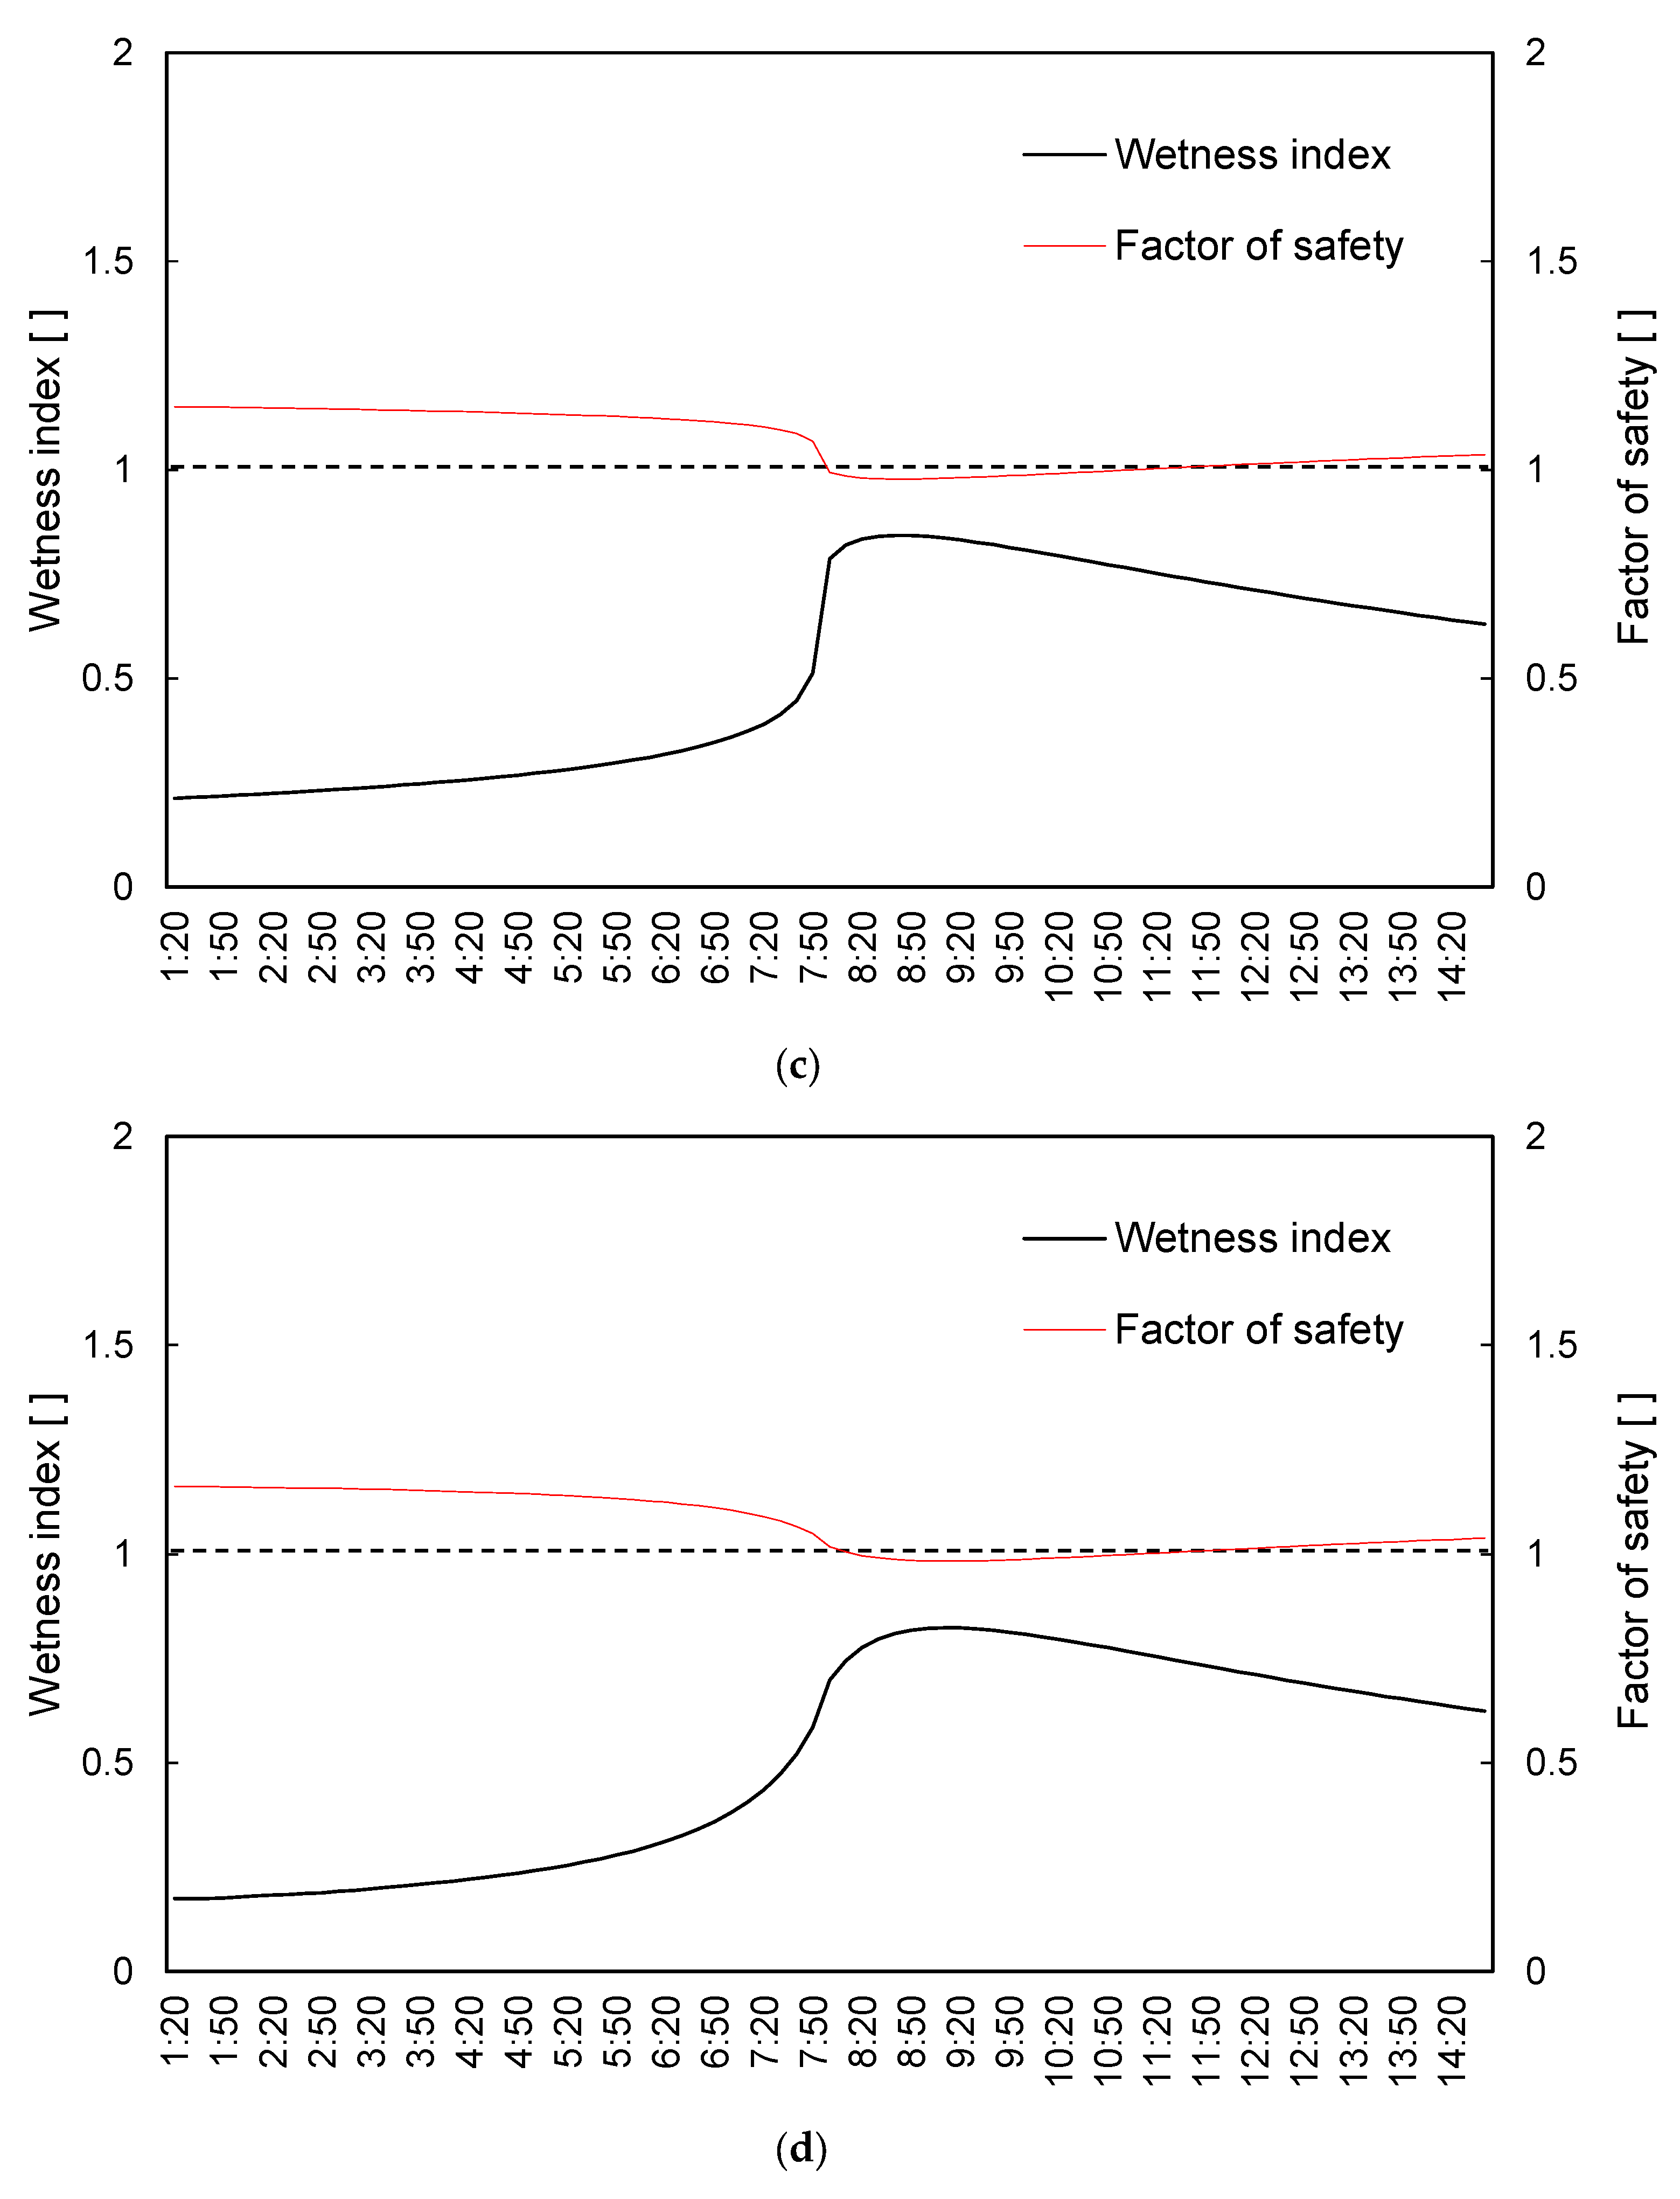
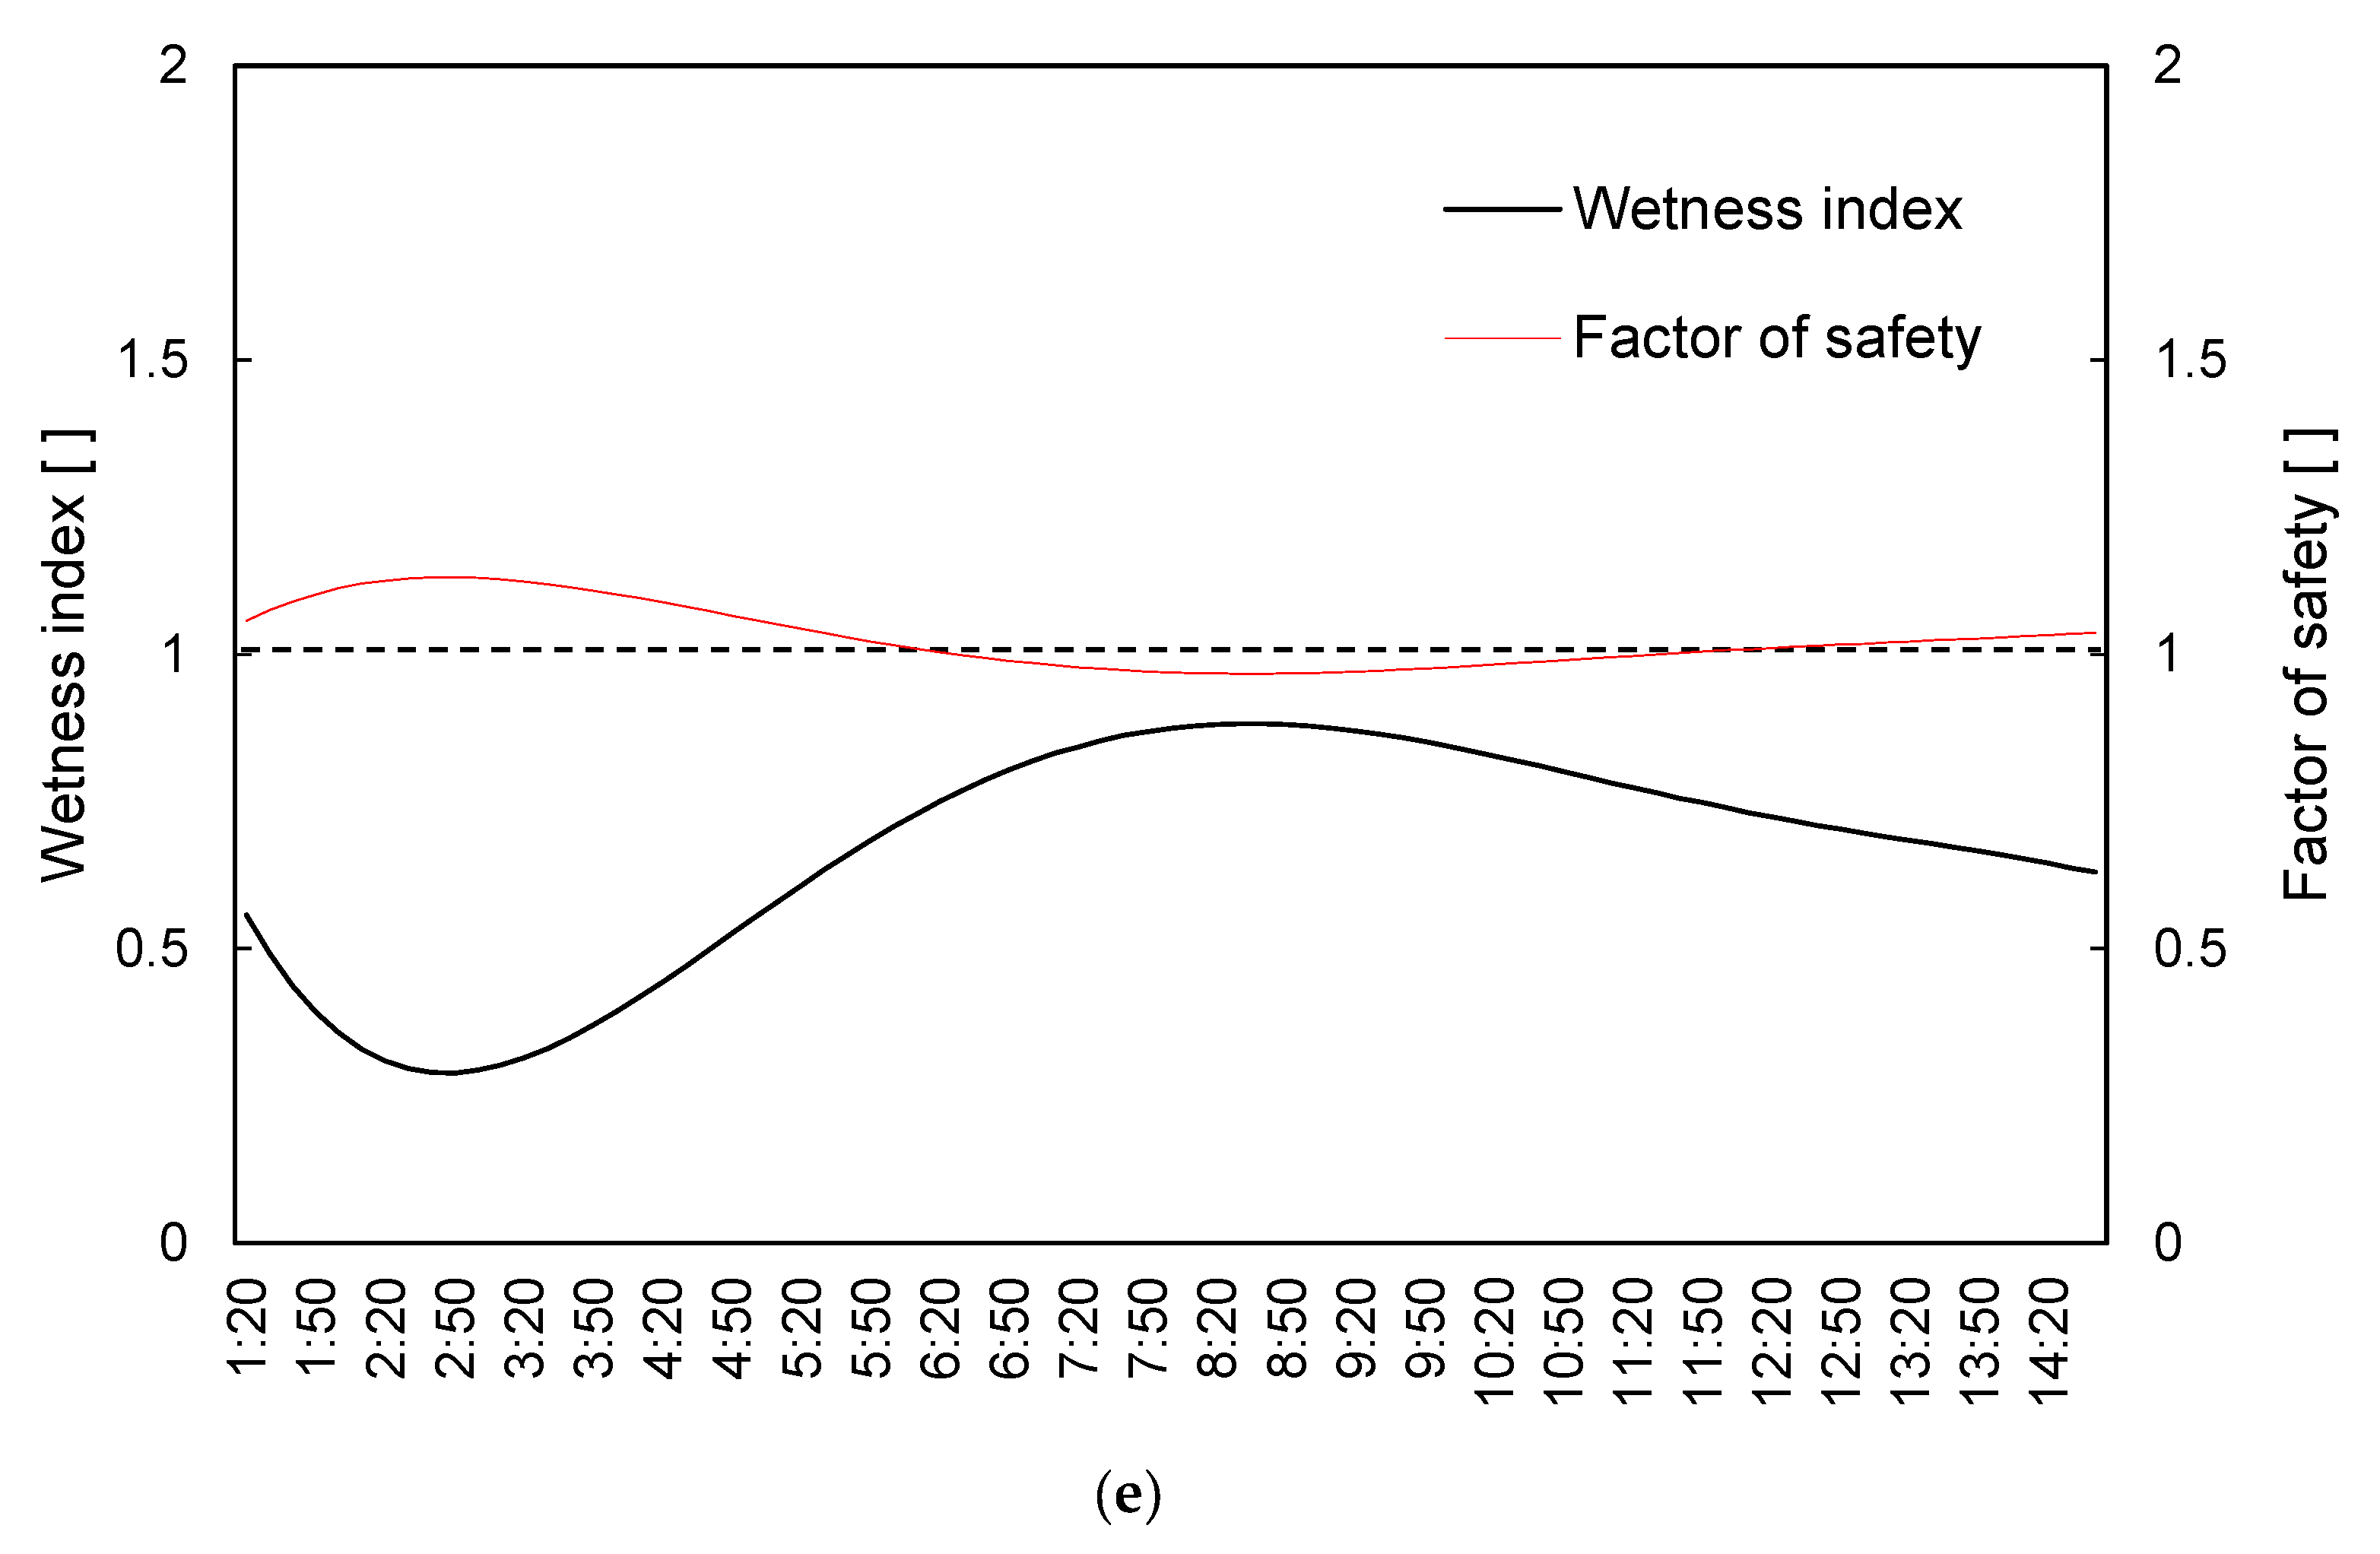
Figure 5 clearly shows the relative appropriateness of the design rainfall temporal distributions that capture the timing and maximum risk of the landslide occurrence well. The uniform distribution does not show any sufficient wetness enough to incur a landslide during a storm event (Figure 5a). The FS values of design rainfall are consistently higher than 1, which means the probability of landslide occurrence will be low, because the standardization of rainfall temporal structure overlooks the rainfall extremes (peaks). The Yen and Chow model presents time-varying FS values different from the uniform case, but still does not meet the condition of landslide occurrence (FS < 1). The lag time, a period difference between the maximum rainfall intensity and the peak of landslide risk, is also found in this case. As one of the causal factors of rainfall-induced landslides is the gradual loading by infiltrating rainwater that weakens the soil mantle (i.e., the pre-wetting of hillslope) [73], the infiltration derived from gradually inclined (or declined) rainfall patterns (e.g., Yen and Chow model) takes a few hours to saturate the soil, triggering slope failure with saturation-excess runoff [74]. Meanwhile, the Mononobe and alternating block models capture both the timing and extent of landslide risk below the safety threshold (FS < 1) well. The primary reason behind the result is that the maximum rainfall intensity is extremely high and occurs at a similar time to the slope failure at Umyeon-mountain that was detected near the rainfall peak time. Additionally, two models generate moderately low rainfall intensities except for the maximum one, which rises and subsides abruptly at the peak time. This temporal pattern easily incurs infiltration-excess runoff, a surface runoff directly transformed from intense rainfall without sufficient infiltration and corresponding slope failure before satisfying the total soil saturation storage [75]. The second quartile Huff model also incurs the landslide (FS < 1) but a bit earlier, even though the peak time of minimum FS is similar to the landslide occurrence time. It indicates that the second quartile Huff model, the most frequently observed rainfall pattern in Korea, may not demonstrate the temporal pattern of landslide risk well. As a rainfall-triggered landslide strongly depends on the evolution of infiltration during rainfall [74], a deep consideration of selecting the proper quartile of the Huff model for rainfall-induced landslide design. The third quartile Huff model can be an alternative for the purpose of landslide prevention.
From the analysis, we demonstrate that temporal patterns of rainfall with similar amounts can affect the hydrological response of a catchment and thus influence the corresponding landslide dynamics similar to previous studies including Fan et al. [54] and Wicki et al. [76]. Rainfall intensity is well known to be more important than the total amount of rainfall to produce runoff and sediment [77]. In addition, this study clearly shows that the temporal distribution of total rainfall can also be a major factor in triggering landslides. Hence, the importance of adopting appropriate temporal distributions of rainfall for landslide prediction and design for an early warning should be highlighted.

4. Summary and Conclusions

The objective of this study is to evaluate the influence of rainfall patterns on the slope stability compared by an actual landslide incident. For the slope stability analysis, the factor of safety (FS) considering the wetness index as a function of time is estimated. Uniform rainfall distribution, Yen and Chow, Mononobe, alternating block and second quartile Huff models are adopted, and the FS variation curves are acquired. Thereafter, the time at an unstable state (FS < 1) for each rainfall model is compared with the actual incident time. The remarkable observations from this study are as follows.
The FS for slope stability analysis should consider the time-dependent variation because the different rainfall patterns such as cumulated rainfall, rainfall duration and rainfall intensity vary the wetness index. Thereafter, the stable, moderately stable, quasi-stable and unstable state of the slope can be determined using the value of the FS.
The unit time interval of rainfall models is set to be 10 min, so the measured total rainfall is redistributed with 10 min rainfall intensity. Among the four rainfall models, the Yen and Chow model provides the lowest peak rainfall intensity, while the Mononobe model generates the highest intensity. The alternating block model shows a similar pattern to the Mononobe model, and the peak rainfall intensity is greater than the actual event. Finally, the second quartile Huff model presents a lower peak value even though it is found to be the most frequent pattern observed in Korea.
The uniform distribution and Yen and Chow model does not show any sufficient wetness to generate a landslide, owing to the standardization of rainfall and gradual inclined rainfall patterns. However, the Mononobe and alternating block models capture both the timing and extent of landslide risk below the safety threshold since they consider the abrupt rainfall intensity, which incurs an infiltration-excess runoff. Meanwhile, the second quartile Huff model generates the landslide at an earlier time even though it demonstrates a frequent pattern observed in Korea. Thus, the appropriate adoption of a rainfall distribution model should be highlighted for landslide prediction. In particular, as the temporal characteristics of rainfall become unpredictable or complex due to the impact of the changing climate, it is important to widen our perspectives on more models prone to landslide occurrence by considering the observed rainfall patterns.
Although this study provides informative implications on the design of rainfall distribution models that are most likely to trigger extreme landslide events, a few limitations still remain. More intense investigation is needed to understand the effect of rainfall on the hydrological soil hillslope, or in which way it is responsible for decreasing the factor of safety. Hence, the following research topics that can be expanded further and stemmed from this study include (1) finding the most impactful drivers for rainfall-induced landslides, (2) investigating which factor mostly causes the reduction in FS, and (3) investigating the effect of rainfall on the hydrological factors in the soil hillslopes.

Author Contributions

Conceptualization, C.J.; methodology, W.N. and S.Y.K.; formal analysis, C.J. and S.Y.K.; investigation, W.N. and S.Y.K.; data curation, W.N. and C.J.; writing—original draft preparation, W.N. and S.Y.K.; supervision, C.J.; funding acquisition, C.J. All authors have read and agreed to the published version of the manuscript.

Funding

This work was supported by the National Research Foundation of Korea (NRF) grant funded by the Korea government (MSIT) (No. NRF-2022R1A4A3032838 and RS-2023-00250239).

Data Availability Statement

The data presented in this study are available on request from the corresponding author.

Conflicts of Interest

The authors declare no conflict of interest.

References

  1. Oh, S.R.; Lee, G.H. Slope stability analysis at catchment scale using spatially-distributed wetness index. J. Korean Geogr. 2014, 3, 111–126. [Google Scholar]
  2. Rahardjo, H.; Lim, T.T.; Chang, M.F.; Fredlund, D.G. Shear-strength characteristics of a residual soil. Can. Geotech. J. 1995, 32, 60–77. [Google Scholar] [CrossRef]
  3. Fourie, A.B. Predicting rainfall-induced slope instability. Proc. Inst. Civ. Eng. Geotech. Eng. 1996, 119, 211–218. [Google Scholar] [CrossRef]
  4. Borga, M.; Dalla Fontana, G.; Da Ros, D.; Marchi, L. Shallow landslide hazard assessment using a physically based model and digital elevation data. Environ. Geol. 1998, 35, 81–88. [Google Scholar] [CrossRef]
  5. Ng, C.W.W.; Shi, Q. Influence of rainfall intensity and duration on slope stability in unsaturated soils. Q. J. Eng. Geol. Hydrogeol. 1998, 31, 105–113. [Google Scholar]
  6. Kim, S.Y.; Park, J.; Cha, W.; Lee, J.S.; Carlos Santamarina, J. Soil response during globally drained and undrained freeze–thaw cycles under deviatoric loading. J. Geotech. Geoenviron.l Eng. 2021, 147, 06020030. [Google Scholar] [CrossRef]
  7. Chae, B.G.; Lee, J.H.; Park, H.J.; Choi, J. A method for predicting the factor of safety of an infinite slope based on the depth ratio of the wetting front induced by rainfall infiltration. Nat. Hazards Earth Syst. Sci. 2015, 15, 1835–1849. [Google Scholar] [CrossRef] [Green Version]
  8. Beven, K.J.; Kirkby, M.J. A physically based, variable contributing area model of basin hydrology/Un modèle à base physique de zone d’appel variable de l’hydrologie du bassin versant. Hydrol. Sci. J. 1979, 24, 43–69. [Google Scholar] [CrossRef] [Green Version]
  9. Barling, R.D.; Moore, I.D.; Grayson, R.B. A quasi-dynamic wetness index for characterizing the spatial distribution of zones of surface saturation and soil water content. Water Resour. Res. 1994, 30, 1029–1044. [Google Scholar] [CrossRef]
  10. Zhao, B.; Dai, Q.; Han, D.; Zhang, J.; Zhuo, L.; Berti, M. Application of hydrological model simulations in landslide predictions. Landslides 2020, 17, 877–891. [Google Scholar] [CrossRef]
  11. Fredlund, D.G.; Rahardjo, H. Soil Mechanics for Unsaturated Soils; John Wiley & Sons: Hoboken, NJ, USA, 1993. [Google Scholar]
  12. Muntohar, A.S.; Liao, H.J. Rainfall infiltration: Infinite slope model for landslides triggering by rainstorm. Nat. Hazards 2010, 54, 967–984. [Google Scholar] [CrossRef]
  13. Montgomery, D.R.; Dietrich, W.E. A physically based model for the topographic control on shallow landsliding. Water Resour. Res. 1994, 30, 1153–1171. [Google Scholar] [CrossRef]
  14. Cardinali, M.; Galli, M.; Guzzetti, F.; Ardizzone, F.; Reichenbach, P.; Bartoccini, P. Rainfall induced landslides in December 2004 in south-western Umbria, central Italy: Types, extent, damage and risk assessment. Nat. Hazards Earth Syst. Sci. 2006, 6, 237–260. [Google Scholar] [CrossRef]
  15. Guzzetti, F.; Peruccacci, S.; Rossi, M.; Stark, C.P. Rainfall thresholds for the initiation of landslides in central and southern Europe. Meteorol. Atmos. Phys. 2007, 98, 239–267. [Google Scholar] [CrossRef]
  16. Peruccacci, S.; Brunetti, M.T.; Gariano, S.L.; Melillo, M.; Rossi, M.; Guzzetti, F. Rainfall thresholds for possible landslide occurrence in Italy. Geomorphology 2017, 290, 39–57. [Google Scholar] [CrossRef]
  17. Gariano, S.L.; Brunetti, M.T.; Iovine, G.; Melillo, M.; Peruccacci, S.; Terranova, O.; Guzzetti, F. Calibration and validation of rainfall thresholds for shallow landslide forecasting in Sicily, southern Italy. Geomorphology 2015, 228, 653–665. [Google Scholar] [CrossRef]
  18. Deganutti, A.M.; Marchi, L.; Arattano, M. Rainfall and debris-flow occurrence in the Moscardo basin (Italian Alps). In Debris-Flow Hazards Mitigation: Mechanics, Prediction and Assessment; Millpress Science Publishers: Rotterdam, The Netherlands, 2000; pp. 67–72. [Google Scholar]
  19. Zhou, W.; Tang, C.; Van Asch, T.W.; Zhou, C. Rainfall-triggering response patterns of post-seismic debris flows in the Wenchuan earthquake area. Nat. Hazards 2014, 70, 1417–1435. [Google Scholar] [CrossRef]
  20. Baum, R.L.; Godt, J.W. Early warning of rainfall-induced shallow landslides and debris flows in the USA. Landslides 2010, 7, 259–272. [Google Scholar] [CrossRef]
  21. Segoni, S.; Leoni, L.; Benedetti, A.I.; Catani, F.; Righini, G.; Falorni, G.; Rebora, N. Towards a definition of a real-time forecasting network for rainfall induced shallow landslides. Nat. Hazards Earth Syst. Sci. 2009, 9, 2119–2133. [Google Scholar] [CrossRef] [Green Version]
  22. Aleotti, P.; Chowdhury, R. Landslide hazard assessment: Summary review and new perspectives. Bull. Eng. Geol. Environ. 1999, 58, 21–44. [Google Scholar] [CrossRef]
  23. Goetz, J.N.; Brenning, A.; Petschko, H.; Leopold, P. Evaluating machine learning and statistical prediction techniques for landslide susceptibility modeling. Comput. Geosci. 2015, 81, 1–11. [Google Scholar] [CrossRef]
  24. Park, H.-J.; Jang, J.-Y.; Lee, J.-H. Physically based susceptibility assessment of rainfall-induced shallow landslides using a fuzzy point estimate method. Remote Sens. 2017, 9, 487. [Google Scholar] [CrossRef] [Green Version]
  25. Zêzere, J.L.; Pereira, S.; Melo, R.; Oliveira, S.C.; Garcia, R.A. Mapping landslide susceptibility using data-driven methods. Sci. Total Environ. 2017, 589, 250–267. [Google Scholar] [CrossRef] [PubMed]
  26. Medina, V.; Hürlimann, M.; Guo, Z.; Lloret, A.; Vaunat, J. Fast physically-based model for rainfall-induced landslide susceptibility assessment at regional scale. Catena 2021, 201, 105213. [Google Scholar] [CrossRef]
  27. Van Westen, C.J. The modelling of landslide hazards using GIS. Surv. Geophys. 2000, 21, 241–255. [Google Scholar] [CrossRef]
  28. Huabin, W.; Gangjun, L.; Weiya, X.; Gonghui, W. GIS-based landslide hazard assessment: An overview. Prog. Phys. Geogr. 2005, 29, 548–567. [Google Scholar] [CrossRef]
  29. Fell, R.; Corominas, J.; Bonnard, C.; Cascini, L.; Leroi, E.; Savage, W.Z. Guidelines for landslide susceptibility, hazard and risk zoning for land use planning. Eng. Geol. 2008, 102, 85–98. [Google Scholar] [CrossRef] [Green Version]
  30. Park, H.J.; Lee, J.H.; Woo, I.K. Assessment of rainfall-induced shallow landslide susceptibility using a GIS-based probabilistic approach. Eng. Geol. 2013, 161, 1–15. [Google Scholar] [CrossRef]
  31. Burton, A.; Bathurst, J.C. Physically based modelling of shallow landslide sediment yield at a catchment scale. Environ. Geol. 1998, 35, 89–99. [Google Scholar] [CrossRef]
  32. Dai, F.C.; Lee, C.F. Landslide characteristics and slope instability modeling using GIS, Lantau Island, Hong Kong. Geomorphology 2002, 42, 213–228. [Google Scholar] [CrossRef]
  33. Yilmaz, I.; Keskin, I. GIS based statistical and physical approaches to landslide susceptibility mapping (Sebinkarahisar, Turkey). Bull. Eng. Geol. Environ. 2009, 68, 459–471. [Google Scholar]
  34. Gutierrez-Martin, A. A GIS-physically-based emergency methodology for predicting rainfall-induced shallow landslide zonation. Geomorphology 2020, 359, 107121. [Google Scholar] [CrossRef]
  35. Ji, J.; Cui, H.; Zhang, T.; Song, J.; Gao, Y. A GIS-based tool for probabilistic physical modelling and prediction of landslides: GIS-FORM landslide susceptibility analysis in seismic areas. Landslides 2022, 19, 2213–2231. [Google Scholar] [CrossRef]
  36. Guzzetti, F.; Peruccacci, S.; Rossi, M.; Stark, C.P. The rainfall intensity–duration control of shallow landslides and debris flows: An update. Landslides 2008, 5, 3–17. [Google Scholar] [CrossRef]
  37. Saito, H.; Nakayama, D.; Matsuyama, H. Relationship between the initiation of a shallow landslide and rainfall intensity—Duration thresholds in Japan. Geomorphology 2010, 118, 167–175. [Google Scholar] [CrossRef]
  38. Bogaard, T.; Greco, R. Invited perspectives: Hydrological perspectives on precipitation intensity-duration thresholds for landslide initiation: Proposing hydro-meteorological thresholds. Nat. Hazards Earth Syst. Sci. 2018, 18, 31–39. [Google Scholar] [CrossRef] [Green Version]
  39. Ma, T.; Li, C.; Lu, Z.; Wang, B. An effective antecedent precipitation model derived from the power-law relationship between landslide occurrence and rainfall level. Geomorphology 2014, 216, 187–192. [Google Scholar] [CrossRef]
  40. Pennington, C.; Dijkstra, T.; Lark, M.; Dashwood, C.; Harrison, A.; Freeborough, K. Antecedent precipitation as a potential proxy for landslide incidence in South West United Kingdom. In Landslide Science for a Safer Geoenvironment: Vol. 1: The International Programme on Landslides (IPL); Springer International Publishing: New York, NY, USA, 2014; pp. 253–259. [Google Scholar]
  41. Zhao, B.; Dai, Q.; Han, D.; Dai, H.; Mao, J.; Zhuo, L.; Rong, G. Estimation of soil moisture using modified antecedent precipitation index with application in landslide predictions. Landslides 2019, 16, 2381–2393. [Google Scholar] [CrossRef]
  42. Hong, M.; Kim, J.; Jeong, S. Rainfall intensity-duration thresholds for landslide prediction in South Korea by considering the effects of antecedent rainfall. Landslides 2018, 15, 523–534. [Google Scholar] [CrossRef]
  43. De Luca, D.L.; Versace, P. A comprehensive framework for empirical modeling of landslides induced by rainfall: The Generalized FLaIR Model (GFM). Landslides 2017, 14, 1009–1030. [Google Scholar] [CrossRef]
  44. Sirangelo, B.; Versace, P. A real time forecasting model for landslides triggered by rainfall. Meccanica 1996, 31, 73–85. [Google Scholar] [CrossRef]
  45. Capparelli, G.; Biondi, D.; De Luca, D.L.; Versace, P. Hydrological and complete models for forecasting landslides triggered by rainfalls. Proc. First Ital. Workshop Landslides 2009, 1, 162–173. [Google Scholar]
  46. Capparelli, G.; Versace, P. FLaIR and SUSHI: Two mathematical models for early warning of landslides induced by rainfall. Landslides 2011, 8, 67–79. [Google Scholar] [CrossRef]
  47. Na, W.; Yoo, C. Evaluation of rainfall temporal distribution models with annual maximum rainfall events in Seoul, Korea. Water 2018, 10, 1468. [Google Scholar] [CrossRef] [Green Version]
  48. Alfieri, L.; Laio, F.; Claps, P. A simulation experiment for optimal design hyetograph selection. Hydrol. Process. Int. J. 2008, 22, 813–820. [Google Scholar] [CrossRef]
  49. D’Odorico, P.; Fagherazzi, S.; Rigon, R. Potential for landsliding: Dependence on hyetograph characteristics. J. Geophys. Res. Earth Surf. 2005, 110, F01007. [Google Scholar] [CrossRef] [Green Version]
  50. Ibsen, M.-L.; Casagli, N. Rainfall patterns and related landslide incidence in the Porretta-Vergato region, Italy. Landslides 2004, 1, 143–150. [Google Scholar] [CrossRef]
  51. Tsai, T.-L. The influence of rainstorm pattern on shallow landslide. Environ. Geol. 2008, 53, 1563–1569. [Google Scholar] [CrossRef]
  52. Tsai, T.-L.; Wang, J.-K. Examination of influences of rainfall patterns on shallow landslides due to dissipation of matric suction. Environ. Earth Sci. 2011, 63, 65–75. [Google Scholar] [CrossRef]
  53. Ran, Q.; Hong, Y.; Li, W.; Gao, J. A modelling study of rainfall-induced shallow landslide mechanisms under different rainfall characteristics. J. Hydrol. 2018, 563, 790–801. [Google Scholar] [CrossRef]
  54. Fan, L.; Lehmann, P.; Zheng, C.; Or, D. Rainfall intensity temporal patterns affect shallow landslide triggering and hazard evolution. Geophys. Res. Lett. 2020, 47, e2019GL085994. [Google Scholar] [CrossRef]
  55. Acharya, G.; De Smedt, F.; Long, N.T. Assessing landslide hazard in GIS: A case study from Rasuwa, Nepal. Bull. Eng. Geol. Environ. 2006, 65, 99–107. [Google Scholar] [CrossRef]
  56. Yen, B.C.; Chow, V.T. Design hyetographs for small drainage structures. J. Hydraul. Div. 1980, 106, 1055–1076. [Google Scholar] [CrossRef]
  57. Mononobe, N. Hydraulics; Iwanami Shoten: Chiyoda, Japan, 1993; pp. 351–356. [Google Scholar]
  58. Jeong, J.H.; Yoon, Y.N. Design Practices for Water Resources; Goomi Press: Seoul, Republic of Korea, 2007. (In Korean) [Google Scholar]
  59. Danasla, M.A.; Kusuma, G.J.; Tuheteru, E.J.; Gautama, R.S. Hydrology model establishment of pit Lake: Extreme event rainfall data analysis. In Proceedings of the IOP Conference Series: Earth and Environmental Science, Bandung, Indonesia, 23–24 June 2021; Volume 883, p. 012048. [Google Scholar]
  60. Yoo, C.; Jun, C.; Park, C. Effect of rainfall temporal distribution on the conversion factor to convert the fixed-interval into true-interval rainfall. J. Hydrol. Eng. 2015, 20, 04015018. [Google Scholar] [CrossRef]
  61. Prayuda, D.D. Temporal and spatial analysis of extreme rainfall on the slope area of Mt. Merapi. J. Civ. Eng. Forum 2015, 21, 1285–1290. [Google Scholar]
  62. Priambodo, S.; Montarcih, L.; Suhartanto, E. Hourly rainfall distribution patterns in Java island. MATEC Web Conf. 2019, 276, 04012. [Google Scholar] [CrossRef] [Green Version]
  63. Chow, V.T.; Maidment, D.R.; Mays, L.W. Applied Hydrology, International ed.; MacGraw-Hill, Inc.: Singapore, 1988; Volume 149. [Google Scholar]
  64. Viessman, W.; Lewis, G.L.; Knapp, J.W.; Harbaugh, T.E. Introduction to Hydrology; Prentice Hall, Pearson Education, Inc.: Hoboken, NJ, USA, 1989. [Google Scholar]
  65. Huff, F.A. Time distribution of rainfall in heavy storms. Water Resour. Res. 1967, 3, 1007–1019. [Google Scholar] [CrossRef]
  66. Azli, M.; Rao, A.R. Development of Huff curves for peninsular Malaysia. J. Hydrol. 2010, 388, 77–84. [Google Scholar] [CrossRef]
  67. Kim, J.; Jeong, S.; Regueiro, R.A. Instability of partially saturated soil slopes due to alteration of rainfall pattern. Eng. Geol. 2012, 147, 28–36. [Google Scholar] [CrossRef]
  68. KGS (Korean Geotechnical Society). Final Report on the Cause of Landslides in Umyeonsan(Mt.) Area and the Establishment of Restoration Measures; Report No. KGS11-250; Korean Geotechnical Society: Seoul, Republic of Korea, 2011. (In Korean) [Google Scholar]
  69. SI (The Seoul Institute). Final Report on the Cause of Landslides in Umyeonsan(Mt.)—Complementary Investigation; Report No. 51-6110000-000649-01; The Seoul Institute: Seoul, Republic of Korea, 2014. (In Korean)
  70. Ministry of Construction and Transportation (MOCT). 1999 Report on the Development of Water Resources Management Techniques: Design Rainfall Temporal Distribution; Ministry of Construction and Transportation: Seoul, Republic of Korea, 2000. (In Korean)
  71. Ministry of Land, Transport and Maritime Affairs (MLTM). Research on the Improvement of Probability Rainfall; Ministry of Land, Transport and Maritime Affair: Seoul, Republic of Korea, 2019. (In Korean)
  72. Yoo, C.; Na, W. Analysis of a Conventional Huff Model at Seoul Station and Proposal of an Improvisation Method. J. Korean Soc. Hazard. Mitig. 2019, 19, 43–55. (In Korean) [Google Scholar] [CrossRef]
  73. Bogaard, T.A.; Greco, R. Landslide hydrology: From hydrology to pore pressure. Wiley Interdiscip. Rev. Water 2016, 3, 439–459. [Google Scholar] [CrossRef]
  74. Tsai, T.L.; Yang, J.C. Modeling of rainfall-triggered shallow landslide. Environ. Geol. 2006, 50, 525–534. [Google Scholar] [CrossRef]
  75. Yang, W.Y.; Li, D.; Sun, T.; Ni, G.H. Saturation-excess and infiltration-excess runoff on green roofs. Ecol. Eng. 2015, 74, 327–336. [Google Scholar] [CrossRef]
  76. Wicki, A.; Lehmann, P.; Hauck, C.; Seneviratne, S.I.; Waldner, P.; Stähli, M. Assessing the potential of soil moisture measurements for regional landslide early warning. Landslides 2020, 17, 1881–1896. [Google Scholar] [CrossRef] [Green Version]
  77. Jungerius, P.D.; Ten Harkel, M.J. The effect of rainfall intensity on surface runoff and sediment yield in the grey dunes along the Dutch coast under conditions of limited rainfall acceptance. Catena 1994, 23, 269–279. [Google Scholar] [CrossRef] [Green Version]
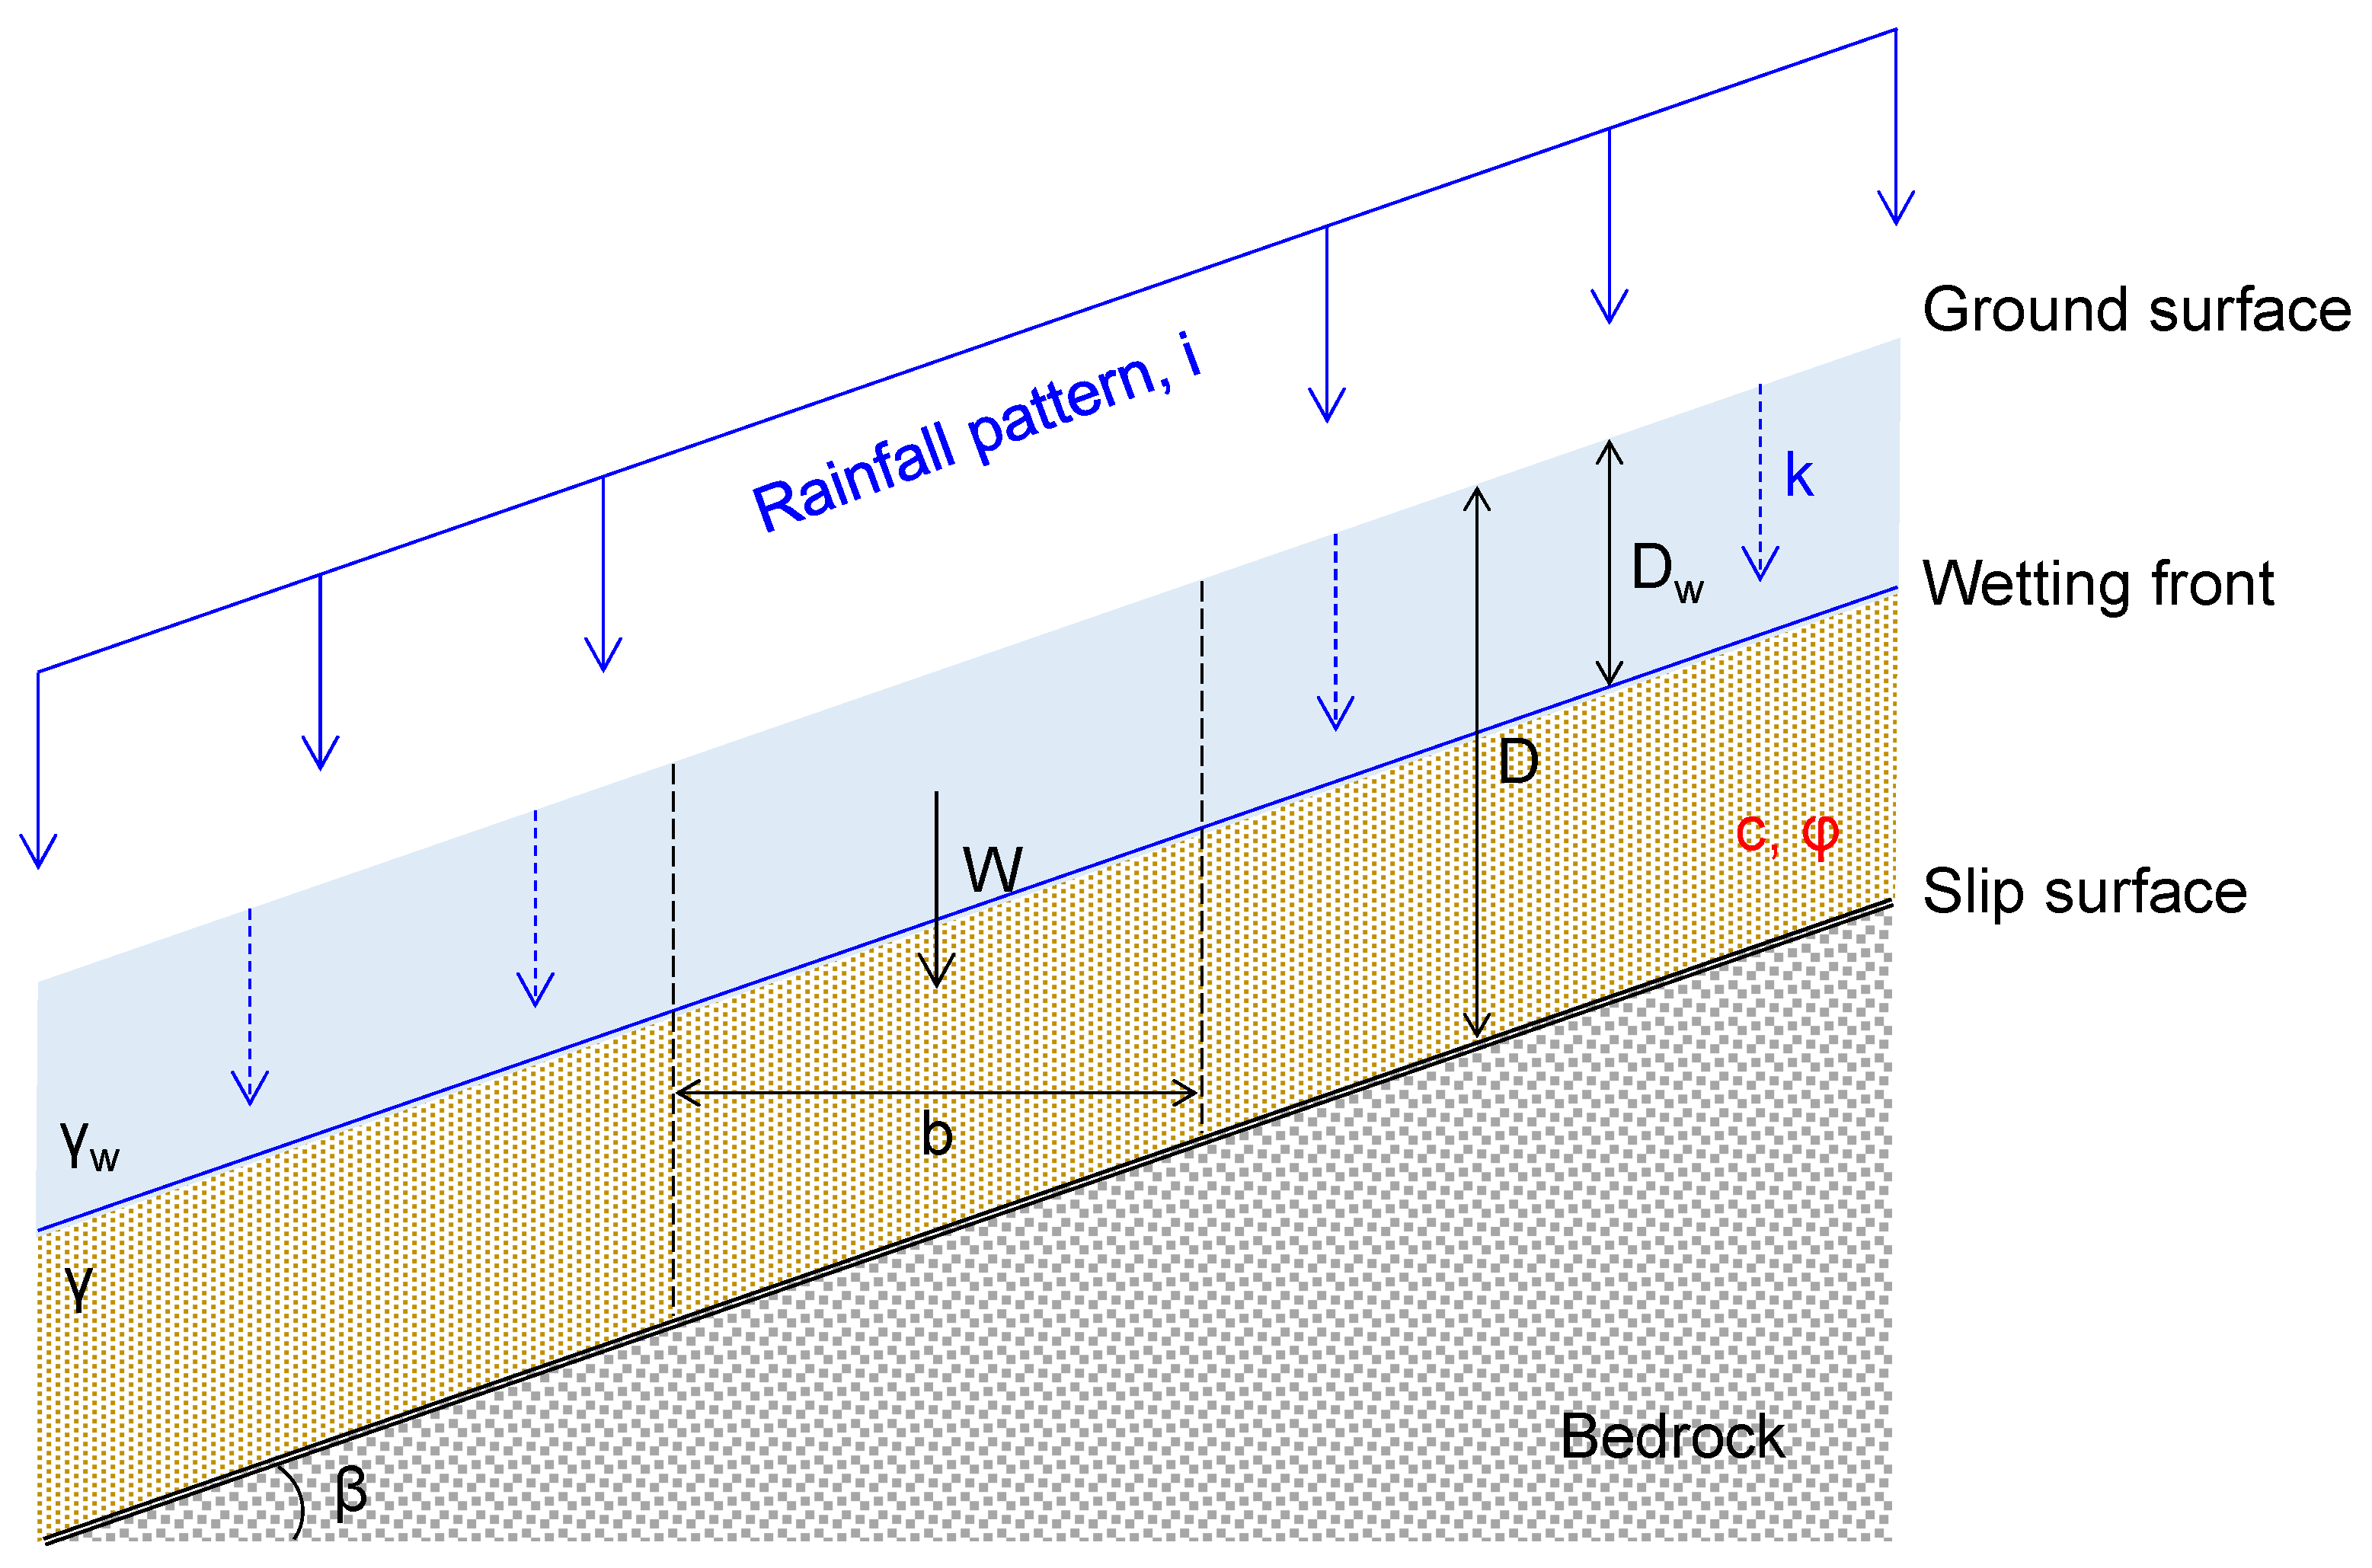
Figure 1. Schematic drawing of infinite slope model considering rainfall infiltration.
Water 15 02535 g001
Figure 2. 10-min hyetograph with cumulative rainfall for 27 July 2011 at Seocho station in Seoul, Korea.
Water 15 02535 g002
Figure 3. Temporal variation in wetness index (m) and factor of safety (FS) for 26–27 July 2011 at Seocho station in Seoul, Korea.
Water 15 02535 g003
Figure 4. 10-min hyetograph with cumulative rainfall for different types of rainfall pattern: (a) uniform distribution; (b) Yen and Chow model; (c) Mononobe model; (d) alternating block model; (e) Huff model (second quartile).
Water 15 02535 g004aWater 15 02535 g004bWater 15 02535 g004c
Figure 5. Temporal variation in wetness index (m) and factor of safety (FS) for different types of rainfall pattern: (a) uniform distribution; (b) Yen and Chow model; (c) Mononobe model; (d) alternating block model; (e) Huff model (second quartile).
Water 15 02535 g005aWater 15 02535 g005bWater 15 02535 g005c
Table 1. Slope stability determination using the factor of safety [56].
Factor of SafetySlope StabilityRemarks
FS > 1.5StableOnly major destabilizing factors lead to instability
1.25 < FS < 1.5Moderately stableModerate destabilizing factors lead to instability
1 < FS < 1.25Quasi-stableMinor destabilizing factors can lead to instability
FS < 1UnstableStabilizing factors are needed for stability
Disclaimer/Publisher’s Note: The statements, opinions and data contained in all publications are solely those of the individual author(s) and contributor(s) and not of MDPI and/or the editor(s). MDPI and/or the editor(s) disclaim responsibility for any injury to people or property resulting from any ideas, methods, instructions or products referred to in the content.