Article

Monitoring of Groundwater in a Limestone Island Aquifer Using Ambient Seismic Noise

1
Department of Geosciences, University of Malta, MSD 2080 Msida, Malta
2
Energy and Water Agency, Pinto Business Centre, QRM 3104 Ħal Qormi, Malta
3
Geosciences Barcelona (GEO3BCN—CSIC), 08028 Barcelona, Spain
*
Author to whom correspondence should be addressed.
Water 2023, 15(14), 2523; https://doi.org/10.3390/w15142523
Submission received: 31 May 2023 / Revised: 2 July 2023 / Accepted: 3 July 2023 / Published: 10 July 2023

Abstract

:
The limestone islands of Malta face high levels of water stress due to low rainfall over a small land area and a high population density. We investigate an innovative, cost-effective approach to groundwater monitoring in an island environment by computing auto- and cross-correlations of ambient seismic noise recorded on short-period and broadband seismic stations. While borehole readings give accurate site-specific water level data of the groundwater across the islands, this technique provides a more regional approach to quantitative groundwater monitoring. We perform the moving window cross-spectral method to determine temporal changes in seismic velocity (δv/v). Comparison of the δv/v with groundwater levels from boreholes and precipitation shows comparable patterns. We find that the variations of the δv/v from auto-correlations are more pronounced than the cross-correlation, and that short-period seismic stations are also sensitive. The δv/v signal deteriorates at longer interstation distances, presumably because paths traverse complex geology. We conclude that changes in the groundwater level found beneath very small islands, even as small as 3 km2, can be detected seismically. Low-cost, easy-to-deploy seismic stations can thus act as an additional tool for groundwater monitoring, especially in places with limited natural water reservoirs, like rivers and lakes, and infrastructure.

1. Introduction

Small islands typically face critical challenges in maintaining a regular supply of freshwater. The land limitations and morphology of small islands usually result in much of the rainwater being lost immediately as runoff through valleys. Alternatively, freshwater can be extracted from aquifers. Depending on the water demand, groundwater can easily face over-extraction and thus requires constant monitoring, typically using a borehole piezometer, which is a device that can measure groundwater level as a function of varying water pressure in underground rock pores.
Piezometric networks, consisting of several wells (boreholes) tapping into a groundwater body, are essential tools for direct and accurate measurement of the quantitative and qualitative status of groundwater [1,2]. However, the groundwater level variations are specific to the location of the piezometric wells in the network [3] and may not necessarily represent the dynamics of the area between the wells. A large number of sampling points (piezometric wells) would be required to adequately monitor the water level changes of a groundwater body [2]. This will likely incur significant costs to set up and maintain and require extensive planning to design the optimal monitoring network [1,4]. Despite the costs involved, groundwater monitoring is important because it allows for the early identification of negative trends and the introduction of remediation strategies before the state of the groundwater body deteriorates any further [5].
Alternative groundwater monitoring techniques have been established, such as the use of global positioning system (GPS, e.g., [6,7,8]), interferometric synthetic-aperture radar (InSAR, e.g., [8,9,10]), and gravity measurements from satellites such as the Gravity Recovery and Climate Experiment satellite (GRACE, e.g., [11,12,13,14]). Using GPS for monitoring surface displacements can measure groundwater changes with good temporal resolution but limited spatial resolution [6,7,8]. Surface displacements measured by InSAR indicate groundwater changes at a high spatial resolution but at a weak temporal resolution [8,9,10]. Utilizing the GRACE satellite for obtaining gravity measurements has proven its sensitivity to changes in water masses at large wavelengths only, but not at the more important shorter wavelengths that are related to local changes (e.g., [12,14]). Another disadvantage of this technique is that the gravity measurements suffer non-uniqueness between aquifer depths and water mass (e.g., [12,14]). Nonetheless, the use of other, different geophysical techniques to obtain spatio-temporal groundwater data can be a complementary option to monitoring groundwater via borehole readings, especially if the latter are absent in the region [15].
In recent years, seismic data have been proposed as a new, cost-effective tool to monitor groundwater (e.g., [16]). The analysis of ambient seismic noise recorded on a seismic network can provide information on the shallow seismic wave velocity structure beneath the network, which, in turn, is influenced by the water content and distribution. Water-saturated rocks have an increased pore pressure, which leads to the opening of cracks in the rock [17]. This reduces the contact area between different grains of rock, leading to a decrease in shear-wave velocity [17]. Thus, variations in the seismic speed reflect changes in the medium through which the seismic waves are passing, such as from changes in groundwater content (e.g., the replenishing and depletion of aquifers due to seasonal effects or anthropogenic intervention (e.g., [18,19]). Such an alternative method can assess the groundwater to a greater extent and may provide a broader picture of the subsurface groundwater level and dynamics.
This phenomenon has been successfully shown in different locations, such as in the mountain region of the Himalayas [20], the Gräfenberg Array, Germany [21], the Pont Bourquin landslide in the Swiss Alps [22], San Gabriel Valley Basin, California [16], the groundwater basins in California [19,23], the Gulf Coast Aquifer System of southern Texas [24], the Crépieux-Charmy water exploitation field in the alluvial plain of the Rhone River, France [25,26], the Reykjanes Geothermal Reservoir, Iceland [27], Merapi volcano, Indonesia [18,28], and across Japan [29]. Small islands such as Malta are different from these locations because many have no lakes or rivers and may also have low rainfall. Moreover, many islands are typically surrounded by saline water, which interacts with groundwater to a certain extent.
Here we demonstrate this technique by presenting a case study for Malta, a small archipelago in the center of the Mediterranean (Figure 1) that has a long history of water management. The Maltese islands are made up of a sedimentary sequence of limestones and clays of late Oligocene to late Miocene age (~33–35 Ma). Malta is deemed the European country facing the highest stress on its water resources [30], with a semi-arid climate of approximately 550 mm of annual rainfall [31]. The three islands of Comino, Gozo, and Malta have land areas of 3.5, 67, and 246 km2, respectively, the latter hosting the main industrial/economic activity and having a high population density of 1867 persons/km2 [32]. In addition to the almost 0.5 million residents, a high number of tourists visit the islands, with a record of 2.6 million in 2019 (pre-COVID-19 outbreak, [33]), adding to the stress of groundwater abstraction and de-salinization plants [34]. It must also be taken into consideration that 80% of the water used in the Maltese agricultural sector is directly abstracted from groundwater resources [35], via boreholes or underground galleries [30]. The groundwater of the Maltese islands is managed by a network of boreholes that record the water levels in the aquifers.
In this study, we determine temporal variations in seismic velocity across the islands and compare the changes with groundwater levels from local wells. We test different types of seismic instruments and take the opportunity to test the method on the small island of Comino. Finally, we discuss the advantages and disadvantages of this method and emphasize the need for careful interpretation.

1.1. Ambient Seismic Noise Correlations

Ambient seismic noise is constituted by a series of random, continuous signals (e.g., [36,37,38]) in the Earth’s surface and shallow rock layers. Natural sources of ambient noise generally contain seismic waves with a frequency of less than 1 Hz [39,40]. Ocean microseisms are typically observed at 0.05–0.3 Hz (e.g., [41]). At frequencies from 1–5 Hz, noise can be natural and/or cultural, while at frequencies higher than 5 Hz, noise is of cultural origin [39,40]. Techniques using ambient seismic noise have demonstrated their applicability in varying contexts, such as imaging and monitoring of the subsurface.
In general, studies relating to seismic ambient noise involve the cross-correlation function (CCF) of two time series of random ambient noise recorded from two seismic stations at the same time. The CCF corresponds to the Green’s function of the medium between the sensors [42,43,44,45,46,47,48]. If one of the sensors is considered to be an impulsive source, the retrieval of Green’s function between two sensors yields the impulse response of the Earth recorded at the other sensor [49]. Cross-correlation of ambient seismic noise is a powerful tool for imaging the Earth’s interior on a local, regional, or global scale (e.g., [38,46,50,51,52,53,54,55,56,57].
The delay times of Green’s function may change because of either a sudden change in the position of the noise source or scatterers or changes in the medium velocity [58], leading to variations in the CCF. Studies investigating changes in seismic velocity to analyze the crustal dynamics of the Earth have been conducted, such as in the context of volcanoes [18,59], and in response to volcanic eruptions [60,61,62,63], earthquakes [29,64,65,66,67], ice sheet melts [68], landslides [22,69], and wastewater injection [70]. Several factors are known to alter seismic wave speeds at shallow depths, such as seasonal variations from air temperature changes [19,71,72,73], precipitation [18,19,29,73,74], and long-term seasonal variations of climatic origin [21]. Essentially, variations in the speed at which these waves travel are determined by changes in the medium through which they propagate. Consequently, changes in groundwater can alter the seismic wave speed [18,19].
In the case of subsurface water, a shear-wave velocity decrease is accompanied by a P-wave velocity increase as water has higher seismic velocities in saturated limestone (e.g., [75]). Nevertheless, measurements from noise cross- and auto-correlations show a decrease in seismic velocity. Scattered body and surface waves contribute in different proportions to the seismic noise response and measurements of seismic velocity changes; however, the strongest contributions come from the lowered shear-wave velocities, likely because surface waves are more sensitive to shear-wave structure than to P-wave and density.
Determining changes in the CCF of real-time data from seismic stations can be utilized to continuously monitor and investigate the medium between the sensors [58]. Thus, monitoring for changes in seismic velocity can act as a complementary tool to groundwater level monitoring in medium-sized aquifers (e.g., [16]). One key advantage of this technique is that it does not depend on the occurrence of active seismic sources such as large vibrators or explosions (e.g., [37]) or earthquake activity to produce results since ambient seismic noise is continuously present [43,58].
Besides CCF, we also compute noise auto-correlations. Auto-correlations are cross-correlations where both time series are the same, that is, the interstation distances are decreased to zero and the two stations are the same. For diffuse wavefields, noise auto-correlations provide zero-offset Green’s functions in full analogy to the CCF. The zero-offset Green’s functions consist basically of the zero-offset seismic reflection response. The principle goes back to Claerbout [76], who demonstrated for one-dimensional (1-D) media that the full reflection response can be obtained from the auto-correlation of a plane wave, which transmits the reflecting structure from below. This finding has been extended to three-dimensional (3D) media, e.g., Wapenaar [77].
In any case, auto- and cross-correlations provide structural noise responses, which can be used for monitoring underground variability, such as that caused by water level changes in the aquifers. Here we process the CCF of seismic data available across Malta to investigate temporal changes in seismic velocity as an indication of the variability of water in underground rocks.

1.2. The Geological and Hydrogeological Setting of the Maltese Islands

The geology of the Maltese islands follows a five-layer cake-like sequence, consisting of the Lower Coralline Limestone (LCL), the oldest formation, followed by Globigerina Limestone (GL), Blue Clay (BC), Greensand, and the youngest formation, Upper Coralline Limestone (UCL) (Figure 2). The LCL is a hard, dense, and semi-crystalline limestone reaching thicknesses of 140 m in vertical cliffs in south-west Gozo and 100 m in western and southern Malta. This is overlain by GL, which outcrops in large areas of southern and central Malta and Gozo. GL is composed of soft and fine-grained sediment and reaches thicknesses of 207 m in southern Malta and 23 m in southern Gozo.
The next formation in the sequence is BC, consisting of deep-water formations of marls, clays, and silty sands in alternating pale grey and dark grey colors. The BC has been significantly eroded in the south and east of Malta, and thicknesses of approximately 75 m have been recorded in Northern Gozo and the western coast of Malta. Greensand, underlying the following UCL formation, is coarse, thickly bedded, bioclastic limestone rich in glauconite. Although it is generally observed as a layer that is a few centimeters thick, a noticeable thickness of approximately 11 m is found in Gozo. The youngest formation, the UCL, is like the LCL in terms of the content of coralline algae and color. The UCL can be observed as either highly competent or, at times, more fractured. Outcrops of the UCL occur in all the islands, where they are the most developed in east-central Gozo, at Comino, and in the west and north of Malta. Comprehensive descriptions of the lithostratigraphical sequence of the Maltese islands can be found in [78,79,80,81,82,83,84,85,86,87,88]. As can be observed from Figure 2, a W-E divide in geological outcrops exists, distinguished by GL in the south of Malta and the UCL/BC in the west and north of Malta.
Figure 2. Geological outcrop map of the Maltese islands. Legend shows the color-coded sequence of geological layers found in the Maltese islands, ranging from the oldest formation of Lower Coralline Limestone (LCL) to the youngest formation of Upper Coralline Limestone (UCL) [89]. The Mean Sea-Level Aquifer (MSLA) is found beneath all the land mass. The perched aquifer occurs where the Upper Coralline Limestone is present on top of the Blue Clay formation in the rock strata.
Water 15 02523 g002
Groundwater resources in the Maltese islands are of two typologies: the perched aquifer and the mean sea-level aquifer (MSLA) [34,83,90,91,92,93,94]. The perched aquifer occurs where the BC formation, acting as an aquiclude, is present in the rock strata, which coincides with where UCL can be observed in the geological outcrop map in Figure 2. The MSLA is evident almost throughout the whole extent of the islands. Our focus here is the MSLA.

2. Materials and Methods

We combine the seismic data from the permanent broadband stations of the Malta Seismic Network (MSN) [95] with the temporary short-period stations of the FASTMIT experiment [96] for the years 2016–2021. Figure 1 shows the location of the seismic stations from the two networks. The data from the permanent network, which consists of combinations of STS-2, Trillium 120PA, and Trillium Compact seismometers, spans from 2016 to the end of 2021, while the temporary stations, using Lennartz 1 Hz seismometers, were only operational for about 14 months, from the end of July 2017 to October 2018.
The vertical (Z) component data was preprocessed by demeaning, tapering, and merging into 1-day-long traces, which were then band-pass filtered and decimated or down-sampled. Power spectral density (PSD) analysis (e.g., McNamara and Buland [97]) was used to determine the filter bands to be used for analyzing the seismic data (Figure 3). It was found most appropriate to have two filters, one for the broadband range at 0.1–1.0 Hz and one for the short-period stations at 0.3–3.0 Hz.
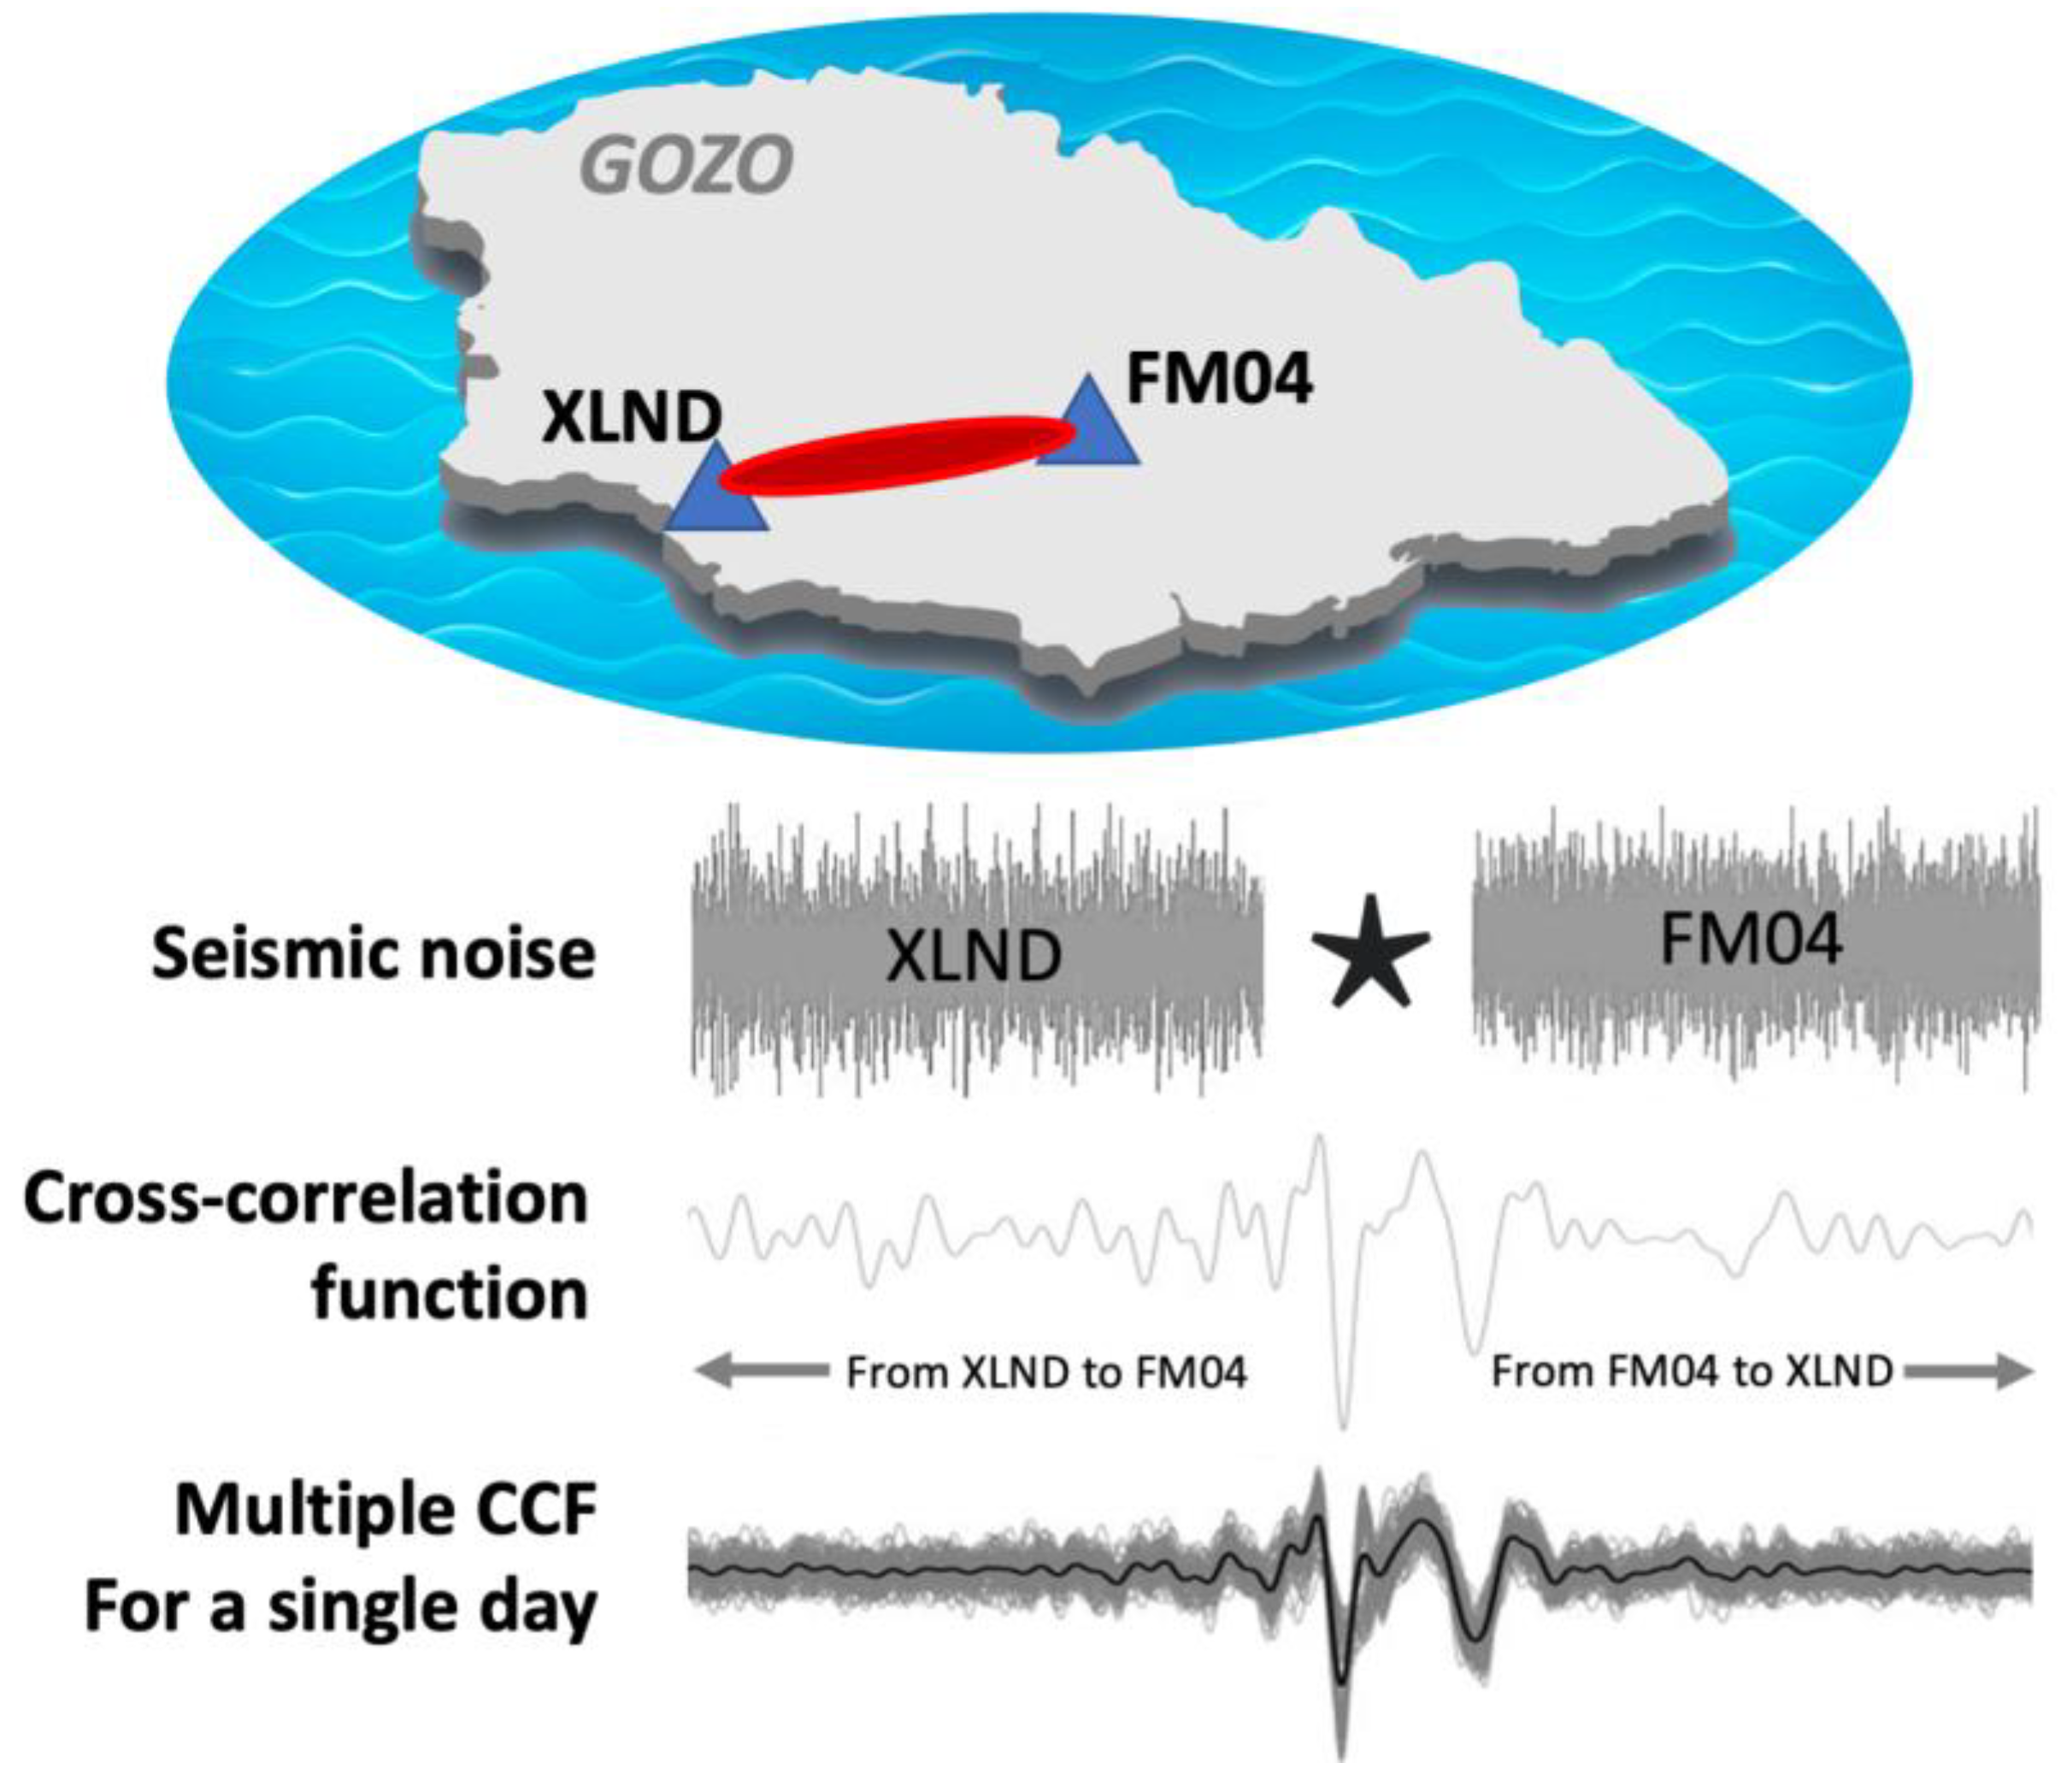
We run the correlation functions using the software package MSNoise [58]. MSNoise takes 30 min time windows of noise recorded at each station and correlates it with the noise recorded at the other stations. The noise is correlated in both left and right directions to produce a bilateral CCF, with an impulse in the negative and positive time lag. The time windows are processed in 15 min steps, thus resulting in 96 CCFs for each day that are stacked together to represent a single day. Figure 4 shows an example of the cross-correlation for stations XLND and FM04. We also processed auto-correlations, which are the same as cross-correlation but with the noise recorded by a single station being correlated with itself [98]. Thus, the CCF from an auto-correlation represents the ground below the station.
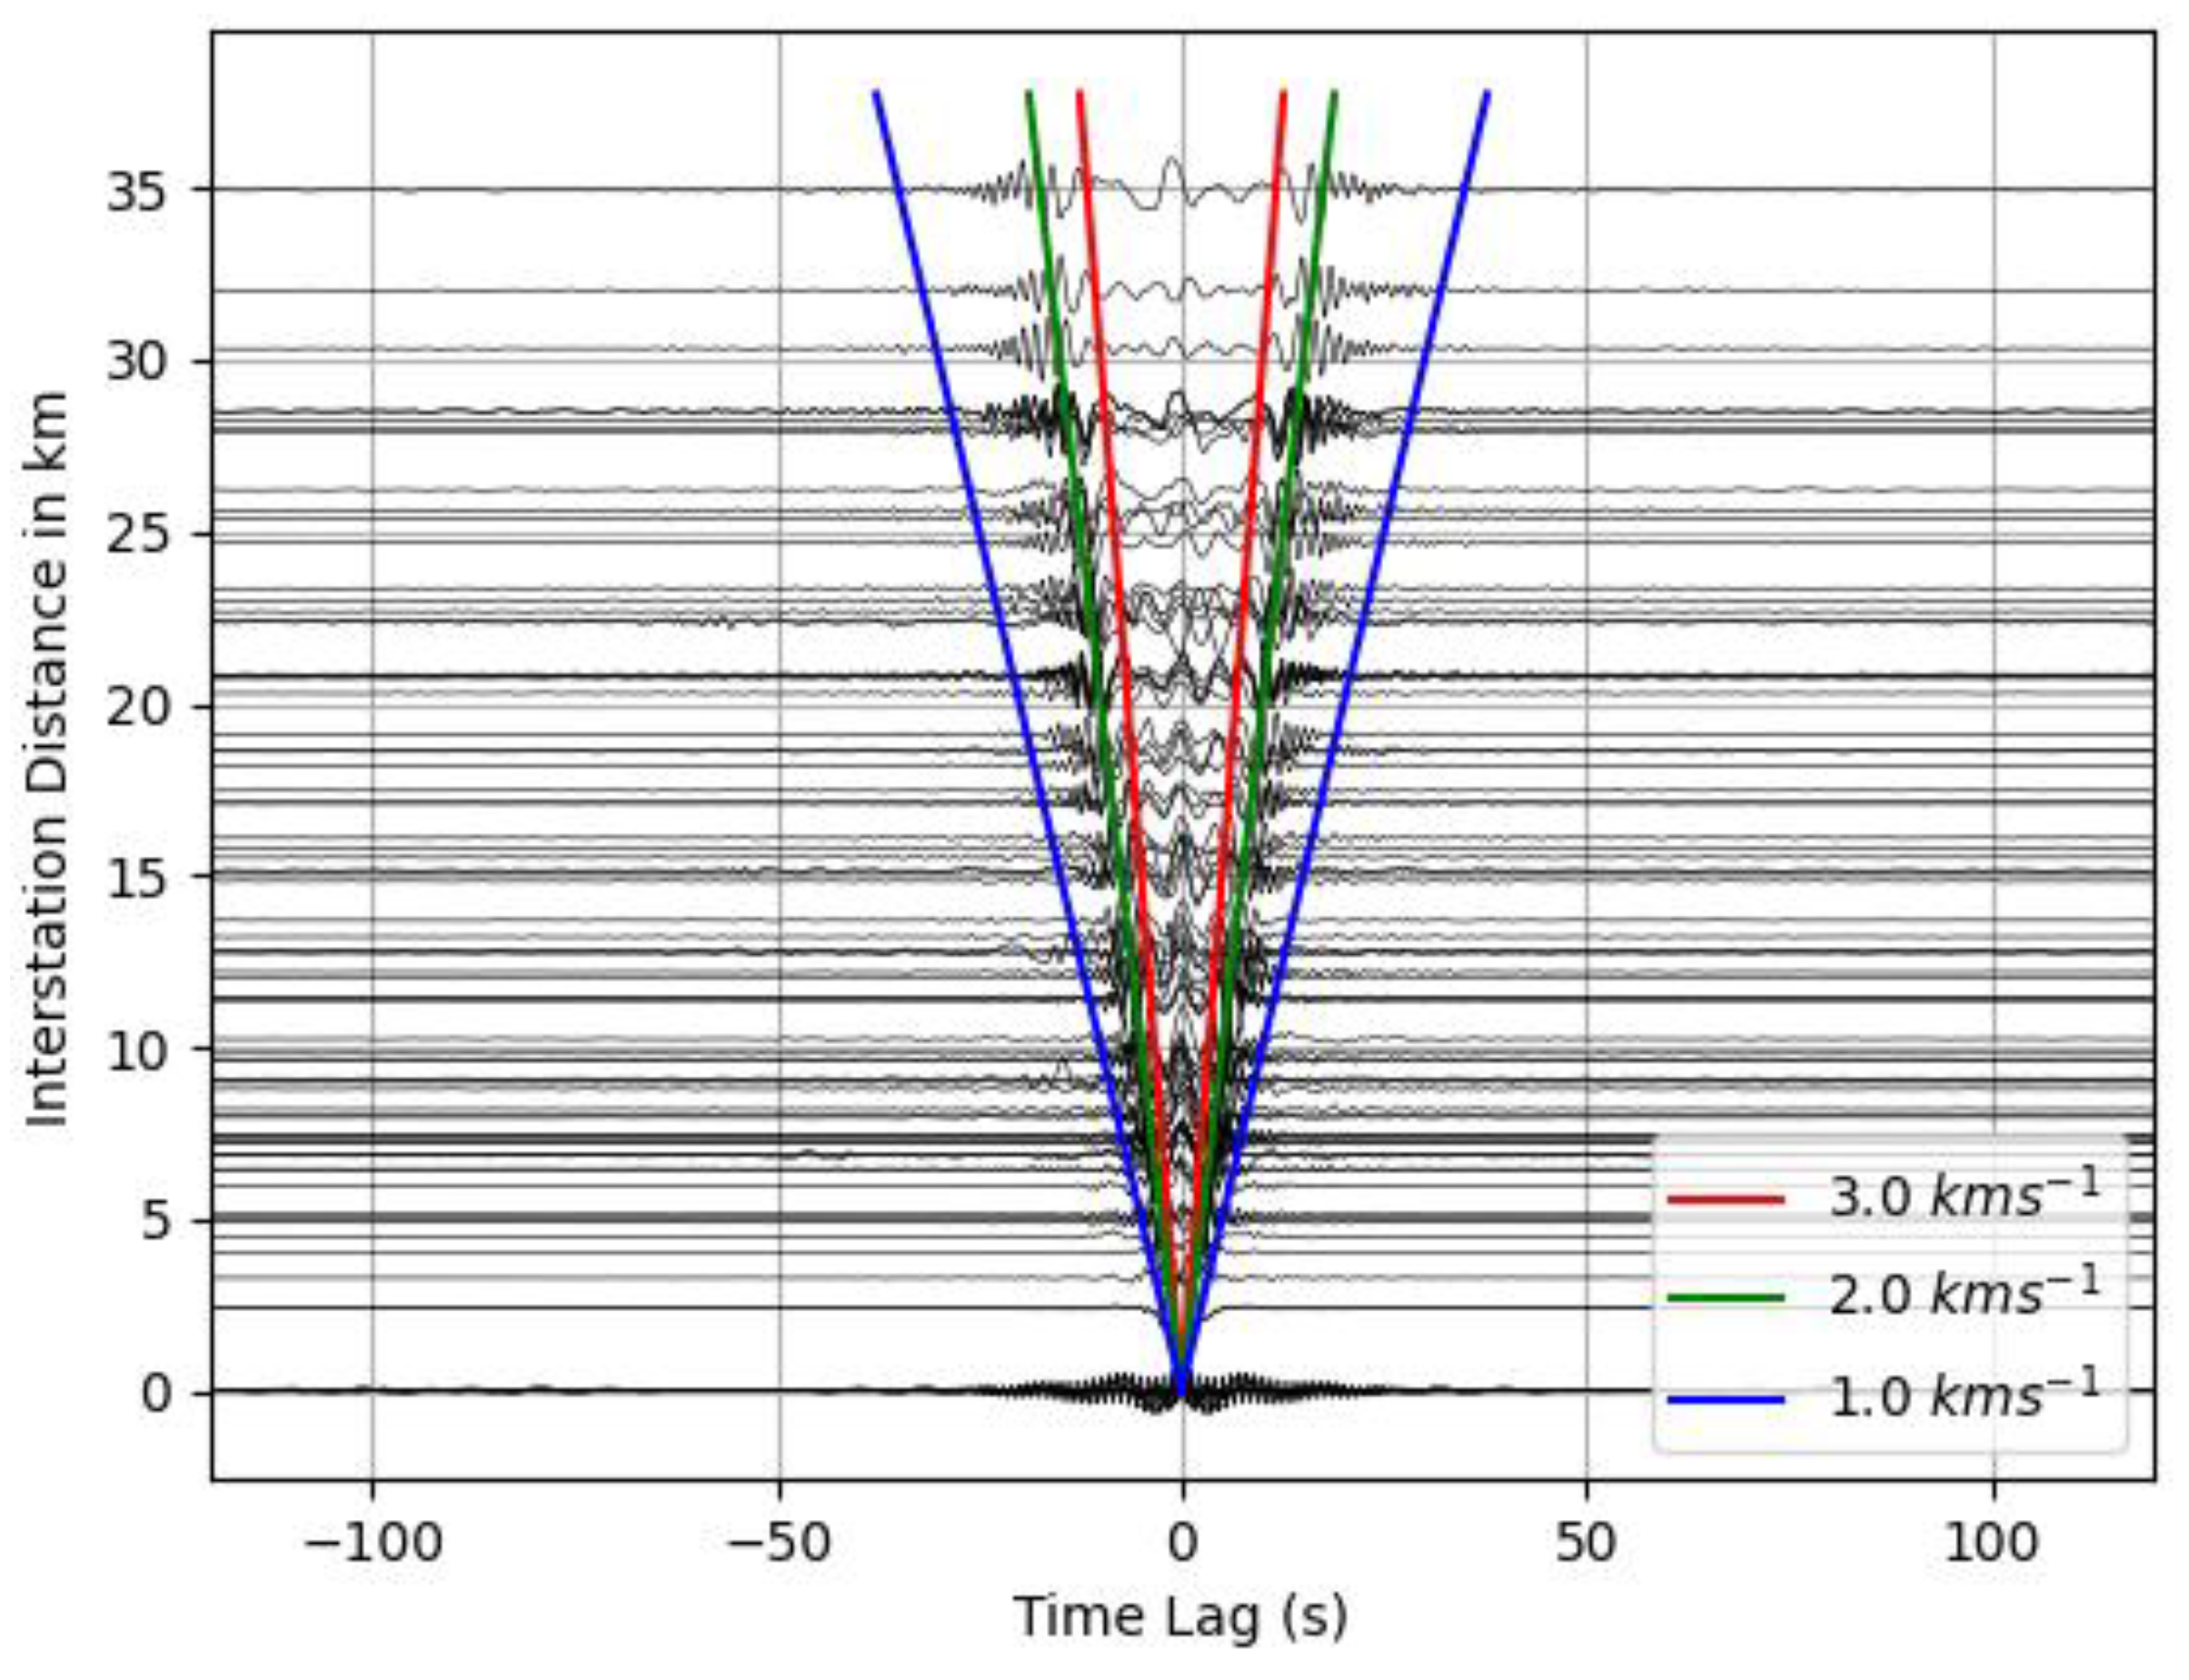
To determine changes in seismic velocity over time, the “current” CCF (or better called correlogram) is compared to a reference correlogram, which is the averaged background representation of the medium being studied [43]. Here, the reference correlograms are computed by averaging all the CCF data available for each station pair (Figure 5). Each reference correlogram peaks in the causal and acausal time lag. As the interstation distance increases, the time lag of the peaks in the reference correlogram also increases. The red, green, and blue lines in Figure 5 indicate the moveout velocities of ballistic waves. The reference correlograms at an interstation distance of 0 km are from auto-correlations. It can be observed that the plot is symmetric, suggesting that the ambient seismic noise recorded by the stations is isotropic and that the ocean microseism noise sources are from random and equally distributed sources and directions. This is likely due to the fact that Malta is an island.
We determine variations in seismic velocity from the CCFs by using the moving-window cross-spectral (MWCS) technique, which operates in the frequency domain [43,99]. One key advantage of the MWCS is that the coherent signal bandwidth in the CCF can be distinctly interpreted in the frequency domain [43], unlike other methods in the time domain (e.g., [18,66]). The MWCS essentially determines the difference between two correlograms in the form of time delay, phase, and coherence properties. The difference between the current (e.g., Figure 4) and reference correlograms (Figure 5) is typically very small and practically invisible to the eye. Delay times (δt) are in the order of 1% or less. Assuming that, to a first-order approximation, a stress field perturbation acts homogeneously over the region sampled by the cross-correlated seismic noise, the seismic velocity perturbation δv/v within that region will also be homogenous and is directly proportional to −δt/t. A detailed description can be found in Clarke et al. [43] and is implemented in MSNoise [58].
The δv/v (%) for each day is plotted as a time series (e.g., Figure 6, Figure 7, Figure 8 and Figure 9). The axis of the δv/v is inverted to help visualize the relationship between the change in seismic velocity and the changes in water level from nearby boreholes measured in meters above the mean sea level (MSL). As the water level increases, the change in δv/v is expected to be negative due to an increase in pore pressure in the grains of underground rocks. The scattered daily plots can be seen to have a seasonal (sinusoidal) pattern, better represented with a rolling average. We also plot precipitation data from the closest meteorological station since this is the main source of supply to the aquifers.
To improve the CCF signal, two or more days were further stacked to represent daily measures. The more stacking days used, the better (clearer) the signal-to-noise ratio of the CCF. However, this will result in smoothing the daily changes and, in turn, lowering the temporal resolution of the data. Hence, a two-day stack was generally deemed a good compromise. Similarly, the rolling average run on the scattered seismic and borehole data acts as a smoothing factor, whereby more days will reduce perturbations. A 30-day period was chosen to examine robust monthly patterns (Figure 6, Figure 7, Figure 8 and Figure 9).
The processing was tested on the three components of the seismic data: north, east, and vertical. All three components showed similar results, for example, similar reference correlograms (Figure 5). We therefore opted to further process the data using the vertical component only, which is also considered the component that is the least affected by anthropogenic, very near noise. We also computed the δv/v using the two filter bands 0.1–1 Hz and 0.3–3 Hz, both showing consistent correlograms. These and other tests, such as different rolling-average windows, are discussed in detail in Laudi [100].
The water level at the MSL aquifer was acquired from 13 boreholes that are part of the groundwater monitoring network of the Maltese islands managed by the Energy and Water Agency (Figure 1). Water level data from 2016–2020 were collected every 30 min using water level shaft encoders fitted with data loggers (Thalimedes, OTT [101]), which serve as automated water level monitoring equipment. Meteorological data from 6 stations operating from 2017–2020 was obtained from the MetOffice of the Malta International Airport (Figure 1). Precipitation, temperature, and atmospheric pressure data were acquired every hour. This data is plotted together with the results to aid the visual examination of our observations (Figure 6, Figure 7, Figure 8 and Figure 9).

3. Results

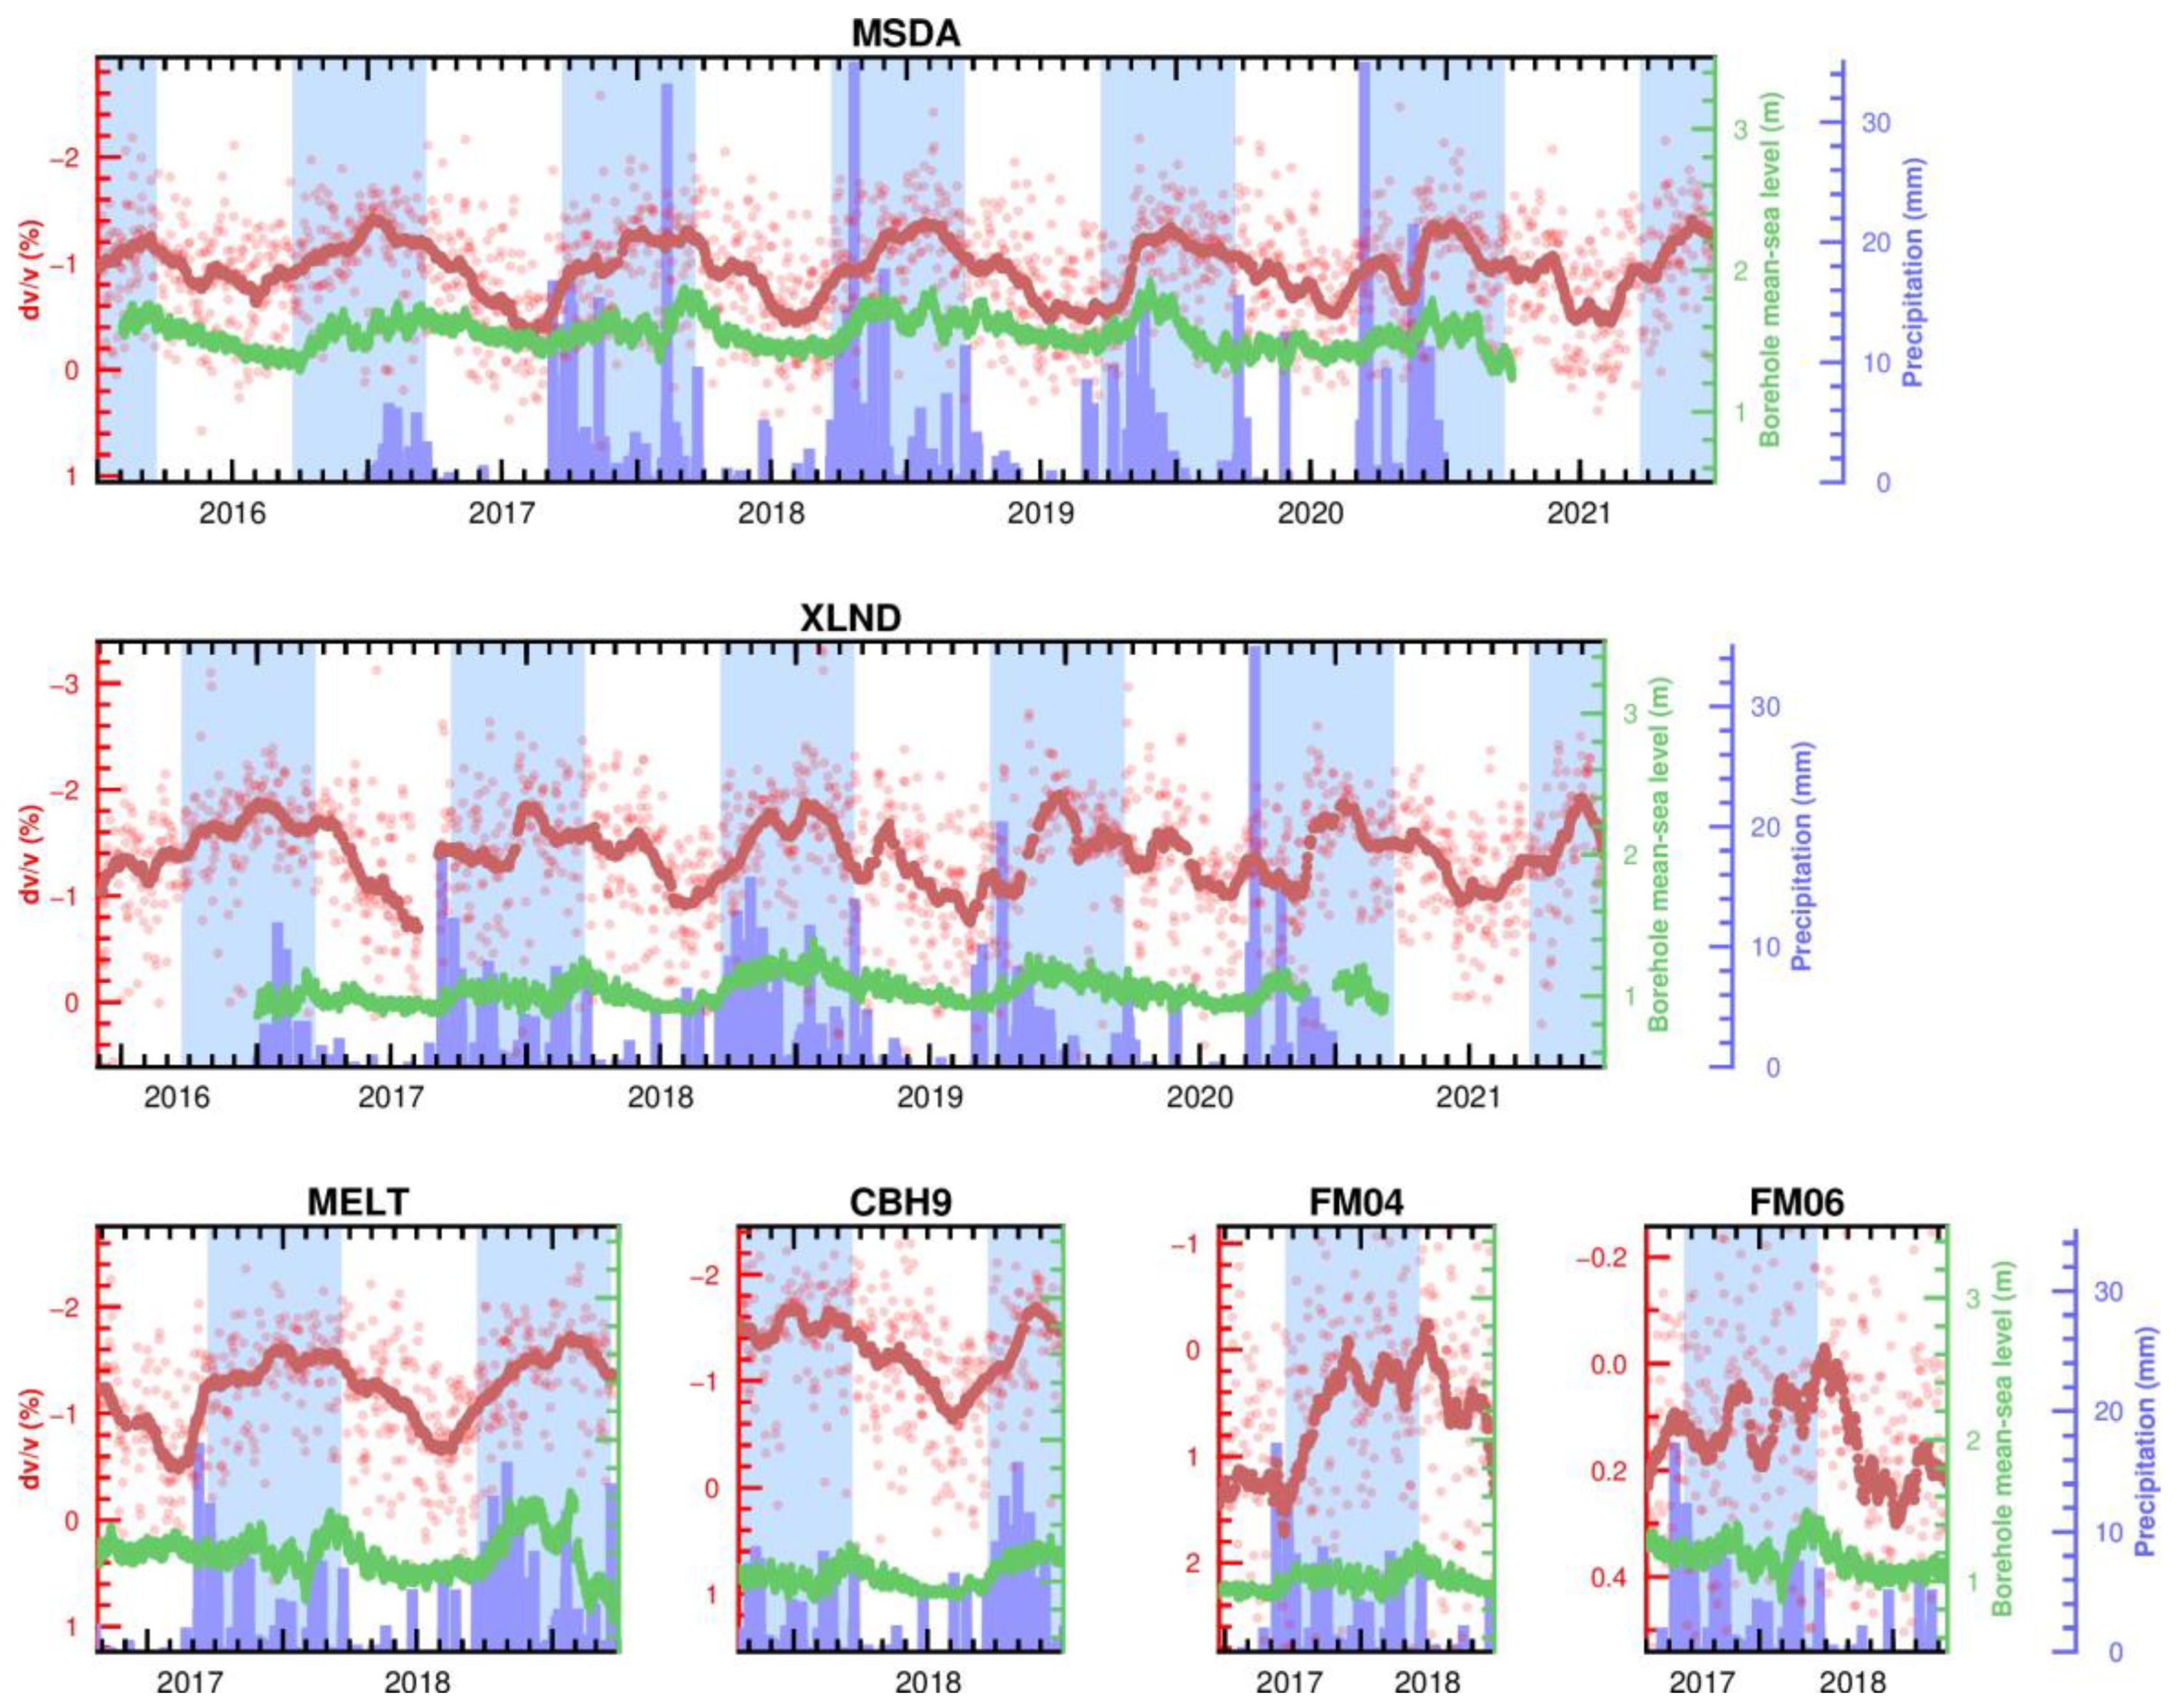
We present time-dependent seismic velocity changes from auto- and cross-correlations of ambient seismic noise from the MSN and the FASMIT seismic networks in Malta. In total, 12 auto-correlations and 66 cross-correlations were processed. Figure 6 and Figure 7 show examples of δv/v from cross-correlation between broadband-broadband stations (CBH9-QALA and CBH9-MELT), between broadband-short period stations (XLND-FM04, WDD-FM06, MSDA-FM02, and QALA-FM04), and between short period stations (FM01-FM02). Figure 8 and Figure 9 show examples of δv/v from auto-correlation (MSDA, XLND, MELT, CBH9, WDD, FM04, and FM06). The δv/v of all the plots shows seasonal summer-winter variations, with patterns visually comparable to the changes in the water level at the MSL and occurrences of precipitation recorded from nearby boreholes and meteorological stations, respectively.
Since only one year of data is available for the FASTMIT stations, annual variations in cross-correlations of short-period stations cannot be studied; however, a seasonal variation in the δv/v can still be noted. For example, for pairs XLND-FM04, WDD-FM06, MSDA-FM02, QALA-FM04, and FM01-FM02, the positive change in the δv/v values at the end of summer 2018 matches the values found at the end of summer 2017, coinciding with the decreases in the water level (Figure 6 and Figure 7). This good agreement gives confidence in the data processing, particularly for the FASTMIT stations, which are low-cost, short-period instruments and are easily deployed.
A similar situation for short-term data is with station CBH9, on the small island of Comino, which experienced a power outage. In this case, during the winter of 2018, the δv/v decreased, matching the values of the previous winter and coinciding with precipitation and the increase in water level during the winter season (Figure 7).
Auto-correlations from the permanent stations provide longer time series (Figure 8 and Figure 9). The annual patterns are clearer and show consistent trends that match borehole data and precipitation patterns. The amplitudes of the δv/v from the auto-correlations are also larger than the cross-correlation, about 1% in contrast to ~0.4%, thus rendering the auto-correlations more sensitive. In Figure 9, the annual δv/v changes of the long-running seismic station WDD are shown from 1995. The annual seismic velocity changes are very clear and are consistent with the borehole and precipitation data from 2016–2020. This gives us some quality assurance on the earlier seismic data, which is not compared.

4. Discussion

The results demonstrate that seasonal and annual changes in groundwater levels can be detected by changes in seismic velocity (δv/v) for small limestone islands such as Malta, particularly the island of Comino, which is only 3.5 km2 in area (station CBH9). This is important as most studies that have detected seasonal changes in the δv/v so far have been from large groundwater basins [16,23,24], complex aquifer systems [21], volcanoes [18,28], mountain regions [20], geothermal fields [27], groundwater exploitation fields [25,26], larger islands [29], and volcanic islands [41]. Malta has relatively smaller aquifer systems; it is surrounded by saltwater at close distances; and it has no rivers, lakes, or mountain regions.
The methods work for both cross- and auto-correlation functions of ambient seismic noise, the latter being more sensitive (larger change in δv/v) (Figure 7 and Figure 8). Two types of stations were investigated: broadband from the MSN and short period from the FASTMIT network, and they show that both stations can provide sensitivity to the δv/v when taking appropriate filters into consideration. Moreover, our results show that a combination of both types of instruments can be used, which is convenient when deploying temporary networks in conjunction with permanent networks.
The seismic data can also be used to investigate long-term patterns of groundwater. Here we process all the data from the seismic station WDD, which has been in operation since 1995. The change in velocity is seen to oscillate consistently between the winter and summer seasons (Figure 9). When groundwater data is not available, such a “proxy” can be considered for modeling; however, one must consider a number of factors and limitations discussed here.
The agreement between the temporal variation of δv/v and the borehole water level is not always consistent. In some cases, the δv/v follows the water level closely (e.g., Figure 8, MSDA), while in other cases, the agreement is not as evident. The relationship between seismic velocity and precipitation, water percolation into the rocks, and the water table can be complex. One has to take into account many factors such as rainwater runoff, permeability and infiltration of the rocks, depth of the aquifer, distances between the seismic stations, the meteorological station, and the borehole, strong water anomalies near the borehole, and that the seismic and water level sensors undergo periods of unreliability. Perhaps the most important is the heterogeneity in the geology of the area; in the case of the Maltese islands, it is characterized by normal faults, which may also influence the dynamics of the changes in seismic velocity and groundwater level. It could also be that water level changes are not the sole reason the δv/v varies seasonally, and other geo-environmental considerations, such as meteorological phenomena (e.g., air pressure and temperature), may play a role. For these reasons, finding a single statistical correlation between the changes in seismic velocity and the water level data may not be useful. Nevertheless, the clear seasonal variation of our results gives us confidence that δv/v may conceptually act as a suitable proxy for monitoring groundwater levels in small islands such as Malta and in places where borehole measurements are sparse.
Here we discuss some further issues related to the performance of the method and the comparison of the δv/v with the nearest borehole water level, interstation distance, rainfall, seasonal air temperatures, atmospheric pressure, and geological issues.

4.1. Station Problems: Power Outage and Timing Issues

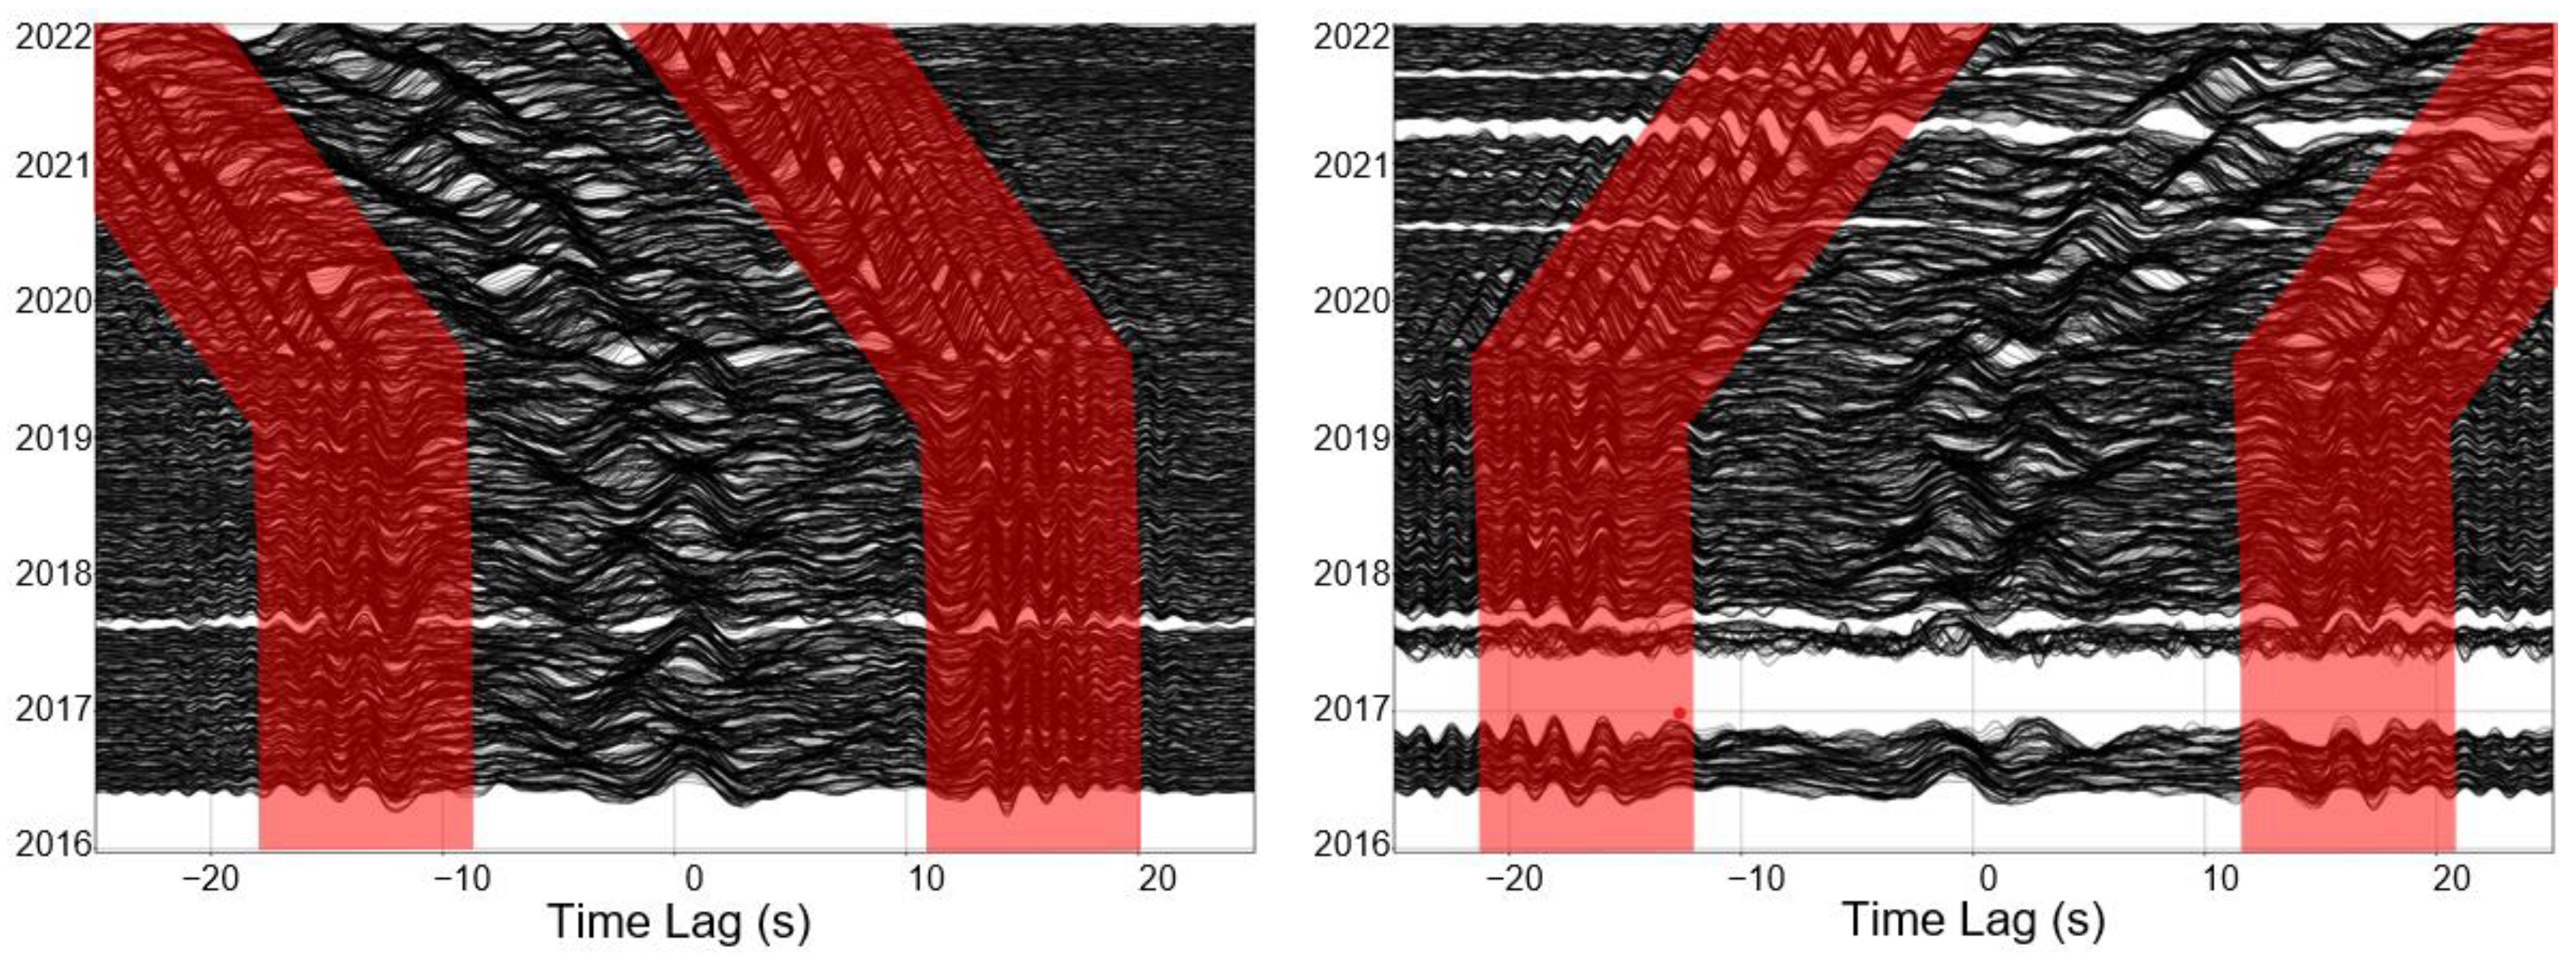
Before interpreting changes in seismic velocities, it is essential to identify errors in the performance of the seismic stations. Gaps in the data availability highlight some problems at the station, such as a power outage or a station shut down for maintenance. This is reflected in the CCF daily time plots (Figure 10) and the computed δv/v from the correlations (e.g., CBH9, QALA, and WDD stations) (Figure 7 and Figure 9).
Station timing errors are the most difficult to identify and the most crucial for the MWCS analysis. Plots of daily CCF against time (Figure 10) provide the opportunity to identify possible timing errors in the data. Timing problems can be visually noted in a single CCF or noticed when comparing several days, weeks, or months of CCFs, whereby the CCFs should be asymmetric. Figure 10 shows examples of the CCF against a time lag plot in the correlograms of MSDA-XLND and XLND-WDD. Shifting of the CCFs suggests that station XLND has a timing error from mid-2019 until the end of 2021. The timing problems were confirmed by the network operators as a result of issues with the GPS antenna cable.
Timing problems cannot be identified in the CCF-time lag plots of auto-correlations because the CCF cancels out such a negligible error when correlating data from the same day and station. Thus, the δv/v of auto-correlations are still valid and can be used. In fact, station XLND maintains seasonal changes throughout the dataset when seen through its auto-correlation function (Figure 8).

4.2. Geological and Hydrogeological Considerations

Interpreting the δv/v in relation to the water level or volume inside the aquifer requires good geological knowledge of the area. In principle, the signal of the CCF should not be dithered by long distances, as can be seen in other studies where the CCF interstation distance reaches 200 km [19]. However, we note that for the longer interstation paths across Malta, the seasonal variations in the δv/v are less noticeable, presumably because the paths tend to traverse more complex geology, different aquifers, or even the sea. Indeed, the geology at the mean sea level is complex throughout the island. At sea level in the south of Malta, one finds the LCL, whereas beneath Comino, it is at the UCL and BC layers. While the stratigraphy remains roughly the same across the islands, the thicknesses of the layers vary. Different block types adjacent to each other, for example, a thicker GL block next to a block comprising a thin GL and a thicker UCL at sea level, would yield a different water infiltration rate and are likely to respond to recharge and discharge at different rates. Detailed cross-sections of the geology of Malta showing the complex lateral structures and the hydrogeology dynamics can be found in Barbagli et al. [102]. Thus, one has to be very careful how to interpret the changes in the seismic velocity, particularly from cross-correlation, where one station is in a different geological setting than the other. Station pair XLND-FM04 is such a case, with XLND located on LCL and FM04 located on GL. The examples shown in Figure 7 are station pairs crossing the same geological features and giving good agreement to the nearby boreholes.
In the case of δv/v measurements from auto-correlation, these have a more direct relationship with the geology and aquifer found below the station. This is probably why the auto-correlation measurements show good results (Figure 8 and Figure 9). Measurements from auto-correlation might, however, be complex to interpret if stations are located on top of multiple aquifers, each having its own recharge/discharge system. Another consideration is how far away the seismic station is from the coast: the closer it is, the thinner the freshwater lens, affecting the amplitude of the change in the MSL. This is the case for station XLND (Figure 8), which is about 300 m away from the sea.
Ideally, the observed changes in seismic velocities can be inferred from a structured model (1, 2, 3, or 4D). Such modeling will provide valuable information about the structure and dynamics of the underlying aquifer. This typically requires a data-model inversion. Studies to reconstruct velocity-depth structures in the Maltese islands have shown that seismic velocities (VP and VS) and layer thicknesses can have a wide range of values and lateral heterogeneity (e.g., [103,104]). Such quantitative, complex modeling requires very good a priori geological information (e.g., seismic velocities at different depths determined from nearby cores). The method presented here is qualitative and is meant to demonstrate the occurrence of groundwater changes.

4.3. Meteorological Considerations

Numerous studies have tested for a correlation between variations in δv/v and seasonal variations of meteorological parameters such as precipitation [20,28,29,71,105], air temperature [16,19,21,72], and atmospheric pressure [71]. We compare the precipitation, air temperature, and atmospheric pressure data with the δv/v measurements for station WDD (Figure 11). The data show seasonal patterns for all three parameters, as expected, particularly precipitation and temperature, and show general agreement with the δv/v from station WDD, the closest seismic station to the meteorological station at the international airport.
The amount of water from precipitation that percolates into the underground, shallow rock layers depends on the degree of surface runoff exhibited in the area. For example, urban regions tend to exhibit lower groundwater recharge rates (and more surface runoff) when compared to more agricultural ones due to a higher degree of impervious areas [106]. In agricultural areas, the types of agricultural practices used and soil properties such as texture, porosity, bulk density, and hydraulic conductivity all determine how much rainwater percolates into groundwater [107]. Agricultural practices and soil properties vary from one area to another, which may also contribute to varying levels of surface runoff and water levels from boreholes. Precipitation events may not have an instant effect on the δv/v, as shown by Illien et al. [20]. Additionally, the effect on the δv/v may vary from place to place depending on the amount of rainfall percolating into groundwater or being lost to surface runoff in a specific location.
The amount of rainwater percolating into groundwater also depends on whether rainfall events are constant and gradual or more intense. Gradual rain events would allow rainwater to steadily percolate through the vadose zone and into groundwater since the soil would not immediately reach its field capacity. Generally, this is not the case for Malta. Due to Malta’s rainfall events being mainly torrential, the field capacity of the soil is easily reached, and this may lead to water stored in the soil pores blocking subsequent rainwater from percolating down into groundwater (Figure 8 and Figure 9).
Studies that looked at how variations in the δv/v correlate with precipitation found that peaks in the δv/v coincide with precipitation events (e.g., [29]). A visual agreement between precipitation events and the variation in δv/v can be seen for most of the correlations (Figure 7 and Figure 8). Although this is encouraging, a detailed investigation is necessary to establish the relationship between precipitation and its effect on groundwater levels and changes in seismic velocity while taking into account the above-mentioned considerations.
Changes in air temperatures may also influence the changes in δv/v in the Earth’s shallow crustal layers (e.g., [16,19,21,72]). Although air temperature changes affect the δv/v in the first tens to hundreds of centimeters of the Earth’s crust, these changes induce thermoelastic strains in the crust [72] that may extend even deeper [73]. A study by Hillers et al. [71] found that changes in air temperature and thermoelastic strain dominate changes in δv/v in the shallow crustal layers of an arid region; thus, the effect that atmospheric pressure may have on seismic velocity changes was considered negligible [71]. Clements and Denolle [16] concluded that changes in seismic velocity were mainly derived from hydrological effects rather than thermoelastic strains, or a mixture of both hydrological effects and thermoelastic strains might determine the changes in seismic velocity in the medium being studied [21].
The seasonal air temperature changes in the Maltese islands are regular in period and amplitude (Figure 11), with higher temperatures in the summer periods and lower temperatures in the winter periods. In general, increases in air temperature coincide with troughs in the δv/v. However, the δv/v have more irregular patterns that seem to relate to the precipitation, such as in the case of autumn–winter 2019–2020, when it rained less and the δv/v amplitude was less pronounced. This leads us to believe that the water content has a larger influence than the temperature on seismic velocity changes, at least in certain regions.

5. Conclusions

We present time-dependent seismic velocity changes from auto- and cross-correlations of ambient seismic noise from broadband and short-period stations in Malta. The velocity changes show annual, seasonal summer-winter variations, with patterns similar to the water level data from nearby boreholes, where increases in water levels in the winter period coincide with a negative change in the δv/v, and lower water levels in the summer months coincide with a positive change in the δv/v. We find that the auto-correlations produced larger variations in the δv/v (~1%) than those from cross-correlations (~0.4%) and that short-period seismic stations are also sensitive. When comparing changes in the seismic velocities with meteorological observations, we find that the variations coincide more with the amount of precipitation. This gives us confidence that seismic observations are mostly influenced by the presence of water in the pores of rocks. We conclude that the method works for very small limestone islands such as Comino, Gozo, and Malta (3.5–246 km2), which have a small aquifer system, are surrounded by saltwater at close distances, and have a semi-arid climate with limited precipitation. Changes in the groundwater level can be detected using low-cost, easy-to-deploy seismic stations, which can thus act as an additional tool for groundwater monitoring, especially in places with limited natural water reservoirs and infrastructure.

Author Contributions

Conceptualization, M.R.A., M.S., P.G. and S.D.; methodology, L.L. and M.R.A.; software, L.L. and M.R.A.; validation, L.L., M.R.A. and P.G.; formal analysis, L.L.; investigation, L.L.; resources, P.G. and S.D.; data curation, M.R.A.; writing—original draft preparation, L.L.; writing—review and editing, L.L, M.R.A., M.S., P.G. and S.D.; visualization, L.L. and M.R.A.; supervision, M.R.A. and P.G.; project administration, P.G. and S.D.; funding acquisition, P.G. and S.D. All authors have read and agreed to the published version of the manuscript.

Funding

Project SIGMA (Seismic Imaging of Groundwater for Maltese Aquifers) is financed by the Energy and Water Agency under the National Strategy for Research and Innovation in Energy and Water (2021–2030), Grant Agreement Number: EWA 110/20/2/005-SE.

Data Availability Statement

Data from the Malta Seismic Network are available from the Italian National Institute of Geophysics and Volcanology at http://webservices.ingv.it (accessed on 2 July 2023). Data from FASTMIT network are available upon request at https://seismic.research.um.edu.mt (accessed on 2 July 2023). Restrictions apply to the availability of borehole and meteorological data. Borehole data were obtained from the Energy and Water Agency (Malta) and are available on request at https://energywateragency.gov.mt (accessed on 2 July 2023); meteorological data are available from the Malta International Airport at https://www.maltairport.com (accessed on 2 July 2023).

Acknowledgments

The authors thank the three anonymous reviewers and the editor for the constructive comments that helped improve the manuscript; Manuel Sapiano, Michael Schembri, Julian Mamo, and Christa Pisani for discussions on the hydrogeology of the Maltese islands. The Python packages Obspy [108] and MSNoise [58] were used to process the data. Some figures were made using Generic Mapping Tools software [109,110].

Conflicts of Interest

The authors declare no conflict of interest. The funders had no role in the design of the study; in the collection, analyses, or interpretation of data; in the writing of the manuscript; or in the decision to publish the results.

References

  1. Kavusi, M.; Khashei Siuki, A.; Dastourani, M. Optimal design of groundwater monitoring network using the combined Election-Kriging method. Water Resour. Manag. 2020, 34, 2503–2516. [Google Scholar] [CrossRef]
  2. Zhou, Y.; Dong, D.; Liu, J.; Li, W. Upgrading a regional groundwater level monitoring network for Beijing Plain, China. Geosci. Front. 2013, 4, 127–138. [Google Scholar] [CrossRef] [Green Version]
  3. Healy, R.W.; Cook, P.G. Using groundwater levels to estimate recharge. Hydrogeol. J. 2002, 10, 91–109. [Google Scholar] [CrossRef]
  4. Gemitzi, A.; Lakshmi, V. Estimating groundwater abstractions at the aquifer scale using GRACE observations. Geosciences 2018, 8, 419. [Google Scholar] [CrossRef] [Green Version]
  5. United Nations. The United Nations World Water Development Report 2022: Groundwater Making the Invisible Visible: Facts and Figures; Technical Report; United Nations: Perugia, Italy, 2022. [Google Scholar]
  6. Bawden, G.W.; Thatcher, W.; Stein, R.S.; Hudnut, K.W.; Peltzer, G. Tectonic contraction across Los Angeles after removal of groundwater pumping effects. Nature 2001, 412, 812–815. [Google Scholar] [CrossRef] [PubMed]
  7. Ji, K.H.; Herring, T.A. Correlation between changes in groundwater levels and surface deformation from GPS measurements in the San Gabriel Valley, California. Geophys. Res. Lett. 2012, 39, L01301. [Google Scholar] [CrossRef]
  8. King, N.; Argus, D.; Langbein, J.; Agnew, D.; Bawden, G.; Dollar, R.; Liu, Z.; Galloway, D.; Reichard, E.; Yong, A.; et al. Space geodetic observation of expansion of the San Gabriel Valley, California, aquifer system, during heavy rainfall in winter 2004–2005. J. Geophys. Res. Solid Earth 2007, 112, B03409. [Google Scholar] [CrossRef]
  9. Chaussard, E.; Milillo, P.; Bürgmann, R.; Perissin, D.; Fielding, E.J.; Baker, B. Remote sensing of ground deformation for monitoring groundwater management practices: Application to the Santa Clara Valley during the 2012–2015 California drought. J. Geophys. Res. Solid Earth 2017, 122, 8566–8582. [Google Scholar] [CrossRef] [Green Version]
  10. Galloway, D.L.; Hoffmann, J. The application of satellite differential SAR interferometry-derived ground displacements in hydrogeology. Hydrogeol. J. 2007, 15, 133–154. [Google Scholar] [CrossRef] [Green Version]
  11. Ramillien, G.; Famiglietti, J.S.; Wahr, J. Detection of continental hydrology and glaciology signals from GRACE: A review. Surv. Geophys. 2008, 29, 361–374. [Google Scholar] [CrossRef] [Green Version]
  12. Rodell, M.; Velicogna, I.; Famiglietti, J.S. Satellite-based estimates of groundwater depletion in India. Nature 2009, 460, 999–1002. [Google Scholar] [CrossRef] [PubMed] [Green Version]
  13. Xanke, J.; Liesch, T. Quantification and possible causes of declining groundwater resources in the Euro-Mediterranean region from 2003 to 2020. Hydrogeol. J. 2022, 30, 379–400. [Google Scholar] [CrossRef]
  14. Xiao, M.; Koppa, A.; Mekonnen, Z.; Pagán, B.R.; Zhan, S.; Cao, Q.; Aierken, A.; Lee, H.; Lettenmaier, D.P. How much groundwater did California’s Central Valley lose during the 2012–2016 drought? Geophys. Res. Lett. 2017, 44, 4872–4879. [Google Scholar] [CrossRef]
  15. Kirsch, R. Groundwater Geophysics: A Tool for Hydrogeology; Springer: Berlin/Heidelberg, Germany, 2006. [Google Scholar]
  16. Clements, T.; Denolle, M.A. Tracking groundwater levels using the ambient seismic field. Geophys. Res. Lett. 2018, 45, 6459–6465. [Google Scholar] [CrossRef] [Green Version]
  17. Christensen, N.; Wang, H. The influence of pore pressure and confining pressure on dynamic elastic properties of Berea sandstone. Geophysics 1985, 50, 207–213. [Google Scholar] [CrossRef]
  18. Sens-Schönfelder, C.; Wegler, U. Passive image interferometry and seasonal variations of seismic velocities at Merapi Volcano, Indonesia. Geophys. Res. Lett. 2006, 33, L21302. [Google Scholar] [CrossRef]
  19. Meier, U.; Shapiro, N.M.; Brenguier, F. Detecting seasonal variations in seismic velocities within Los Angeles basin from correlations of ambient seismic noise. Geophys. J. Int. 2010, 181, 985–996. [Google Scholar] [CrossRef] [Green Version]
  20. Illien, L.; Andermann, C.; Sens-Schönfelder, C.; Cook, K.; Baidya, K.; Adhikari, L.; Hovius, N. Subsurface moisture regulates Himalayan groundwater storage and discharge. AGU Adv. 2021, 2, e2021AV000398. [Google Scholar] [CrossRef]
  21. Lecocq, T.; Longuevergne, L.; Pedersen, H.A.; Brenguier, F.; Stammler, K. Monitoring ground water storage at mesoscale using seismic noise: 30 years of continuous observation and thermo-elastic and hydrological modeling. Sci. Rep. 2017, 7, 14241. [Google Scholar] [CrossRef] [Green Version]
  22. Mainsant, G.; Larose, E.; Brönnimann, C.; Jongmans, D.; Michoud, C.; Jaboyedoff, M. Ambient seismic noise monitoring of a clay landslide: Toward failure prediction. J. Geophys. Res. Earth Surf. 2012, 117, F01030. [Google Scholar] [CrossRef] [Green Version]
  23. Mao, S.; Lecointre, A.; van der Hilst, R.D.; Campillo, M. Space-time monitoring of groundwater fluctuations with passive seismic interferometry. Nat. Commun. 2022, 13, 4643. [Google Scholar] [CrossRef]
  24. Kim, D.; Lekic, V. Groundwater variations from autocorrelation and receiver functions. Geophys. Res. Lett. 2019, 46, 13722–13729. [Google Scholar] [CrossRef]
  25. Garambois, S.; Voisin, C.; Romero Guzman, M.; Brito, D.; Guillier, B.; Réfloch, A. Analysis of ballistic waves in seismic noise monitoring of water table variations in a water field site: Added value from numerical modelling to data understanding. Geophys. J. Int. 2019, 219, 1636–1647. [Google Scholar] [CrossRef]
  26. Voisin, C.; Guzmán, M.A.R.; Refloch, A.; Taruselli, M.; Garambois, S. Groundwater monitoring with passive seismic interferometry. J. Water Resour. Prot. 2017, 9, 1414–1427. [Google Scholar] [CrossRef] [Green Version]
  27. Sánchez-Pastor, P.; Obermann, A.; Schimmel, M.; Weemstra, C.; Verdel, A.; Jousset, P. Short-and long-term variations in the Reykjanes geothermal reservoir from seismic noise interferometry. Geophys. Res. Lett. 2019, 46, 5788–5798. [Google Scholar] [CrossRef] [Green Version]
  28. Sens-Schönfelder, C.; Wegler, U. Passive image interferometry for monitoring crustal changes with ambient seismic noise. Comptes Rendus Geosci. 2011, 343, 639–651. [Google Scholar] [CrossRef]
  29. Wang, Q.-Y.; Brenguier, F.; Campillo, M.; Lecointre, A.; Takeda, T.; Aoki, Y. Seasonal crustal seismic velocity changes throughout Japan. J. Geophys. Res. Solid Earth 2017, 122, 7987–8002. [Google Scholar] [CrossRef]
  30. Hallett, S.; Sakrabani, R.; Thompson, A.; Deeks, L.; Knox, J. Improving soil and water management for agriculture: Insights and innovation from Malta. J. Appl. Res. Pract. 2017, 1, 40–59. [Google Scholar] [CrossRef]
  31. Hartfiel, L.; Soupir, M.; Kanwar, R.S. Malta’s Water Scarcity Challenges: Past, Present, and Future Mitigation Strategies for Sustainable Water Supplies. Sustainability 2020, 12, 9835. [Google Scholar] [CrossRef]
  32. National Statistics Office. Key Figures for Malta 2019 Edition: Visuals and Words. 2019. Available online: https://nso.gov.mt/en/nso/Media/Salient-Points-of-Publications/Document/Key%20Figures%20for%20Malta%20-%202019%20Edition/Malta%20In%20Figures%20-%202019.pdf. (accessed on 15 December 2022).
  33. National Statistics Office. Regional Tourism: 2016–2018. 2019. Available online: https://nso.gov.mt/en/News_Releases/View_by_Unit/Unit_C3/Tourism_Statistics/Documents/2019/News2019_106.pdf (accessed on 15 December 2022).
  34. Sapiano, M. Integrated Water Resources Management in the Maltese Islands. Acque Sotter.-Ital. J. Groundw. 2020, 9, 25–32. [Google Scholar] [CrossRef]
  35. Fenech, S.; Knox, J.; Borg, M.; Camilleri, C.; Rizzo, A. Estimating impacts of land use change on evapotranspiration for three agricultural crops in Malta—A preliminary assessment. J. Agric. Sci. 2019, 11, 67–74. [Google Scholar] [CrossRef]
  36. Bonnefoy-Claudet, S.; Cotton, F.; Bard, P.-Y. The nature of noise wavefield and its applications for site effects studies: A literature review. Earth-Sci. Rev. 2006, 79, 205–227. [Google Scholar] [CrossRef]
  37. Groos, J. Broadband Seismic Noise: Classification and Green’s Function Estimation. Ph.D. Thesis, Karlsruher Institute für Technologie, Karlsruhe, Germany, 2010. [Google Scholar]
  38. Yang, Y.; Ritzwoller, M.H. Characteristics of ambient seismic noise as a source for surface wave tomography. Geochem. Geophys. Geosystems 2008, 9, Q02008. [Google Scholar] [CrossRef] [Green Version]
  39. Asten, M.W. Geological control on the three-component spectra of Rayleigh-wave microseisms. Bull. Seismol. Soc. Am. 1978, 68, 1623–1636. [Google Scholar]
  40. Gutenberg, B. Microseisms. Adv. Geophys. 1958, 5, 53–92. [Google Scholar]
  41. Ardhuin, F.; Stutzmann, E.; Schimmel, M.; Mangeney, A. Ocean wave sources of seismic noise. J. Geophys. Res. Ocean. 2011, 116, C09004. [Google Scholar] [CrossRef]
  42. Campillo, M.; Paul, A. Long-range correlations in the diffuse seismic coda. Science 2003, 299, 547–549. [Google Scholar] [CrossRef] [Green Version]
  43. Clarke, D.; Zaccarelli, L.; Shapiro, N.; Brenguier, F. Assessment of resolution and accuracy of the Moving Window Cross Spectral technique for monitoring crustal temporal variations using ambient seismic noise. Geophys. J. Int. 2011, 186, 867–882. [Google Scholar] [CrossRef]
  44. Lobkis, O.I.; Weaver, R.L. On the emergence of the Green’s function in the correlations of a diffuse field. J. Acoust. Soc. Am. 2001, 110, 3011–3017. [Google Scholar] [CrossRef]
  45. Sabra, K.G.; Gerstoft, P.; Roux, P.; Kuperman, W.; Fehler, M.C. Extracting time-domain Green’s function estimates from ambient seismic noise. Geophys. Res. Lett. 2005, 32, L03310. [Google Scholar] [CrossRef]
  46. Shapiro, N.M.; Campillo, M.; Stehly, L.; Ritzwoller, M.H. High-resolution surface-wave tomography from ambient seismic noise. Science 2005, 307, 1615–1618. [Google Scholar] [CrossRef] [PubMed] [Green Version]
  47. Wapenaar, K.; Fokkema, J. Green’s function representations for seismic interferometry. Geophysics 2006, 71, SI33–SI46. [Google Scholar] [CrossRef]
  48. Weaver, R.L.; Lobkis, O.I. Diffuse fields in open systems and the emergence of the Green’s function (L). J. Acoust. Soc. Am. 2004, 116, 2731–2734. [Google Scholar] [CrossRef]
  49. Grobbe, N.; Mordret, A.; Barde-Cabusson, S.; Ellison, L.; Lach, M.; Seo, Y.-H.; Viti, T.; Ward, L.; Zhang, H. A Multi-Hydrogeophysical Study of a Watershed at Kaiwi Coast (O’ahu, Hawai’i), using Seismic Ambient Noise Surface Wave Tomography and Self-Potential Data. Water Resour. Res. 2021, 57, 1–21. [Google Scholar] [CrossRef]
  50. Agius, M.; Magrini, F.; Diaferia, G.; Kästle, E.; Cammarano, F.; Faccenna, C.; Funiciello, F.; van der Meijde, M. Shear-velocity structure and dynamics beneath the Sicily Channel and surrounding regions of the Central Mediterranean inferred from seismic surface waves. Geochem. Geophys. Geosyst. 2022, 23, e2022GC010394. [Google Scholar] [CrossRef]
  51. Bensen, G.; Ritzwoller, M.; Barmin, M.; Levshin, A.L.; Lin, F.; Moschetti, M.; Shapiro, N.; Yang, Y. Processing seismic ambient noise data to obtain reliable broad-band surface wave dispersion measurements. Geophys. J. Int. 2007, 169, 1239–1260. [Google Scholar] [CrossRef] [Green Version]
  52. Lin, F.-C.; Moschetti, M.P.; Ritzwoller, M.H. Surface wave tomography of the western United States from ambient seismic noise: Rayleigh and Love wave phase velocity maps. Geophys. J. Int. 2008, 173, 281–298. [Google Scholar] [CrossRef] [Green Version]
  53. Lin, F.-C.; Ritzwoller, M.H.; Townend, J.; Bannister, S.; Savage, M.K. Ambient noise Rayleigh wave tomography of New Zealand. Geophys. J. Int. 2007, 170, 649–666. [Google Scholar] [CrossRef] [Green Version]
  54. Moschetti, M.; Ritzwoller, M.; Shapiro, N. Surface wave tomography of the western United States from ambient seismic noise: Rayleigh wave group velocity maps. Geochem. Geophys. Geosyst. 2007, 8, Q08010. [Google Scholar] [CrossRef]
  55. Sabra, K.G.; Gerstoft, P.; Roux, P.; Kuperman, W.; Fehler, M.C. Surface wave tomography from microseisms in Southern California. Geophys. Res. Lett. 2005, 32, L14311. [Google Scholar] [CrossRef] [Green Version]
  56. Yang, Y.; Ritzwoller, M.H.; Levshin, A.L.; Shapiro, N.M. Ambient noise Rayleigh wave tomography across Europe. Geophys. J. Int. 2007, 168, 259–274. [Google Scholar] [CrossRef] [Green Version]
  57. Yao, H.; van Der Hilst, R.D.; De Hoop, M.V. Surface-wave array tomography in SE Tibet from ambient seismic noise and two-station analysis—I. Phase velocity maps. Geophys. J. Int. 2006, 166, 732–744. [Google Scholar] [CrossRef] [Green Version]
  58. Lecocq, T.; Caudron, C.; Brenguier, F. MSNoise, a Python Package for Monitoring Seismic Velocity Changes Using Ambient Seismic Noise. Seismol. Res. Lett. 2014, 85, 715–726. [Google Scholar] [CrossRef] [Green Version]
  59. Duputel, Z.; Ferrazzini, V.; Brenguier, F.; Shapiro, N.; Campillo, M.; Nercessian, A. Real time monitoring of relative velocity changes using ambient seismic noise at the Piton de la Fournaise volcano (La Réunion) from January 2006 to June 2007. J. Volcanol. Geotherm. Res. 2009, 184, 164–173. [Google Scholar] [CrossRef]
  60. Brenguier, F.; Campillo, M.; Takeda, T.; Aoki, Y.; Shapiro, N.; Briand, X.; Emoto, K.; Miyake, H. Mapping pressurized volcanic fluids from induced crustal seismic velocity drops. Science 2014, 345, 80–82. [Google Scholar] [CrossRef]
  61. Brenguier, F.; Rivet, D.; Obermann, A.; Nakata, N.; Boué, P.; Lecocq, T.; Campillo, M.; Shapiro, N. 4-d noise-based seismology at volcanoes: Ongoing efforts and perspectives. J. Volcanol. Geotherm. Res. 2016, 321, 182–195. [Google Scholar] [CrossRef]
  62. Brenguier, F.; Shapiro, N.M.; Campillo, M.; Ferrazzini, V.; Duputel, Z.; Coutant, O.; Nercessian, A. Towards forecasting volcanic eruptions using seismic noise. Nat. Geosci. 2008, 1, 126–130. [Google Scholar] [CrossRef] [Green Version]
  63. Rivet, D.; Brenguier, F.; Cappa, F. Improved detection of preeruptive seismic velocity drops at the Piton de La Fournaise volcano. Geophys. Res. Lett. 2015, 42, 6332–6339. [Google Scholar] [CrossRef] [Green Version]
  64. Brenguier, F.; Campillo, M.; Hadziioannou, C.; Shapiro, N.M.; Nadeau, R.M.; Larose, É. Postseismic relaxation along the San Andreas fault at Parkfield from continuous seismological observations. Science 2008, 321, 1478–1481. [Google Scholar] [CrossRef] [Green Version]
  65. Taira, T.; Brenguier, F.; Kong, Q. Ambient noise-based monitoring of seismic velocity changes associated with the 2014 Mw 6.0 South Napa earthquake. Geophys. Res. Lett. 2015, 42, 6997–7004. [Google Scholar] [CrossRef] [Green Version]
  66. Wegler, U.; Nakahara, H.; Sens-Schönfelder, C.; Korn, M.; Shiomi, K. Sudden drop of seismic velocity after the 2004 Mw 6.6 mid-Niigata earthquake, Japan, observed with Passive Image Interferometry. J. Geophys. Res. Solid Earth 2009, 114, B06305. [Google Scholar] [CrossRef]
  67. Wegler, U.; Sens-Schönfelder, C. Fault zone monitoring with passive image interferometry. Geophys. J. Int. 2007, 168, 1029–1033. [Google Scholar] [CrossRef]
  68. Mordret, A.; Mikesell, T.D.; Harig, C.; Lipovsky, B.P.; Prieto, G.A. Monitoring southwest Greenland’s ice sheet melt with ambient seismic noise. Sci. Adv. 2016, 2, e1501538. [Google Scholar] [CrossRef] [PubMed] [Green Version]
  69. Larose, E.; Carrière, S.; Voisin, C.; Bottelin, P.; Baillet, L.; Guéguen, P.; Walter, F.; Jongmans, D.; Guillier, B.; Garambois, S.; et al. Environmental seismology: What can we learn on earth surface processes with ambient noise? J. Appl. Geophys. 2015, 116, 62–74. [Google Scholar] [CrossRef]
  70. Yang, Z.; Yuan, C.; Denolle, M.A. Detecting Elevated Pore Pressure due to Wastewater Injection Using Ambient Noise Monitoring. Seism. Rec. 2022, 2, 38–49. [Google Scholar] [CrossRef]
  71. Hillers, G.; Ben-Zion, Y.; Campillo, M.; Zigone, D. Seasonal variations of seismic velocities in the San Jacinto fault area observed with ambient seismic noise. Geophys. J. Int. 2015, 202, 920–932. [Google Scholar] [CrossRef] [Green Version]
  72. Mao, S.; Campillo, M.; van der Hilst, R.D.; Brenguier, F.; Stehly, L.; Hillers, G. High temporal resolution monitoring of small variations in crustal strain by dense seismic arrays. Geophys. Res. Lett. 2019, 46, 128–137. [Google Scholar] [CrossRef] [Green Version]
  73. Tsai, V.C. A model for seasonal changes in GPS positions and seismic wave speeds due to thermoelastic and hydrologic variations. J. Geophys. Res. Solid Earth 2011, 116, B04404. [Google Scholar] [CrossRef] [Green Version]
  74. Obermann, A.; Froment, B.; Campillo, M.; Larose, E.; Planès, T.; Valette, B.; Chen, J.; Liu, Q. Seismic noise correlations to image structural and mechanical changes associated with the Mw 7.9 2008 Wenchuan earthquake. J. Geophys. Res. Solid Earth 2014, 119, 3155–3168. [Google Scholar] [CrossRef]
  75. Sharo, A.A.; Taamneh, M.O.; Alawneh, A.S.; Nuseir, O.K.; Rababeh, S.R. P Wave Velocity of Limestone Influenced by Saturation: Experimental Study. Int. Rev. Civ. Eng. 2022, 13, 108–117. [Google Scholar] [CrossRef]
  76. Claerbout, J.F. Synthesis of a layered medium from its acoustic transmission response. Geophysics 1968, 33, 264–269. [Google Scholar] [CrossRef]
  77. Wapenaar, K. Retrieving the elastodynamic Green’s function of an arbitrary inhomogeneous medium by cross correlation. Phys. Rev. Lett. 2004, 93, 254301. [Google Scholar] [CrossRef] [Green Version]
  78. House, M. Geology and Structure of the Maltese Islands; Research Paper Series; Durham University, Department of Geography: Durham, UK, 1961; Volume 5, pp. 23–31. [Google Scholar]
  79. Felix, R. Oligo-Miocene stratigraphy of Malta and Gozo. Meded. Land 1973, 73–20, 1–103. [Google Scholar]
  80. Pedley, H.M. A new lithostratigraphical and palaeoenvironmental interpretation for the coralline limestone formations (Miocene) of the Maltese Islands. Overseas Geol. Miner. Resour. 1978, 54, 17. [Google Scholar]
  81. Pedley, H.M.; House, M.R.; Waugh, B. The geology of the Pelagian block: The Maltese Islands. In The Ocean Basins and Margins; Springer: New York, NY, USA, 1978; pp. 417–433. [Google Scholar]
  82. Pedley, H. Controls on Cenozoic carbonate deposition in the Maltese islands: Review and reinterpretation. Mem. Della Soc. Geol. Ital. 1987, 38, 81–94. [Google Scholar]
  83. Alexander, D. A review of the physical geography of Malta and its significance for tectonic geomorphology. Quat. Sci. Rev. 1988, 7, 41–53. [Google Scholar] [CrossRef]
  84. Pedley, H. Syndepositional tectonics affecting Cenozoic and Mesozoic deposition in the Malta and SE Sicily areas (Central Mediterranean) and their bearing on Mesozoic reservoir development in the N Malta offshore region. Mar. Pet. Geol. 1990, 7, 171–180. [Google Scholar] [CrossRef]
  85. Rehfeld, U.; Janssen, A.W. Development of phosphatized hardgrounds in the miocene Globigerina Limestone of the Maltese archipelago, including a description of Gamopleura melitensis sp. nov. (Gastropoda, Euthecosomata). Facies 1995, 33, 91–106. [Google Scholar] [CrossRef]
  86. Magri, O. A geological and geomorphological review of the Maltese Islands with special reference to the coastal zone. Territoris 2006, 6, 7–26. [Google Scholar]
  87. Baldassini, N.; Di Stefano, A. Stratigraphic features of the Maltese Archipelago: A synthesis. Nat. Hazards 2017, 86, 203–231. [Google Scholar] [CrossRef]
  88. Prampolini, M.; Gauci, C.; Micallef, A.S.; Selmi, L.; Vandelli, V.; Soldati, M. Geomorphology of the north-eastern coast of Gozo (Malta, Mediterranean Sea). J. Maps 2018, 14, 402–410. [Google Scholar] [CrossRef]
  89. Continental Shelf Department. Geological Map of the Maltese Islands. 2022. Available online: https://continentalshelf.gov.mt/en/Pages/Geological-Map-of-the-Maltese-Islands.aspx (accessed on 15 December 2022).
  90. Newbery, J. The perched water table in the upper limestone aquifer of Malta. J. Inst. Water Eng. 1968, 22, 551–570. [Google Scholar]
  91. Food and Agricultural Organisation. Malta Water Resources Review; Technical Report; FAO: Rome, Italy, 2006. [Google Scholar]
  92. Buhagiar, K. Water management strategies and the cave-dwelling phenomenon in late-medieval Malta. Mediev. Archaeol. 2007, 51, 103–131. [Google Scholar] [CrossRef]
  93. Sapiano, M.; Micallef, P.; Attard, G.; Zammit, M.-L. The evolution of water culture in Malta: An analysis of the changing perceptions towards water throughout the ages. Options Mediterranéennes Ser. A Semin. Mediterr. 2008, 83, 97–109. [Google Scholar]
  94. National Audit Office. Performance Audit: Safeguarding Malta’s Groundwater; Technical Report; NAO: Floriana, Malta, 2012. [Google Scholar]
  95. Galea, P.; Agius, M.R.; Bozionelos, G.; D’Amico, S.; Farrugia, D. A first national seismic network for the Maltese islands–The Malta seismic network. Seismol. Soc. Am. 2021, 92, 1817–1831. [Google Scholar] [CrossRef]
  96. Bozionelos, G.; Galea, P.; D’Amico, S.; Plasencia Linares, M.; Romanelli, M.; Rossi, G.; Vuan, A.; Sugan, M.; Agius, M. An augmented seismic network to study off-shore seismicity around the Maltese Islands: The FASTMIT experiment. Xjenza 2019, 7, 104–121. [Google Scholar]
  97. McNamara, D.E.; Buland, R.P. Ambient noise levels in the continental United States. Bull. Seismol. Soc. Am. 2004, 94, 1517–1527. [Google Scholar] [CrossRef]
  98. Gubbins, D. Time Series Analysis and Inverse Theory for Geophysicists; Cambridge University Press: Cambridge, UK, 2004. [Google Scholar]
  99. Ratdomopurbo, A.; Poupinet, G. Monitoring a temporal change of seismic velocity in a volcano: Application to the 1992 eruption of Mt. Merapi (Indonesia). Geophys. Res. Lett. 1995, 22, 775–778. [Google Scholar] [CrossRef]
  100. Laudi, L. A Novel Approach to Groundwater Monitoring in the Maltese Islands: Analysis of Auto- and Cross-Correlation Functions of Ambient Seismic Noise. Master’s Thesis, University of Malta, Msida, Malta, 2023. [Google Scholar]
  101. OTT. Thalimedes. Available online: https://www.ott.com/download/leaflet-shaft-encoder-for-depth-and-water-level-measurement-ott-thalimedes-1/ (accessed on 23 June 2023).
  102. Barbagli, A.; Guastaldi, E.; Conti, P.; Giannuzzi, M.; Borsi, I.; Lotti, F.; Basile, P.; Favaro, L.; Mallia, A.; Xuereb, R.; et al. Geological and hydrogeological reconstruction of the main aquifers of the Maltese islands. Hydrogeol. J. 2021, 29, 2685–2703. [Google Scholar] [CrossRef]
  103. Farrugia, D.; Paolucci, E.; D’Amico, S.; Galea, P. Inversion of surface wave data for subsurface shear wave velocity profiles characterized by a thick buried low-velocity layer. Geophys. J. Int. 2016, 206, 1221–1231. [Google Scholar] [CrossRef] [Green Version]
  104. Pischiutta, M.; Villani, F.; D’Amico, S.; Vassallo, M.; Cara, F.; Di Naccio, D.; Farrugia, D.; Di Giulio, G.; Amoroso, S.; Cantore, L.; et al. Results from shallow geophysical investigations in the northwestern sector of the island of Malta. Phys. Chem. Earth Parts A/B/C 2017, 98, 41–48. [Google Scholar] [CrossRef]
  105. Hillers, G.; Campillo, M.; Ma, K.-F. Seismic velocity variations at TCDP are controlled by MJO driven precipitation pattern and high fluid discharge properties. Earth Planet. Sci. Lett. 2014, 391, 121–127. [Google Scholar] [CrossRef]
  106. Niemczynowicz, J. Urban hydrology and water management–present and future challenges. Urban Water 1999, 1, 1–14. [Google Scholar] [CrossRef]
  107. Owuor, S.O.; Butterbach-Bahl, K.; Guzha, A.C.; Rufino, M.C.; Pelster, D.E.; Díaz-Pinés, E.; Breuer, L. Groundwater recharge rates and surface runoff response to land use and land cover changes in semi-arid environments. Ecol. Process. 2016, 5, 1–21. [Google Scholar] [CrossRef] [Green Version]
  108. Beyreuther, M.; Barsch, R.; Krischer, L.; Megies, T.; Behr, Y.; Wassermann, J. ObsPy: A Python toolbox for seismology. Seismol. Res. Lett. 2010, 81, 530–533. [Google Scholar] [CrossRef] [Green Version]
  109. Wessel, P.; Smith, W.H.F.; Scharroo, R.; Luis, J.; Wobbe, F. Generic mapping tools: Improved version released. Trans. Am. Geophys. Union 2013, 94, 409–410. [Google Scholar] [CrossRef] [Green Version]
  110. Agius, M.R. Getting started with GMT: An introduction for seismologists. In Moment Tensor Solutions; D’Amico, S., Ed.; Springer: Cham, Switzerland, 2018; Available online: https://link.springer.com/chapter/10.1007/978-3-319-77359-9_31 (accessed on 2 July 2023).
Figure 1. Seismic stations across the Maltese islands. Red triangles are broadband seismic stations from the Malta Seismic Network. Orange triangles are short-period seismic stations from the FASTMIT temporary network. Bottom left inset map shows the location of the borehole and meteorological stations. Top right inset shows the location of Malta on a regional map.
Water 15 02523 g001
Figure 3. Example of the spectrum of ambient seismic noise recorded on broadband station MSDA. The recorded noise in the 0.1–10 s periods are typical of cultural noise and ocean microseisms. Longer periods are from seismic surface waves. The color bar represents the density of the PSD curves in percent. The two graphs show spectral differences between winter 22 December 2017 (left) and summer 22 June 2018 (right) days. Gray curves represent the global low and high noise models [97].
Water 15 02523 g003
Figure 4. Schematic showing the cross-correlation (represented by the five-pointed star) between 2 stations, XLND and FM04, located on the island of Gozo. A 30 min time window of seismic noise recorded at the two stations simultaneously is cross-correlated to produce a Green’s function (CCF) sensitive to the area between the stations (red shade). Similar CCFs are calculated every 15 min and stacked to produce 96 CCFs (overlaid grey curves). The black curve is the stacked CCF representative for a single day.
Water 15 02523 g004
Figure 5. Reference correlograms (CCFs) for different interstation distances (km) against time lag (s). The red, green, and blue lines indicate the velocity of ballistic waves. The correlation functions at an interstation distance of 0 km are from the auto-correlations. The symmetry of the plots indicates that noise recorded by the stations is isotropic.
Water 15 02523 g005
Figure 6. Changes in seismic velocity (δv/v) for station pair XLND-FM04 and water level data. The red and green curves represent a 30-day rolling average of the δv/v (%) and of the water level (m above MSL) from a nearby borehole, respectively. Each red scatter point represents a one-day measure for the δv/v, and each green scatter point is from a 30 min measurement for the water level data. The blue bars are precipitation measurements from a nearby meteorological station. The light blue shading in the background indicates the winter months (21 September–21 March).
Water 15 02523 g006
Figure 7. Selected examples showing changes in seismic velocity (δv/v) from the cross-correlation. See Figure 6 for plot details.
Water 15 02523 g007
Figure 8. Selected examples showing changes in seismic velocity (δv/v) from auto-correlation. See Figure 6 for plot details.
Water 15 02523 g008
Figure 9. Changes in seismic velocity at station WDD since 1995. See Figure 6 for plot details.
Water 15 02523 g009
Figure 10. Examples of timing issues noticed in the daily CCF. Plots show the daily CCFs for interstation pairs MSDA-XLND (left) XLND-WDD (right). Red bands highlight areas of shifted peaks in CCF due to timing errors. Gaps in the daily CCFs are because of a lack of data availability.
Water 15 02523 g010
Figure 11. Meteorological considerations. Graphs show the seismic velocity changes δv/v from the auto-correlation of station WDD (red scatter) compared to precipitation (vertical blue bars), air temperature, and atmospheric pressure recorded hourly at a nearby meteorological station located at the international airport (Luqa).
Water 15 02523 g011
Disclaimer/Publisher’s Note: The statements, opinions and data contained in all publications are solely those of the individual author(s) and contributor(s) and not of MDPI and/or the editor(s). MDPI and/or the editor(s) disclaim responsibility for any injury to people or property resulting from any ideas, methods, instructions or products referred to in the content.