Abstract
The combination of several factors related both to human pressure as well as natural issues could lead to a marked alteration of the groundwater budget terms and a decrease in groundwater availability. The basal aquifer of the Sibillini Mts. is a strategic resource of drinking water in the central sector of Apennine (Italy). The seismic sequence that occurred in this area in 2016 induced transient and sustained modifications in the aquifer settings. Springs located on the western side of the Sibillini Mts. were characterized by an increased discharge, while in contrast, the eastern springs suffered an intense drop in their groundwater discharge. In 2017, a drought period started immediately after the exhaustion of the seismic sequence effect. The comparison between the recharge and discharge of the major springs in the 2000–2020 period allowed the definition of the different responses of the aquifer to the co-occurrence of earthquakes and climatic events. The hydrodynamic alteration triggered by the earthquake induced a huge depletion of the groundwater stored in the eastern sector of the basal aquifer (at least 50 × 106 m3). The scarce recharge occurring in the following drought period (more than 30% of the average annual value) was not enough to restore the groundwater resources, causing a serious drinking water supply crisis in the main tapped springs in the eastern sector of the aquifer.
1. Introduction
The availability and safeguarding of groundwater resources have always been precious assets for humanity. This issue has gained even more attention in the last decades from the local scale up to a worldwide level in light of climate changes [].
Applied research investigating all aspects of aquifer yields (e.g., safety, sustainability) [,,,] is developing innovative models and criteria for necessary groundwater management based on hydrogeological balance calculations, in which the relationships between groundwater inflow and outflow and aquifer content are analyzed [,,,]. Despite several approaches to groundwater budget calculation, it is commonly accepted that the groundwater yield (in its general meaning) primarily depends on the recharge [,].
In the case of prolonged periods characterized by a higher groundwater discharge than recharge, the groundwater stored in the aquifers is progressively consumed. In addition, if this condition is triggered by excessive anthropic withdrawals, the aquifer may reach the point of overexploitation of the non-renewable groundwater reserves [,,]. Examples of aquifer overexploitation induced by withdrawals are known in the literature both at local and global scales [,,,,].
Several studies focus on the effects of diminished aquifer recharging induced by climate change on groundwater resource availability [,,,,], highlighting how the current climate trends are seriously threatening groundwater supplies. Specifically, in some studies of carbonate aquifers of Central Italy, the comparation between the time-trend of the local Standardized Precipitation Index (SPI) with the long-term spring hydrograph was used to quantify the impact of dry periods on groundwater resources [,,].
In addition, few works report aquifer imbalances induced by seismic effects. The magnitude and duration of the effects may depend on the aquifer sensitivity to earthquakes []. This statement is defined by the study of the seismically induced variations in the hydraulic parameters of the aquifer (recession coefficient, transmissivity, and storage coefficient) [] and specific analysis of the groundwater level and seismogram to determine the storage coefficient [].
A fair amount of research concerns the seismic reactions of carbonate fractured aquifers, focusing on the physical modifications of the system. The increase in pore pressure, the dynamic strain modifications, and the unlocking and dilation of preexisting fractures may induce a general increase in bulk hydraulic conductivity at the aquifer scale. This also produces changes in the hydraulic heads, with consequent increases in groundwater outflow rates. During persistent altered hydrodynamic conditions, the groundwater discharge is higher than pre-seismic discharge [,,,,,]. In many cases, the surplus of groundwater outflowed for years after the seismic event, altering the groundwater budget [,,].
This alteration may be assumed to be similar to the overexploitation of aquifers because in both cases the groundwater discharge does not depend on the natural recharge. In addition, the co-occurrence of a post-seismic event and a drought period may induce reductions in the groundwater reserves. This issue may be extremely relevant if the aquifer represents a strategic drinking water supply.
The Sibillini carbonate massif, located in Central Italy, hosts two main fractured aquifers. In 2016, a seismic sequence with events of intensity greater than 5.5 Mw affected the whole hydrogeological system but only the larger and deeper basal aquifer (BA) suffered sustained effects [,].
During the two following years, about 350 × 106 m3 of groundwater flowed out. This value corresponds to a 70% increase in pre-seismic discharge []. After five years, the BA still suffers from the sustained effects of the seismic sequence and, in addition, the co-occurrence of drought periods.
The aim of this study is the elaboration of long-term analysis and quantification of the combined effects induced by seismic events and climate variability on the groundwater availability of the BA. At present, some springs tapped for drinking purposes are still characterized by negative discharge trends, undermining the regional drinking water supply system. By a comparative analysis of groundwater responses to the drought periods occurring before and after the 2016 seismic events, we contribute to quantifying the hydrogeological alteration triggered by the earthquake. The potential applications of the study results might provide a scientific base for future decision-making procedures in the resolution of the current crisis of groundwater supply in the study area.
2. Study Area
2.1. Hydrogeological Setting of Sibillini Mts.
The Sibillini Mts. are part of the Central Apennines (Italy), an E-verging arcuate fold-and-thrust belt formed in the middle-late Miocene. They were later dissected by SW-NE extensional tectonics since the early Pleistocene and are still considered active with moderate seismicity []. The stratigraphy is composed of a Meso-Cenozoic calcareous multilayer sequence (Umbria–Marche sedimentary succession) that is more than 2 km thick [].
The fracturing of the limestone units permits two main aquifers to be recharged: the basal and Scaglia aquifers [,,,,]. The mean discharge of the Sibillini Mts. aquifers is approximately 23 m3/s, mainly in gaining streams in the Nera River basin (18.2 m3/s) and along the eastern side of the carbonate massif (4.6 m3/s) []. The aquifers system is hydraulically limited by two thrust faults: the Valnerina Thrust (VNT) [] in the west and the Sibillini Mts. Thrust (SMT) [] in the east (Figure 1).
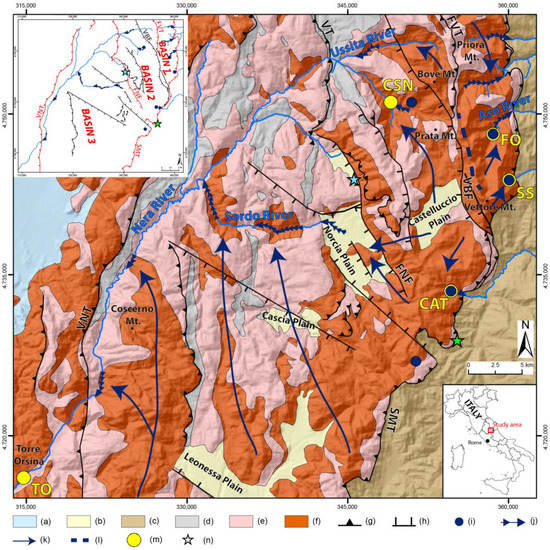
Figure 1.
Hydrogeological framework of the studied area (Adapted with permission from Ref. []). Legend: (a) alluvial aquifers; (b) intermontane porous aquifer; (c) low-permeability turbidic deposits; (d) Scaglia Cinerea aquitard; (e) Scaglia aquifer; (f) basal aquifer; (g) main fault thrust; (h) main normal faults; (i) main springs fed by the basal aquifer; (j) main gaining streams fed by the basal aquifer; (k) main groundwater flow direction within the basal aquifer; (l) groundwater divide; (m) monitoring stations; and (n) earthquake epicenters (green: 24 October 2016 event; cyan: 30 October 2016 event). Acronyms: CAT: tapped Capodacqua del Tronto spring; CSN: Nera River at Castelsantangelo gauging station; FO: tapped Foce spring; SS: tapped Sassospaccato spring; TO: Nera River at Torre Orsina gauging station. Tectonic elements’ acronyms: FNF: Fema Mt.–Norcia Fault; FVT: Fiegni–Vettore Thrust; SMT: Sibillini Mts. Thrust; VBF: Vettore Mt.–Bove Mt. Fault; VNT: Valnerina Thrust; VT: Visso Thrust.
The BA consists of fractured and karst lithotypes (Calcare Massiccio, Corniola, and Maiolica formations, early Jurassic–early Cretaceous). It feeds approximately 70% of the total discharge. The main recharge area is the southern sector of the Sibillini Mts. where the aquifer units are exposed. The Triassic evaporites underlie the aquifer and act as a regional aquiclude. The eastern sector of the BA feeds the springs at the eastern foot of the Sibillini Mts. ridge at altitudes above 900 m a.s.l. with a discharge of approximately 2 m3/s. The western sector of the BA mainly drains towards the springs of the Nera River basin at elevations between 760 and 250 m a.s.l. with a total discharge of approximately 14 m3/s. Minor groundwater flow (approximately 0.6 m3/s) drains southward, feeding the Capodacqua del Tronto spring group (site CAT in Figure 1) [,].
The preferential groundwater flow directions in the BA are NNW–SSE and N– S; the flow is parallel to the regional compressive faults that usually hinder transversal groundwater exchanges []. This general hydrostructural setting is affected by the presence of normal faults that alter the sealing role of the thrusts, which permits minor groundwater seepages [,,]. The BA, therefore, results in a partially compartmentalized aquifer (a basin in series system) where each basin has a high hydraulic interdependence [].
The three main basins in the series were defined in the Sibillini Mts. (Figure 1) hydrogeological system. The boundary between basins 1 and 2 is composed of three segments (from north to south): the no-flow boundary corresponding to the Fiegni–Vettore Mt. Thrust (FVT) (I), a small portion corresponding to a piezometric divide in the northern sector of Vettore Mt. (II), and the groundwater divide caused by the bedrock reaching a higher elevation than the water table (III) [,]. The hydraulic connection between basins 2 and 3 occurs through the Fema Mt.–Norcia Fault (FNF), and it plays a limited role as a hydraulic barrier in the Norcia plain [].
The average annual infiltration rate of the BA ranges between 500 and 1100 mm/year [,,,], which corresponds to 75% of the local effective rainfall [].
2.2. Effects of the 2016–2017 Seismic Sequence on the Sibillini Mts. Groundwater Flow
A seismic sequence affected the Sibillini Mts. during 2016–2017. The mainshocks that occurred on 24 August (Mw = 6.0) and 30 October 2016 (Mw = 6.5) (Figure 1) were caused by the rupture of the different segments of the Vettore Mt.–Bove Mt. Fault system (VBF) []. The activation of this fault system induced sustained hydrodynamic responses in the BA, with a sustained increase in groundwater discharge on the western springs and a prolonged decrease in the discharge of some eastern springs [,,]. Many factors might have contributed to this alteration, such as the increase in the hydraulic conductivity induced by the fracture cleaning, the increase in permeability due to seismic rupturing along normal faults, and the aquifer distance from the activated faults [,,,]. The effects of the seismic sequence enhanced the E–W hydraulic continuity, which produced a surplus of groundwater outflow from the BA in the western sector of about 350 × 106 m3 and a groundwater outflow deficit in the eastern sector of 50 × 106 m3 during the 2016–2020 period. Figure 2 shows the hydrodynamic alteration induced by the earthquake in the BA that is extensively explained in the literature [,].
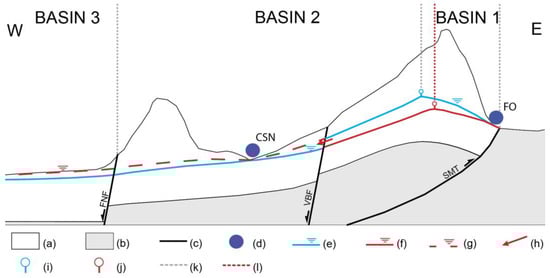
Figure 2.
Not to scale schematic sketch of the hydrodynamic alteration induced by the earthquake in the BA (Adapted with permission from Ref. []). Legend: (a) basal aquifer; (b) bedrock; (c) main faults; (d) springs; (e) water table at the time of the earthquake; (f) water table due to the long-lasting effects of the earthquake; (g) water table after the earthquake’s transient effects; (h) new cross flow between nearby basins in series due earthquake effects; (i) position of the groundwater divide before the earthquake; (j) position of groundwater divide after the earthquake; (k) position of the basins in series boundaries before the earthquake; (l) position of the basins in series boundaries due to the earthquake effects.
3. Materials and Methods
3.1. The monitoring Sites and Collected Data
The five sites (Table 1; the locations are in Figure 1) that are used to monitor the groundwater discharge were chosen to investigate the responses of the different BA sectors to the groundwater consumption induced by the earthquake and climate. The sites correspond to two gauging stations along the Nera River managed by the Umbria Hydrographic Service on the western side of the BA and three springs on the eastern side that are exploited for drinking purposes by Cicli Integrati Impianti Primari S.p.A. All the monitoring stations were equipped with water level probes to acquire daily data. The water levels were converted into discharge data according to each specific flow rate curve. Seasonal control discharge measurements were performed at the CSN, FO, SS, and CAT sites by using an OTT Nautilus C2000 current meter.

Table 1.
Features of the measurement sites of groundwater discharge. TO: Nera River at Torre Orsina gauging station; CSN: Nera River at Castelsantangelo gauging station; FO: tapped Foce spring; SS: tapped Sassospaccato spring; CAT: tapped Capodacqua del Tronto spring. Extension of the recharge areas of the monitored springs (site) and the whole group (total) to which each monitored spring belongs is reported.
The Torre Orsina (TO) station is located along the Nera River at the exit of the Sibillini Mts. system. Here, the baseflow (about 20 m3/s before the seismic event) accounts for more than 90% of the total discharge, with a negligible contribution from the runoff []. At least 78% of the baseflow is fed by the BA [], and it has a recharge area of 1292 km2. The TO site can, therefore, be considered a strong control point that can be used to monitor the outflow of the western side of the BA.
The Castelsantangelo (CSN) station monitors the baseflow fed by the BA springs located in the upper Nera River basin. The recharge area has a size of 99 km2 and also feeds the groundwater transfer toward basin 3 through the FNF fault. Before the 2016 earthquake, the mean discharge was 2.3 m3/s subdivided between the baseflow discharge at the CSN (1.3 m3/s) and the lateral transfer westwards of the Norcia plain (1 m3/s) []. This lateral contribution is monitored in the Sordo River (Figure S1) at the exit of the Norcia plain (Figure 1). The discharge components were accounted for together in the groundwater budget evaluation because the recharge area is the same.
The Capodacqua del Tronto (CAT) site refers to a drainage tunnel with an average discharge of 0.385 m3/s (65% of the total discharge of the spring group). The recharge area of the whole spring system is approximately 32 km2 [], of which 21 km2 feeds the tapped spring. It is geographically located in the eastern side of the Sibillini Mts. but its recharge area is in basin 2, which is west of the groundwater divide near Vettore Mt. (Figure 1 and Figure 3).
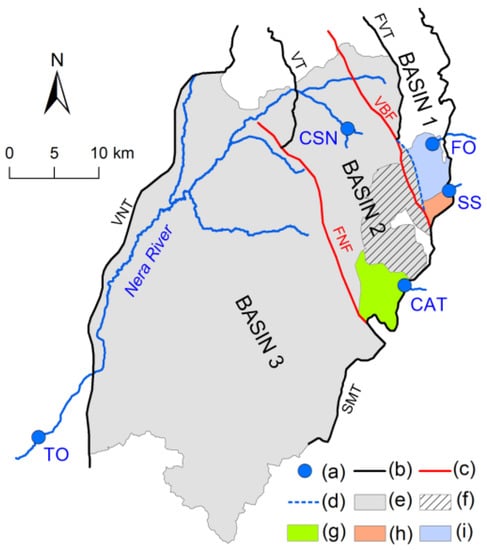
Figure 3.
Basins in series and recharge areas of the spring groups to which the monitored sites belong. (a) Monitoring sites; (b) thrusts; (c) normal faults; (d) groundwater divide; (e) TO recharge area; (f) CSN recharge area; (g) CAT recharge area; (h) SS recharge area; (i) FO recharge area.
The springs, including the Sassospaccato (SS) site, have the highest outflow from basin 1 (1300 m a.s.l.). The recharge area of the springs group is approximately 7 km2 and it is located between the SMT and the segment of the groundwater divide that corresponds to the bedrock uplift. The total discharge is about 0.125 m3/s, 0.035 m3/s of which is tapped at the SS site (which has an estimated recharge area of 2.1 km2) [,].
The Foce spring (FO) site is the main drinking water supply for those on the eastern slope of the Sibillini Mts., and it is included in a spring group with a total discharge of 1.15 m3/s. Before the 2016 earthquake, 0.55 m3/s of groundwater was steadily tapped by a drainage tunnel, and 0.6 m3/s of groundwater supported the discharge of the Aso River []. After the seismic events, the Aso River became dry, and the drainage tunnel tapped less than 0.2 m3/s [,]. The actual recharge area of the whole spring group in the eastern side of basin 1 has still not been defined. The extension should range between 30 and 50 km2 [] but it probably decreased after the 2016 earthquake due to the eastward shift of the groundwater divide []. The recharge area of the tapped spring monitored at the FO site is estimated to be at least 20 km2 [].
In the CAT, SS, and FO sites, the discharge monitoring data were collected inside the drainage tunnels and did not correspond to the total discharge of each spring group. The FO dataset includes only discharge values that are less than or equal to the maximum capacity of the drainage tunnel. The SS dataset was created in 2014 and includes only 6 years of data, only three of which were before the earthquake, which are too few to be representative of the preseismic period.
Daily climate data (the rainfall, air temperature, and snow thickness) were acquired from 61 weather stations by the Umbria, Marche, and Lazio Regional Hydrographic Services for the years 2000–2020 [,,]. A total of 20 daily rainfall datasets from 1951 to 2020 were collected to calculate the Standard Precipitation Index (SPI). The data were aggregated on a monthly scale, and any data gap was filled according to the correlation between the contemporaneous data from the nearby stations. The snow thickness data, acquired from three snow gauge stations, were converted into water-equivalent values [] and summed to obtain the rainfall data collected by the pluviometers.
The location, details of the weather stations, and yearly rainfall data collected between 2010 and 2020 are reported in the Supplementary Materials (Figure S2 and Table S1).
3.2. Elaboration Methods
The SPI was calculated, and we chose a 12-month scale (SPI12) because it is more related to groundwater time dynamics [,]. A total of two mean SPI12 were calculated for the eastern and western sides of the area according to the location of the surface water divide.
The SPI is the number of standard deviations that the observed value deviated from the long-term mean by for a normally distributed random variable. A drought event occurs when the SPI is continuously negative and reaches an intensity of at least −1. The duration of the drought period comprises two SPIs that are equal to 0 [].
The aquifer recharge was calculated by using the monthly rainfall and mean monthly temperature in the 2000–2020 period. The actual evapotranspiration was estimated by using the Thornthwaite–Mather method []. The monthly water surplus values were calculated by using the data from each meteorological station as the difference between the rainfall and actual evapotranspiration. The water surplus data were spatialized by using the ArcGIS Geostatistical Analyst, and the result of the spatialization was clipped according to the extension of the recharge area at each monitoring point. The effective infiltration over the BA that consisted of fractured limestone was estimated as 75% of the water surplus []. The monthly variability of the effective infiltration permitted us to define the recharge periods and quantify the total recharge of each hydrological year.
The groundwater discharge was calculated by considering the baseflow measured at the CSN and TO hydrographic stations. The baseflow was roughly separated from the data by using the Straight-Line Method [], whereby we drew a straight line from the beginning to the end of the surface runoff occurrence on the hydrograph. The approximation of this approach was suitable due to the regional scale of this study.
3.3. Components of Groundwater Stored in the Aquifer: Reference Model
The components of the groundwater in an aquifer with a geometry such as the one that was studied are described in the following section (Figure 4) [,,,].
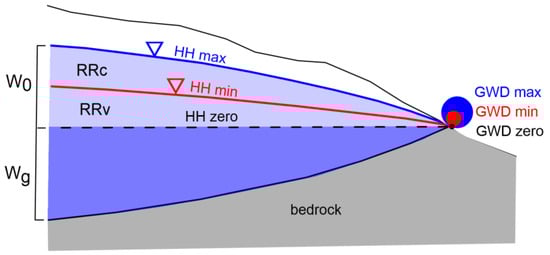
Figure 4.
Reference model of the groundwater components stored in the aquifer. HH: hydraulic head; GWD: groundwater discharge; W0: dynamic reserve; Wg geological reserve; RRc: renewable resource; RRv: renewable reserve (Adapted with permission from Ref. []).
The geological reserve (Wg) corresponds to the amount of groundwater that is stored in the aquifer below the spring elevation, and the groundwater may remain stored even if the spring becomes dry. In a tapped aquifer, the Wg can be extracted by pumping but the prolonged consumption may trigger the overexploitation condition.
The dynamic reserve (W0) corresponds to the annual amount of groundwater that can naturally discharge from a spring during the recession period. The discharge rate may vary during the year according to the hydraulic gradient and may reach the no-flow condition (i.e., the groundwater discharge is zero, as shown in Figure 3) when the water table drops to the spring elevation.
If the natural groundwater discharge is perennial, W0 can be conceptualized as the sum of the renewable resource (RRc) and the renewable reserve (RRv) (Figure 4). The RRc is the amount of groundwater that is present between the maximum and minimum values of the hydraulic head during the hydrological year. The RRv is the amount of groundwater that is present between the average minimum hydraulic head and the elevation of the spring.
The RRv supports the spring discharge during drought periods, and it is restored during the recharge period of the wet years.
To investigate how the groundwater is stored in the different BA sectors, the hydrographs of the recession periods were examined by using the Maillet equation [], which allows the depletion coefficient (α) and amount of W0 to be calculated.
Regarding the yearly data, W0 is defined as the amount of groundwater stored in the aquifer at the beginning of the recession period, and ΔW is the amount of groundwater discharge that outflows until the end of the recession period.
These values were defined according to the Maillet equation, and the hydrograph was measured at each monitoring site. The difference between W0–ΔW corresponds to Wr, which is the RRv left in the aquifer at the beginning of the next recharge period.
The estimation of what the hydrographs would look like if the aquifer had not been affected by seismic activities was realized by using the α values calculated during the preseismic period. The seismic-induced groundwater discharge surplus was evaluated by comparing the actual and calculated hydrographs.
In the studied cases, the amount of ΔW in each postseismic year included the ΔW that outflowed during the recession and the amount of the groundwater surplus that outflowed during the following recharge period. This is because the groundwater surplus that is outflowing during the recharge period consumes the W0 stored in the aquifer at the beginning of the previous recession period every year.
4. Results
4.1. Climate Analysis
The results of the SPI12 allowed us to identify the drought periods since the 1950s (Figure S3). A detailed focus on the 2000–2020 period is reported in Figure 5. In this period, four droughts (SPI < −1) were recognized, three of which reached extremely dry conditions with an SPI < −2 (October 2001–December 2002; November 2006–December 2008; September 2011–December 2012; March 2017–February 2018).
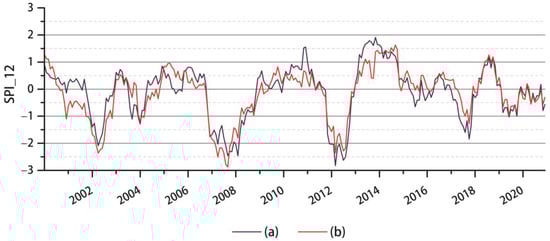
Figure 5.
Details of the 2000–2020 SPI_12 trend, calculated by using data from the 1951–2020 period and differentiating the western (a) and eastern (b) sides.
The 2017 drought period started immediately after the exhaustion of the 2016 seismic sequence, and it seemed to be shorter than the other droughts that have occurred since 2000. The intensity of the drought seemed to be less severe in the eastern sector than in the western one.
4.2. Groundwater Budget Estimation
The average values of the yearly recharge and discharge were calculated for the pre- and post-seismic periods (Figure 6). In all sites, the mean effective infiltration (recharge) was higher during the pre-seismic period than the post-seismic one. Moreover, during the post-seismic period, the annual effective infiltration was always below the mean, except for the years 2017–2018. The yearly variability in the recharge aligned with the SPI12 trend.
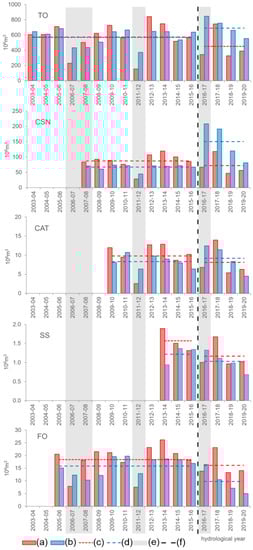
Figure 6.
Comparison between effective infiltration and groundwater discharge for each hydrological year of the studied period and average yearly groundwater budget before and after the seismic event. (a) Effective infiltration; (b) groundwater discharge; (c) average recharge; (d) average groundwater discharge; (e) dry periods; (f) seismic event. TO: Nera River at Torre Orsina gauging station; CSN: Nera River at Castesantangelo gauging station; FO: tapped Foce spring; SS: tapped Sassospaccato spring; CAT: tapped Capodacqua del Tronto spring.
On the contrary, the mean pre-seismic discharge was higher than the post-seismic one, except at the FO and SS sites, where the average groundwater discharge consistently fell. The annual groundwater discharge values during the post-seismic period were abnormally high, especially during the 2016–2017 drought period as the result of the more intense effect of the earthquake rather than the climate issues.
A rough average annual groundwater budget was calculated for each measurement point during the pre- and post-seismic periods (Table 2). During the pre-seismic period, the difference (Δ) between the effective infiltration and groundwater discharge was always <17% of the effective infiltration, except for the SS (Δ = 25% of effective infiltration), which was probably due to the limited monitoring period. This inconsistency may have been caused by the uncertainties in the recharge area definition and instrumental issues, especially for the monitoring systems that were installed in the drainage tunnels. The postseismic groundwater budgets highlight the unbalanced conditions that may refer to different factors. The TO, CSN, and CAT sites showed a negative Δ corresponding to 56% (TO), 11% (CAT), and 117% (CSN) of the effective infiltration. This means that the groundwater discharge was higher than the aquifer recharge.
Table 2.
Average annual groundwater budget differentiated between pre- and post-seismic events. EI: effective infiltration; GWD: groundwater discharge; Δ: difference in budget (EI minus GWD); TO: Nera River at Torre Orsina gauging station; CSN: Nera River at Castelsantangelo gauging station; FO: tapped Foce spring; SS: tapped Sassospaccato spring; CAT: tapped Capodacqua del Tronto spring.
On the contrary, the SS and FO sites presented a positive Δ equal to 17% and 38% of the effective infiltration, respectively, which indicated less groundwater outflow than recharge. The Δ in the FO site was also much higher in the post-seismic period than the pre-seismic one, as the changes in the local hydrogeological settings rather than monitoring uncertainties.
The results of the comparison between the inflow and outflow in each hydrological year (Figure 6) identified the critical years when the outflow amount was considerably higher than the inflow amount. This finding highlights the probable consumption of the renewable reserve (RRv) that may be replenished by the recharge that occurs during the following wet years.
In the pre-seismic period, the groundwater outflow exceeded the recharge in all sites during the drought years (2006–2007 and 2011–2012), with imbalances ranging between 36% of the effective infiltration (FO, 2006–2007) and 60% (CAT, 2011–2012).
During the post-seismic period, except in 2017–2018, the western side of the BA presented an excess of groundwater discharge. On the contrary, the amount of effective infiltration in the eastern springs has been higher than the groundwater outflow since 2017–2018. The discrepant responses in the western and eastern sides of the BA under similar climate conditions suggest the persistence of the seismic-induced effects.
4.3. Hydrograph Analysis
Daily hydrographs of the five sites are shown in Figure 7. The average values of the baseflow in the river hydrographs (TO and CSN) correspond to 91% of the total discharge during the pre-seismic period, according to the literature []. This percentage slightly increased (94%) during the post-seismic period (Table 3).
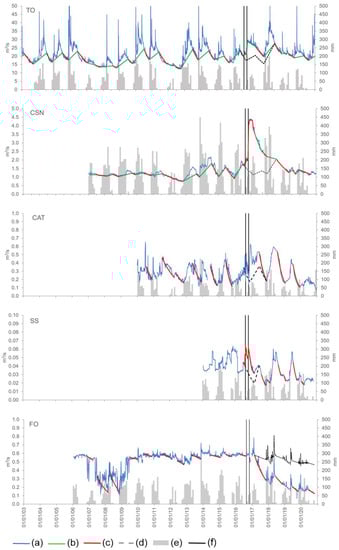
Figure 7.
Daily hydrograph of the considered sites and time distribution of monthly effective infiltration. (a) Daily hydrograph; (b) rising limb (only for river hydrographs); (c) recession limb; (d) reconstruction of the undisturbed hydrographs in the absence of the earthquake; (e) monthly effective infiltration; (f) seismic events. TO: Nera River at Torre Orsina gauging station; CSN: Nera River at Castelsantangelo gauging station; FO: tapped Foce spring; SS: tapped Sassospaccato spring; CAT: tapped Capodacqua del Tronto spring.
Table 3.
Average values of river discharge and related baseflow for the pre- and post-seismic period. TO: Nera River at Torre Orsina gauging station; CSN: Nera River at Castelsantangelo gauging station.
Using the α values that were calculated with Maillet’s equation, the amount of groundwater that was stored (W0) and outflowed (ΔW) after the seismic effects occurred was estimated for each recession period and compared with the groundwater discharge amount that was unaffected by the earthquake to calculate the amount of the outflow surplus or deficit in each site (Table 4).
Table 4.
Groundwater reserve amount stored in the BA and outflowed during the recession periods affected by seismic consequences. The n.d.: not determined; W0: amount of groundwater stored in the aquifer at the beginning of the recession period; ΔW: amount of groundwater discharge that outflowed until the end of the recession period; A: actual recession; B: assumed recession; C: surplus or deficit during recession; D: surplus or deficit during the next recharge period; E: total surplus or deficit; Wr: difference between W0–ΔW, which is amount of groundwater left in the aquifer at the beginning of the next recharge period; TO: Nera River at Torre Orsina gauging station; CSN: Nera River at Castelsantangelo gauging station; FO: tapped Foce spring; SS: tapped Sassospaccato spring; CAT: tapped Capodacqua del Tronto spring.
After the earthquake, the excess groundwater discharge in the western side was at least 364 × 106 m3. In the eastern side, a surplus of 0.4 × 10⁶ m3 existed in the SS site, whereas the FO site was characterized by a groundwater deficit of 27 × 106 m3. The seismic-induced groundwater discharge variations disappeared in two years except in the SS site, where the seismic effects lasted only one year. On the contrary, in the FO site, the deficit remained until 2020. The negative values of the Wr amount highlight the exhaustion of the W0 and the partial consumption of the Wg. This critical condition occurred in the CSN and CAT sites during the recession period immediately after the seismic events, when about 12 × 106 m3 of the Wg was consumed due to the earthquake effect.
5. Discussion
The annual average values of the groundwater discharge and the effective infiltration of the pre- and post-seismic periods were normalized and compared.
The data collected during the pre-seismic period did not show a trend, and a high dispersion existed around the 1:1 line (Figure 8A). This means that even if the effective infiltration and groundwater outflows were the main terms of aquifer recharge and discharge, respectively, they cannot be expressed by a unique mathematical equation, so analyzing this relation every year is necessary. The geological and structural nature of the studied aquifer facilitates the storage of a high amount of the RRv that supports the annual groundwater regime more than the recharge processes.
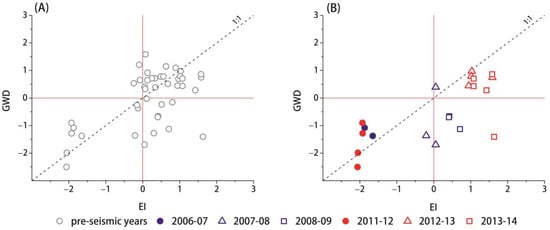
Figure 8.
Groundwater discharge (GWD) versus effective infiltration (EI) of monitoring points for all years of the pre-seismic period (A) and for SPI12 dry years (2006–2007 and 2011–2012) and their following ones (B). The plotted values were normalized.
The points located above the 1:1 line (Figure 8) indicate the situations where the RRv supports the discharge because the previous annual recharge level was not high enough to justify the discharge. On the contrary, the points falling below the 1:1 line (recharge > discharge) indicate the RRv restoration conditions.
Most of the points corresponding to the preseismic SPI12 dry periods (2006–2007 and 2011–2012) fell above the 1:1 line (Figure 8B), which suggests that the groundwater discharge was supported by the RRv stored in the aquifer. In the following years, the points were located below the 1:1 line. This means that most of the effective infiltration restored the RRv that was employed in the previous dry years. The residual effective infiltration fed the discharge, which, thus, means that the discharge occurred less than expected. During the observed period, at least two years were necessary to restore the RRv consumed during the dry periods.
In the post-seismic period (Figure 9), the groundwater surplus triggered by the earthquake outflows consumed the RRv. The huge amount of the surplus hid the effects of the 2016–2017 dry conditions and altered the impacts of the recharge in the following years.
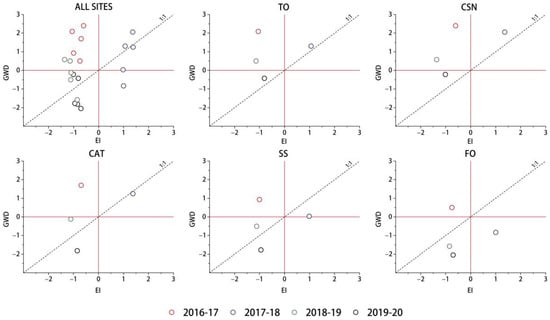
Figure 9.
Groundwater discharge (GWD) versus effective infiltration (EI) under post-seismic conditions at all monitoring points and at each monitoring site. The plotted values were normalized. TO: Nera River at Torre Orsina gauging station; CSN: Nera River at Castelsantangelo gauging station; FO: tapped Foce spring; SS: tapped Sassospaccato spring; CAT: tapped Capodacqua del Tronto spring.
Despite the drought year, the results of the analysis of the data from 2016 to 2017 showed that the points were abnormally above the 1:1 line at all the sites; specifically, they fell in the first quadrant of the graph, which represents a serious imbalance between the shortage of the effective infiltration and the discharge surplus. The sites located in basin 2 (CSN, and CAT) were, therefore, mainly affected by the seismic effects rather than climatic ones, which were reflected in the higher W0 consumption than expected in the dry year. Critical W0 consumption occurred in the CSN and CAT sites, and they were fed by the aquifer sectors that were located closer to the seismogenetic fault BVF (Figure 1). Here, the Wg consumption was about 10 × 106 m3 at the CSN and 2 × 10⁶ m3 at the CAT (Table 4). Similar conditions never existed during the observation periods, even in the driest years. The W0 depletion recorded at the TO site was less intense due to the large extension of the western BA (Figure 3). The position of the SS and FO points was lower and closer to the 1:1 line, which refers to an apparent lower W0 consumption.
In agreement with the placement of the points that were obtained by using data from the pre-seismic period, we expected that the points obtained during 2017–2018, as shown in Figure 9, would be placed in the third quadrant, which corresponds to the RRv restoration. This condition occurred only at the SS and FO sites, which were both located east of the groundwater divide. In the wet 2017–2018 year, the recharge should have restored the W0 consumption that was induced by the co-occurrence of the seismic and drought events in the previous year. On the contrary, the points from the western side of the BA (TO, CSN, and CAT) fell in the second quadrant and were above or very close to the 1:1 ratio line, as if the RRv consumption never happened. This result led us to hypothesize the additional contribution of groundwater, which would integrate the RRv consumption in the western side of the BA.
In 2018–2019, an imbalance between the effective infiltration shortage and the discharge surplus was highlighted with the TO and CSN points, and these points fell in the first quadrant. The persistence of these anomalous conditions suggests that in the western BA, the RRv consumption did not seem to occur, despite the high amount of groundwater that outflowed. On the contrary, the position of the CAT and SS points in the fourth quadrant suggests that the recharge–discharge balance was reached. The position of the FO point below the 1:1 line suggests that in 2017–2018, the effective infiltration was not enough to restore the RRv of the FO aquifer.
In 2019–2020, all the points fell in the fourth quadrant due to the effective infiltration and groundwater discharge shortage. In the western BA, the RRv, which seemed to not be depleted by seismic effects, continued to support the baseflow of the TO and CSN, and the points remained above the 1:1 line. On the contrary, the CAT, SS, and FO points showed a lack of RRv support and were below the 1:1 line.
According to the results of this analysis, the groundwater discharge in the western sector of the BA was also supported by the lateral contribution from the RRv of the eastern BA that was induced by the earthquake, as supposed by the literature [,,]. This would mean that mostly the RRv of the eastern BA was consumed and maybe exhausted, which explains the persistent decrease in the eastern spring discharge.
In the SS site, the 2017–2018 wet year resulted in the original discharge being recovered, even though the discharge values were slightly below the average, and this occurrence was compatible with the actual climate condition. On the contrary, the effective infiltration that occurred during the 2017–2018 wet year and the two years that were not too dry that followed could not properly recharge the W0 of the FO springs, mostly because its RRv was involved in the E-W groundwater transfer induced by the seismic sequences.
The different nature of the groundwater divide, which separates basins 1 and 2, could be one of the causes of the different trends in the discharge of the SS and FO springs, which are both located east of the groundwater divide. The SS hydrogeological basin is partitioned from the whole BA because the uplift of the bedrock in this area reaches a higher elevation than the water table (Figure 10A). This local hydrogeological setting could have dampened the seismic-induced hydrodynamic effects, which limited any E-W groundwater transfer. Differently, the FO reservoir is separated from the western side of the BA by a dynamic piezometric divide (Figure 10B) that was shifted eastward after the earthquake []. Thus, the groundwater transfer almost exclusively involved the RRv of the FO reservoir, which explains the different time trends with the SS and FO spring discharge.
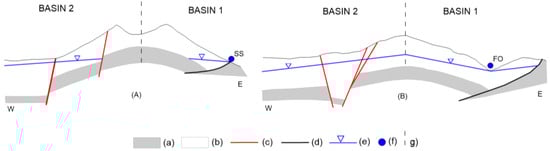
Figure 10.
Different nature of the groundwater divides in SS site (A) and in FO site (B). Not to scale schematic representation. (a) Bedrock; (b) aquifer; (c) normal faults; (d) thrust faults; (e) hydraulic head; (f) spring; (g) groundwater divide.
6. Conclusions
The co-occurrence of the hydrodynamic alteration triggered by the 2016 earthquake and the 2016–2017 drought period resulted in a crisis with the drinking water supply in the Sibillini Mts. area.
The different responses of the monitored springs to the drought periods before and after the earthquake highlight the impact of the hydrogeological seismic effects on the BA recharge. During the 2016–2017 dry period, which started immediately after the seismic event, the western springs did not suffer from a recharge shortage as they did during the previous drought periods (2006–2007 and 2011–2012). After the end of the 2016–2017 dry period, the eastern springs showed a more limited discharge recovery than what occurred during the pre-seismic period.
This anomalous condition was due to the earthquake, which caused a groundwater transfer from the eastern side of the BA toward the western side, and this caused an increase in the discharge of the western springs and induced a persistent decrease in the eastern spring’s outflow.
Considering the amount of the groundwater surplus that outflowed from the western side of the BA since 2016–2017 (364 × 106 m3), assuming that at least part of the Wg of the eastern side of the BA was consumed due to the groundwater transfer is reasonable. The eastern side of the BA reached a condition such as overexploitation immediately after the earthquake, and the following recharge shortage failed to restore the groundwater reserves at least until 2020.
A period of four years after the earthquake, the eastern aquifer resources were still recovering only in the sectors of the aquifer that were partly separated by a physical groundwater divide (e.g., the SS spring). Where a dynamic piezometric divide allowed for a hydraulic connection, the spring discharge failed to recover, such as for the FO spring, which is the main drinking water supply for the eastern slope of the Sibillini Mts.
Due to the geomorphological features of the Sibillini Mts., monitoring the total groundwater discharge of the eastern side of the BA at a unique point that is similar to the TO site in the western side is not possible. The lack of these data prevented us from assessing the overall groundwater reserve stored in the eastern side of the BA because we would need to evaluate the actual Wr amount left in this sector of the aquifer after the seismic effect occurred. For this reason, forecasting if and when the original condition of the FO spring will be restored is not actually possible. Therefore, continuous daily discharge monitoring is recommended not only at the tapped springs but as well in the entire spring’s groups in the eastern side of the BA to increase the data availability, which is useful to enhance scientific research and to forecast the restoration of the groundwater resources.
Our results highlight the relevance of conducting hydrogeological regional studies to characterize the spatiotemporal variability of the available groundwater resources that may be tapped. Without a complete and detailed hydrogeological framework, interpreting the different responses of the springs to the co-occurrence of the earthquake and dry conditions would not have been possible.
The future development of groundwater management plans for the eastern BA should consider the possibility that recovering the FO spring is not probable and that finding alternative groundwater sources is necessary. Additionally, in this case, knowledge of both the hydrogeological regional framework and its possible time trends could help optimize groundwater resource management, indicate where new drinking water sources must be searched, and replace drinking water sources after they become inadequate. For this study area, planning new ways to access groundwater resources in the western sector of the BA that, at present, is little exploited compared to its groundwater capacity is desirable.
Supplementary Materials
The following supporting information can be downloaded at: https://www.mdpi.com/article/10.3390/w15132355/s1, Figure S1: Discharge measurements in the Sordo River; Figure S2: Location map of meteorological stations used for recharge estimation. Details in Table S1; Figure S3: SPI_12 calculated for the 1951–2020 period and differentiated in Western and Eastern side. Table S1: Code, name, location, and type of active gauges of the meteorological stations used for SPI and recharge estimation and measured yearly rainfall. Legend: T: Temperature, R: Rainfall, S: Snow thickness, n.a.: data of the yearly rainfall missing or incomplete, “-” rainfall was not measured in the thermometric stations.
Author Contributions
L.M.: conceptualization, methodology, investigation, writing original draft, project administration, funding acquisition; S.V.: conceptualization, methodology, software, investigation, writing original draft; M.P. conceptualization, validation, supervision, project administration e funding acquisition. All authors have read and agreed to the published version of the manuscript.
Funding
This research was financed by: CIIP S.p.A. Cicli Integrati Impianti Primari. Funds for “Attività di supporto alla ricerca idrogeologica nell’ambito della realizzazione del progetto di interconnessione idrica “Anello Acquedottistico dei Sibillini”. Research agreement CIIP S.p.A.—Department of Sciences, University of Roma Tre—Department of Earth Sciences, Sapienza University of Rome.
Data Availability Statement
All processed data used in the study have been shown in the article. Raw data may be available on request from the corresponding author.
Acknowledgments
We acknowledge C.I.I.P. S.p.A. Servizio Idrico Integrato for providing discharge data of the tapped springs.
Conflicts of Interest
The authors declare no conflict of interest.
References
- Stigter, T.Y.; Miller, J.; Chen, J.; Re, V. Groundwater and Climate Change: Threats and Opportunities. Hydrogeol. J. 2023, 31, 7–10. [Google Scholar] [CrossRef]
- Alley, W.M.; Leake, S.A. The Journey from Safe Yield to Sustainability. Ground Water 2004, 42, 12–16. [Google Scholar] [CrossRef]
- Molle, F. Aquifer Safe Yield: Hard Science or Boundary Concept? In Proceedings of the Ground Water 2011 Conference, Orléans, France, 14–16 March 2011. [Google Scholar]
- Liu, G.; Wilson, B.B.; Bohling, G.C.; Whittemore, D.O.; Butler, J.J. Estimation of Specific Yield for Regional Groundwater Models: Pitfalls, Ramifications, and a Promising Path Forward. Water Resour. Res. 2022, 58, e2021WR030761. [Google Scholar] [CrossRef]
- Piscopo, V.; Sbarbati, C.; Lotti, F.; Lana, L.; Petitta, M. Sustainability Indicators of Groundwater Withdrawal in a Heavily Stressed System: The Case of the Acque Albule Basin (Rome, Italy). Sustainability 2022, 14, 15248. [Google Scholar] [CrossRef]
- Voudouris, K.S. Groundwater Balance and Safe Yield of the Coastal Aquifer System in NEastern Korinthia, Greece. Appl. Geogr. 2006, 26, 291–311. [Google Scholar] [CrossRef]
- Meyland, S.J. Examining Safe Yield and Sustainable Yield for Groundwater Supplies and Moving to Managed Yield as Water Resource Limits Become a Reality. In Proceedings of the Water Resources Management VI Conference, Milan, Italy, 23 May 2011; pp. 813–823. [Google Scholar]
- Gleeson, T.; Wada, Y.; Bierkens, M.F.P.; van Beek, L.P.H. Water Balance of Global Aquifers Revealed by Groundwater Footprint. Nature 2012, 488, 197–200. [Google Scholar] [CrossRef]
- Viaroli, S.; Mastrorillo, L.; Lotti, F.; Paolucci, V.; Mazza, R. The Groundwater Budget: A Tool for Preliminary Estimation of the Hydraulic Connection between Neighboring Aquifers. J. Hydrol. 2018, 556, 72–86. [Google Scholar] [CrossRef]
- Manghi, F.; Mortazavi, B.; Crother, C.; Hamdi, M.R. Estimating Regional Groundwater Recharge Using a Hydrological Budget Method. Water Resour. Manag. 2009, 23, 2475–2489. [Google Scholar] [CrossRef]
- Zhou, Y. A Critical Review of Groundwater Budget Myth, Safe Yield and Sustainability. J. Hydrol. 2009, 370, 207–213. [Google Scholar] [CrossRef]
- Huo, A.; Peng, J.; Chen, X.; Deng, L.; Wang, G.; Cheng, Y. Groundwater Storage and Depletion Trends in the Loess Areas of China. Environ. Earth Sci. 2016, 75, 1167. [Google Scholar] [CrossRef]
- Bierkens, M.F.P.; Wada, Y. Non-Renewable Groundwater Use and Groundwater Depletion: A Review. Environ. Res. Lett. 2019, 14, 063002. [Google Scholar] [CrossRef]
- Moiwo, J.P. Implications of Groundwater Depletion for Aquifer Geomatrix Deformation and Water Availability. Hydrology 2016, 4, 46. [Google Scholar] [CrossRef]
- Custodio, E. Aquifer Overexploitation: What Does It Mean? Hydrogeol. J 2002, 10, 254–277. [Google Scholar] [CrossRef]
- Voss, K.A.; Famiglietti, J.S.; Lo, M.; de Linage, C.; Rodell, M.; Swenson, S.C. Groundwater Depletion in the Middle East from GRACE with Implications for Transboundary Water Management in the Tigris-Euphrates-Western Iran Region. Water Resour. Res. 2013, 49, 904–914. [Google Scholar] [CrossRef]
- Chang, F.-J.; Huang, C.-W.; Cheng, S.-T.; Chang, L.-C. Conservation of Groundwater from Over-Exploitation—Scientific Analyses for Groundwater Resources Management. Sci. Total Environ. 2017, 598, 828–838. [Google Scholar] [CrossRef]
- Li, H.; Du, X.; Lu, X.; Fang, M. Analysis of Groundwater Overexploitation Based on Groundwater Regime Information. Groundwater 2022. [Google Scholar] [CrossRef]
- Lancia, M.; Yao, Y.; Andrews, C.B.; Wang, X.; Kuang, X.; Ni, J.; Gorelick, S.M.; Scanlon, B.R.; Wang, Y.; Zheng, C. The China Groundwater Crisis: A Mechanistic Analysis with Implications for Global Sustainability. Sustain. Horiz. 2022, 4, 100042. [Google Scholar] [CrossRef]
- UNESCO. United Nations World Water Development Report 2020: Water and Climate Change; UNESCO: Paris, France, 2020. [Google Scholar]
- Holman, I.P. Climate Change Impacts on Groundwater Recharge-Uncertainty, Shortcomings, and the Way Forward? Hydrogeol. J. 2006, 14, 637–647. [Google Scholar] [CrossRef]
- Fiorillo, F.; Petitta, M.; Preziosi, E.; Rusi, S.; Esposito, L.; Tallini, M. Long-Term Trend and Fluctuations of Karst Spring Discharge in a Mediterranean Area (Central-Southern Italy). Environ. Earth Sci. 2015, 74, 153–172. [Google Scholar] [CrossRef]
- Leone, G.; Pagnozzi, M.; Catani, V.; Ventafridda, G.; Esposito, L.; Fiorillo, F. A Hundred Years of Caposele Spring Discharge Measurements: Trends and Statistics for Understanding Water Resource Availability under Climate Change. Stoch. Environ. Res. Risk Assess. 2021, 35, 345–370. [Google Scholar] [CrossRef]
- Grinevskiy, S.O.; Pozdniakov, S.P.; Dedulina, E.A. Regional-Scale Model Analysis of Climate Changes Impact on the Water Budget of the Critical Zone and Groundwater Recharge in the European Part of Russia. Water 2021, 13, 428. [Google Scholar] [CrossRef]
- Fiorillo, F.; Leone, G.; Pagnozzi, M.; Esposito, L. Long-Term Trends in Karst Spring Discharge and Relation to Climate Factors and Changes. Hydrogeol. J. 2021, 29, 347–377. [Google Scholar] [CrossRef]
- Romano, E.; Del Bon, A.; Petrangeli, A.B.; Preziosi, E. Generating Synthetic Time Series of Springs Discharge in Relation to Standardized Precipitation Indices. Case Study in Central Italy. J. Hydrol. 2013, 507, 86–99. [Google Scholar] [CrossRef]
- Sanz de Ojeda, A.; Alhama, I.; Sanz, E. Aquifer Sensitivity to Earthquakes: The 1755 Lisbon Earthquake. J. Geophys. Res. Solid Earth 2019, 124, 8844–8866. [Google Scholar] [CrossRef]
- Sanz, E.; Menéndez Pidal, I.; Escavy, J.I.; Ojeda, J.S. de Hydrogeological Changes along a Fault Zone Caused by Earthquakes in the Moncayo Massif (Iberian Chain, Spain). Sustainability 2020, 12, 9034. [Google Scholar] [CrossRef]
- Shih, D.C.-F. Groundwater Storage Inferred from Earthquake Activities around East Asia and West Pacific Ocean. J. Hydrol. 2017, 544, 363–372. [Google Scholar] [CrossRef]
- Rojstaczer, S.; Wolf, S.; Michel, R. Permeability Enhancement in the Shallow Crust as a Cause of Earthquake-Induced Hydrological Changes. Nature 1995, 373, 237–239. [Google Scholar] [CrossRef]
- Jónsson, S.; Segall, P.; Pedersen, R.; Björnsson, G. Post-Earthquake Ground Movements Correlated to Pore-Pressure Transients. Nature 2003, 424, 179–183. [Google Scholar] [CrossRef]
- Wang, C.-Y.; Manga, M. Earthquakes Influenced by Water. In Water and Earthquakes; Springer: Berlin/Heidelberg, Germany, 2010; pp. 125–139. [Google Scholar]
- Mohr, C.H.; Manga, M.; Wang, C.-Y.; Korup, O. Regional Changes in Streamflow after a Megathrust Earthquake. Earth Planet Sci. Lett. 2017, 458, 418–428. [Google Scholar] [CrossRef]
- Petitta, M.; Mastrorillo, L.; Preziosi, E.; Banzato, F.; Barberio, M.D.; Billi, A.; Cambi, C.; De Luca, G.; Di Carlo, G.; Di Curzio, D.; et al. Water-Table and Discharge Changes Associated with the 2016–2017 Seismic Sequence in Central Italy: Hydrogeological Data and a Conceptual Model for Fractured Carbonate Aquifers. Hydrogeol. J. 2018, 26, 1009–1026. [Google Scholar] [CrossRef]
- Hosono, T.; Yamada, C.; Manga, M.; Wang, C.-Y.; Tanimizu, M. Stable Isotopes Show That Earthquakes Enhance Permeability and Release Water from Mountains. Nat. Commun. 2020, 11, 2776. [Google Scholar] [CrossRef]
- Amoruso, A.; Crescentini, L.; Petitta, M.; Rusi, S.; Tallini, M. Impact of the 6 April 2009 L’Aquila Earthquake on Groundwater Flow in the Gran Sasso Carbonate Aquifer, Central Italy. Hydrol. Process 2011, 25, 1754–1764. [Google Scholar] [CrossRef]
- Valigi, D.; Fronzi, D.; Cambi, C.; Beddini, G.; Cardellini, C.; Checcucci, R.; Mastrorillo, L.; Mirabella, F.; Tazioli, A. Earthquake-Induced Spring Discharge Modifications: The Pescara Di Arquata Spring Reaction to the August–October 2016 Central Italy Earthquakes. Water 2020, 12, 767. [Google Scholar] [CrossRef]
- Scheihing, K.W. Post-Seismic Mountain Aquifer Leakage Drives Multi-Annual Forearc Basin Recharge in the Atacama Desert. Hydrol. Sci. J. 2023, 68, 49–61. [Google Scholar] [CrossRef]
- Mastrorillo, L.; Saroli, M.; Viaroli, S.; Banzato, F.; Valigi, D.; Petitta, M. Sustained Post-seismic Effects on Groundwater Flow in Fractured Carbonate Aquifers in Central Italy. Hydrol. Process 2020, 34, 1167–1181. [Google Scholar] [CrossRef]
- Cambi, C.; Mirabella, F.; Petitta, M.; Banzato, F.; Beddini, G.; Cardellini, C.; Fronzi, D.; Mastrorillo, L.; Tazioli, A.; Valigi, D. Reaction of the Carbonate Sibillini Mountains Basal Aquifer (Central Italy) to the Extensional 2016–2017 Seismic Sequence. Sci. Rep. 2022, 12, 22428. [Google Scholar] [CrossRef]
- Chiaraluce, L.; Di Stefano, R.; Tinti, E.; Scognamiglio, L.; Michele, M.; Casarotti, E.; Cattaneo, M.; De Gori, P.; Chiarabba, C.; Monachesi, G.; et al. The 2016 Central Italy Seismic Sequence: A First Look at the Mainshocks, Aftershocks, and Source Models. Seismol. Res. Lett. 2017, 88, 757–771. [Google Scholar] [CrossRef]
- Cresta, S.; Monechi, S.; Parisi, G. Mesozoic–Cenozoic Stratigraphy in the Umbria - Marche Area. Mem. Descr. Della Carta Geol. D’Italia 1989, 39, 1–182. [Google Scholar]
- Nanni, T.; Vivalda, P. The Aquifers of the Umbria-Marche Adriatic Region: Relationships between Structural Setting and Groundwater Chemistry. Ital. J. Geosci. 2005, 124, 523–542. [Google Scholar]
- Mastrorillo, L.; Baldoni, T.; Banzato, F.; Boscherini, A.; Cascone, D.; Checcucci, R.; Petitta, M.; Boni, C. Quantitative Hydrogeological Analysis of the Carbonate Domain of the Umbria Region (Central Italy). Ital. J. Eng. Geol. Environ. 2009, 1, 137–156. [Google Scholar]
- Boni, C.; Baldoni, T.; Banzato, F.; Cascone, D.; Petitta, M. Hydrogeological Study for Identification, Characterisation and Management of Groundwater Resources in the Sibillini Mountains National Park (Central Italy). Ital. J. Eng. Geol. Environ. 2010, 2, 21–39. [Google Scholar]
- Mastrorillo, L.; Petitta, M. Hydrogeological Conceptual Model of the Upper Chienti River Basin Aquifers (Umbria-Marche Apennines). Ital. J. Geosci. 2014, 133, 396–408. [Google Scholar] [CrossRef]
- Viaroli, S.; Mirabella, F.; Mastrorillo, L.; Angelini, S.; Valigi, D. Fractured Carbonate Aquifers of Sibillini Mts. (Central Italy). J. Maps 2021, 17, 140–149. [Google Scholar] [CrossRef]
- Boni, C.; Bono, P.; Capelli, G. Schema Idrogeologico Dell’Italia Centrale. Mem. Della Soc. Geol. Ital. 1986, 35, 991–1012. [Google Scholar]
- Calamita, F.; Deiana, G. The Arcuate Shape of the Umbria-Marche-Sabina Apennines (Central Italy). Tectonophysics 1988, 146, 139–147. [Google Scholar] [CrossRef]
- Calamita, F.; Cello, G.; Deiana, G.; Paltrinieri, W. Structural Styles, Chronology Rates of Deformation, and Time-Space Relationships in the Umbria-Marche Thrust System (Central Apennines, Italy). Tectonics 1994, 13, 873–881. [Google Scholar] [CrossRef]
- Curzi, M.; Cipriani, A.; Aldega, L.; Billi, A.; Carminati, E.; Van der Lelij, R.; Vignaroli, G.; Viola, G. Architecture and Permeability Structure of the Sibillini Mts. Thrust and Influence upon Recent, Extension-Related Seismicity in the Central Apennines (Italy) through Fault-Valve Behavior. GSA Bull. 2023. [Google Scholar] [CrossRef]
- Sapienza Università di Roma Integrazione Della Base Conoscitiva per La Gestione Della Risorsa Idrica Sotterranea Del Parco Nazionale Dei Monti Sibillini; Technical Report; Sapienza University of Rome: Rome, Italy, 2011.
- Petrella, E.; Capuano, P.; Carcione, M.; Celico, F. A High-Altitude Temporary Spring in a Compartmentalized Carbonate Aquifer: The Role of Low-Permeability Faults and Karst Conduits. Hydrol. Process 2009, 23, 3354–3364. [Google Scholar] [CrossRef]
- Boni, C.; Cascone, D.; Mastrorillo, L.; Tarragoni, C. Carta Idrogeologica Delle Dorsali Interne Umbro Marchigiane; Consiglio Nazionale delle Ricerche Gruppo Nazionale Difesa Catastrofi Idrogeologiche: Rome, Italy, 2005. [Google Scholar]
- Civita, M. Idrogeologia Applicata e Ambientale; Casa Editrice Ambrosiana: Milan, Italy, 2005. [Google Scholar]
- Brozzetti, F.; Boncio, P.; Cirillo, D.; Ferrarini, F.; Nardis, R.; Testa, A.; Liberi, F.; Lavecchia, G. High-Resolution Field Mapping and Analysis of the August–October 2016 Coseismic Surface Faulting (Central Italy Earthquakes): Slip Distribution, Parameterization, and Comparison with Global Earthquakes. Tectonics 2019, 38, 417–439. [Google Scholar] [CrossRef]
- Di Matteo, L.; Capoccioni, A.; Porreca, M.; Pauselli, C. Groundwater-Surface Water Interaction in the Nera River Basin (Central Italy): New Insights after the 2016 Seismic Sequence. Hydrology 2021, 8, 97. [Google Scholar] [CrossRef]
- Fronzi, D.; Banzato, F.; Caliro, S.; Cambi, C.; Cardellini, C.; Checcucci, R.; Mastrorillo, L.; Mirabella, F.; Petitta, M.; Valigi, D.; et al. Preliminary Results on the Response of Some Springs of the Sibillini Mountains Area to the 2016–2017 Seismic Sequence. Acque Sotter. Ital. J. Groundw. 2020, 9. [Google Scholar] [CrossRef]
- Mammoliti, E.; Fronzi, D.; Cambi, C.; Mirabella, F.; Cardellini, C.; Patacchiola, E.; Tazioli, A.; Caliro, S.; Valigi, D. A Holistic Approach to Study Groundwater-Surface Water Modifications Induced by Strong Earthquakes: The Case of Campiano Catchment (Central Italy). Hydrology 2022, 9, 97. [Google Scholar] [CrossRef]
- Boni, C.; Petitta, M.; Preziosi, E.; Sereni, M. Genesi e Regime Di Portata Delle Acque Continentali Del Lazio; Consiglio Nazionale delle RIcerche, Ufficio Pubblicazioni e Informazioni Scientifiche: Rome, Italy, 1993. [Google Scholar]
- Sapienza Università di Roma Studio Idrogeologico Della Sorgente Di Capodacqua Del Tronto; Technical Report; Sapienza University of Rome: Rome, Italy, 2021.
- Università degli Studi Roma Tre Revisione Dei Modelli Concettuali Dei Corpi Idrici Sotterranei e Valutazione Dei Relativi Bilanci Idrici a Seguito Degli Effetti Indotti Dagli Eventi Sismici Del 2016–2017; Technical Report; Roma Tre University: Rome, Italy, 2021.
- Università degli Studi Roma Tre Attività Di Supporto Alla Ricerca Idrogeologica Nell’ambito Della Realizzazione Del Progetto Di Interconnessione Idrica “Anello Acquedottistico Dei Sibillini”; Technical Report; Roma Tre University: Rome, Italy, 2022.
- Mastrorillo, L.; Nanni, T.; Petitta, M.; Vivalda, P.M.; Banzato, F.; Palpacelli, S. Groundwater Resources of the Upper Basin of Aso River (Sibillini Mts. National Park): Hydrogeological Study and Management Evaluation. G. Geol. Appl. 2012, 15, 83–96. [Google Scholar]
- Sapienza Università di Roma Studio Idrogeologico Della Captazione Di Foce e Del Sistema Sorgivo Del Fiume Aso; Technical Report; Sapienza University of Rome: Rome, Italy, 2022.
- Regione Lazio Agenzia Regionale Di Protezione Civile. Available online: https://protezionecivile.regione.lazio.it/gestione-emergenze/centro-funzionale/servizio-idrografico (accessed on 31 May 2022).
- Regione Marche Protezione Civile Regionale. Available online: http://app.protezionecivile.marche.it/sol/indexjs.sol?lang=it (accessed on 31 May 2022).
- Regione Umbria Servizio Idrografico. Available online: https://www.mdpi.com/authors/references (accessed on 31 May 2022).
- ISPRA Metodologiedi Misura e Specifiche Tecniche per La Raccolta e l’elaborazione Dei Dati Idrometeorologici; ISPRA: Rome, Italy, 2010.
- Fiorillo, F.; Guadagno, F.M. Karst Spring Discharges Analysis in Relation to Drought Periods, Using the SPI. Water Resour. Manag. 2010, 24, 1867–1884. [Google Scholar] [CrossRef]
- World Meteorological Organization. Standardized Precipitation Index User Guide; WMO: Geneva, Switzerland, 2012. [Google Scholar]
- McKee, T.B.; Doesken, N.J.; Kleist, J. The Relationship of Drought Frequency and Duration to Time Scales. In Proceedings of the 8th Conference on Applied Climatology, Anaheim, CA, USA, 17–22 January 1993; pp. 179–184. [Google Scholar]
- Thornthwaite, C.W.; Mather, J.R. Instructions and Tables for Computing Potential Evapotranspiration and the Water Balance; CW Thornthwaite Associates, Laboratory of Climatology: Elmer, NJ, USA, 1957; Volume 10. [Google Scholar]
- Bosch, D.D.; Arnold, J.G.; Allen, P.G.; Lim, K.-J.; Park, Y.S. Temporal Variations in Baseflow for the Little River Experimental Watershed in South Georgia, USA. J. Hydrol. Reg. Stud. 2017, 10, 110–121. [Google Scholar] [CrossRef]
- Boni, C. Utilizzazione Delle Riserve Idriche Permanenti per Regolare Il Regime Delle Sorgenti Di Trabocco. Geol. Romana 1968, 8, 405–416. [Google Scholar]
- Margat, J.; Foster, S.; Droubi, A. Concept and Importance of Non-Renewable Resources. In Non-Renewable Groundwater Resources, A Guidebook on Socially-Sustainable Management for Water-Policy Makers; United Nations Educational, Scientific and Cultural Organization: Paris, France, 2006; Volume 10, pp. 13–24. [Google Scholar]
- Maillet, E. Essais d’Hydraulique Souterraine et Fluviale; Librairie Scientifique A. Hermann: Paris, France, 1905. [Google Scholar]
Disclaimer/Publisher’s Note: The statements, opinions and data contained in all publications are solely those of the individual author(s) and contributor(s) and not of MDPI and/or the editor(s). MDPI and/or the editor(s) disclaim responsibility for any injury to people or property resulting from any ideas, methods, instructions or products referred to in the content. |
© 2023 by the authors. Licensee MDPI, Basel, Switzerland. This article is an open access article distributed under the terms and conditions of the Creative Commons Attribution (CC BY) license (https://creativecommons.org/licenses/by/4.0/).