Article

Local Scour around Side-by-Side Double Piers in Channel Bends under Ice-Covered Conditions—An Experimental Study

1
School of Civil and Hydraulic Engineering, Hefei University of Technology, Hefei 230009, China
2
School of Engineering, University of Northern British Columbia, Prince George, BC V2N 4Z9, Canada
*
Authors to whom correspondence should be addressed.
Water 2023, 15(13), 2317; https://doi.org/10.3390/w15132317
Submission received: 18 May 2023 / Revised: 16 June 2023 / Accepted: 18 June 2023 / Published: 21 June 2023
(This article belongs to the Special Issue Cold Region Hydrology and Hydraulics)

Abstract

:
The pier scour process is normally intensified in the presence of an ice cover, which poses risks to the longevity and safety of bridges. In the present study, the impact of the densimetric Froude number, locations, and pier spacing of side-by-side piers on the local scour depth under ice-covered flow conditions were investigated based on clear water scour experiments in an S-shaped laboratory flume. The results demonstrated that the local scour at piers along the convex bank was more substantial than that along the concave bank when other factors stayed identical. The densimetric Froude number clearly has more impact on local scour at piers along the convex bank than that along the concave bank. Different from the mechanism of the pier scour in a straight channel, the scour depth around a pier along the convex bank in the S-shaped flume increases as the distance between two piers (or pier spacing) increases, while it decreases around the piers along the concave bank. Similar scour patterns were observed when the side-by-side piers were installed at different bend apex cross-sections. The maximum local scour depths at piers along the convex bank measured at different bend apex cross-sections were relatively unchanged when other influencing factors were held constant. However, the maximum scour depth around piers along the concave bank decreased as the bends increased toward downstream.

1. Introduction

Severe local scour at piers can lead to bridge collapses. In cold regions, ice covers appear frequently in rivers during winter [1], and the presence of piers in rivers affect the formation process of ice cover [2]. Meanwhile, the local scour process at piers is exacerbated by the presence of an ice cover, which doubles the channel’s wetted perimeter, alters the velocity distribution, and shifts the location of the maximum velocity toward the channel bed [3,4]. As a consequence, the depth of scour holes around piers increases due to the increase in the velocity gradient near the bed. Therefore, it is crucial for the safety and longevity of bridges to accurately predict the depth of scour holes at piers.
Numerous studies have been conducted on the pier scour in open channel flows, and most of them are based on laboratory experiments around a single pier [5,6,7,8,9]. In other words, few research works have been carried out to investigate the local scour process around multiple piers in channels. Ataie-Ashtiani and Beheshti [10] conducted local scour experiments at piers with different arrangements under clear water scour conditions. Their results demonstrated that the maximum depth of scour holes in the vicinity of side-by-side double piers increased as the pier spacing decreased. This may be partly due to the increased size of the horseshoe vortex for a smaller pile spacing distance and partly due to a very strong flow between two neighboring piles. Kim et al. [11] conducted a numerical simulation on local scour around both tandem and side-by-side piers. It was found that the maximum scour depth around side-by-side double piers decreased with increases in pier spacing, since the jet-like flow between piers, which leads to an acceleration of the flow and elevated turbulence, was weakened. Malik and Setia [12] investigated the local scour around side-by-side double piers and found that the scour depth around double piers reached the maximum, which was approximately 54% greater than that around a single pier, when the pier spacing was 0. The scour holes around the double piers would not interfere with one another when the pier spacing was greater than 1.5 times the pier diameter. Bordbar et al. [13] numerically simulated local scour around side-by-side double piers and stated that the characteristics of the flow between piers were similar to jet flow. Further, the impact of such flows would diminish with increases in pier spacing. Experimental studies of local scour around double square piers in various arrangements were conducted by Mamoon et al. [14]. The results revealed that the scour process was slowed down due to sediments deposited between piers, and the maximum scour depth was slightly greater than that around a single pier when the two square piers were placed side by side and the distance between piers was 1 or 2 times the pier diameter.
The local scour process around in-stream infrastructure becomes complicated when an ice cover is present on the water surface. Ackermann et al. [15] and Hains and Zabilansky [16,17] studied the scour process around cylindrical piers when an ice cover appears on the water surface and noted that velocity distribution profiles appear in a “parabolic” shape under an ice cover. The presence of an ice cover caused the maximum to be located closer to the bed, along with a steeper velocity gradient near the bed and the associated increased shear stresses along the bed. Consequently, the scour depth around piers under ice-covered conditions was greater than that under open flow conditions. The impact of ice cover roughness on local scour around semi-circular bridge abutments was investigated by Wu et al. [18]. According to Wu et al. [18], the maximum scour depth under a rough covered condition increased by approximately 35% compared to that under a smooth covered condition. In addition, large particles impede the scour process and dissipate some of the kinetic energy in the scour area; the maximum scour depth is reduced with increases in the median grain size of the bed material. Wu et al. [19] further investigated the local scour around a single cylindrical pier under ice-covered conditions. The scour radius was included as an indicator, which offered a fresh viewpoint on scour estimation. Additionally, empirical formulas for the scour depth and scour radius were derived for ice-covered flows compared to those in open channel flows. Wang et al. [20,21] studied the temporal variation in the scour depth around a cylindrical pier when an ice cover appears on the water surface. Their findings demonstrated that the rate of the pier scour with the appearance of an ice cover on the water surface was greater compared to that in open channel flows. It is reported that the local scour process under an ice cover needs an additional 10% of time to reach the equilibrium state. An equation describing the temporal variation of scour depth around a cylindrical pier under an ice-covered flow condition was derived based on data collected from laboratory experiments. Both the area and volume of scour holes increased by 40~50% under a sheet of ice cover compared to those in an open channel flow. Wang et al. [22] conducted experiments to study local scour at bridge piers when an ice jam occurs on the water surface. It is reported that the local scour depth under an ice jam was greater than that under conditions of both sheet ice-covered flow and open channel flow. Furthermore, the flow cross-sectional area decreased with increases in the thickness of an ice jam, and the flow velocity increased correspondingly. This caused a stronger horseshoe vortex, so the maximum depth of the scour holes increased. Hu et al. [23] studied the interaction between local scour and the evolution of an ice jam around bridge piers and claimed that the scour hole developed faster under an ice-jammed flow condition.
Research works have also investigated the scouring process in the vicinity of multiple bridge piers in a straight channel under an ice-covered flow condition. Sang et al. [24] assessed the effect of the distance between piers on the scour depth in the vicinity of double piers placed in a tandem arrangement under an ice cover. Their findings demonstrated the dependence of the scour depth around tandem double piers on the pier spacing under a sheet ice cover. As the pier spacing increased, the maximum scour depth around piers increased by approximately 10% in comparison to that in an open channel flow. The scour depth around the rear pier was the lowest when the pier spacing equated to 9 times the pier diameter. Additionally, formulas for calculating the maximum scour depths around tandem double piers under an ice cover flow condition were proposed based on the experimental data. Namaee and Sui [25] investigated the characteristics of the scour process at side-by-side double piers in ice-covered flow by comparing the results to an open channel flow. Their results demonstrated that the maximum scour depth at side-by-side bridge double piers in flows under an ice cover always occurred at the upstream front face of bridge piers, analogous to the local scour under open flow conditions. They claimed that the strength of the horseshoe vortex is a function of the pier Reynolds number (Reb), which is defined as follows [25]:
R e b = U D υ
where U is the average velocity of the approaching flow, D is the diameter of the bridge pier, and υ is the kinematic viscosity of water. The pier Reynolds number Reb and the strength of the horseshoe vortex decreased as the pier diameter decreased and pier spacing increased. Therefore, the bed shear stress decreased, and the scour depth decreased correspondingly. Based on experimental data, formulas were established to determine the maximum scour depth around side-by-side double piers under ice-covered flow conditions compared to that under open channel flow conditions. Additionally, a numerical simulation was carried out by Namaee et al.to assess the local scour process around side-by-side double piers under an ice-covered condition [26]. It was found that the sediment transport models employing the Meyer-Peter and Müller equation could roughly reflect the transport of sediment particles under an ice-covered flow condition, and the simulated results were in good agreement with the experimental results.
Overall, the local scour around multiple bridge piers in both open channel flows and ice-covered flows has been investigated under various flow conditions with different pier layouts. However, almost all these investigations were conducted in straight channels. In the present study, local scour experiments were conducted around side-by-side double piers in an S-shaped flume under ice-covered flow conditions. Different flow conditions as well as different pier spacings and positions were considered to determine the effects of these factors on the local scour around side-by-side double piers in an S-shaped channel.

2. Materials and Methods

2.1. Experimental Setup

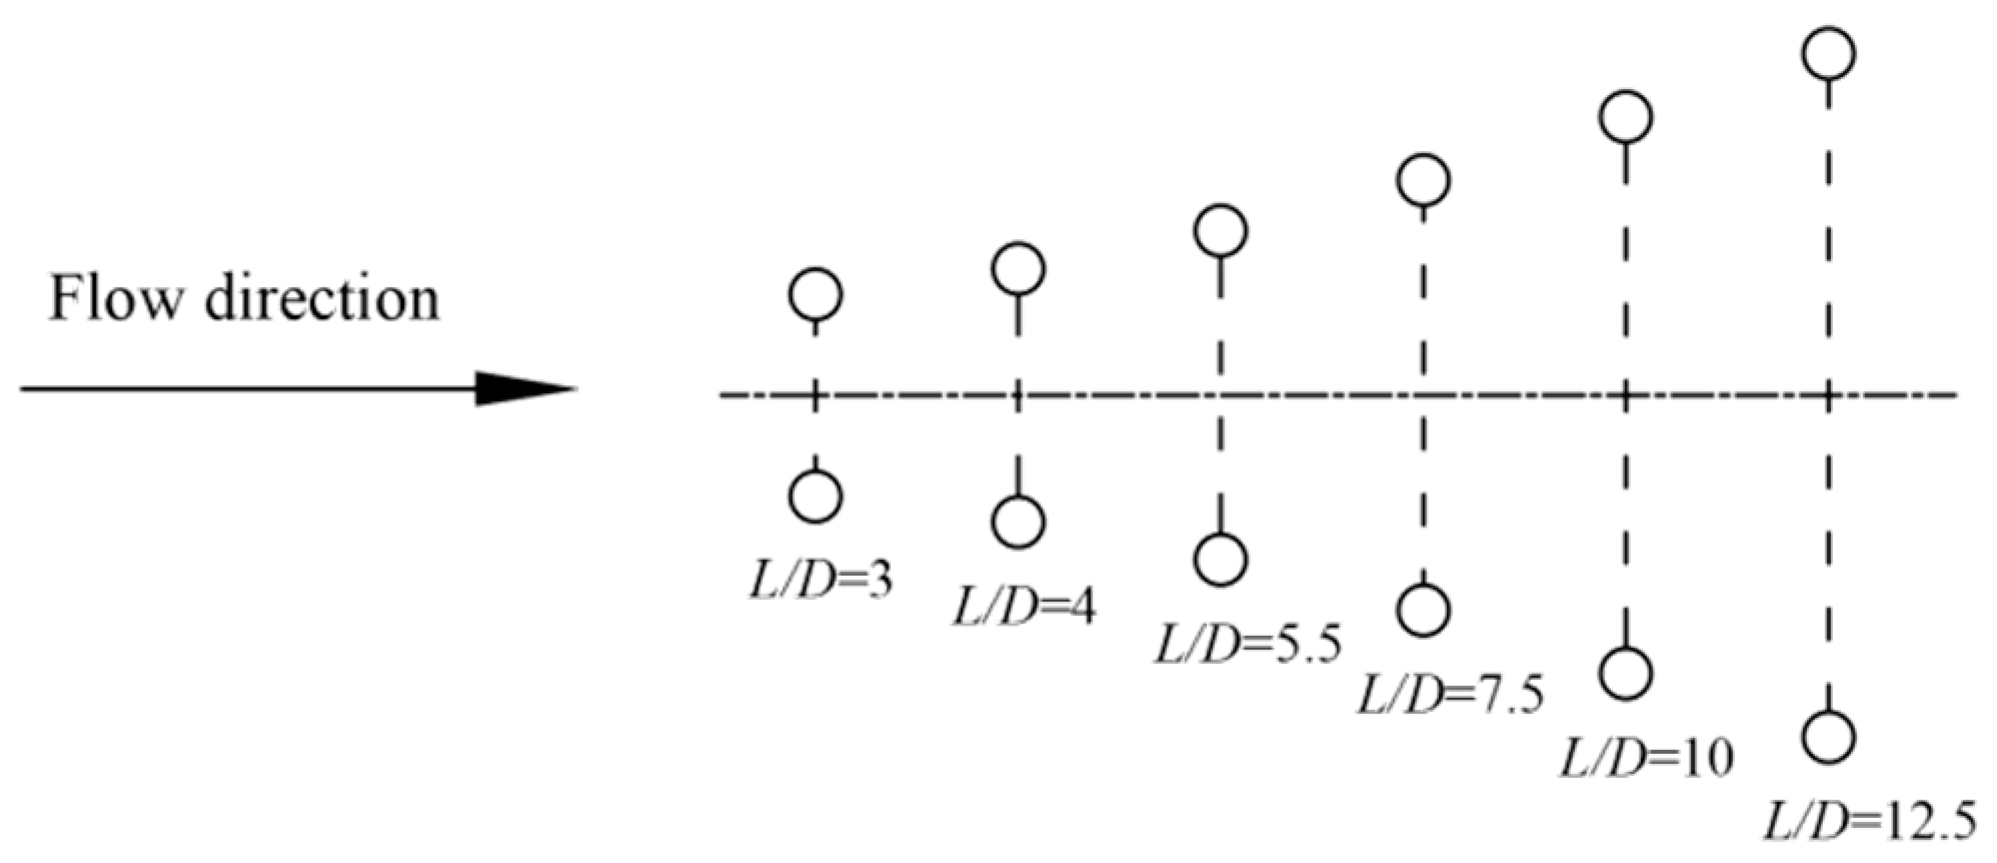
In the present study, laboratory experiments were conducted in an S-shaped bend flume. The S-shaped bend flume was 25.17 m long, 0.6 m wide, and 0.6 m deep. The layout plan of the flume is shown in Figure 1. In total, 27 cross-sections (CS) with equal spacing distances from upstream to downstream were set up. At the beginning of each experimental run, the entire flume bed was covered by a layer of sediment with a thickness of 15 cm. The median particle diameter (d50) of the bed material was 0.713 mm, the mass density of the sediment ρs was 1.423 kg/m3, and the non-uniformity coefficient η was 1.61. According to Chiew [27], the flume side wall has no appreciable impact on flow characteristics or the scour profile if the ratio of flume width (B) to pier diameter (D) is more than 10 (B/D > 10). In this study, the model pier (which is prepared by Shushan Ruifuxiang building materials business department, Hefei, China) diameter was 2cm, and, thus, the B/D ratio = 30. So, the side-wall effect could be ignored. Two cylindrical piers were placed side by side at the cross-section of bend apexes of the S-shaped flume (CS-8, CS-13, or CS-18). Figure 2 depicts the pier arrangement. The flow depth (H) and velocity (V) measured at the upstream CS-3 were used to describe the experiment control variables. As suggested by other researchers, Styrofoam panels (manufactured by Jiujiang Boling Trading Co. Ltd., Jiangxi, China) were used to model the ice cover [15,16,17,18,19,20,21,24,25,26].

2.2. Experiment Procedures

All experiment runs were conducted by following the steps below:
(1)
Before each experimental run, the model bridge piers were installed at the bend apex cross-sections. Then, the channel bed was filled with sediment and leveled carefully before each experimental run. By adjusting the upstream weir head, the flume was then slowly filled with water to avoid the initial scour. The incoming flow to the flume was then gradually adjusted to the designated flow rate.
(2)
At each cross-section, three pressure gauges were installed to check the water level in the flume. To reach the specified water depth in the flume, the tailgate at the downstream end of the flume was gradually adjusted.
(3)
Under an ice-covered flow condition, the Reynolds number Re was calculated using Equation (2).
R e = ρ w V d μ
where ρw = the mass density of the water; μ = the dynamic viscosity of the water; and d = the characteristic length. The hydraulic radius is used under an ice-covered condition.
For all experimental runs, the Reynolds number was higher than 11,250. Therefore, the flows for all experimental runs can be considered fully developed turbulence.
(4)
The model ice cover was placed on the water surface along the bend channel from CS-3 to CS-26. Then, the experiment under this condition began. The depth of the scour holes around side-by-side double piers was measured once every five minutes during the first half hour then once every ten minutes during the 2nd half-hour, and, finally, once every 30 min until the end of each experiment run.
(5)
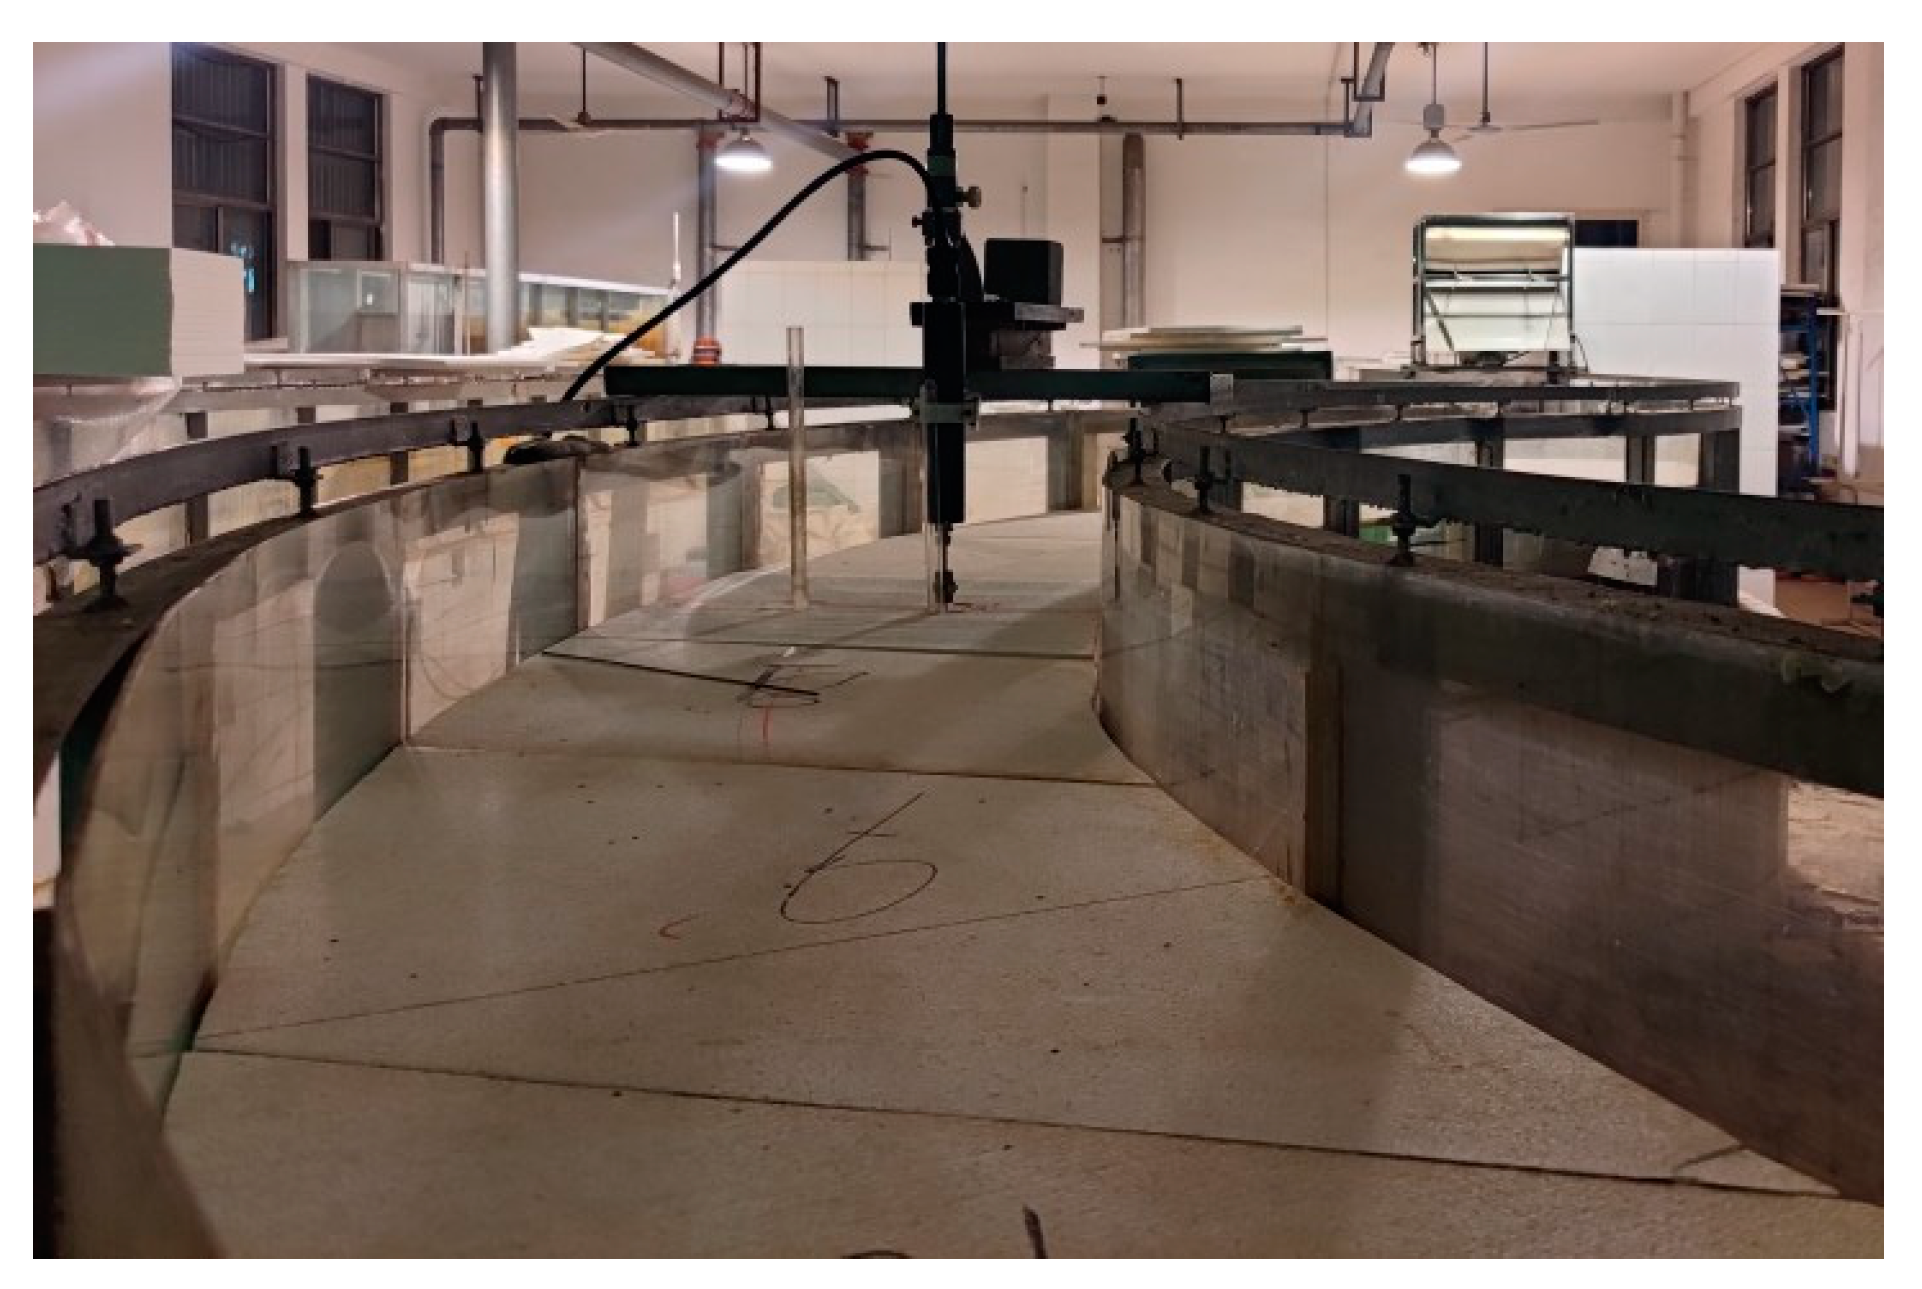
After the experiment achieved the equilibrium condition, the maximum depth of the scour hole was reached. The Acoustic Doppler Velocimeter (ADV) was used to measure flow velocities in front of the piers, as shown in Figure 3. After all the data for the flow velocity were acquired, both the ADV and model ice cover around the piers were carefully removed. Then, the bathymetry of the scour holes and deposition dunes around the piers was measured carefully using a point gauge with an accuracy of 0.1 mm.
In total, 19 experimental runs were conducted under conditions of both ice-covered and open channel flows. It is considered that the scour process around piers reaches an equilibrium condition when the depth and area of scour holes stop changing. It has been observed from experiments that scour holes hardly change after approximately 10 h, indicating that the scour process reaches a quasi-equilibrium condition. However, all experiments lasted 24 h to make sure the scour process achieved an equilibrium state. Table 1 summarizes the experimental setups: “A” represents the ice-covered condition and “B” represents the open channel condition.
As stated by Sheppard et al. [28], the critical velocity for the incipient of sediment (Vc) can be estimated from the Shields diagram, using Equations (3)–(6).
u * = 16.2 d 50 9.09 × 1 0 6 d 50 d 50 38.76 + 9.6 ln ( d 50 ) 0.005 1 / 2
R = u * d 50 2.32 × 1 0 7
For 5 ≤ R ≤ 70,
V c = 2.5 u * ln 73.5 H d 50 R 2.85 0.58 ln ( R ) + 0.002 R + 111 / R 6
For R > 70,
V c = 2.5 u * ln 2.21 H d 50
The results of the calculations reveal that the approach flow intensity (V/Vc) in this study was between 0.5 and 0.6.

3. Results

3.1. Temporal Variation of Scour Holes

There are some discrepancies in the scour mechanisms at piers near the convex bank compared to those near the concave bank because of the flume’s sinuosity. Sediment particles were eroded and transported by vortexes and exhibited a circular motion in front of piers near the convex bank (hereinafter referred to as the convex bank pier), and only a small number of sediment particles were disturbed at the rear side of the pier due to the blockage of the structure. Meanwhile, the scouring process around the pier near the concave bank (hereinafter referred to as the concave bank pier) underwent a similar scouring process, but the circular motion of the sediment particles was clearly weak compared to that around the convex bank pier. The sediments transported by the flow around both piers were deposited downstream of the piers where the influence of the vortex was not prominent. Once the scouring process around bridge piers was initiated, the depth and area of the scour hole expanded with time. This pattern was also observed for the height and the expanse of the deposition dunes, whose direction followed the sinuosity of the flume. It was observed that the scour holes around the convex bank piers were deeper and wider than those around the concave bank piers, and the deposition dunes behind the convex bank piers were also higher, as shown in Figure 4 and Figure 5.
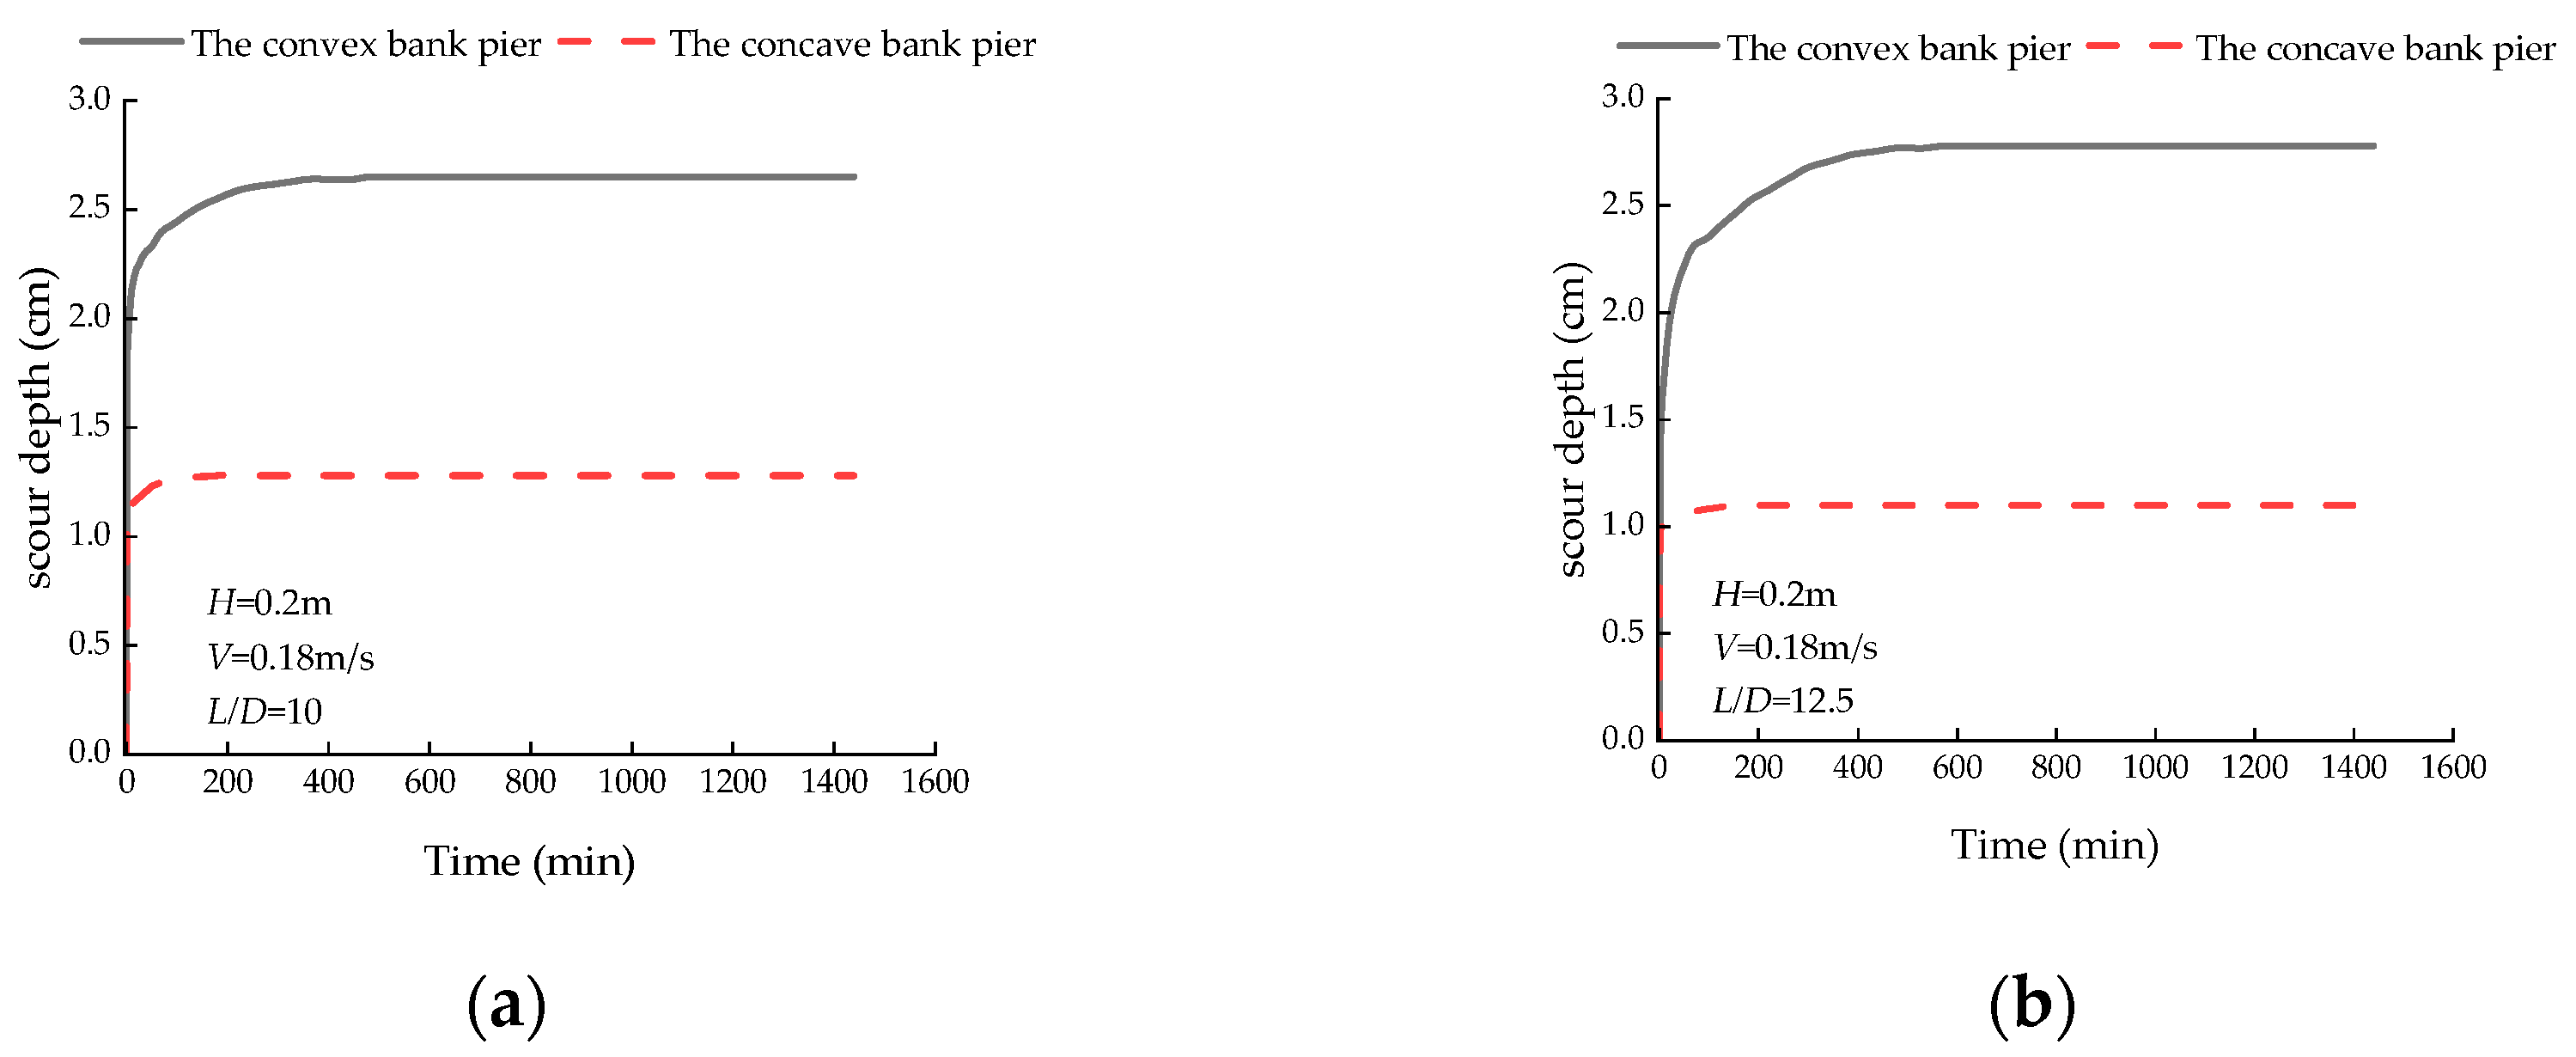
The temporal variation in the scour depth around side-by-side double piers at CS-18 is shown in Figure 6 for two different pier spacings. One can see from Figure 6 that the slope of the variation curve of the scour depth at the convex bank pier was steeper during the initial scouring stage compared to that of the concave bank pier, indicating that the scour intensity around the convex bank pier was greater. As the experiments continued, the changes in the depth and area of scour holes became noticeably slow. Gradually, the scouring process achieved an equilibrium state, and the scour depth reached the maximum (ym represents the maximum scour depth). One can see from Figure 6 that about 80–90% of the maximum scour depth was reached after approximately 5 h and 3 h around the convex and concave bank piers, respectively.

3.2. Comparison of Local Scour under Open Channel and Ice-Covered Flow Conditions

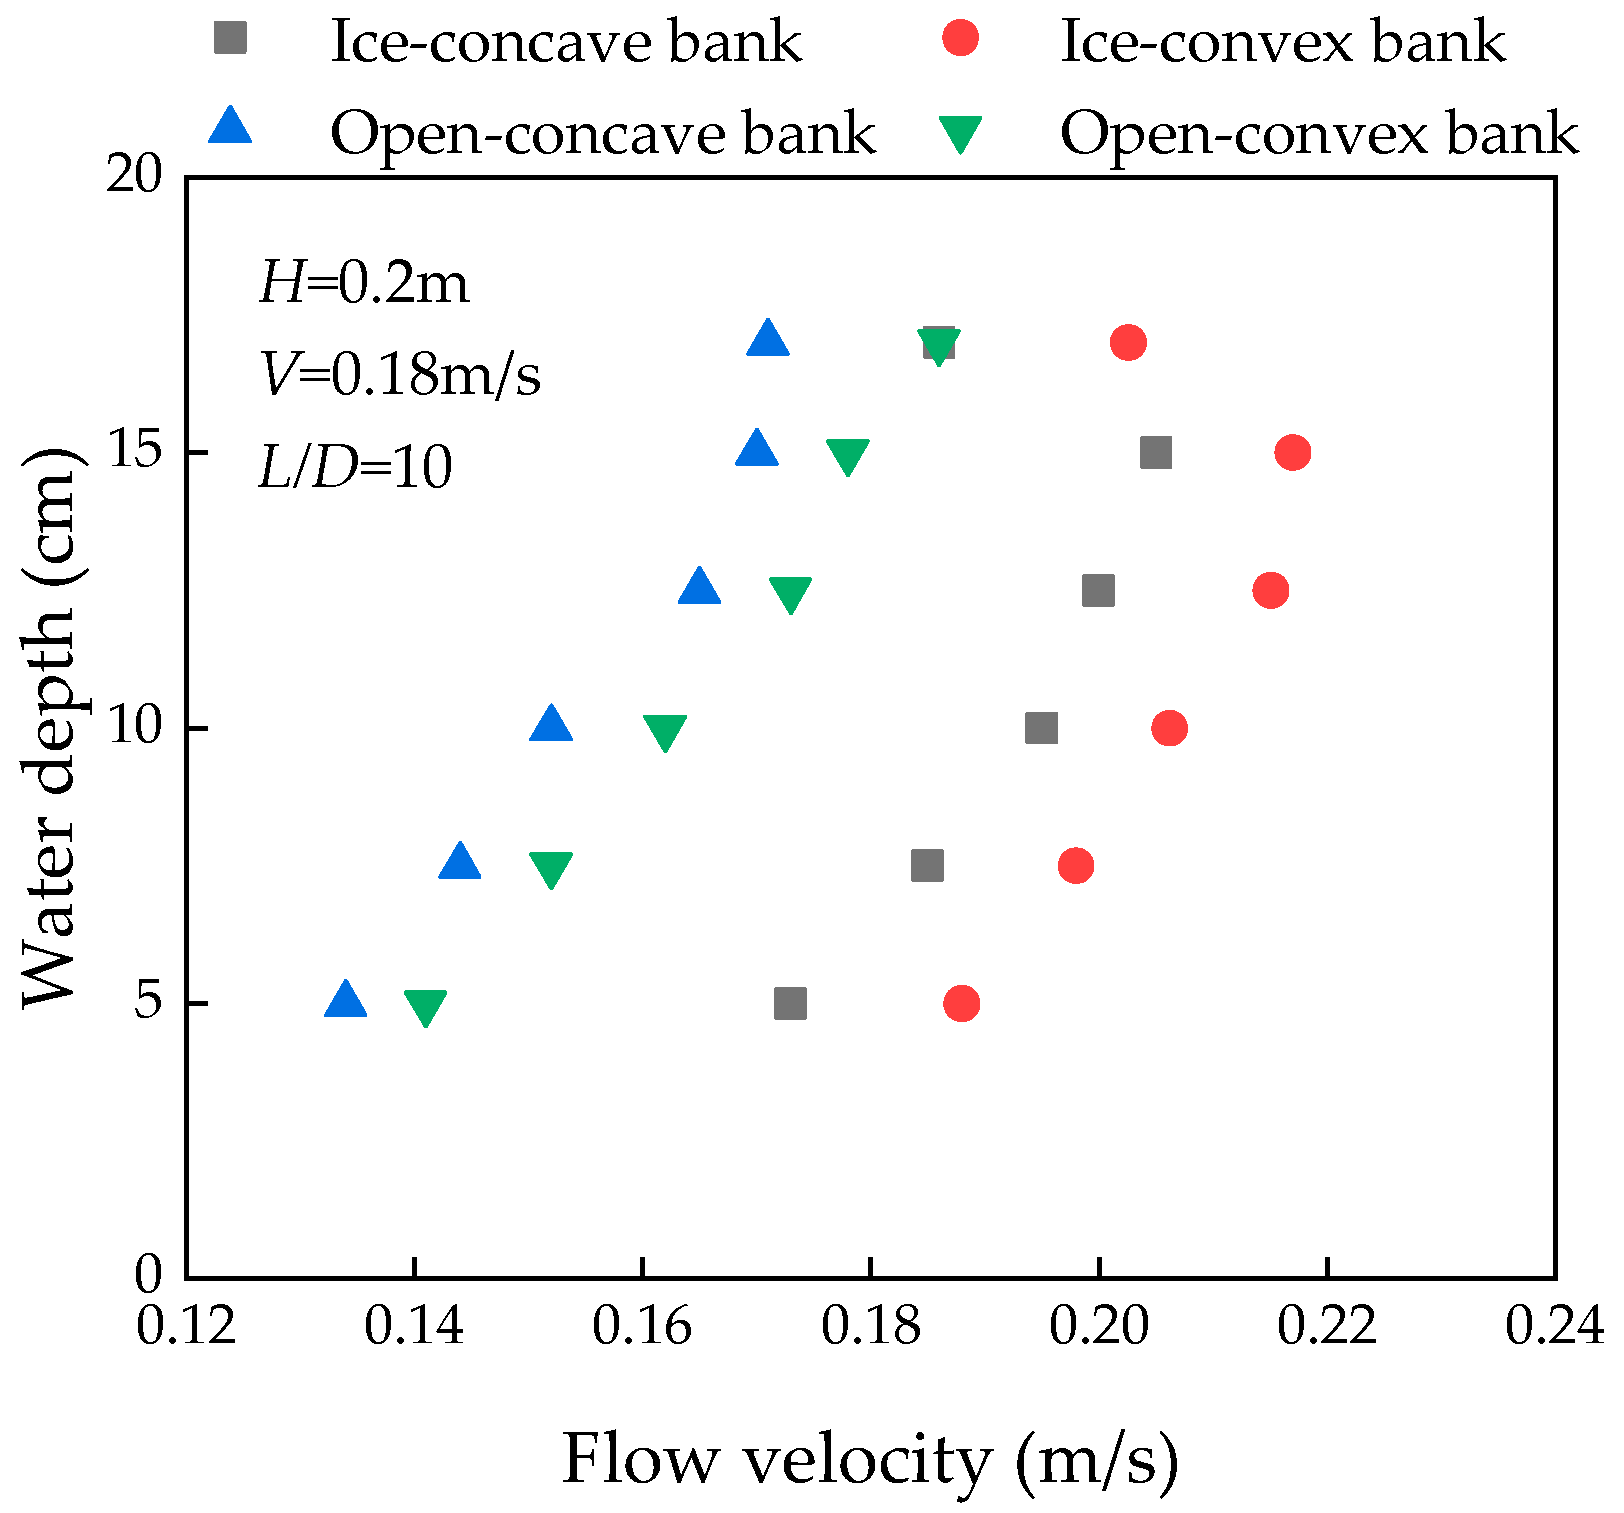
As demonstrated in Figure 7, the velocity gradient in front of the piers under an ice-covered flow condition is larger than that under an open flow condition. One can obtain from Equation (1) that the Reb is larger under an ice-covered condition, and the strength of the horseshoe vortex is also more violent, exacerbating the local scour at the piers. Additionally, greater approaching velocity gradients will be yielded along the convex bank compared to those around the concave bank pier under the same conditions. Therefore, the Reb around the convex bank pier is larger, which could produce stronger horseshoe vortices. As a result, one can see from Figure 8 that the scour depths around the convex bank pier are substantially greater than those around the concave bank pier. The relative local scour depth (calculated as ym/D) under ice-covered conditions is about 10%~20% greater than that under open channel conditions, as shown in Figure 8, similar to the results for a single pier proposed by Ackermann et al. [15].

3.3. Effect of Densimetric Froude Number on Local Scour

The densimetric Froude number (Frd) is one of the crucial factors affecting local scour at piers. The Frd can be calculated using the following formula [29]:
F r d = V ρ s - ρ w ρ w g d 50
in which g is the gravitational acceleration.
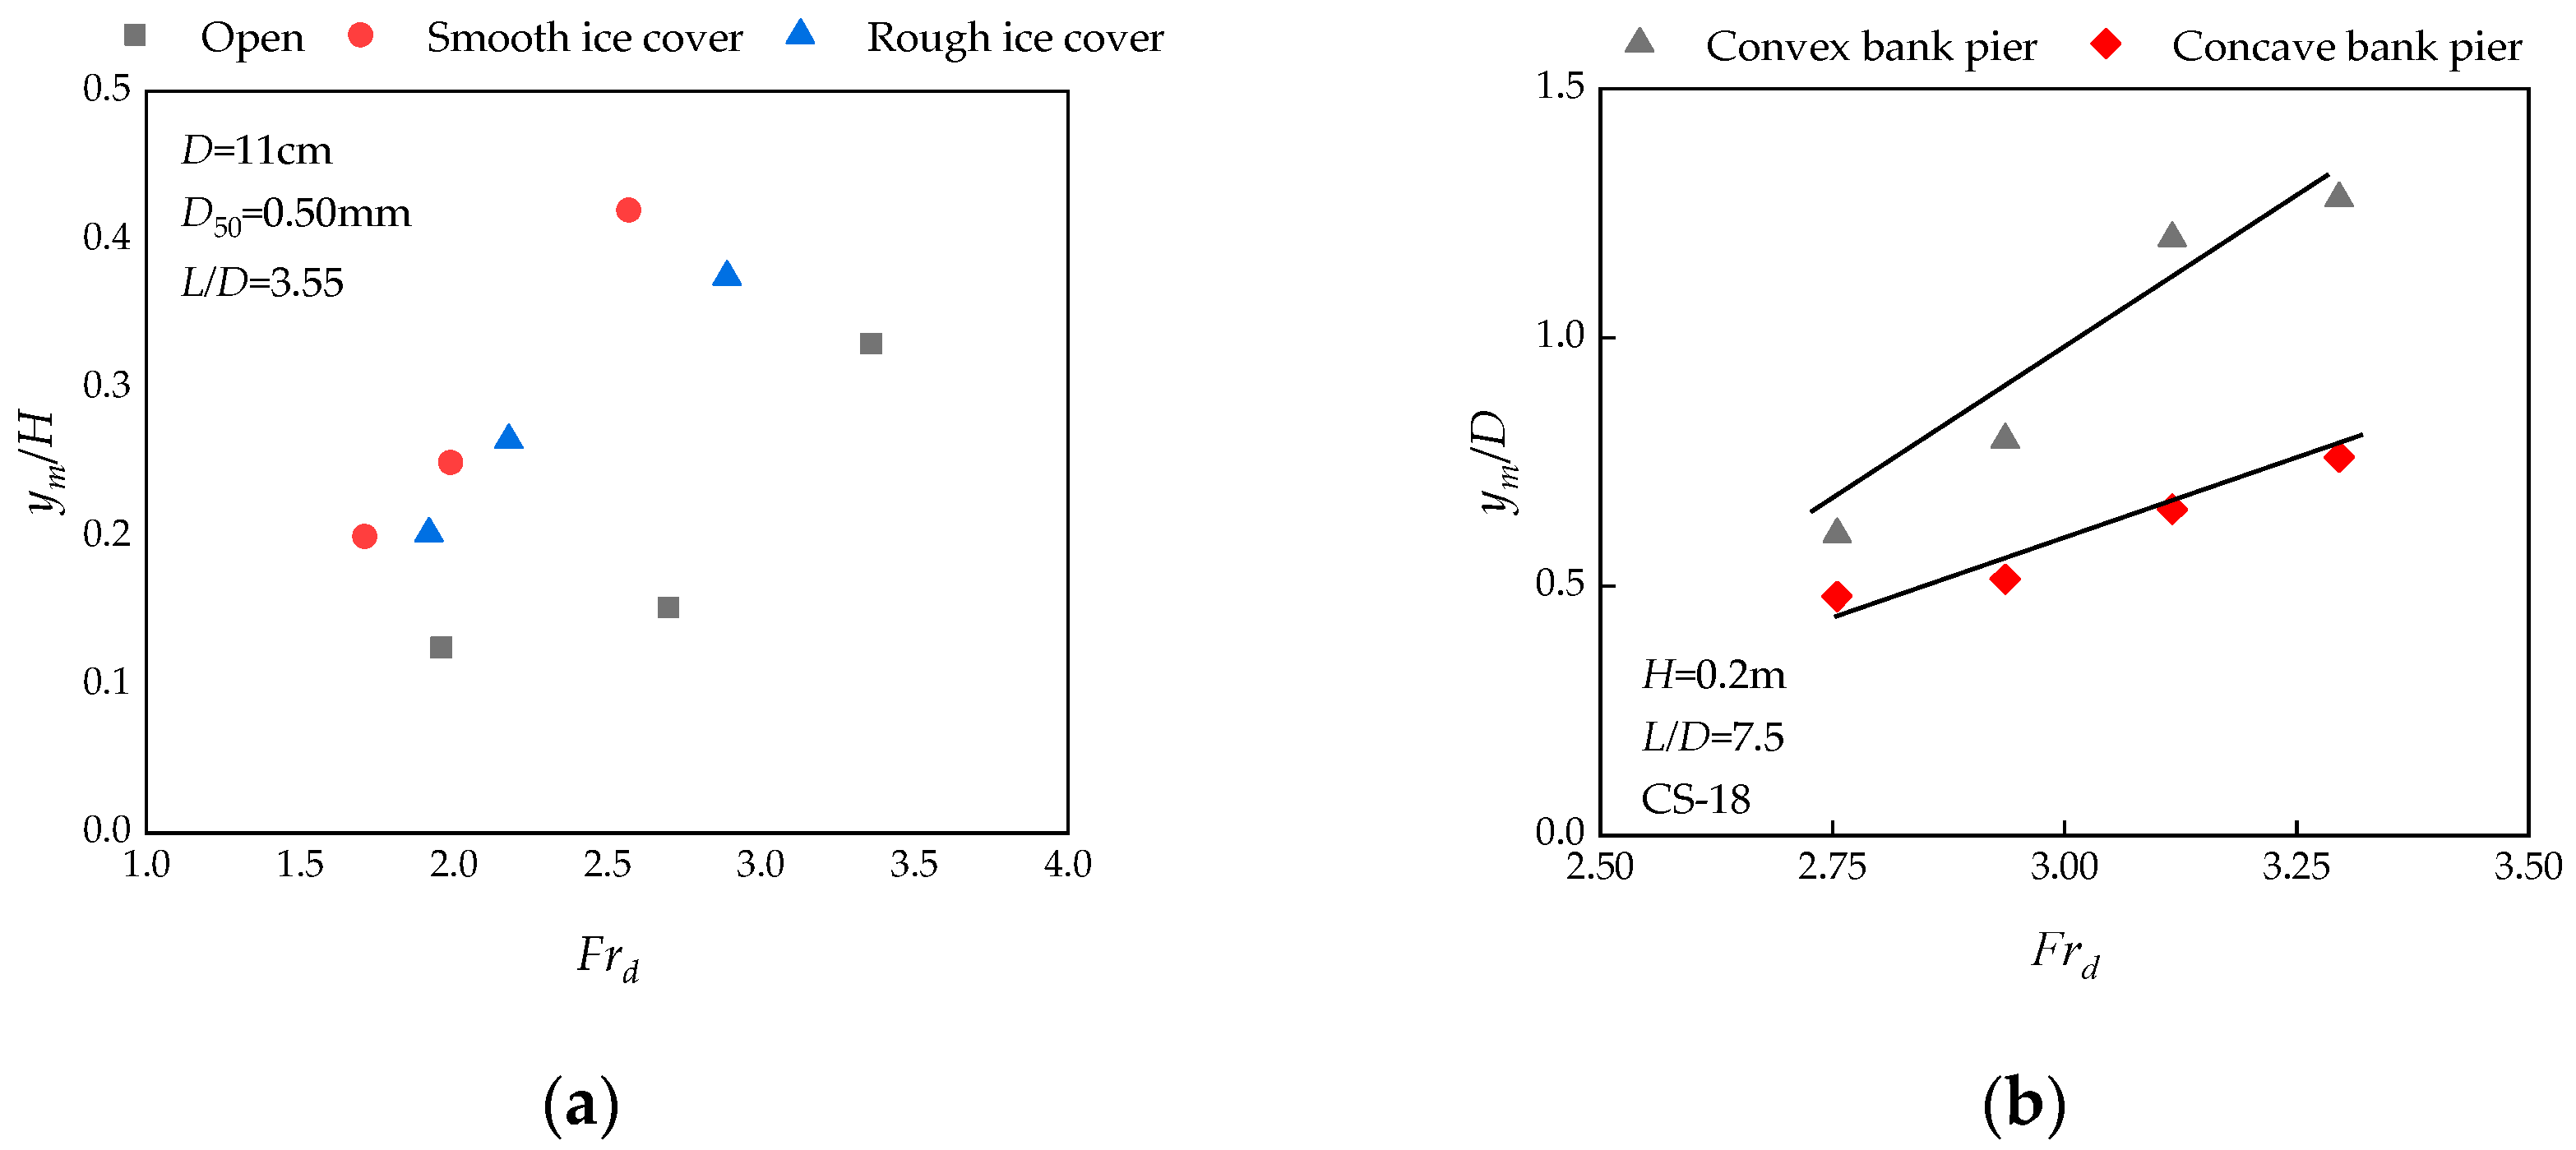
Based on the experimental data of Namaee and Sui [29], the relationship between the relative maximum local scour depth (relative MSD, calculated as ym/H) and densimetric Froude number in a straight channel was plotted, as shown in Figure 9a. Their results demonstrated that the relative MSD increased with increases in the densimetric Froude number under open channel, smooth ice-covered, and rough ice-covered conditions. The relationship between the maximum scour depth and the densimetric Froude number in the bend channel under ice-covered conditions is demonstrated in Figure 9b. Analogous to the scour deposition patterns in a straight channel, the relative local scour depth around side-by-side double piers in the bend flume increases with increases in the Frd. The slope of the fitting line between the scour depth and Frd and relative local scour depth around the convex bank pier is steeper compared to that for the concave bank pier, as illustrated in Figure 9b, suggesting that the local scour depth at the convex bank pier is more affected by the Frd.

3.4. Effect of the Pier Spacing on Local Scour

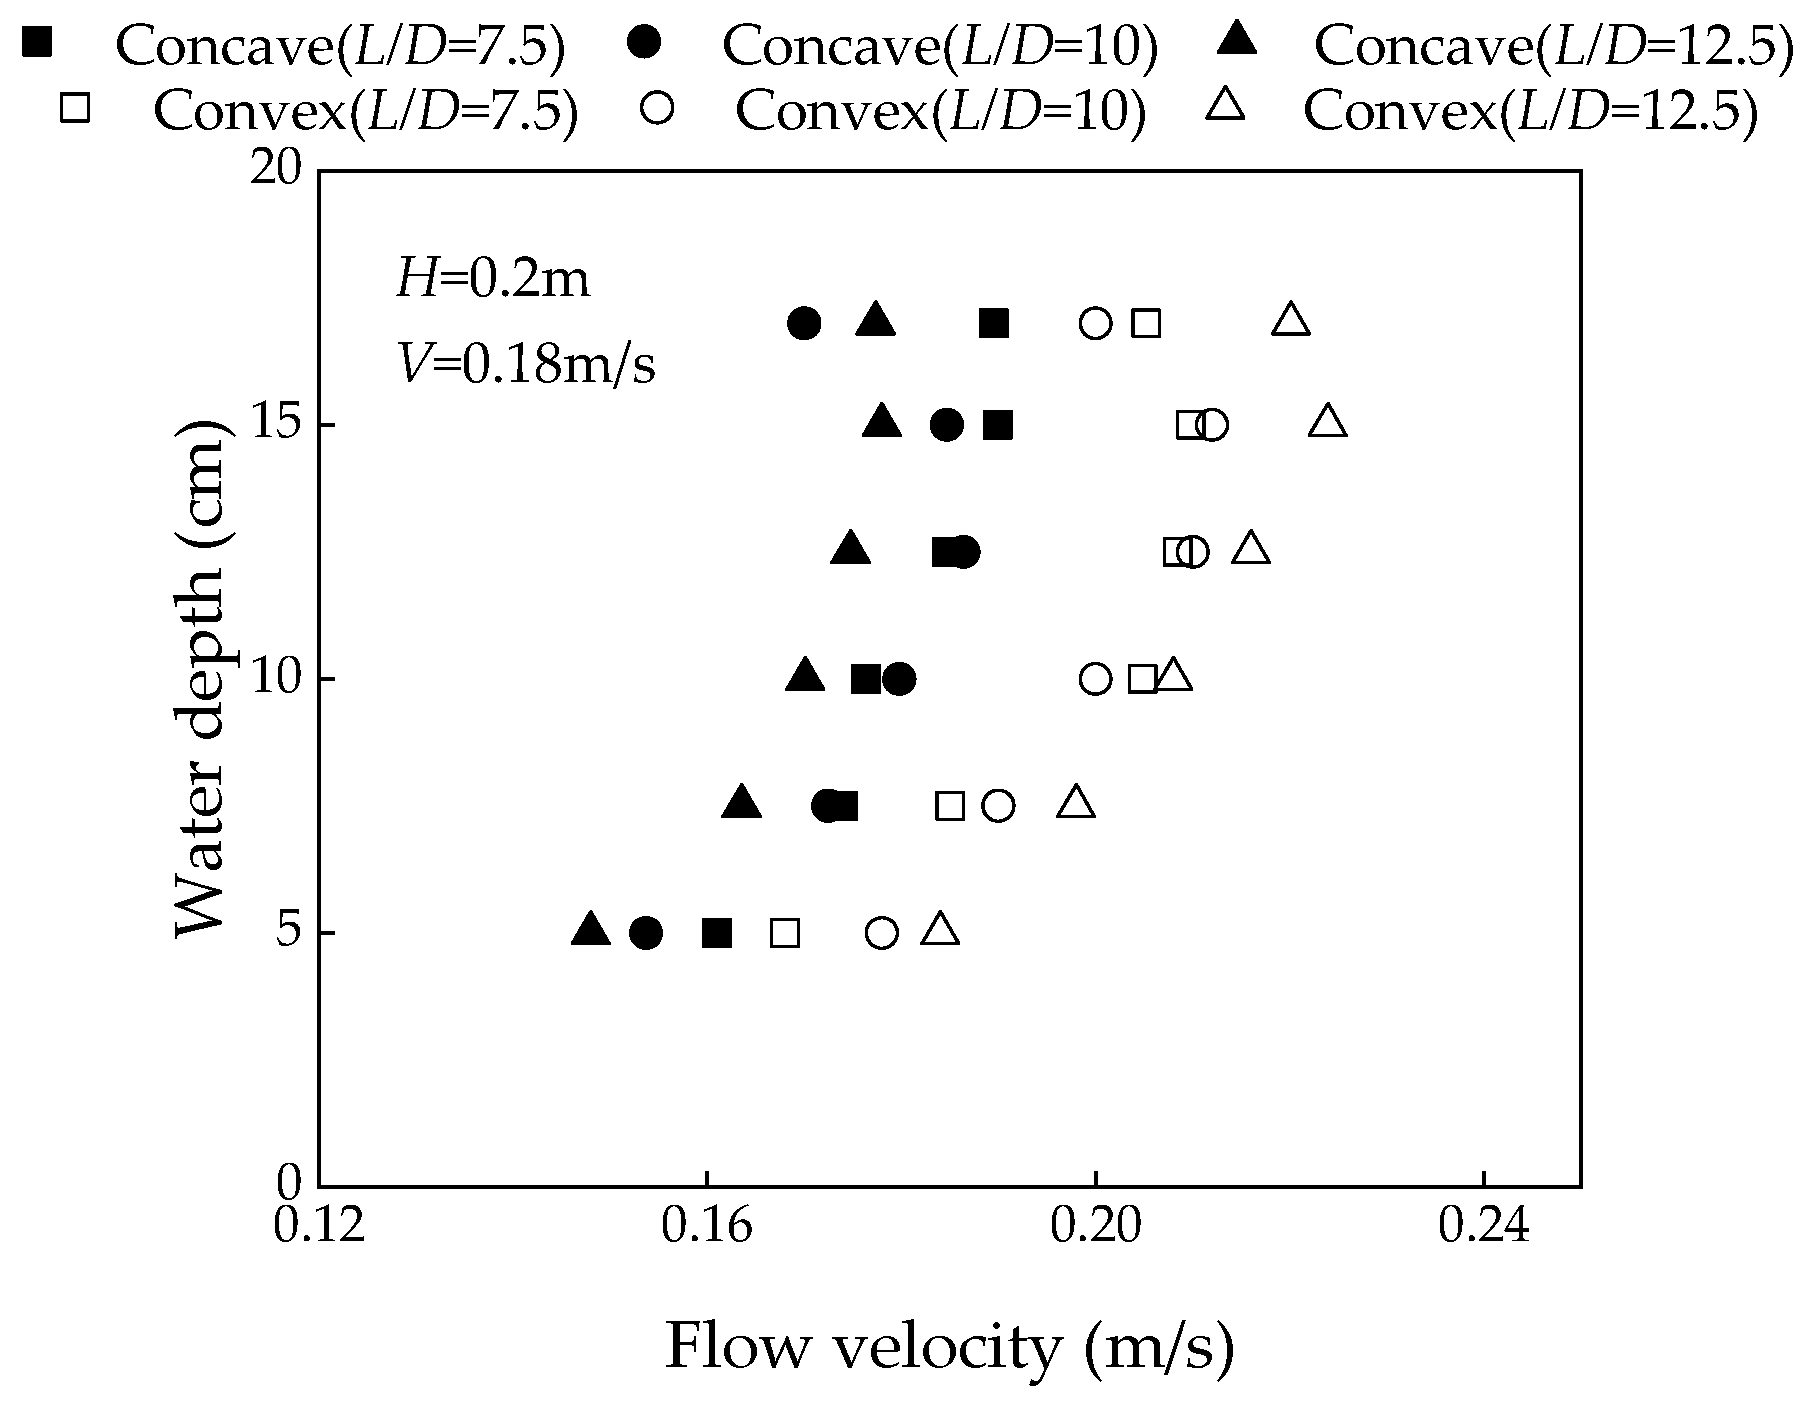
Namaee and Sui [25] investigated the relationship between the ym/H and the relative pier spacing (L/D) of side-by-side double piers in an ice-covered straight flume. It can be observed from Figure 10a that the ym/H decreased as the L/D increased. It is worth noting that the results in the bend channel were different from those acquired in the straight channel when the side-by-side double piers were placed at the bend apex cross-section of the S-shaped flume. Figure 10b shows the relationship between the maximum relative local scour depth and the pier spacing at CS-18. It can be seen from Figure 10b that the relative local scour depth is greater around the convex bank pier than that around the concave bank pier under the same experimental setups. Different from the mechanism of local scour at piers in a straight channel, the relative scour depth around the convex bank pier in the S-shaped flume increases as the pier spacing increases, but it decreases around the concave bank pier as the pier spacing increases. As can be seen from Figure 11, the depth of scour holes around the convex bank pier increases with increases in the L/D at the bend apex section because the velocity gradient in front of the pier increases, which subsequently increases the shear force of the flow, leading to more accessible transportation of the sediments by water. In contrast, the depth of scour holes around the concave bank pier decreases as the L/D increases because the velocity gradient decreases, leading to a weak horseshoe vortex strength in front of the piers.

3.5. Local Scour at Different Locations of the Side-by-Side Piers

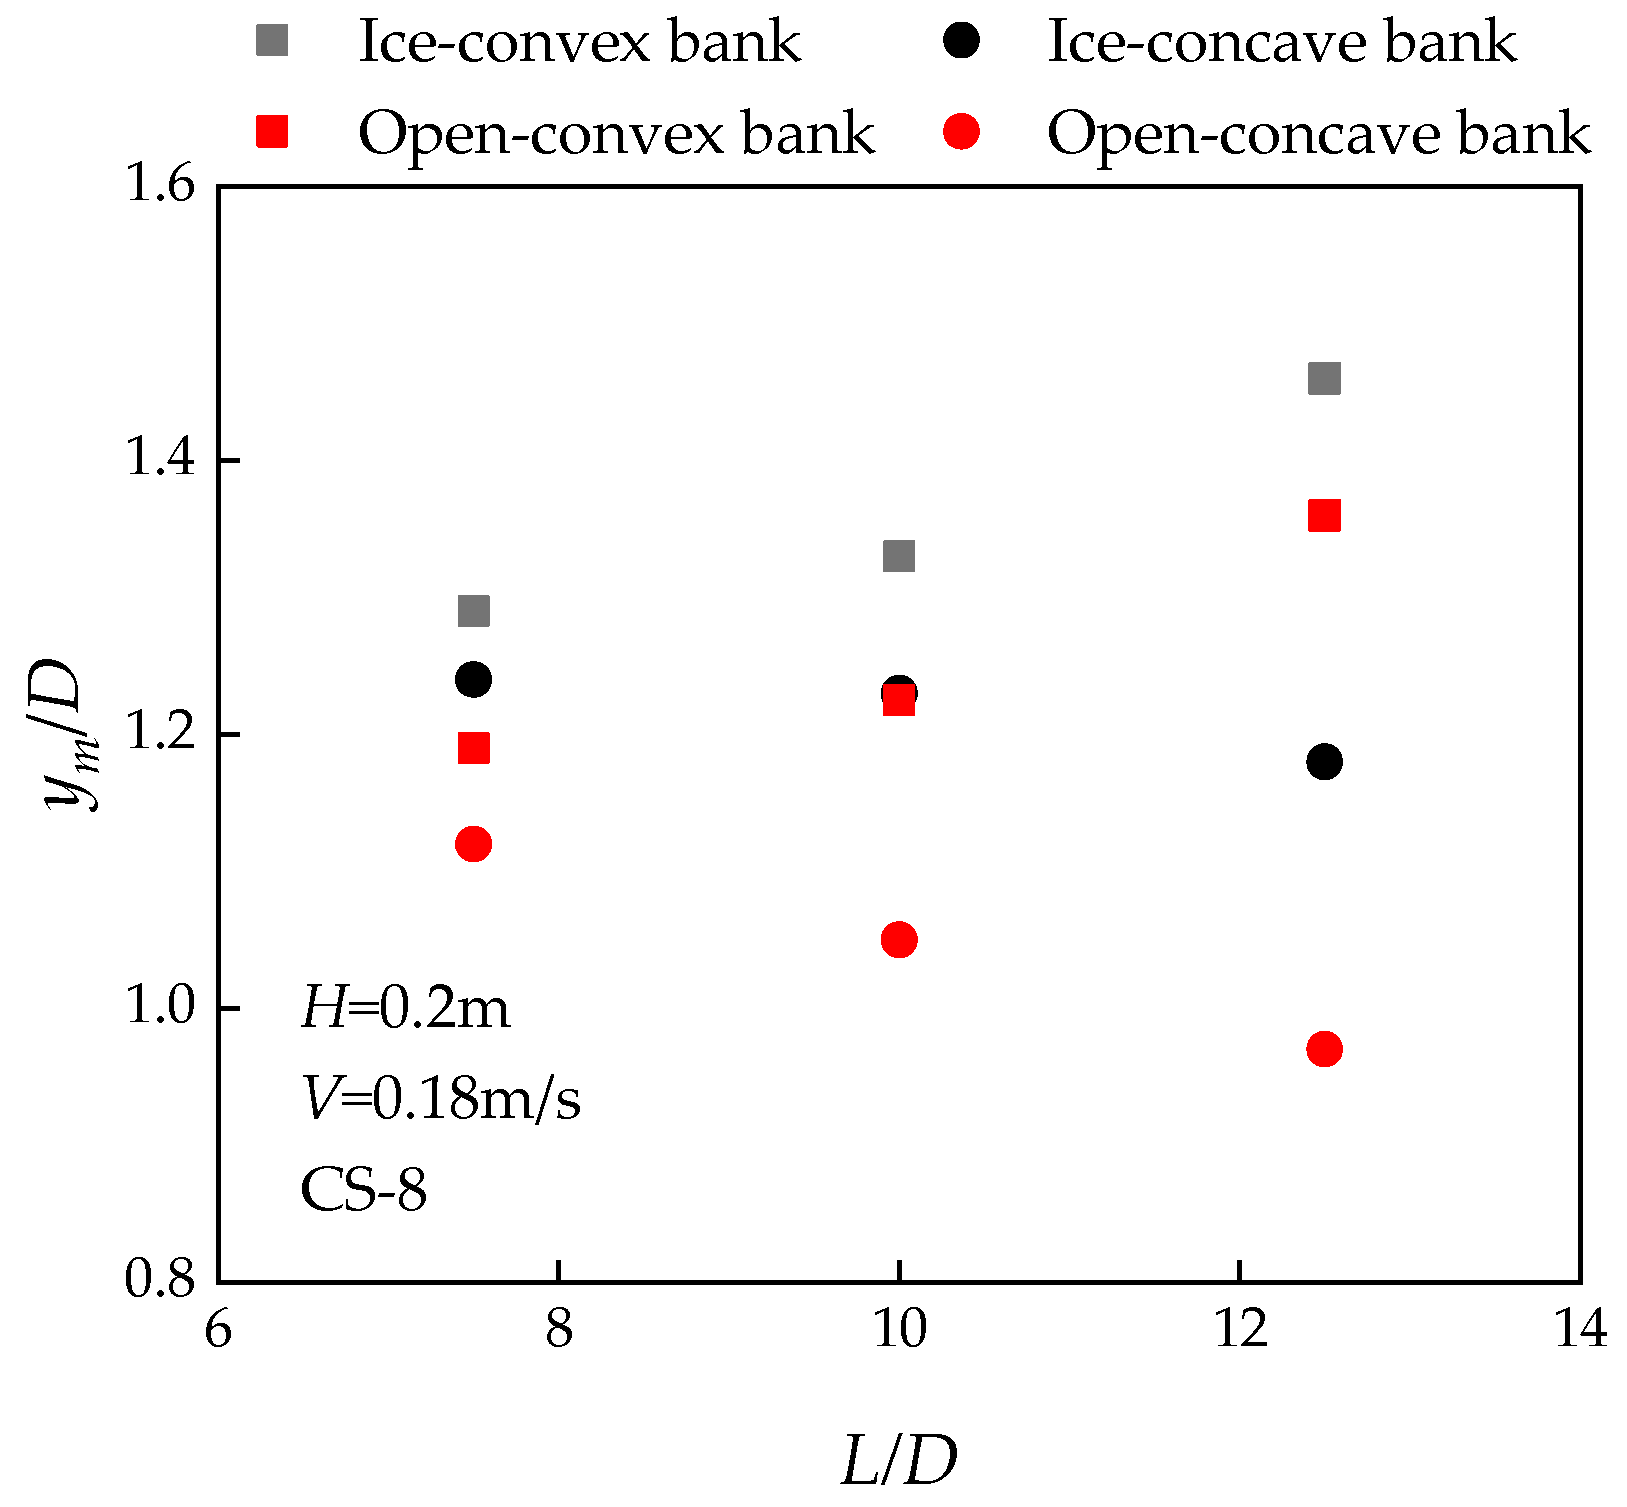
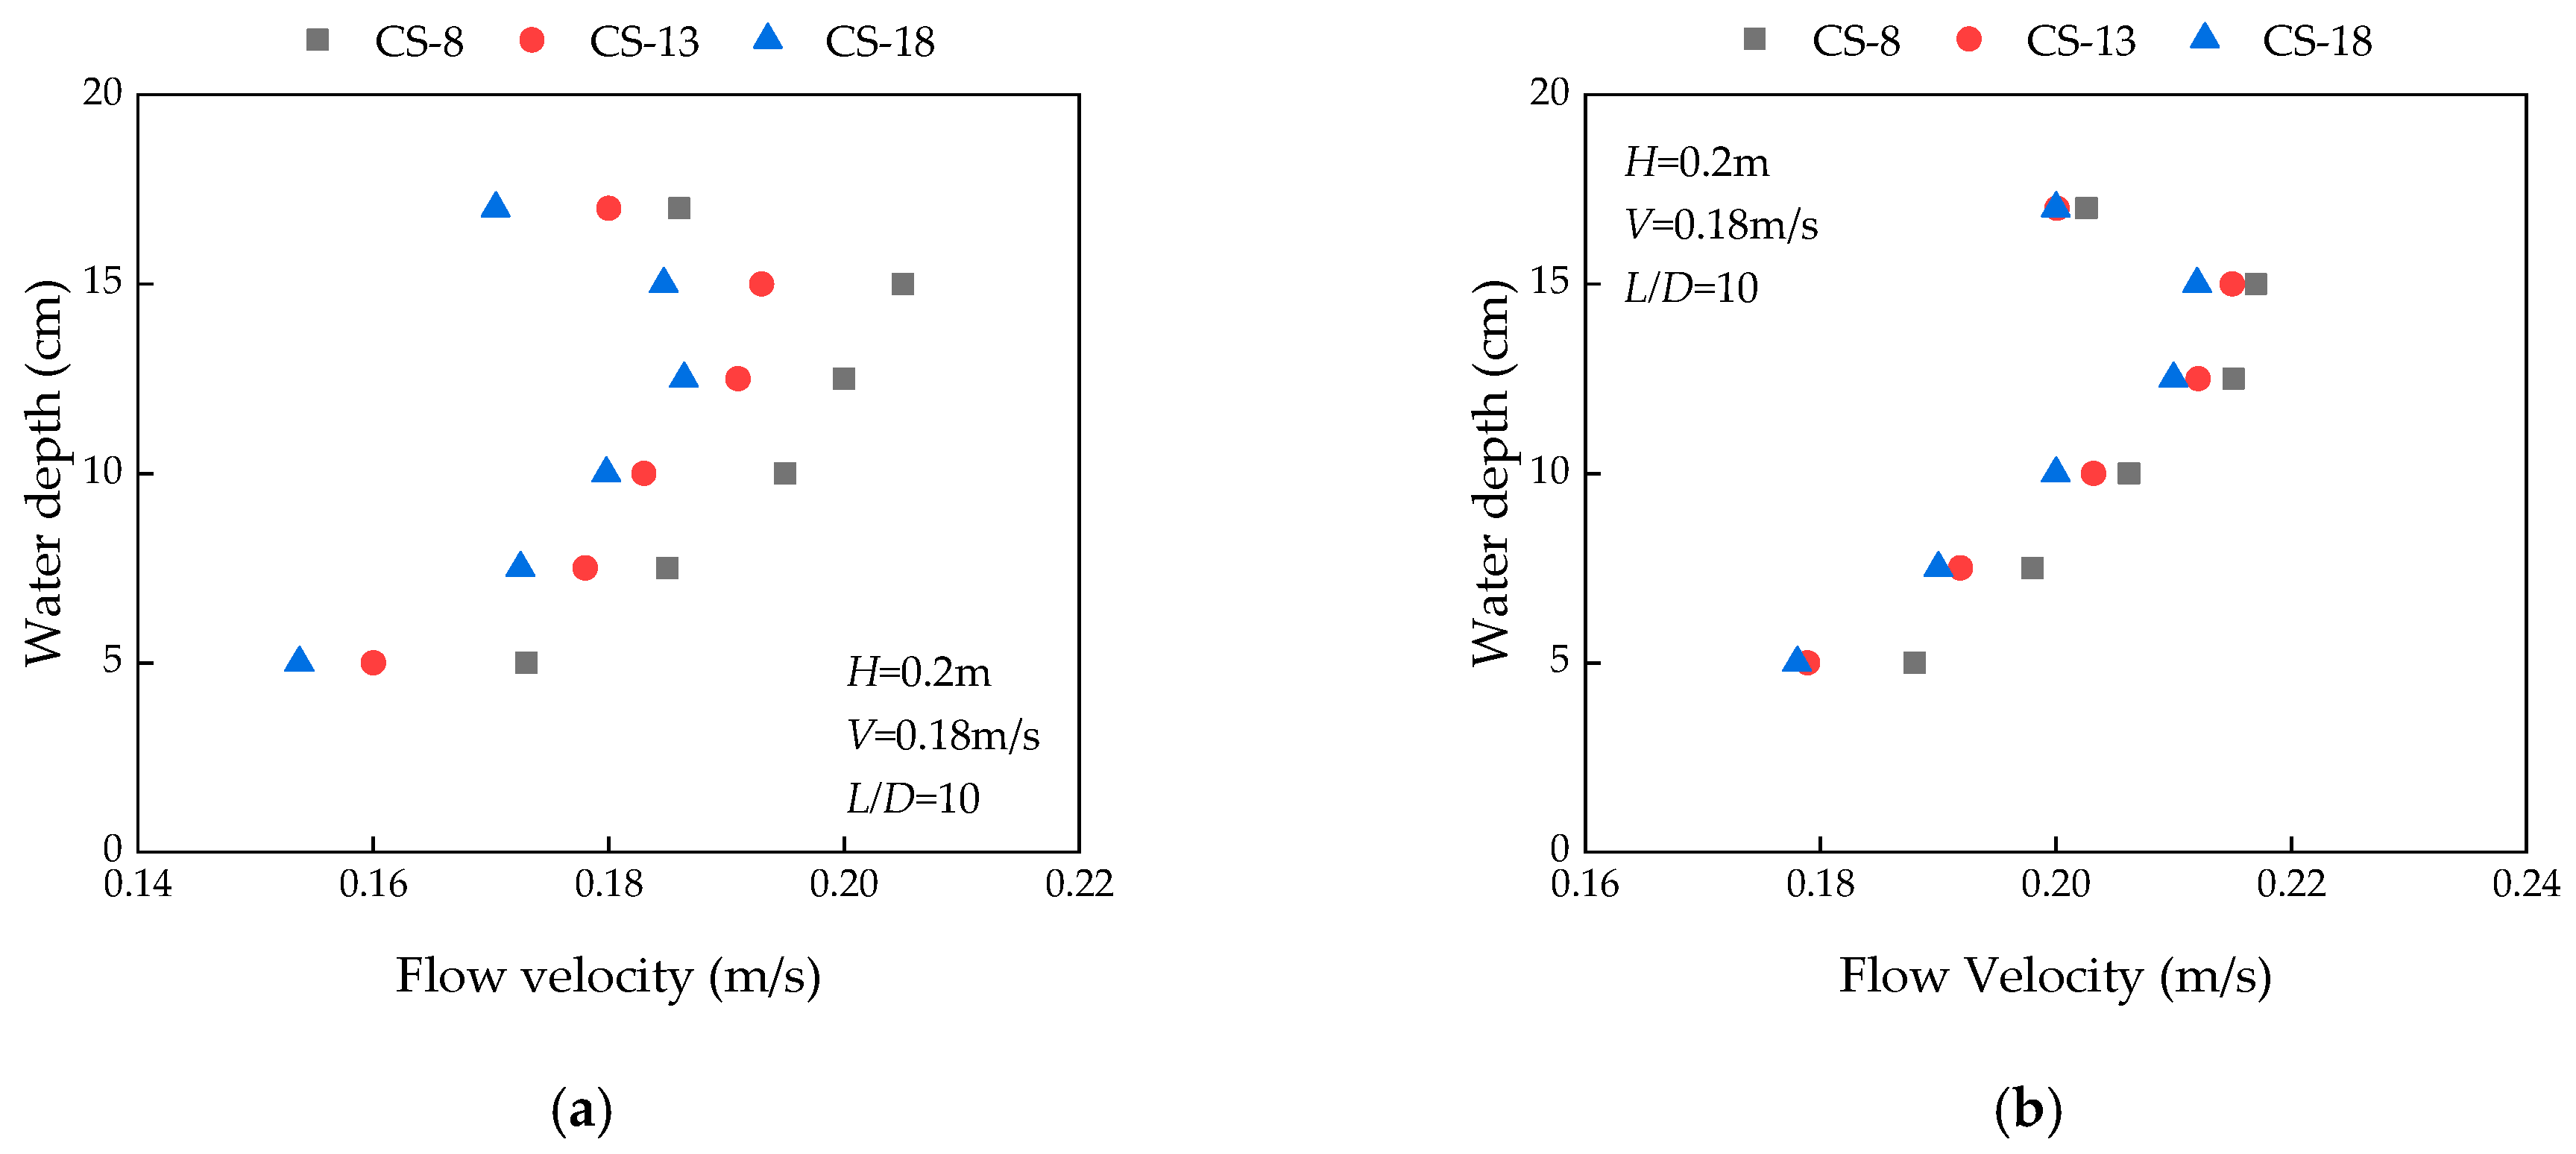
A comparison was conducted regarding the variations in scour depth when side-by-side double piers were placed at different bend apex cross-sections of the S-shaped flume. As illustrated in Figure 12, the relative local scour depths around the convex bank pier are much greater than those around the concave bank pier when the experiment setup is the same. Additionally, the relative scour depth shows an increasing trend with increases in the L/D at the convex bank and a decreasing trend with increases in the L/D at the concave bank. As shown in Figure 12, the further toward the downstream (namely, as the bends increase toward downstream), the shallower the scour hole around the concave bank pier. In contrast, the local scour depths around the convex bank pier remain virtually constant at different bend apex cross-sections. The quasi-constant scour depths around the convex bank pier are caused by energy dissipation due to the friction as the water travels downstream of the S-shaped flume. The flow velocity in front of the concave bank pier gradually decreases as the flow approaches further downstream (namely, the bend increases toward downstream), as illustrated in Figure 13a. As a result, the flow’s shear force decreases, the scouring process becomes weak, and the equilibrium scour depth decreases. The velocity distribution in front of the convex bank pier at different bend apex cross-sections is nearly identical, as depicted in Figure 13b, despite some losses in flow kinetic energy. The velocity distributions in front of the convex bank pier at different cross-sections are congruent in all cases. Therefore, the local scour depths around the convex bank pier at different bend apex cross-sections are also congruous.

3.6. Formulas for Determining the Maximum Local Scour Depth

The maximum depth of scour holes around side-by-side double piers in an S-shaped bend flume under an ice-covered condition can be expressed as follows:
y m = f V , ρ s , ρ w , d 50 , g , L , D , α , β
in which ym is the maximum local scour depth, V is the initial approaching flow velocity, ρs is the density of bed material, ρw is density of water, d50 is the median particle diameter, g is the gravitational acceleration, L is the pier spacing distance between side-by-side double piers, D is the diameter of the piers, α is the cumulative turning angle of the flow from the upstream control cross-section (CS-3) to the cross-section where the side-by-side piers are located, and β is the angle of the bend where the piers are located.
Based on of Equation (8), using dimensional analysis, the relative maximum depth of scour holes around side-by-side double piers can be described as follows:
y m D = k ( F r d ) a ( L D ) b ( α β ) c
in which k, a, b, and c are empirical constants.
The empirical constants in Equation (9) for calculating the maximum local scour depth around the side-by-side double piers in the bend flume under an ice-covered flow condition have been determined through regression analysis based on data collected from laboratory experiments.
The depth of scour holes around the convex bank pier is as follows:
y m D = 0.01 ( F r d ) 3.982 ( L D ) 0.115 ( α β ) 0.024 , R 2 = 0.98
The depth of scour holes around the concave bank pier is as follows:
y m D = 0.095 ( F r d ) 2.795 ( L D ) 0.359 ( α β ) 0.562 , R 2 = 0.91
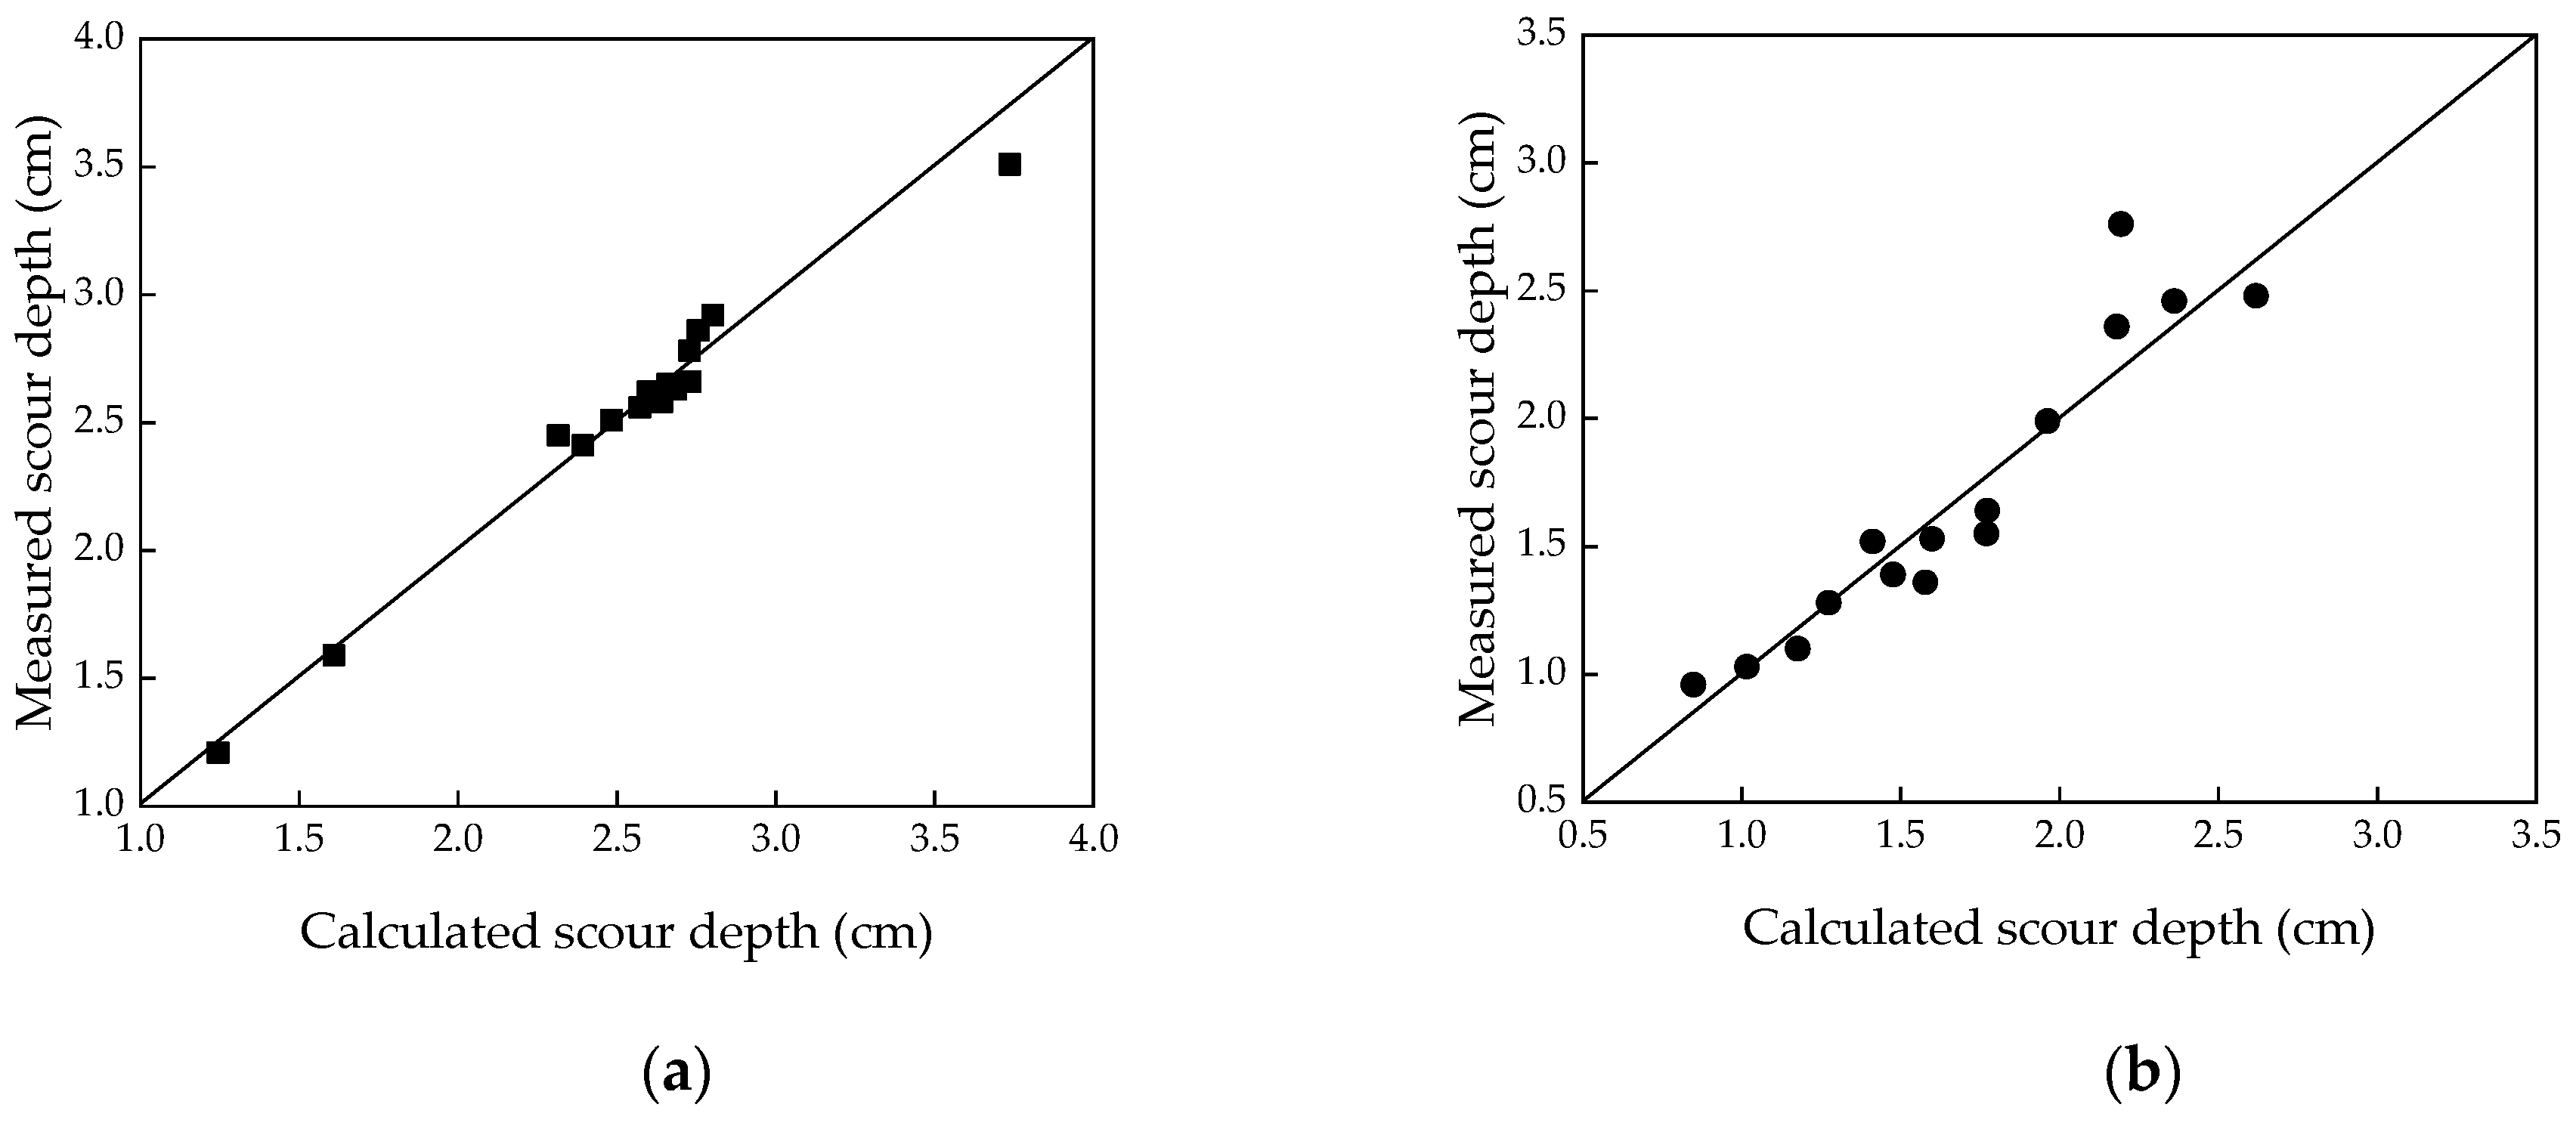
The calculated maximum scour depths have been compared to those of measurements around both the convex bank piers and the concave bank piers in the bend flume under ice-covered flow conditions, as shown in Figure 14. It is clear from Equations (10) and (11) that the power for the densimetric Froude number (Frd) is significantly higher than other factors. A greater index value demonstrates that the local scour depth is mainly influenced by the densimetric Froude number, which is consistent with the findings of Namaee and Sui [29]. In addition, the index of the Frd in formula for the convex bank piers is larger than that for the concave bank piers, which indicates that the densimetric Froude number has a greater effect on scour depth around the convex bank piers. One can see from Equations (10) and (11) that the power for the relative pier spacing (L/D) is positive for the convex bank piers but negative for the concave bank piers. This means that the relative scour depth around side-by-side double piers in the bend flume shows an increasing trend at the convex bank and decreasing trend at the concave bank as the L/D increases. It can also be seen from Equations (10) and (11) that the power for “α/β” for piers is negative. However, the power for the convex bank piers is close to “0”. One can conclude that the further toward the downstream bend, the shallower the scour hole around the concave bank pier. On the other side, the scour depth around the convex bank piers is less affected by the pier arrangement cross-sections.

4. Conclusions

Based on laboratory experiments, the local scour around side-by-side double piers in an S-shaped bend flume under ice-covered conditions has been investigated. Comparing the results of local scour around side-by-side double piers in the bend flume under ice-covered conditions to those of acquired from a straight flume, some noticeable differences have been noticed. The following findings are drawn from this experimental study:
(1)
The maximum depth of scour holes around the convex pier is more substantial than that around the concave pier. The densimetric Froude number clearly has prominent effects on the maximum depth of scour holes around the convex pier. The relative local scour depth around side-by-side double piers in the bend flume increases with increase in the Frd. The slope of the fitting line between the scour depth and Frd and relative local scour depth around the convex bank pier is steeper compared to that for the concave bank pier, suggesting that the local scour depth at the convex bank pier is more affected by the Frd.
(2)
In a straight channel, the relative maximum scour depth around piers decreased as the pier spacing increased. However, results in a bend channel were different from those acquired in the straight channel when the side-by-side double piers were placed at the bend apex cross-section. The relative scour depth around the convex bank pier in the S-shaped flume increases as the pier spacing increases, but it decreases around the concave bank pier as the pier spacing increases.
(3)
The maximum depth of scour holes around the convex bank pier at different bend apex cross-sections did not change much when all other factors were constant. In contrast, the maximum depth of scour holes around the concave bank pier decreased as the bend increased toward downstream.
(4)
The formula for determining the maximum scour depth around both convex bank piers and concave bank piers has been established considering the densimetric Froude number, pier spacing, and the ratio of the cumulative turning angle of the flow from the upstream control cross-section to the cross-section where the piers are located (α) to the angle of the bend where the piers are located (β). The results calculated using the proposed equations agree well with those of laboratory experiments.

Author Contributions

F.S.: laboratory works, data curation, formal analysis, methodology, and writing—original draft preparation; J.W.: conceptualization, laboratory supervision, methodology, funding acquisition, and writing—original draft preparation; Z.Z.: conceptualization, laboratory supervision, and methodology; T.C.: laboratory works, data curation, and investigation; G.L.: conceptualization, methodology, and writing—review and editing; J.S.: conceptualization, formal analysis, methodology, and writing—review and editing. All authors have read and agreed to the published version of the manuscript.

Funding

This research was funded by the National Key Research and Development Program of China, grant number 2022YFC3202502 and the Joint Funds of the National Natural Science Foundation of China, grant number U2243239. We are extremely grateful for the assistance provided by the National Key Research and Development Program of China and the Joint Funds of the National Natural Science Foundation of China.

Data Availability Statement

The data are available in the case that they are required.

Acknowledgments

The authors are grateful to the lab teachers for support and assistance. We are grateful to the editor and anonymous reviewers for their valuable comments and suggestions, which considerably improved this work.

Conflicts of Interest

The authors declare no conflict of interest.

References

  1. Ashton, G.D. River ice. Ann. Rev. Fluid Mech. 1978, 10, 369–392. [Google Scholar] [CrossRef]
  2. Beltaos, S.; Miller, L.; Burrell, B.C.; Sullivan, D. Formation of breakup ice jams at bridges. J. Hydraul. Eng. 2006, 132, 1229–1236. [Google Scholar] [CrossRef]
  3. Sui, J.; Wang, J.; He, Y.; Krol, F. Velocity profiles and incipient motion of frazil particles under ice cover. Int. J. Sediment Res. 2010, 25, 39–51. [Google Scholar] [CrossRef]
  4. Ettema, R.; Zabilamsky, L. Ice influences on channel stability: Insights from Missouri’s fort peck reach. J. Hydraul. Eng. 2004, 130, 279–292. [Google Scholar] [CrossRef]
  5. Chiew, Y.M.; Melville, B.W. Local scour around bridge piers. J. Hydraul. Res. 1987, 25, 15–26. [Google Scholar] [CrossRef]
  6. Melville, B.W.; Chiew, Y.M. Time scale for local scour at bridge piers. J. Hydraul. Eng. 1999, 125, 59–65. [Google Scholar] [CrossRef]
  7. Oliveto, G.; Hager, W.H. Temporal evolution of clear-water pier and abutment scour. J. Hydraul. Eng. 2002, 128, 811–820. [Google Scholar] [CrossRef]
  8. Aksoy, A.O.; Bombar, G.; Arkis, T.; Guney, M.S. Study of the time-dependent clear water scour around circular bridge piers. J. Hydrol. Hydromech. 2017, 65, 26–34. [Google Scholar] [CrossRef] [Green Version]
  9. Fael, C.; Lança, R.; Cardoso, A. Effect of pier shape and pier alignment on the equilibrium scour depth at single piers. Int. J. Sediment Res. 2016, 31, 244–250. [Google Scholar] [CrossRef]
  10. Ataie-Ashtiani, B.; Beheshti, A.A. Experimental investigation of clear-water local scour at pile groups. J. Hydraul. Eng. 2006, 132, 1100–1104. [Google Scholar] [CrossRef] [Green Version]
  11. Kim, H.S.; Nabi, M.; Kimura, I.; Shimizu, Y. Numerical investigation of local scour at two adjacent cylinders. Adv. Water Resour. 2014, 70, 131–147. [Google Scholar] [CrossRef]
  12. Malik, R.; Setia, B. Interference between pier models and its effects on scour depth. SN Appl. Sci. 2020, 2, 68. [Google Scholar] [CrossRef] [Green Version]
  13. Bordbar, A.; Sharifi, S.; Guo, Z.; Hemida, H. Estimating the equilibrium scour depth around two side-by-side piers with different spacing ratios in live-bed conditions. Ocean Eng. 2022, 257, 111641. [Google Scholar] [CrossRef]
  14. Mamoon, A.A.; Zhao, M.; Wu, H.; Keshavarzi, A. Experimental investigation of local scour around two submerged short square piles under tandem, side-by-side and staggered arrangements in steady current. Ocean Eng. 2022, 261, 112156. [Google Scholar] [CrossRef]
  15. Ackermann, N.L.; Shen, H.T.; Olsson, P. Local scour around circular piers under ice covers. Ice in the Environment. In Proceedings of the 16th IAHR International Symposium on Ice, Dunedin, New Zealand, 2–6 December 2002. [Google Scholar]
  16. Hains, D.; Zabilansky, L. Laboratory Test of Scour under Ice: Data and Preliminary Results; U.S. Army Engineer Research and Development Center, Cold Regions Research and Engineering Laboratory: Hanover, NH, USA, 2004; p. 182. [Google Scholar]
  17. Hains, D.; Zabilansky, L. The Effects of river ice on scour and sediment transport. In Proceedings of the CRIPE 13th Workshop on the Hydraulics of Ice Covered Rivers, Hanover, NH, USA, 15–16 September 2005. [Google Scholar]
  18. Wu, P.; Hirshfield, F.; Sui, J.; Wang, J.; Chen, P. Impacts of ice cover on local scour around semi-circular bridge abutment. J. Hydrodyn. 2014, 26, 10–18. [Google Scholar] [CrossRef]
  19. Wu, P.; Balachandar, R.; Sui, J. Local scour around bridge piers under ice-covered conditions. J. Hydraul. Eng. 2016, 142, 04015038. [Google Scholar] [CrossRef]
  20. Wang, J.; Li, Z.; Cheng, T.; Sui, J. Experimental study on local erosion of piers under ice cover with time. J. Hydraul. Eng. 2021, 52, 1174–1182. (In Chinese) [Google Scholar]
  21. Wang, J.; Wang, K.; Fang, B.; Sui, J. A revisit of the local scour around bridge piers under an ice-covered flow condition—An experimental study. J. Hydrodyn. 2021, 33, 928–937. [Google Scholar] [CrossRef]
  22. Wang, J.; Hou, Z.; Sun, H.; Fang, B.; Sui, J.; Karney, B. Local scour around a bridge pier under ice-jammed flow condition—An experimental study. J. Hydrol. Hydromech. 2021, 69, 275–287. [Google Scholar] [CrossRef]
  23. Hu, H.; Wang, J.; Cheng, T.; Hou, Z.; Sui, J. Channel bed deformation and ice jam evolution around bridge piers. Water 2022, 14, 1766. [Google Scholar] [CrossRef]
  24. Sang, L.; Wang, J.; Cheng, T.; Hou, Z.; Sui, J. Local Scour around Tandem Double Piers under an Ice Cover. Water 2022, 14, 1168. [Google Scholar] [CrossRef]
  25. Namaee, M.R.; Sui, J. Local scour around two side-by-side cylindrical bridge piers under ice-covered conditions. Int. J. Sediment Res. 2019, 34, 355–367. [Google Scholar] [CrossRef]
  26. Namaee, M.R.; Sui, J.; Wu, Y.; Linklater, N. Three-dimensional numerical simulation of local scour around circular side-by-side bridge piers with ice cover. Can. J. Civ. Eng. 2021, 48, 1335–1353. [Google Scholar] [CrossRef]
  27. Chiew, Y.M. Local Scour at Bridge Piers. Ph.D. Thesis, Auckland University, Auckland, New Zealand, 1984. [Google Scholar]
  28. Sheppard, D.M.; Melville, B.; Demir, H. Evaluation of existing equations for local scour at bridge piers. J. Hydraul. Eng. 2014, 140, 14–23. [Google Scholar] [CrossRef]
  29. Namaee, M.R.; Sui, J. Impact of armour layer on the depth of scour hole around side-by-side bridge piers under ice-covered flow condition. J. Hydrol. Hydromech. 2019, 67, 240–251. [Google Scholar] [CrossRef] [Green Version]
Figure 1. Plan view of the S-shaped bend flume (unit: mm).
Water 15 02317 g001
Figure 2. Layout of side-by-side double piers (“D” represents the piers diameter and “L” represents the spacing distance between the piers.).
Water 15 02317 g002
Figure 3. Measurement of flow velocities in front of the piers using an ADV.
Water 15 02317 g003
Figure 4. Temporal variation of scour holes around side-by-side double piers at CS-8: (a) after 30 min time elapsed; (b) after 60 min time elapsed; (c) after 300 min time elapsed.
Water 15 02317 g004
Figure 5. Contour map for scour holes and deposition dunes around double piers at CS-18.
Water 15 02317 g005
Figure 6. Variation in local scour depth around side-by-side double piers at CS-18: (a) L/D = 10; (b) L/D = 12.5.
Water 15 02317 g006
Figure 7. Streamwise velocity distribution under open flow condition compared to that under ice-covered flow conditions at CS-8.
Water 15 02317 g007
Figure 8. Relative scour depth under open flow condition compared to that under ice-covered condition at CS-8.
Water 15 02317 g008
Figure 9. Relationship between relative scour depth and densimetric Froude number: (a) in the straight channel; (b) in the bend channel.
Water 15 02317 g009
Figure 10. Relationship between relative scour depth and pier distance: (a) in a straight channel; (b) in the bend flume.
Water 15 02317 g010
Figure 11. Vertical distribution of streamwise velocity in front of side-by-side double piers with different pier spacing at CS-18.
Water 15 02317 g011
Figure 12. Relative local scour depths at different bend apex cross-sections.
Water 15 02317 g012
Figure 13. Velocity distribution in front of the side-by-side double piers at different bend apex cross-sections: (a) the concave bank piers; (b) the convex bank piers.
Water 15 02317 g013
Figure 14. Comparison of the calculated scour depths to those of measurements around the side-by-side double piers: (a) convex bank pier; (b) concave bank pier.
Water 15 02317 g014
Table 1. Summary of experimental setups.
Experiment RunsPier Location
Cross-Section
Approach Flow
Depth H (m)
Approach Flow Velocity V (m/s)Pier Diameter
D (m)
Pier Spacing
L (m)
A1CS-80.20.180.020.15
A2CS-80.20.180.020.20
A3CS-80.20.180.020.25
A4CS-130.20.180.020.15
A5CS-130.20.180.020.20
A6CS-130.20.180.020.25
A7CS-180.20.180.020.06
A8CS-180.20.180.020.08
A9CS-180.20.180.020.11
A10CS-180.20.180.020.15
A11CS-180.20.180.020.20
A12CS-180.20.180.020.25
A13CS-180.20.150.020.15
A14CS-180.20.160.020.15
A15CS-180.20.170.020.15
A16CS-180.20.200.020.10
B1CS-80.20.180.020.15
B2CS-80.20.180.020.20
B3CS-80.20.180.020.25
Disclaimer/Publisher’s Note: The statements, opinions and data contained in all publications are solely those of the individual author(s) and contributor(s) and not of MDPI and/or the editor(s). MDPI and/or the editor(s) disclaim responsibility for any injury to people or property resulting from any ideas, methods, instructions or products referred to in the content.