Article

Phytoplankton Diversity and Co-Dependency in a Stratified Oligotrophic Ecosystem in the South Adriatic Sea

1
Department of Biology, Faculty of Science, University of Zagreb, 10000 Zagreb, Croatia
2
Department of Integrative Marine Ecology, Stazione Zoologica Anton Dohrn, Villa Comunale, 80121 Naples, Italy
3
GEOMAR Helmholtz Centre for Ocean Research Kiel, 24148 Kiel, Germany
4
Institute of Oceanography and Fisheries, 21000 Split, Croatia
5
Marine Explorers Society 20.000 Leagues, 23000 Zadar, Croatia
6
Division for Marine and Environmental Research, Ruđer Bošković Institute, 10000 Zagreb, Croatia
*
Author to whom correspondence should be addressed.
Water 2023, 15(12), 2299; https://doi.org/10.3390/w15122299
Submission received: 21 March 2023 / Revised: 12 June 2023 / Accepted: 15 June 2023 / Published: 20 June 2023
(This article belongs to the Special Issue Marine Phytoplankton Diversity)

Abstract

:
The oligotrophy of the southern Adriatic Sea is characterized by seasonal stratification which enables nutrient supply to the euphotic layer. A set of interdisciplinary methods was used to elucidate the diversity and co-dependency of bacterio- and phytoplankton of the water column during the stratification period of July 2021. A total of 95 taxa were determined by microscopy: 58 diatoms, 27 dinoflagellates, 6 coccolithophores, and 4 other autotrophs, which included Chlorophyceae, Chrysophyceae, and Cryptophytes. Nanophytoplankton abundances were higher in comparison to microphytoplankton. The prokaryotic plankton community as revealed by HTS was dominated by Proteobacteria (41–73%), Bacteroidota (9.5–27%), and cyanobacteria (1–10%), while the eukaryotic plankton community was composed of parasitic Syndiniales (45–80%), Ochrophyta (2–18%), Ciliophora (2–21%), Chlorophytes (2–4%), Haptophytes (1–4%), Bacillariophyta (1–13%), Pelagophyta (0.5–12%) and Chrysophyta (0.5–3%). Flow cytometry analysis has recorded Prochlorococcus and photosynthetic picoeukaryotes as more abundant in deep chlorophyll maximum (DCM), and Synechococcus and heterotrophic bacteria as most abundant in surface and thermocline layers. Surface, thermocline, and DCM layers were distinct considering community diversity, temperature, and nutrient correlations, while extreme nutrient values at the beginning of the investigating period indicated a possible nutrient flux. Nutrient and temperature were recognized as the main environmental drivers of phytoplankton and bacterioplankton community abundance.

1. Introduction

Distribution patterns of primary producers are determined by a combination of physico-chemical (e.g., light availability, nutrient supply, water column stratification) and biological processes (e.g., microbial activity, grazing, viral lysis) [1]. Due to ongoing climate change, which is progressively warming the ocean, we are witnessing more stratified water columns with a decrease in mixing and subsurface nutrient supply to the euphotic layer. It is important to understand the mechanisms of nutrient supply and to identify potential hot spot regions of enhanced net primary production, for example, along shelf breaks, in upwelling regions and areas of enhanced dynamic mixing.
The climatically temperate Adriatic Sea experiences a bimodal seasonal variability in phytoplankton biomass, typically with maxima in spring and autumn [2,3]. While picophytoplankton dominates the phytoplankton community in the southern Adriatic Sea and appears to be the overall dominant primary producer [4,5], microphytoplankton production is restricted to coastal waters, the deep chlorophyll maximum (DCM), and periods during or following winter convection [6,7,8,9]. Winters in the southern Adriatic Sea are characterized by convection events and vertical mixing that occur regularly, supporting nutrient supply to surface waters that facilitates phytoplankton development [6,7,9]. Ultimately, these larger scale physical processes impact the whole food web of exceptionally high summer anchovy catches following a higher than usual abundance of phytoplankton in the winter of 2015 [10].
Upwelling on the Palagruža Sill was detected by enhanced nutrient concentrations and abundance of primary producers [10]. Similarly, a small peak in nutrient concentrations and nano- and picophytoplankton abundance was recorded close to the Lastovo Island cliffs, indicating a possible upwelling effect near the island [5,10]. However, satellite images do not show enhanced primary production under stratified conditions (Mihanović, personal communication). A possible explanation may be a rapid uptake of nutrients with efficient, almost instant, removal of primary producers by zooplankton under oligotrophic conditions [11]. In a flexible biome, such as the one of the Adriatic Sea, the first signals of climate-driven changes might be represented by the spatial reorganization of communities [12]. These findings suggest that climate change might be impacting the biological structure of this basin more rapidly as compared to the large oceans, suggesting the Adriatic Sea as an ideal environment model for plankton diversity and co-dependency investigations.
Recently, an interesting oceanographic phenomenon, known as island-trapped waves (ITW), has been recognized around Lastovo Island in the Adriatic Sea [13,14], making it together with Bermuda [15,16], Hawaii [17,18], Gotland in the Baltic Sea [19], and Saint Pierre and Miquelon archipelago in the northwestern Atlantic Ocean [20], one of the only islands in the world where such waves were observed. The link between those physical processes and ecosystem diversity and functioning has not yet been fully explored and described. The significance of this study is to explain phytoplankton/bacterioplankton diversity and co-dependency in the ecosystem of Lastovo Island to have a basis for comparison of the ecosystem response to observed island effects. Therefore, the aims of the study are as follows: (1) to investigate phytoplankton and bacterioplankton diversity in an oligotrophic ecosystem of the Adriatic Sea during a period of water column stratification, and (2) to analyse the co-dependency of phytoplankton and bacterioplankton communities.

2. Materials and Methods
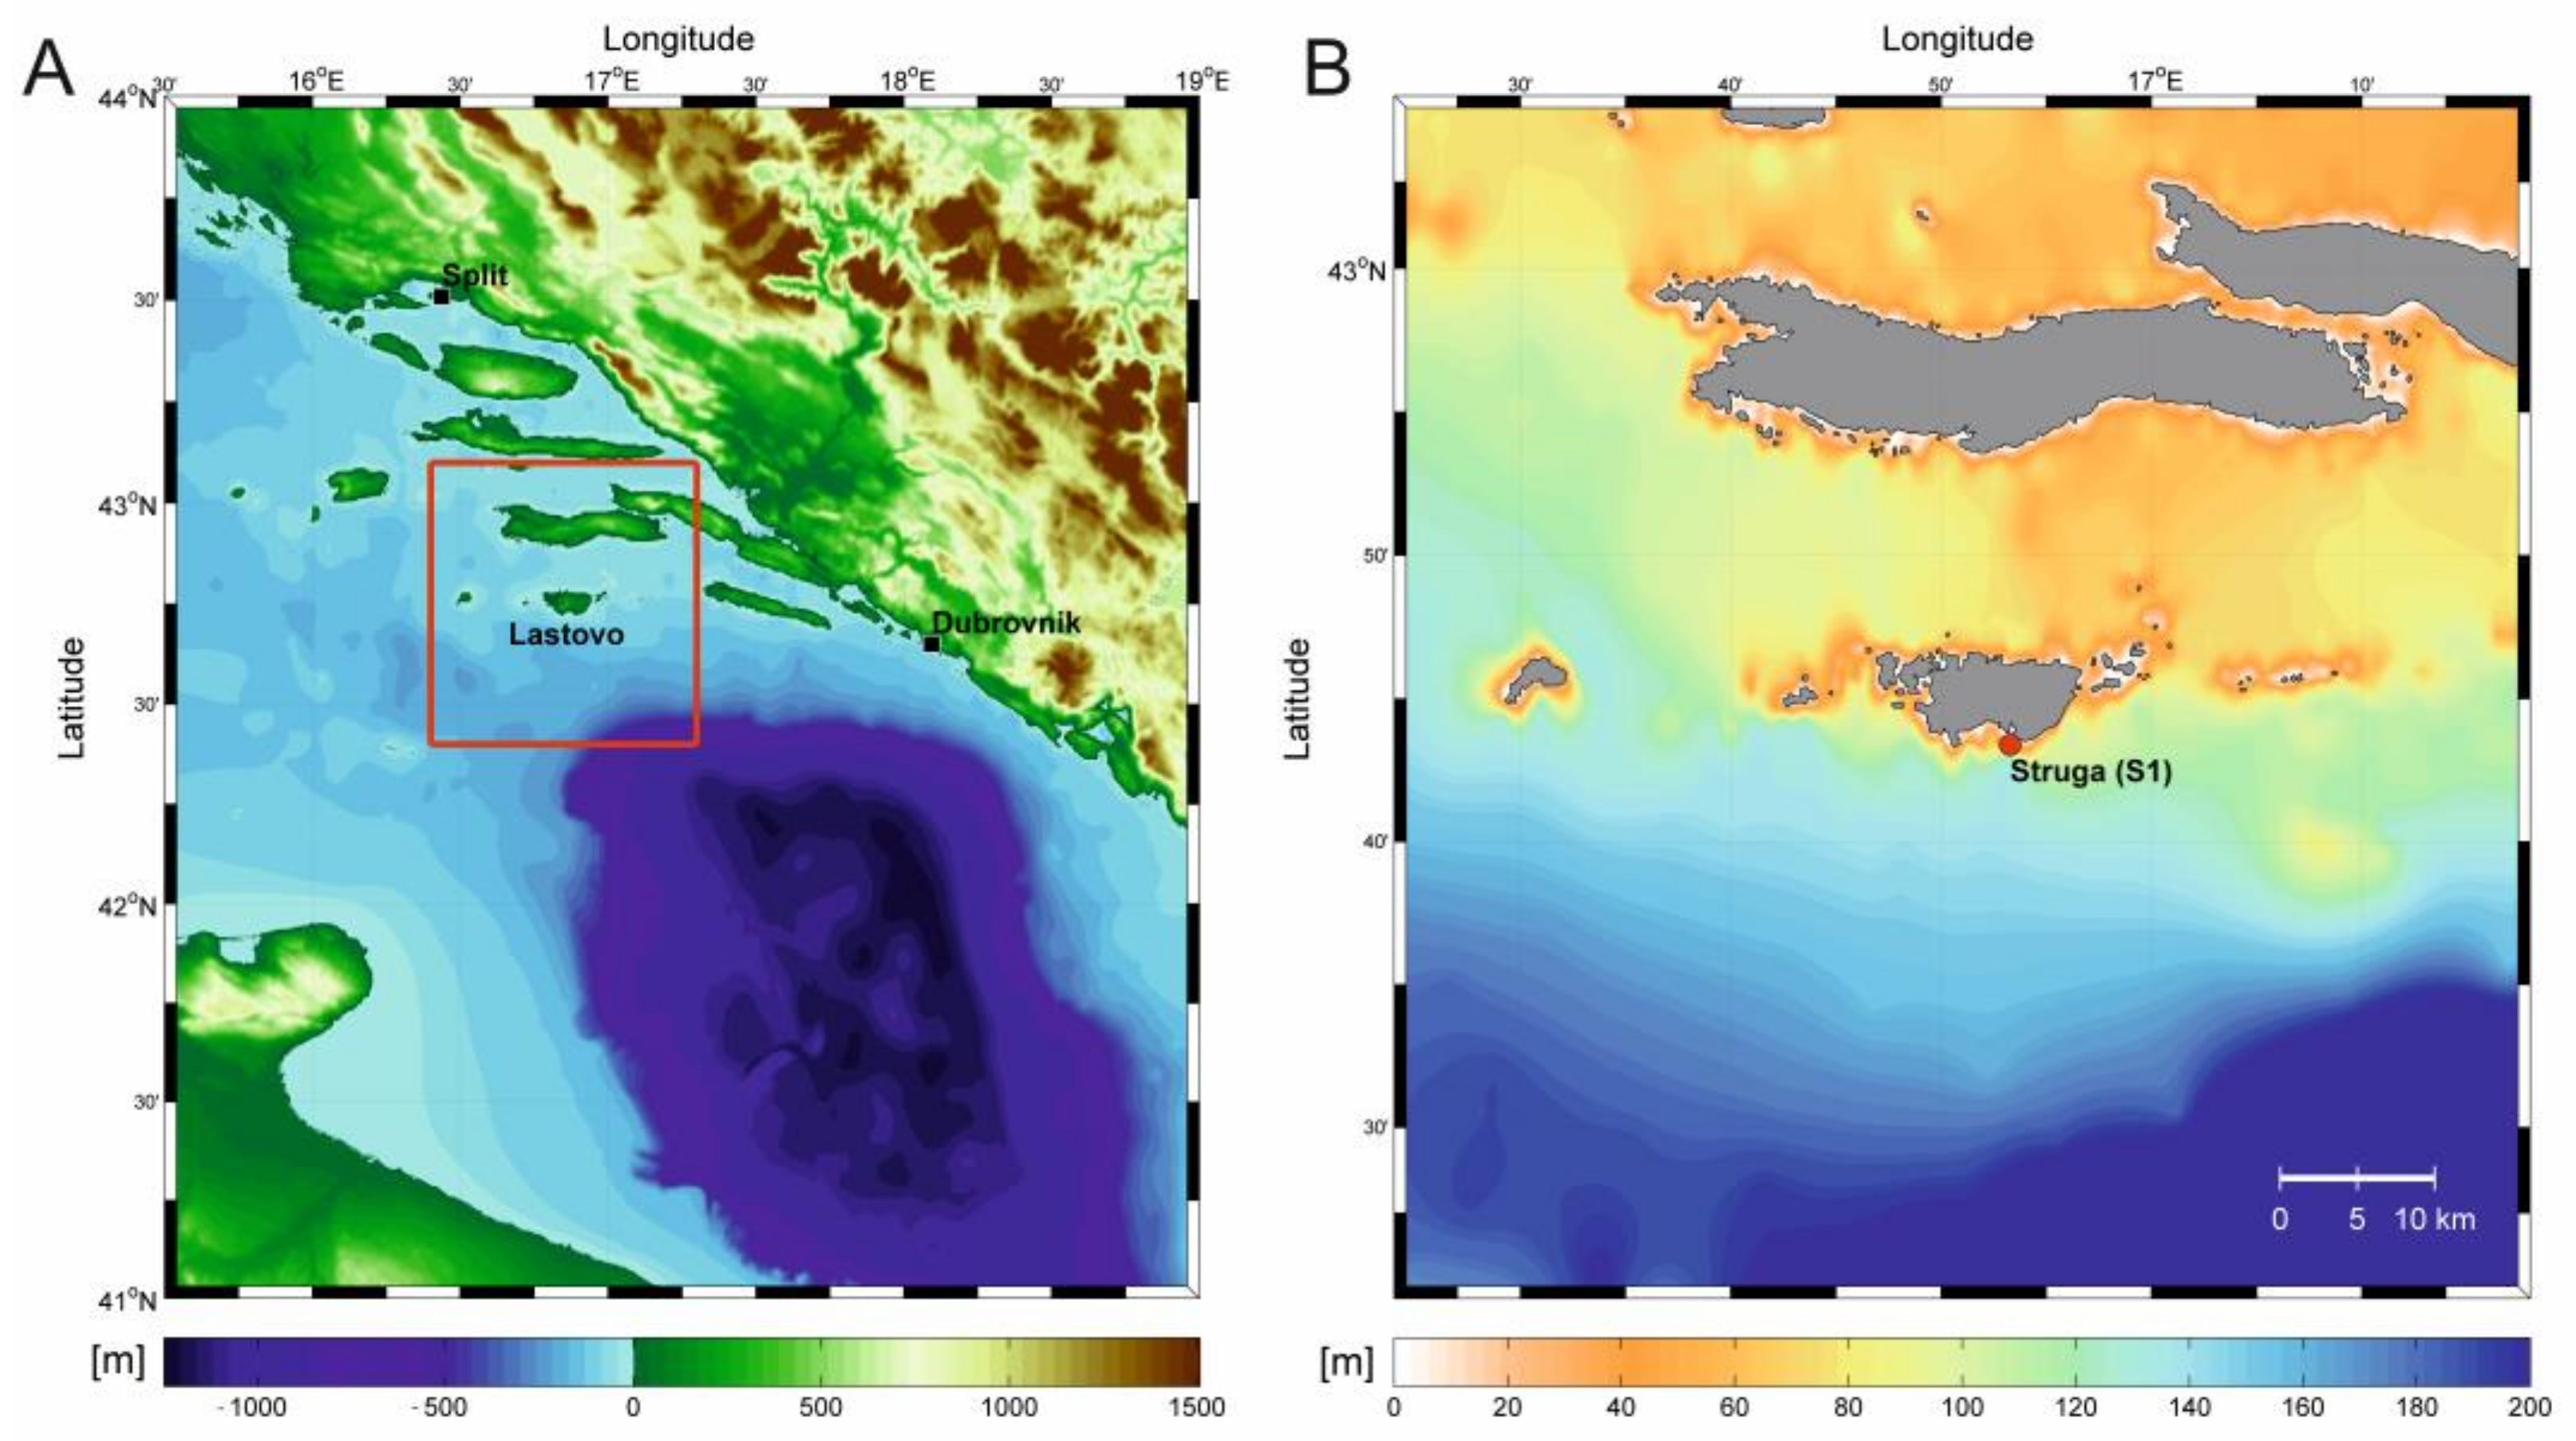
2.1. Study Area

The Adriatic Sea is a semi-enclosed oligotrophic basin approximately 800 km long and 200 km wide and is elongated in a northwest–southeast direction. It is of interest due to its numerous large and small islands and islets along the eastern coast. Lastovo Island, located in the southern part of the middle Adriatic Sea island group, is characterized by very steep island sides and has average depths reaching 70 m at about 300 m from the island (Figure 1).
Physical processes relevant for the island of Lastovo include resonantly excited diurnal internal waves that revolve around the island in a clockwise direction (island-trapped waves). These waves result in diurnal thermocline oscillations ranging up to 30 m during stratification periods [21]. The lower diversity of bryozoans and other benthic organisms between the surface and 40 m depth at Lastovo’s submersed cliffs compared with other Adriatic locations is thought to be due to large diurnal and intertidal temperature fluctuations during the summer stratification periods [21,22]. Additionally, in the area around Lastovo Island, relatively high chlorophyll a (Chl a) concentrations were recorded [10,23], which contrasts with other parts of the oligotrophic southern Adriatic Sea [4,8,23,24].

2.2. Sampling

During the stratification period in 2021, a set of thermistors was deployed at nine equidistant depths between 5 and 45 m at the rocky cliffs of Lastovo Island (Figure 1). Six loggers were recovered at the end of measurement period, as loggers positioned at 15, 25, and 40 m were either missing or not functioning properly. The measurement interval was 5 min. A ship-based survey was conducted in the period from 12 to 21 July 2021. T–S–Chl F (temperature, salinity, Chl a fluorescence) profiles were measured using an SBE 25 CTD probe (Sea-Bird Electronics Inc., Bellevue, WA, USA) twice a day, at around 06:00 (UTC+2), when a deep thermocline was expected at the location, and at around 18:00 (UTC+2), when a shallow thermocline was expected. Complementary to the CTD casts, water samples for flow cytometry, nutrient, Chl a, and phytoplankton analyses were collected using 5 L Niskin bottles at one station at depths determined in situ based on the position of the thermocline (Supplementary Table S1). Samples for flow cytometry measurements of picoplankton abundance were taken in duplicate, where 1.5 mL of sample was fixed with 100 µL of glutaraldehyde (36%), deep frozen in liquid nitrogen, and stored at −80 °C until analysis.
Triplicates of 15 mL sample were taken for nutrient analysis, filtered through a 0.2 μm syringe filter, fixed with 30 µL of 6 M HCl, and stored in the dark and cold until the analysis in the laboratory. Samples of 1 L volume for Chl a analysis were filtered in situ using 0.7 μm pore size Whatman GF/Fs (Cytiva Whatman glass microfiber filters, Marlborough, MA, USA) and preserved in –80 °C liquid nitrogen until the analysis.
Discrete and net phytoplankton samples were fixed with 2% neutralized formaldehyde and stored in 250 mL bottles until analysis in the laboratory. Water samples for environmental DNA (eDNA) extraction and small ribosomal units of bacteria and eukaryote (16S rRNA and 18S rRNA genes) analysis were taken with Niskin bottles from surface (0 m) and DCM (75 m) waters. A total of nine samples were taken: six samples on 13 of July 2021 and three samples on 20 of July 2021 (Supplementary Table S2). A large volume (approx. 6 L) of seawater was filtered through 20 µm, then 3 µm, and ultimately 0.2 µm pore-size polycarbonate filters (Cytiva Whatman Cyclopore, Marlborough, MA, USA) to obtain plankton size-fractions: pico-nanoplankton (0.2–3 µm), nanoplankton (3–20 µm), and micro-mesoplankton (>20 µm). Filters were immediately frozen in liquid nitrogen and transferred to the laboratory where they were stored at −80 °C until eDNA extraction.

2.3. Plankton Community and Nutrient Analysis

Light microscopy (LM) was used to determine microphytoplankton (>20 µm) and nanophytoplankton (2–20 µm) composition and abundance. Subsamples of 100 mL were settled for 48 h and analyzed under a Zeiss Axiovert 200 inverted microscope (Carl Zeiss microscopy GmbH, Jena, Germany) using the Utermöhl method [25]
Abundances of heterotrophic bacteria and cyanobacteria were determined on a BD FACSVerse flow cytometer (BD Biosciences, Franklin Lake, NJ, USA) equipped with a standard filter setup and with 488 nm laser excitation, as described in Babić et al., 2018 [26].
Phosphate (PO4), nitrate (NO3), nitrite (NO2), and silicic acid (SiO4) concentrations were analysed using an autoanalyzer (SEAL QuAAtro segmented flow AutoAnalyzer, SEAL Analytical GmbH, Norderstedt, Germany), with procedures as per international GO-SHIP protocols [27]. KANSO-certified reference materials were used to verify the accuracy of the analysis. Chl a was analysed by the fluorometric procedure after extraction in 90% acetone [28]. The detection limit for Chl a, considering the filtered volume of water, was 0.01 μgL−1.

2.4. eDNA Isolation, Amplicon Sequencing and Bioinformatics

eDNA was extracted from polycarbonate filters by using a DNeasy PowerSoil kit (Qiagen, Hilden, Germany), following the manufacturer’s instructions with minor changes. Modifications involved mechanical disruption by vortex on a VortexGenie 2 (Fisher Scientific, Waltham, MA, USA) for 15 min at maximum speed and incubation at 37 °C for 30 min with the addition of 2 µL of lysozyme (0.5 mg mL–1 solution). Extracted DNA yield and quality were measured by Qubit fluorometer (Thermo Fisher, Waltham, MA, USA), while the integrity of DNA was checked on 1% agarose gel. Samples of total extracted DNA were sent for 16S rRNA and 18S rRNA gene library preparation and amplicon next-generation sequencing to the FISABIO–Public Health Sequencing and Bioinformatics Service (Servicio de Secuenciación y Bioinformática, Valencia, Spain). Sequencing was performed on the Illumina MiSeq (Illumina, Chesterfield, UK) platform following the manufacturer’s guidelines. The 16S rRNA gene V4–V5 variable region was targeted by PCR primers from Earth Microbiome Project 515F and 806R primers: (FWD: 5′-GTGYCAGCMGCCGCGGTAA-3′; REV: 5′-GGACTACNVGGGTWTCTAAT-3′), while the 18S rRNA gene V4 variable region was targeted by PCR primers Reuk454FWD1 (5′-CCAGCASCYGCGGTAATTCC-3′) and ReukREV3 modified (5′-ACTTTCGTTCTTGATYRATGA-3′), with a barcode on the forward primer. The PCR program included a 28-cycle PCR using the HotStarTaq Plus Master Mix Kit (Qiagen, Germantown, MD, USA) under the following conditions: 94 °C for 3 min, followed by 28 cycles of 94 °C for 30 s, 53 °C for 40 s, and 72 °C for 1 min, with a final elongation step at 72 °C for 5 min. PCR products were visualized on 2% agarose gel to check the success of amplification and the relative intensity of bands.
Quality of raw reads was checked with FastQC ver.0.11.5. [29], after which reads were processed using QIIME 2 2021.11 [30] in a pipeline composed of several steps: importing and demultiplexing of raw sequence data, quality filtering and denoising using DADA2 plugin [31], and taxonomy assignment of the resulting amplicon sequencing variants (ASVs) using a Naïve Bayes classifier pre-trained on the latest version SILVA database for prokaryotes and the PR2 database for eukaryotes with a 99% OTU identity threshold [32]. For the 16S rRNA dataset, from a total of 1,735,345 raw reads, 1,453,307 were included in further analysis, while for the 18S rRNA dataset, from a total of 1,262,960 raw reads, 858,740 were included for further analysis. To subsample the datasets, taxa filtering was performed to exclude chloroplast, mitochondrial, and archaeal sequences from the 16S rRNA dataset and chloroplast, mitochondrial, and metazoan sequences from 18S rRNA dataset, focusing only on bacteria and cyanobacteria in the 16S dataset and true contributors to pico-, nano-, and microplankton in the 18S dataset. Further taxa filtering for 18S dataset was conducted to include only classes of taxa revealed by light microscopy (Dinophyta, Bacillariophyta, Chlorophyta, Haptophyta, and Cryptophyta), thus, showing comparable results and allowing us to compare morphological identification with 18S rRNA gene affiliation. Raw sequences are deposited in the European Nucleotide Archive (ENA) under project number PRJEB59876.
The cladogram (tree containing representative sequences from filtered dataset) was constructed using plugin q2-phylogeny: the MAFFT program was used to perform multiple sequence alignment, masking ambiguously aligned regions and applying FastTree for creating a cladogram from the masked alignment. The generated tree had 1070 sequences and was visualized in iTOL 4.4.2. [33]. The taxonomy dataset generated in QIIME2 using PR2 database [Taxonomy.qza] was added to the visualization of the tree to apply leaf identification. Sequences that were poorly identified or defined as “uncultured” were searched in the NCBI GenBank database using the BLAST search tool, and those with a low identity threshold were pruned from the tree. We additionally pruned out identical sequences that taxonomically corresponded to the same species or strain. The final tree was composed of 211 relevant taxa spread through Dinophyta, Cryptophyta, Haptophyta, Chlorophyta, and Bacillariophyta. The sample frequency (number of ASVs identified as an individual representative sequence) was added using FeatureTable [Frequency] (Supplementary Figure S1). Taxa bar plots visualization were performed in RStudio version 1.2.1335, using the ‘qiime2R’ [34], ‘phyloseq’ [35], and ‘ggplot2’ [36] packages.

2.5. Statistical Analyses

For the purposes of data visualization and statistical analyses, sampling depths were grouped into three categories: surface, thermocline, and deep chlorophyll a maxima layer (DCM) according to temperature (surface and thermocline) and Chl a concentration (DCM) (Supplementary Table S1). The values were as follows: surface layer, 22.6–25.5 °C; thermocline layer, 17.3–22.3 °C; DCM layer, 0.120–0.222 µgL−1.
Statistical analyses were performed in Primer 7.0. (Primer-E Ltd. 2021, Auckland, New Zealand) and in R studio using ‘vegan’ [37] and ‘Hmisc’ [38] packages. Data editing and reading in R studio were performed using the ‘tidyverse’ [39], ‘tibble’ [40], and ‘readr’ [41] packages. Prior to statistical analyses, plankton community data including phytoplankton and bacterioplankton counts were log-transformed, while environmental data were log-transformed, normalized, and standardized. Transformations were carried out in order to create resemblance matrices and to combine them in correlation analysis, canonical correspondence analyses, and principal component analysis.
Phytoplankton community diversity was defined by calculating biodiversity indices, and dominant taxa were determined by maximum abundances and frequency of appearance in samples. Significant average dissimilarity in phytoplankton community and nutrient composition between the surface, thermocline, and DCM layers were tested using analysis of similarities (ANOSIM). The contribution of dominant taxa to the observed dissimilarity of water layers was determined using similarity percentage analysis (SIMPER).
Nutrient and Chl a distribution in the water column and changes over the investigating period were analyzed in Primer using principal component analysis (PCA). The significance of clusters revealed by PCA was tested using ANOSIM, performed within the two factors (factor period and factor water column), determined by differences visualized with linear scatter plots. Prior to ANOSIM, a resemblance matrix was calculated using Euclidean distance for environmental data, and Manhattan distance (Bray–Curtis similarity) for biotic data.
Spearman’s rank correlation analysis was carried out between the environmental data. Furthermore, a percentage of plankton community variability that can be explained by environmental variables was calculated using canonical correspondence analyses (CCAs). The model used nutrients as constrained variables for bacterioplankton and phytoplankton data. Variance inflation factors were calculated for each constraint in order to eliminate those which are highly correlated from the model, making the CCA more constrained. Statistical significance of the CCA model and constrained axes was tested using analysis of variance (ANOVA).

3. Results

3.1. Water Column Structure

Vertical profiles of temperature at station Struga elucidate a stratified water column with intermittent diurnal vertical thermocline oscillations. Chl a fluorescence (Chl F) retrieved by CTD cast elucidated a DCM layer that followed the thermocline oscillation, showing diurnal depth variations with maximum values observed from a 30 to 70 m depth (Figure 2).
Maximum Chl a concentration in the DCM, thermocline, and surface layers was 0.222 µgL−1, 0.098 µgL−1, and 0.071 µgL−1, respectively. Three peaks of Chl a concentration in the DCM layer through investigated period were recorded on 12, 14, and 20 July (Figure 3). Maximum NO2 concentration was 0.013 µmol L−1 at the surface, while NO3, PO4, and SiO4 reached their maximum in the DCM layer with concentrations of 10.26 µmol L−1, 0.761 µmol L−1, and 3.530 µmol L−1, respectively. Nutrient concentrations were higher at the beginning of the study period, and then significantly decreased by the end (Figure S3A and Figure 3). Maximal values of NO3, PO4, and SiO4 in the thermocline and DCM layer were recorded on 12 July with second peak after 14 July, while in the surface layer the maximal values of NO3, PO4, and SiO4 were recorded on the 15 July 2021 (Figure 3).
In the stratified water column, nutrients exhibited significant distinct vertical distribution confirmed by PCA (Supplementary Figure S2) and the ANOSIM test (Supplementary Figure S3B). PCA elucidated a trend of increases in PO4 and NO2 concentrations in the surface and thermocline layers, and NO3 and SiO4 in DCM layer (Supplementary Figure S2). PC 1 and PC 2 axes explain 49.6% and 73.4% of the total data variability, respectively. Temperature and NO3 had the highest correlation with the PC 2 and PC 1 axes, respectively (Supplementary Table S3).

3.2. Phytoplankton Community Diversity

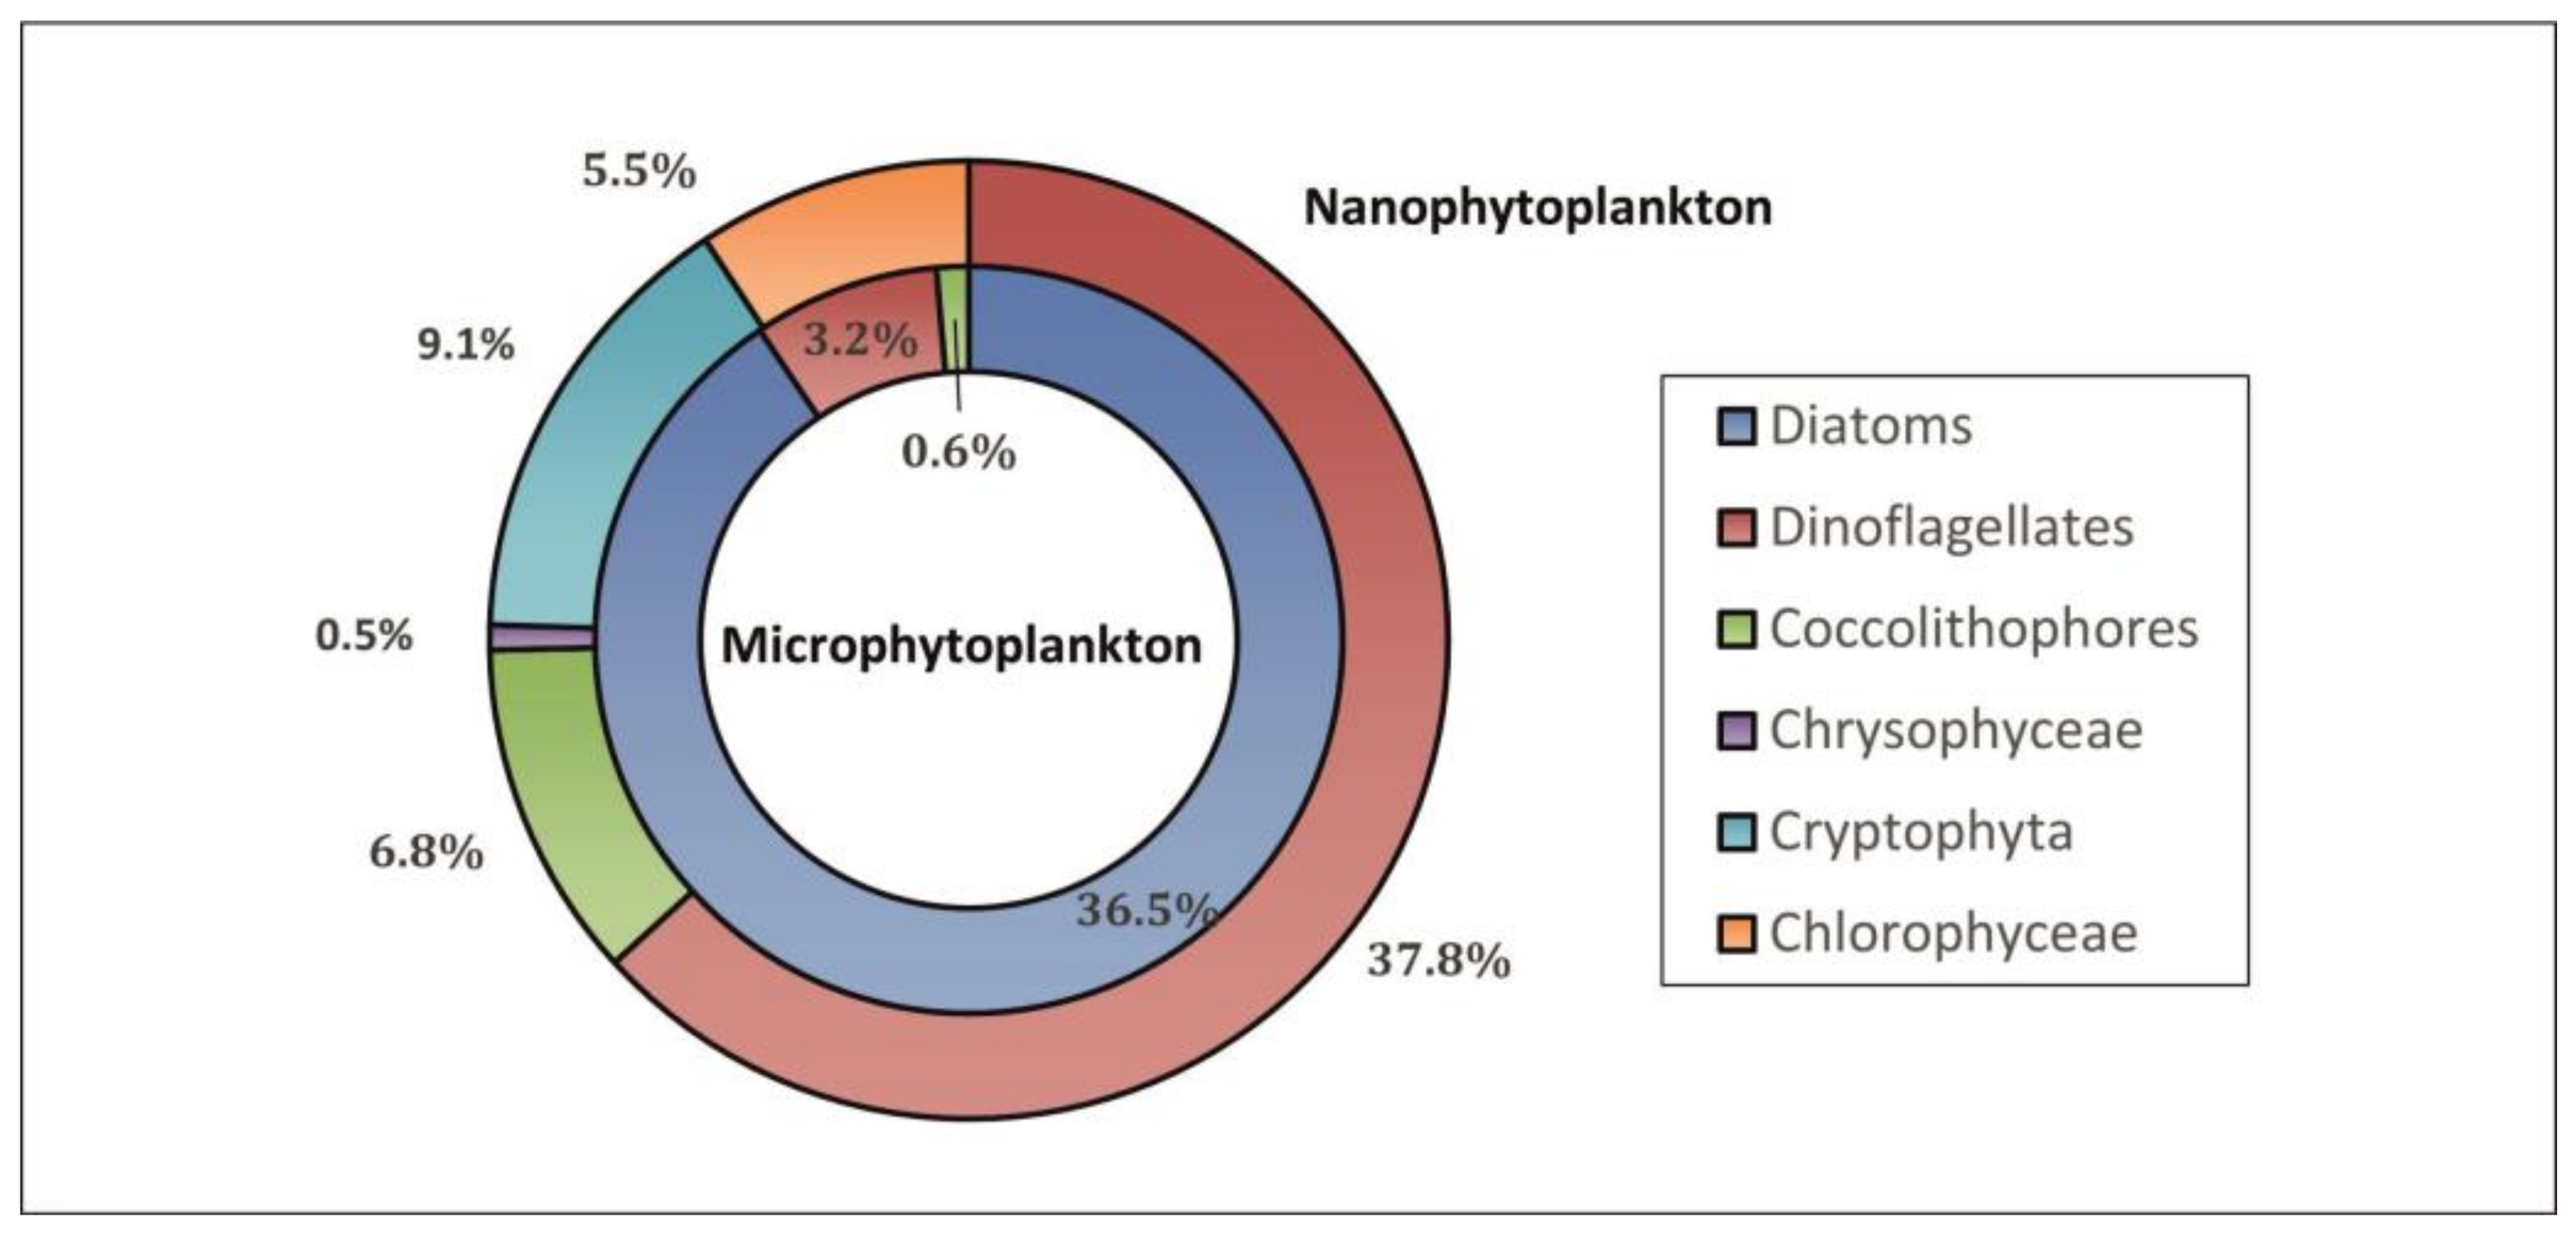
3.2.1. Taxonomic Composition and Abundance

A total of 95 taxa were determined, of which there were 58 diatoms, 27 dinoflagellates, 6 coccolithophores, and 4 other autotrophs, which included chlorophyceae, chrysophyceae, and cryptophytes (Supplementary Table S4). The microphytoplankton community was dominated by diatoms (36.5%), while dinoflagellates (3.2%) and coccolithophores (0.6%) contributed less. Nanophytoplankton was comprised of dinoflagellates (37.8%), coccolithophores, (6.8%), and other autotrophs (15.1%) (Figure 4).
The maximum recorded cell abundance was 23.4 × 10³ cells L−1 (Supplementary Table S4), and the species richness was 10.2 (Supplementary Table S5). Maximal nanophytoplankton and microphytoplankton abundance was 36.9 × 10³ cells L−1 and 28 × 103 cells L−1, respectively (Figure 5). The phytoplankton community had uneven species distribution, as confirmed by Pielou’s evenness (J′ = 0.58) (Supplementary Table S5). Shannon–Weiner (H′ = 2.67), and Simpson diversity index (1 − λ′ = 0.84) confirmed a low phytoplankton community diversity (Supplementary Table S5).

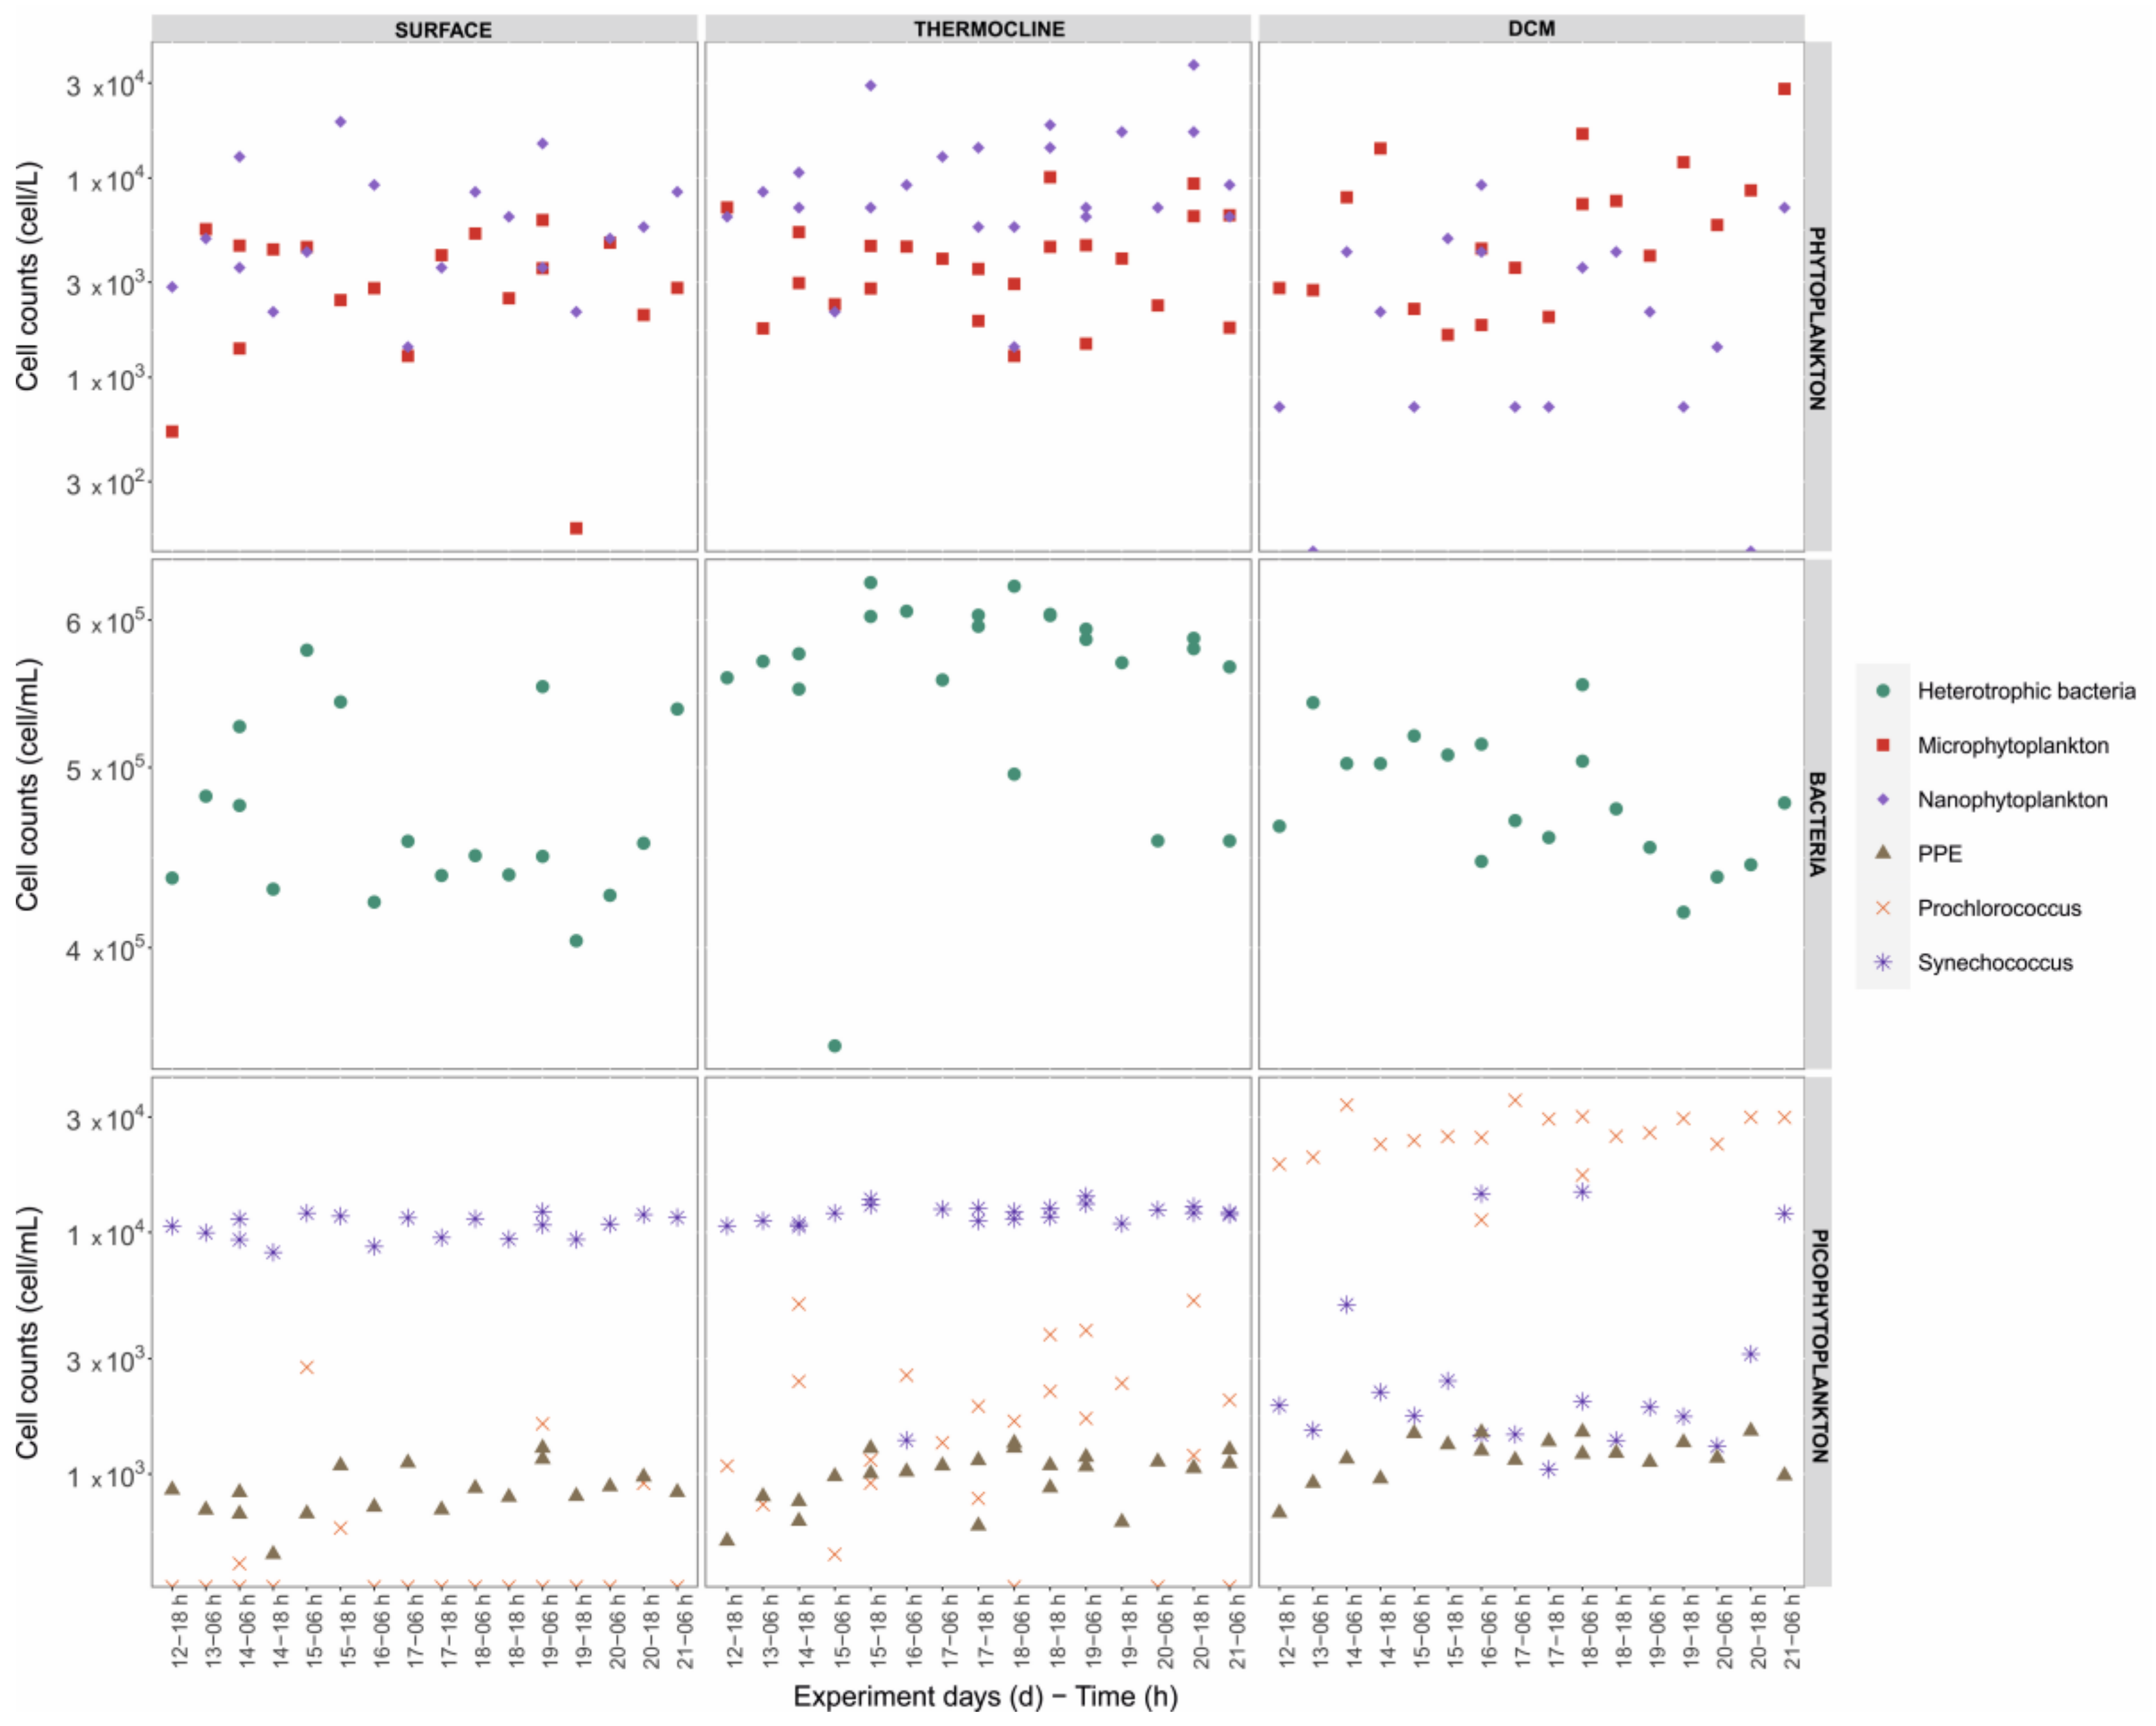
3.2.2. Vertical Distributions and Dominant Taxa

Microphytoplankton dominated the DCM layer, while nanophytoplankton contributed most to the thermocline layer (Figure 5). Maximum microphytoplankton and nanophytoplankton abundance was recorded on 21 and 20 July, respectively (Figure 5). Distinct phytoplankton vertical distribution was also observed by CCA ordination (Figure 6) and confirmed as significant using ANOSIM (Supplementary Figure S3).
Dominant taxa, defined as species or groups with maximum abundance >500 cellsL−1, and the frequency of occurrence in samples >50%, were Cylindrotheca closterium, Guinardia flaccida, Guinardia striata, Hemiaulus chinensis, Leptocylindrus danicus, Proboscia alata, Pseudo-nitzschia delicatissima, Rhizosolenia imbricata, Thalassionema frauenfeldii, Gyrodinium fusiforme, nano- and micro-scale dinoflagellates, penatae, and nano-scale coccolitophorids (Table 1). The micro-fraction was dominated by diatoms, and P. delicatissima, and T. frauenfeldii had the highest maximum abundances, while dinoflagellates, coccolithophorids, and cryptophytes contributed most to the nanophytoplankton (Table 1). The distribution of dominant taxa abundances remained constant throughout the investigating period.
Average dissimilarity in phytoplankton structure was the highest between the surface and DCM layers (48.9%), where Thalassionema frauenfeldi contributed the most. Cryptophyta and nano-scale coccolithophorids contributed the most to the thermocline and DCM layers’ dissimilarity (46.47%), while surface and thermocline layer dissimilarity (36.53%) was observed for Leptocylindrus danicus and Pseudo-nitzschia delicatissima. Cryptophyta, nano-scale coccolithophorids, and nano-scale dinoflagellates contributed the most to overall average dissimilarity in the water column (Table 2).

3.3. Picophytoplankton and Bacterioplankton

Picophytoplankton was comprised of cyanobacteria Prochlorococcus sp. and Synechococcus sp., and photosynthetic picoeukaryotes (PPEs). Its specific vertical distribution was observed (Figure 5 and Figure 6) and confirmed to be significant by ANOSIM and PCA (Supplementary Figures S2 and S3C). Prochlorococcus sp. and PPEs had the highest abundances in the DCM layer (3.52 × 10⁴ cellmL−1 and 1.51 × 10³ cellmL−1 respectively), while Synechococcus sp. dominated in the surface and thermocline layers (maximum abundance of 1.47 × 10⁴ cellmL−1 in thermocline layer) (Figure 6, Supplementary Table S6). Heterotrophic bacteria were comprised of high nucleic acid (HNA) and low nucleic acid (LNA) heterotrophic bacteria (HB), and were most active in the thermocline layer where they had maximum abundance of 6.28 × 10⁵ cellmL−1 (Figure 6, Supplementary Table S6). Maximum abundances of HNA HB and LNA HB were 3.22 × 10⁵ cellmL−1, and 3.62 × 10⁵ cellmL−1, respectively (Supplementary Table S6). Overall, LNA HB had higher abundance than HNA HB, except in the surface layer, where HNA HB were more abundant (Supplementary Table S6).

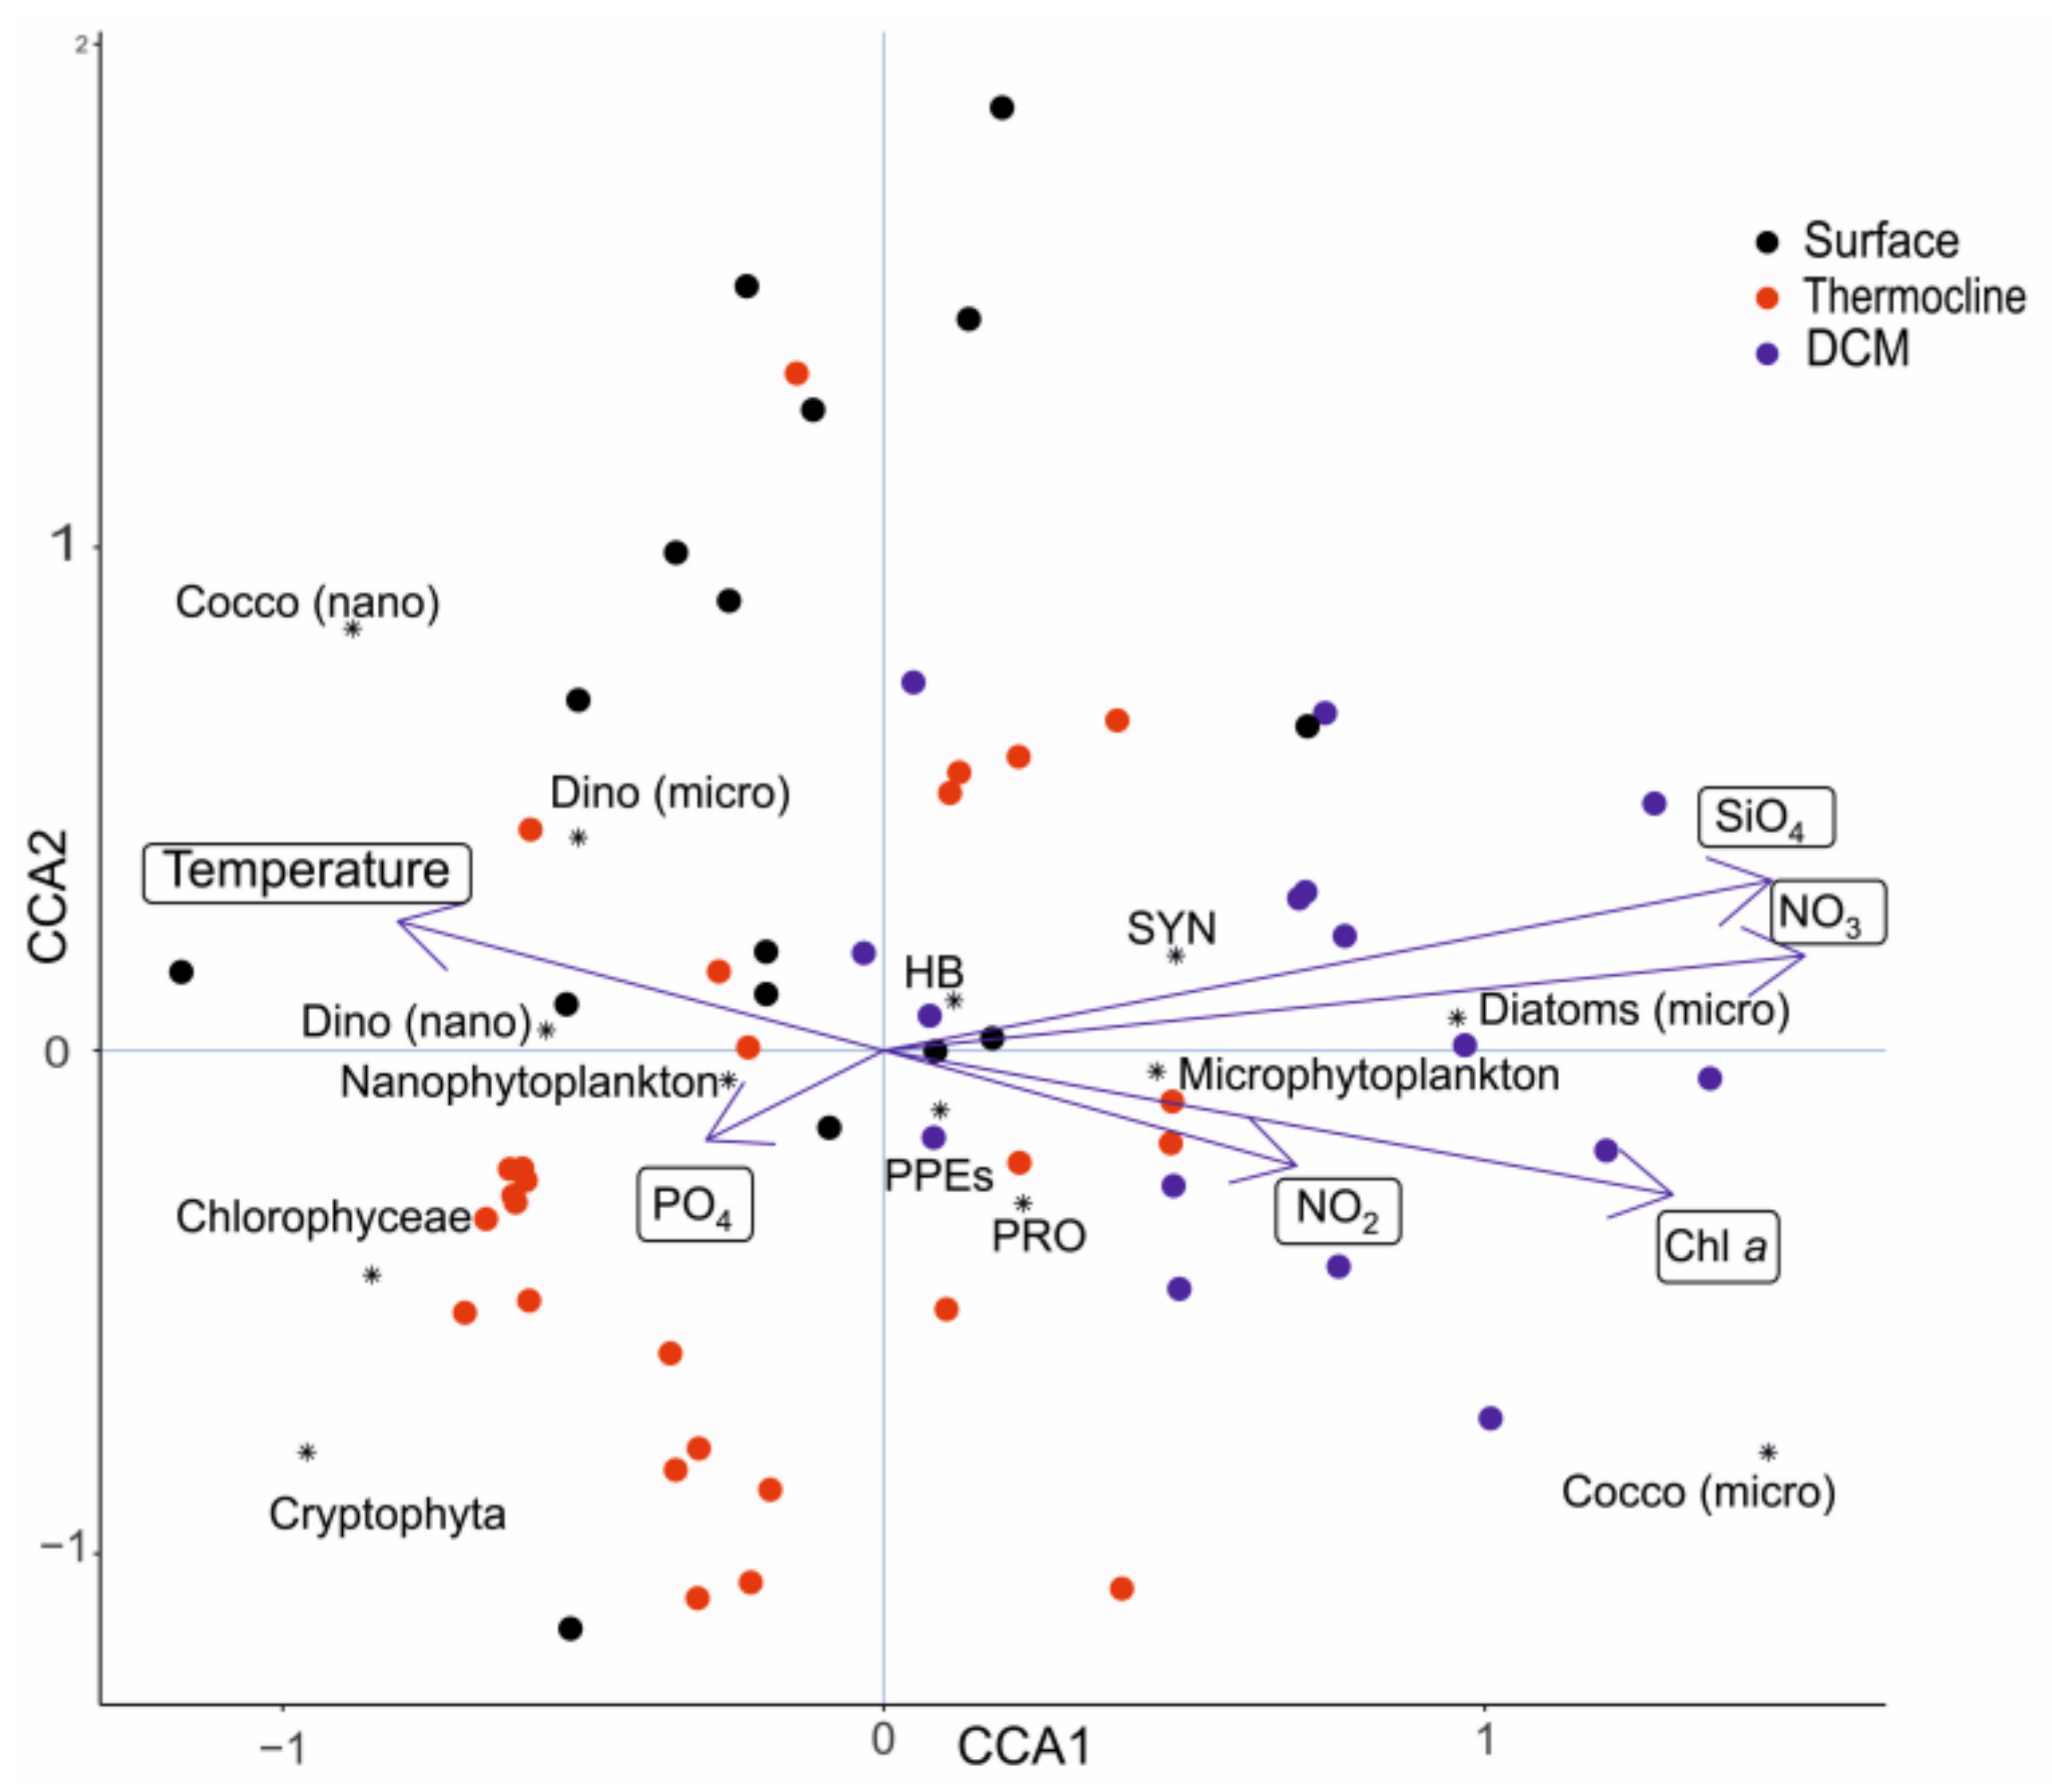
3.4. Correlation between Physico-Chemical Parameters and Plankton Community

The highest positive correlations were determined between NO3 and SiO4, and NO2 and PO4. Chl a had a significantly negative correlation with temperature, and significant positive correlations with NO3 and SiO4 (Table 3). Observed relationships were confirmed by CCA, indicating different environments in the stratified water column (Figure 6).
Environmental variables significantly explained 18.3% of phytoplankton and bacterioplankton variability (p = 0.003), while the most significant effect was in the CCA1 axis (p = 0.001) (Supplementary Table S7). NO3, NO2, and SiO4 were positively correlated with the CCA1 axis, while temperature and PO4 were negatively correlated (Supplementary Table S7). Samples represented as weighted averages of species and linear combinations of constrained variables tend to cluster according to water column stratification into surface water, thermocline, and DCM groups, therefore, elucidating a distinct plankton vertical distribution and significant nutrient gradient, as shown in Figure 6. The CCA indicated heterotrophic bacteria, PPEs, Prochlorococcus, nanophytoplankton, and micro-scale dinoflagellates to have a niche in the surface and thermocline layers, while Synechococcus, microphytoplankton, and micro-scale diatoms had a trend of linear increase towards the DCM layer (Figure 6). Furthermore, CCA showed that temperature, NO3, and SiO4 were the main factors influencing the vertical distribution and abundances of phytoplankton and bacterioplankton.

3.5. Plankton Community Composition Revealed through HTS

The prokaryotic plankton community revealed by high-throughput sequencing (HTS) was dominated by Proteobacteria (41–73%), Bacteroidota (9.5–27%) and cyanobacteria (1–10%; higher relative abundances in pico- and nano-fractions sampled at the beginning of the study period in the DCM) (Figure 7A). Proteobacteria are equally represented with alphaproteobacteria (relative abundancy alternated) and gammaproteobacteria (increased in relative abundancy towards the end of investigating period). Planctomycetota (1–15%) had the highest values in the DCM layer nano-fraction sampled at the beginning of the experiment (Figure 7A). Surface water samples had higher relative abundances of Verrucomicrobiota at both beginning and end of the experiment (5% and 9%, respectively). Firmicutes and Marinimicrobia were generally less represented in samples (the highest relative abundances of Firmicutes were in the micro-fraction surface sample at the end of the study period (~6.5%), while Marinimicrobia had ~5% in the pico-fraction at DCM and surface layers, at the beginning and end of experiment, respectively. Differences between fractions are most prominent between the pico- versus micro-fraction (Supplementary Table S2, Shannon diversity index for the 16S rRNA gene).
The eukaryotic plankton community as determined by amplicon sequencing of the 18S rRNA gene after filtering out metazoan sequences (fragments of crustacean skeletons or higher mesozooplankton), mitochondria, chloroplast, and unassigned sequences is shown through relative abundance bar plots as a phylum-ranked taxonomy and order-ranked heatmap (Figure 7B). In congruence with microscopy abundances, the eukaryotic plankton community was composed of dinoflagellates of which the majority represent parasitic Syndiniales (45–80%), followed by Stramenopiles (Ochrophyta; 2–18%), Ciliophora (of which the majority are parasitic Spirotrichea; 2–21%), chlorophytes (2–4%), and haptophytes (1–4%). Phyllum Ochrophyta dominated with diatoms (Bacillariophyta; 1–13%), while a significant proportion of samples also showed the phyla Pelagophyta (0.5–12%) and Chrysophyta (0.5–3%). Class Prymnesiophyceae dominates in phyllum Haptophyta with an average of 0.5–3.5%, while cryptophytes comprise only 0.3–1% of assemblages throughout all samples (Figure 7B).
Differences between the fractions (pico-, nano-, and micro-) were most prominent between pico- and nano-fractions versus micro-fractions (Figure 7). The micro-fraction was generally less diverse (Supplementary Table S2, Shannon diversity index for the 18S rRNA gene), containing significantly more radiolarian and dinoflagellate sequences, while in smaller fractions the diversity increases with Ochropyta and Chlorophyta increasing in ASV frequencies (Figure 7B).
The cladogram with adjacent ASV frequencies showing the microscopy relevant 211 taxa is presented in Figure S3. The most frequent taxa belong to the dinoflagellate genus Gyrodinium within the nano-fraction collected at the beginning of the experiment, while the most frequent dinoflagellate genus within the pico-fraction was Amphidinium, detected at the end of the experiment. The most frequent diatoms were pennate genera Pseudo-nitzschia (highest ASV frequencies detected at DCM at the beginning of the experiment) and multipolar centric Chaetoceros, which had slight peak in ASV frequency in the pico-fraction DCM layer sample collected at the beginning of the experiment (Supplementary Figure S1). Chlorophyta were represented with omnipresent genera, such as Ostreococcus, Bathycoccus, Pycnococcus, Mamiella, Pterosperma, and Halosphaera, while Haptophyta sequences were identified mostly as class Chrysochromulinaceae or Phaeocystaceae (Supplementary Figure S1).

4. Discussion

4.1. Nutrients and Thermal Stratification

The South Adriatic Sea is characterized by relatively low phosphate and nitrate concentrations (generally less than 0.2 µmol L−1, and 3 µmol L−1, respectively), and primary production is often limited by phosphate [42,43]. However, during winter mixing and enhanced river inflow, nitrate can reach maximum values of 2.5 µmol L−1 in offshore areas [42] and up to 14–20 µmol L−1 in eutrophic estuaries [44]. The nutrient concentrations recorded in the Lastovo archipelago (Figure 3) are, therefore, in congruence with previous studies and with oligotrophic stratified ecosystems. However, extremes recorded at the beginning of the study period with values of 10.3 µmol L−1, 0.76 µmol L−1, and 3.53 µmol L−1 for NO3, PO4, and SiO4 (Figure 3), respectively, are more typical for eutrophic systems, such as the Neretva Estuary (11.6 µmol L−1, 0.81 µmol L−1, and 13.9 µmol L−1—averaged annual values for NO3, PO4, and SiO4, respectively [45]), Mali Ston Bay (9.73 µmol L−1, 0.33 µmol L−1, and 6.24 µmol L−1 [46]), and Boka Kotorska Bay (9.92 µmol L−1, 0.581 µmol L−1, and 14.0 µmol L−1 [47]). Furthermore, maximum values for NO3, PO4, and SiO4 measured in the Eastern Mediterranean are 9.011 µmol L−1, 0.381 µmol L−1, and 10.660 µmol L−1, respectively [48]. Therefore, we can discuss the extremes at Lastovo Island as indicators of nutrient influx to the euphotic layer during thermal stratification.
Stratification in the southern Adriatic Sea generates a thermocline in April and culminates in August [43], with temperatures above the thermocline being between 22 °C and 26 °C [49], as observed with our temperature data loggers (Figure 2). The maximum Chl a concentration recorded at Lastovo Island was 0.2 µg L−1 in the DCM layer at 65–75 m, which coincided with higher SiO4 and NO3 concentrations and microphytoplankton abundances. Thermal stratification at Otranto Strait was recorded in the layer between 10 and 50 m with maximum Chl a concentrations being between 0.17–1.1 µg L−1 [50,51]. Chl a and temperature showed significant negative correlations, while Chl a, NO3, and SiO4 showed significant positive correlations, which indicated the DCM (Table 3) [51,52,53,54].

4.2. Phytoplankton Community in the Oligotrophic Ecosystem

Contrary to the northern Adriatic Sea, the oligotrophic southern Adriatic Sea is characterized by low phytoplankton abundances with maximum abundances occurring in spring [42,49]. Nanophytoplankton and microphytoplankton abundances (36.9 × 10³ cells L−1 and 28 × 103 cells L−1, respectively) (Figure 5) are characteristic for the South Adriatic Sea [43,51,53,55] and oligotrophic Mediterranean Sea [56,57,58,59,60]. In the stratified South Adriatic Sea, microphytoplankton abundances range between 49.2 × 10³ cells L−1 in open sea areas [43], 21.3 × 10⁵ cells L−1 in bays [46], and up to 7.9 × 10⁶ cells L−1 in karstic estuaries [45], while offshore nanophytoplankton abundances are between 1.1 × 10⁵ cells L−1 and 1.5 × 10⁵ cells L−1 [42]. In general, ecosystems rich in inorganic nutrients will support microphytoplankton, while organic nutrients are preferred by nano- and picophytoplankton [51,61]. Diatoms, one of the main constituents of microphytoplankton, rapidly respond to higher nitrate concentrations and outcompete other phytoplankton [62] which may explain their development in the DCM layer. Diatoms dominating microphytoplankton, and dinoflagellates dominating the nanophytoplankton community (Figure 4), are characteristic for the South Adriatic Sea [9,44,46,63,64]. In the oligotrophic Mediterranean Sea they thrive only in areas of nutrient inflow increase, and picophytoplankton dominates [65].
Nano-scale dinoflagellates were the most dominant taxa (Table 1), which is supported by records of nano-scale dinoflagellates and coccolithophorids being more frequent than micro-scale diatoms in the stratified Mediterranean Sea [66] and in the Adriatic Sea [67]. In addition, HTS results recognize dinoflagellates over diatoms as the main contributors to the plankton community, of which most reads are annotated to parasitic Syndiniales (Figure 7B). This can be explained with multiple copies of dinoflagellate genomes [68] and/or PCR biases in the metagenomic amplicon sequencing approach [69]. The prevalence of sequences of these, for hosts, fatal parasites, are shown in all major oligotrophic oceans and seas, including the Mediterranean [70] and Adriatic Sea [71] especially within the smallest size-fraction (<5 µm) [72].

4.2.1. Microphytoplankton

Of the micro-scale diatoms revealed by light microscopym Pseudo-nitzschia delicatissima, Proboscia alata, Rhizosolenia imbricata, and Thalassionema frauenfeldii were most abundant in more than 50% of samples (Table 1). Pseudo-nitzschia spp., Proboscia alata, and Rhizosolenia spp. were also identified among the 18S rRNA ASVs (Figure S3), of which Pseudo-nitzschia spp. contributed the most, confirming its dominance among diatoms within this study. Other (multipolar) centrics identified among the 18S rRNA ASVs predominantly belonged to genus Chaetoceros (species: Ch. diversus, Ch. throndsenii, Ch. decipiens, Ch. vixvisibilis, Ch. anastomosans, C. lauderi, Ch. socialis, Ch. tortissimus, and Ch. curvisetus), followed by Minidiscus, Thalassiosira, Leptocylindrus, and Hemiaulus, which is congruent with Piredda et al., 2018 [73], who showed the dominance of Chaetoceros–Leptocylindrus–Thalassiosira assemblages in coastal European seas.
Pseudo-nitzschia spp. is described to be distributed across the Adriatic Sea and frequent in all seasons [74], but is also characteristic for nutrient enriched ecosystems [74,75,76]. A similar diversity was observed in other studies in the South Adriatic Sea, with Pseudo-nitzschia delicatissima, Pseudo-nitzschia spp., Leptocylindrus danicus, Proboscia alata, T. frauenfeldii, and Thalassionema nitzschioides often being dominant diatoms [43,46,51,77]. In general, it is recorded that centric diatoms characterize the South Adriatic Sea, in contrast to pennatae diatoms that are more frequent in the North Adriatic Sea [49]. Dominant diatom species often found in the DCM in the Mediterranean Sea are Dactyliosolen fragilissimus, Pseudo-nitzschia sp., Pseudo-nitzschia delicatissima, Rhizosolenia sp., Thalassiosira sp., Thalassionema nitzschioides, Th. frauenfeldii, Leptocylindrus danicus, Bacteriastrum sp., and Hemiaulus sp. [78,79,80]. These findings are consistent with observed diatom assemblage in the Lastovo archipelago (Table S3) that can be described as part of the Chaetoceros–Rhizosolenia (Proboscia) community characteristic of the eastern Adriatic and Mediterranean and which often includes the following genera: Chaetoceros, Pseudo–nitzschia, Proboscia, Rhizosolenia, Bacteriastrum, Cerataulina, Leptocylindrus, and Thalassionema [50,81,82]. Differences in diatom composition in the northern and southern Adriatic can be explained with the nitrogen availability, since the availability of nitrogen can be a driver of development and abundance of different diatom species [83].

4.2.2. Nanophytoplankton

Nanophytoplankton was dominated by dinoflagellates, coccolithophorids, and cryptophytes (Table 1), which is in accordance with previous studies of the South Adriatic [47,54,84,85], and Mediterranean Sea [80,86,87].
Frequent dinoflagellate genera in the South Adriatic Sea are Dinophysis, Gonyaulax, Gymnodinium, Oxytoxum, Prorocentrum, Protoperidinium, and Tripos [43,46,47,88], of which only a few were recorded in the Lastovo archipelago (Supplementary Table S4). In the Mediterranean Sea, frequently observed taxa are Gymnodinium, Gyrodinium, Tripos, Protoperidinium, and Oxytoxum [89,90,91], all of which were observed at Lastovo Island (except D. fortii), but not frequently (Supplementary Table S4). Common coccolithophorid species observed in South Adriatic Sea are Calyptosphaera oblonga, Calciosolenia brasilliensis, Emiliana huxley, Helicosphaera walichii, Rhabosphaera tignifera, and Syracosphaera pulchra [92]. The coccolithophorid community is also highly diverse in the Mediterranean Sea, and Emiliania huxleyi is an often dominant and widespread species [93]. A similar community was found at Lastovo Island, except H. walichii and R. tignifera (Supplementary Table S4). The silicoflagellate species Dictyocha fibula was also recorded in studies of the South Adriatic Sea phytoplankton community [47], and in the Mediterranean Sea where it is scarce and mostly found in surface layers [94,95].
The bias of comparing taxa lists obtained by different observers/taxonomers should be considered, as well as seasonality, sampling location, and the different methodologies used, as shown in the more diverse dinoflagellate community revealed by HTS vs. microscopy. Some genera were recorded only via the 18S rRNA ASVs: Ceratoperidinium, Karlodinium, Azadinium, Lepidodinium, Blastodinium, Heterocapsa, Karenia, Torodinium, Biecheleria, Pelagodinium etc., all of which were reported previously in the South Adriatic [71] and in other coastal marine areas [73,96,97,98]. Relative abundances of ASVs belonging to dinoflagellate genera revealed their dominance in the phytoplankton community, especially Gyrodinium, which was dominant in reads in all samples, with the highest number observed in the surface pico-fraction collected at the beginning of experiment (13 July 2021) (Supplementary Figure S1). In general, smaller fractions, such as pico-nano cell sizes, mostly accumulate the classes Dinophyceae and other MALVs (marine alveolates, mostly parasitic), followed by Rhizaria and Stramenopiles [68,99]. Within haptophytes, HTS data associated most ASVs to Chrysochromulina, Phaeocystis, Prymnesium, Haptolina, Algirosphaera, Helicosphaera, and Syrachosphaera, while the rest of the reads belonged to Haptophyta_Clades HAP4 and HAP5. Interestingly, there were no E. huxley ASVs in our dataset, nor was it recorded via light microscopy, which can be corroborated with the findings of Piredda et al., 2017 [70] and Gran-Stadniczeñko et al., 2019 [95]. They noted that higher abundances of Emiliania huxley regarding the V4 region of the 18S rRNA gene are expected in late summer and fall in coastal seas [98,100], allowing us to conclude that the period of our experiment was not favorable for E. huxley growth.

4.3. Phytoplankton Vertical Distribution

Significant distinct phytoplankton vertical distribution was driven by temperature and nutrients (Figure 6). Cryptophytes, nano-scale coccolithophorids, and dinoflagellates contributed the most to the statistically significant dissimilarity between surface, thermocline, and DCM layers (Table 2). Dinoflagellates and diatoms’ opposite responses to temperature are observed in other studies [54], which can be explained by dinoflagellates having their temperature optima higher than 24 °C, while diatoms are most abundant in bottom layers where temperature is between 16 °C and 24 °C [46]. Furthermore, there is a tendency of the microphytoplankton community sinking to the bottom layers towards the end of summer [53,77]. Similar significant vertical distribution is also recorded in studies of the stratified Mediterranean Sea [65,99] where the community in the DCM is often comprised of diatoms [79,101] and picoplankton, specifically Prochlorococcus [56,102,103], while Synechococcus thrives in the surface layer [48,104]. Although we did not observe temperature as a significant constraint for picophytoplankton and bacterioplankton (Figure 6), the neural network analysis study revealed positive correlation of PPEs, cyanobacteria, and heterotrophic bacteria with temperature in the oligotrophic South Adriatic [102].
A common trend of linear increase is evident for NO2 concentration, microphytoplankton, and micro-scale diatom abundances (Figure 6). TIN (total inorganic nitrogen) was eliminated from the CCA as a highly correlated variable with NO2 (calculated using variance inflation factors test) which is, therefore, its proxy. As a result, we can discuss TIN as an influential factor in phytoplankton community diversity [45], which is in accordance with previously observed high microphytoplankton abundances in areas rich with inorganic nutrients, while nanophytoplankton thrives in layers where organic nutrients are formed [51,61,105]. Nano-scale groups followed an inverse trend with nutrients (Figure 6), which indicates a preference for low-nutrient environments. Such nutrient–phytoplankton correlations were confirmed by other studies in the oligotrophic South Adriatic Sea [45,54,97], and the Mediterranean Sea [99,105,106].

4.4. Picophytoplankton and Heterotrophic Bacteria

Picophytoplankton tends to dominate the photosynthetic biomass in the oligotrophic Mediterranean Sea [96]. The cyanobacteria distribution is constant [107], while picoeukaryotes are frequently observed in the Ionian Sea, Strait of Sicily, and the Levantine Basin [65]. The community at Lastovo Island was comprised of the cyanobacteria Prochlorococcus sp. and Synechococcus sp., and PPEs (Figure 5). Prochlorococcus and Synechococcus abundances (103 to 104 cell mL−1, Figure 5) are typical for the oligotrophic South Adriatic open sea regions [103,108], and for the Mediterranean Sea [109,110,111]. Synechococcus was more successful in the surface and thermocline layers, while Prochlorococcus peaked in the DCM (Figure 5). The observed distinct niches of Prochlorococcus and Synechococcus are characteristic for oligotrophic waters [112,113], and are often recorded in the South Adriatic [4,8,114], and the Mediterranean Sea [87], Temperature and nutrients are important factors determining their distribution [4,109,115,116,117], especially Synechococcus, which easily adapts to different temperatures and nutrient sources [104,118].
Prochlorococcus and Synechococcus were also identified as photosynthetic counterparts of bacterial ASVs congruently to previous studies within the same area [26,71,119]. However, in those studies, Cyanobacteria relative OTUs abundance in the winter were higher compared to our results [26,71]. Nevertheless, as it was observed by Korlević et al., 2015 [119] that an unusually strong winter deep convection event adds up to those higher relative abundancies, question of methodology used (454-pyrosequencing along with classification to OTUs instead of ASVs in post-bioinformatic analysis of raw reads) should be considered.
PPEs’ abundance follows the trend of increased NO2 and PO4 concentrations (Figure 6), which confirms they are very successful in ecosystems with elevated nutrient levels [116]. Their abundance remained constant throughout the water column (Figure 5). Maximum abundance was recorded in the DCM layer (Table S5), which is congruent with other studies carried out in the Mediterranean in summer [99] and in the Adriatic Sea in spring [114,120]. Due to their size and lack of distinguishing characters, most PPE cells are overlooked in traditional monitoring by light-microscopy studies [121]. Therefore, the importance of sequencing that fraction arose with global expeditions, such as the Biosope and Tara Oceans [100,122], which showed that most PPEs belong to the classes Prymnesiophyceae, Prasinophyceae, Mamiellophyceae, Cryptophyceae, Pelagophyceae, Chrysophyceae, and Dictyochophyceae [123]. Heterotrophic counterparts of pico-nano size-fractions as confirmed within this study are mostly bacterivorous (alveolates and stramenopiles) and play a key role in nutrient recycling [124] and community control through predation pressure or parasitism [117].
High bacterial activity in the nutrient-poor surface and thermocline layers (Supplementary Table S6, Figure 3) was confirmed by HNA and LNA HB maximum abundances (Supplementary Table S6) characteristic of the oligotrophic South Adriatic Sea in summer (104–105) [102,103,114]. The increase in bacteria in the surface layer of the stratified South Adriatic Sea [4,114,125,126] can be explained by nutrient utilization in the productive surface layers (low nutrients and high bacteria abundances), and nutrient regeneration and accumulation in deeper layers (high nutrient and low bacteria abundances) [4]. LNA HB had higher abundances than HNA HB (Supplementary Table S6), often observed in the South Adriatic Sea [26,114] because LNA HB are dominated by the alphaproteobacterial group SAR11 which prefers oligotrophic waters [26,114] and is well adapted to low nutrient concentrations [103].
The microbial community at Lastovo Island was comprised mostly of Proteobacteria, represented by Alphaproteobacteria and Gammaproteobacteria, followed by Bacteroidota and Cyanobacteria (Figure 7A). Šantić et al., 2021 [102] neural network analysis revealed similar dominance of Proteobacteria in the oligotrophic South Adriatic Sea, followed by Bacteroideota and Actinobacteriota, which were not observed in high relative abundances at Lastovo Island (Figure 7A). HTS revealed dynamic vertical distribution of the bacterial community, with Marinmicrobia being more frequent in DCM and surface layers at the beginning and end of the experiment, respectively (Figure 7A). Verrucomicrobiota had higher relative abundances at the surface layer, while Planctomycetota had the highest values in the DCM layer (Figure 7A). Similarly, the San Pedro Ocean Time series study (2005–2018) revealed prokaryotic community diversity that has steady dynamics and is vertically distinct [127]. The euphotic zone is dominated by Rhodobacterales, SAR86, and Puniceispirillales (SAR116) that represent the small size-fraction, with Synechococcales, Actinomarinales, Cellvibrionales dominating the large size-fraction. Deeper layers are dominated by Nitrosopumilales Archaea, Thiomicrospirales, Nitrospinales, Marinimicrobia, and SAR234 predominated, all representing small size-fraction [127].
There are numerous case studies confirming the HTS method to add to the value of investigating plankton community diversity [128]. For example, it elucidated that the most diverse and dominant diatom genus in the plankton is Chaetoceros with over 200 validated species. Light microscopy is limited in identifying species by morphological characteristics only, while HTS can help identify rare and cryptic species [73,100]. However, the HTS method has disadvantages, such as bias in choosing the marker region, no universally accepted gene for algae barcoding, presence of intros, etc. [128]. Therefore, combining HTS metabarcoding and light microscopy methods yields valuable results on phytoplankton and bacterioplankton community diversity, and both were used to examine phytoplankton and bacterioplankton diversity and co-dependency at Lastovo Island.

5. Conclusions

Diatoms and dinoflagellates contributed the most to micro- and nanophytoplankton, respectively, while the pico-fraction comprised of PPEs and the cyanobacteria Synechococcocus sp. and Prochlorococcus sp. Bacterioplankton comprised of HNA and LNA heterotrophic bacteria, and the main prokaryotic groups revealed by HTS were Proteobacteria, Bacteroidota, and cyanobacteria. Differences in pico-, nano-, and microphytoplankton community diversity were most prominent between pico- and nano-fractions versus the micro-fraction, which was generally less diverse. Temperature vertical profiles, correlations between nutrients, Chl a, and temperature, and overall nutrients and Chl a concentration indicated a stratified water column. In addition, phytoplankton and bacterioplankton community vertical distribution additionally supported dissimilarity between surface, thermocline, and DCM layers. Cryptophytes, nano-scale coccolithophorids, and nano-scale dinoflagellates contributed the most to this distinction, as they were most frequent and abundant, which is typical for the oligotrophic South Adriatic Sea ecosystem. However, the dominant diatoms Pseudo-nitzschia delicatissima, Proboscia alata, Rhizosolenia imbricata, and Thalassionema frauenfeldii (present in more than 50% of samples in high numbers) can be indicators of a nutrient-enriched area. In addition, nutrient extremes observed at the beginning of the study period are unusual for the stratified and oligotrophic South Adriatic Sea ecosystem in summer, therefore, indicating a possible nutrient flux to the euphotic layer that could affect the observed phytoplankton community diversity.

Supplementary Materials

The following supporting information can be downloaded at: https://www.mdpi.com/article/10.3390/w15122299/s1, Figure S1: Cladogram with adjacent ASV frequencies showing microscopy relevant 211 taxa. Cladogram was constructed using plugin q2-phylogeny, MAFFT program, and FastTree, and visualized using iTOL 4.4.2. Taxonomy dataset generated in QIIME2 using PR2 database was added to the cladogram, representing 211 relevant taxa spread through Dinophyta, Cryptophyta, Haptophyta, Chlorophyta, and Bacillariophyta. Sample frequency (number of ASVs identified as individual representative sequences) was added using FeatureTable; Figure S2: Principal component analysis (PCA) of environmental variables with overlaid vectors whose direction and length indicate negative or positive correlations of abiotic variables with PC1 and PC2 axes.; Figure S3: Analysis of similarities (ANOSIM) test confirming: (A) significant nutrient concentration decrease after 16 July 2021, (B) significant nutrient gradient with distinct concentrations between surface, thermocline and deep chlorophyll maximum layer, (C) significant vertical distribution of nano-, micro-, picophytoplankton, and bacterioplankton; Table S1: Sampling categories with corresponding sampling depths at station Struga (S1) (N 42.72285, E 16.88676) during investigating period. Abbreviations: DCM (deep chlorophyll maximum); Table S2: eDNA samples (Station-depth-fraction-date) with numbers of raw input reads, filtrated, denoised, and non-chimeric reads.; Table S3: Principal component analysis (PCA) of environmental variables showing loadings (eigenvectors) of environmental variables, with highest values highlighted, and cumulative variability explained by PC1 and PC2 axes with corresponding eigenvalues; Table S4: List of groups/taxa determined by the Utermöhl method from samples taken at station Struga (S1) at Lastovo Island in the Adriatic Sea, with corresponding maximum abundances (cell L−1), minimum abundances (cell L−1), and frequency of appearance in samples (%). The total number of samples is 60. Abbreviations: Min (minimum abundances), Max (maximum abundances), Fr (frequency of appearance), N.D (not determined); Table S5: Phytoplankton community biodiversity indices at station Struga (S1), Lastovo Island, South Adriatic. Abbreviations: S (total species number), N (total number of individuals), d (species richness), J′ (Pielou’s evenness), H′ (Shannon–Weiner diversity), 1 − λ (species diversity); λ (Simpson’s Index); Table S6: Maximum bacterioplankton and picophytoplankton abundance determined by flow cytometry. Abbreviations: Max (maximum abundance), HB (heterotrophic bacteria), HNA HB (high nucleic acid heterotrophic bacteria), LNA HB (low nucleic acid heterotrophic bacteria), PRO (Prochlorococcus), SYN (Synechococcus), PPEs (Photosynthetic picoeukaryotes).; Table S7: Canonical correspondence analysis (CCA) results showing percentage of variability explained by constrained and unconstrained axes, eigenvalues for constrained axes and ANOVA permutation test results (F and p value) for entire model and for constrained axis.

Author Contributions

Conceptualization, Z.L. and A.M.; methodology, Z.L., H.Č. and H.M.; software, H.M. and A.M.; validation, H.M. and V.C.; formal analysis, Z.L., M.M., R.C., A.C.T. and E.P.A.; investigation, Z.L., H.Č., B.Č. and V.C.; resources, Z.L., E.P.A., H.Č. and R.C.; data curation, Z.L.; writing—original draft preparation, Z.L. and A.M.; writing—review and editing, Z.L., A.M., E.P.A., M.M., V.C., R.C., A.C.T. and H.M.; visualization, A.M. and H.M.; supervision, Z.L.; project administration, Z.L. and V.C.; funding acquisition, Z.L. and V.C. All authors have read and agreed to the published version of the manuscript.

Funding

This work was funded by Croatian Science Foundation under the projects ISLAND (IP-2020-02-9524) and METALPATH (lP-2019-04-5832).

Data Availability Statement

Not applicable.

Acknowledgments

We thank the captain and crew of the R/V Baldo Kosić II, Marine Explorers Society 20.000 leagues team, and Rade Garić, Marta Žižek, and Tomislav Zetović, who made this research possible.

Conflicts of Interest

The authors declare no conflict of interest.

References

  1. Field, C.B.; Behrenfeld, M.J.; Randerson, J.T.; Falkowski, P. Primary Production of the Biosphere: Integrating Terrestrial and Oceanic Components. Science 1998, 281, 237–240. [Google Scholar] [CrossRef] [Green Version]
  2. Kirchman, D.L. Microbial Ecology of the Oceans; John Wiley & Sons: Hoboken, NJ, USA, 2000; ISBN 978-0-471-29992-9. [Google Scholar]
  3. Viličić, D. Ecology and Composition of Phytoplankton in the Adriatic Sea; Koeltz Scientific Books: Koenigstein, Germany, 2014; ISBN 978-3-87429-474-4. [Google Scholar]
  4. Najdek, M.; Paliaga, P.; Šilović, T.; Batistić, M.; Garić, R.; Supić, N.; Ivančić, I.; Ljubimir, S.; Korlević, M.; Jasprica, N.; et al. Picoplankton Community Structure before, during and after Convection Event in the Offshore Waters of the Southern Adriatic Sea. Biogeosciences 2014, 11, 2645–2659. [Google Scholar] [CrossRef] [Green Version]
  5. Babić, I.; Petrić, I.; Bosak, S.; Mihanović, H.; Dupčić Radić, I.; Ljubešić, Z. Distribution and Diversity of Marine Picocyanobacteria Community: Targeting of Prochlorococcus Ecotypes in Winter Conditions (Southern Adriatic Sea). Mar. Genom. 2017, 36, 3–11. [Google Scholar] [CrossRef]
  6. Gačić, M.; Civitarese, G.; Miserocchi, S.; Cardin, V.; Crise, A.; Mauri, E. The Open-Ocean Convection in the Southern Adriatic: A Controlling Mechanism of the Spring Phytoplankton Bloom. Cont. Shelf Res. 2002, 22, 1897–1908. [Google Scholar] [CrossRef]
  7. Batistić, M.; Jasprica, N.; Carić, M.; Čalić, M.; Kovačević, V.; Garić, R.; Njire, J.; Mikuš, J.; Bobanović-Ćolić, S. Biological Evidence of a Winter Convection Event in the South Adriatic: A Phytoplankton Maximum in the Aphotic Zone. Cont. Shelf Res. 2012, 44, 57–71. [Google Scholar] [CrossRef]
  8. Cerino, F.; Bernardi Aubry, F.; Coppola, J.; La Ferla, R.; Maimone, G.; Socal, G.; Totti, C. Spatial and Temporal Variability of Pico-, Nano- and Microphytoplankton in the Offshore Waters of the Southern Adriatic Sea (Mediterranean Sea). Cont. Shelf Res. 2012, 44, 94–105. [Google Scholar] [CrossRef]
  9. Ljubimir, S.; Jasprica, N.; Čalić, M.; Hrustić, E.; Dupčić Radić, I.; Car, A.; Batistić, M. Interannual (2009–2013) Variability of Winter-Spring Phytoplankton in the Open South Adriatic Sea: Effects of Deep Convection and Lateral Advection. Cont. Shelf Res. 2017, 143, 311–321. [Google Scholar] [CrossRef]
  10. Vilibić, I.; Matijević, S.; Šepić, J.; Kušpilić, G. Changes in the Adriatic Oceanographic Properties Induced by the Eastern Mediterranean Transient. Biogeosciences 2012, 9, 2085–2097. [Google Scholar] [CrossRef] [Green Version]
  11. Lučić, D.; Ljubešić, Z.; Babić, I.; Bosak, S.; Cetinić, I.; Vilibić, I.; Mihanović, H.; Hure, M.; Njire, J.; Lučić, P.; et al. Unusual Winter Zooplankton Bloom in the Open Southern Adriatic Sea. Turk. J. Zool. 2017, 41, 1024–1035. [Google Scholar] [CrossRef]
  12. Hure, M.; Mihanović, H.; Lučić, D.; Ljubešić, Z.; Kružić, P. Mesozooplankton Spatial Distribution and Community Structure in the South Adriatic Sea during Two Winters (2015, 2016). Mar. Ecol. 2018, 39, e12488. [Google Scholar] [CrossRef]
  13. Mihanović, H.; Orlić, M.; Pasarić, Z. Diurnal Thermocline Oscillations Driven by Tidal Flow around an Island in the Middle Adriatic. J. Mar. Syst. 2009, 78, S157–S168. [Google Scholar] [CrossRef]
  14. Mihanović, H.; Beg Paklar, G.; Orlić, M. Resonant Excitation of Island-Trapped Waves in a Shallow, Seasonally Stratified Sea. Cont. Shelf Res. 2014, 77, 24–37. [Google Scholar] [CrossRef]
  15. Hogg, N.G. Observations of Internal Kelvin Waves Trapped Round Bermuda. J. Phys. Oceanogr. 1980, 10, 1353–1376. [Google Scholar] [CrossRef]
  16. Brink, K.H. Island-Trapped Waves, with Application to Observations off Bermuda. Dyn. Atmos. Ocean. 1999, 29, 93–118. [Google Scholar] [CrossRef]
  17. Luther, D.S. Trapped Waves around the Hawaiian Islands. In Proceedings of the 3rd ‘Aha Huliko’ a Hawaiian Winter Workshop, Hawaiian Ocean Experiment, Honolulu, HI, USA, 21–24 January 1985; pp. 261–301. [Google Scholar]
  18. Merrifield, M.A.; Yang, L.; Luther, D.S. Numerical Simulations of a Storm-Generated Island-Trapped Wave Event at the Hawaiian Islands. J. Geophys. Res. Ocean. 2002, 107, 33-1–33-10. [Google Scholar] [CrossRef] [Green Version]
  19. Pizarro, O.; Shaffer, G. Wind-Driven, Coastal-Trapped Waves off the Island of Gotland, Baltic Sea. J. Phys. Oceanogr. 1998, 28, 2117–2129. [Google Scholar] [CrossRef]
  20. Lazure, P.; Le Cann, B.; Bezaud, M. Large Diurnal Bottom Temperature Oscillations around the Saint Pierre and Miquelon Archipelago. Sci. Rep. 2018, 8, 13882. [Google Scholar] [CrossRef] [PubMed] [Green Version]
  21. Mihanović, H.; Orlić, M.; Pasarić, Z. Diurnal Internal Tides Detected in the Adriatic. Ann. Geophys. 2006, 24, 2773–2780. [Google Scholar] [CrossRef] [Green Version]
  22. Novosel, M.; Požar-Domac, A.; Pasarić, M. Diversity and Distribution of the Bryozoa along Underwater Cliffs in the Adriatic Sea with Special Reference to Thermal Regime. Mar. Ecol. 2004, 25, 155–170. [Google Scholar] [CrossRef]
  23. Orlić, M.; Beg Paklar, G.; Dadić, V.; Leder, N.; Mihanović, H.; Pasarić, M.; Pasarić, Z. Diurnal Upwelling Resonantly Driven by Sea Breezes around an Adriatic Island. J. Geophys. Res. 2011, 116, C09025. [Google Scholar] [CrossRef]
  24. Zavatarelli, M.; Raicich, F.; Bregant, D.; Russo, A.; Artegiani, A. Climatological Biogeochemical Characteristics of the Adriatic Sea. J. Mar. Syst. 1998, 18, 227–263. [Google Scholar] [CrossRef]
  25. Utermöhl, H. Zur Vervollkommnung der quantitativen Phytoplankton-Methodik (Towards a perfection of quantitative phytoplankton methodology). Mitt. Int. Ver. Theor. Angew. Limnol. 1958, 9, 1–38. [Google Scholar] [CrossRef]
  26. Babić, I.; Mucko, M.; Petrić, I.; Bosak, S.; Mihanović, H.; Vilibić, I.; Dupčić Radić, I.; Cetinić, I.; Balestra, C.; Casotti, R.; et al. Multilayer Approach for Characterization of Bacterial Diversity in a Marginal Sea: From Surface to Seabed. J. Mar. Syst. 2018, 184, 15–27. [Google Scholar] [CrossRef]
  27. Becker, S.; Aoyama, M.; Woodward, E.; Bakker, K.; Coverly, S.; Mahaffey, C.; Tanhua, T. GO-SHIP Repeat Hydrography Nutrient Manual: The Precise and Accurate Determination of Dissolved Inorganic Nutrients in Seawater, Using Continuous Flow Analysis Methods. Front. Mar. Sci. 2020, 7, 581790. [Google Scholar] [CrossRef]
  28. Holm-Hansen, O.; Lorenzen, C.J.; Holmes, R.W.; Strickland, J.D.H. Fluorometric Determination of Chlorophyll. ICES J. Mar. Sci. 1965, 30, 3–15. [Google Scholar] [CrossRef]
  29. Andrews, S. Babraham Bioinformatics— FastQC A Quality Control Tool for High Throughput Sequence Data. Available online: https://www.bioinformatics.babraham.ac.uk/projects/fastqc/ (accessed on 5 December 2022).
  30. Bolyen, E.; Rideout, J.R.; Dillon, M.R.; Bokulich, N.A.; Abnet, C.C.; Al-Ghalith, G.A.; Alexander, H.; Alm, E.J.; Arumugam, M.; Asnicar, F.; et al. Reproducible, Interactive, Scalable and Extensible Microbiome Data Science Using QIIME 2. Nat. Biotechnol. 2019, 37, 852–857. [Google Scholar] [CrossRef] [PubMed]
  31. Callahan, B.J.; McMurdie, P.J.; Rosen, M.J.; Han, A.W.; Johnson, A.J.A.; Holmes, S.P. DADA2: High-Resolution Sample Inference from Illumina Amplicon Data. Nat. Methods 2016, 13, 581–583. [Google Scholar] [CrossRef] [Green Version]
  32. Guillou, L.; Bachar, D.; Audic, S.; Bass, D.; Berney, C.; Bittner, L.; Boutte, C.; Burgaud, G.; de Vargas, C.; Decelle, J.; et al. The Protist Ribosomal Reference Database (PR2): A Catalog of Unicellular Eukaryote Small Sub-Unit RRNA Sequences with Curated Taxonomy. Nucleic Acids Res. 2013, 41, D597–D604. [Google Scholar] [CrossRef] [Green Version]
  33. Letunic, I.; Bork, P. Interactive Tree Of Life (ITOL) v4: Recent Updates and New Developments. Nucleic Acids Res. 2019, 47, W256–W259. [Google Scholar] [CrossRef] [Green Version]
  34. Bisanz, J.E. Qiime2R: Importing QIIME2 Artifacts and Associated Data into R Sessions. Available online: https://github.com/jbisanz/qiime2R (accessed on 5 December 2022).
  35. McMurdie, P.J.; Holmes, S. Phyloseq: An R Package for Reproducible Interactive Analysis and Graphics of Microbiome Census Data. PLoS ONE 2013, 8, e61217. [Google Scholar] [CrossRef] [PubMed] [Green Version]
  36. Wickham, H.; Chang, W.; Henry, L.; Pedersen, T.L.; Takahashi, K.; Wilke, C.; Woo, K.; Yutani, H.; Dunnington, D.; Rstudio. Ggplot2: Create Elegant Data Visualisations Using the Grammar of Graphics. 2022. Available online: https://CRAN.R-project.org/package=ggplot2 (accessed on 22 December 2022).
  37. Oksanen, J.; Simpson, G.L.; Blanchet, F.G.; Kindt, R.; Legendre, P.; Minchin, P.R.; O’Hara, R.B.; Solymos, P.; Stevens, M.H.H.; Szoecs, E.; et al. Vegan: Community Ecology Package. 2022. Available online: https://CRAN.R-project.org/package=vegan (accessed on 22 December 2022).
  38. Harrel, F.E., Jr.; Dupont, C. Hmisc: Harrell Miscellaneous. 2022. Available online: https://CRAN.R-project.org/package=Hmisc (accessed on 22 December 2022).
  39. Wickham, H.; Rstudio. Tidyverse: Easily Install. and Load. the “Tidyverse”. 2022. Available online: https://CRAN.R-project.org/package=tidyverse (accessed on 22 December 2022).
  40. Müller, K.; Wickham, H.; Francois, R.; Bryan, J.; Rstudio. Tibble: Simple Data Frames. 2022. Available online: https://CRAN.R-project.org/package=tibble (accessed on 22 December 2022).
  41. Wickham, H.; Hester, J.; Francois, R.; Bryan, J.; Bearrows, S.; RStudio. Readr: Read Rectangular Text Data. 2022. Available online: https://github.com/mandreyel/ (accessed on 22 December 2022).
  42. Viličić, D.; Vučak, Z.; Škrivanić, A.; Gržetić, Z. Phytoplankton Blooms in the Oligotrophic Open South Adriatic Waters. Mar. Chem. 1989, 28, 89–107. [Google Scholar] [CrossRef]
  43. Viličić, D. Phytoplankton Taxonomy and Distribution in the Offshore Southern Adriatic. Nat. Croat. 1998, 7, 127–141. [Google Scholar]
  44. Viličić, D.; Terzić, S.; Ahel, M.; Burić, Z.; Jasprica, N.; Carić, M.; Caput Mihalić, K.; Olujić, G. Phytoplankton Abundance and Pigment Biomarkers in the Oligotrophic, Eastern Adriatic Estuary. Environ. Monit. Assess. 2008, 142, 199–218. [Google Scholar] [CrossRef] [PubMed]
  45. Jasprica, N.; Caric, M.; Kršinić, F.; Kapetanović, T.; Batistić, M.; Njire, J. Planktonic Diatoms and Their Environment in the Lower Neretva River Estuary (Eastern Adriatic Sea, NE Mediterranean). Nova Hedwig. 2012, 141, 405–430. [Google Scholar]
  46. Viličić, D.; Jasprica, N.; Carić, M.; Burić, Z. Taxonomic Composition and Seasonal Distribution of Microphytoplankton in Mali Ston Bay (Eastern Adriatic). Acta Bot. Croat. 1998, 57, 29–48. [Google Scholar]
  47. Drakulović, D.; Krivokapić, S.; Mandić, M.; Redžic, A. Phytoplankton Community in Boka Kotorska Bay (South-Eastern Adriatic). Rapp. Comm. Int. Mer. Médit. 2013, 40, 428. [Google Scholar]
  48. La Ferla, R.; Maimone, G.; Azzaro, M.; Conversano, F.; Brunet, C.; Cabral, A.S.; Paranhos, R. Vertical Distribution of the Prokaryotic Cell Size in the Mediterranean Sea. Helgol. Mar. Res. 2012, 66, 635–650. [Google Scholar] [CrossRef] [Green Version]
  49. Viličić, D.; Marasović, I.; Mioković, D. Checklist of Phytoplankton in the Eastern Adriatic Sea. Acta Bot. Croat. 2002, 61, 57–91. [Google Scholar]
  50. Viličić, D.; Leder, N.; Gržetić, Z.; Jasprica, N. Microphytoplankton in the Strait of Otranto (Eastern Mediterranean). Mar. Biol. 1995, 123, 619–630. [Google Scholar] [CrossRef]
  51. Turchetto, M.; Bianchi, F.; Boldrin, A.; Malaguti, A.; Rabitti, S.; Socal, G.; Strada, L. Nutrients, Phytoplankton and Primary Production Processes in Oligotrophic Areas (Southern Adriatic and Northern Ionian). Atti AIOL 2000, 13, 269–278. [Google Scholar]
  52. Socal, G.; Boldrin, A.; Bianchi, F.; Civitarese, G.; De Lazzari, A.; Rabitti, S.; Totti, C.; Turchetto, M.M. Nutrient, Particulate Matter and Phytoplankton Variability in the Photic Layer of the Otranto Strait. J. Mar. Syst. 1999, 20, 381–398. [Google Scholar] [CrossRef]
  53. Čalić, M.; Carić, M.; Kršinić, F.; Jasprica, N.; Pećarević, M. Controlling Factors of Phytoplankton Seasonal Succession in Oligotrophic Mali Ston Bay (South-Eastern Adriatic). Environ. Monit. Assess. 2013, 185, 7543–7563. [Google Scholar] [CrossRef] [PubMed]
  54. Krivokapić, S.; Bosak, S.; Viličić, D.; Kušpilić, G.; Drakulović, D.; Pestorić, B. Algal Pigments Distribution and Phytoplankton Group Assemblages in Coastal Transitional Environment—Boka Kotorska Bay (South Eastern Adriatic Sea). Acta Adriat. 2018, 59, 35–49. [Google Scholar] [CrossRef] [Green Version]
  55. Viličić, D. A Study of Phytoplankton in the Adriatic Sea after the July 1984 Bloom. Int. Rev. Ges. Hydrobiol. 1991, 76, 197–211. [Google Scholar] [CrossRef]
  56. Decembrini, F.; Caroppo, C.; Azzaro, M. Size Structure and Production of Phytoplankton Community and Carbon Pathways Channelling in the Southern Tyrrhenian Sea (Western Mediterranean). Deep. Sea Res. Part. II Top. Stud. Oceanogr. 2009, 56, 687–699. [Google Scholar] [CrossRef]
  57. Turley, C.M. The Changing Mediterranean Sea—A Sensitive Ecosystem? Prog. Oceanogr. 1999, 44, 387–400. [Google Scholar] [CrossRef]
  58. Yahia-Kefi, D.O.; Souissi, S.; Gomez, F.; Daly Yahia, M.N. Spatio-Temporal Distribution of the Dominant Diatom and Dinoflagellate Species in the Bay of Tunis (SW Mediterranean Sea). Medit. Mar. Sci. 2005, 6, 17. [Google Scholar] [CrossRef] [Green Version]
  59. Becacos-Kontos, T. Primary Production and Environmental Factors in an Oligotrophic Biome in the Aegean Sea. Mar. Biol. 1977, 42, 93–98. [Google Scholar] [CrossRef]
  60. Berman, T.; Townsend, D.; Elsayed, S.; Trees, C.; Azov, Y. Optical Transparency, Chlorophyll and Primary Productivity in the Eastern Mediterranean near the Israeli Coast. Oceanol. Acta 1984, 7, 367–372. [Google Scholar]
  61. Thingstad, T.F.; Sakshaug, E. Control of Phytoplankton Growth in Nutrient Recycling Ecosystems. Theory and Terminology. Mar. Ecol. Prog. Ser. 1990, 63, 261–272. [Google Scholar] [CrossRef]
  62. Estrada, M.; Blasco, D. Two Phases of the Phytoplankton Community in the Baja California Upwelling1. Limnol. Oceanogr. 1979, 24, 1065–1080. [Google Scholar] [CrossRef]
  63. Viličić, D. Phytoplankton Communities of the South Adriatic in the Greater Vicinity of Dubrovnik. Acta Bot. Croat. 1984, 43, 175–189. [Google Scholar]
  64. Pestorić, B.; Drakulović, D.; Mandić, M.; López Abbate, C. Distribution Changes of Plankton Communities in the Harbour Porto Montenegro (South Adriatic Sea). Stud. Mar. 2018, 31, 5–31. [Google Scholar] [CrossRef]
  65. Siokou-Frangou, I.; Christaki, U.; Mazzocchi, M.G.; Montresor, M.; Ribera d’Alcalá, M.; Vaqué, D.; Zingone, A. Plankton in the Open Mediterranean Sea: A Review. Biogeosciences 2010, 7, 1543–1586. [Google Scholar] [CrossRef] [Green Version]
  66. Ignatiades, L.; Gotsis-Skretas, O.; Pagou, K.; Krasakopoulou, E. Diversification of Phytoplankton Community Structure and Related Parameters along a Large-Scale Longitudinal East-West Transect of the Mediterranean Sea. J. Plankton Res. 2009, 31, 411–428. [Google Scholar] [CrossRef]
  67. Ninčević Gladan, Ž.; Matić, F.; Arapov, J.; Skejić, S.; Bužančić, M.; Bakrač, A.; Straka, M.; Dekneudt, Q.; Grbec, B.; Garber, R.; et al. The Relationship between Toxic Phytoplankton Species Occurrence and Environmental and Meteorological Factors along the Eastern Adriatic Coast. Harmful Algae 2020, 92, 101745. [Google Scholar] [CrossRef] [PubMed]
  68. Massana, R.; Pernice, M.; Bunge, J.A.; Campo, J. del Sequence Diversity and Novelty of Natural Assemblages of Picoeukaryotes from the Indian Ocean. ISME J. 2011, 5, 184–195. [Google Scholar] [CrossRef] [Green Version]
  69. Clarke, L.J.; Bestley, S.; Bissett, A.; Deagle, B.E. A Globally Distributed Syndiniales Parasite Dominates the Southern Ocean Micro-Eukaryote Community near the Sea-Ice Edge. ISME J. 2019, 13, 734–737. [Google Scholar] [CrossRef] [PubMed]
  70. Piredda, R.; Tomasino, M.P.; D’Erchia, A.M.; Manzari, C.; Pesole, G.; Montresor, M.; Kooistra, W.H.C.F.; Sarno, D.; Zingone, A. Diversity and Temporal Patterns of Planktonic Protist Assemblages at a Mediterranean Long Term Ecological Research Site. FEMS Microbiol. Ecol. 2017, 93, fiw200. [Google Scholar] [CrossRef] [Green Version]
  71. Mucko, M.; Bosak, S.; Casotti, R.; Balestra, C.; Ljubešić, Z. Winter Picoplankton Diversity in an Oligotrophic Marginal Sea. Mar. Genom. 2018, 42, 14–24. [Google Scholar] [CrossRef]
  72. Rowena, S.; Picard, K.; Clarke, J.; Walker, C.; Martins, C.; Marshall, C.; Amorim, A.; Woodward, M.; Widdicombe, C.; Tarran, G.; et al. Composition and Patterns of Taxa Assemblages in the Western Channel Assessed by 18S Sequencing, Microscopy and Flow Cytometry. J. Mar. Sci. Eng. 2023, 11, 480. [Google Scholar]
  73. Piredda, R.; Claverie, J.-M.; Decelle, J.; de Vargas, C.; Dunthorn, M.; Edvardsen, B.; Eikrem, W.; Forster, D.; Kooistra, W.H.C.F.; Logares, R.; et al. Diatom Diversity through HTS-Metabarcoding in Coastal European Seas. Sci. Rep. 2018, 8, 18059. [Google Scholar] [CrossRef] [Green Version]
  74. Ujević, I.; Ninčević-Gladan, Z.; Roje, R.; Skejić, S.; Arapov, J.; Marasović, I. Domoic Acid—A New Toxin in the Croatian Adriatic Shellfish Toxin Profile. Molecules 2010, 15, 6835–6849. [Google Scholar] [CrossRef] [PubMed] [Green Version]
  75. Mochemadkar, S.; Gauns, M.; Pratihary, A.; Thorat, B.; Roy, R.; Pai, I.K.; Naqvi, S. Response of Phytoplankton to Nutrient Enrichment with High Growth Rates in a Tropical Monsoonal Estuary—Zuari Estuary, India. Indian. J. Geo-Mar. Sci. 2013, 42, 314–325. [Google Scholar]
  76. Revelante, N.; Gilmartin, M. Microplankton Diversity Indices as Indicators of Eutrophication in the Northern Adriatic Sea. Hydrobiologia 1980, 70, 277–286. [Google Scholar] [CrossRef]
  77. Pucher-Petković, T.; Marasović, I. Développement Des Populations Phytoplanctoniques Caractéristiques Pour Un Milieu Eutrophisé (Baie de Kaštela, Adriatique Centrale). Acta Adriat. 1980, 21, 79–93. [Google Scholar]
  78. Boldrin, A.; Miserocchi, S.; Rabitti, S.; Turchetto, M.M.; Balboni, V.; Socal, G. Particulate Matter in the Southern Adriatic and Ionian Sea: Characterisation and Downward Fluxes. J. Mar. Syst. 2002, 33–34, 389–410. [Google Scholar] [CrossRef]
  79. Berland, B.; Burlakova, Z.P.; Georgieva, L.; Izmestieva, M.; Kholodov, V.; Krupatkina, D.K.; Maestrini, S.; Zaika, V.E. Phytoplancton Estival de La Mer Du Levant, Biomasse et Facteurs Limitants. Prod. Relat. Trophique Ecosystèmes Mar. 1987, 2, 61–83. [Google Scholar]
  80. Gotsis-Skretas, O.; Pagou, K.; Moraitou-Apostolopoulou, M.; Ignatiades, L. Seasonal Horizontal and Vertical Variability in Primary Production and Standing Stocks of Phytoplankton and Zooplankton in the Cretan Sea and the Straits of the Cretan Arc (March 1994–January 1995). Prog. Oceanogr. 1999, 44, 625–649. [Google Scholar] [CrossRef]
  81. Latasa, M.; Estrada, M.; Delgado, M. Plankton-Pigment Relationships in the Northwestern Mediterranean during Stratification. Mar. Ecol. Prog. Ser. 1992, 88, 61–73. [Google Scholar] [CrossRef]
  82. Kimor, B. Distinctive Features of the Plankton of the Eastern Mediterranean. Annls. Inst. Oceanogr. 1983, 59, 97–106. [Google Scholar]
  83. Kimor, B.; Berman, T.; Schneller, A. Phytoplankton Assemblages in the Deep Chlorophyll Maximum Layers off the Mediterranean Coast of Israel. J. Plankton Res. 1987, 9, 433–443. [Google Scholar] [CrossRef]
  84. Drakulović, D.; Vuksanović, N.; Joksimović, D. Dynamics of Phytoplankton in Boka Kotorska Bay. Stud. Mar. 2010, 25, 1–20. [Google Scholar]
  85. Burić, Z.; Cetinić, I.; Viličić, D.; Mihalić, K.C.; Carić, M.; Olujić, G. Spatial and Temporal Distribution of Phytoplankton in a Highly Stratified Estuary (Zrmanja, Adriatic Sea). Mar. Ecol. 2007, 28, 169–177. [Google Scholar] [CrossRef]
  86. Vidussi, F.; Claustre, H.; Manca, B.B.; Luchetta, A.; Marty, J.-C. Phytoplankton Pigment Distribution in Relation to Upper Thermocline Circulation in the Eastern Mediterranean Sea during Winter. J. Geophys. Res. Ocean. 2001, 106, 19939–19956. [Google Scholar] [CrossRef]
  87. Marty, J.-C.; Chiavérini, J. Seasonal and Interannual Variations in Phytoplankton Production at DYFAMED Time-Series Station, Northwestern Mediterranean Sea. Deep. Sea Res. Part. II Top. Stud. Oceanogr. 2002, 49, 2017–2030. [Google Scholar] [CrossRef]
  88. Viličić, D. A Phytoplankton Study of Southern Adriatic Waters near Dubrovnik for the Period from June 1979 to July 1980. CENTRO 1985, 1, 35–36. [Google Scholar]
  89. Estrada, M. Phytoplankton Assemblages across a NW Mediterranean Front: Changes from Winter Mixing to Spring Stratification. Oecol. Aquatic. 1991, 10, 157–185. [Google Scholar]
  90. Giaccone, G.; Geraci, R. Biogeografia Delle Alghe Del Mediterráneo. An. Jard. Bot. Madr. 1989, 1, 27–34. [Google Scholar]
  91. Gómez, F. Endemic and Indo-Pacific Plankton in the Mediterranean Sea: A Study Based on Dinoflagellate Records. J. Biogeogr. 2006, 33, 261–270. [Google Scholar] [CrossRef]
  92. Skejić, S.; Arapov, J.; Kovačević, V.; Bužančić, M.; Bensi, M.; Giani, M.; Bakrač, A.; Mihanović, H.; Gladan, Ž.N.; Urbini, L.; et al. Coccolithophore Diversity in Open Waters of the Middle Adriatic Sea in Pre- and Post-Winter Periods. Mar. Micropaleontol. 2018, 143, 30–45. [Google Scholar] [CrossRef]
  93. Cros, L.; Fortuño, J.M. Atlas of Northwestern Mediterranean Coccolithophores. Sci. Mar. 2002, 66, 1–182. [Google Scholar] [CrossRef] [Green Version]
  94. Estrada, M.; Marrase, C.; Latasa, M.; Berdalet, E.; Delgado, M.; Riera, T. Variability of Deep Chlorophyll Maximum Characteristics in the Northwestern Mediterranean. Mar. Ecol. Prog. Ser. 1993, 92, 289–300. [Google Scholar] [CrossRef]
  95. Gran-Stadniczeñko, S.; Egge, E.; Hostyeva, V.; Logares, R.; Eikrem, W.; Edvardsen, B. Protist Diversity and Seasonal Dynamics in Skagerrak Plankton Communities as Revealed by Metabarcoding and Microscopy. J. Eukaryot. Microbiol. 2019, 66, 494–513. [Google Scholar] [CrossRef] [PubMed] [Green Version]
  96. Lohrenz, S.E.; Arnone, R.A.; Wiesenburg, D.A.; DePalma, I.P. Satellite Detection of Transient Enhanced Primary Production in the Western Mediterranean Sea. Nature 1988, 335, 245–247. [Google Scholar] [CrossRef]
  97. Magazzù, G.; Decembrini, F. Primary Production, Biomass and Abundance of Phototrophic Picoplankton in the Mediterranean Sea: A Review. Aquat. Microb. Ecol. 1995, 9, 97–104. [Google Scholar] [CrossRef] [Green Version]
  98. Wang, F.; Huang, B.; Xie, Y.; Cai, S.; Wang, X.; Mu, J. Diversity, Composition, and Activities of Nano- and Pico-Eukaryotes in the Northern South China Sea With Influences of Kuroshio Intrusion. Front. Mar. Sci. 2021, 8, 658233. [Google Scholar] [CrossRef]
  99. Mena, C.; Reglero, P.; Hidalgo, M.; Sintes, E.; Santiago, R.; Martín, M.; Moyà, G.; Balbín, R. Phytoplankton Community Structure Is Driven by Stratification in the Oligotrophic Mediterranean Sea. Front. Microbiol. 2019, 10, 1698. [Google Scholar] [CrossRef] [Green Version]
  100. De Vargas, C.; Audic, S.; Henry, N.; Decelle, J.; Mahé, F.; Logares, R.; Lara, E.; Berney, Ć.; Le Bescot, N.; Probert, I.; et al. Eukaryotic Plankton Diversity in the Sunlit Ocean. Science 2015, 348, 1261605. [Google Scholar] [CrossRef] [Green Version]
  101. Margalef, R. Composición Específica Del Fitoplancton de La Costa Catalano-Levantina (Mediterráneo Occidental) En 1962–1967. Geography 1969, 33, 345–380. [Google Scholar]
  102. Šantić, D.; Piwosz, K.; Matić, F.; Vrdoljak Tomaš, A.; Arapov, J.; Dean, J.L.; Šolić, M.; Koblížek, M.; Kušpilić, G.; Šestanović, S. Artificial Neural Network Analysis of Microbial Diversity in the Central and Southern Adriatic Sea. Sci. Rep. 2021, 11, 11186. [Google Scholar] [CrossRef]
  103. Šantić, D.; Vrdoljak Tomaš, A.; Lušić, J. Spatial and Temporal Patterns of Picoplankton Community in the Central and Southern Adriatic Sea. In The Montenegrin Adriatic Coast: Marine Biology; Joksimović, A., Đurović, M., Zonn, I.S., Kostianoy, A.G., Semenov, A.V., Eds.; The Handbook of Environmental Chemistry; Springer International Publishing: Cham, Switzerland, 2020; pp. 29–51. ISBN 978-3-030-77513-1. [Google Scholar]
  104. Mackey, K.R.M.; Paytan, A.; Caldeira, K.; Grossman, A.R.; Moran, D.; McIlvin, M.; Saito, M.A. Effect of Temperature on Photosynthesis and Growth in Marine Synechococcus Spp. Plant. Physiol. 2013, 163, 815–829. [Google Scholar] [CrossRef] [PubMed] [Green Version]
  105. Hafner, D.; Car, A.; Jasprica, N.; Kapetanović, T.; Radić, I.D. Relationship between Marine Epilithic Diatoms and Environmental Variables in Oligotrophic Bay, NE Mediterranean. Mediterr. Mar. Sci. 2018, 19, 223–239. [Google Scholar] [CrossRef] [Green Version]
  106. Civitarese, G.; Crise, A.; Crispi, G.; Mosetti, R. Circulation Effects on Nitrogen Dynamics in the Ionian Sea. Oceanol. Acta 1996, 19, 609–622. [Google Scholar]
  107. Dolan, J.R.; Vidussi, F.; Claustre, H. Planktonic Ciliates in the Mediterranean Sea: Longitudinal Trends. Deep. Sea Res. Part I Oceanogr. Res. Pap. 1999, 46, 2025–2039. [Google Scholar] [CrossRef]
  108. Šantić, D.; Krstulović, N.; Šolić, M.; Ordulj, M.; Kušpilić, G. Dynamics of Prokaryotic Picoplankton Community in the Central and Southern Adriatic Sea (Croatia). Helgol. Mar. Res. 2013, 67, 471–481. [Google Scholar] [CrossRef] [Green Version]
  109. Larkin, A.A.; Blinebry, S.K.; Howes, C.; Lin, Y.; Loftus, S.E.; Schmaus, C.A.; Zinser, E.R.; Johnson, Z.I. Niche Partitioning and Biogeography of High Light Adapted Prochlorococcus across Taxonomic Ranks in the North Pacific. ISME J. 2016, 10, 1555–1567. [Google Scholar] [CrossRef]
  110. Mella-Flores, D.; Mazard, S.; Humily, F.; Partensky, F.; Mahé, F.; Bariat, L.; Courties, C.; Marie, D.; Ras, J.; Mauriac, R.; et al. Is the Distribution of Prochlorococcus and Synechococcus Ecotypes in the Mediterranean Sea Affected by Global Warming? Biogeosciences 2011, 8, 2785–2804. [Google Scholar] [CrossRef] [Green Version]
  111. Zwirglmaier, K.; Jardillier, L.; Ostrowski, M.; Mazard, S.; Garczarek, L.; Vaulot, D.; Not, F.; Massana, R.; Ulloa, O.; Scanlan, D.J. Global Phylogeography of Marine Synechococcus and Prochlorococcus Reveals a Distinct Partitioning of Lineages among Oceanic Biomes. Env. Microbiol. 2008, 10, 147–161. [Google Scholar] [CrossRef]
  112. Coello-Camba, A.; Agustí, S. Picophytoplankton Niche Partitioning in the Warmest Oligotrophic Sea. Front. Mar. Sci. 2021, 8, 651877. [Google Scholar] [CrossRef]
  113. Schmoker, C.; Hernández-León, S. Stratification Effects on the Plankton of the Subtropical Canary Current. Prog. Oceanogr. 2013, 119, 24–31. [Google Scholar] [CrossRef]
  114. Šilović, T.; Mihanović, H.; Batistić, M.; Radić, I.D.; Hrustić, E.; Najdek, M. Picoplankton Distribution Influenced by Thermohaline Circulation in the Southern Adriatic. Cont. Shelf Res. 2018, 155, 21–33. [Google Scholar] [CrossRef]
  115. Moore, L.R.; Post, A.F.; Rocap, G.; Chisholm, S.W. Utilization of Different Nitrogen Sources by the Marine Cyanobacteria Prochlorococcus and Synechococcus. Limnol. Oceanogr. 2002, 47, 989–996. [Google Scholar] [CrossRef]
  116. Duarte, C.M.; Agustí, S.; Gasol, J.M.; Vaqué, D.; Vazquez-Dominguez, E. Effect of Nutrient Supply on the Biomass Structure of Planktonic Communities: An Experimental Test on a Mediterranean Coastal Community. Mar. Ecol. Prog. Ser. 2000, 206, 87–95. [Google Scholar] [CrossRef] [Green Version]
  117. Jardillier, L.; Boucher, D.; Personnic, S.; Jacquet, S.; Thénot, A.; Sargos, D.; Amblard, C.; Debroas, D. Relative Importance of Nutrients and Mortality Factors on Prokaryotic Community Composition in Two Lakes of Different Trophic Status: Microcosm Experiments. FEMS Microbiol. Ecol. 2005, 53, 429–443. [Google Scholar] [CrossRef] [PubMed]
  118. Pittera, J.; Humily, F.; Thorel, M.; Grulois, D.; Garczarek, L.; Six, C. Connecting Thermal Physiology and Latitudinal Niche Partitioning in Marine Synechococcus. ISME J. 2014, 8, 1221–1236. [Google Scholar] [CrossRef]
  119. Korlević, M.; Pop RIstova, P.; Garić, R.; Amann, R.; Orlić, S. Bacterial Diversity in the South Adriatic Sea during a Strong Deep Winter Convection Year. Appl. Environ. Microbiol. 2015, 81, 1715–1726. [Google Scholar] [CrossRef] [PubMed] [Green Version]
  120. Šantić, D.; Kovačević, V.; Bensi, M.; Giani, M.; Vrdoljak Tomaš, A.; Ordulj, M.; Santinelli, C.; Šestanović, S.; Šolić, M.; Grbec, B. Picoplankton Distribution and Activity in the Deep Waters of the Southern Adriatic Sea. Water 2019, 11, 1655. [Google Scholar] [CrossRef] [Green Version]
  121. Henley, W.J.; Hironaka, J.L.; Guillou, L.; Buchheim, M.A.; Buchheim, J.A.; Fawley, M.W.; Fawley, K.P. Phylogenetic Analysis of the ‘Nannochloris-like’ Algae and Diagnoses of Picochlorum Oklahomensis Gen. et Sp. Nov. (Trebouxiophyceae, Chlorophyta). Phycologia 2004, 43, 641–652. [Google Scholar] [CrossRef]
  122. Claustre, H.; Sciandra, A.; Vaulot, D. Introduction to the Special Section Bio-Optical and Biogeochemical Conditions in the South East Pacific in Late 2004: The BIOSOPE Program. Biogeosciences 2008, 5, 679–691. [Google Scholar] [CrossRef] [Green Version]
  123. Shi, X.L.; Marie, D.; Jardillier, L.; Scanlan, D.J.; Vaulot, D. Groups without Cultured Representatives Dominate Eukaryotic Picophytoplankton in the Oligotrophic South East Pacific Ocean. PLoS ONE 2009, 4, e7657. [Google Scholar] [CrossRef] [Green Version]
  124. Sherr, E.B.; Sherr, B.F. Bacterivory and Herbivory: Key Roles of Phagotrophic Protists in Pelagic Food Webs. Microb. Ecol. 1994, 28, 223–235. [Google Scholar] [CrossRef] [PubMed]
  125. Turk, V.; Lučić, D.; Njire, J.; Terzić, S.; Tinta, T.; Benović, A.; Malej, A. The Epiplankton Community in the Southern Adriatic: Multiple Trophic Levels along the South–North and Inshore–Offshore Gradients. Acta Adriatica 2012, 53, 263–276. [Google Scholar]
  126. Gallina, A.A.; Celussi, M.; Del Negro, P. Large-Scale Distribution and Production of Bacterioplankton in the Adriatic Sea. J. Sea Res. 2011, 66, 1–8. [Google Scholar] [CrossRef]
  127. Yeh, Y.-C.; Fuhrman, J.A. Contrasting Diversity Patterns of Prokaryotes and Protists over Time and Depth at the San-Pedro Ocean Time Series. ISME Commun. 2022, 2, 36. [Google Scholar] [CrossRef]
  128. Campbell, L.; Gaonkar, C.C.; Henrichs, D.W. Chapter 5—Integrating Imaging and Molecular Approaches to Assess Phytoplankton Diversity. In Advances in Phytoplankton Ecology; Clementson, L.A., Eriksen, R.S., Willis, A., Eds.; Elsevier: Amsterdam, The Netherlands, 2022; pp. 159–190. ISBN 978-0-12-822861-6. [Google Scholar]
Figure 1. Location of study area (Lastovo Island, South Adriatic Sea) (A) and sampling station Struga (S1) (B) superimposed on bathymetry maps.
Water 15 02299 g001
Figure 2. Chlorophyll a (Chl a) fluorescence vertical profiles recovered from CTD casts (A) and temperature data recorded on loggers from the cliff at S1 station (B). Vertical dotted lines indicate CTD casts. Black horizontal ticks in panel (B) indicate deployment depths of recovered temperature loggers.
Water 15 02299 g002
Figure 3. Chl a, nitrite (NO2), nitrate (NO3), phosphate (PO4), and silicate (SiO4) concentrations during the study period (12–21 July 2021).
Water 15 02299 g003
Figure 4. Phytoplankton taxonomic composition at station Struga (S1), Lastovo Island.
Water 15 02299 g004
Figure 5. Phytoplankton (micro- and nano-fraction), picophytoplankton (photosynthetic picoeukaryotes, or PPEs, Synechococcus sp., and Prochlorococcus sp.), and bacterioplankton (heterotrophic bacteria) abundance distribution (surface, thermocline, deep chlorophyll maximum, or DCM, layer) during the investigating period.
Water 15 02299 g005
Figure 6. Canonical correspondence analysis (CCA) of environmental variables and plankton groups (pico-, nano-, and microphytoplankton and heterotrophic bacteria). Circles represent sample (N = 59) scores and constraints (weighted averages of plankton groups and linear combinations of constrained variables, respectively) colored by factor water layer (surface, thermocline, and DCM), while asterisk represent scores of plankton groups. Superimposed vectors (arrows) represent explanatory environmental variables: temperature, phosphates (PO4), nitrates (NO3), nitrites (NO2), silicates (SiO4), and Chl a. Abbreviations: PRO (Prochlorococcus); SYN (Synechococcus); PPEs (photosynthetic picoeukaryotes); HB (heterotrophic bacteria).
Water 15 02299 g006
Figure 7. (A) Bar plot with relative abundances (ASV%) in the prokaryotic community, phylum level. (B) Heatmap with relative abundances (log10 ASV%) in eukaryotic community, phylum level. Legend explaining symbols of fractioned samples and colors of sample dates positioned in the bottom right corner of panel A.
Water 15 02299 g007
Table 1. Maximum abundances (cells L−1) and frequencies of appearance (%) for phytoplankton dominant taxa/groups (dominance is defined as fr > 50%, and max > 500 cells L−1) at station Struga (S1), Lastovo Island, South Adriatic Sea.
Dominant Taxa/GroupMax (Cell L−1)Fr (%)
Dinoflagellates indet. (<20 µm)23,43091.67
Penatae indet.113585.00
Pseudo-nitzschia delicatissima (Cleve) Heiden14,06081.67
Proboscia alata (Brightwell) Sundström132580.00
Rhizosolenia imbricata Brightwell75575.00
Gyrodinium fusiforme Kofoid & Swezy57058.33
Coccolitophorids indet. (<10 µm)568055.00
Cylindrotheca closterium (Ehrenberg) Reimann & J.C. Lewin94553.33
Leptocylindrus danicus Cleve322053.33
Guinardia flaccida (Castracane) Peragallo57051.67
Guinardia striata (Stolterfoth) Hasle227051.67
Hemiaulus chinensis Greville113551.67
Dinoflagellates indet. (micro)97051.67
Thalassionema frauenfeldii (Grunow) Tempère & Peragallo151550.00
Cryptophyta851050.00
Table 2. Similarities percentage (SIMPER) analysis of phytoplankton dominant taxa/groups between surface (S), thermocline (T), and deep chlorophyll maximum (DCM) layers, and their contribution to average dissimilarity. Abbreviations: average contribution/standard deviation (δ/σ), species contribution (Σδ%), average dissimilarity (Av. Diss%).
S and T
(δ/σ; Σδ%)
S and DCM
(δ/σ; Σδ%)
T and DCM
(δ/σ; Σδ%)
Dominant taxa/groupsAv. Diss% = 36.53Av. Diss% = 48.86Av. Diss% = 46.47
Cryptophyta1.10; 10.20.99; 7.491.41; 10.58
Coccolitophorids indet. (<10 µm)1.02; 8.661.16; 8.641.21; 9.03
Leptocylindrus danicus1.18; 8.851.07; 6.831.16; 7.65
Thalassionema frauenfeldi0.97; 6.541.41; 8.091.34; 6.99
Cylindrotheca closterium1.11; 6.451.09; 6.051.20; 6.61
Guinardia striata 1.30; 7.081.45; 7.76
Dinoflagellates indet. (<20 µm) 0.78; 6.710.86; 7.04
Proboscia alata 1.19; 6.811.15; 6.20
Pseudo-nitzschia delicatissima1.13; 8.671.11; 7.74
Combried1.20; 7.581.32; 7.35
Gyrodinium fusiforme1.20; 6.11 1.57; 7.16
Hemiaulus chinensis1.21; 6.14 1.14; 5.71
Rhizosolenia imbricate1.00; 5.96
Table 3. Spearman’s rank order correlation matrix for physico-chemical parameters. Only significant correlations are shown (p < 0.05, N = 59) Only significant correlations are shown (p < 0.06, N = 59). Bold values represent the highest correlations for each parameter.
NO2NO3PO4SiO4TempChl a
NO2 (µM)1.00
NO3 (µM)0.451.00
PO4 (µM)0.630.651.00
SiO4 (µM)0.370.850.561.00
Temperature (°C) 0.53 −0.421.00
Chlorophyll a (µgL−1) 0.57 0.50−0.741.00
Disclaimer/Publisher’s Note: The statements, opinions and data contained in all publications are solely those of the individual author(s) and contributor(s) and not of MDPI and/or the editor(s). MDPI and/or the editor(s) disclaim responsibility for any injury to people or property resulting from any ideas, methods, instructions or products referred to in the content.

