


The Application and Applicability of HEC-HMS Model in Flood Simulation under the Condition of River Basin Urbanization

Abstract
1. Introduction
2. Materials and Data
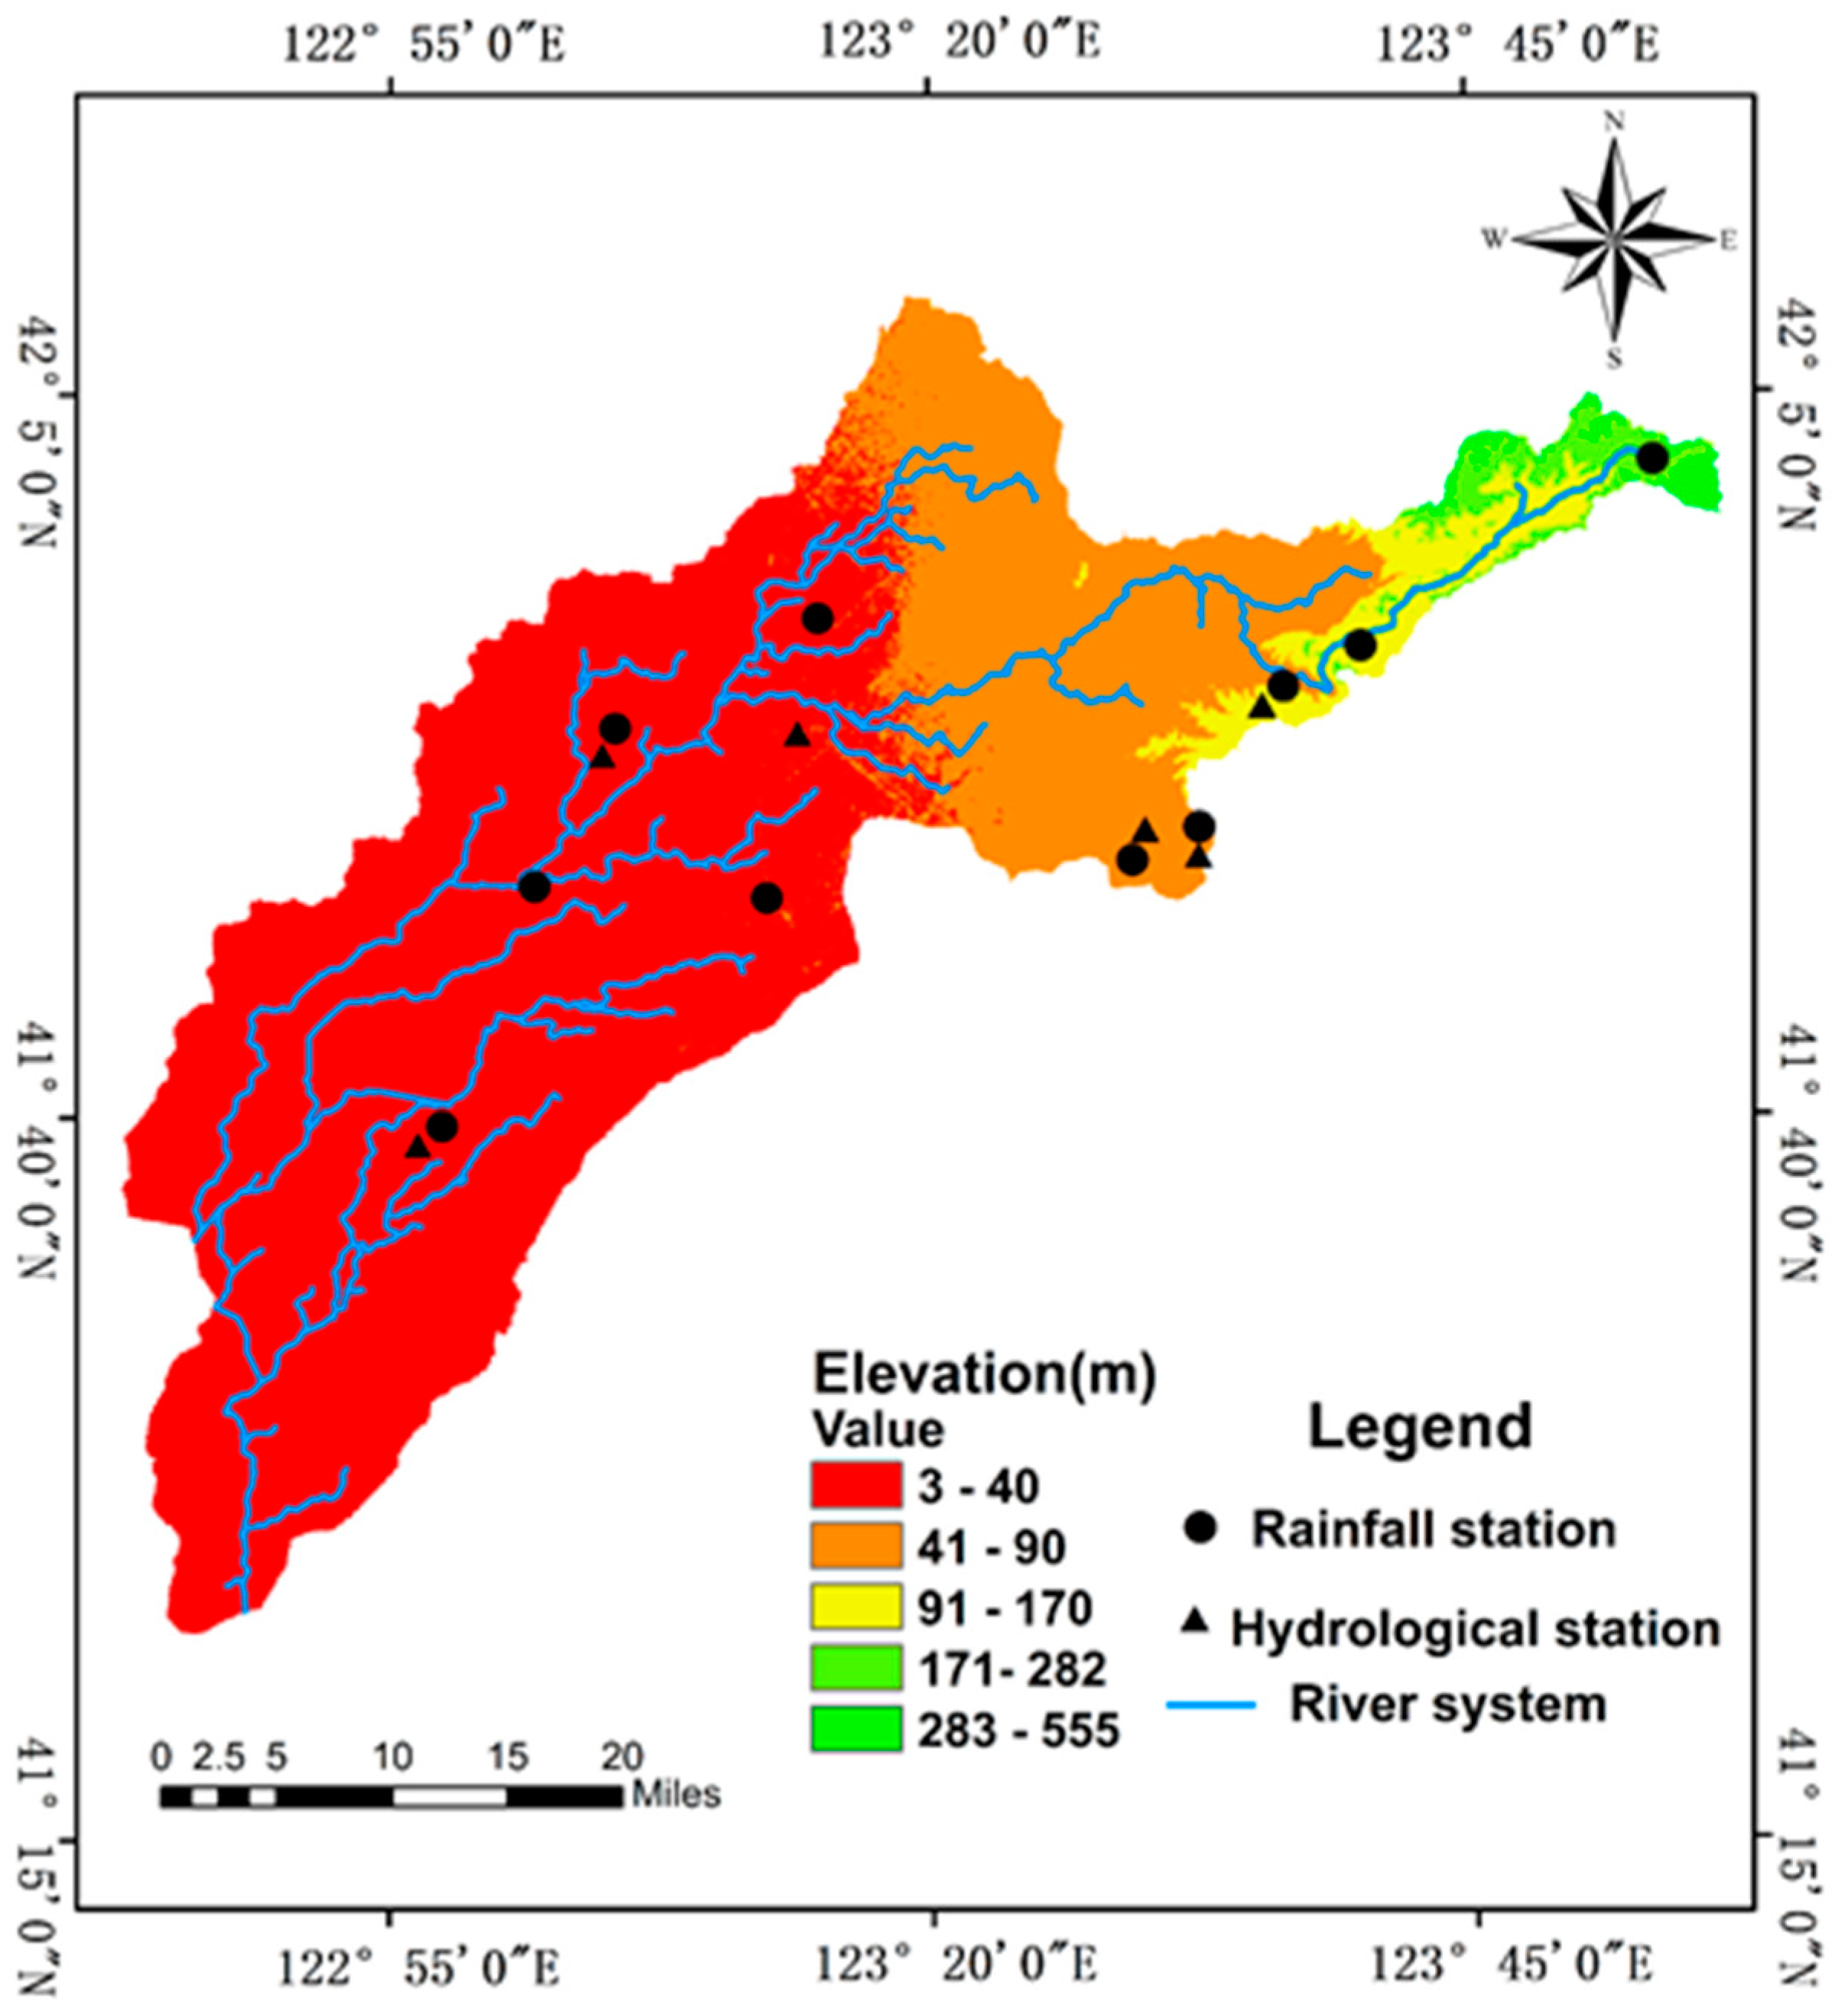
2.1. Study Area
2.2. Hydrological Data
3. Research Methods
3.1. Hydrological Model Methods Selection
3.2. Loss Model
3.3. Transform Model
3.4. Base Flow Model
3.5. Routing Model
3.6. Accuracy Evaluation Methods
4. Results and Analysis
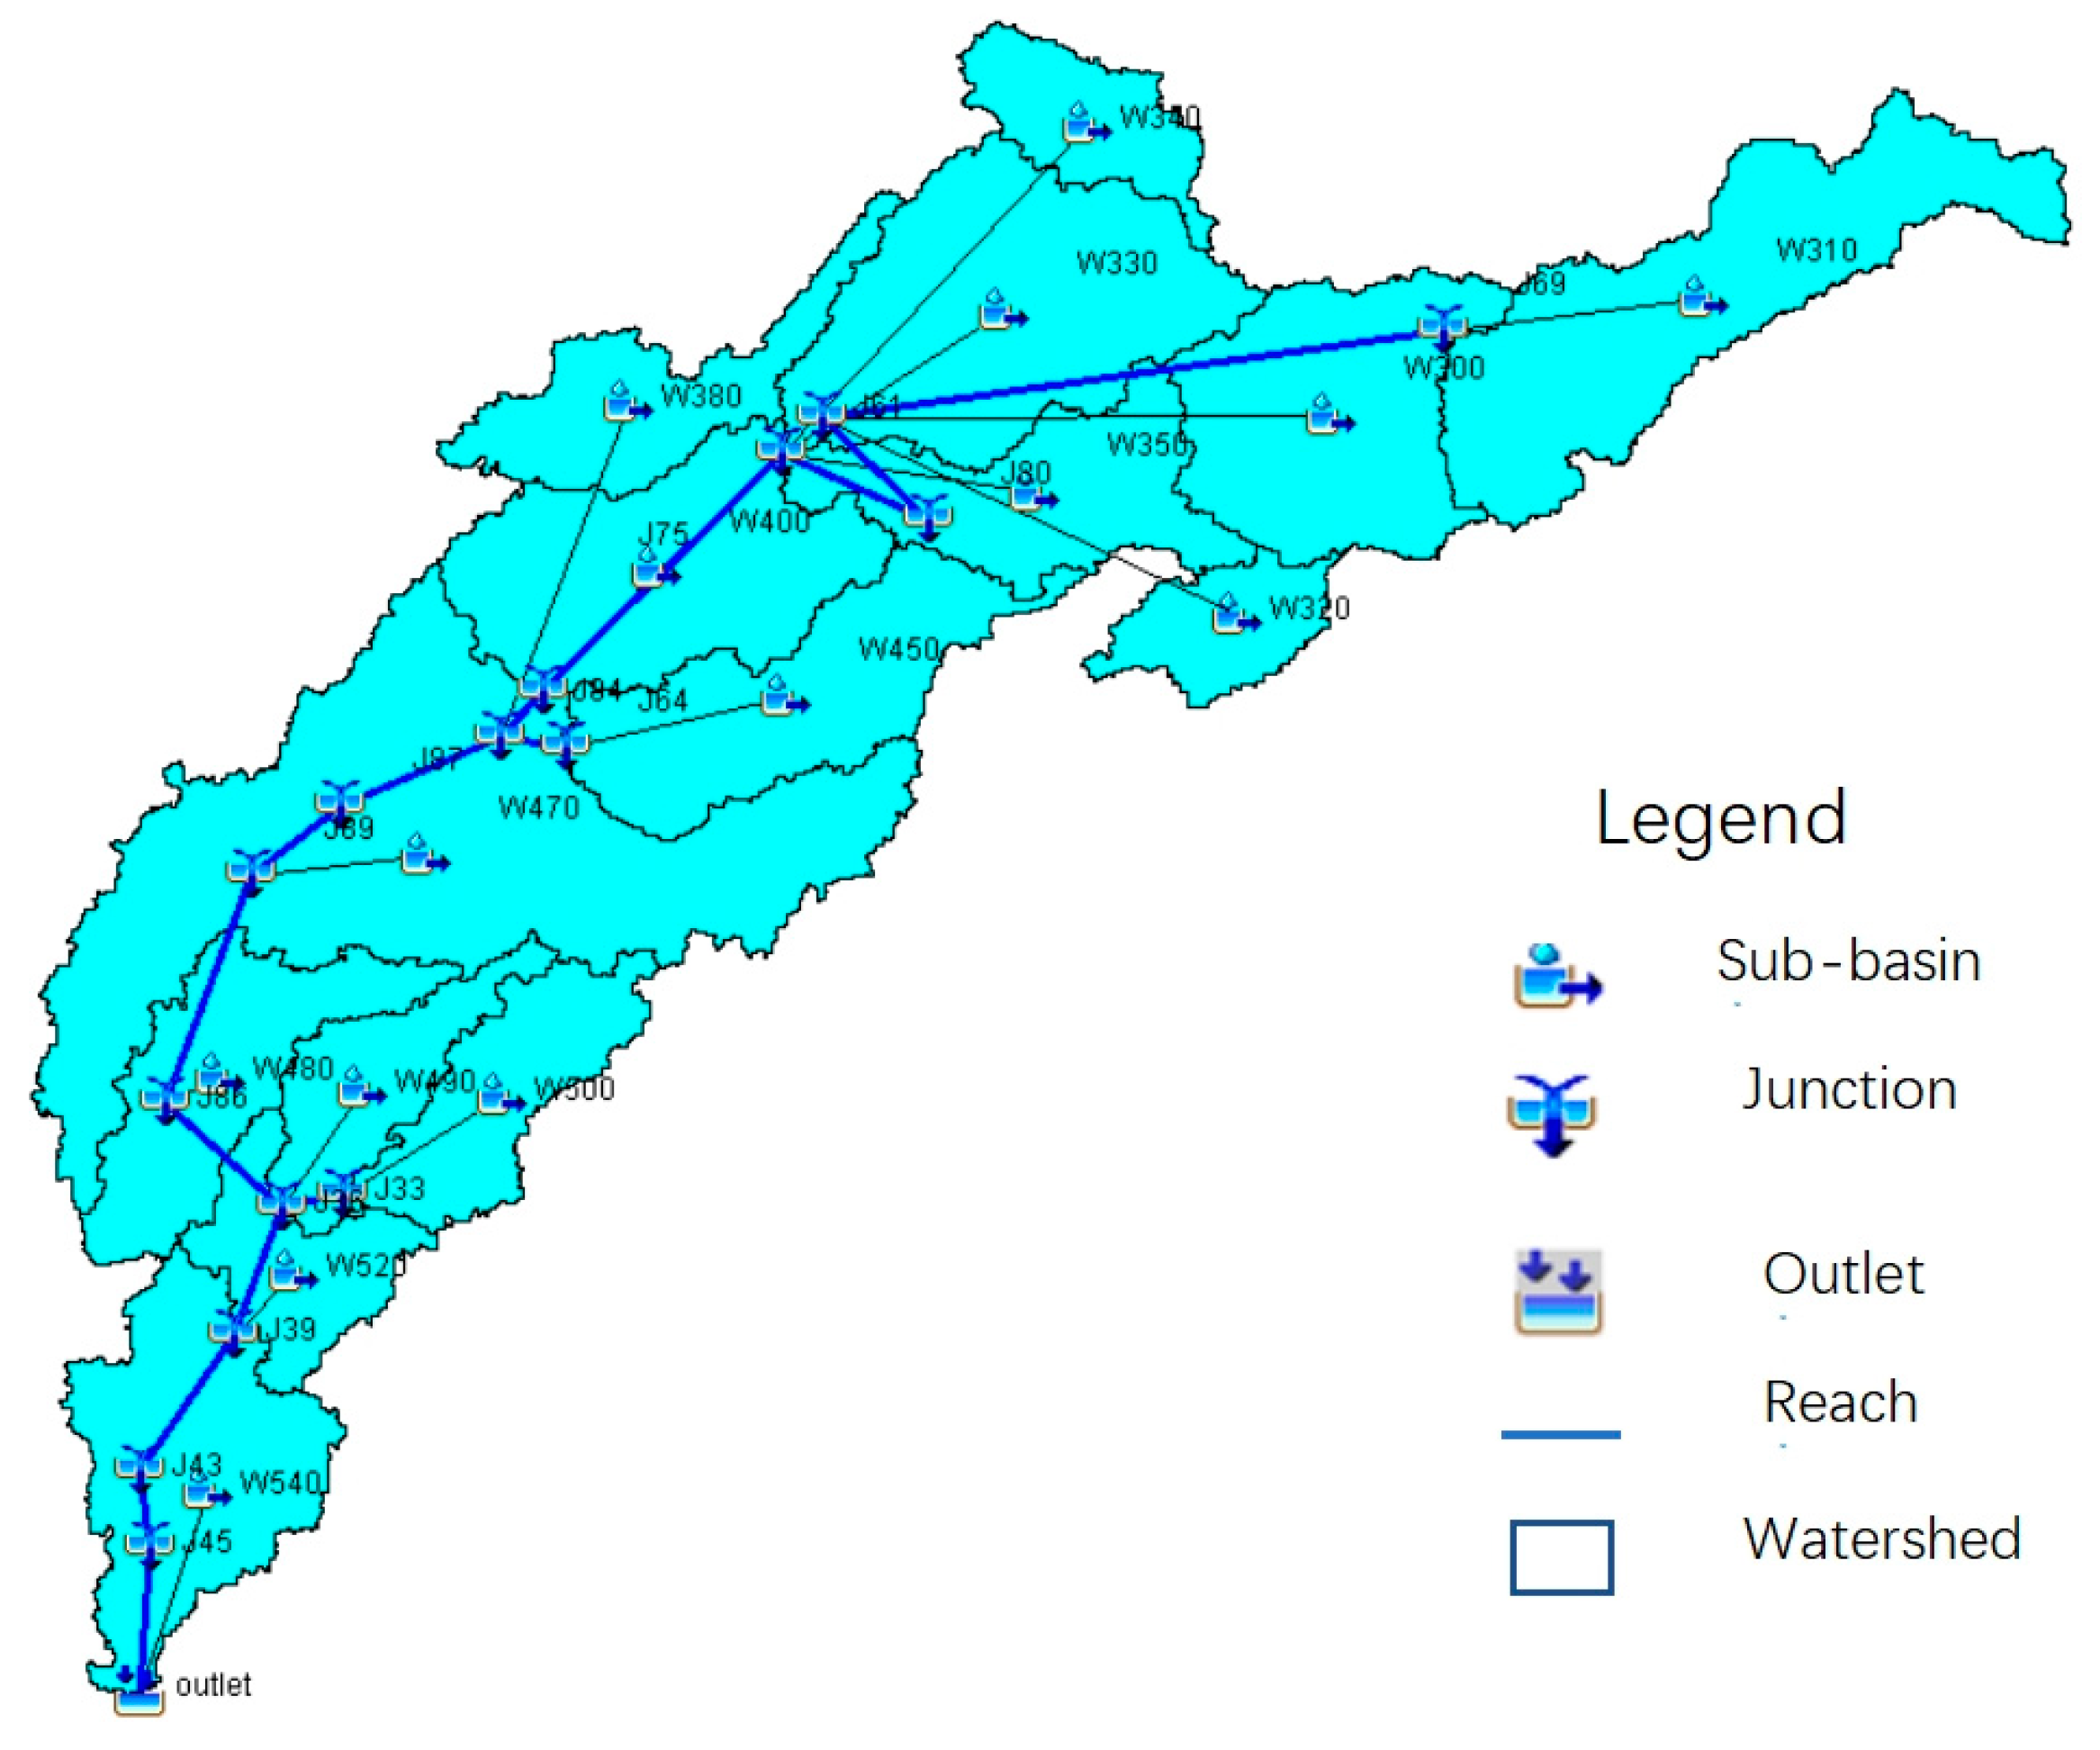
4.1. Model Building
4.2. Determination of CN Value
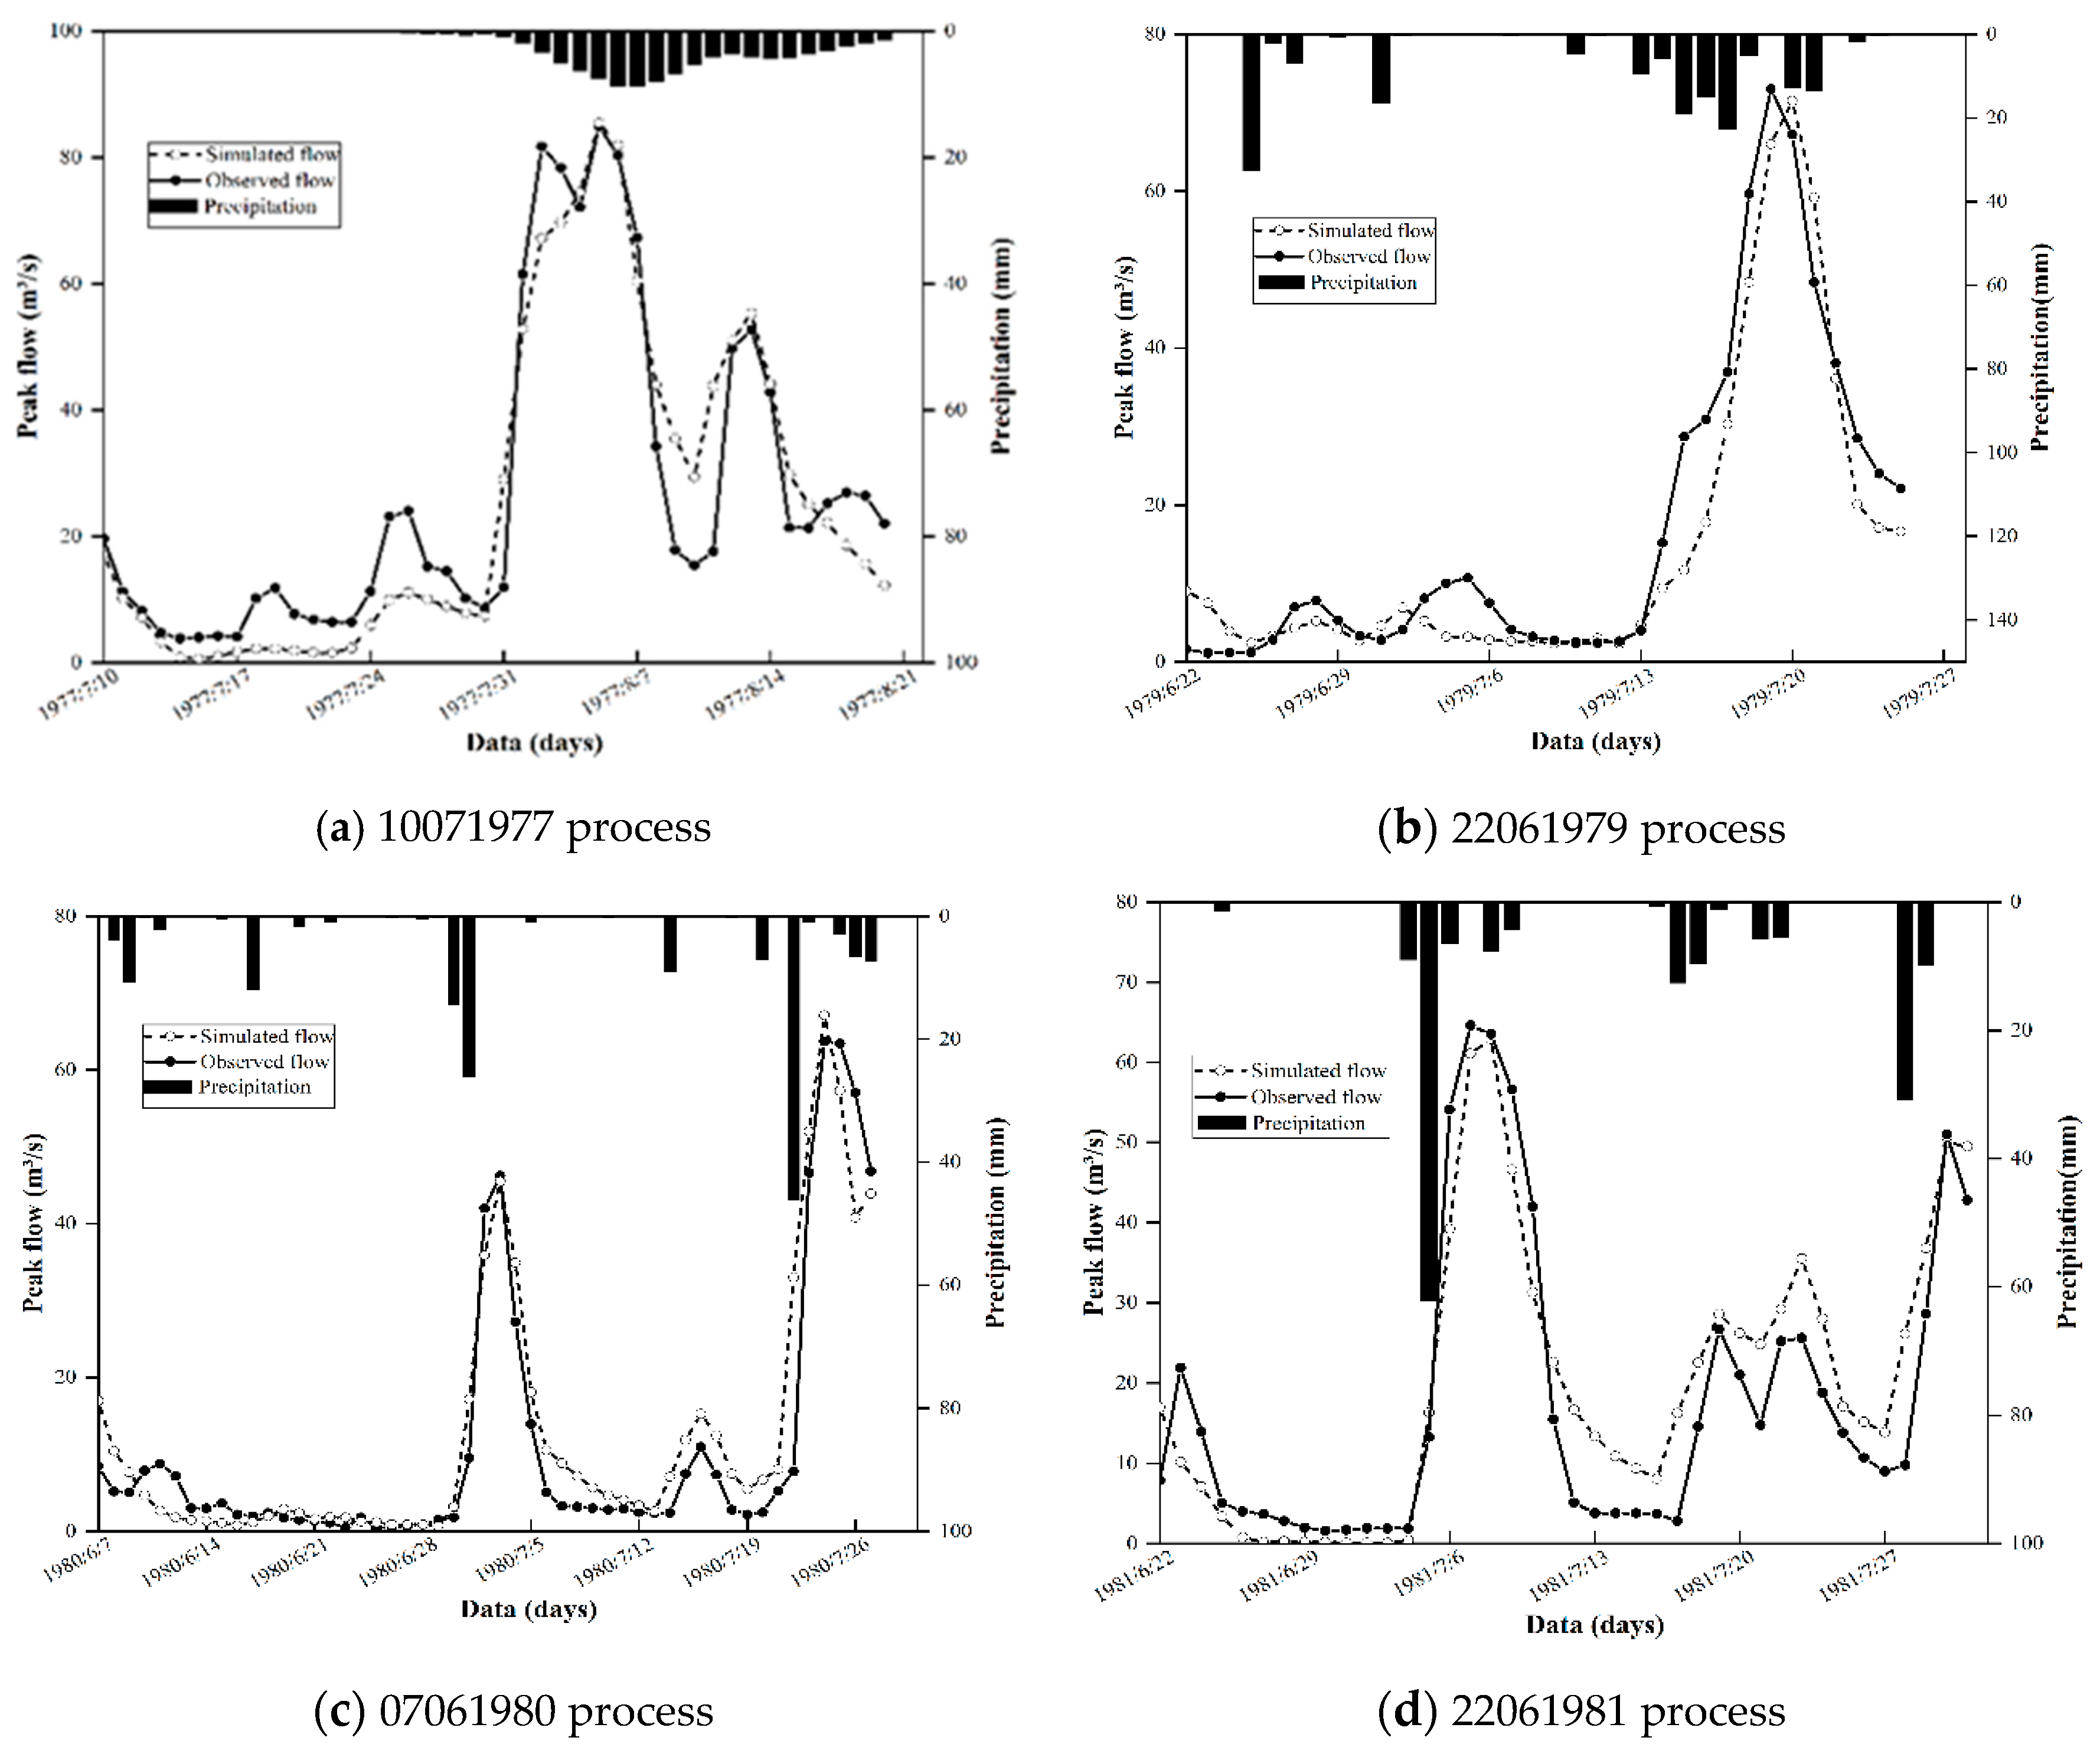
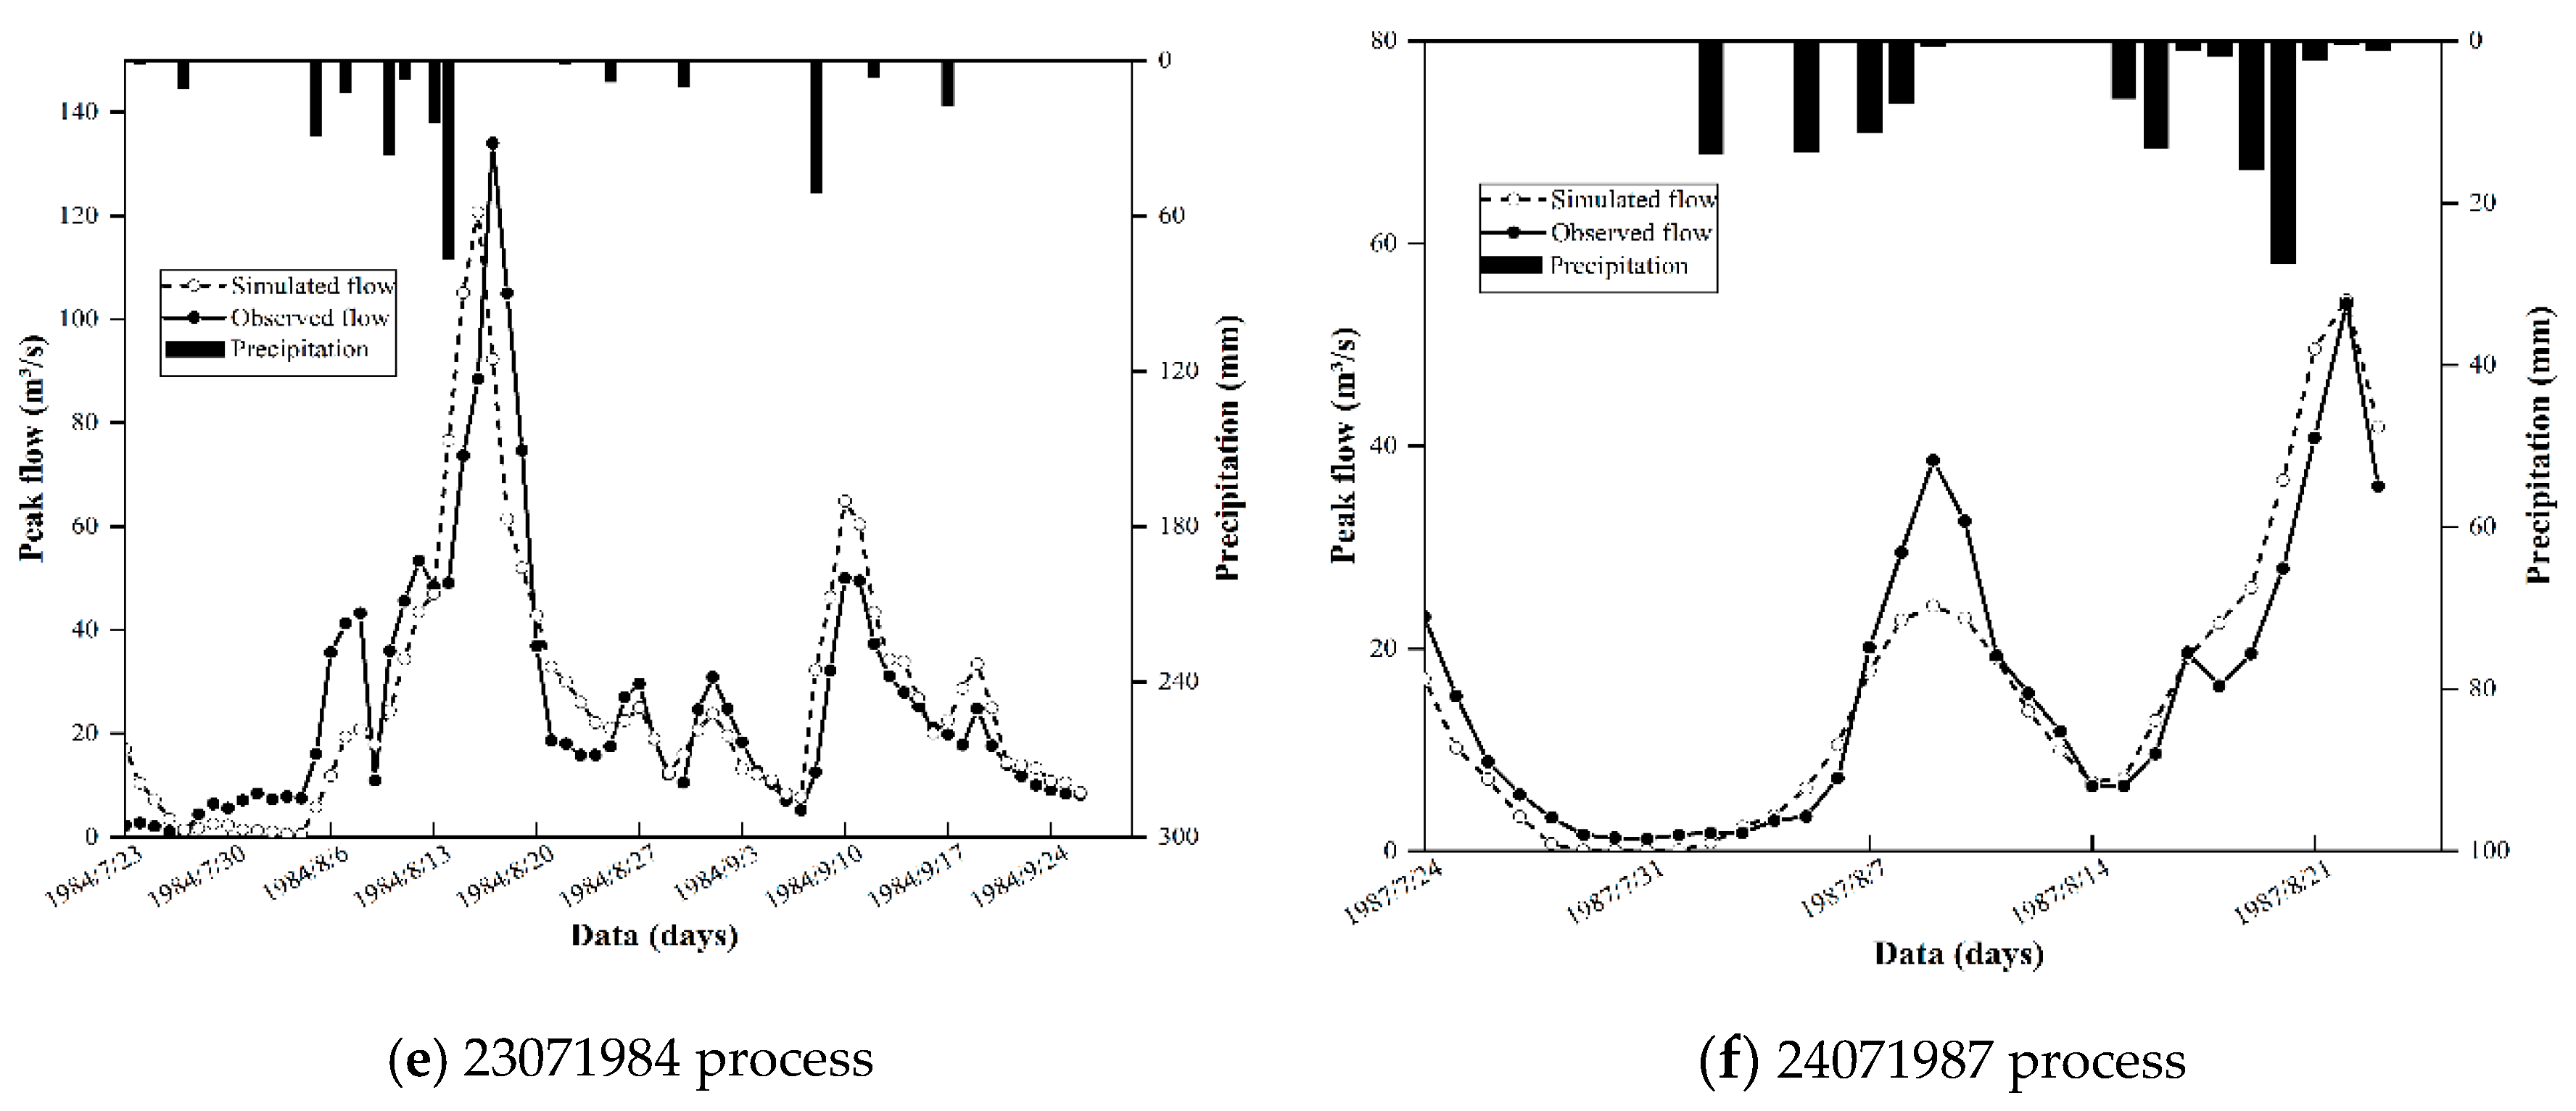
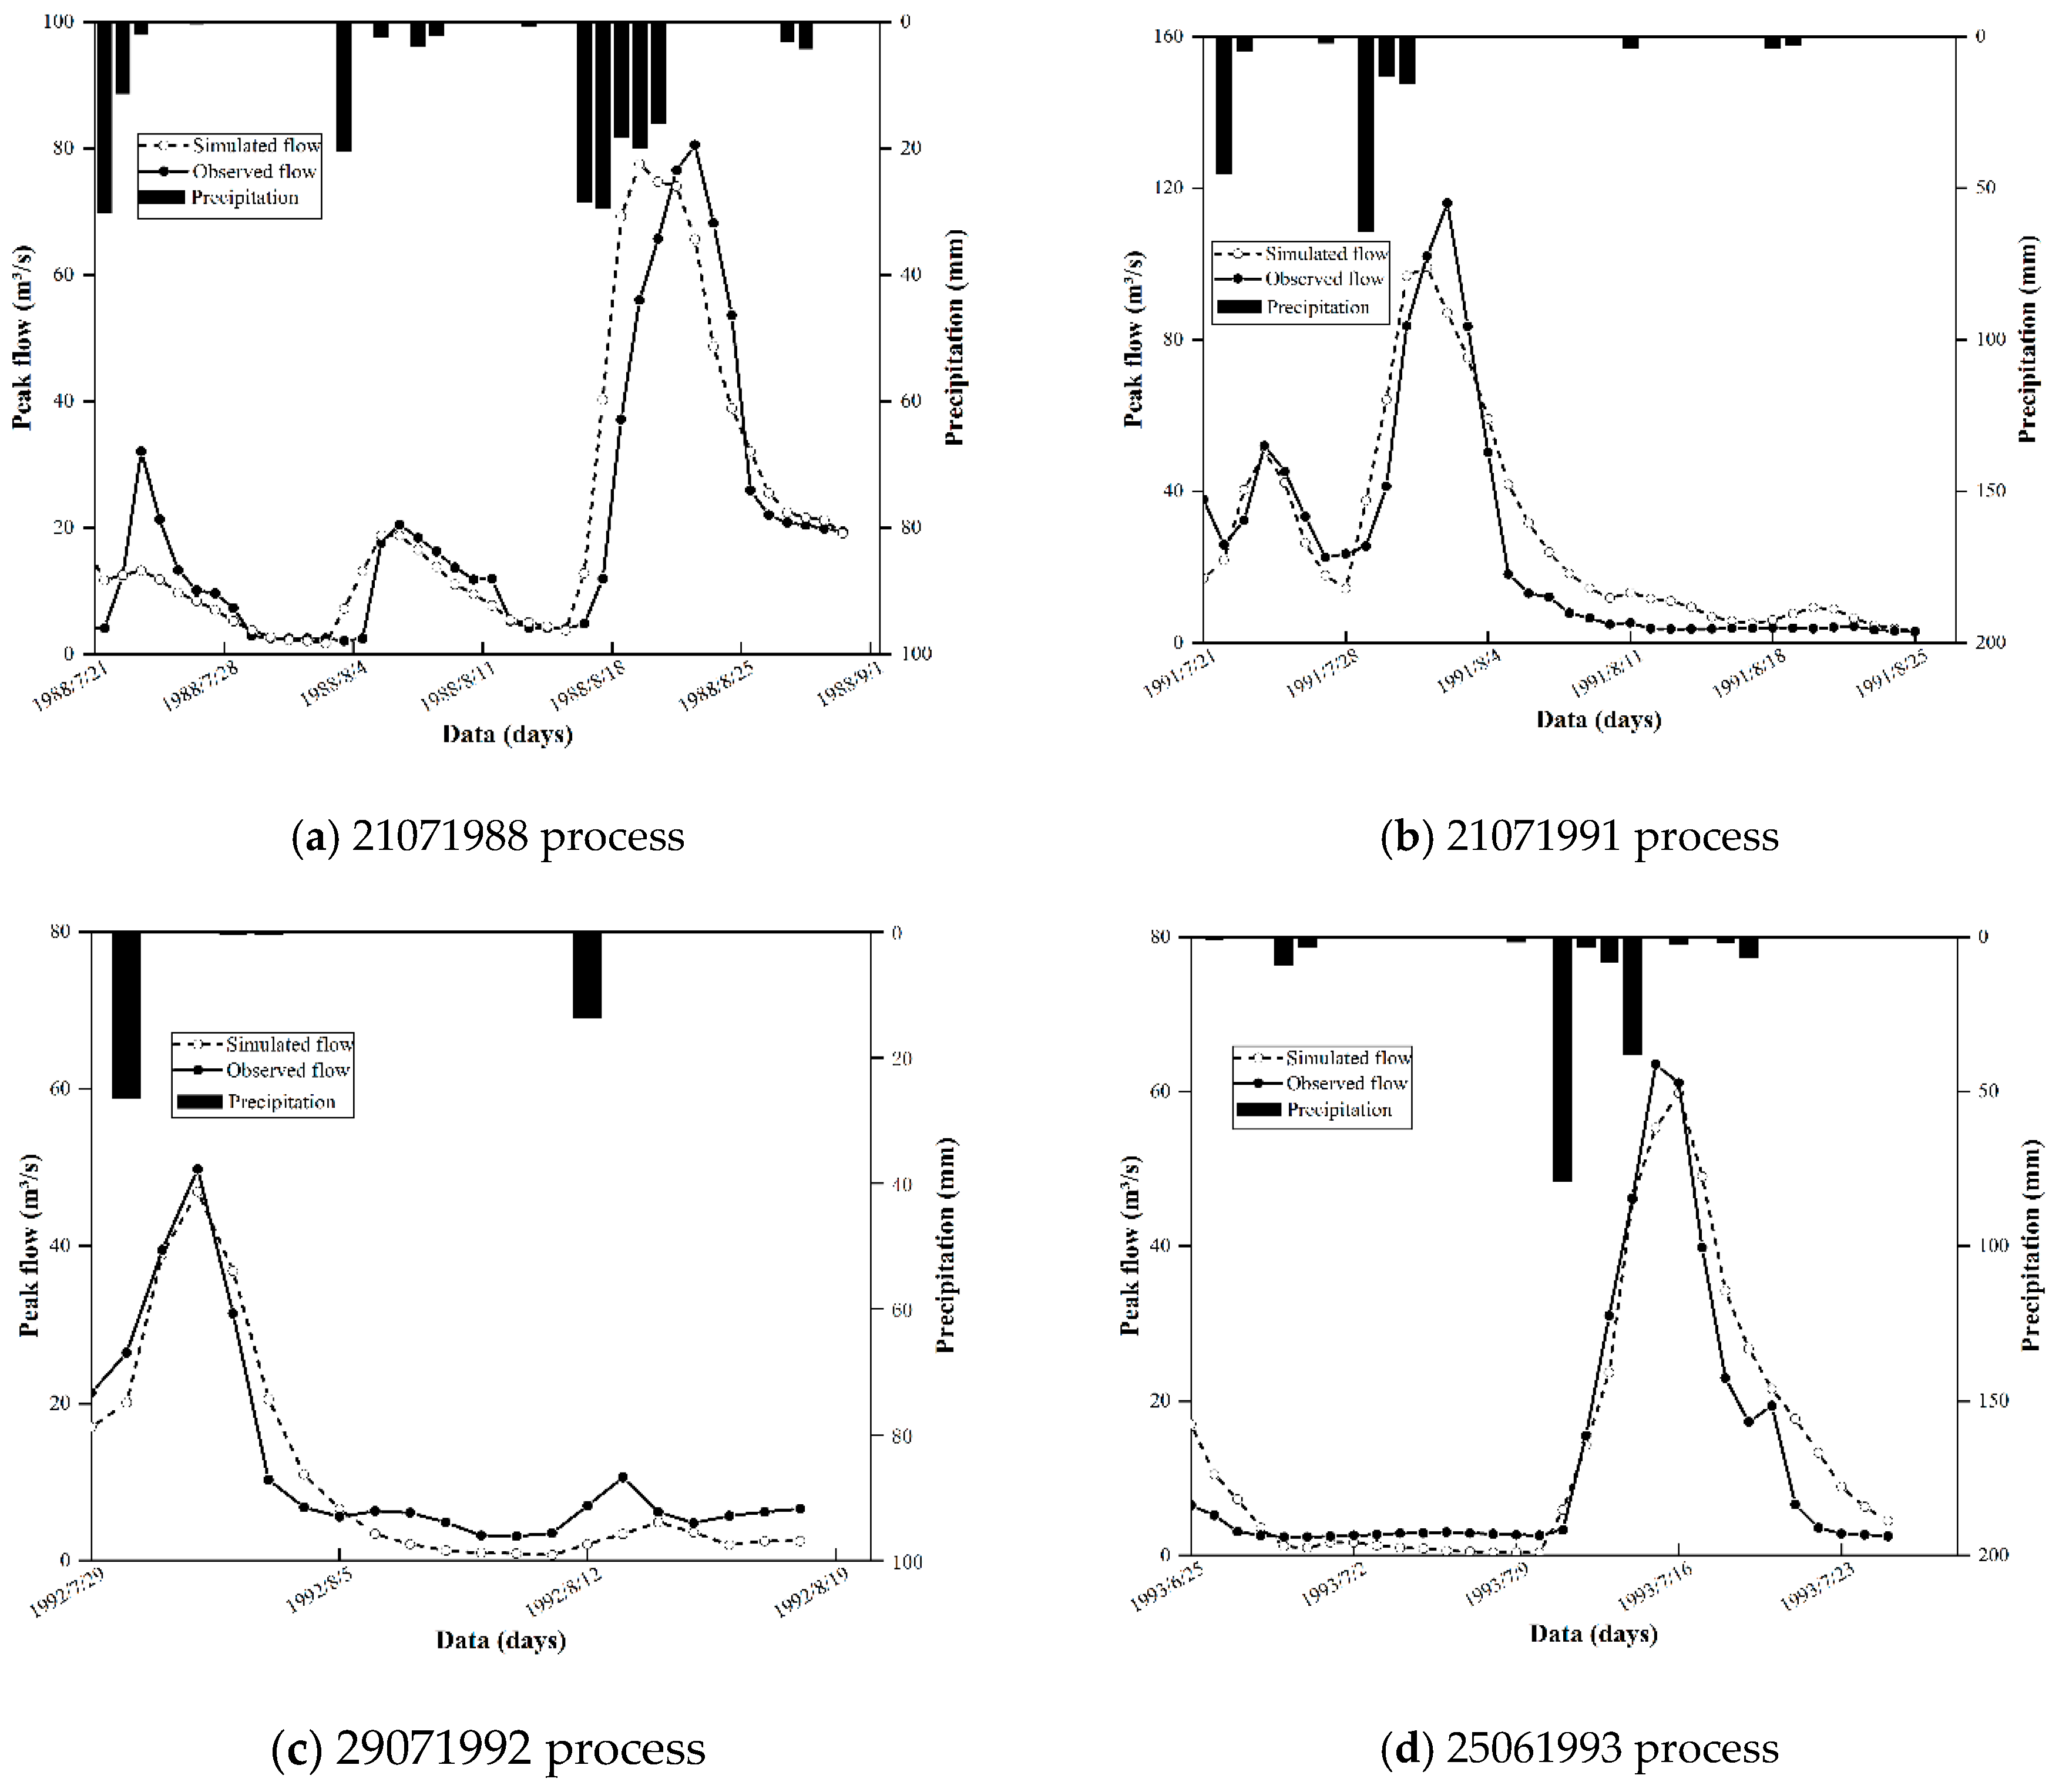
4.3. Model Calibration and Validation before Urbanization
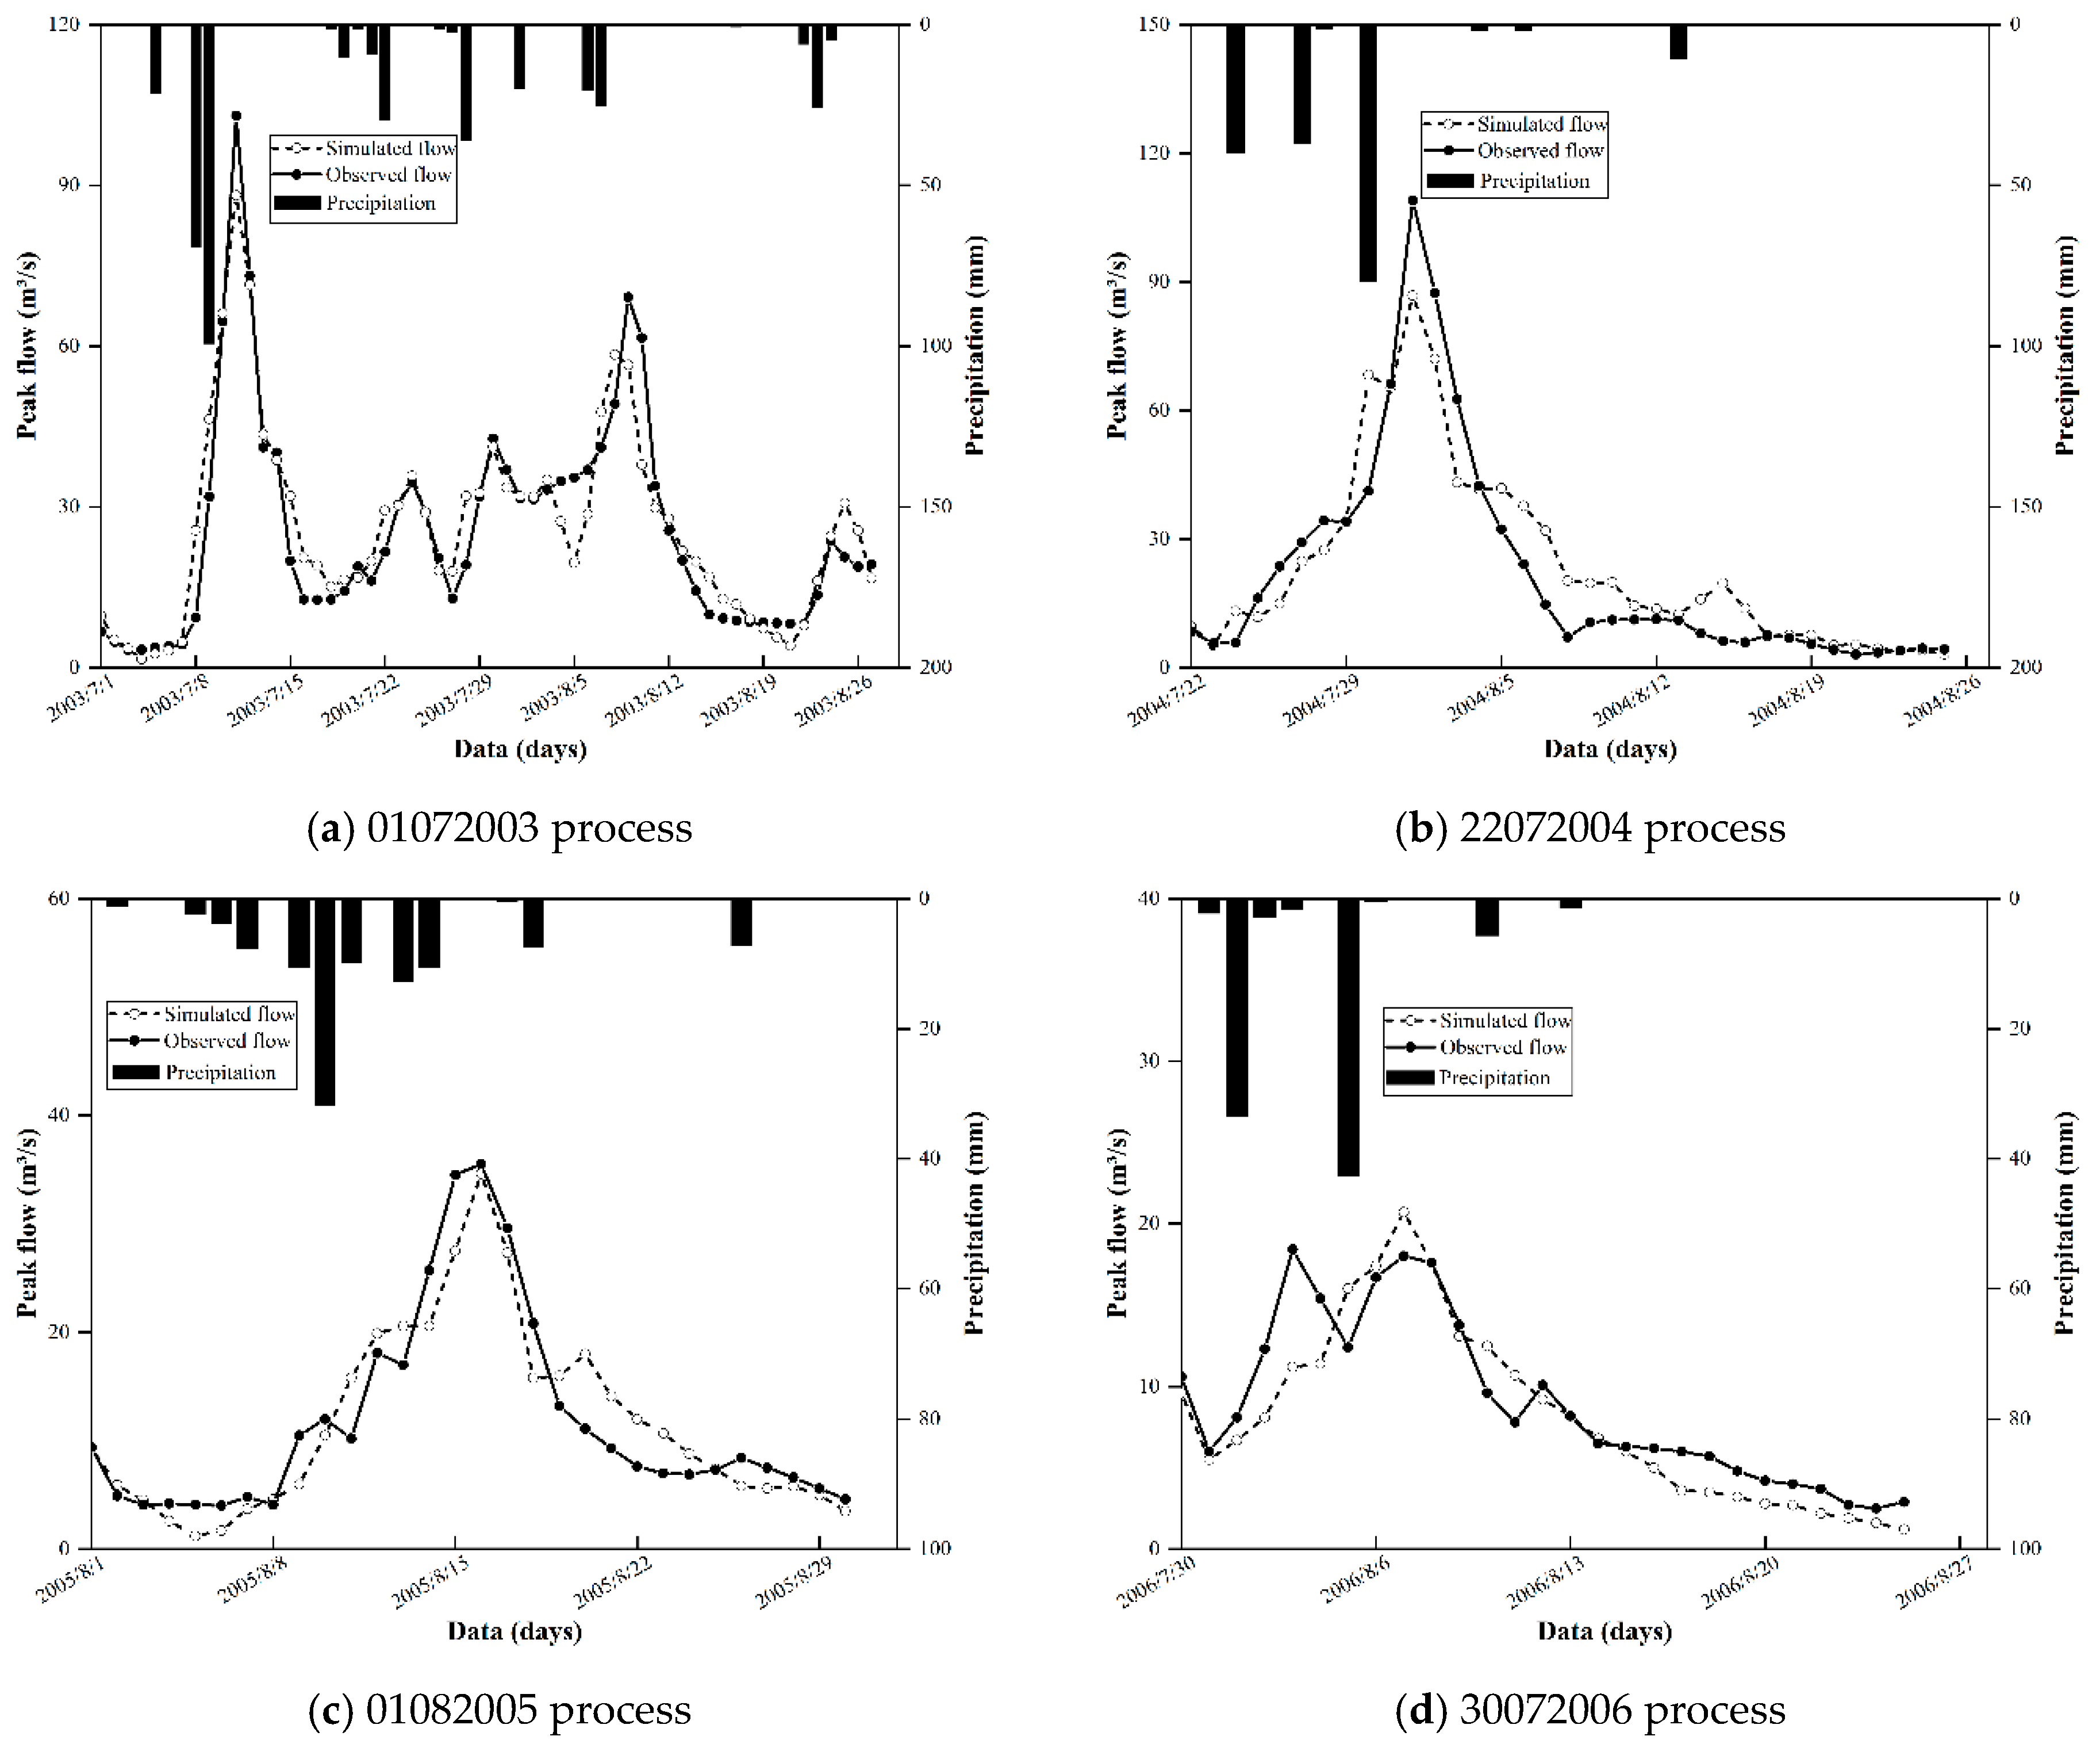
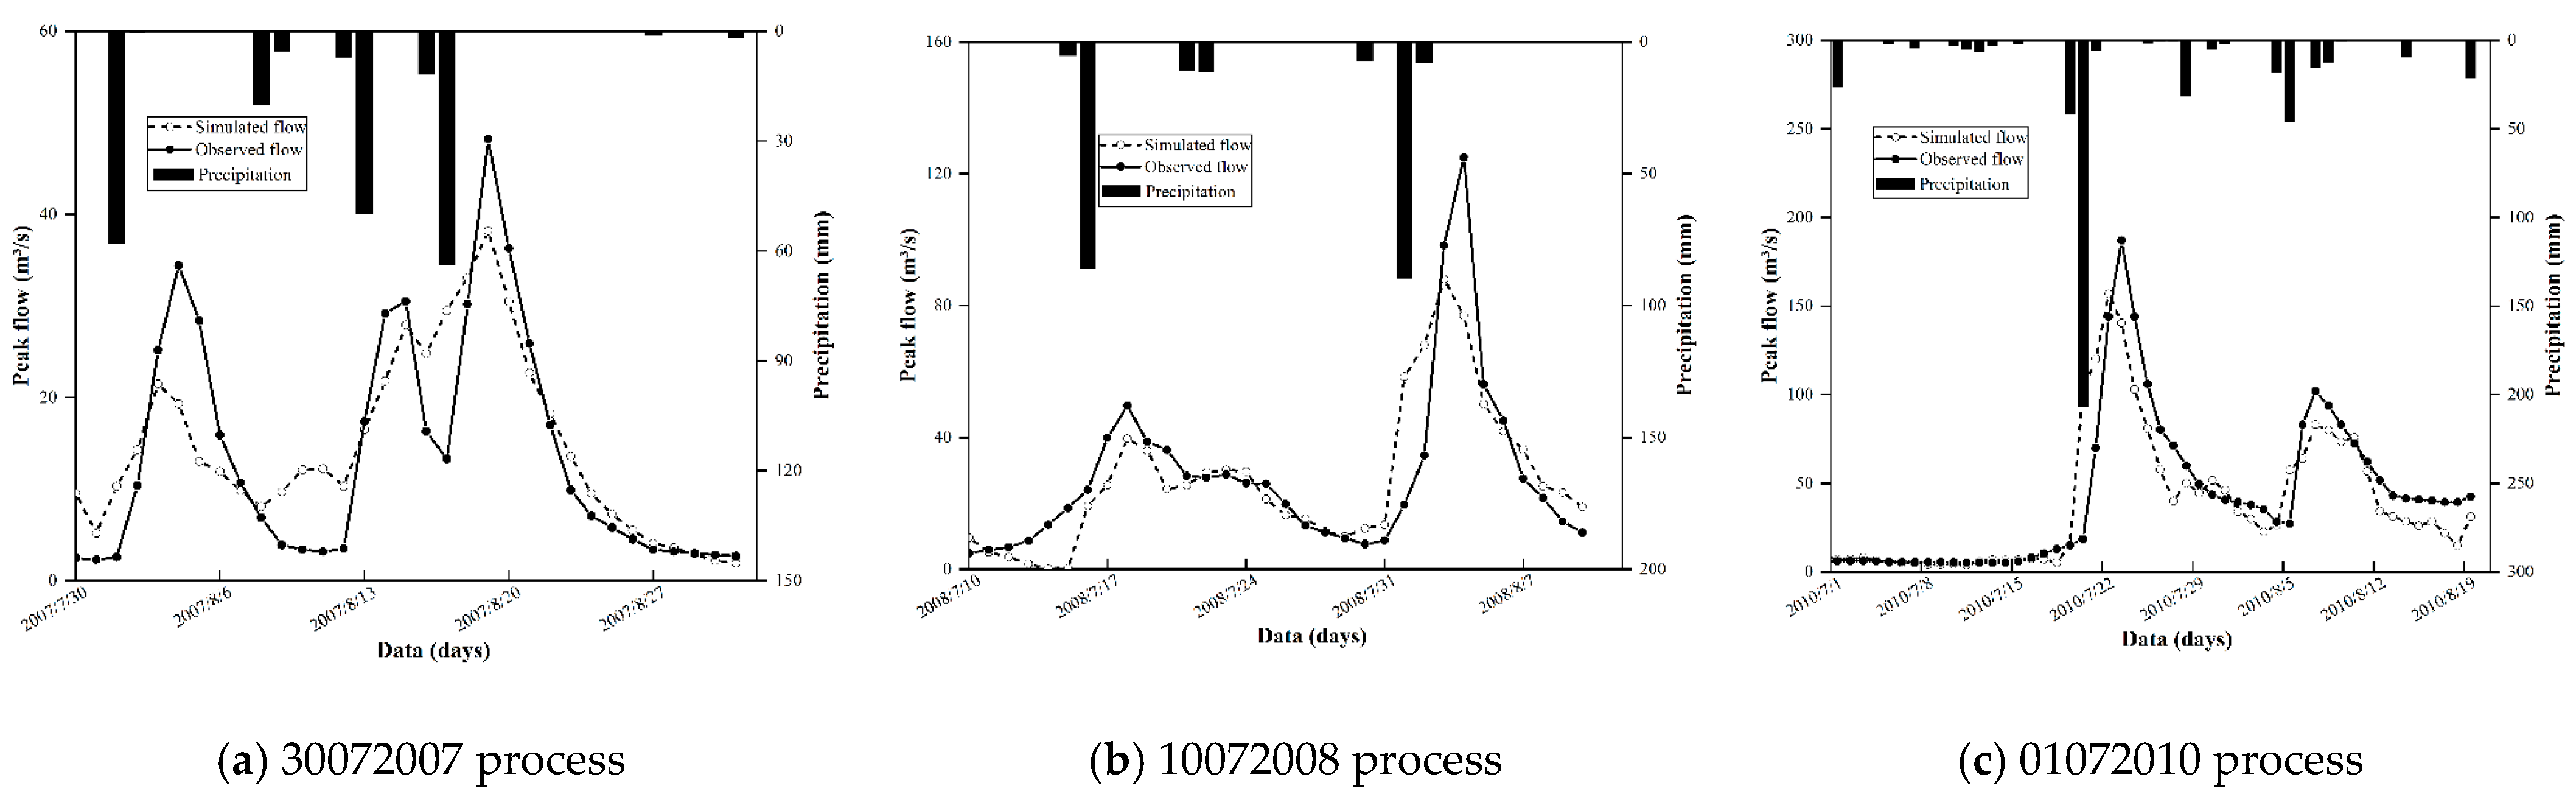
4.4. Model Calibration and Validation after Urbanization
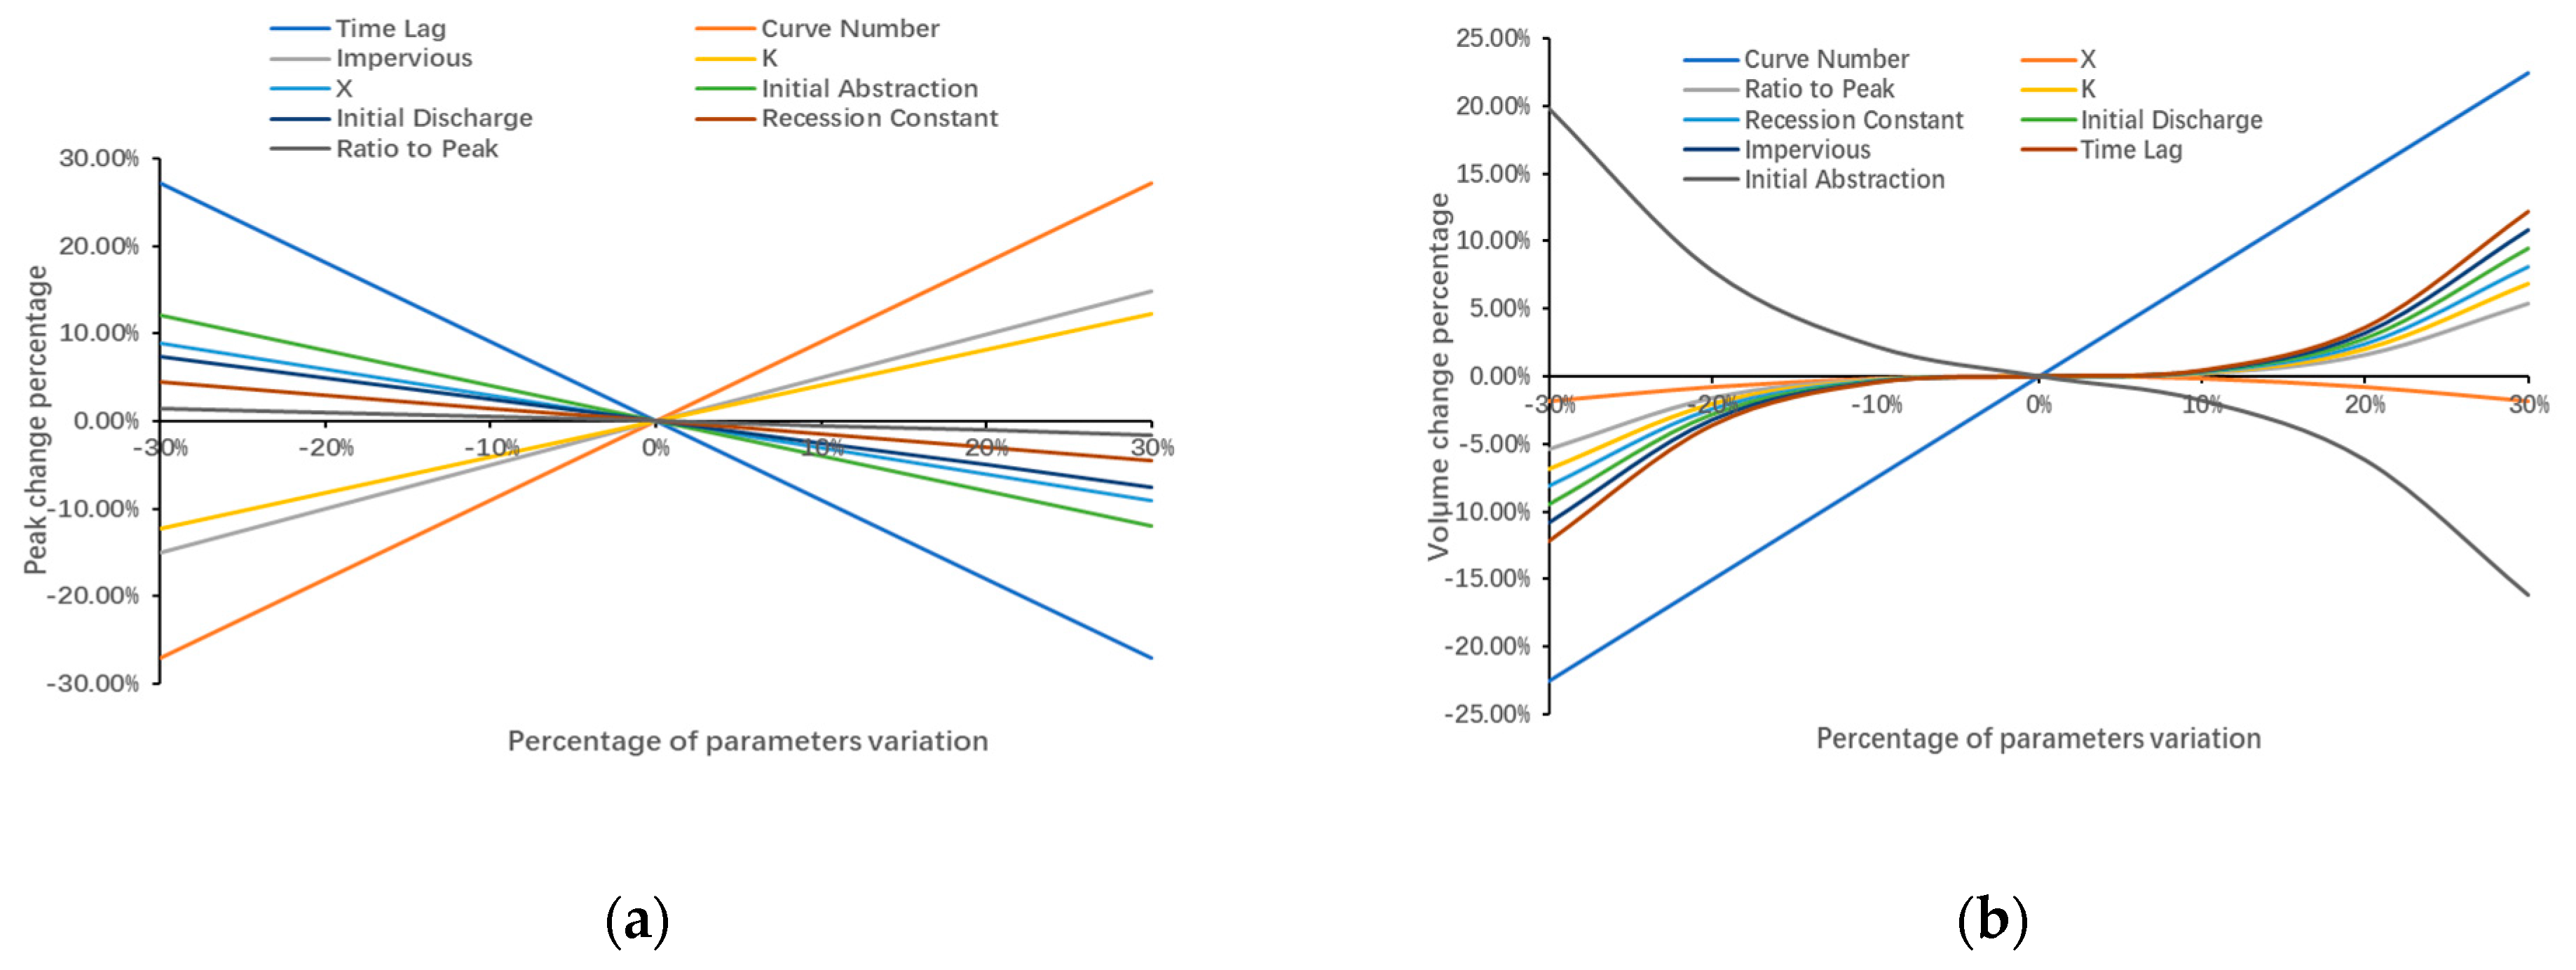
4.5. Parameters Sensitivity Analysis
5. Conclusions
Author Contributions
Funding
Data Availability Statement
Conflicts of Interest
References
- Sun, Z.; Zhu, X.; Pan, Y.; Liu, X. Progress and Prospect of flood disaster risk analysis. Disaster Sci. 2017, 32, 125–130. [Google Scholar]
- Li, J.; Wei, Z.; Liu, Y. Analysis of response degree of flood process to soil and water conservation project. J. Irrig. Drain. 2013, 32, 137–140. [Google Scholar]
- Wang, W.; Du, Y.; Chau, K.; Chen, H.; Liu, C.; Ma, Q.A. Comparison of BPNN, GMDH, and ARIMA for Monthly Rainfall Forecasting Based on Wavelet Packet Decomposition. Water 2021, 13, 2871. [Google Scholar] [CrossRef]
- Wang, W.-C.; Zhao, Y.-W.; Chau, K.-W.; Xu, D.-M.; Liu, C.-J. Improved flood forecasting using geomorphic unit hydrograph based on spatially distributed velocity field. J. Hydroinform. 2021, 23, 724–739. [Google Scholar] [CrossRef]
- Long, A.; Hao, W.; Yu, F.; Wang, J. Analysis on the theoretical basis of social water cycle II: Scientific problems and disciplinary frontiers. J. Water Conserv. 2011, 42, 505–513. [Google Scholar]
- Cuo, L.; Giambelluca, T.W.; Ziegler, A.D. Lumped parameter sensitivity analysis of a distributed hydrological model within tropical and temperate catchments. Hydrol. Process. 2011, 25, 2405–2421. [Google Scholar] [CrossRef]
- Wang, W.; Feng, Z.; Ma, M. Climate Changes and Hydrological Processes. Water 2022, 14, 3922. [Google Scholar] [CrossRef]
- Xin, J.; Qiong, C.; YanXiang, J. Influence of land use / cover data accuracy on hydrological process simulation. J. Irrig. Drain. 2018, 37, 108–115. [Google Scholar]
- Refsgaard, J.C.; Auken, E.; Bamberg, C.A.; Christensen, B.S.; Clausen, T.; Dalgaard, E.; Effersø, F.; Ernstsen, V.; Gertz, F.; Hansen, A.L.; et al. Nitrate reduction in geologically heterogeneous catchments—A framework for assessing the scale of predictive capability of hydrological models. Sci. Total Environ. 2014, 468, 1278–1288. [Google Scholar] [CrossRef]
- Sandu, M.-A.; Virsta, A. Applicability of mike she to simulate hydrology in argesel river catchment. Agric. Agric. Sci. Procedia 2015, 6, 517–524. [Google Scholar] [CrossRef]
- Hu, G.; Chen, X.; Yu, Z. Study on mountain torrent forecast in Chenjiang River Basin Based on HEC-HMS. J. Nat. Disasters 2017, 26, 147–155. [Google Scholar]
- Zheng, P.; Lin, Y.; Pan, W.; Deng, H. Study on flood return period of Bayi Reservoir Basin Based on HEC-HMS model. J. Ecol. 2013, 33, 1268–1275. [Google Scholar]
- Bo, W. Effects of Land Use/Cover Change on the Formation of Mountain Torrents in Gedong Watershed of Sanchuan River; Taiyuan University of Technology: Taiyuan, China, 2017. [Google Scholar]
- Yucel, I. Assessment of a flash flood event using different precipitation datasets. Nat. Hazards 2015, 79, 1889–1911. [Google Scholar] [CrossRef]
- Giannaros, C.; Dafis, S.; Stefanidis, S.; Giannaros, T.M.; Koletsis, I.; Oikonomou, C. Hydrometeorological analysis of a flash flood event in an ungauged Mediterranean watershed under an operational forecasting and monitoring context. Meteorol. Appl. 2022, 29, e2079. [Google Scholar] [CrossRef]
- Chang, L.; Chen, X.; Liu, C. Regional calibration of key parameters of HEC-HMS model in Jinjiang River Basin. S. N. Water Divers. Water Conserv. Sci. Technol. 2019, 3, 40–47. [Google Scholar]
- YanFu, K.; JianZhu, L.; QiuShuang, M. Construction of distributed HEC-HMS hydrological model and flood simulation in Zijingguan watershed. J. Irrig. Drain. 2019, 16, 108–115. [Google Scholar]
- Xing, Z.; Ma, M.; Wen, L.; Liu, C.; Lv, J.; Su, Z. Application of HEC-HMS model in mountain flood forecasting in data deficient areas. J. China Inst. Water Resour. Hydropower Res. 2020, 18, 54–61. [Google Scholar]
- Sardoii, E.R.; Rostami, N.; Sigaroudi, S.K.; Taheri, S. Calibration of loss estimation methods in HEC-HMS for simulation of surface runoff (Case Study: Amirkabir Dam Watershed, Iran). Adv. Environ. Biol. 2012, 6, 343–348. [Google Scholar]
- Tassew, B.G.; Belete, M.A.; Miegel, K. Application of HEC-HMS model for flow simulation in the Lake Tana basin: The case of Gilgel Abay catchment, upper Blue Nile basin, Ethiopia. Hydrology 2019, 6, 21. [Google Scholar] [CrossRef]
- Zelelew, D.G.; Melesse, A.M. Applicability of a spatially semi-distributed hydrological model for watershed scale runoff estimation in Northwest Ethiopia. Water 2018, 10, 923. [Google Scholar] [CrossRef]
- Du, J.; Cheng, L.; Zhang, Q.; Yang, Y.; Xu, W. Different flooding behaviors due to varied urbanization levels within river Basin: A case study from the Xiang river Basin, China. Int. J. Disaster Risk Sci. 2019, 10, 89–102. [Google Scholar] [CrossRef]
- Liu, S.; Zang, Z.; Wang, W.; Wu, Y. Spatial-temporal evolution of urban heat Island in Xi’an from 2006 to 2016. Phys. Chem. Earth 2019, 110, 185–194. [Google Scholar] [CrossRef]
- Bibi, T.S.; Kara, K.G. Evaluation of climate change, urbanization, and low-impact development practices on urban flooding. Heliyon 2023, 9, e12955. [Google Scholar] [CrossRef] [PubMed]
- Zhang, J.; Yu, X. Analysis of land use change and its influence on runoff in the Puhe River Basin. Environ. Sci. Pollut. Res. 2020, 28, 40116–40125. [Google Scholar] [CrossRef]
- Scs, U. Urban Hydrology for Small Watersheds, Technical Release no. 55 (TR-55); US Department of Agriculture, US Government Printing Office: Washington, DC, USA, 1986. [Google Scholar]
- Kirpich, Z. Time of concentration of small agricultural watersheds. Civ. Eng. 1940, 10, 362. [Google Scholar]
- McCarthy, G.T. The Unit Hydrograph and Flood Routing. In Proceedings of the Conference of North Atlantic Division; US Army Corps of Engineers: Washington, DC, USA, 1938; pp. 608–609. [Google Scholar]
- Moriasi, D.N.; Arnold, J.G.; Van Liew, M.W.; Bingner, R.L.; Harmel, R.D.; Veith, T.L. Model evaluation guidelines for systematic quantification of accuracy in watershed simulations. Trans. ASABE 2007, 50, 885–900. [Google Scholar] [CrossRef]
- Fleming, M.J.; Doan, J.H. HEC-GeoHMS Geospatial Hydrologic Modeling Extension User’s Manual; US Army Corps of Engineers: Washington, DC, USA, 2013. [Google Scholar]
- Ouédraogo, W.A.A.; Raude, J.M.; Gathenya, J.M. Continuous modeling of the Mkurumudzi River catchment in Kenya using the HEC-HMS conceptual model: Calibration, validation, model performance evaluation and sensitivity analysis. Hydrology 2018, 5, 44. [Google Scholar] [CrossRef]


| Urbanization Period | Calibration | Validation | ||
|---|---|---|---|---|
| Start Date | End Date | Start Date | End Date | |
| Before urbanization | 7 July 1977 | 20 August 1977 | 21 July 1988 | 31 August 1988 |
| 22 June 1979 | 25 July 1979 | 21 July 1991 | 24 August 1991 | |
| 7 June 1980 | 27 July 1980 | 29 July 1992 | 18 August 1992 | |
| 22 June 1981 | 31 July 1981 | 25 June 1993 | 25 July 1993 | |
| 23 July 1984 | 27 September 1984 | |||
| 24 July 1987 | 23 August 1987 | |||
| After urbanization | 1 July 2003 | 27 August 2003 | 30 July 2007 | 31 August 2007 |
| 22 July 2004 | 25 August 2004 | 10 July 2008 | 10 August 2008 | |
| 1 August 2005 | 30 August 2005 | 1 July 2010 | 20 August 2010 | |
| 30 July 2006 | 25 August 2006 | |||
| No. | Performance Rating | PEPF (%) | PEV (%) | NSE | R2 |
|---|---|---|---|---|---|
| 1 | Very good | <±15 | <±10 | 0.75–1 | 0.75–1 |
| 2 | Good | ±15–±30 | ±10–±15 | 0.65–0.75 | 0.65–0.75 |
| 3 | Satisfactory | ±30–±40 | ±15–±25 | 0.50–0.65 | 0.50–0.65 |
| 4 | Unsatisfactory | >±40 | >±25 | <0.50 | <0.50 |
| Sub Code | Area (km2) | Perimeter (km) | Basin Slope (%) | Main River Flow | |
|---|---|---|---|---|---|
| Flow Length (m) | Slope (m/m) | ||||
| W300 | 166.53 | 87.842 | 11.13 | 19,989 | 0.00070 |
| W310 | 225.87 | 139.481 | 5.21 | 38,916 | 0.00257 |
| W320 | 52.929 | 54.878 | 7.63 | - | - |
| W330 | 223.22 | 104.992 | 9.83 | 13,421 | 0.00052 |
| W340 | 62.786 | 62.119 | 10.55 | - | - |
| W350 | 121.4 | 101.181 | 11.54 | 16,117 | 0.00056 |
| W380 | 94.783 | 103.277 | 12.31 | - | - |
| W400 | 180.82 | 98.513 | 5.95 | 19,718 | 0.00036 |
| W450 | 146.89 | 104.229 | 14.83 | 22,713 | 0.00048 |
| W470 | 434.45 | 238.947 | 7.38 | 13,048 | 0.00031 |
| W480 | 115.65 | 96.608 | 5.93 | - | - |
| W490 | 72.744 | 76.791 | 5.91 | 14,210 | 0.00035 |
| W500 | 87.549 | 81.364 | 2.39 | - | - |
| W520 | 70.729 | 73.742 | 6.28 | 9986 | 0.00030 |
| W540 | 159.22 | 103.086 | 5.65 | 7355 | 0.00027 |
| Sub Code | Impervious Rate | |||||
|---|---|---|---|---|---|---|
| 1985 | 1989 | 1995 | 2000 | 2005 | 2010 | |
| W310 | 0.41% | 0.50% | 16.10% | 23.54% | 37.42% | 19.75% |
| W300 | 5.38% | 5.76% | 22.44% | 67.14% | 63.37% | 52.10% |
| W320 | 58.45% | 62.99% | 84.37% | 93.40% | 91.40% | 85.64% |
| W330 | 1.48% | 1.73% | 15.39% | 24.56% | 27.54% | 32.79% |
| W340 | 2.79% | 3.19% | 6.11% | 11.70% | 15.79% | 18.66% |
| W350 | 8.20% | 10.05% | 44.19% | 67.31% | 65.70% | 61.54% |
| W380 | 4.09% | 8.63% | 11.33% | 23.27% | 27.86% | 37.47% |
| W400 | 3.33% | 5.98% | 9.68% | 26.33% | 32.64% | 45.99% |
| W450 | 5.50% | 6.22% | 18.41% | 35.08% | 49.36% | 57.48% |
| W470 | 3.86% | 6.84% | 12.98% | 35.20% | 42.86% | 58.70% |
| W480 | 4.69% | 5.22% | 10.81% | 26.79% | 35.51% | 56.35% |
| W490 | 1.25% | 6.35% | 4.78% | 20.86% | 38.49% | 51.10% |
| W500 | 1.75% | 5.87% | 7.94% | 24.46% | 37.35% | 60.99% |
| W520 | 2.22% | 5.15% | 8.03% | 24.90% | 39.16% | 52.75% |
| W540 | 2.23% | 4.66% | 10.09% | 20.96% | 32.51% | 54.31% |
| Sub-Basins | W300 | W310 | W320 | W330 | W340 | W350 | W380 | W400 | |
|---|---|---|---|---|---|---|---|---|---|
| WCN | before urbanization | 71 | 76 | 68 | 78 | 82 | 72 | 75 | 67 |
| after urbanization | 84 | 91 | 81 | 85 | 95 | 87 | 89 | 85 | |
| Sub-basins | W450 | W470 | W480 | W490 | W500 | W520 | W540 | ||
| WCN | before urbanization | 77 | 63 | 66 | 66 | 66 | 64 | 66 | |
| after urbanization | 85 | 81 | 80 | 86 | 89 | 82 | 82 | ||
| Period | Events | Peak Discharge (m³/s) | PEPF | Total Volume (mm) | PEV | NSE | R2 | ||
|---|---|---|---|---|---|---|---|---|---|
| S | O | (%) | S | O | (%) | ||||
| Calibration | 77,707 | 85.4 | 84.9 | 0.59 | 106.08 | 112.13 | −5.4 | 0.877 | 0.888 |
| 79,622 | 71.5 | 73 | −2.05 | 93.03 | 108 | −13.86 | 0.906 | 0.919 | |
| 80,607 | 67.1 | 63.7 | 5.34 | 61.7 | 54.27 | 13.69 | 0.895 | 0.902 | |
| 81,622 | 69.7 | 64.6 | 7.89 | 77.52 | 69.92 | 10.87 | 0.841 | 0.854 | |
| 84,723 | 120.7 | 134 | −9.93 | 173.06 | 172.64 | 0.24 | 0.72 | 0.735 | |
| 87,724 | 55.1 | 54 | 2.04 | 44.61 | 45.94 | −2.9 | 0.874 | 0.912 | |
| Validation | 88,721 | 77.5 | 80.5 | −3.73 | 88.09 | 84.11 | 4.73 | 0.776 | 0.795 |
| 91,721 | 99.2 | 116 | −14.48 | 100.71 | 88.54 | 13.75 | 0.87 | 0.882 | |
| 92,729 | 46.9 | 49.8 | −5.82 | 22.14 | 25.48 | −13.11 | 0.886 | 0.917 | |
| 93,625 | 59.8 | 63.5 | −5.83 | 43.13 | 38.87 | 10.96 | 0.903 | 0.912 | |
| Period | Events | Peak Discharge (m³/s) | PEPF | Total Volume (mm) | PEV | NSE | R2 | ||
|---|---|---|---|---|---|---|---|---|---|
| S | O | (%) | S | O | (%) | ||||
| Calibration | 03701 | 88.1 | 103 | −14.47 | 151.99 | 146.96 | 3.42 | 0.875 | 0.879 |
| 04722 | 86.8 | 109 | −20.37 | 83.28 | 76.62 | 8.69 | 0.847 | 0.858 | |
| 05801 | 34.6 | 35.5 | −2.54 | 34.26 | 34.61 | −1.01 | 0.864 | 0.865 | |
| 06730 | 20.7 | 18.4 | 12.5 | 21.61 | 23.67 | −8.07 | 0.771 | 0.828 | |
| Validation | 07730 | 38.2 | 48.2 | −20.75 | 48.18 | 46.36 | 3.93 | 0.717 | 0.728 |
| 08710 | 88 | 125 | −29.6 | 86.49 | 91.05 | −5.01 | 0.687 | 0.689 | |
| 10701 | 157 | 187 | −16.04 | 194.98 | 215.87 | −9.68 | 0.764 | 0.777 | |
Disclaimer/Publisher’s Note: The statements, opinions and data contained in all publications are solely those of the individual author(s) and contributor(s) and not of MDPI and/or the editor(s). MDPI and/or the editor(s) disclaim responsibility for any injury to people or property resulting from any ideas, methods, instructions or products referred to in the content. |
© 2023 by the authors. Licensee MDPI, Basel, Switzerland. This article is an open access article distributed under the terms and conditions of the Creative Commons Attribution (CC BY) license (https://creativecommons.org/licenses/by/4.0/).
Share and Cite
Yu, X.; Zhang, J. The Application and Applicability of HEC-HMS Model in Flood Simulation under the Condition of River Basin Urbanization. Water 2023, 15, 2249. https://doi.org/10.3390/w15122249
Yu X, Zhang J. The Application and Applicability of HEC-HMS Model in Flood Simulation under the Condition of River Basin Urbanization. Water. 2023; 15(12):2249. https://doi.org/10.3390/w15122249
Chicago/Turabian StyleYu, Xiaolong, and Jing Zhang. 2023. "The Application and Applicability of HEC-HMS Model in Flood Simulation under the Condition of River Basin Urbanization" Water 15, no. 12: 2249. https://doi.org/10.3390/w15122249
APA StyleYu, X., & Zhang, J. (2023). The Application and Applicability of HEC-HMS Model in Flood Simulation under the Condition of River Basin Urbanization. Water, 15(12), 2249. https://doi.org/10.3390/w15122249