Article

Seismo-Hydrogeodynamic Effects in Groundwater Pressure Changes: A Case Study of the YuZ-5 Well on the Kamchatka Peninsula

Laboratory of Geophysical Research, Kamchatka Branch of the Geophysical Survey of the Russian Academy of Sciences (KB GS RAS), 683006 Petropavlovsk-Kamchatsky, Russia
*
Author to whom correspondence should be addressed.
Water 2023, 15(12), 2174; https://doi.org/10.3390/w15122174
Submission received: 27 February 2023 / Revised: 2 June 2023 / Accepted: 5 June 2023 / Published: 8 June 2023
(This article belongs to the Special Issue How Earthquakes Affect Groundwater)

Abstract

:
Seismo-hydrogeodynamic effects (SHGEs) in groundwater level (pressure) variations in a range of periods from minutes to hours and days during local and teleseismic earthquakes were considered based on the data of precision observations in a deep piezometric well located in a seismically active region. With the use of the tidal analysis and frequency dependence of the barometric response of the water level, a static confined response of groundwater pressure in a range of periods from hours to the first tens of days was established. The annual water level trend was characterized by the seasonal function of a hydrostatic head change in the well. In the groundwater pressure, changes were detected due to several types of seismo-hydrogeodynamic effects: 1—the coseismic fluctuations during the first tens of seconds and minutes after the arrival of seismic waves from the earthquakes with magnitudes of 5.3–9.1 at epicentral distances of 80–700 km; 2—the supposed hydrogeodynamic precursors of the two strongest events; 3—the four types of variations under the vibration impact of seismic waves from Mw = 6.8–9.1 earthquakes at epicentral distances of 80–14,600 km. The dependence of the distinguished types of SHGEs on the earthquake parameters, the intensity of the seismic impact in the well area and the amplitude-frequency composition of seismic waves were considered.

1. Introduction

Studies of hydrological effects in connection with earthquakes are widely carried out in the world. The results of such studies were summarized in monographs [1,2]. In these monographs and in many other works [3,4,5,6,7,8,9,10,11,12,13,14,15,16,17,18], it was shown that during observations in piezometric wells equipped with level gauges or pressure sensors, various changes in the groundwater level and pressure were detected, mainly influenced by the seismic waves from the earthquakes. To a lesser degree, such studies investigated the changes in the groundwater pressure before the earthquakes (hydrogeodynamic precursors, HPs) as well as the effects of changes in the static stress state of water-bearing rocks during the ruptures in the earthquake sources (coseismic effects, CSEs).
In our opinion, the reasons for the poor knowledge of HPs and CSEs are as follows:
(1)
Limited manifestation of HPs and CSEs over an area due to their confinement to relatively small areas near earthquake sources, where observation wells may be absent;
(2)
Using shallow wells for long-term observations, penetrating unconfined or partially confined aquifers in loose Quaternary deposits or in weathered crystalline rocks without assumptions on static confined conditions and quasi-elastic groundwater pressure response to barometric, tidal and seismic influences [19];
(3)
Lack of long-term precision observations of groundwater pressure variations in confined aquifers at depths of at least hundreds of meters in the near and intermediate field zones of earthquake sources.
The insufficiency of the observation data to assess the regularities in the HPs and CSEs is also indicated in the above-mentioned monographs [1,2].
At the same time, the data on HPs form the basis for studying the earthquake preparation processes and can be used to predict strong seismic events, when reliable relationships are established between HP manifestations and earthquake parameters. Data on CSEs can be used to study the Earth’s crust deformations, assessing sensitivity of wells to variations in static volumetric strain, and also to verify the earthquake mechanisms [16,20].
The data of long-term precision observations in wells in seismically active regions play a key role in the study of the HPs and CSEs. Only such data can be used to establish the relationships between the HPs, CSEs and earthquake parameters.
In 1997–2022, groundwater level/pressure variations were monitored with the use of digital equipment in the piezometric well YuZ-5 (hereinafter, well YuZ-5) located on the Kamchatka Peninsula in the northwestern part of the Pacific seismic belt (Figure 1a, Table 1 and Table 2). The research results of groundwater pressure changes in this well in connection with the local and remote earthquakes with magnitudes Mw = 5.4–9.3 at epicentral distances de = 80–14,600 km are presented in this paper. The main attention is paid to the manifestations of CSEs during local earthquakes that occurred at epicentral distances de = 70–700 km. Table 3 provides data on 14 earthquakes that were accompanied by coseismic increases or decreases in water level/pressure with amplitudes ≥0.2 cm of the water column (≥0.2 hPa) for a time of no more than 5–12 min after the instrumental time of an earthquake, corresponding to the beginning of rupture formation in the source and the emission of seismic waves [21].
Previously, the authors showed [16,28,29] that the amplitudes and signs of such coseismic pressure fluctuations corresponded to the expected coseismic strain in the well area according to the dislocation model [30] with the parameters of earthquake source mechanisms according to the GlobalCMT catalog (https://www.globalcmt.org (accessed on 20 January 2023)). The parameters of focal mechanisms of all 14 earthquakes are given in Table 4.
The values of the coseismic deformation in the well area (D1) were estimated based on the amplitudes of water level changes Δh with the use of the value of water level tidal sensitivity Av (Table 5). The sign of deformation was assessed by the directions of the water level change: volumetric compression of water-bearing rocks with an increase in the water level and volumetric expansion with a decrease in the water level [16,28,31]. In Table 3, D1 values are compared with the theoretical estimates of coseismic strain D2 according to the dislocation model [30] with parameters of earthquake sources (Table 4).
Table 3. Data on 1997–2020 earthquakes (https://earthquake.usgs.gov/earthquakes/search; http://sdis.emsd.ru/info/earthquakes/catalogue.php (accessed on 20 January 2023)) accompanied by coseismic water level fluctuations in the YuZ-5 well.
No.HypocenterMwEpicentral Distance,
de, km/ Hypo-
central Distance,
dh, km
Shaking Intensity on the MSK-64 ScaleAmplitude of the Coseismic Water Level/
Pressure Fluctuation ***,
Δh, cm/hPa
Volumetric Coseismic Deformation in the Well YuZ-5 area, 10−9
Date
dd.mm.yyyy
Time
hh:mm
Coordinates, degreesH,
km
NEBy Coseismic Level Fluctuation, D1 ****By the Dislocation Model [30]Reference
105.12.1997 *11:2754.0 **162.3 **107.8200 **/200 **5–6−12.07548[16]
201.06.199805:3452.81160.37316.4136/1403–4−1.0+6.3+7.9
308.03.199912:2651.93159.7276.9162/1625−1.7+10.6+31
420.12.200009:2053.31160.06665.4110/1284+0.6−3.8−0.3
516.06.200322:0855.30160.341906.9266/3272–3−0.3+1.9+0.7
620.03.200408:5353.74160.76405.6167/1714–5+0.25−1.6−0.02
705.07.200802:1253.45154.936337.7232/6743–4+0.3−1.9−7.3*****
824.11.200809:0253.77154.695647.3253/6183+0.2−1.2−3.7*****
928.02.201314:0650.67157.77616.9278/2854–5+0.6−3.7−0.7[28]
1024.05.201305:4554.76153.796308.3348/7204+6.0−37.3−63
1130.01.2016 *03:2553.85159.041787.286/1975+7.3−45−37[29]
1217.07.201723:3454.35168.9077.7700/7002–3+2.0−12.4−13*****
1320.12.201817:0254.91164.71547.3451/4553–4+0.26−1.6−1.1*****
1425.03.202002:4949.11158.08477.5448/4504–5+0.56−3.5−2.3*****
Notes: * Earthquakes preceded by anomalous changes in the water level (supposed hydrogeodynamic precursors); ** coordinates of the center of the source area according to the aftershocks of the first day and well YuZ-5 hypocentral distance to midpoint of the displacement plane [16]; *** «+» indicates a pressure increase, «−» indicates a pressure decrease; **** D1 = −Δh/Av, where Av is water level tidal sensitivity 0.161 cm/10−9 (Table 5); ***** author’s unpublished data presented for the first time. MSK-64 is the Medvedev–Sponheuer–Karnik scale, also known as the 12-point macroseismic intensity scale used for evaluating the shaking of the Earth’s surface based on the observed effects in the earthquake area.
Table 4. Earthquake data (https://www.globalcmt.org (accessed on 20 January 2023)) for estimation of coseismic strain D2 in the area of YuZ-5 well according to the dislocation model [16,30].
EQ No. According to Table 3 and Figure 1MwEarthquake Source Mechanism According to CMT https://www.globalcmt.org
(accessed on 20 January 2023)
Earthquake Source Dimensions *Movement along the Rupture **
U, m
Scalar Seismic Moment
M0, N·m·1020
Strike,
(°)
Dip,
(°)
Rake,
(°)
W,
m
L,
m
17.85.32202(39)23(68)74(97)47,841138,9952.67
26.40.06210(43)22(68)78(95)13,13433,6510.45
36.90.26242(49)28(62)101(84)20,84055,8470.74
45.40.00273(220)25(69)120(77)521712,2180.1
56.90.24123(17)32(80)−161(−59)20,84055,8470.69
65.60.002216(36)34(56)90(90)627514,9620.07
77.74.48143(18)48(58)−134(−52)43,621125,6032.73
87.31.11276(34)19(81)−29(−106)30,15183,7531.47
96.90.21212(36)32(58)86(92)20,84055,8470.60
108.339.5189(12)11(79)−93(−89)75,910230,6757.52
117.20.86324(77)84(85)−29(−126)27,49275,6831.38
127.75.4307(217)85(88)−178(−5)47,840138,9952.71
137.30.8858(155)68(73)−19(−156)30,15183,7531.16
147.52.0732(194)43(48)103(78)36,266102,5651.86
Notes: * L, length along the strike, and W, width along the dip, were estimated from magnitude Mw according to the following formulas: lgL = 0.440Mw − 1.289 and lgW = 0.401Mw − 1.448 [32]. ** The amount of movement along the rupture U was found from scalar seismic moment M0, in U = M0/S × μ, where S = L × W is the rupture area, and μ = 30 × 109 N/m2 is the shear modulus of the elastic medium.
Table 5. Elastic and filtration parameters of water-bearing rocks according to the author’s data [16,33].
Barometric Efficiency, Eb,
cm/hPa
Tidal Sensitivity,
AV/AS *,
m/10−7
Compressibility,
β,
Pa−1 × 10⁻¹¹
Shear Modulus, G,
Pa × 1010
Skempton’s Coefficient,
B
Specific Elastic Capacity,
SS,
m−1 × 10⁻⁷
Porosity,
φ
Storage Coefficient,
S
Transmissivity,
T,
m2/day
Hydraulic Conductivity,
k = T/d **,
m/c
Hydraulic Diffusivity,
a = k/SS,
m2/c
0.400.161/0.10712.51.340.6716.90.1116.9⋅10−57.89⋅10−70.53
Notes: *AV is water level tidal sensitivity with respect to the theoretical volumetric strain, and AS is water level tidal sensitivity with respect to the theoretical areal strain; ** d = 100 m is the total thickness of water-bearing mudstones in a depth range of 310–800 m (Figure 1c) [33].
Satisfactory correspondence between D1 values estimated from the observational data in well YuZ-5 with the theoretical estimates of D2 allows us to consider the recorded coseismic water level/pressure fluctuations as individual types of seismo-hydrogeodynamic effects in groundwater pressure changes.
Before the events of 5 December 1997, Mw = 7.8 (No. 1 in Table 3, Figure 1a), and 30 January 2016, Mw = 7.2 (No. 11), anomalous water level variations were manifested for about 20 and 90 days. Such water level changes were considered as the supposed hydrogeodynamic precursors when compared with the seasonal function behavior of the groundwater head estimated over a long period [29,34,35]. Data processing method to evaluate such a function is presented in Section 2.3. In the cases of both earthquakes, the precursors in the groundwater pressure in well YuZ-5 were confirmed by the manifestation of the hydrogeodynamic precursors in the water level changes in the E-1 well, located 11 km from well YuZ-5 (Figure 1b), as well as in the changes in the chemical composition of the groundwater from deep self-flowing wells [17] and the movements of the GPS stations near the EQ area of 5 December 1997 [35,36].
Various water level responses to the passage of seismic waves from the earthquakes with magnitudes Mw = 6.8–9.1 at epicentral distances de = 80–14,600 km were also recorded according to the observations in well YuZ-5. Four types of such hydrogeoseismic water level variations (type I–IV HGSVs) were considered in detail in [18]. In this paper, a summary description of type I–IV HGSVs is given to assess the range of magnitudes and distances of earthquakes accompanied by such types of seismo-hydrogeodynamic effects in the water pressure changes in well YuZ-5.
Particular attention is paid to the methodological issues of conducting long-term observations in a well and processing the level/pressure data for identifying various types of seismo-hydrogeodynamic phenomena, as well as static confined conditions in the "well–aquifer" system assessed by the groundwater responses to barometric and tidal influences. Close attention to the technical and methodological issues of long-term observations and data processing is required for the objective consideration of the hydrogeodynamic regime’s features of the observation well, when seismo-hydrogeodynamic effects are identified in the groundwater pressure changes.

Geological and Technical Conditions, Earthquake Data

The Kamchatka Peninsula is one of the most seismically active regions of the Earth due to its location in the junction of the Pacific oceanic plate and the Eurasian and North American continental tectonic plates. The subduction of the Pacific Plate is accompanied by the formation of the Kuril-Kamchatka and Aleutian seismic focal zones, where strong earthquakes with Mw ≥ 6–7 occur frequently. Seismological, geophysical, hydrogeological and geochemical observations are carried out on the Kamchatka Peninsula to search for the precursors of strong earthquakes [37]. The YuZ-5 well (Figure 1, Table 1) is one of the wells where groundwater parameters are monitored by the Kamchatka Branch of the Geophysical Survey of the Russian Academy of Sciences [16,17,34].
The climate of the area under consideration is maritime monsoon with cool summers and mild winters. Average annual air temperatures according to the Pionerskaya meteorological station (Figure 1b) are 3–4 °C. Average daily air temperatures below 0° C are observed usually from mid-November to mid-April. Annual total precipitations in 1997–2021 were 414–1149 mm/year. The main share of precipitation in the form of rain and snow falls in the autumn-winter period from October to February. The largest monthly precipitation totals were recorded in October 2012 (404 mm) and in October 2015 (486 mm). On some days, the daily amount of precipitation reached 130–180 mm/day.
A generalized geological map of the area based on the geological surveys of 1980–1990 [22] is shown in Figure 1b. The well is located in a complex block junction of the inversion structure of the Avacha volcano-tectonic depression with the Petropavlovsky horst and the Nachikinsky zone of fold-block dislocations separated by ancient deep faults. Within the Avacha volcano-tectonic depression, the volcanic and volcanogenic-sedimentary Neogene-Quaternary deposits up to 1.4 km in thickness, formed as a result of intense volcanic activity, are common. To the north of the area under consideration, there are five Late Pleistocene volcanoes. The Avachinsky and Koryaksky volcanoes are currently active. The Petropavlovsky horst was formed as a result of vertical block displacements of the Cretaceous basement and its outcrop to the southeast and northwest of the YuZ-5 well. The basement is composed of the Upper Cretaceous rocks represented by metamorphosed sandstones, siltstones, mudstones and shales. The YuZ-5 well is located in a local depression in the top of the Cretaceous basement filled with loose Quaternary pyroclastic, alluvial and proluvial deposits.
The hydrogeology of the region is characterized by the presence of an unconfined aquifer (UA) composed of loose Quaternary deposits and a confined aquifer (CA) in the metamorphosed Late Cretaceous rocks [23,24]. The values of hydraulic conductivity coefficient of the water-bearing rocks in the UA are in tens of m/day. The mineralization of the groundwater in the UA is on average 0.15 g/l, and the chemical composition of water is predominantly bicarbonate calcium.
The YuZ-5 well was drilled in 1994 to a depth of 800 m. The well is located in the groundwater transit region from the recharge zone located to the east and northeast in the elevated territory to the coastal area of the regional groundwater discharge (Figure 1b). A diagram of the well structure and geological section is shown in Figure 1c. The well opened the unconfined aquifer in the loose Quaternary deposits in a depth range of 0–270 m. Late Cretaceous metamorphic rocks are common in the interval of 270–800 m. Porosity of Late Cretaceous rocks are a few tenths of a percent; the matrix permeability has a low value of 0.001–0.01 mD [23]. The groundwater in the Late Cretaceous rocks forms a confined aquifer (CA) with hydrostatic distribution of groundwater pressure over depth.
In the depth range of 0–310 m, the wellbore is cased with a metal pipe, which provides wellbore isolation in the area of the unconfined aquifer. At depths of 310–800 m, the wellbore is open and connected to the confined aquifer. The water level in the well is at a depth of about 0.5–1 m below the ground surface. Transmissivity coefficient of the open strata of water-bearing rocks, according to the pumping test, is 7.8 m2/day [33]. Table 1 provides information on the temperature and chemical composition of the groundwater in the CA. Data on filtration and elastic properties of water-bearing rocks are given in Table 5.
In this work, we used the observational data on the groundwater level/pressure in well YuZ-5 from September 1997 to July 2022 obtained under the conditions of the natural state of groundwater not disturbed by pumping or industrial water withdrawal from the confined aquifer. All activities for installing equipment in the wellbore and its technical maintenance were recorded in an electronic journal as part of the database [38]. Such controlled disturbances of the well’s hydrogeodynamic regime were accompanied by short-term changes in the water level with amplitudes of a few cm and restored within the first few hours after the work completion.
The data on local earthquakes accompanied by the changes in water pressure in well YuZ-5 are presented in Table 3 and Table 4. The epicenters and mechanisms of the earthquakes are shown in Figure 1a. All these earthquakes were accompanied by perceptible shaking in the well area with the intensity of 2.5–5.5 on the 12-point MSK-64 scale [39]. All considered earthquakes are of subduction type. EQs Nos. 1–11, 13 and 14 occurred in the Kamchatka fragment of the Kuril-Kamchatka focal zone at depths H = 7–630 km. EQ No. 12 occurred in the Aleutian seismic focal zone at a depth of H = 7 km. In the case of EQ No. 12, the epicentral distance to the well, de = 700 km, is the maximum for the events accompanied by the coseismic groundwater pressure fluctuations in well YuZ-5.

2. Methodology: Equipment, Data, Influence of Natural Factors

2.1. Equipment, Observed Data

During the 25-year observation period, three different sets of digital equipment were used to record water level/pressure changes in well YuZ-5 (Table 2). Equipment description is given in [25,26,27]. In accordance with technical means used for recording groundwater level/pressure, observation stages I–III are considered.
During stages I and II, measurements of water level and atmospheric pressure were carried out at intervals of 10 and 5 min. The accuracy of water level registration was ±0.1 cm of the water column, atmospheric pressure ±0.1 hPa. At stage III, water pressure was measured in the wellbore at depth of 8 m below the water level with frequency of 20 Hz and accuracy of ±0.002 hPa. Atmospheric pressure was measured once per minute.
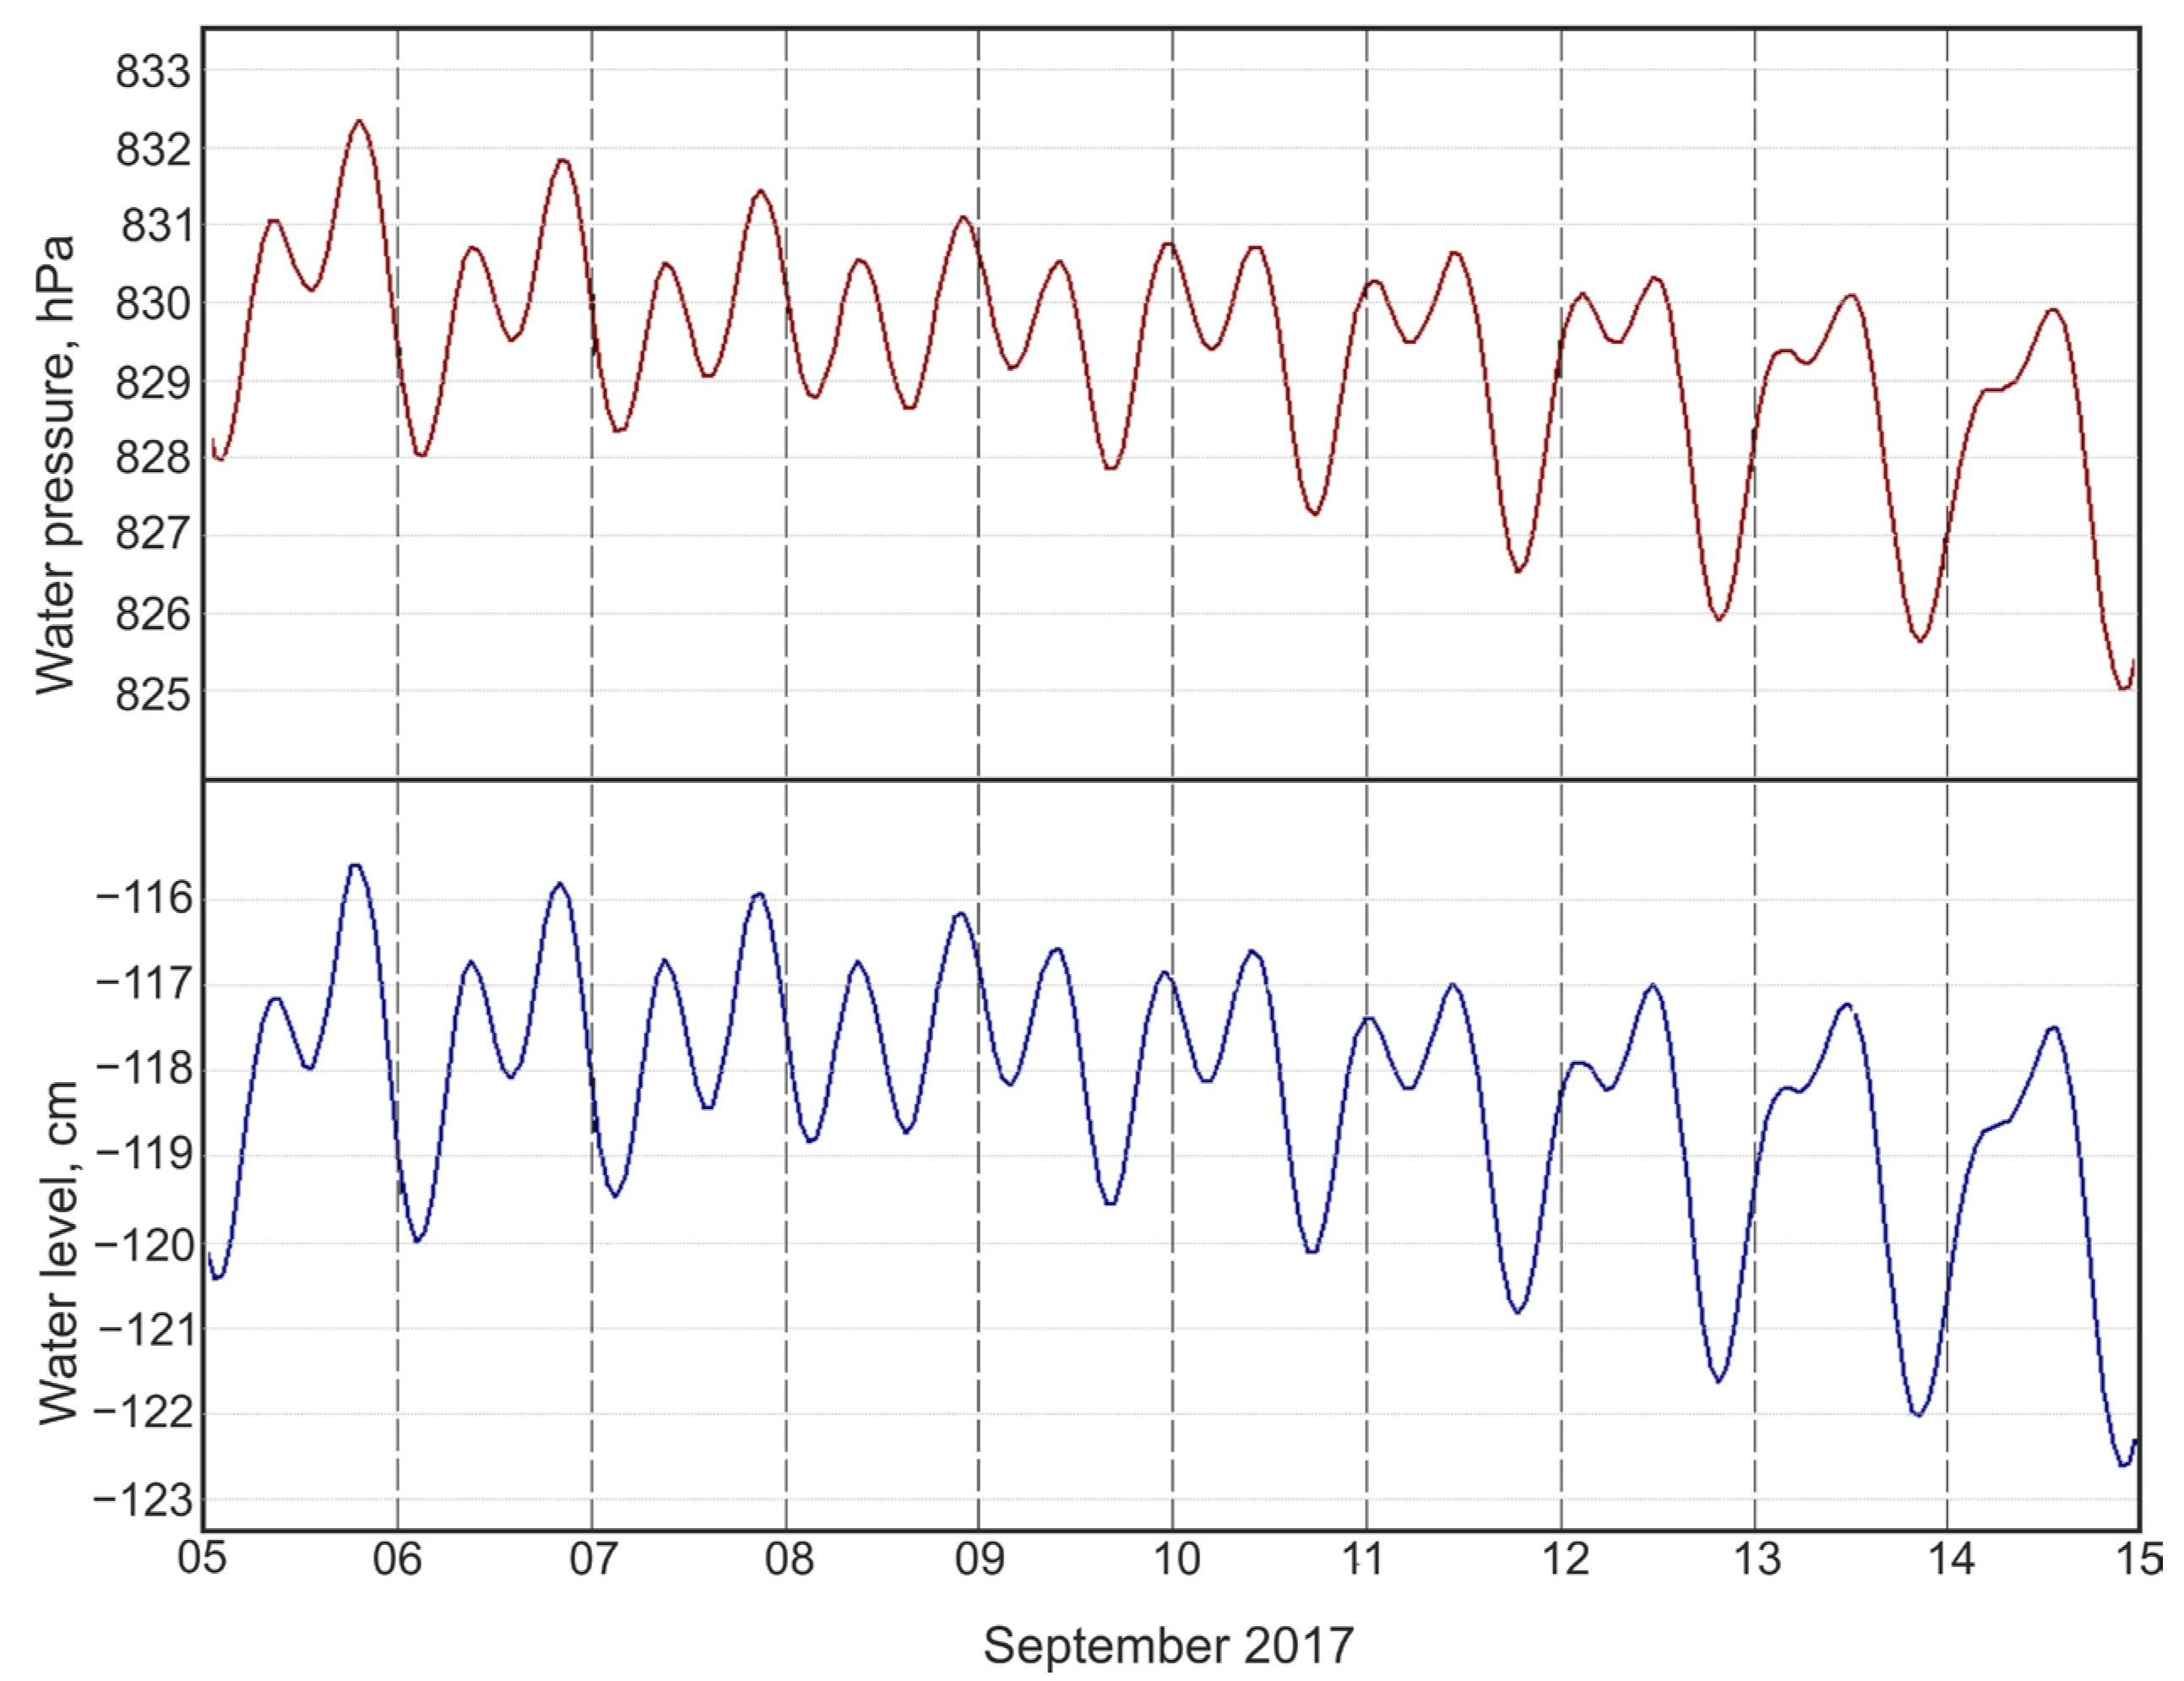
In stage III, when level measurements were replaced by groundwater pressure measurements, synchronous measurements were carried out with two sets of equipment for six months from August 2017 to February 2018. The water level was measured by highly sensitive ultrasonic sensor as part of the Kedr DM equipment. The pressure was measured with a hydrostatic pressure sensor (Table 2). The obtained time series of groundwater level and pressure were averaged over hourly time window, and adaptive compensation of barometric variations was performed in average hourly series based on estimate of the complex transfer function from atmospheric pressure variations to water level changes [38,40,41]. Figure 2 shows a 10-day fragment of synchronous average hourly time series of water level and pressure with compensated barometric influence. Figure 2 shows a complete similarity of groundwater pressure variations in the well recorded by two different sets of equipment. The value of correlation coefficient between variations of time series during the 6-month observation period by two sets of equipment was 0.99, and the value of coefficient of linear relationship between them by the least squares method was 1.02 cm of the water column/hPa.
The experiment also shows that at stages I and II, the time series of water level, using the procedure for compensating for barometric variations, provided reliable identification of groundwater pressure variations.
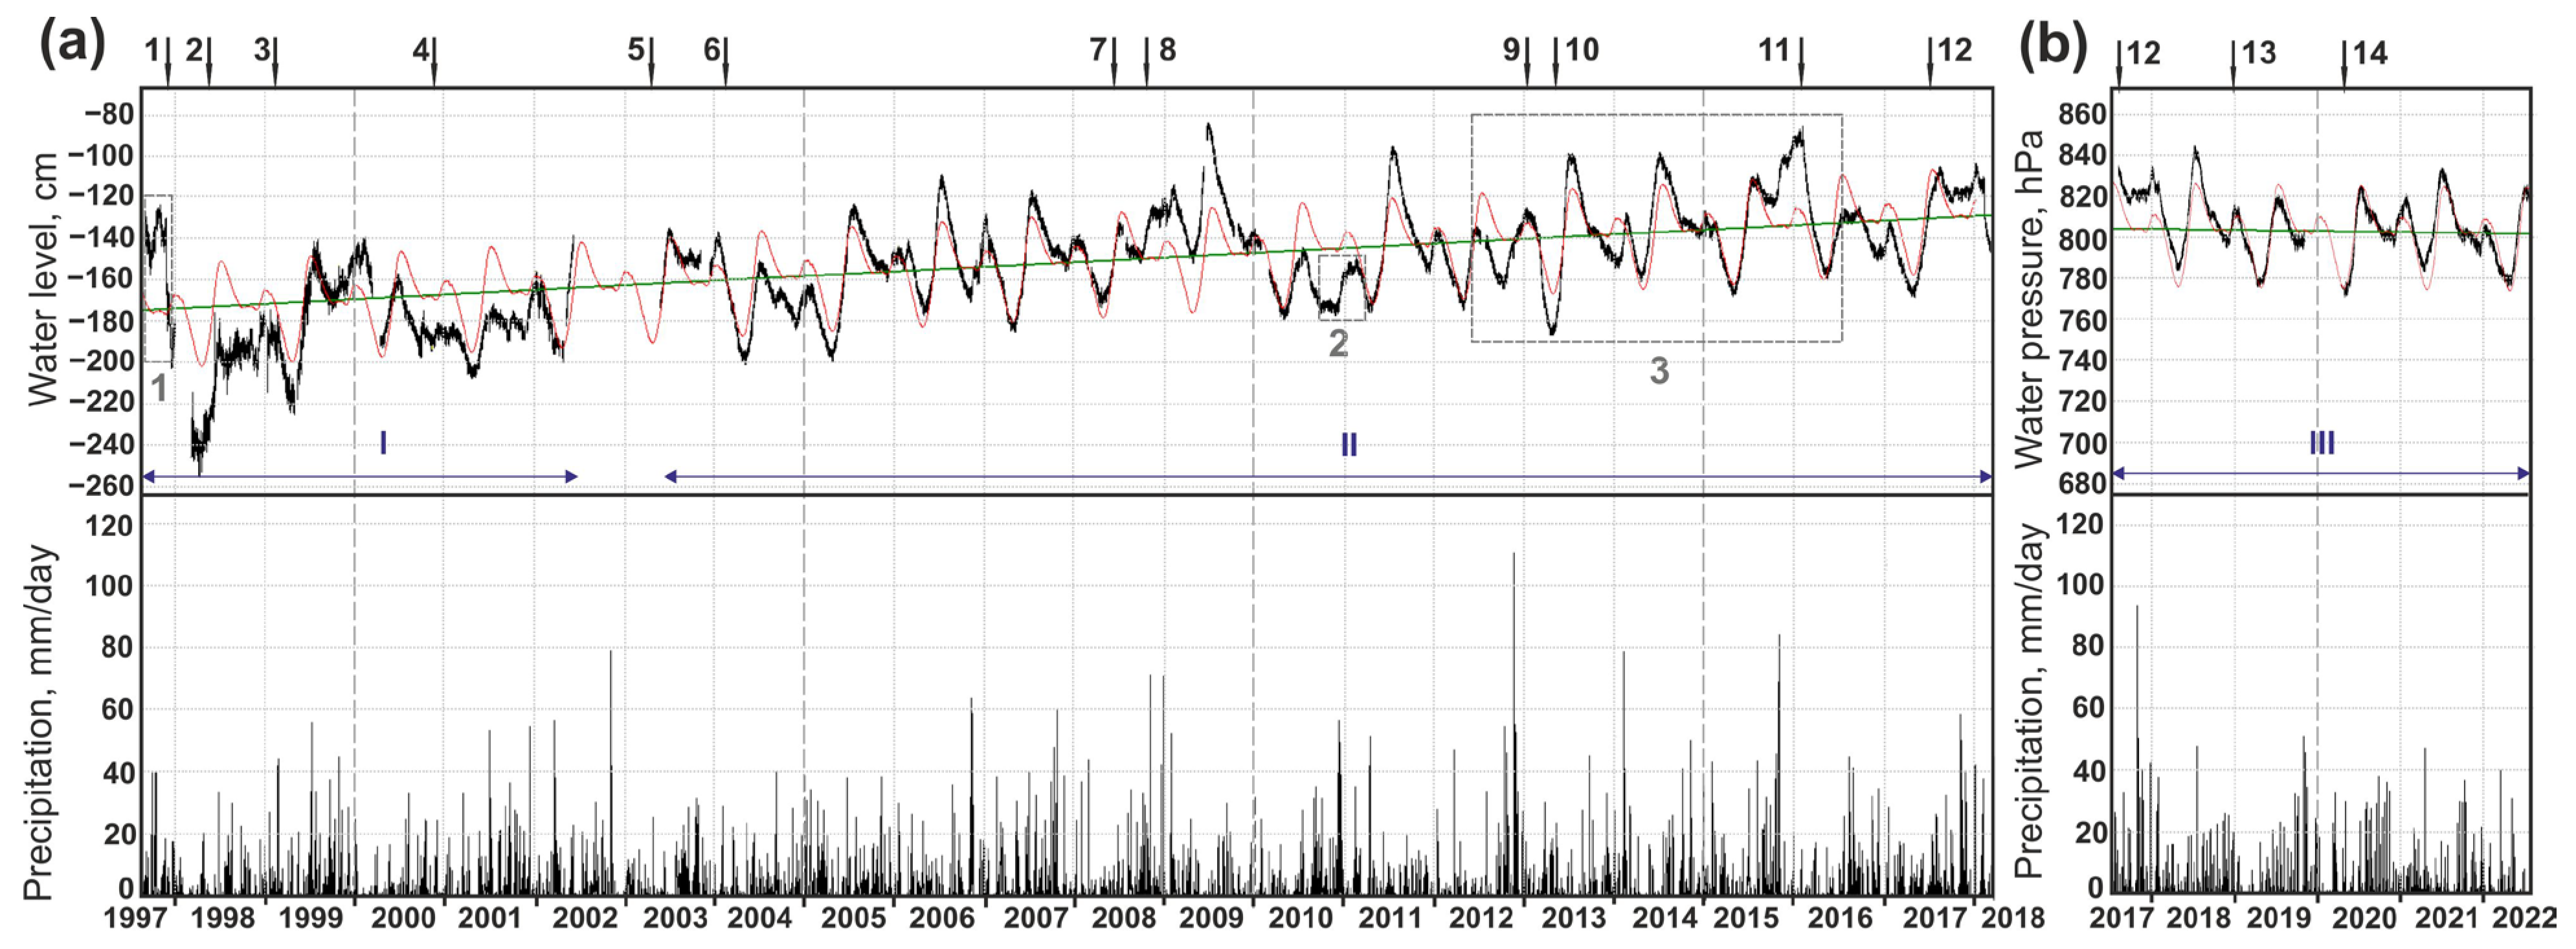
Figure 3 shows hourly mean groundwater pressure variations over the entire observation time compared to precipitation and earthquakes (Table 3). These series were obtained by averaging the original 10- or 5-minute water level measurements (stages I and II) and water pressure measurements at frequency of 20 Hz (stage III) in 1-h window, followed by adaptive compensation for barometric variations. Compensation of barometric variations was carried out using separate fragments of qualitative data of level/pressure measurements.
Gaps in observational data in 1998–2003 and in other years are due to exclusion from the consideration of incorrect water level registration data due to equipment failures. From 2004 to February 2018 (observation stage II) and from October 2017 to July 2022 (stage III), the equipment operated practically without failures.
Liquid and solid precipitation with amplitudes up to 15–20 mm/day (according to observations at the Pionerskaya meteorological station) did not affect the variations in water pressure in the well. However, with precipitation ≥15–20 mm/day, increases in water pressure with amplitudes of 1–2 cm of the water column were observed for 1–2 days due to additional load on the confined aquifer [34].
On Figure 3, changes in groundwater pressure are presented in comparison with the seasonal function of head change calculated over a long period of continuous observations (see Section 2.3), together with linear trends for the observation periods 1997–2018 (Figure 3a) and 2017–2022 (Figure 3b). Linear trend rates in water pressure changes were 2.2 cm/year (increase) for the observation period 1997–2017 and −0.5 hPa/year (decrease) for the observation period 2017–2022.

2.2. Barometric and Tidal Variations

Analysis of barometric and tidal responses in water level changes in an open piezometric well makes it possible to evaluate the properties of the well as a strain-meter. Using data on barometric and tidal responses, it is possible to assess the static confined conditions in the considered “well–aquifer” system as well as the elastic properties of water-bearing rocks [31,42,43,44,45]. Popular direction is calculation of variations in amplitude and phase shift of tidal waves, mainly the M2 wave, using the data on the groundwater level for the assessment of transmissivity and permeability changes over time [7,9,46] based on the approach of [47,48].
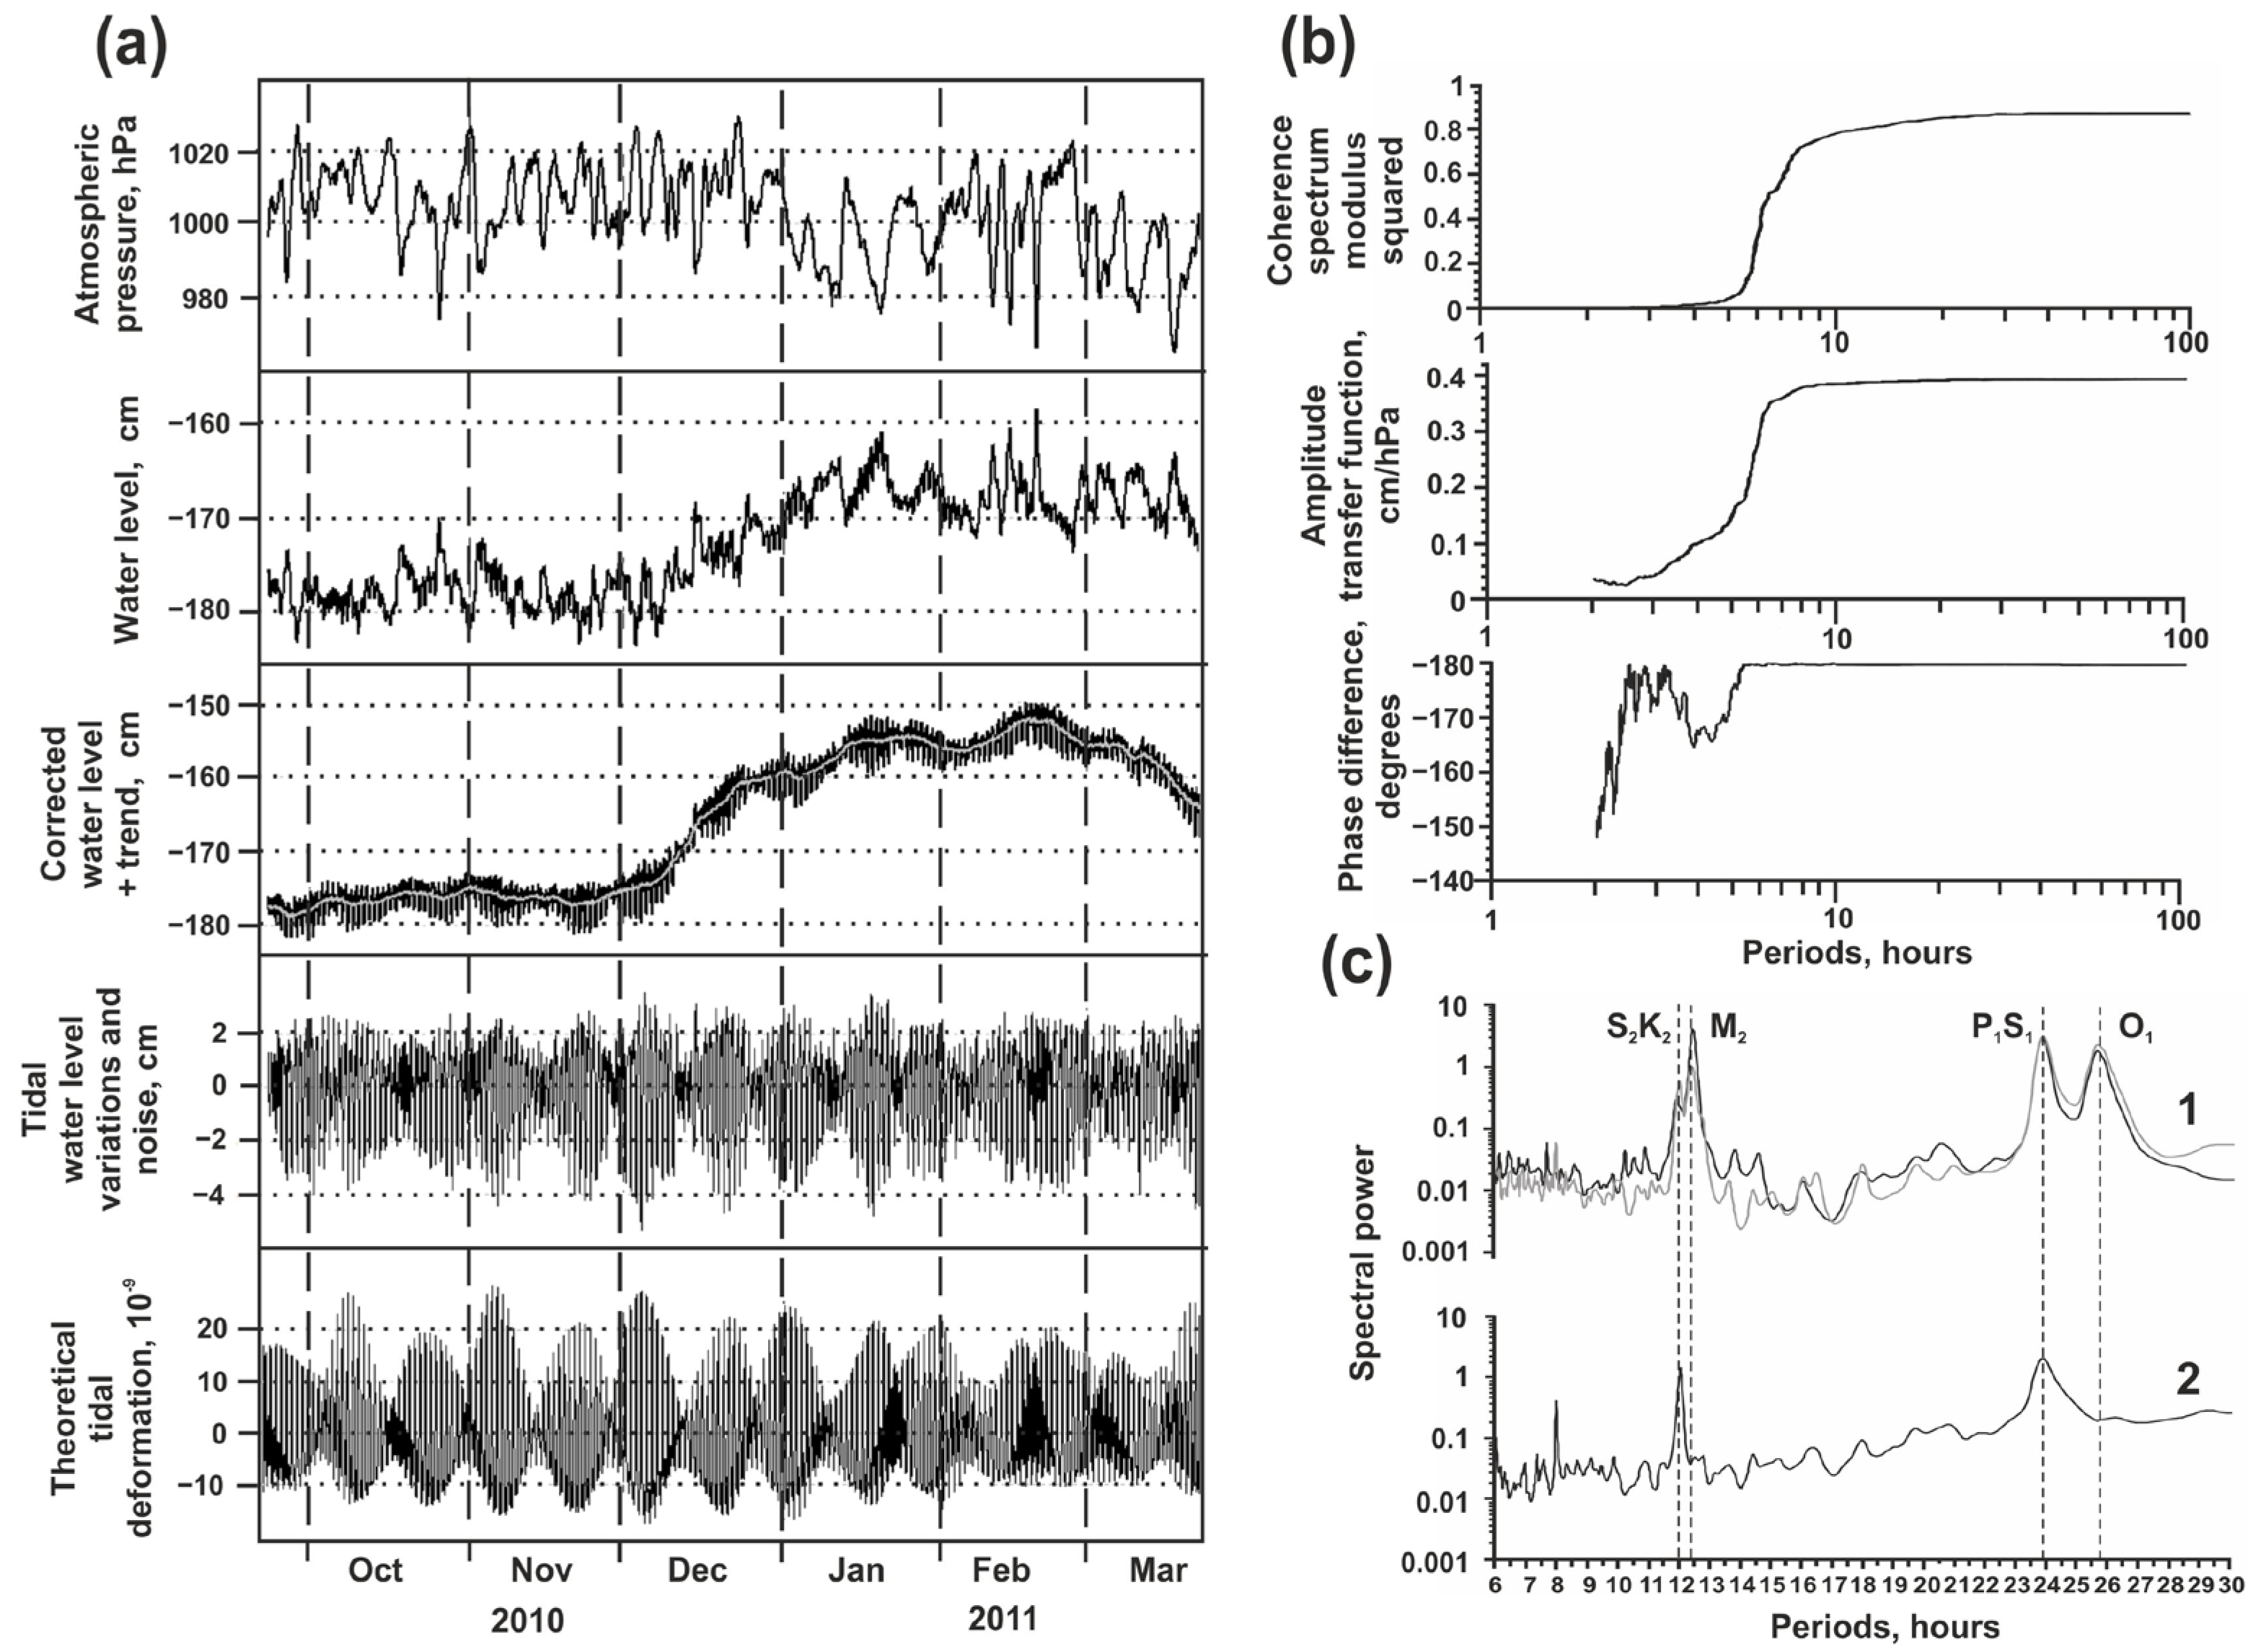
Figure 4a shows a fragment of average hourly water level variations with manifestations of barometric and tidal responses without any seismic influence (Figure 3a, fragment 2). Water level changes after compensation for barometric variations, as well as the highlighted low-frequency trend obtained by averaging the data in a 48-h window with a 1-h offset, are presented on the third panel from the top. Figure 4a, the fourth panel from the top, shows series of differences between water level variations with compensated barometric variations and a low-frequency trend. The resulting series of high-frequency variations in groundwater pressure reflects the calculated tidal changes in volumetric deformation in the well area (see bottom panel).
The study of barometric response of the water level in well YuZ-5 was carried out using a cross-spectral analysis of the data on average hourly water level and atmospheric pressure. Atmospheric pressure was considered as the “input signal”, and water level variations were considered as the “output signal”. Parametric method was used to construct periodograms and cross-periodograms of water level and atmospheric pressure variations. Previously, linear trends were removed from original time series of water level and atmospheric pressure, and transition was made to their first differences to suppress low-frequency components in both time series [38,40,41]. The amplitude transfer function (ATF), squared modulus of coherence spectrum and phase difference between variations in water level and atmospheric pressure are presented in Figure 4b.
The results of cross-spectral analysis show an increase in the barometric response of the water level from zero values to the maximum value of 0.40 cm/hPa in the range of periods from 2 to 6 h and its stability in the range of periods of 6–100 h. The phase difference between changes in water level and atmospheric pressure is −180° in the range of constant value 0.4 cm/hPa of ATF. This indicates the manifestation of an undistorted water level response to barometric variations in the range of periods from 6 h to the first few days and allows the value of −0.4 cm/hPa to be considered as static confined barometric efficiency of water level variations in well YuZ-5 [34,44].
In [50], using cross-spectral analysis of average daily values of water level and atmospheric pressure, a weakening of barometric response in periods ≥20 days was found, which manifests itself in a decrease in ATF values from 0.4 to ≤ 0.3 cm/hPa, in a decrease in the values of the square modulus of coherence spectrum from 0.8 to 0.2, as well as in a significant deviation of the phase difference from −180°.
The weakening of water level barometric response with an increase in periods of variations shows the distortion of quasi-elastic response of groundwater pressure to atmospheric loading at daily periods induced by groundwater flow and seasonal processes in the confined aquifer. Possibility of limited manifestation of water level barometric response in piezometric wells due to groundwater flow in near-surface aquifers is pointed out also in works [42,45].
Thus, the results of cross-spectral analysis of water level and atmospheric pressure variations in a wide range of hourly and daily periods allow us to apply the hypothesis of static confined conditions in the “well–aquifer” system in a range of periods from the first few hours to the first tens of days for well YuZ-5. At periods of more than the first tens of days, a static confined response of groundwater pressure to earthquake preparation and postseismic disturbances can be distorted by groundwater flow and seasonal changes in hydrostatic head.
In contrast to broadband barometric influence, the tides in water pressure changes are characterized by limited set of peaks in power spectrum of water level variations corresponding to individual waves of tidal gravitational potential (Figure 4c, plot 1). In the power spectrum of average hourly water level data, there are peaks corresponding to tidal waves S2K2 (period 12 h), M2 (12.42 h), P1S1 (23.93 h) and O1 (25.82 h). In the spectrum of average hourly variations in the atmospheric pressure in the period range of 6–30 h (Figure 4c, graph 2), only two peaks are distinguished, corresponding to diurnal (24 h) and semi-diurnal (12 h) periodicities of meteorological processes in the atmosphere [51].
The values of barometric efficiency Eb and tidal factors towards volumetric (Av) and areal (As) strain obtained from the tidal analysis of water level and atmospheric pressure variations using the ETERNA 3.0 program [52] are presented in Table 5. The Av and As values were estimated as the average water level tidal sensitivity towards the waves O1, Q1, J1, M1 of diurnal group and the waves S2K2, M2, N2, 2N2 of semidiurnal group [16].
Parameters of water-bearing rocks—compressibility β, shear modulus G, Skempton’s coefficient B, specific elastic capacity Ss, porosity ϕ (Table 5)—were calculated using the formulas of poroelasticity theory [53,54,55]. Storage coefficient S = Ss × d, where d = 100 m (total thickness of water-bearing mudstones in the depth range of 310–800 m). Transmissivity T = 7.8 M2/day estimated from pumping test [33].
Data from Table 5 were used to estimate volumetric deformation D1 during coseismic fluctuations (Table 3) and hydrogeodynamic precursors of earthquakes Nos. 1 and 11 (see Section 4.2) as well as to describe the mechanisms of hydrogeodynamic processes initiated by the impact of seismic waves [18].

2.3. Seasonal Head Change Function

The most pronounced component of long-term changes in the water level in well YuZ-5 (Figure 3) is the annual variations of hydrostatic head due to seasonal features in groundwater supply, discharge and runoff.
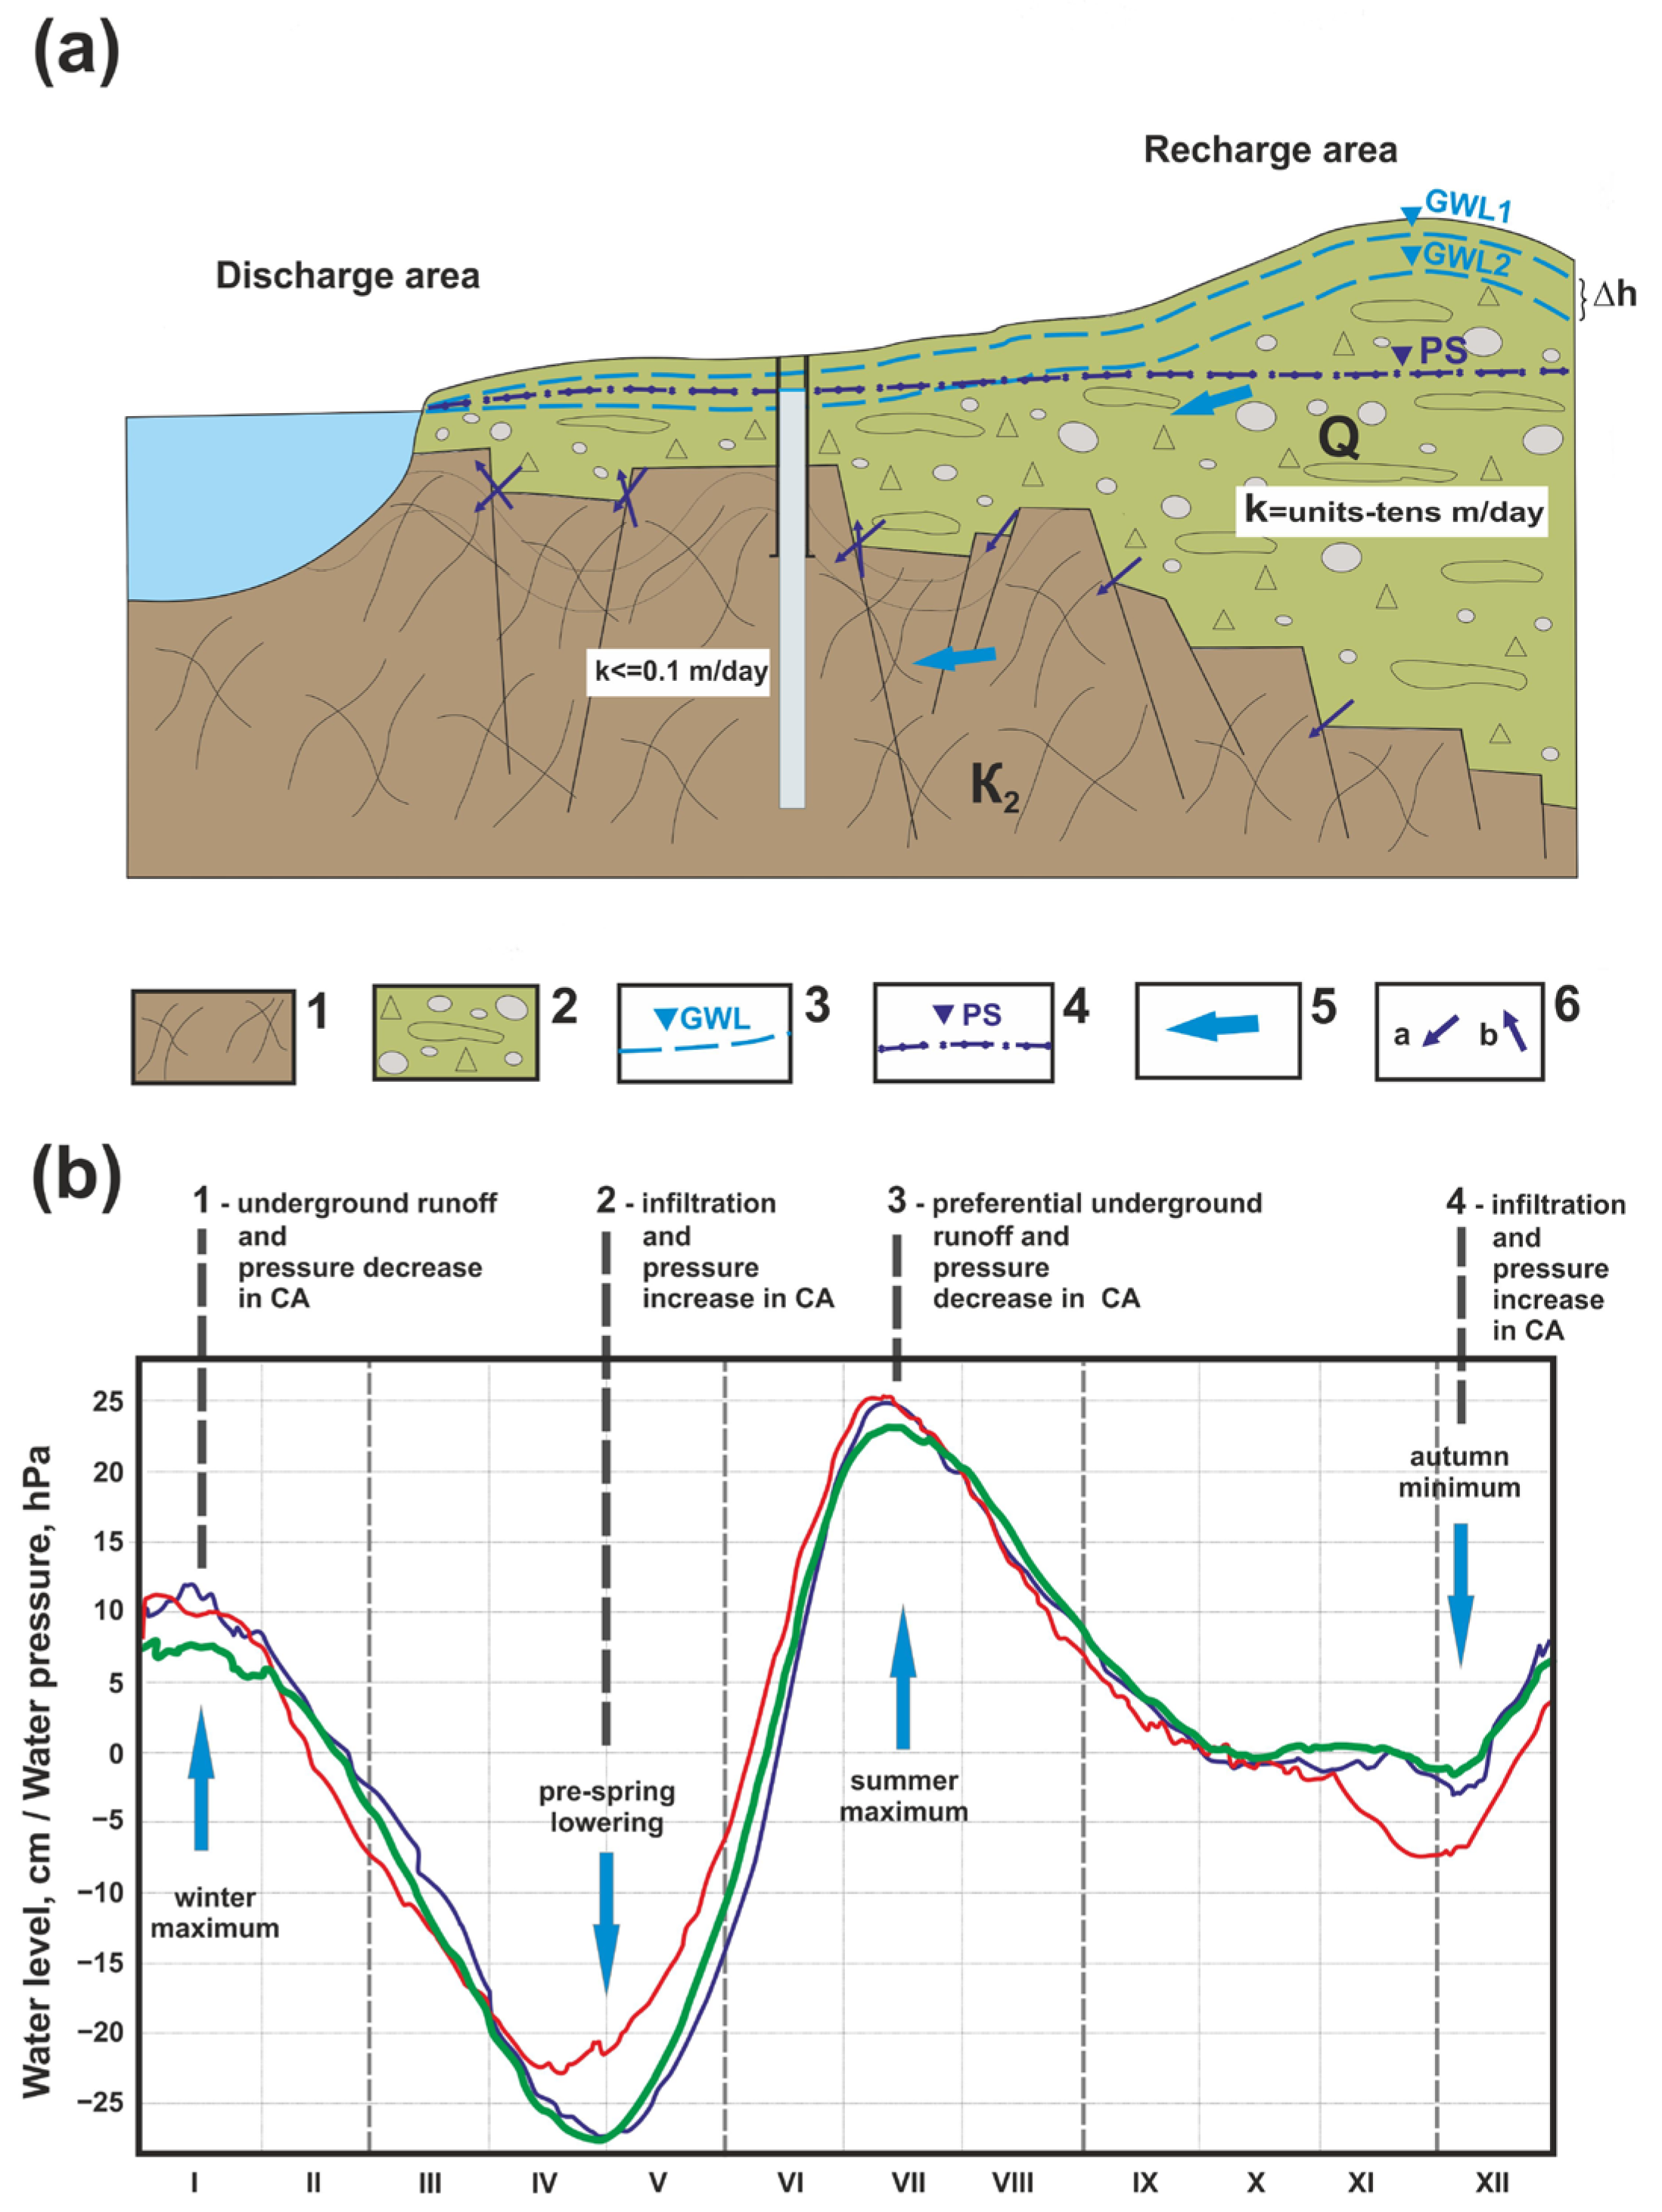
Changes of hydrostatic head in the well during the year are shown in the diagram (Figure 5). Changes in water pressure in the well are determined by changes in the height of the groundwater column in the recharge area (Δh) during the infiltration of meteoric waters and groundwater runoff towards the regional discharge area. The maximum increase in groundwater pressure in the recharge area occurs in April-June after the transition of the average daily air temperature to positive values and an increase in infiltration during the intensive melting of snow and glaciers on the surrounding uplands including the volcanic areas [23]. In July-November, the height of the water column in recharge area decreases due to groundwater off flow to local and regional discharge areas. Changes in groundwater pressure in recharge area are transmitted to the confined aquifer (CA) mainly by elastic mechanism, and they are reflected in annual fluctuations of the water level in well YuZ-5.
Figure 5b shows the seasonal head change functions with discretization of one day obtained for four fragments of observations over 5, 14 and 4 years. These functions were estimated with the use of the program MESOSAUR [56] for constructing the seasonality model applied to the average daily data of water level/pressure observations with compensated barometric variations. We used the additive model of annual water level/pressure changes Y(t) with linear trend T(t) and seasonality S(t):
Y(t) = (T(t) + S(t)) + Er(t),
where Er(t) represents residuals in cm or hPa, representing the difference between the observed values of water level/pressure time series and their calculated values according to the model. Linear trend in (1) is defined as T(t) = A × t + B, where A is a constant that determines the average daily trend rate, cm/day; B is the average value of water level position relative to top of the wellbore (for level measurement data, cm) or average value of water pressure at a depth of 8 m below the water level (for pressure recording data, hPa). Seasonal component S(t) with period L = 365 days was defined as S(t) = S(t + L) and S(1) + … + S(365) = 0. Values S(1), …, S(365) represent the seasonality indices, which determine the average position of the water level in cm or average pressure at a depth of 8 m in hPa for each day of a 365-day calendar year from 1 January to 31 December after removing the linear trend.
Quality of the seasonality model with linear trend assessed by the value of determination coefficient R2 ≤ 1, which shows the share of explained dispersion of the initial water level/pressure time series: R2 = 1−SEr2/Sos2, where SEr2 is the dispersion of the residuals, Sos2 is the dispersion of the initial series.
Standard error of residuals σ and maximum error of residuals σmax, as well as ratio σmax/σ, are model parameters that show the average and maximum deviation of the actual data from their model approximation. Model parameter estimates for each of the four fragments of the observational data are given in Table 6.
The average seasonal functions calculated for three observation intervals (Figure 5b) show the change in daily seasonality indices from 1 January to 31 December, and they are of the same type with characteristic amplitudes of pressure changes during the year, 45–50 cm of the water column (≈ 45–50 hPa).
Annually recurring phases of water level/pressure changes in well YuZ-5 correspond to hydrological regime of seasonal, mainly spring–summer and autumn groundwater recharge with a clearly defined pre-spring minimum and summer maximum, as well as a less pronounced autumn minimum and autumn-winter maximum [57].
In the behavior of seasonal functions constructed from different data fragments (Figure 5b), there is a small difference in the time of the extremely low position of water level/pressure in April–the first half of May and their extremely high position in July. The shifts of the maxima and minima in the amplitude are up to 5–7 cm, and in time the shift of the extrema can reach 10–15 days.
The shifts of the extrema of seasonal functions in amplitude and time are due to individual features of the time series used to construct the seasonal functions, including effects of the strongest earthquakes. After earthquakes Nos. 1, 9 and 11 (Table 3, Figure 3), postseismic decreases in water pressure with amplitudes of 30–100 cm of the water column (0.03–0.1 bar) took place for up to three months [18].
Shifts in the extremes of seasonal functions can also occur due to the time shift in different years of maximum phases of infiltration recharge, as well as the influence of groundwater overflow at the boundary between the UA and CA (Figure 5a). Pronounced seasonal variations in groundwater pressure in the well, as well as the predominantly hydrocarbonate composition and low mineralization of groundwater (Table 1), also indicate the possibility of mixing of water in the CA with fresh water from the UA in the well area. Therefore, it can be assumed that the value of hydrostatic head in well YuZ-5, in addition to elastic transfer of changing pressure from recharge area, can also be influenced by groundwater overflow at boundary between the UA and CA. However, the role of this process seems insignificant compared to the influence of annual changes in the height of the water column in the recharge area (Figure 5a), due to significant difference in the filtration properties of water-bearing rocks in the UA and CA.
When estimating the seasonal head change function in the well tapped in the confined aquifer, we recommend using long-term observation series of at least 11 years to compensate for short-term disturbances in annual seasonality due to irregularity in infiltration of meteoric waters in the recharge area during 11-year cycles of solar activity [57]. Therefore, below, in the analysis of water level variations identified as supposed HPs before earthquakes Nos. 1 and 11 (Table 3), the average seasonal function obtained from the longest fragment of continuous observations in 2004–2017 is used. This seasonal function describes the main regularities of the head change during the year with an amplitude of 40–50 cm of the water column and is determined by the pre-spring pressure minimum and summer pressure maximum. According to the data of 14-year observations, the element of seasonal function corresponding to autumn minimum and autumn-winter maximum is very weakly expressed (≤1–2 cm). However, in the behavior of seasonal functions constructed on basis of observation series for 3–5 years, the amplitude of head variations from autumn minimum to autumn-winter maximum can be up to 5–10 cm. Thus, the influence of individual years with increased amount of effective precipitation in October–the first half of November on the behavior of seasonal head change functions calculated from short series of observations is manifested.

3. Seismo-Hydrogeodynamic Effects

We will understand the anomalies in groundwater pressure changes associated with individual earthquakes from the seismo-hydrogeodynamic effects (SHGEs), which can manifest themselves both before the earthquakes (hydrogeodynamic precursors, HPs) and after the arrival of seismic waves within minutes (coseismic effects, CSEs) and within hours and days (postseismic effects).
Identification of SHGEs in the water level/pressure changes in well YuZ-5 was carried out both retrospectively and in near-real time during the processing of the current observational data and the preparation of weekly information messages to the Kamchatka branch of the Russian Expert Council for Earthquake Prediction.
In both cases, the same methods of processing the observational data were used, including the following activities:
(1)
Compensation for barometric and tidal variations in the original average hourly water level/pressure records to highlight the low frequency component of pressure changes (trend) (Figure 4a);
(2)
Comparison of the trend in water level/pressure changes with the behavior of the seasonal head change function together with the data on atmospheric precipitation from the observations at the Pionerskaya meteorological station (Figure 1b);
(3)
Accounting for empirically established influence of precipitation with intensity of ≥15–20 mm/day, causing increases in water pressure in the well.
With the use of the DIMAS program [58], a detailed visual analysis of water level variations with periodicity of 5–10 min (stages I, II) and pressure variations with a frequency of 20 Hz (stage III) was performed in comparison with the seismic records of local and distant earthquakes of the PET seismic station. With the use of the DIMAS program, the arrival times of different wave groups in the seismic records and in the water level/pressure changes were distinguished and compared.
The processing of the observational data in well YuZ-5 and construction of time series (for examples, see Figure 2, Figure 3 and Figure 4a, Figure 5b, Figure 6 and Figure 7) were carried out using the POLYGON Information System [59], which includes the database for the entire observation time, a program to compensate for barometric variations in the water level/pressure changes [38,40], as well as an interactive graphical interface.
Below, we will consider (1) the seismo-hydrogeodynamic effects before, during and after the strongest earthquakes of 5 December 1997 (Kronotskoye, KE) and 30 January 2016 (Zhupanovskoye, ZhE) (Nos. 1 and 11 in Table 3), (2) the regularities in the manifestation of coseismic effects (CSEs) and (3) the hydrogeoseismic variations caused by the vibration impact of the seismic waves during the earthquakes with Mw = 6.8–9.1 at epicentral distances de = 80–14,600 km [18].

3.1. Earthquake of 5 December 1997, Mw = 7.8

The Kronotsky earthquake (hereinafter, the KE, No. 1 in Table 3 and Table 4 and in Figure 1a and Figure 3) occurred three months after the start of observations at w. YuZ-5. The KE was the strongest seismic event during the observation period. The intensity of shaking in the well area during the KE was 5–6 points. The KE source according to the aftershocks of the first day had the dimensions of 220 × 140 km. Before the KE, various precursors were recorded, including a swarm of foreshocks near the instrumental epicenter for two days before the main shock, movement of the GPS stations [36], anomalous changes in the chemical composition of water in deep self-flowing wells [17,35], etc.
The groundwater pressure variations in wells YuZ-5 and E-1 (Figure 1b) in connection with the KE were previously described in [17,34,35] and are shown in Figure 6a in comparison with precipitation.
Changes in water pressure in well YuZ-5 were consistently manifested as follows:
—A pressure decrease with an amplitude of 11 cm for three weeks before KE—the supposed hydrogeodynamic precursor (Figure 6b);
—A coseismic decrease in pressure with amplitude Δh = 12 cm within 12 min after the beginning of the rupture process in the source (Figure 6c);
—A postseismic decrease in water pressure with amplitude Δh ≈ 1 m for three months.
After reaching the minimum in postseismic drawdown, the recovery of water pressure in the well to its previous position continued for about two years (Figure 3a).
In works [34,35], the conclusion about hydrogeodynamic precursor before the KE was based on synchronous manifestation of bay-like decreases in water pressure in two wells and anomalous movements of GPS stations near the KE source.
Before KE, there was also an increase in water pressure in well YuZ-5 from the beginning of October to the first ten days of November (Figure 6a). Such an increase in water pressure was anomalous in comparison with the behavior of seasonal change head function (gray line in the middle panel of Figure 6a) and could be caused by heavy precipitation which amounted in October to more than 400 mm with daily precipitation on some days of up to 75 mm/day. However, bay-like decreases in water pressure from 13 November to 25 November with an amplitude of 11 cm in well YuZ-5 and with an amplitude of 1 cm in well E-1 were anomalous phenomena that occurred synchronously with the movements of the GPS stations in the KE source area.
A sharp decrease in water pressure with an amplitude of 12 cm (Figure 6c) was first recorded immediately after the arrival of seismic waves during the KE in Kamchatka. The duration of a coseismic decrease in pressure was estimated at about 12 min with the time at the source 11:27 and water level measurements at 11:20, 11:30 and 11:40 UT.
From 11:50 UT and over the next 3.5 months, a water pressure decrease developed with an amplitude ≈1 m or ≈0.1 bar (Figure 3a). Such a pressure decrease is explained by the improvement of permeability of the water-bearing rocks in the confined aquifer during the intense shaking and the occurrence of a local source of pressure drop or many such sources at a distance of up to a few hundred meters from the well [18,34]. The gradual water pressure return to the background values of the seasonal hydrostatic head in about two years, apparently, was associated with the restoration of filtration properties of the water-bearing rocks in the confined aquifer after the KE.

3.2. Earthquake on 30 January 2016, Mw = 7.2

An earthquake with magnitude Mw = 7.2 and hypocenter depth H = 180 km (No. 11 in Table 3 and Table 4, Figure 1a) occurred at epicentral distance de = 80 km (hypocentral distance dh = 200 km) from well YuZ-5. The intensity of shaking in the area of well YuZ-5 was 5 points on the MSK-64 scale [39]. In [60], this earthquake was called the Zhupanovsky earthquake (hereinafter, the ZhE), and the precursors detected in real time before the ZhE, including the changes in the water level in well E-1 and concentration radon in subsoil gas, were indicated.
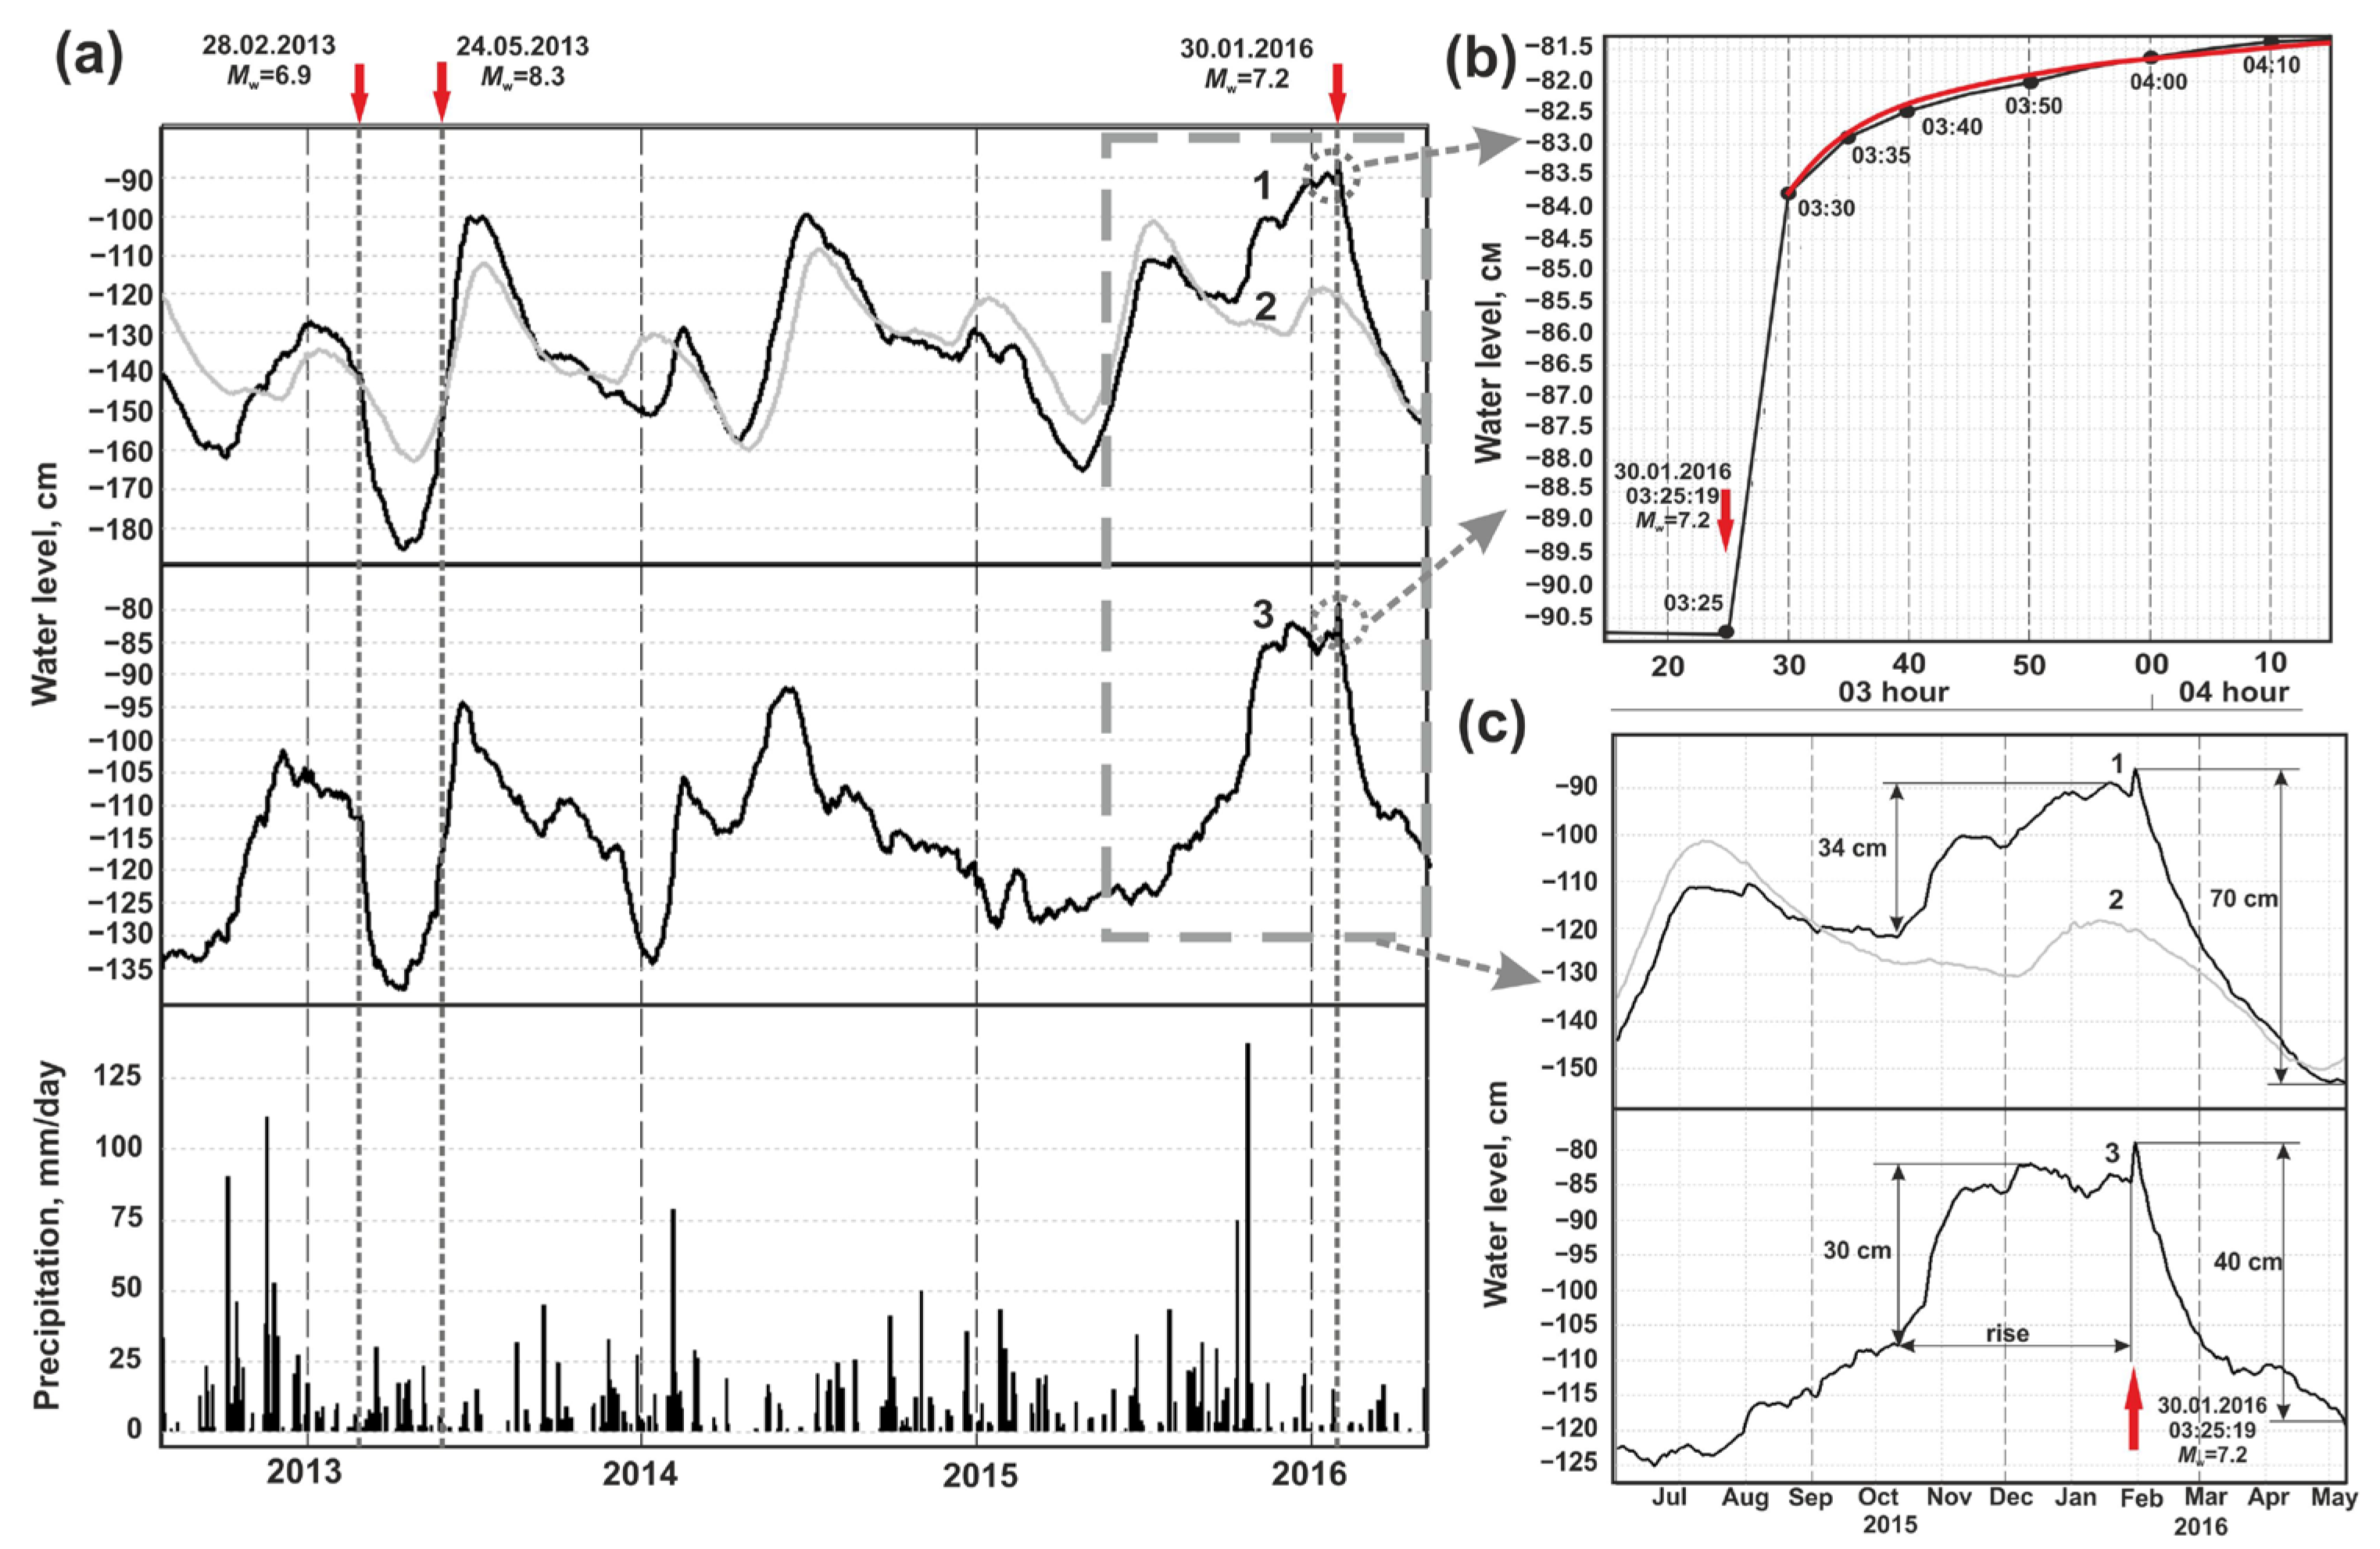
Water pressure changes in wells YuZ-5 and E-1 during the ZhE were described in [29]. In the YuZ-5 well, the different types of seismo-hydrogeodynamic effects were consistently manifested (Figure 7) as follows:
—The supposed hydrogeodynamic precursor in the form of the water pressure increase with amplitude Δh ≈ 30 cm during 3.5 months before the ZhE (Figure 7a,c);
—The coseismic increase in water pressure with amplitude Δh = 9.4 cm for 45 min after the ZhE time (Figure 7b);
—The postseismic water pressure decrease with an amplitude of ≈40 cm during February–April 2016.
The anomalous increase in water pressure relative to the average long-term change in the hydrostatic head can be traced during September 2015–January 2016 (Figure 7c, top panel). After subtracting the seasonal head function from the current observations, together with a linear trend, the excess amplitude in pressure in October-December 2015 was approximately 30 cm (Figure 7c, bottom panel).
The mechanism of the 45-minute rise in the water level after the arrival of seismic waves (Figure 7b) is explained in [29] by the superposition of a coseismic increase in water pressure due to static volumetric compression of water-bearing rocks and an impulsive increase in groundwater pressure near the wellbore during seismic shaking. Both processes were accompanied by a water inflow into the wellbore and water level rise.
Seismic shaking can be accompanied by pulsed head changes and short-term nonlinear filtration of groundwater due to local inhomogeneity in filtration properties of the water-bearing rocks adjacent directly to the wellbore [11,61].
To describe the rise in the water level u(t) during a pulsed pressure increase, the damped exponential function was used, which characterizes the flow of groundwater without specifying the spatial change in the pressure field that causes a water inflow into the well [45]:
u(t) = u0(1 − exp(−t/tr)),
where u0 is the maximum amplitude of the water level rise, t is time, and tr is the relaxation time of pressure impulse in the “well–aquifer” system.
To estimate the amplitude of CSE due to the elastic compression of water-bearing rocks, it was assumed that the corresponding increase in pressure occurred within time of no more than 10 min, i.e., in the period from 03:25 to 03:35 (Figure 7b). The CSE amplitude Δh was determined by selection, taking into account the total water level rise with the maximum amplitude of 9.4 cm for 45 min. The amplitude of 9.4 cm is the sum of value u0, determined by (2), and the unknown value of water level rise Δh: u0 + Δh = 9.4 cm.
The calculated water level rise for 45 min is in good agreement with the observed data at a CSE amplitude Δh = 7.3 cm, u0 = 2.1 cm and tr = 12 min (Figure 7b).
The estimated amplitude of coseismic pressure increase Δh = 7.3 cm in the ZhE was quite large. Only in the case of the earthquake of 5 December 1997 (KE), a coseismic water level decrease with a larger amplitude Δh = −12.2 cm was registered.
After the ZhE, a water level decrease was observed for three months (Figure 7c). Since May 2016, the behavior of the water level in well YuZ-5 corresponded to its background seasonal variations. Visually, the amplitude of a water level decrease from 30 January to 1 May 2016 was approximately 70 cm (see Figure 7c, top panel). If we take into account seasonal head changes in the well over a long period (see Figure 7a,c, bottom panel), then the amplitude of a postseismic water pressure decrease due to the ZhE is estimated at approximately 40 cm or 0.04 bar.

3.3. Coseismic Effects in Groundwater Pressure Changes

The data on coseismic effects observed in the YuZ-5 well are presented in Table 3. Such data were identified according to water level measurements with a frequency of 5–10 min at stages I–II and according to the water pressure registration with a frequency of 20 Hz at stage III.
When using the data of the 5–10-minute registration of the water level, the CSEs were recorded for no more than 5–12 min after the instrumental time of the earthquake (for an example, see Figure 6c).
The authors of [16] noted the difficulties in separating the effects in the groundwater pressure changes immediately after the rupture in the EQ source according to the 5–10 min registrations due to the superposition of the water-bearing rock’s capacity effect due to static deformation and nonlinear groundwater filtration near the wellbore due to the dynamic deformation of the water-bearing rocks by seismic waves. We assumed that the mechanism of the elastic fluid loss of water-bearing rocks with the water inflow into the wellbore was localized by the volume of the water-bearing rocks directly near the open part of the wellbore, and it acted for no more than 5 min after the EQ time. In Section 3.2, Figure 7b shows an example of estimating the amplitude of a coseismic rise in the water level changes during the ZhE according to the data of the 5 min recording.
Another example of a coseismic water level increase during the EQ of 17 July 2017 (No. 12 in Table 3) according to the 5-minute measurements is shown in Figure 8. The total increase in the water level within five hours after the EQ was 5.8 cm (Figure 8a,b). Within 5 min after the arrival of seismic waves, the amplitude of the water level rise was h = 4.3 cm, which corresponds to the time t = 5 min in Figure 8b. The increase in the water level at a 5-minute interval and the general increase in the water level within 5 h after the arrival of seismic waves were due to the influx of groundwater into the wellbore caused by the elastic fluid loss of the water-bearing rocks and the nonlinear filtration near the wellbore. To determine the amplitude of coseismic water level increase Δh during 5 min after the arrival of seismic waves, pressure increase u0(t) was calculated also during the 5-minute time interval using formula (2), which describes a water level increase in the well when nonlinear filtration occurs near the wellbore [45]. Taking into account the total increase in the water level with maximum amplitude u0 = 5.8 cm for 5 h, the amplitude of the coseismic pressure increase during the first 5 min is Δh = hu0(t) = 4.3 − 2.3 = 2 cm, where h = 4.3 cm is the total water level increase during the first 5 min, u0(t) = 2.3 cm is the water level increase during the first 5 min when nonlinear filtration occurs (Figure 8b).
The calculated water level rise within 5 h after the arrival of seismic waves (Figure 8b) is in good agreement with the observed data at the amplitude of a coseismic increase in water pressure Δh = 2 cm, u0(t) = 2.3 cm and at value tr = 15 min. Parameter tr was determined by comparing the theoretical function (2) with the observational data.
The value of volumetric coseismic deformation according to the data of water level measurements D1 = −12.4 × 10⁻⁹ during the earthquake on 17 July 2017 (Table 3) was estimated by the following formula:
D1 = −Δh/Av,
where D1 is the volumetric coseismic deformation in the units of 10−9 (a positive value corresponds to the expansion of water-bearing rocks, a negative value corresponds to their compression), Δh is the amplitude of the coseismic water level change in cm (a positive value corresponds to the water level/pressure increase, a negative value corresponds to the water level/pressure decrease), Av = 0.161 cm/10−9- is the tidal sensitivity of the water level in relation to the theoretical volumetric deformation at a depth of 500 m, cm/10−9 (Table 5).
Using the dislocation model [30] and the data on the focal mechanism of the EQ of 17 July 2017 (Table 4), we calculated the areal distribution of the volumetric coseismic strain at a depth of 500 m and value D2 = −13 × 10−9 in the area of well YuZ-5 (Figure 8c). The obtained value and sign (compression) of theoretical volumetric deformation D2 are consistent within one order of magnitude of the value and sign according to the data of water level measurements D1 = −12.4 × 10⁻⁹.
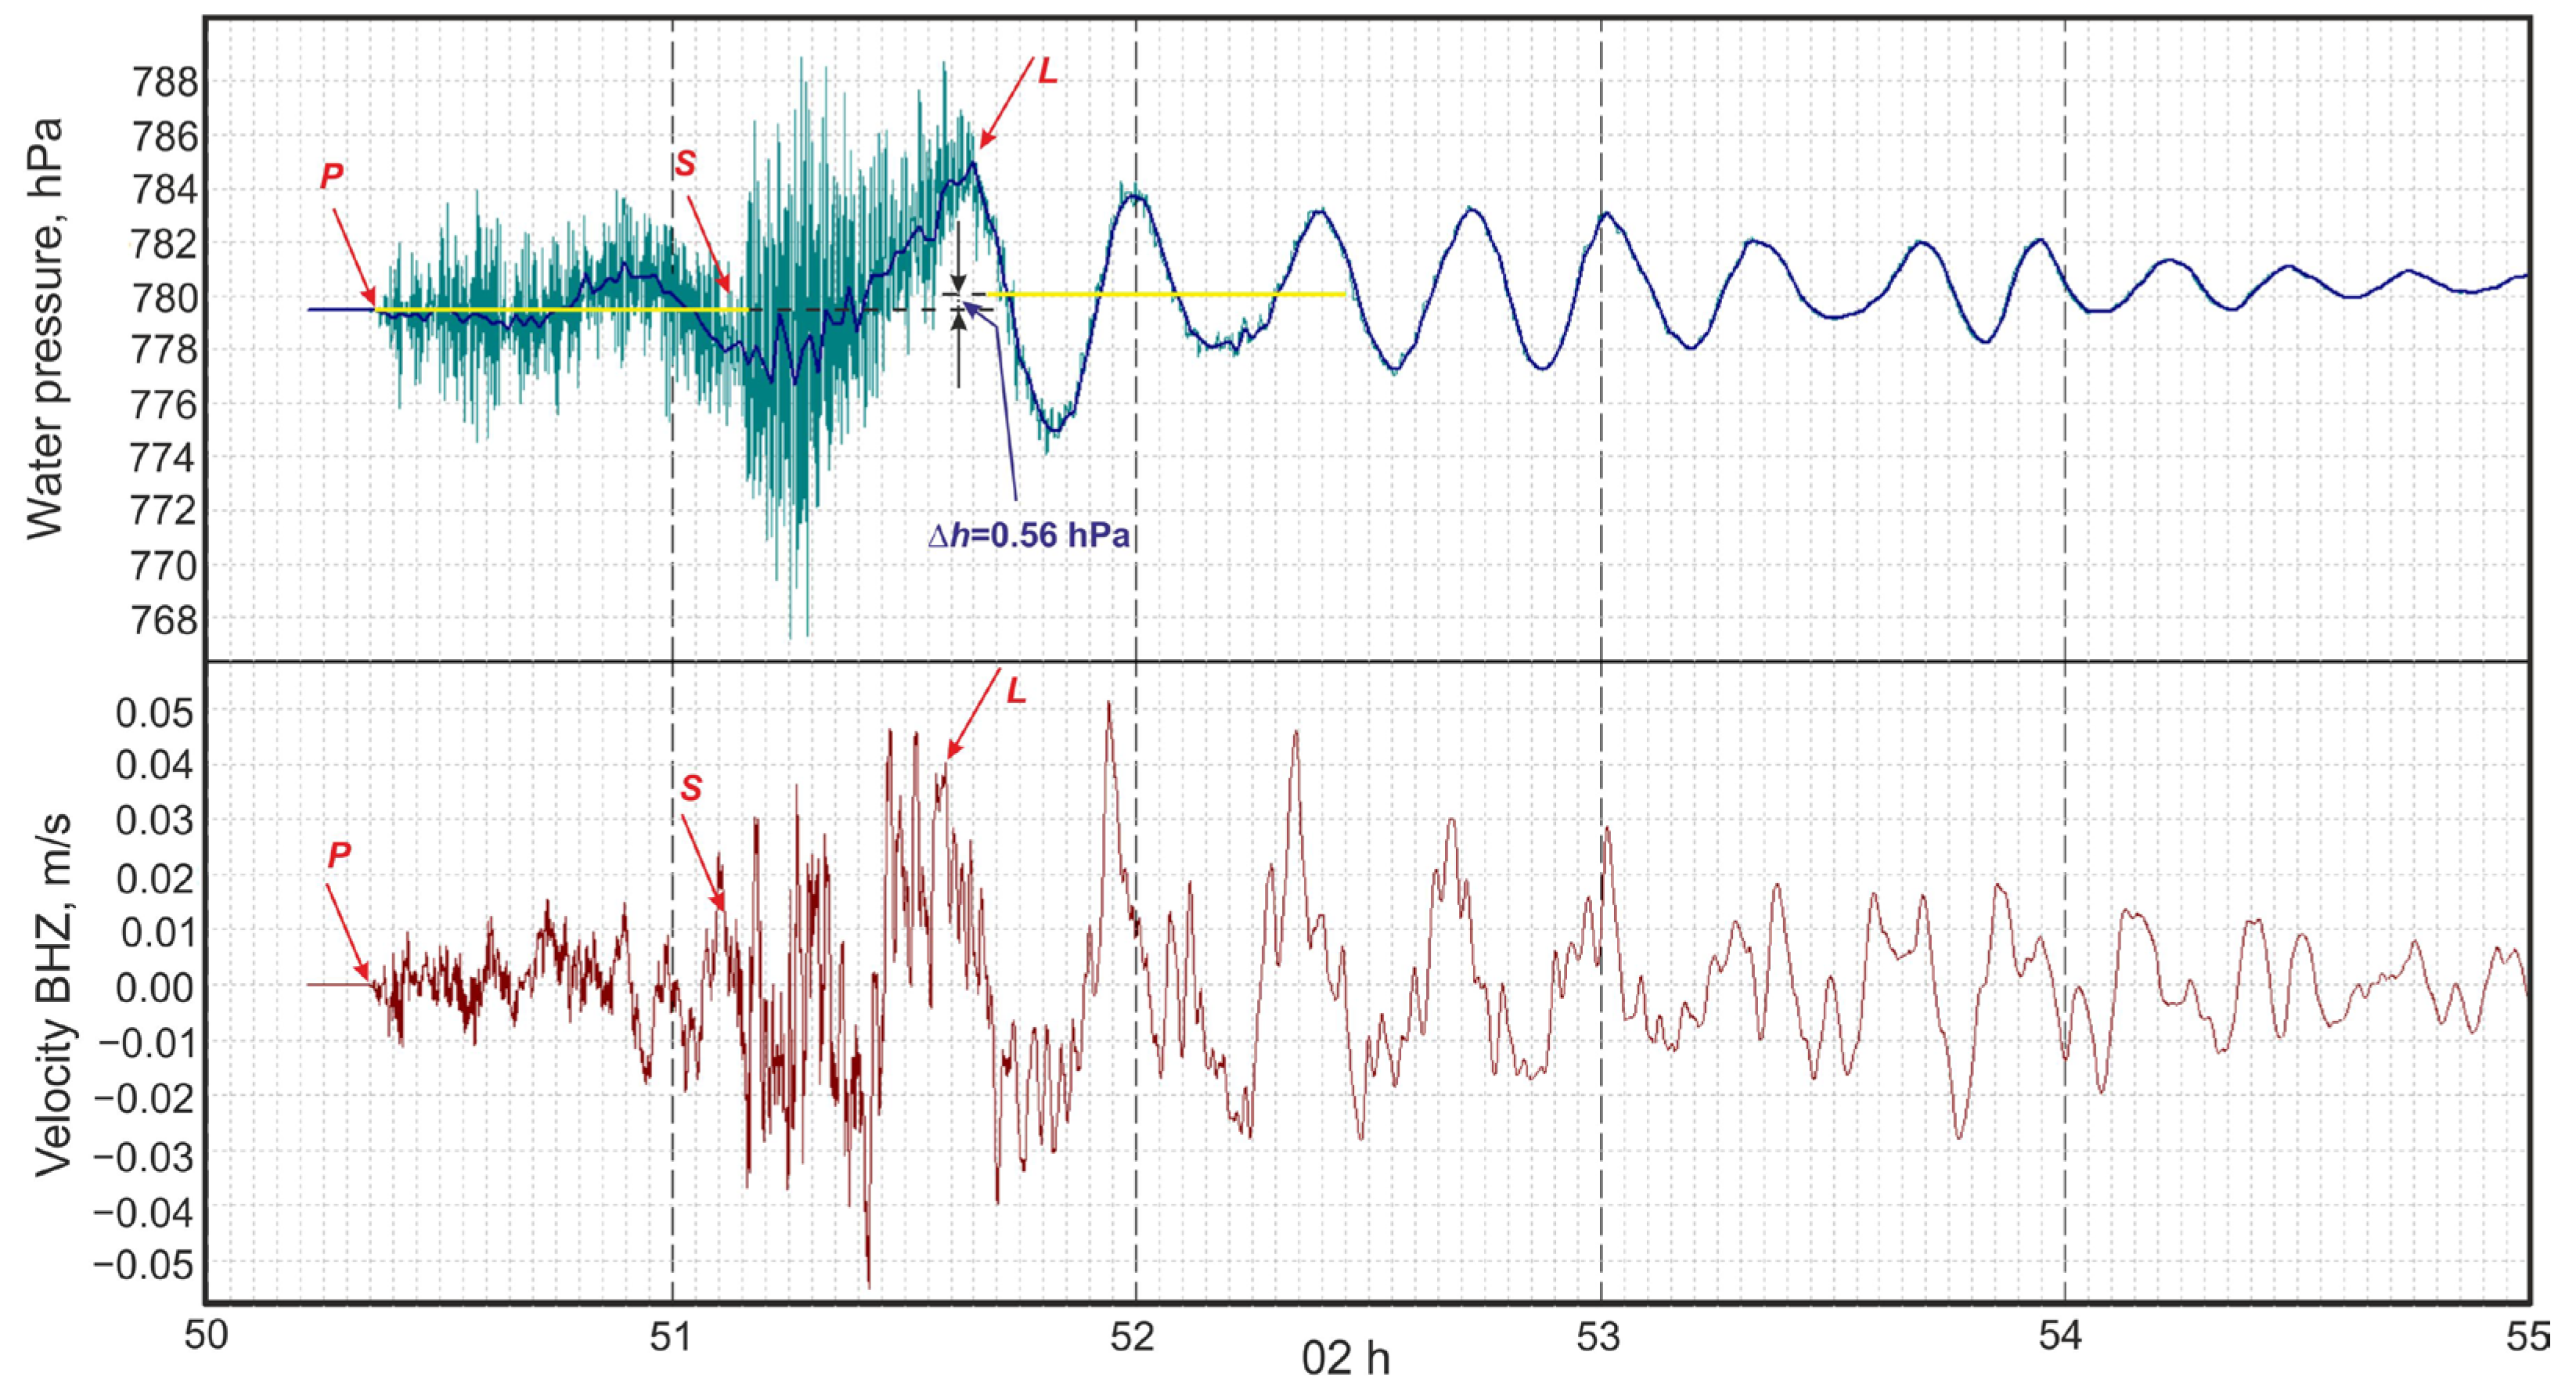
At stage III, when observing water pressure variations with a frequency of 20 Hz, earthquakes No. 13 and 14 occurred (Table 3 and Table 4), at which the calculated changes in static strain in the well area D2 were −1.1 × 10⁻⁹ (No. 13) and −2.3 × 10⁻⁹ (No. 14). Such volumetric strain could cause water pressure increases with amplitudes of 0.3 and 0.5 cm (0.3 and 0.5 hPa). However, identification of CSEs from records of water pressure during earthquakes Nos. 13 and 14 was complicated by amplitude dynamic pressure variations during passage of S-waves. Therefore, to estimate the amplitudes of CSEs, we averaged the data on water pressure variations during the passage of P-waves and during the data fragment of the same length at the initial stage of surface L-waves manifestation. The difference between these average values was taken as an amplitude of a coseismic change in pressure Δh.
Figure 9 shows a record of water pressure variations in well YuZ-5 and a broadband record of EQ No. 14 at PET seismic station on the BHZ channel with the estimated amplitude of coseismic water pressure increase Δh = 0.56 hPa, which corresponds to value D1 = −3.1 × 10⁻⁹ according to (3).
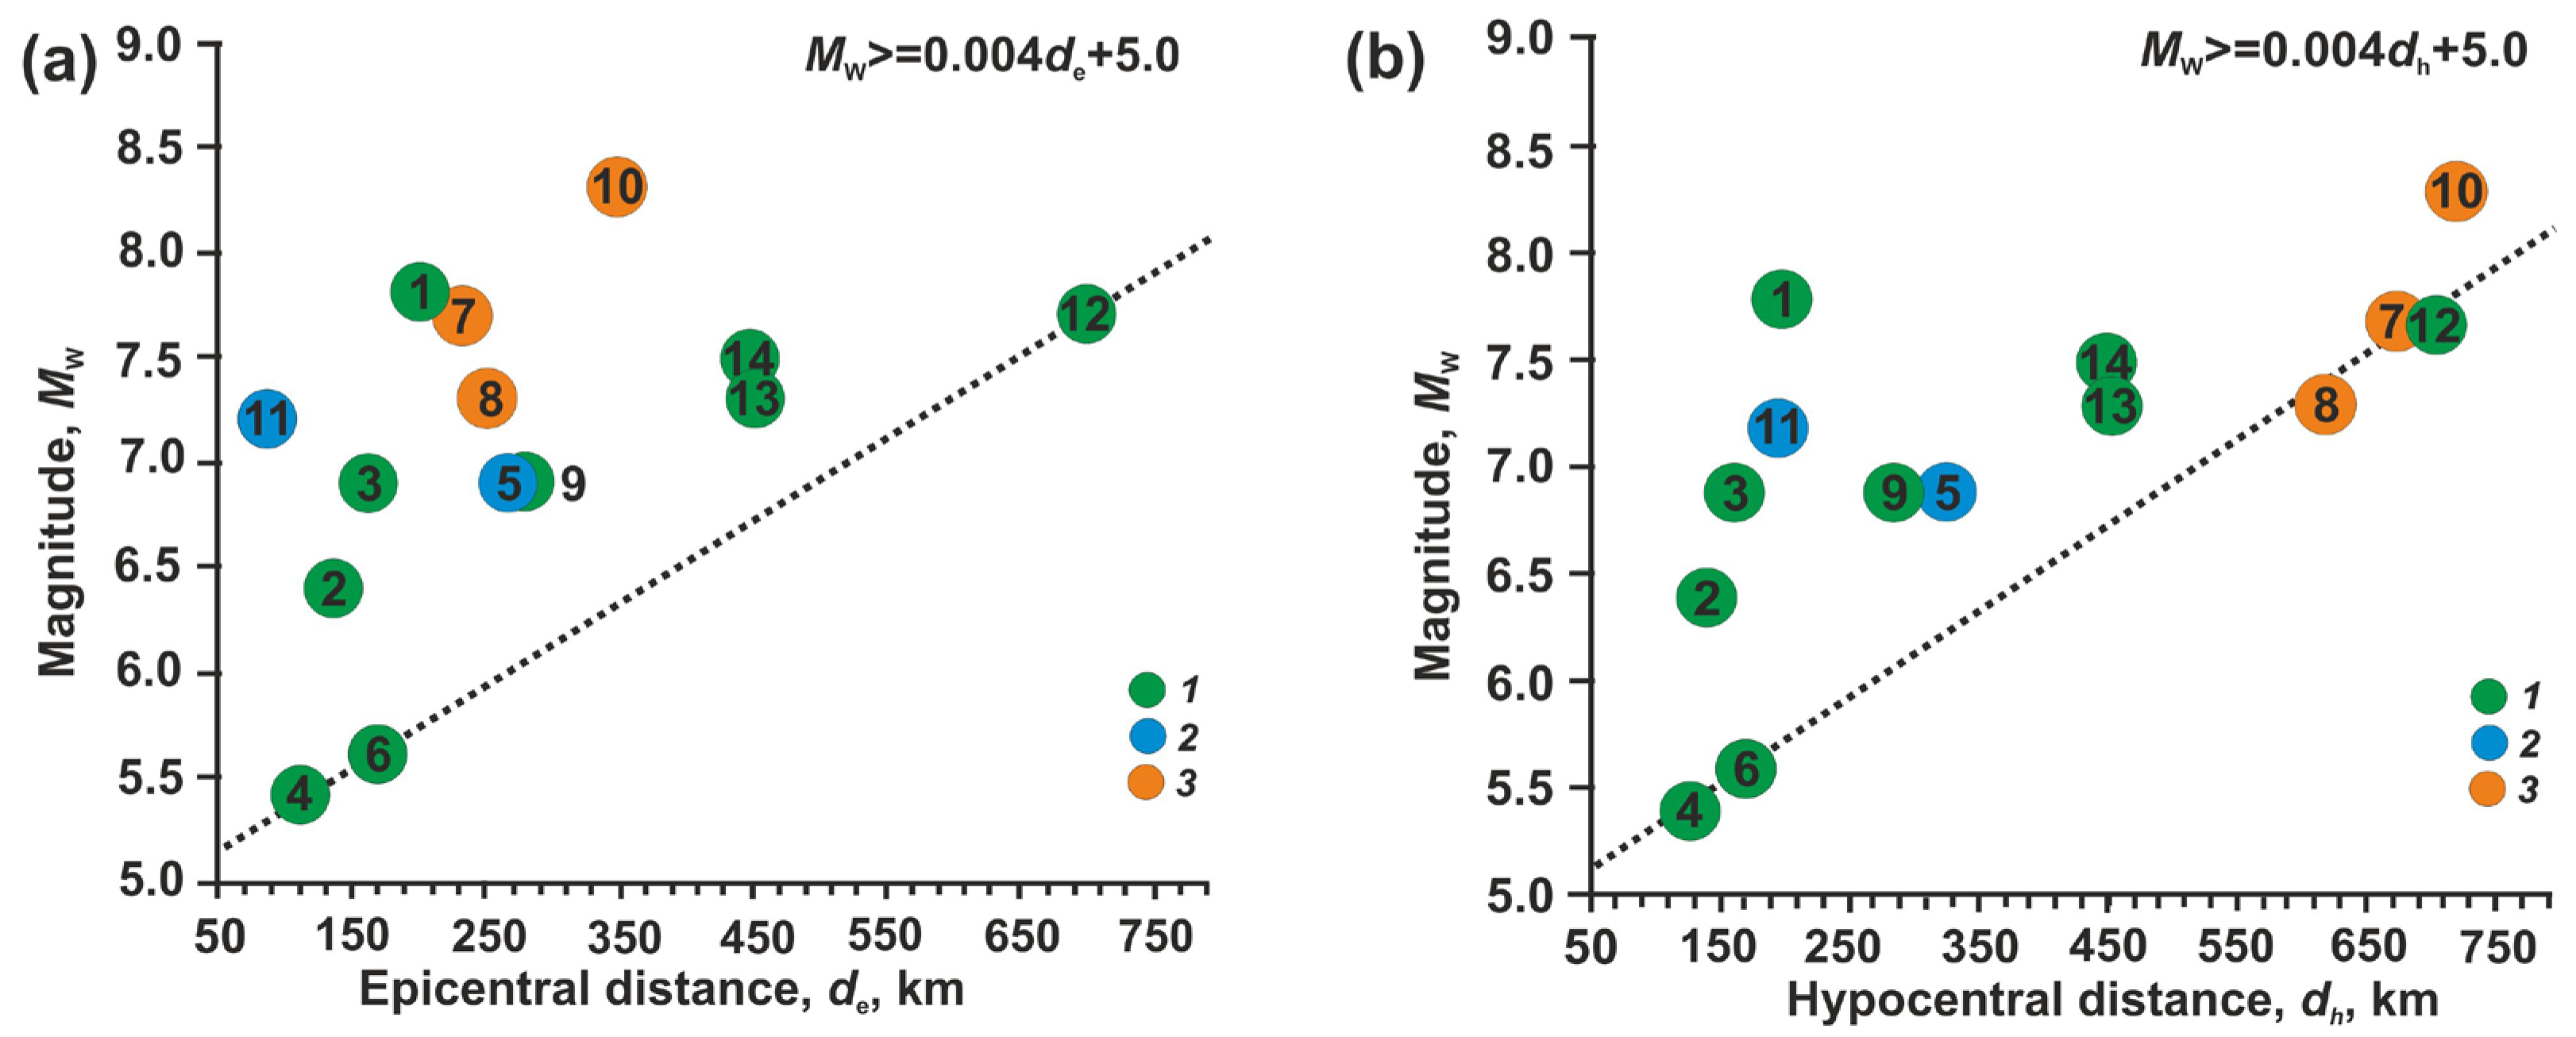
Let us consider the dependence of the CSEs in groundwater pressure changes on the ratio of magnitude and distance of the earthquakes (Table 3). The distribution of the earthquakes as a function of magnitude Mw and epicentral (de) and hypocentral (dh) distances to the well is shown in Figure 10. The manifestation of CSEs in water pressure in well YuZ-5 during earthquakes with parameters Mw, de and dh is described by the same dependencies Mw ≥ 0.004de + 5.0 and Mw ≥ 0.004dh + 5.0. Such dependencies characterize, in the first approximation, the sensitivity of the observation well YuZ-5 with respect to the coseismic volumetric deformation during local earthquakes with magnitudes Mw = 5.4–8.3 at epicentral distances from 80 to 700 km in a depth range from a few kilometers to approximately 600 km. These dependencies may be updated as new CSE data become available.
For well YuZ-5, tidal sensitivity of water level/pressure variations is Av = 0.161 cm(hPa)/10−9 (Table 5). Therefore, in the cases of CSE manifestations in water pressure changes, the value of coseismic volumetric deformation in the well area can be at least the first units of 10−9. Sign of volumetric strain can be determined from direction of change in groundwater level/pressure. Such information can be useful in verifying data on the mechanisms of earthquake sources and in other problems of modern geodynamics.
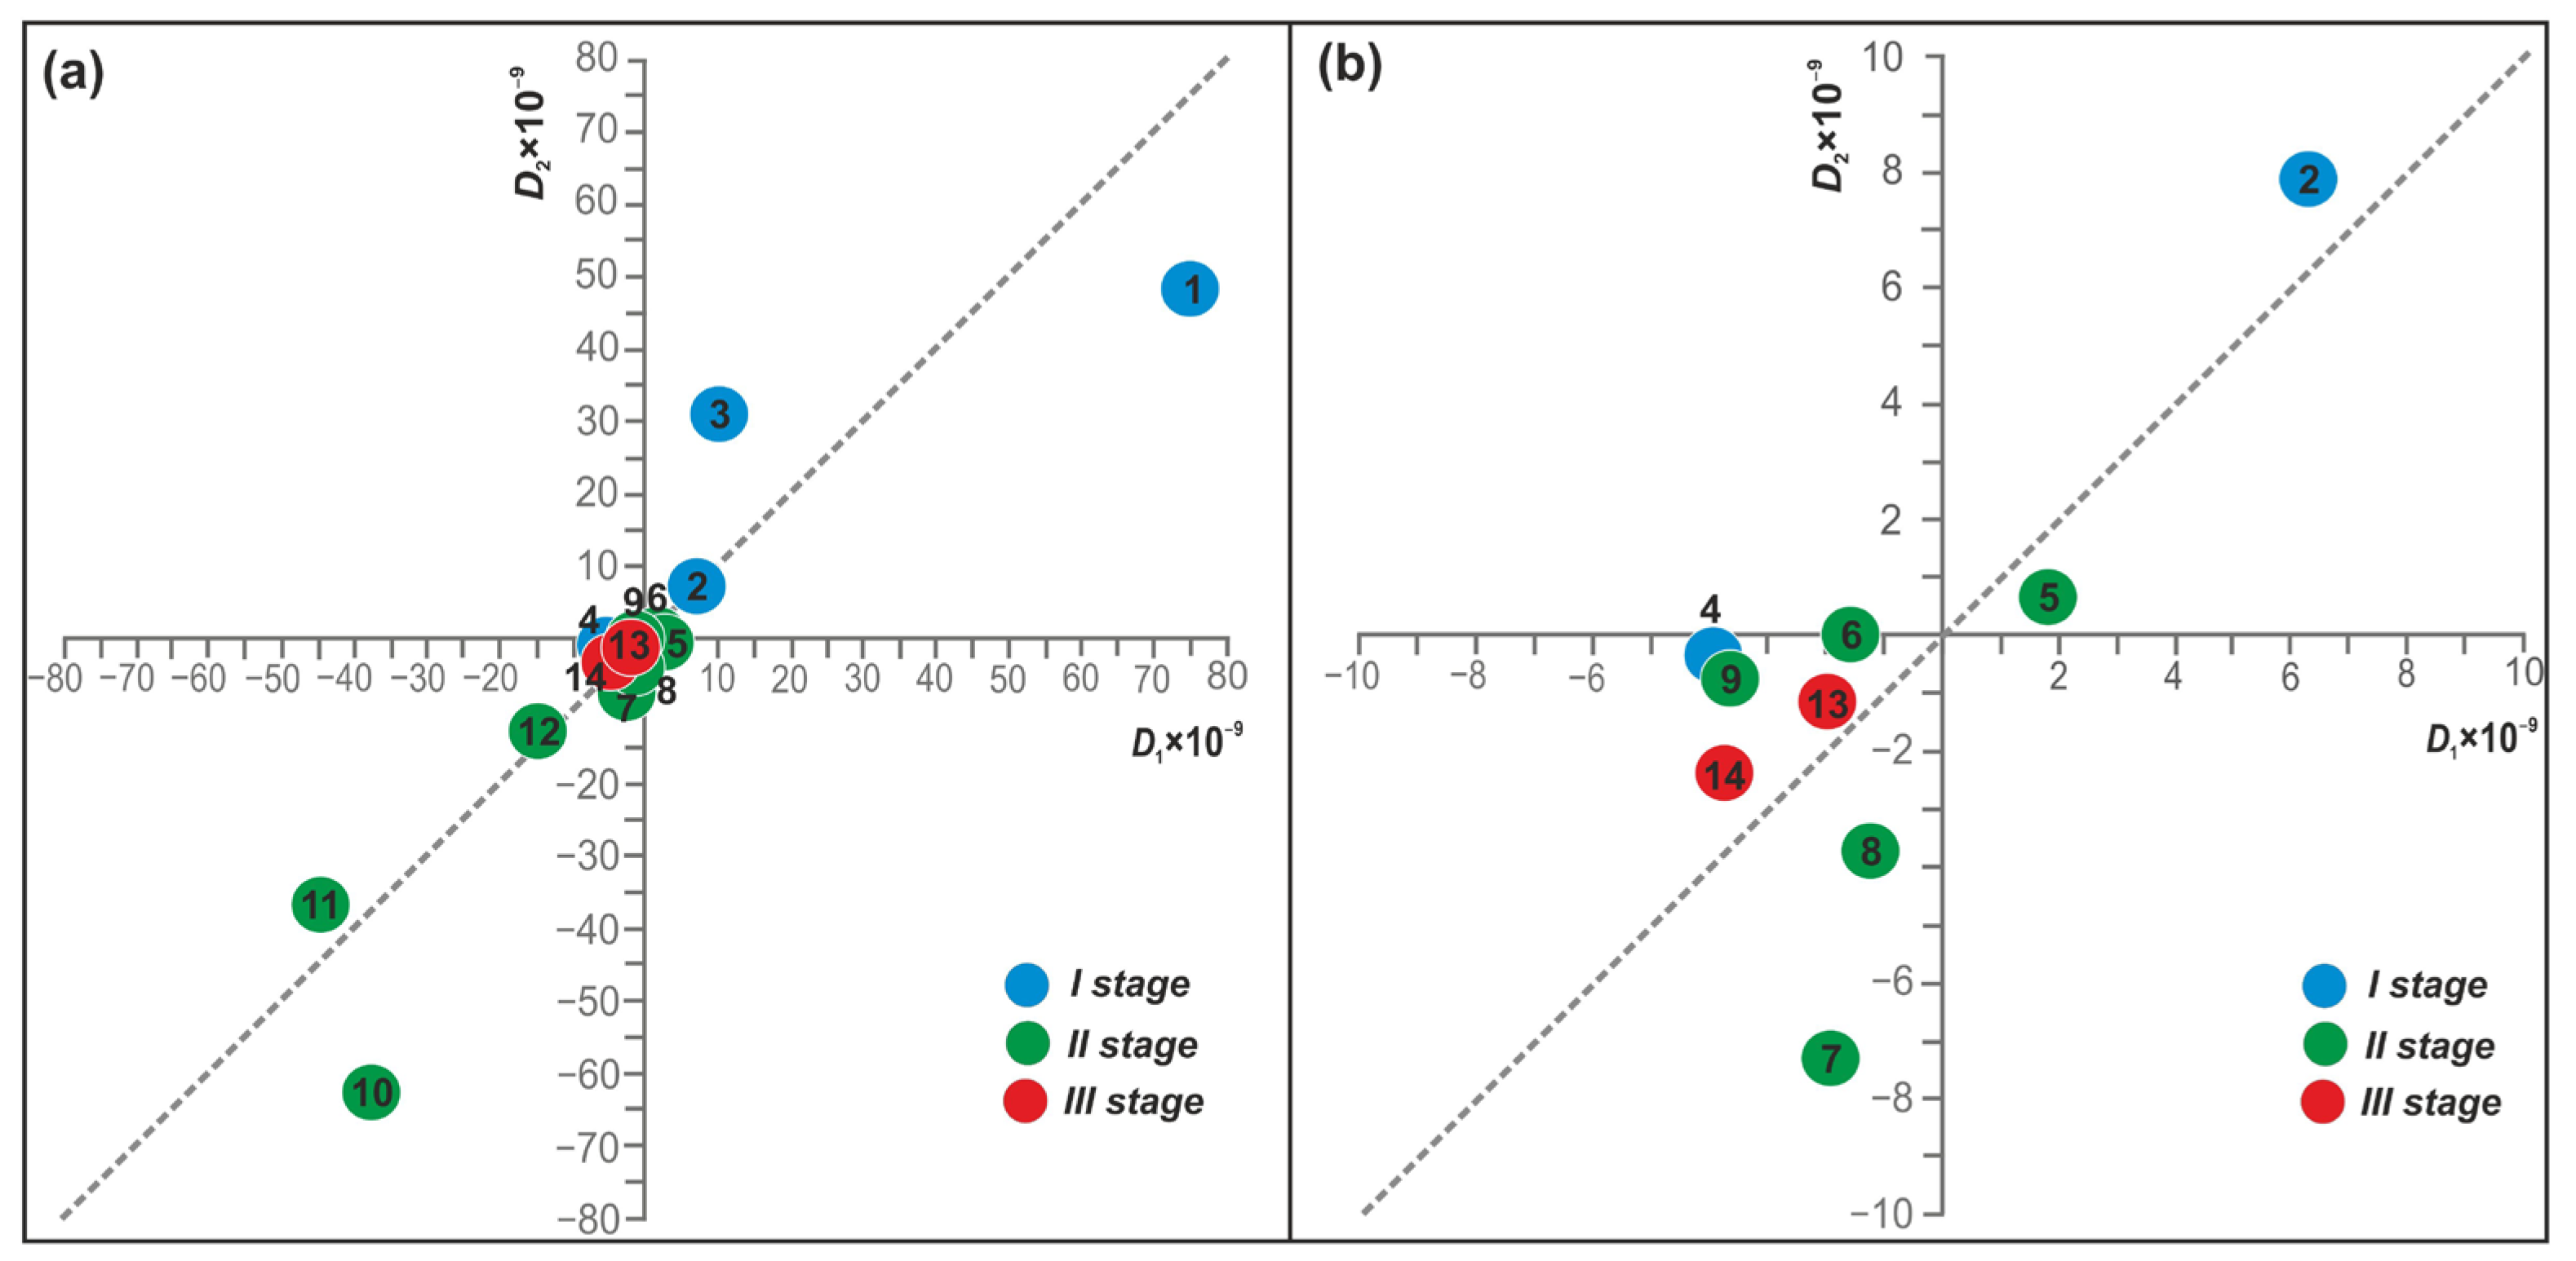
The ratio of D1 and D2 values (Table 3) is shown in Figure 11. As can be seen, there is uniform distribution of points obtained by two methods relative to the middle line, which characterizes the direct relationship between D1 and D2. No regular displacement of points relative to each other is observed, which indicates the absence of a systematic error in determining coseismic deformation by both methods within the same order of magnitude. Therefore, it can be assumed that the existing divergences in D1 and D2 values are due to errors in estimating coseismic volumetric deformation inherent in both methods [16].

3.4. Hydrogeodynamic Effects of Seismic Waves

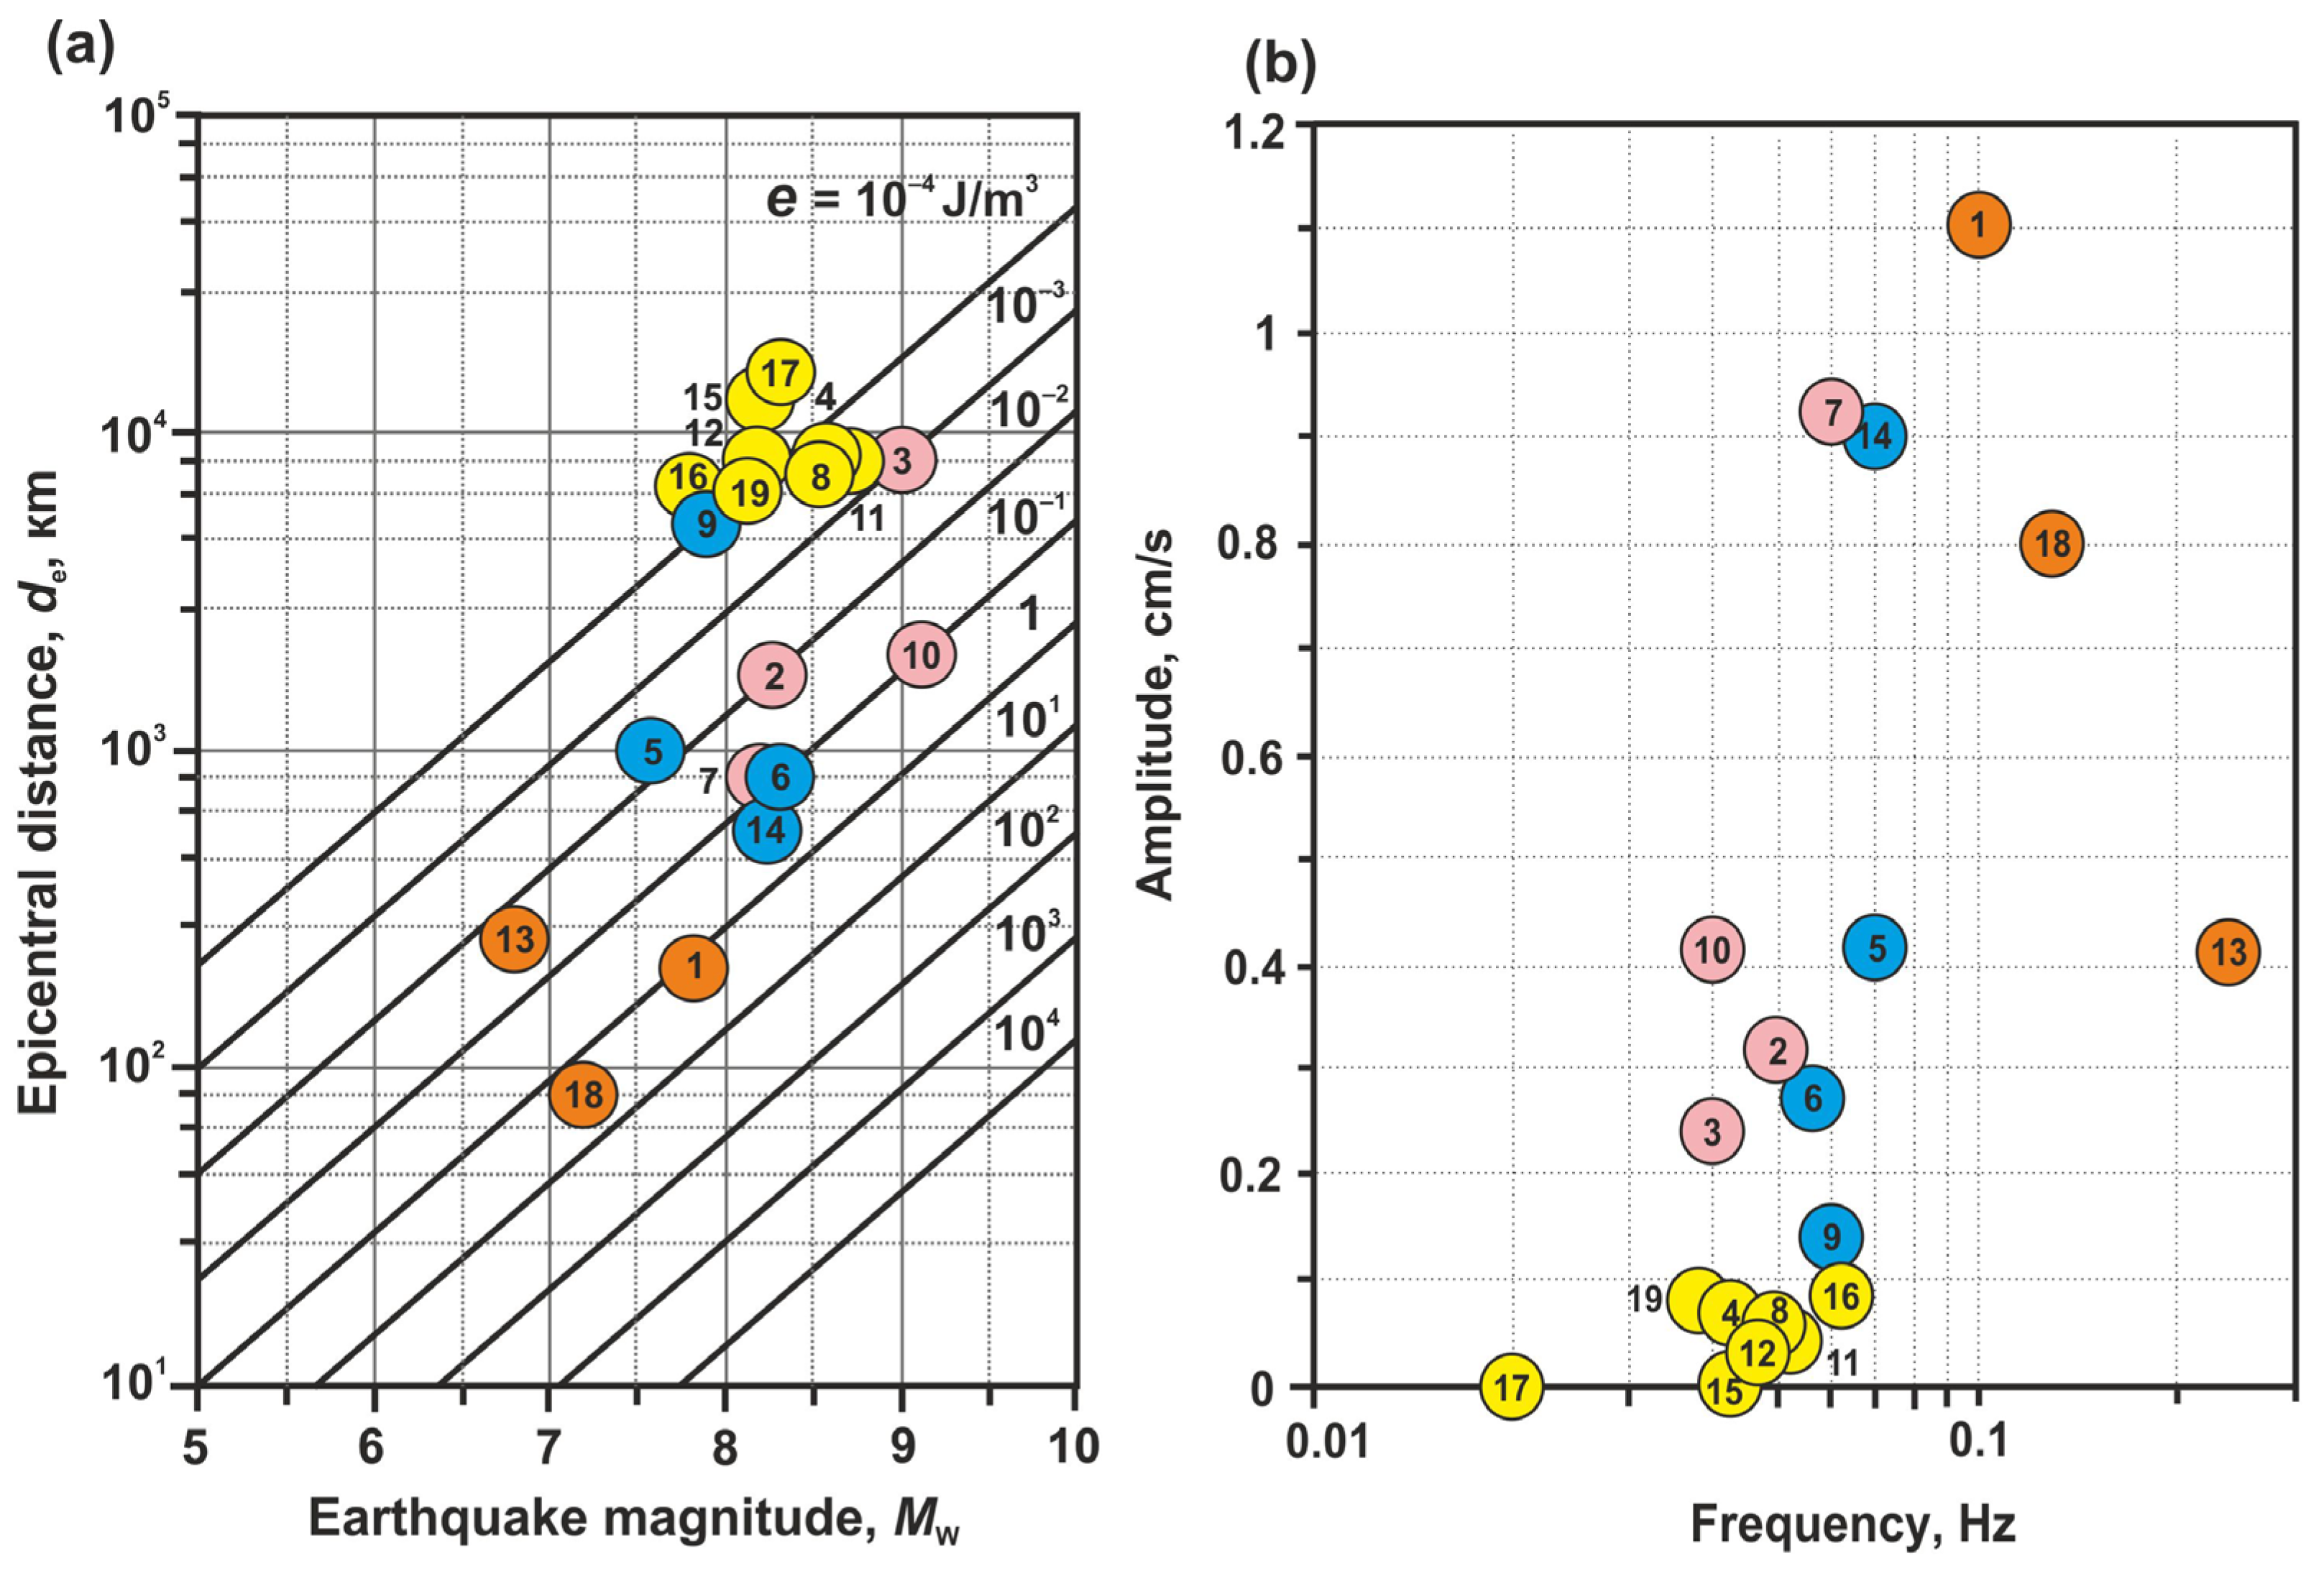
Various effects of seismic waves in the water level changes in well YuZ-5 were considered in [18]. On the example of 19 earthquakes with Mw = 6.8–9.1, de = 80–14,600 km (Figure 12), four types of hydrogeoseismic water level variations (HGSVs) with amplitudes ≥0.4 cm were distinguished by morphological features and duration:
—Type I—forced and free oscillations during the time from hours to about one day (highlighted in Figure 12 in yellow);
—Type II—oscillations with the imposition of water level increases during minutes–hours–first days (pink color);
—Type III—short-term water level increases over time from hours to first days (blue color);
—Type IV—long-term (1.5–3 months) water level lowering (orange color).
The dependence of type I–IV HGSV manifestation on the intensity of seismic impact in the area of the well was considered. The ratio of EQ magnitudes Mw and epicentral distances to the well de, as well as the calculated values of specific seismic energy density e, J/m3 [62], were used as parameters for the intensity of seismic wave impact in the well area. The amplitudes and frequency bands of the maximum phases of ground movements were also estimated from three-component broadband earthquake records by the STS-1 sensor at PET seismic station.
In the seismic records of the earthquakes accompanied by type I–III HGSVs, intense manifestations of surface waves were recorded. In the records of local earthquakes Nos. 1, 9 and 11 (Table 3), accompanied by type IV HGSVs, mainly P and S body waves were manifested.
In Figure 13a, the dependence of type I–IV HGSVs on the EQ parameters Mw, de and the specific seismic energy density e calculated from the formula lgde = 0.48 Mw − 0.33 lge − 1.4 [1,62] is demonstrated. Figure 13b shows the distribution of type I–IV HGSVs depending on the values of the maximum amplitude of velocity and central frequency of its manifestation according to seismic records.
The distribution of type I–IV HGSVs shows obvious dependence of their manifestations on earthquake parameters Mw, de, e (Figure 13a) and the amplitude-frequency composition of the maximum phases of ground movements according to the seismic records at the nearest seismic station (Figure 13b). Low-frequency and low-amplitude surface waves from distant earthquakes were accompanied by water level oscillations (type I HGSVs). With the increase in the amplitude of seismic signal, short-term water level increases were superimposed on oscillations (type II HGSVs). Relatively high-frequency signals of surface waves were accompanied by short-term water level rises (type III HGSVs). In the cases of the strongest local earthquakes Nos. 1, 9, 11 (Table 3) accompanied by the passage of body waves and perceptible shaking with the intensity of Imsk-64 = 5–6 points, the decreases in the water level occurred during 1–3 months (type IV HGSVs).
At stage III, when local earthquakes with magnitudes of 5.0–5.5 occurred at distances of 100–200 km, water pressure oscillations corresponding to the arrivals of P and S waves were distinguished in high-frequency pressure records. In the cases of EQs Nos. 13 and 14 with magnitudes 7.3 and 7.5 at the epicentral distances of about 450 km (Table 3), L-wave appeared in seismic records at the PET station (Figure 9). During these earthquakes, L-waves and small coseismic displacements with amplitudes of 0.26 and 0.56 hPa were revealed in the water pressure records. During the passage of surface waves from strong earthquakes thousands of kilometers away from the well, water level oscillations observed were corresponding to type I HGSVs.
Continuation of high-frequency, 20 Hz, registration of water pressure in well YuZ-5 and accumulation of new data on responses to seismic waves in a wide range of EQ magnitudes and distances will make it possible to refine the considered typification of HGSVs.
As shown in [18], manifestations of type I–IV HGSVs were initiated by various hydrogeodynamic processes in the “well–aquifer” system depending on the intensity of seismic impact. These processes include the following:
—The amplification of groundwater pressure variations in wellbore at a resonant frequency of 0.023 Hz [33], manifested in level oscillations with amplitudes exceeding the amplitudes of vertical displacements of the Earth’s surface during the passage of surface waves (type I HGSVs);
—An impulse increase in groundwater pressure and non-linear filtration near the wellbore (type III HGSVs);
—The occurrence of a pressure downgrade source (or several sources) in the CA during intense seismic shaking at distances up to a few hundreds of meters from the well, possibly due to permeability improvement of water-bearing rocks (type IV HGSVs).
On the example of well YuZ-5, simultaneous development was discovered indicating hydrogeodynamic processes in the “well–aquifer” system with the formation of complex morphological types of HGSVs. In particular, such an example is the HGSVs of type II, which manifest in the oscillations against the background of a short-term increase in the water level under the impact of seismic waves from the earthquakes with Mw = 8.2–8.3 at distances of 810–1670 km (Figure 12).

4. Discussion

4.1. Natural Components of Groundwater Pressure Variations

The data of long-term water level/pressure observations make it possible to study the influences of natural processes on the hydrogeodynamic regime of the observation well and to identify the corresponding components in the behavior of the obtained time series. In the groundwater pressure changes in well YuZ-5, several such components with different durations and properties were found (Figure 3):
(1)
Weakly expressed trends of a decrease and increase in water pressure within 2–4 years at a rate of no more than a few cm per year;
(2)
Annual (seasonal) water pressure variations with amplitudes of ≈45–55 cm of the water column (Figure 5b);
(3)
Increases in water pressure with amplitudes of 1–2 cm during the first days after heavy (≥15–20 mm/day) precipitation;
(4)
Regular water level/pressure responses to barometric and tidal influences.
Trends with duration of years and seasonal groundwater pressure variations represent the low frequency components of the hydrostatic head changes in the confined aquifer in the well area. Seasonal pressure variations in the well are mainly due to the elastic transfer of the changing pressure of the water column height in the groundwater supply and runoff areas during the year. General regularities of a seasonal pressure change in the well are described by its seasonal function estimated over a long period (Figure 5b). The deviation of seasonal pressure values in individual years from the average seasonal head change function (Figure 3) is due to groundwater uneven infiltration replenishment over the years, as well as the imposition of long-term postseismic depressions and subsequent pressure recovery on seasonal water pressure changes in well YuZ-5, as in the cases of the Kronotsky EQ of 5 December 1997 (No. 1 in Figure 3) and Zhupanovsky EQ of 30 January 2016 (No. 9). Such deviations of seasonal water pressure values from the average seasonal head change function can reach 5–20 cm of the water column (Figure 3).
Based on the data of the 25-year series of observations in well YuZ-5, establishing the causes and regularities of long-term water pressure trends is not possible. This is the task of further research aimed at determining the relationship of such trends in groundwater pressure changes with the features of recharge and discharge of the confined aquifer as well as the influence of cosmic factors, seismicity and volcanic activity. At the same time, insignificant values of trend rates make it possible to neglect their influence when identifying long-term HGSVs and estimating their amplitudes and durations.
Tidal and barometric responses of water level/pressure in a range of periods from the first few hours to the first tens of days, as well as short-term pressure increases due to surface load during heavy precipitation, represent relatively short-term water pressure variations in well YuZ-5 reflecting the static confined behavior of the “well–aquifer” system when the stressed state of the water-bearing rocks changes. The consideration of frequency dependence of the water level barometric response (Figure 4b) in a wide range of hourly and daily periods allows us to apply the hypothesis on the static confined conditions in the “well–aquifer” system and the quasi-elastic response of groundwater pressure in well YuZ-5 to the seismic and tidal exposures in a range of pressure variations from hours to days, the first tens of days. Variations in groundwater pressure with periods of more than the first tens of days should be considered taking into account the patterns of the seasonal pressure change in the well.
Elastic parameters of water-bearing rocks (Table 5) were estimated with the use of barometric efficiency value Eb = −0.4 cm/hPa for water level variations in a range of periods from 6 h to days and average water level tidal sensitivity for semidiurnal and diurnal groups of tidal waves Av = 0.161 cm/10−9. For such conditions, according to distinguished amplitudes of groundwater pressure changes in well YuZ-5 before earthquakes or at coseismic stage, one can make an approximate estimate of volumetric deformation values in the area of the well.

4.2. Typification of Seismo-Hydrogeodynamic Effects

In water pressure variations in well YuZ-5, several types of SHGEs were identified in connection with local (Table 3) and teleseismic earthquakes (Figure 12):
—The supposed hydrogeodynamic precursors (2 cases);
—The coseismic effects of a decrease (4 cases) and increase (10 cases) in the water level/pressure with amplitudes of 0.2–12 cm (Table 3) within seconds–minutes after the EQ time;
—Four types of hydrogeoseismic variations in the water level/pressure changes caused by the passage of seismic waves—types I–IV HGSVs according to [18].

4.2.1. Supposed Hydrogeodynamic Precursors

The supposed hydrogeodynamic precursors of the EQs of 5 December 1997 (Figure 6) and 30 January 2016 (Figure 7) manifested themselves in anomalous changes in the water level in relation to the average seasonal behavior of the head in the well during the time intervals approximately corresponding to the upper limit of the static confined conditions in the considered “well–aquifer” system. In the case of the KE, the preceding water level decrease was 11 cm for ≈ 20 days (Figure 6b, bottom graph). In the case of the ZhE, the preceding water level rise for ≈ 90 days was approximately 30 cm (Figure 7a,c).
Both the KE and ZhE were the strongest and least distant seismic events from the well during the entire observation period. Before these earthquakes, precursors in seismicity as foreshocks, in movements of the GPS stations, in the groundwater chemical composition and others were recorded.
At the same time, according to the data of observations at Pionerskaya meteorological station, both before the KE and before the ZhE, the anomalously high amounts of precipitation were recorded during powerful cyclones in October. The abundant liquid precipitation in October, its infiltration and a groundwater pressure increase in the recharge area, as well as the additional load on the confined aquifer in the well area, could cause the water pressure increase in well YuZ-5 in October-November of 1997 and 2015. This mechanism of pressure increase in well YuZ-5 can also explain the deviations in water pressure changes in October-November of 1997 and 2015, compared to the behavior of the average head change function estimated for 2004–2017.
If, nevertheless, the procedure used for estimating the anomalous water pressure changes before the KE and ZhE determines their amplitudes more or less correctly, then the corresponding amplitudes of quasi-elastic deformation in the well area according to (3) could be at the preparation stage of the KE DKE = 11 cm/0.161 cm/10−9 = 68 × 10−9 ≈ 0.7 × 10⁻⁷ (expansion) and at the preparation stage of the ZhE DZhE = −30 cm/0.161 cm/10−9 = −186.3 × 10⁻⁹ ≈ −1.9 × 10⁻⁷ (compression). The obtained values of deformation in the well area during preparation of two earthquakes are very approximate due to uncertainty of mechanism of observed water pressure anomalies and imperfections of procedure used for estimating their amplitudes and durations.

4.2.2. Coseismic Effects

The identification of coseismic effects in water level/pressure changes and estimates of their parameters (Table 3) were obtained under various technical conditions of observations in well YuZ-5 in stages I–III (Table 2).
At stage I, coseismic effects with amplitudes of up to 12 cm appeared in the 10-minute water level records during earthquakes Nos. 1–4 (Table 3, Figure 1a) in the form of distinct “steps”. Examples of such “steps” are shown in Figure 6c and in ([16], Figure 1b).
At stage II (EQs Nos. 5–12), with the 5 min registration of the water level, the “steps” in the water level changes were also clearly distinguished after the arrival of seismic waves during the 5-minute interval. For two events, No. 9 (Figure 7b) and No. 12 (Figure 8b), the distortion of coseismic pressure changes by a simultaneous influx of water into the well during nonlinear filtration near the wellbore was found, which was taken into account by applying the decaying exponential function (2) [45] and fitting the observed data to the theoretical dependence. In these cases, it was assumed that the duration of the CSE development was no more than 5 min after the arrival of seismic waves.
At stage III, during the measurements of water pressure with a frequency of 20 Hz, earthquakes Nos. 13 and 14 occurred, which were accompanied by weak coseismic water pressure changes during ≈20–30 s against the background of a noisy recorded signal by transverse S-waves with amplitudes exceeding the amplitudes of coseismic effects (Figure 9). Using differences between the averaged pressure variations during the manifestation of P-waves and pressure variations after the arrival of L-waves, amplitudes of coseismic water pressure changes were obtained, which approximately correspond to their theoretical estimates.
Despite the difference in technical conditions for recording water level/pressure in well YuZ-5 at stages I–III, estimates of amplitudes and signs in the coseismic reaction of groundwater pressure consistent with the theoretical estimates of amplitudes (within the same order of magnitude) and signs in static volumetric strain were obtained at a depth of 500 m, corresponding to the middle part of the open wellbore (Table 3).
The used method of normalizing the coseismic amplitudes of water level/pressure changes by tidal sensitivity Av, estimated in a range of diurnal and semidiurnal tidal waves, demonstrates the acceptability of such approach for estimating the volumetric coseismic deformation in the well area.
As follows from the distribution of D1 and D2 values (Figure 11), both methods for estimating the volumetric coseismic deformation in the well area do not give systematic deviations in the range of values of unity, tens of 10−9, and some difference in their values is determined by estimation errors inherent in both methods [16].
During stage III, a seismic quietness took place in the observation area, and earthquakes similar to seismic events Nos. 1, 9 at which the amplitudes of coseismic fluctuations were 12 and 7 cm, did not occur. Therefore, it is necessary to continue high-frequency water pressure measurements in well YuZ-5 in order to trace in detail the development of pressure responses during strong nearby earthquakes.

4.3. Identified Types of SHGEs and Earthquake Parameters

The study of regularities in the manifestations of various types of SHGEs depending on the earthquake parameters—the magnitudes and distances from the observation well, as well as the seismic impact in the observation areas—is not only of scientific, but also of practical importance when conducting geophysical monitoring in regions prone to earthquakes. The evaluation of such relationships makes it possible to consider the spatial and temporal scales of various forms of seismic impact on groundwater as well as to use such information when predicting strong earthquakes and their consequences.
The distribution of distinguished types of SHGEs as a function of magnitude and epicentral distance of the earthquakes, as well as the calculated value of specific seismic energy density e in the area of well YuZ-5, is shown in Figure 14. Figure 14 also shows the values of one (1L), five (5L) and ten (10L) maximum linear sizes of earthquake sources in km, which were calculated using the formula lgL = 0.440Mw − 1.289 [32].
Such representation of various types of seismo-hydrogeodynamic effects in groundwater pressure changes according to precision long-term observations in the well allows us to display in a compact form the relationship between the recorded seismo-hydrogeological effects and the energy and spatial characteristics of seismic events that cause such effects and also to estimate the remoteness of the observation well from the earthquake source by the de/L ratio.
Using the data in Figure 14, Table 3 and Figure 12, it is possible to give a meaningful description of individual types of SHGEs in the water pressure changes in well YuZ-5, taking into account a set of energy and spatial parameters of earthquakes accompanied by such seismo-hydrogeodynamic effects. For example, the supposed hydrogeological precursors (HPs) appeared in well YuZ-5 during earthquakes with magnitudes Mw = 7.2–7.8 (L = 76–139 km) at epicentral distances de = 86–200 km (de/L = 1–3). The intensity of the seismic impact in the area of the observation well during the occurrence of such earthquakes was IMSK-64 = 5–6 points at values of e = 0.4–4 J/m3.
Similar descriptions of coseismic effects (CSEs) or I–IV types of hydrogeoseismic variations (HGSVs) and earthquake parameters can also be made. Having such a description of seismo-hydrogeodynamic effects for individual observation wells, characterized by the individual sets of technical and hydrogeological properties and the features of barometric and tidal groundwater responses, it will be possible to consider a difficult question about the diversity of groundwater level/pressure responses to seismic events.

5. Conclusions

1. This article presents a unique experience of 25 years in the precision recording of water pressure variations in deep well YuZ-5 located in the seismically active region of the Kamchatka Peninsula with frequent strong subduction earthquakes. The well is connected with a confined aquifer in metamorphosed rocks at depths of 310–800 m. The natural hydrogeodynamic state of the confined aquifer is not disturbed by technogenic impacts.
When the local earthquakes with magnitudes Mw = 6.2–8.3 occurred, the well was located at a relatively small distance from their sources. Location of the well in relation to these earthquakes is characterized by the ratio of the epicentral distance and the maximum linear size of the source de/L = 1–5 (Figure 14). During these earthquakes, coseismic effects were recorded in the groundwater pressure increase or decrease with amplitudes from 0.2 to 12 cm for a short time—from tens of seconds to 12 min. Using the water level tidal sensitivity in relation to the theoretical tidal volumetric deformation Av (Table 5) and the amplitudes of pressure changes Δh, values (1.2–75) × 10−9 and signs (compression or expansion) of coseismic deformation in the well area during these earthquakes were estimated. The estimates of coseismic strain obtained from the well observations are in satisfactory agreement with the theoretical amplitudes and signs of strain in the well area based on the dislocation model [30] with the parameters of earthquake source mechanisms from the Global CMT catalog (Table 3, Figure 11).
The ratio of magnitudes and epicentral (de) and hypocentral distances (dh) of the earthquakes accompanied by coseismic fluctuations in water pressure in well YuZ-5 is described by the same dependence Mw ≥ 0.004de + 5.0 (Mw ≥ 0.004dh + 5.0).
Before the most powerful earthquakes—Kronotsky, Mw = 7.8 (No. 1 in Figure 1a, Table 3), and Zhupanovsky, Mw = 7.2 (No. 9)—the anomalous water pressure changes were observed over tens of days (Figure 5 and Figure 6) in comparison with the behavior of the seasonal head change function. In the cases of both earthquakes, the values de/L = 3.7 and 1.0 are the minimums of all considered local earthquakes, and they were preceded by the manifestations of precursors in the water level changes in well E-1 located near well YuZ-5 as well as in the changes in the chemical composition of water from deep self-flowing wells.
The anomalous water pressure changes in well YuZ-5 before these earthquakes were identified as the supposed (hypothetical) hydrogeodynamic precursors due to the possible influence of heavy precipitation in the autumn period of cyclonic activity. Abnormally high amounts of precipitation could cause the increase in water pressure in the observation well due to the increase in the water table in the regional recharge area as well as the additional surface load in the well area.
In well YuZ-5, in addition to two cases of supposed hydrogeodynamic precursors and 14 cases of coseismic effects during local earthquakes, four types of hydrogeoseismic water level variations were found that were influenced by the seismic waves during local and teleseismic earthquakes in magnitude range Mw = 6.8–9.1 at distances of 80–14,600 km (type I–IV HGSVs) (Figure 12). The dependence of their manifestation on the ratio of the magnitude and distance of the earthquakes and the amplitude-frequency composition of the maximum phases of the Earth’s surface movements according to the records of the earthquakes at the nearest seismic station is established.
The example of the well under consideration showed the generation of various hydrogeodynamic processes depending on the intensity of the seismic impact and amplitude-frequency composition of seismic waves in the well area during the earthquakes. The impact of seismic waves, depending on their characteristics, can be accompanied by (1) the amplification of dynamic water pressure variations in the wellbore at a resonant frequency of the well, (2) a short-term increase in pressure near the wellbore during nonlinear filtration in the water-bearing rocks, (3) the development of a non-stationary drawdown due to the occurrence of pressure drop sources during strong shaking.
2. Using well YuZ-5 as an example, a new methodological approach to the identification, study, typification and presentation of seismo-hydrogeological effects on the changes in the groundwater parameters in individual wells based on the long-term observations is demonstrated. It is shown that the effect of seismicity on the groundwater pressure variations in the well in a seismically active region can manifest itself at different time intervals—from seconds or a few minutes to days to thousands of days.
When identifying relatively long-term seismo-hydrogeodynamic effects in water pressure changes lasting tens of days or months, it is necessary to take into account the possibility of superimposing the natural long-term elements of the well regime, first of all, the general seasonal patterns of the groundwater hydrostatic head in the well area (Figure 5b).
An equally important element of the method for processing and analyzing water level/pressure observations in open piezometric wells is a detailed study of the tidal and barometric responses in a wide range of periods, providing the assessment of deformation properties of the observed “well–aquifer” system as well as broadening the options of using well observation data in various studies of seismo-hydrogeodynamic effects in the framework of conceptual models.
The presentation of various types of seismo-hydrogeodynamic effects in a well in the form shown in Figure 14 makes it possible to provide their compact description using a set of quantitative parameters of earthquakes in the observation area. This is convenient for describing the manifestation of various types of SHGEs in individual wells and comparing such information with that of other wells with different structures and local hydrogeological and seismic conditions.
3. The presented methodological approach for obtaining and analyzing the precision data of observation wells will contribute to solving the issue of the diversity of seismo-hydrogeological effects in various wells and to the research of the seismic influence on the fluid-saturated environment of seismically active regions as well as to earthquake forecasting. Since 2002, the authors, in collaboration with the Kamchatka branch of the Russian Expert Council for Earthquake Prediction (KB REC), have been conducting an experiment on the use of hydrogeodynamic precursors in the water level changes in wells E-1 and YuZ-5 to predict earthquakes in real time by compiling weekly conclusions about the presence/absence of hydrogeodynamic precursors based on current observational data [17,37]. According to the conclusions of the KB REC in 2002–2016, the place, magnitude and time of six earthquakes with M = 5.3–7.2 were successfully predicted using current observations in well E-1 [17]. Before the earthquake of 16 March 2021, Mw = 6.6, de = 350 km, a hydrogeodynamic precursor was also detected in real time in the water pressure changes in well E-1 [27].

Author Contributions

G.K. and S.B. have made a substantial, direct and intellectual contribution to the work. All authors have read and agreed to the published version of the manuscript.

Funding

The work was supported by Ministry of Science and Higher Education of the Russian Federation (075-01271-23). The data used in the work were obtained with large-scale research facilities “Seismic infrasound array for monitoring Arctic cryolitozone and continuous seismic monitoring of the Russian Federation, neighbouring territories and the world” (https://ckp-rf.ru/usu/507436/; http://www.gsras.ru/unu/ (accessed on 20 January 2023)).

Data Availability Statement

The original contributions presented in this study are included in the article; further inquiries can be directed to the corresponding author.

Conflicts of Interest

The authors declare that this research was conducted in the absence of any commercial or financial relationships that could be construed as a potential conflict of interest.

References

  1. Wang, C.-Y.; Manga, M. Earthquakes and Water. Lecture Notes in Earth Sciences; Springer: Berlin, Germany, 2010; p. 225. [Google Scholar] [CrossRef] [Green Version]
  2. Wang, C.-Y.; Manga, M. Water and Earthquakes. Lecture Notes in Earth System Sciences; Springer: Cham, Switzerland, 2021; p. 387. [Google Scholar] [CrossRef]
  3. Chia, Y.; Chiu, J.-J.; Chiang, Y.-H.; Lee, T.-P.; Wu, Y.-M.; Horng, M.-J. Implications of coseismic groundwater level changes observed at multiple-well monitoring stations. Geophys. J. Int. 2008, 172, 293–301. [Google Scholar] [CrossRef] [Green Version]
  4. Shi, Z.; Wang, G.; Liu, C. Co-seismic groundwater level changes induced by the 12 May 2008 Wenchuan earthquake in the near field. Pure Appl. Geophys. 2013, 170, 1773–1783. [Google Scholar] [CrossRef]
  5. Shi, Z.; Wang, G.; Manga, M.; Wang, C.-Y. Mechanism of co–seismic water level change following four great earthquakes—Insights from co-seismic responses throughout the Chinese mainland. Earth Planet. Sci. Lett. 2015, 430, 66–74. [Google Scholar] [CrossRef] [Green Version]
  6. Sun, X.; Wang, G.; Yang, X. Coseismic response of water level in Changping well, China, to the Mw 9.0 Tohoku earthquake. J. Hydrol. 2015, 531, 1028–1039. [Google Scholar] [CrossRef]
  7. Zhang, S.; Shi, Z.; Wang, G.; Zhang, Z. Quantitative Assessment of the Mechanisms of Earthquake–Induced Groundwater–Level Change in the MP Well, Three Gorges Area. Pure Appl. Geophys. 2018, 175, 2475–2484. [Google Scholar] [CrossRef]
  8. Kitagawa, Y.; Koizumi, N.; Takahashi, M.; Matsumoto, N.; Sato, T. Changes in groundwater levels or pressures associated with the 2004 earthquake off the west coast of northern Sumatra (M9.0). Earth Planets Space 2006, 58, 173–179. [Google Scholar] [CrossRef] [Green Version]
  9. Matsumoto, N.; Roeloffs, E.A. Hydrological response to earthquakes in the Haibara well, central Japan: II. Possible mechanism inferred from time–varying hydraulic properties. Geophys. J. Int. 2003, 155, 899–913. [Google Scholar] [CrossRef] [Green Version]
  10. Roeloffs, E.A.; Burford, S.S.; Riley, F.S.; Records, A.W. Hydrologic effects on water level changes associated with episodic fault creep near Parkfield, California. J. Geophys. Res. 1989, 94, 12387–12402. [Google Scholar] [CrossRef]
  11. Brodsky, E.E.; Roeloffs, E.; Woodcock, D.; Gall, I.; Manga, M.A. A Mechanism for sustained groundwater pressure changes induced by distant earthquakes. J. Geophys. Res. 2003, 108, 2390–2400. [Google Scholar] [CrossRef] [Green Version]
  12. Shalev, E.; Kurzon, I.; Doan, M.-L.; Lyakhovsky, V. Water–level oscillations caused by volumetric and deviatoric dynamic strains. Geophys. J. Int. 2016, 204, 841–851. [Google Scholar] [CrossRef]
  13. Shalev, E.; Kurzon, I.; Doan, M.-L.; Lyakhovsky, V. Sustained water-level changes caused by damage and compaction induced by teleseismic earthquakes. J. Geophys. Res. Solid Earth 2016, 121, 4943–4954. [Google Scholar] [CrossRef]
  14. Chelidze, T.; Melikadze, G.; Kobzev, G.; Shengelia, I.; Jorjiashvili, N.; Mepharidze, E. Hydrodynamic and seismic response to teleseismic waves of strong remote earthquakes in Caucasus. Acta Geophys. 2019, 67, 1–16. [Google Scholar] [CrossRef]
  15. Besedina, A.; Vinogradov, E.; Gorbunova, E.; Svintsov, I. Chilean earthquakes: Aquifer responses at the Russian platform. Pure Appl. Geophys. 2016, 173, 1039–1050. [Google Scholar] [CrossRef]
  16. Kopylova, G.N.; Steblov, G.M.; Boldina, S.V.; Sdel’nikova, I.A. The possibility of estimating the coseismic deformation from water level observations in wells. Izv. Phys. Solid Earth 2010, 46, 47–56. [Google Scholar] [CrossRef] [Green Version]
  17. Kopylova, G.N.; Boldina, S.V. Hydrogeological Earthquake Precursors: A Case Study from the Kamchatka Peninsula. Front. Earth Sci. 2020, 8, 576017. [Google Scholar] [CrossRef]
  18. Kopylova, G.N.; Boldina, S.V. Effects of Seismic Waves in Water Level Changes in a Well: Empirical Data and Models. Izv. Phys. Solid Earth 2020, 56, 530–549. [Google Scholar] [CrossRef]
  19. Van der Kamp, G.; Gale, L.E. Theory of Earth tide and barometric effects in porous formations with compressible grains. Water Resour. Res. 1983, 19, 538–544. [Google Scholar] [CrossRef]
  20. Wakita, H. Water wells as possible indicators of tectonic strain. Science 1975, 189, 553–555. [Google Scholar] [CrossRef]
  21. Aki, K.; Richards, P. Quantitative Seismology, Theory and Methods; Freeman: San Francisco, CA, USA, 1980; Volume I, p. 557. [Google Scholar]
  22. Sheymovich, V.S. Explanation to the State Geological Map of the Russian Federation. Scale 1:200,000. Series South Kamchatka; VSEGEI: Moscow, Russia, 2000; p. 302. (In Russian) [Google Scholar]
  23. Kiryukhin, A.; Lavrushin, V.; Kiryukhin, P.; Voronin, P. System of Koryaksky–Avachinsky Volcanoes (Kamchatka, Russia). Geofluids 2017, 2017, 4279652. [Google Scholar] [CrossRef] [Green Version]
  24. Taran, Y.; Ryabinin, G.; Pokrovsky, B.; Malik, N.; Cienfuegos, E. Methane–rich thermal and mineral waters of the Avachinsky Depression, Kamchatka. Appl. Geochem. 2022, 145, 105414. [Google Scholar] [CrossRef]
  25. Bagmet, A.L.; Bagmet, M.I.; Barabanov, V.L.; Grinevsky, A.O.; Kissin, I.G.; Malugin, V.A.; Rukavishnikova, T.A.; Savin, I.V. Study of the earth tides induced oscillations of the groundwater level in the “Obninsk” well. Izv. SSSR Phys. Earth 1989, 11, 84–95. (In Russian) [Google Scholar]
  26. Kopylova, G.N.; Boldina, S.V.; Smirnov, A.A.; Chubarova, E.G. Experience in Registration of Variations Caused by Strong Earthquakes in the Level and Physicochemical Parameters of Ground Waters in the Piezometric Wells: The Case of Kamchatka. Seism. Instrum. 2017, 53, 286–295. [Google Scholar] [CrossRef] [Green Version]
  27. Boldina, S.V.; Kopylova, G.N.; Kobzev, V.A. Study of Seismic Effects on Changes in Groundwater Pressure: Equipment and Some Well Observastion Results for the Kamchatka Peninsula. Geodyn. Tectonophys. 2022, 13, 0594. [Google Scholar] [CrossRef]
  28. Boldina, S.V.; Kopylova, G.N. Coseismic effects of the 2013 strong Kamchatka earthquakes in well YuZ-5. Bull. Kamchatka Reg. Assoc. “Educ.-Sci.” Cent. Earth Sci. 2016, 30, 66–76. (In Russian) [Google Scholar]
  29. Boldina, S.V.; Kopylova, G.N. Effects of the January 30, 2016, Mw = 7.2 Zhupanovsky earthquake on the water level variations in wells YuZ-5 and E-1 in Kamchatka. Geodyn. Tectonophys. 2017, 8, 863–880. [Google Scholar] [CrossRef] [Green Version]
  30. Okada, Y. Surface deformation due to shear and tensile faults in a half–space. Bull. Seismol. Soc. Am. 1985, 75, 1135–1154. [Google Scholar] [CrossRef]
  31. Igarashi, G.; Wakita, H. Tidal responses and earthquake–related changes in the water level of deep wells. J. Geophys. Res. 1991, 96, 4269–4278. [Google Scholar] [CrossRef]
  32. Riznichenko, Y.V. The source dimensions of the crustal earthquakes and the seismic moment. In Issledovaniya po Fizike Zemletryasenii (Studies in Earthquake Physics); Nauka: Moscow, Russia, 1976; pp. 9–27. (In Russian) [Google Scholar]
  33. Kopylova, G.N.; Boldina, S.V. The Response of Water Level in the YuZ-5 Well, Kamchatka to the Magnitude 9.3, Sumatra–Andaman Earthquake of December 26, 2004. J. Volcanol. Seismol. 2007, 1, 319–327. [Google Scholar] [CrossRef] [Green Version]
  34. Kopylova, G.N. Earthquake–induced Water Level Changes in the YuZ-5 Well Kamchatka. J. Volcanol. Seismol. 2006, 6, 52–64. (In Russian) [Google Scholar]
  35. Kopylova, G.N.; Boldina, S.V. The mechanism of the hydrogeodynamic precursor of the Mw = 7.8 Kronotsky earthquake of December 5, 1997. Russ. J. Pac. Geol. 2012, 5, 104–114. (In Russian) [Google Scholar]
  36. Gordeev, E.I.; Gusev, A.A.; Levin, V.E.; Bakhtiarov, V.F. Preliminary analysis of deformation at the Eurasia–Pacific–North America plate junction from GPS data. Geophys. J. Int. 2001, 147, 189–198. [Google Scholar] [CrossRef] [Green Version]
  37. Chebrov, V.N.; Droznin, D.V.; Kugaenko, Y.A.; Levina, V.I.; Senyukov, S.L.; Sergeev, V.A.; Shevchenko, Y.V.; Yashchuk, V.V. The system of detailed seismological observations in Kamchatka in 2011. J. Volcanol. Seismol. 2013, 7, 16–36. [Google Scholar] [CrossRef]
  38. Kopylova, G.N.; Lyubushin, A.A.; Boldina, S.V. Statistical Analysis of Precision Water Level Data from Observations in a Seismoactive Region: Case Study of the YuZ-5 Well, Kamchatka. Seism. Instrum. 2019, 55, 507–523. [Google Scholar] [CrossRef] [Green Version]
  39. Medvedev, S.V.; Sponheuer, W.; Kárník, V. Seismic Intensity Scale MSK-64; (In Russian). Akad. Nauk SSSR, Geofiz. Kom: Moscow, Russia, 1965; p. 11. [Google Scholar]
  40. Lyubushin, A.A. Multidimensional analysis of temporal series of geophysical monitoring 1993. Izv. Phys. Solid Earth 1993, 3, 103–118. (In Russian) [Google Scholar]
  41. Lyubushin, A.A. Geophysical Monitoring Systems Data Analysis; Nauka: Moscow, Russia, 2007; p. 228. (In Russian) [Google Scholar]
  42. Rojstaczer, S. Determination of fluid flows properties from the response of water levels in wells to atmospheric loading. Water Resour. Res. 1988, 24, 1927–1938. [Google Scholar] [CrossRef] [Green Version]
  43. Rojstaczer, S.; Agnew, D.S. The influence of formation material properties on the response of water levels in wells to Earth tides and atmospheric loading. J. Geophys. Res. 1989, 94, 12403–12411. [Google Scholar] [CrossRef] [Green Version]
  44. Boldina, S.V.; Kopylova, G.N. Possibility to estimate the elastic parameters of water-saturated rocks according to water-level observations in piezometric wells. Bull. Kamchatka Reg. Assoc. “Educ.-Sci.” Cent. Earth Sci. 2013, 22, 231–243. (In Russian) [Google Scholar]
  45. Roeloffs, E.A. Persistent water level changes in a well near Parkfield, California, due to local and distant earthquakes. J. Geophys. Res. 1998, 103, 869–889. [Google Scholar] [CrossRef]
  46. Zhang, S.; Shi, Z.; Wang, G.; Zhang, Z.; Guo, H. The origin of hydrological responses following earthquakes in a confined aquifer: Insight from water level, flow rate, and temperature observations. Hydrol. Earth Syst. Sci. 2023, 27, 401–415. [Google Scholar] [CrossRef]
  47. Hsieh, P.; Bredehoeft, J.; Farr, J. Determination of aquifer transmissivity from earth–tide analysis. Water Resour. Res. 1987, 23, 1824–1832. [Google Scholar] [CrossRef]
  48. Boldina, S.V.; Kopylova, G.N. Estimation of the inertial effect on flow from an underground water reservoir to a well. Bull. Kamchatka Reg. Assoc. “Educ.-Sci.” Cent. Earth Sci. 2006, 8, 112–119. (In Russian) [Google Scholar]
  49. Marple, S.L., Jr. Digital Spectral Analysis with Applications; Prentice-Hall Inc.: Englewood Cliffs, NJ, USA, 1987; p. 492. [Google Scholar]
  50. Kopylova, G.N. The application of water level observations in wells for searching earthquakes precursors (on the example of Kamchatka). Geofiz. Issled. 2009, 10, 56–68. (In Russian) [Google Scholar]
  51. Zhang, H.; Shi, Z.; Wang, G.; Yan, X.; Liu, C.; Sun, X.; Ma, Y.; Wen, D. Different sensitivities of earthquake–induced water level and hydrogeological property variations in two aquifer systems. Water Resour. Res. 2021, 57, e2020WR028217. [Google Scholar] [CrossRef]
  52. Wenzel, H.G. Earth tide analysis package ETERNA 3.0. Bull. D’Inf. Mareés Terr. 1994, 118, 8719–8721. [Google Scholar]
  53. Biot, M.A. General theory of three–dimensional consolidation. J. Appl. Phys. 1941, 12, 155–164. [Google Scholar] [CrossRef]
  54. Rice, J.R.; Cleary, M.P. P. Some basic stress–diffusion solutions for fluid saturated elastic porous media with compressible constituents. Rev. Geophys. Space Phys. 1976, 14, 227–241. [Google Scholar] [CrossRef]
  55. Kumpel, H.-J. Poroelasticity: Parameters reviewed. Geophys. J. Int. 1991, 105, 783–799. [Google Scholar] [CrossRef] [Green Version]
  56. Kuznetsov, S.E.; Khalileev, A.K.; Peresetsky, A.A.; Zhidko, D.S. Time Series Analysis Packege MESOSAUR. In Proceedings of the VI All-Union School-Seminar “Software and Algorithmic Support for Applied Multivariate Statistical Analysis”, Tsakhkadzor, Armenia, October 1991; Available online: https://search.rsl.ru/ru/record/01001607417 (accessed on 20 January 2023).
  57. Kovalevsky, V.S. Conditions of Formation and Forecasts of the Natural Regime of Groundwaters; Nedra: Moscow, Russia, 1973; p. 152. (In Russian) [Google Scholar]
  58. Droznin, D.V.; Droznina, S.Y. Program for seismic signal processing DIMAS. Seism. Prib. 2010, 46, 22–34. (In Russian) [Google Scholar]
  59. Kopylova, G.N.; Ivanov, V.Y.; Kasimova, V.A. The implementation of information system elements for interpreting integrated geophysical observations in Kamchatka. Russ. J. Earth Sci. 2009, 11, ES1006. [Google Scholar] [CrossRef] [Green Version]
  60. Chebrov, V.N.; Kugayenko, Y.A.; Abubakirov, I.R.; Droznina, S.Y.; Ivanova, Y.I.; Matveyenko, Y.A.; Mityushkina, S.V.; Ototyuk, D.A.; Pavlov, V.M.; Rayevskaya, A.A.; et al. The 30 January 2016 earthquake with Ks = 15.7, Mw = 7.2, I = 6 in the Zhupanovsky region (Kamchatka). Bull. Kamchatka Reg. Assoc. “Educ.-Sci.” Cent. Earth Sci. 2016, 29, 5–16. (In Russian) [Google Scholar]
  61. Kocharyan, G.G.; Vinogradov, E.A.; Gorbunova, E.M.; Markov, V.K.; Markov, D.V.; Pernik, L.M. Hydrologic response of underground reservoirs to seismic vibrations. Izv. Phys. Solid Earth 2011, 47, 1071–1082. [Google Scholar] [CrossRef]
  62. Wang, C.-Y. Liquefaction beyond the near field. Seismol. Res. Lett. 2007, 78, 512–517. [Google Scholar] [CrossRef]
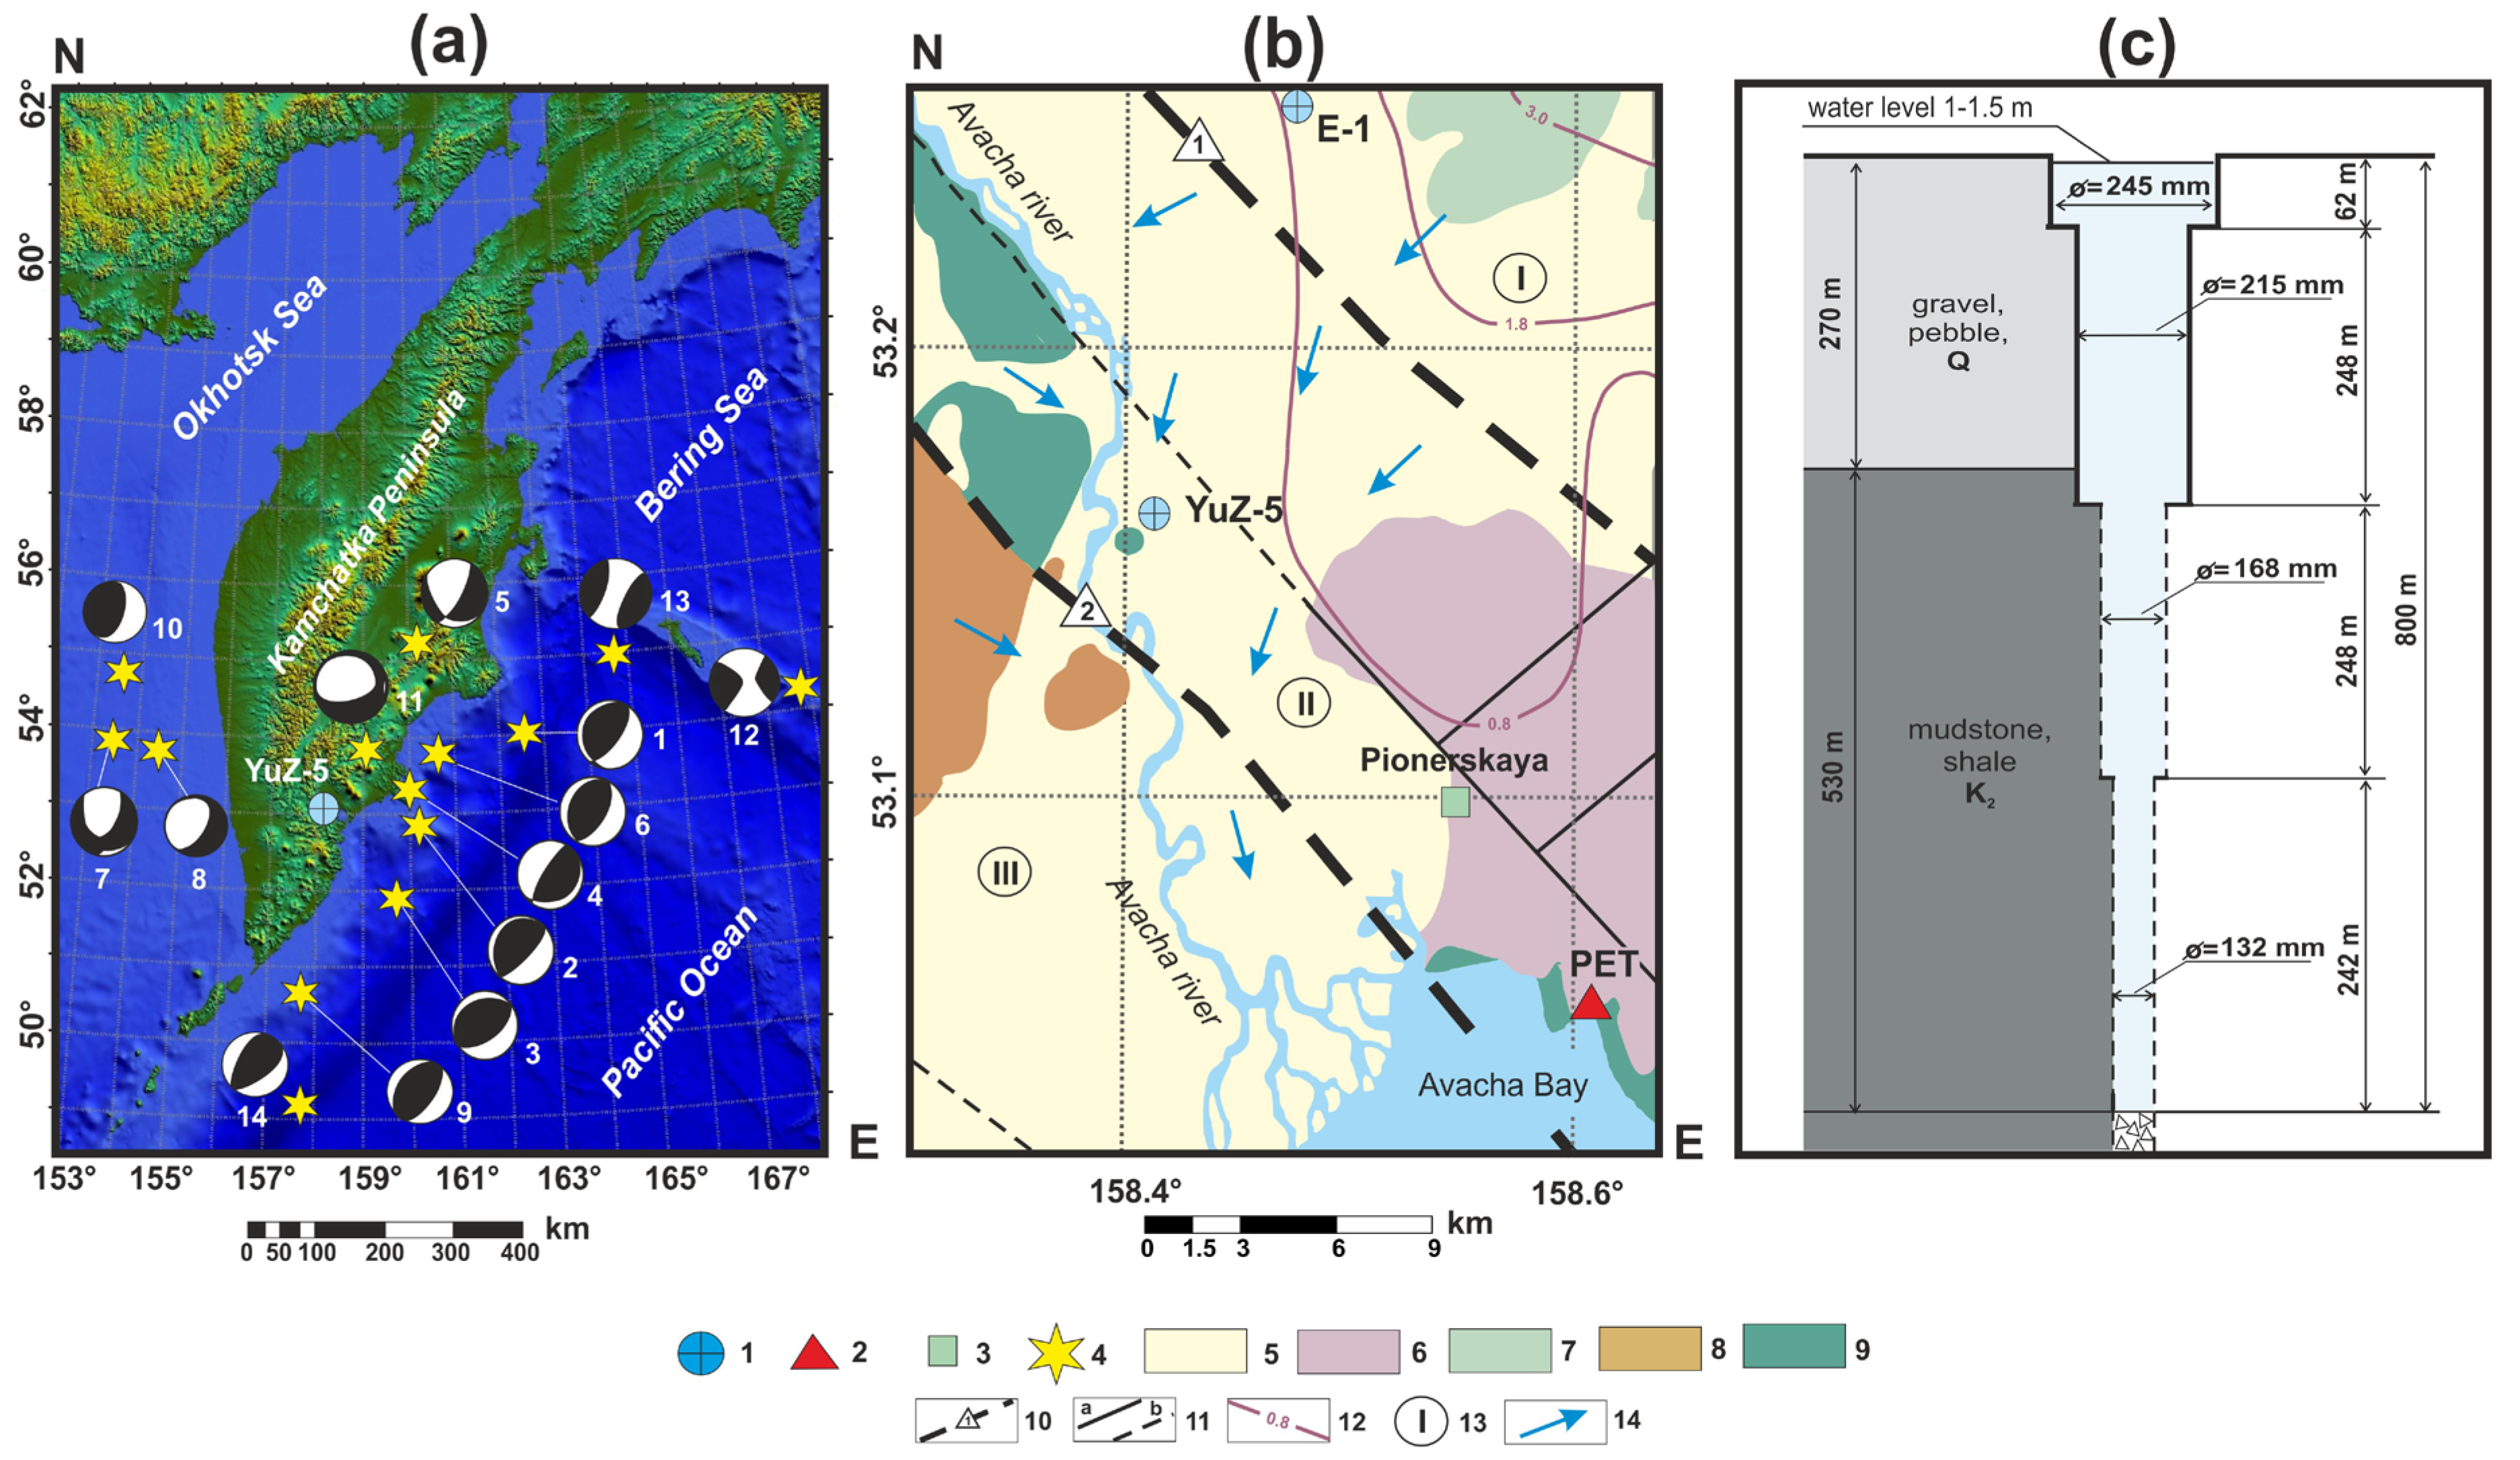
Figure 1. Location and structure of the YuZ-5 well, geologic setting, epicenters and focal mechanisms of local earthquakes according to NEIS (https://earthquake.usgs.gov/earthquakes/search (accessed on 20 January 2023)), GlobalCMT (https://www.globalcmt.org (accessed on 20 January 2023)) and the Kamchatka Branch of the Geophysical Survey of the Russian Academy of Sciences (http://sdis.emsd.ru/info/earthquakes/catalogue.php (accessed on 20 January 2023)). (a) Location of the YuZ-5 well, epicenters and focal mechanisms of 1997–2020 earthquakes (Table 3 and Table 4). (b) Geological environment according to [22,23,24] with authors’ additions. Designations: 1—observation well, 2—Petropavlovsk (PET) seismic station, 3—Pionerskaya meteorological station, 4—earthquake epicenters, 5–9—geological formations (5—Quaternary sedimentary deposits, 6—Quaternary volcanogenic deposits, 7—Quaternary lavas of modern volcanoes, 8—Neogene volcanogenic-sedimentary rocks, 9—Late Cretaceous metamorphosed volcanogenic-sedimentary rocks), 10—regional faults (1—Avachinsky, 2—Petropavlovsky), 11—faults (a—established, b—assumed), 12—depth to the metamorphosed basement in km, 13—tectonic structures (I—Avacha volcano-tectonic depression, II—Petropavlovsky horst, III—Nachikinskaya zone of fold-block dislocations), 14—direction of regional underground runoff. (c) Well structure and geological section.
Water 15 02174 g001
Figure 2. Changes in average hourly values of pressure (upper graph) and water level (lower graph) after compensation for barometric variations, well YuZ-5, 5–14 September 2017.
Water 15 02174 g002
Figure 3. Average hourly groundwater pressure variations in well YuZ-5 (black line) in comparison with daily precipitation at the Pionerskaya meteorological station (Figure 1b) and earthquakes (shown by vertical arrows, earthquake numbers according to Figure 1a, Table 3) in September 1997–February 2018 (a) and in October 2017–July 2022 (b). I, II, III—stages of observations shown in blue lines (Table 2). The vertical axis of the upper graph (a) shows the water level position from the top of metal cap (75 cm height) above the wellhead. The vertical axis of the upper graph (b) shows groundwater pressure changes at a depth of 8 m below the water level in the wellbore. Gray dotted rectangles with numbers 1–3 highlight fragments of observations, which are given below in more detail. Groundwater pressure variations in (a,b) are shown in comparison with the seasonal head change function (pink line) calculated over a 14-year observation period (2004–2017) and average linear trends (green lines) estimated for the observation periods 1997–2018 (a) and 2017–2022 (b).
Water 15 02174 g003
Figure 4. (a) Average hourly data of synchronous measurements of atmospheric pressure (top panel) and water level (second panel from top) (fragment 2 in Figure 3), corrected water level and low frequency trend (light line on the third panel from the top) compared to high-frequency water level variations (fourth panel from the top) and theoretical tidal deformation (bottom panel). (b) Cross-spectral analysis of hourly water level and atmospheric pressure data; functions are shown in the range of periods of 2–100 h from top to bottom: square modulus of the coherence spectrum, amplitude transfer function and phase difference. (c) Power spectra of hourly data on average water level and atmospheric pressure constructed using the Burg maximum entropy method described in [49]: 1—observed water level data (dark line) and corrected water level data (gray line); 2—atmospheric pressure. S2K2, M2, P1S1, O1—main tidal waves of the semidiurnal and diurnal groups.
Water 15 02174 g004
Figure 5. Hydrogeological conditions and seasonal hydrostatic head changes in the YuZ-5 well. (a) General scheme: 1—Late Cretaceous siliceous-volcanogenic formations, K2 (confined aquifer, CA); 2—Quaternary loose deposits, Q (unconfined aquifer, UA); 3—groundwater level in UA and its changes during the year (GWL1 is the maximum increase in the groundwater level in the period of spring snowmelt and groundwater supply, GWL2 is the lowest groundwater level position during the low-water period in winter and summer, Δh is the change in the water column height in UA during the year); 4—piezometric surface of CA (PS); 5—direction of regional underground flow; 6—local groundwater flows at the border between UA and CA; k—hydraulic conductivity coefficient in the corresponding hydrogeological subdivisions. (b) Seasonal head change functions estimated for different time intervals of observations in well YuZ-5: dark blue line—according to 5-year data, 2004–2008 (Stage I); bold green line—according to 14-year data, 2004–2017 (Stage II); red line—according to 4-year data, 2018–2021 (Stage III); 1–4—phases of the head change function.
Water 15 02174 g005
Figure 6. Seismo-hydrogeodynamic effects of the earthquake of 5 December 1997, Mw = 7.8 (No. 1 in Table 3). (a) Water level changes in wells E-1 (upper panel) and YuZ-5 (middle panel) in comparison with precipitation according to data in Pionerskaya meteorological station (9 September–31 December 1997. Horizontal arrows and numbers I, II show as follows: I—supposed hydrogeodynamic precursor; II—postseismic changes in pressure increase in the E-1 well (top panel) and pressure decrease in the YuZ-5 well (middle panel). (b) Gray vertical arrows and numbers show the amplitudes of water level decrease Δh). (c) Coseismic decrease in water pressure with amplitude Δh = 12 cm for 12 min; 11:27 is the time of the Kronotsky earthquake.
Water 15 02174 g006
Figure 7. Seismo-hydrogeodynamic effects of the earthquake of 30 January 2016, Mw = 7.2 (No. 11 in Table 3, ZhE), well YuZ-5. (a) Changes in water pressure in July 2012–May 2016 in comparison with precipitation and local earthquakes with Mw ≥ 6.8 (red arrows): 1—average hourly pressure variations with compensated barometric variations; 2—seasonal pressure variations together with linear trend; 3—residuals in pressure changes after removal of annual seasonality and linear trend. Bold dotted line denotes a fragment of pressure variations during ZhE. (b) Coseismic increase in water pressure after the ZhE time (03:25): red line shows the calculated water level rise according to Formula (2). (c) Manifestation of the supposed hydrogeodynamic precursor and postseismic decrease in water pressure.
Water 15 02174 g007
Figure 8. Coseismic change in water pressure in YuZ-5 well during the EQ on 17 July 2017, Mw = 7.7, de = 700 km (No. 12 in Table 3 and Table 4). (a) The 5-minute water level changes: red arrow indicates the arrival of seismic waves at PET seismic station. (b) Data of water level measurements and a calculated pressure increase according to (2) (red line): black circles indicate 5-minute water level measurements with compensated barometric variations. (c) Distribution of coseismic volumetric strain at a depth of 500 m calculated from the dislocation model [31] and data on the earthquake source mechanism (Table 4, EQ No. 12), indicating the value of strain D2 in the area of well YuZ-5 (the well is shown by the black circle).
Water 15 02174 g008
Figure 9. Earthquake on 25 March 2020, Mw = 7.5, de = 450 km (No. 13 in Figure 1a, Table 3 and Table 4): water pressure variations in YuZ-5 well, 20 Hz (upper panel), and seismic recording on the BHZ channel, 20 Hz, PET seismic station (lower panel). P, S, L—seismic waves.
Water 15 02174 g009
Figure 10. Distribution of 1997–2020 earthquakes (Table 3, Figure 1a) as a function of parameter Mw and epicentral distance de to the YuZ-5 well (a) and Mw and hypocentral distance dh (b). Hypocenter depths: 1—H = 0–70 km, 2—H = 70–300 km, 3—H = 300–700 km.
Water 15 02174 g010
Figure 11. Correlation between coseismic volumetric deformation values in the area of the YuZ-5 well during local earthquakes (Table 3 and Table 4, Figure 1a) obtained from observational data in the well (D1) and from the dislocation model (D2) (a). Figure (b) shows an enlarged fragment of the graph (a) in the range of volumetric deformation ±10 × 10−9. Blue, green and red circles show the coseismic volumetric strain obtained at observation stages I, II and III, respectively.
Water 15 02174 g011
Figure 12. Data on earthquakes accompanied by manifestations of hydrogeoseismic variations in the water level in YuZ-5 well (red circle on the map). Epicenter locations are shown on the map. Earthquake parameters are presented in the table: earthquake numbers in brackets correspond to the numbers in Table 3 and Table 4 and in Figure 1a. Diagrams provide examples and descriptions of type I–IV HGSVs. Highlighted in color: yellow—type I HGSVs, pink—type II HGSVs, blue—type III HGSVs, orange—type IV HGSVs.
Water 15 02174 g012
Figure 13. Distribution of HGSV types (type I—yellow circles, type II—pink circles, type III—blue circles, type IV—orange circles) as a function of earthquake parameters Mw, de and seismic energy density e (a); maximum velocity and central frequency of its manifestation on the BHZ channel, PET station (b).
Water 15 02174 g013
Figure 14. Distribution of various types of seismo-hydrogeodynamic effects in water level/pressure changes in the YuZ-5 well: supposed hydrogeodynamic precursors (1), coseismic effects (2), vibration effects of seismic waves (3–6) (3—type I HGSVs, 4—type II, 5—type III, 6—type IV), as functions of magnitude Mw, epicentral distance of earthquakes de and seismic energy density e. One, five and ten maximum linear sizes of earthquake sources as a function of magnitude Mw are shown as 1L, 5L and 10L.
Water 15 02174 g014
Table 1. Well YuZ-5, Kamchatka Peninsula.
Coor-
dinates
Depth, m
Open Interval, m
Lithology: Age, CompositionWater Level
Depth,
m
Water Temperature, °CWater
Mineralization,
g/dm3
Water TypeGas Composition
53.17°N
158.41°E
800
310–800
K2, mudstone,
shale
1.5140.25HCO3–SO4
Na–Ca
dissolved
gas, N2
Table 2. Observation equipment at well YuZ-5, 1997–2022.
Observation
Stages
Observation PeriodEquipmentRegistered ParametersMeasurement AccuracyMeasurement FrequencyReferences
ISep 1997–May 2003GIP-3 data logger, water level DU and atmospheric pressure DA sensors, Schmidt Institute of Physics of the Earth RAS, Moscow, Russiawater level,
atmosphere pressure
0.1 cm
0.1 hPa
10 min[25]
IIJul 2003–Feb 2018Kedr A2 and Kedr DM data loggers with an ultrasonic water level sensor, Polinom LLC, Khabarovsk, Russiawater level,
atmosphere pressure
0.1 cm
0.1 hPa
5–10 min[26]
IIIAug 2017–Jul 2022CR6 and CR1000 data loggers, Campbell Scientific Inc, Logan, Utah, USA, and water pressure and temperature sensor PAA36XiW, Keller, Winterthur, Switzerlandwater pressure
atmosphere pressure
0.002 hPa
0.1 hPa
20 Hz
1 min
[27]
Table 6. Seasonality model with linear trend constructed based on the data from four observation periods at the YuZ-5 well.
No.Observation Period,
Years
Time Series Length,
Days/Years
Model Parametersσmax,
cm (hPa)
Linear TrendR2 *Residuals
A,
cm/Day (hPa/Day)
B,
cm (hPa)
Average,
cm (hPa)
Standard Error σ, cm (hPa)
11999–20011096/3−0.0065 cm/day−175.60.451.5 × 10−7 cm12.1 cm30.9 cm/2.5 *
22004–20081827/50.0167 cm/day−170.20.76−3.7 × 10−7 cm8.9 cm22.9 cm/2.6 *
32004–20175114/140.0062 cm/day−160.80.585.1 × 10−8 cm13.8 cm44.6 cm/3.2 *
42018–20211461/4−0.0037 hPa/day814.30.772.6 × 10−6 hPa7 hPa17.3 gPa/2.5 *
Notes: * ratio of maximum error to value of standard error of the model σmax/σ.
Disclaimer/Publisher’s Note: The statements, opinions and data contained in all publications are solely those of the individual author(s) and contributor(s) and not of MDPI and/or the editor(s). MDPI and/or the editor(s) disclaim responsibility for any injury to people or property resulting from any ideas, methods, instructions or products referred to in the content.